Embed Size (px)
Citation preview
Project Completion Report
PCR: INO 23312
Smallholder Tree Crop Processing Project (Loan 1186-INO) in Indonesia June 2005
CURRENCY EQUIVALENTS
Currency Unit – rupiah (Rp) At Appraisal At Project Completion
(1 October 1992) (15 March 2005) Rp1.00 = $0.000490 $0.000105 $1.00 = Rp2,040 Rp9,500
ABBREVIATIONS
CDC – Commonwealth Development Corporation (United Kingdom) DGE – Directorate General of Estates DGECP – Directorate General of Estate Crops Production EIRR – economic internal rate of return ICB – international competitive bidding GPC – group processing center LCB – local competitive bidding IEE – initial environmental examination PBME – project benefit monitoring and evaluation PMO – project management office PMU – project management unit PTP – perseroan terbatas perkebunan
(estate crop enterprise) PTPN – perseroan terbatas perkebunan nusantara
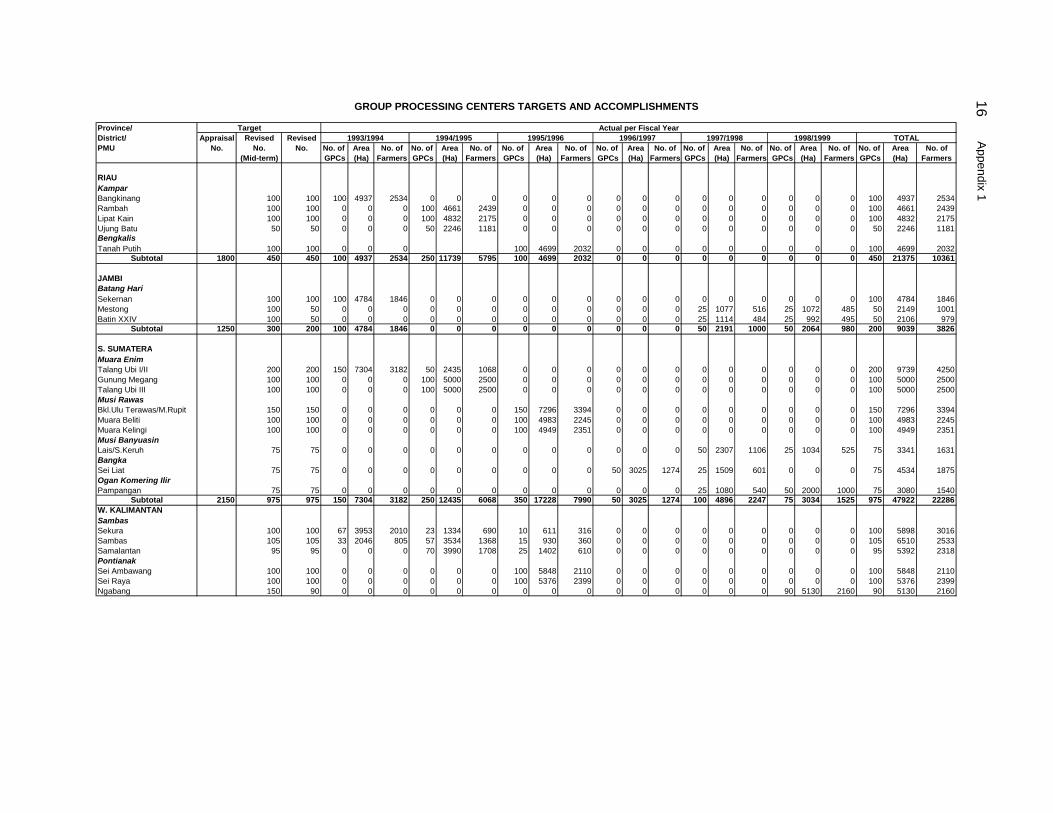
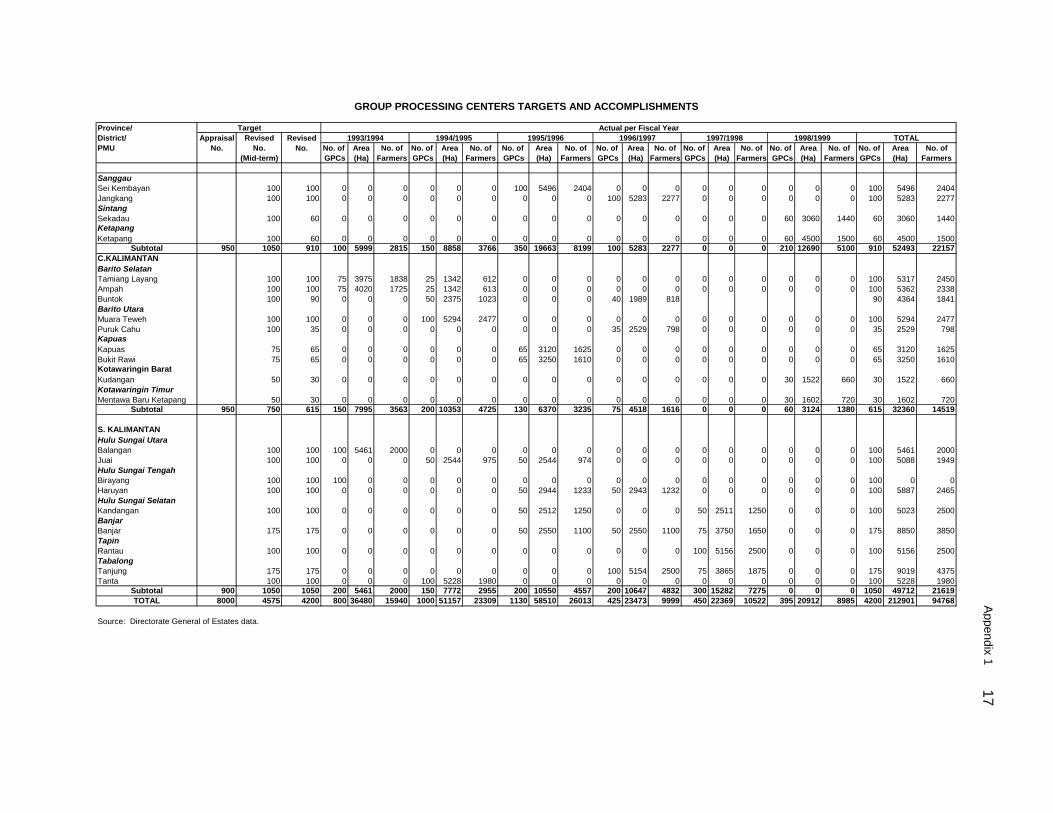
(state-owned estate crop enterprise) RSS – Rubber Standard Sheet SBI – Sertifikat Bank Indonesia SIR – Standard Indonesian Rubber SLA – subsidiary loan agreement
GLOSSARY GPC – A simple facility equipped with hand-operated mangles, to
enable smallholder farmers’ groups to process raw latex into clean rubber sheets with 90–95% dry rubber content.
Ojol – Unclean lump rubber DRC - Dry rubber content
NOTES
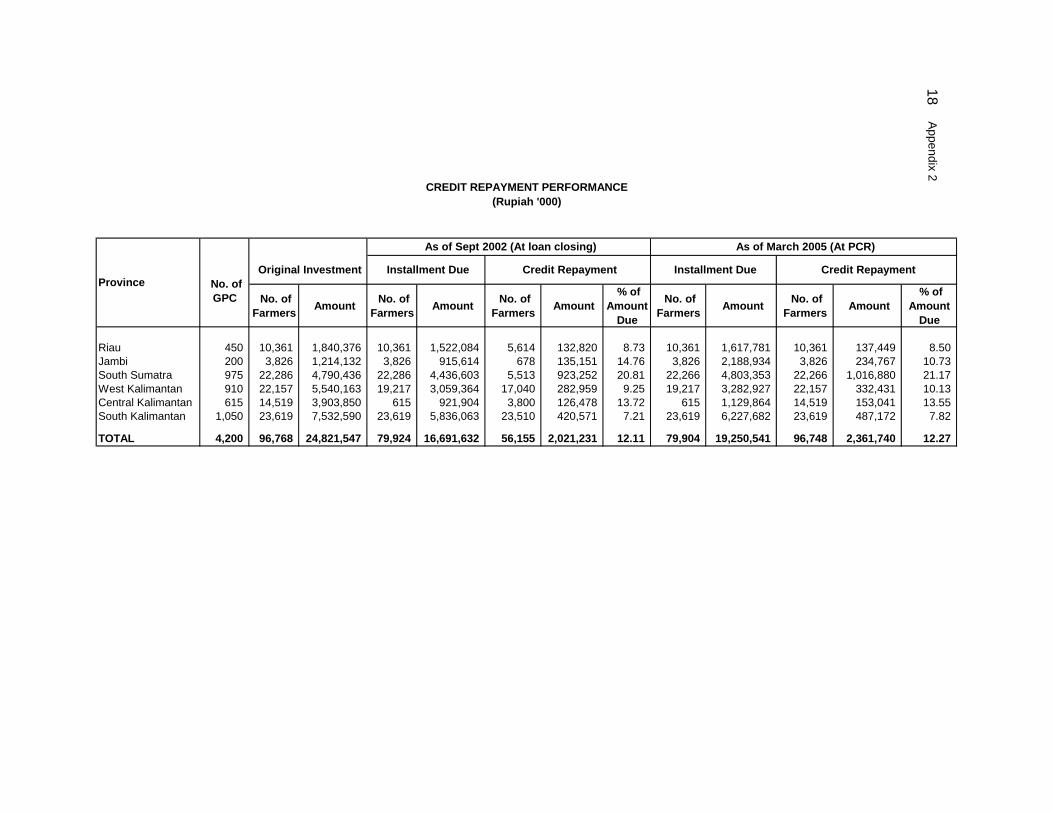
(i) The fiscal year (FY) of the Government ended on 31 March until 2000 and now ends on 31 December. FY before a calendar year denotes the year in which the fiscal year ends. FY1996 began on 1 April 1995 and ended on 31 March 1996. FY1999/2000 denotes the last fiscal year ending on 31 March 2000; FY2000 denotes the fiscal year beginning on 1 April 2000 and ending on 31 December 2000.
(ii) In this report, "$" refers to US dollars.

CONTENTS
Page BASIC DATA ii MAP vii I. PROJECT DESCRIPTION 1 II. EVALUATION OF DESIGN AND IMPLEMENTATION 1 A. Relevance of Design and Formulation 1 B. Project Outputs 3 C. Project Costs 7 D. Disbursements 7 E. Project Schedule 8 F. Implementation Arrangements 8 G. Conditions and Covenants 9 H. Consultant Recruitment and Procurement 9 I. Performance of Consultants, Contractors, and Suppliers 10 J. Performance of the Borrower and the Executing Agency 10 K. Performance of the Asian Development Bank 11 III. EVALUATION OF PERFORMANCE A. Relevance 11 B. Efficacy in Achievement of Purpose 11 C. Efficiency in Achievement of Outputs and Purpose 12 D. Preliminary Assessment of Sustainability 12 E. Environmental, Sociocultural, and Other Impacts 13 IV. OVERALL ASSESSMENT AND RECOMMENDATIONS A. Overall Assessment 13 B. Lessons Learned 14 C. Recommendations 14 APPENDIXES 1. Group Processing Centers Targets and Accomplishments 16 2. Credit Repayment Performance 18 3. Implementation Schedule Factory Component 19 4. Training Programs 20 5. Consultants Personnel Staffing Schedule 22 6. Implementation Schedule of Rehabilitation/Intercropping, and Intensification Activities 23 7. Summary of Project Cost 24 8. Loan Utilization by Year 29 9. Utilization of Loan Proceeds 31 10. Status of Compliance with Loan Covenants 32 11. Financial and Economic Analyses 36

BASIC DATA A. Loan Identification 1. Country 2. Loan Number 3. Project Title 4. Borrower 5. Executing Agencies 6. Amount of Loan 7. Project Completion Report Number
Indonesia 1186-INO Smallholder Tree Crop Processing Project Republic of Indonesia Directorate General of Estates State-owned Estate Crop Enterprises (PTPN VI and PTPN XIII) $50.055 million PCR: INO 888
B. Loan Data 1. Appraisal – Date Started – Date Completed 2. Loan Negotiations – Date Started – Date Completed 3. Date of Board Approval 4. Date of Loan Agreement 5. Date of Loan Effectiveness – In Loan Agreement – Actual – Number of Extensions 6. Closing Date – In Loan Agreement – Actual – Number of Extensions 7. Terms of Loan – Interest Rate – Maturity (number of years) – Grace Period (number of years) 8. Terms of Relending a. Credit Agreements – Interest Rate – Maturity (number of years) - Grace Period (number of years) b. Subsidiary Loan Agreements - Interest Rate - Maturity - Grace Period
11 March 1992 31 March 1992 14 October 1992 16 October 1992 12 November 1992 16 March 1993 14 June 1993 14 September 1993 3 30 September 1999 1 July 2003 2 ADB’s pool-based variable lending rate system 26 years 6 years Average SBI rate, subject to 16% per annum ceiling 10 years 1 year Variable 3-month deposit rate of SBI 10 years 3 years

iii
9. Disbursements a. Dates Initial Disbursement
1 October 1993
Final Disbursement 1 July 2003
Time Interval 115 months
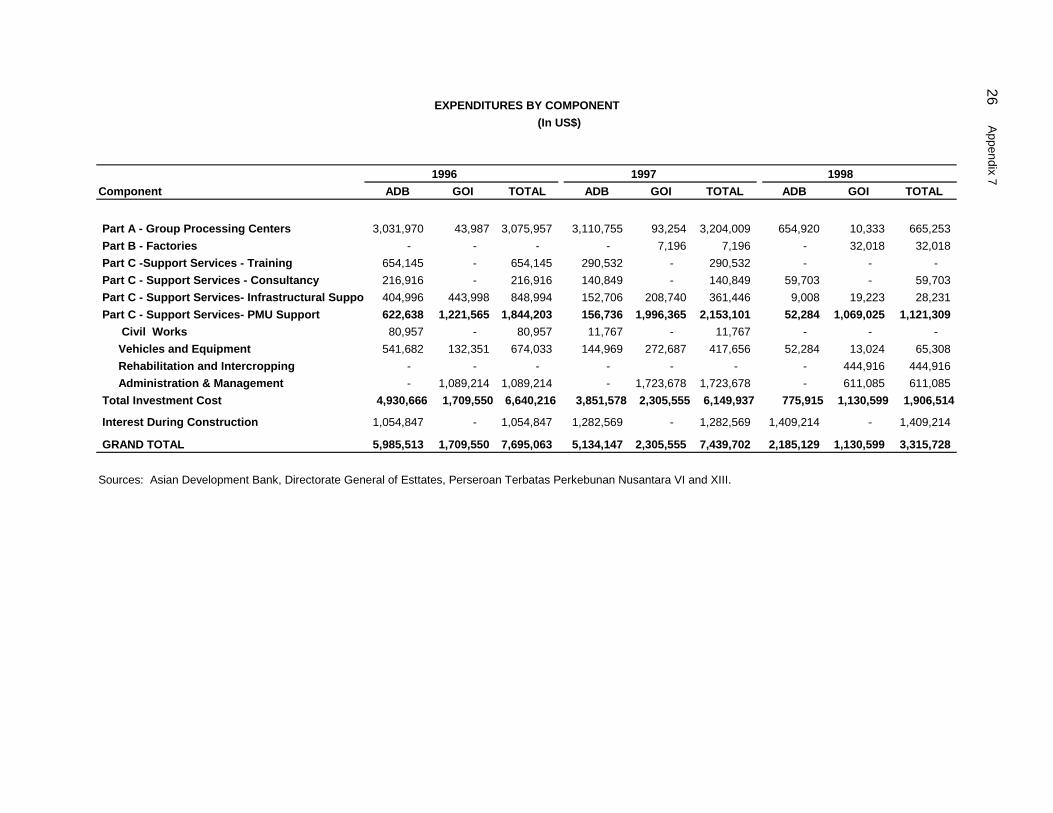
Effective Date 14 September 1993
Original Closing Date 30 September 1999
Time Interval 72 months
b. Amount ($ million) Category or Subloan
Original
Allocation
Last Revised
Allocation
Amount
Cancelleda
Amount
Disbursed
Undisbursed
Balanceb
01A–Civil Works-Part A 15,904,000 7,500,000 8,404,000 7,293,576 206,424 01B–Civil Works-Part B–PTPN VI 891,000 0 891,000 0 0 01C–Civil Works Part B–PTPN XIII 1,894,000 0 1,894,000 0 0 01D-Civil Works–Part C–GPC Road Improvement
1,920,000 866,100 1,053,900 221,568 644,532
01E-Civil Works–Part C–PMU Support
811,000 990,400 (179,400) 904,151 86,249
02A-Machinery, Equipment & Vehicle–Part A
20,030,000 5,876,576 14,153,424 6,059,199 (182,623)
02B-Machinery, Equipment & Vehicle–PTPN VI
1,128,000 6,375,600 (5,247,600) 6,365,496 10,104
02C-Machinery, Equipment & Vehicle–PTPN XIII
3,157,000 10,473,400 (7,316,400) 10,427,747 45,653
02DMachinery, Equipment & Vehicle–PMU Support
1,405,000 1,300,000 105,000 1,282,795 17,205
03A–Consulting Part B – PTPN VI 194,000 0 194,000 0 0 03B–Consulting Part B – PTPN XIII 306,000 0 306,000 0 0 03C–Consulting- Part C 1,622,000 1,261,500 360,500 863,048 398,452 04-Training- Part C 2,487,000 4,950,000 (2,463,000) 4,264,882 685,118 05K–Local Expenditures – GPC Site Planning
140,000 153,000 (13,000) 188,584 (35,584 )
06-IDC 10,720,000 8,900,000 1,820,000 8,900,000 0 07-Unallocated 12,391,000 0 12,391,000 0 0 08-Rehabilitation 0 3,000,000 (3,000,000) 2,776,530 223,470 09-Intercropping 0 1,015,000 (1,015,000) 507,311 507,689 Total 75,000,000 52,661,576 a 22,338,424 50,054,886 2,606,690 IDC = (Interest and Commitment Charges), INO = Indonesia, DGE = Directorate General of Estates, PMU = project
management unit, PTPN = Perseroan Terbatas Perkebunan Nusantara (state-owned estate crop enterprise, SBI = Sertifikat Bank Indonesia.
a There were 4 loan cancellations as follows: $10,665,424 on 16 July 1998, $6,600,000 on 7 August 1998, $5,073,000 on 4 September 2000, resulting to the final loan allocation of $52,661,576.
b The undisbursed loan balance at loan closing date amounting to $2,606,690 was canceled on 1 July 2003.
10. Local Costs (Financed) - Amount ($) $12,552,942 - Percent of Local Costs 45% - Percent of Total Cost 43%
iv
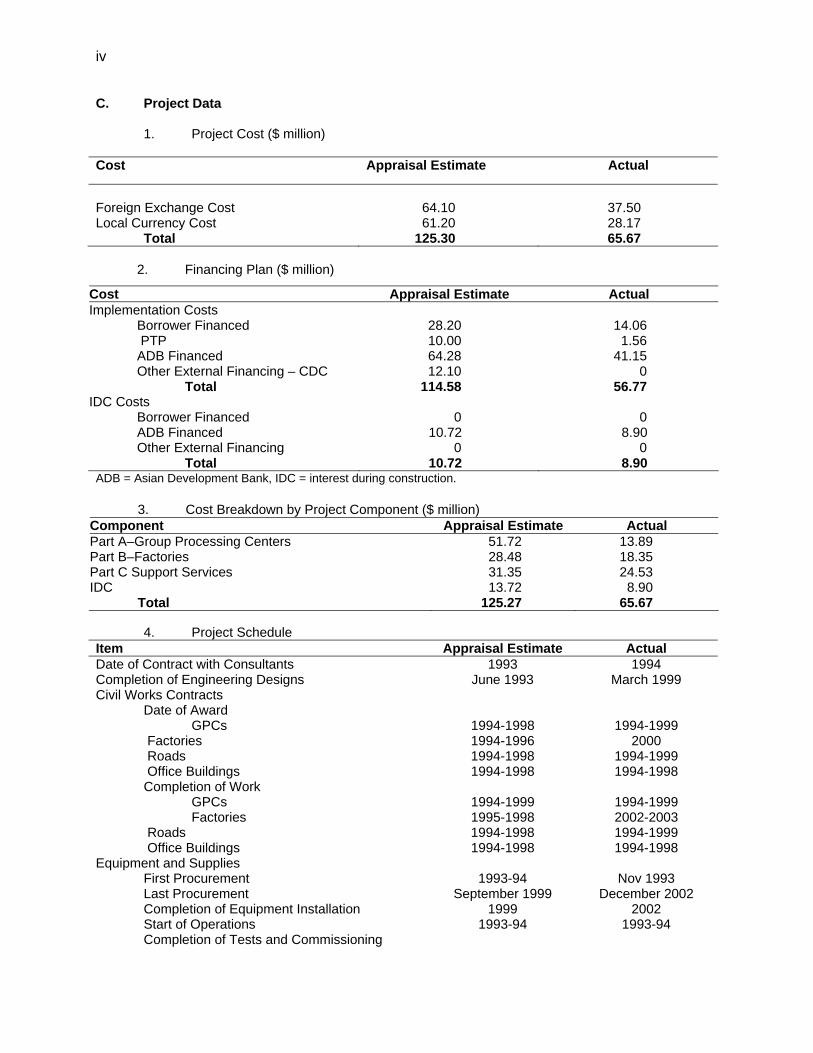
C. Project Data 1. Project Cost ($ million) Cost Appraisal Estimate Actual
Foreign Exchange Cost 64.10 37.50 Local Currency Cost 61.20 28.17 Total 125.30 65.67
2. Financing Plan ($ million)
Cost Appraisal Estimate Actual Implementation Costs Borrower Financed 28.20 14.06 PTP 10.00 1.56 ADB Financed 64.28 41.15 Other External Financing – CDC 12.10 0 Total 114.58 56.77 IDC Costs Borrower Financed 0 0 ADB Financed 10.72 8.90 Other External Financing 0 0 Total 10.72 8.90 ADB = Asian Development Bank, IDC = interest during construction.
3. Cost Breakdown by Project Component ($ million) Component Appraisal Estimate Actual Part A–Group Processing Centers 51.72 13.89 Part B–Factories 28.48 18.35 Part C Support Services 31.35 24.53 IDC 13.72 8.90 Total 125.27 65.67 4. Project Schedule Item Appraisal Estimate Actual Date of Contract with Consultants 1993 1994 Completion of Engineering Designs June 1993 March 1999 Civil Works Contracts Date of Award GPCs 1994-1998 1994-1999 Factories 1994-1996 2000 Roads 1994-1998 1994-1999 Office Buildings 1994-1998 1994-1998 Completion of Work GPCs 1994-1999 1994-1999 Factories 1995-1998 2002-2003 Roads 1994-1998 1994-1999 Office Buildings 1994-1998 1994-1998 Equipment and Supplies First Procurement 1993-94 Nov 1993 Last Procurement September 1999 December 2002 Completion of Equipment Installation 1999 2002 Start of Operations 1993-94 1993-94 Completion of Tests and Commissioning

v
Item Appraisal Estimate Actual Factories 1995-1998 2001-2002 Beginning of Start-Up GPCs 1994 1994 Factories 1995-1998 2001-2002 Other Milestones
Cancellation of Loan Proceeds 1st 2nd 3rd Final Extension of Loan Closing Date 1st 2nd Approval of additional categories for rehabilitation and replanting ADB approval of changes in implementation arrangement including relending terms of the Government to PTPN VI and PTPN XIII
16 July 1998 7 August 1998
4 September 2000 1 July 2003
30 September 2001 30 September 2002
7 Aug 1998
28 July 1999
5. Project Performance Report Ratings PAC Notes Project Classification From June 1993 to December 1998 AAA
PPR Ratings Development
Objectives Implementation
Progress From January 1999 to May 1999 S S From June 1999 to March 2000 U U From April 2000 to June 2000 PS U From July 2000 to December 2000 S PS January 2001 to loan closing S S PAC = Project Administration Committee; AAA = project classified as satisfactory in implementation progress, project costs and compliance with loan covenants; PPR = project performance report; S = satisfactory; PS = partly satisfactory; U = unsatisfactory. D. Data on Asian Development Bank Missions Name of Mission
Date
No. of Persons
No. of Person-Days
Specialization of Membersa
Fact-Finding Nov 1991 Appraisal 11-31 Mar 92 7 90 a, b, c, d, e, f, p Inception 16-24 Jun 93 2 18 a, b Special Project Administration 1 26 Jan-2 Feb 94 1 8 h Review 1 24 Feb-10 Mar 94 1 7 g Review 2 25 Sep-6 Oct 95 21 24 i, j Midterm Review 19 Jul -9 Aug 96 3 73 i, k, o Review 3 24 Jul-8 Aug 97 3 48 j,l,o Special Project Administration Mission 10-12 Dec 97 1 3 I Sectoral Review 13-27 Apr 9 8 2 14 i, l Review 4 22 Jul-7 Aug 98 3 49 i, l, o Review 5 29 Apr-29 May 99 2 10 h, b Review 6 2-17 Dec 99 2 15 h, m

vi
Name of Mission
Date
No. of Persons
No. of Person-Days
Specialization of Membersa
Review 7 19 May-6 Jun
2000 1 12 h
Review 8 12-22 Dec 2000 1 11 h Review 9 8-17 May 2001 1 11 h Review 10 12-21 Mar 2002 2 20 h, l Project Completion Reviewb 8-21 Mar 2005 3 67 a, l, n a a = project economist, b = senior programs officer, c = senior private sector specialist, d = financial analyst, e =
environment specialist, f = counsel, g = project engineer, h = sr. project engineer, i = sr. project specialist, j = project officer, k = agriculture economist, l = project analyst, m = credit specialist, n = staff consultant tree crop specialist, o = staff consultant agriculture economist, p = staff consultant tree crop economist.
b The project completion report was prepared by M. E. Khan, project economist (mission leader); and C. Quintos, associate project analyst.

PROJECT LOCATION
1
1
1
2
2
3
3
I N D I A N O C E A N
I N D I A N O C E A N
PACIFIC OCEAN
South China Sea
J a v a S e aJakarta
SUMATRA
KALIMANTAN
Banda Aceh
Pontianak
Palangkaraya
Sampit
Kintap
Samarinda
Balikpapan
Tarakan
Sangkulirang
LangsaMeulaboh
Pekanbaru
Palembang
Bandar Lampung
Pangkal PinangTanjungpandan
Banjarmasin
Padang
Sibolga
Medan
Toba
Bengkulu
Jambi
Bukittinggi
Ketapang
Sintang
NIAS
SIMEULUE
SIBERUT
SIPORAUTARASELATAN
BUNGURAN
ENGGANO
BINTAN
LINGGA
BATU
NANGGROE ACEHDARUSSALAM
R I A U
J A M B I
WEST SUMATRA
NORTH SUMATRA
BENGKULU
LAMPUNG
SOUTHSUMATRA
BANGKA-BELITUNG
WESTKALIMANTAN
EASTKALIMANTAN
CENTRALKALIMANTAN
SOUTHKALIMANTAN
FLORES
SUMBA TIMOR
CERAM
HALMAHERA
BALISUMBAWA
BANGKA
BELITUNG
KALIMANTANSUMATRA
J A V A
SULAWESI
PAPUA
I N D O N E S I A
TIMOR-LESTE
MALAYSIABRUNEI DARUSSALAM
MALAYSIA
BRUNEIDARUSSALAM
PTPN XIII Sintang Crumb Rubber FactoryPTPN XIII Tanjung Lebar Palm Oil MillPTPN VI Longkali Palm Oil Mill
Provinces with Group-Processing CenterNational CapitalProvincial CapitalCity/TownProcessing FactoryNational RoadOther RoadProvincial BoundaryInternational Boundary
Boundaries are not necessarily authoritative.
INDONESIASMALLHOLDER TREE CROP PROCESSING PROJECT
(as completed)
0 50 100 150 200
Kilometers
N
05-2406 HR vii
0 o0 o
10 00'So 10 00'So
130 00'Eo
130 00'Eo
110 00'Eo
110 00'Eo
10 00'No 10 00'No
114 00'Eo
114 00'Eo
98 00'Eo
98 00'Eo
0o 0o
6 00'No6 00'No
6 00'So 6 00'So

I. PROJECT DESCRIPTION 1. The loan for the Smallholder Tree Crop Processing Project was approved in November 1992 for $75.0 million, or about 60% of the estimated project cost of $125.3 million. In addition to the Government and other in-country counterpart funding, the Commonwealth Development Corporation (CDC) was to provide a loan of $12.1 million. The Project’s primary objective was to raise the income levels of rubber and oil palm smallholders living in selected provinces in Sumatra and Kalimantan, and the secondary objective was to contribute to economic growth. The Project’s purpose was to improve the quality of rubber and palm oil output and reduce postharvest losses by providing intermediate and advanced processing facilities. The Project was also to help improve the competitiveness of Indonesia’s rubber and palm oil in the world market. 2. The Project comprised the following:
(i) Part A. Group processing center (GPC) component. This included establishing 8,000 GPCs to provide intermediate rubber-processing facilities to about 160,000 smallholders (organized into groups) and covering about 400,000 hectares (ha) of plantations. The civil works for the GPCs were to be financed by the Project, while the equipment was to be provided to the farmers’ groups on credit.
(ii) Part B. Factory component. This provided advanced processing facilities to
state-owned estate enterprises (PTPs) to cater to the needs of the smallholders in and around the PTPs’ nucleus estates. The scope included establishment of 4 crumb rubber factories (3 with a capacity of 20 tons/day and 1 with 40 tons/day) and 1 crude oil palm factory with a capacity of 30 tons/hour, and rehabilitation of a crude oil palm factory with a capacity of 60 tons/hour. The component also provided engineering consultancy to design and supervise factory construction.
(iii) Part C. Support service component. To support the Project objectives, the
component provided a program to enhance the institutional capacities and technical skills of staff and farmers, consulting services in processing, training and environmental management, infrastructure upgrade in smallholder areas, and project management units (PMUs) to support the GPCs.
3. The Directorate General of Estates (DGE)1 was the Executing Agency for the Project, with responsibility for implementing parts A and C. PTPs XII and XVIII were responsible for implementing part B.
II. EVALUATION OF DESIGN AND IMPLEMENTATION A. Relevance of Design and Formulation 4. A large number of the rubber and oil palm holdings are owned and operated by poor smallholders, so supporting tree crop development raises their incomes and helps reduce rural poverty. The tree crop subsector is also of macroeconomic importance as it has accounted on
1 Following project completion in 2002, DGE was reorganized as the Directorate General of Estate Crop Production,
with the marketing and processing functions assigned to the Directorate General of Processing and Marketing of Agricultural Products.

2
average for roughly 16% of the agricultural gross domestic product since the 1990s. The total earnings and export revenue from the subsector respectively amounted to $6.3 billion and $4.5 billion in 2002, of which over 70% was contributed by the smallholders. The subsector’s importance was evident during the 1997 financial crisis, when tree crop farmers were largely protected from the turmoil by the export-oriented nature of their produce. 5. The main development objectives of the Government’s 5-year plan (1989/90–1993/94) were sustainable economic growth, with emphasis on job creation, promotion of non-oil exports, equitable distribution of income, achievement of regional balance, reduction of rural poverty, conservation of natural resources, and protection of the environment. Within the tree crop subsector, the Government focused on increasing export earnings, improving farmers’ incomes, creating rural jobs, stimulating agro-industrial development, improving regional balance, and ensuring adequate supply of affordable edible oils for domestic markets. The Asian Development Bank (ADB) operational strategy for Indonesia and the subsector was consistent with Government strategies and aimed to support an important and potentially viable and competitive tree crop subsector. 6. The Project aimed to promote sustainable growth, reduce rural poverty, and enhance agricultural exports by developing institutions and agribusiness, which were salient features of the Government and ADB development strategies at project appraisal and completion. The Project built on the past investments and complemented ongoing projects that had primarily focused on enhancing the productivity of smallholder tree crops.2 7. The Project was designed under an ADB-financed project preparatory technical assistance (TA), which was implemented in 1991 over 8 months.3 Fact-finding and appraisal missions were conducted in November 1991 and March 1992, respectively. Sufficient resources were devoted to the TA and project formulation. The Project included clear and objective targeting mechanisms and was based on an integrated, participatory, and sound technical methodology. 8. However, in hindsight, the design was lacking in some key areas. It underestimated the need for institutional strengthening to change marketing mechanisms. Insufficient emphasis was placed on mobilizing farmers into groups or cooperatives that could deal with middlemen and factories. The project design did not provide an adequate system or resources for managing credit to farmers. 9. The Government and ADB closely monitored the Project’s progress and made several changes to improve the project activities’ relevance and impact. Funds and consulting resources were provided to build the capacity of staff and farmers’ groups, and to strengthen farmers’ groups and organize farmers’ cooperatives. Consulting resources were also provided to establish and improve the systems for managing credit to farmers. When CDC cofinancing failed to materialize, and rubber plantations were damaged by the 1998 forest fires and drought, the components of the Project were realigned to improve the likelihood of achieving its objectives. 2 In particular, the Project complemented ADB. 1991. Report and Recommendation of the President to the Board of
Directors on a Proposed Loan to Indonesia for the Tree Crop Smallholder Sector Project. Manila (Loan 1118-INO), which focused on improving productivity by introducing improved crop varieties and cultivation practices and was implemented from March 1992 to March 2001.
3 ADB. 1990. Technical Assistance to Indonesia for Tree Crop Processing Project. Manila. (TA No. 1327-INO, $500,000, approved on 27 June 1990)
3
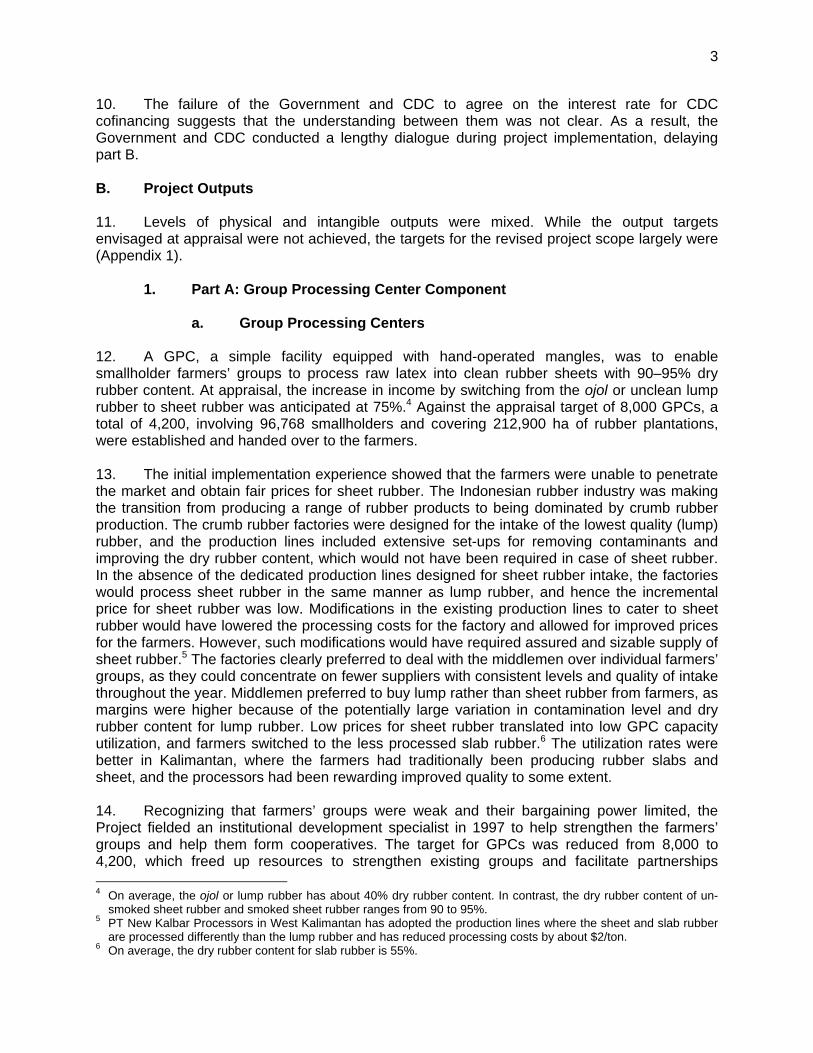
10. The failure of the Government and CDC to agree on the interest rate for CDC cofinancing suggests that the understanding between them was not clear. As a result, the Government and CDC conducted a lengthy dialogue during project implementation, delaying part B. B. Project Outputs 11. Levels of physical and intangible outputs were mixed. While the output targets envisaged at appraisal were not achieved, the targets for the revised project scope largely were (Appendix 1).
1. Part A: Group Processing Center Component
a. Group Processing Centers 12. A GPC, a simple facility equipped with hand-operated mangles, was to enable smallholder farmers’ groups to process raw latex into clean rubber sheets with 90–95% dry rubber content. At appraisal, the increase in income by switching from the ojol or unclean lump rubber to sheet rubber was anticipated at 75%.4 Against the appraisal target of 8,000 GPCs, a total of 4,200, involving 96,768 smallholders and covering 212,900 ha of rubber plantations, were established and handed over to the farmers. 13. The initial implementation experience showed that the farmers were unable to penetrate the market and obtain fair prices for sheet rubber. The Indonesian rubber industry was making the transition from producing a range of rubber products to being dominated by crumb rubber production. The crumb rubber factories were designed for the intake of the lowest quality (lump) rubber, and the production lines included extensive set-ups for removing contaminants and improving the dry rubber content, which would not have been required in case of sheet rubber. In the absence of the dedicated production lines designed for sheet rubber intake, the factories would process sheet rubber in the same manner as lump rubber, and hence the incremental price for sheet rubber was low. Modifications in the existing production lines to cater to sheet rubber would have lowered the processing costs for the factory and allowed for improved prices for the farmers. However, such modifications would have required assured and sizable supply of sheet rubber.5 The factories clearly preferred to deal with the middlemen over individual farmers’ groups, as they could concentrate on fewer suppliers with consistent levels and quality of intake throughout the year. Middlemen preferred to buy lump rather than sheet rubber from farmers, as margins were higher because of the potentially large variation in contamination level and dry rubber content for lump rubber. Low prices for sheet rubber translated into low GPC capacity utilization, and farmers switched to the less processed slab rubber.6 The utilization rates were better in Kalimantan, where the farmers had traditionally been producing rubber slabs and sheet, and the processors had been rewarding improved quality to some extent. 14. Recognizing that farmers’ groups were weak and their bargaining power limited, the Project fielded an institutional development specialist in 1997 to help strengthen the farmers’ groups and help them form cooperatives. The target for GPCs was reduced from 8,000 to 4,200, which freed up resources to strengthen existing groups and facilitate partnerships 4 On average, the ojol or lump rubber has about 40% dry rubber content. In contrast, the dry rubber content of un-
smoked sheet rubber and smoked sheet rubber ranges from 90 to 95%. 5 PT New Kalbar Processors in West Kalimantan has adopted the production lines where the sheet and slab rubber
are processed differently than the lump rubber and has reduced processing costs by about $2/ton. 6 On average, the dry rubber content for slab rubber is 55%.

4
between farmers’ groups and processors. These measures and a crash program undertaken by DGE starting in 2000 had a visible impact, as average capacity utilization increased from 24% in 1997 to about 85% at completion. The most visible aspect was the consolidation of about 10% of farmers’ groups into cooperatives. These comprised 6–8 farmers’ groups or 120–200 farmers, and could either bypass the middlemen and deal directly with the processors, or establish auction systems, where the middlemen would compete for the processed rubber. Interaction with the farmers suggested that the cooperative members were able to fetch prices that were 10–25% higher than those fetched by individual farmers or farmers’ groups. 15. While the improvements were significant, the interventions could not produce the anticipated returns. The project design had underestimated the need for institutional development of farmers’ groups and for addressing the marketing aspects. The extension staff lacked the skills to develop farmers’ groups. The assessments of farmers’ groups at project completion indicated that 56% had very basic capabilities, whereas the groups with intermediate and advanced capabilities were 44% and less than 1%, respectively. The appraisal estimation of 75% increase in the farmers’ income levels was overly optimistic given that the Indonesian rubber market was moving from producing a mix of rubber products to being dominated by crumb rubber production.
b. Credit to Establish Group Processing Centers 16. GPC equipment was provided to farmers’ groups on credit, to be repaid over 10 years at interest based on the Sertifikat Bank Indonesia rate, but not to exceed 16%.7 The interest rate included a 2.5% fee for farmers’ groups for collection of loans from individual members. The credit was managed by the PMUs that maintained the records on specifically designed forms. The PMUs collected the loan payments from the farmers and deposited them in the DGE account. The absence of a proper credit management system made it difficult to apply a variable interest rate, and instead the rate was fixed at 16%. The Project provided 4,200 farmers’ groups with equipment amounting to Rp24.8 billion ($6.1 million). 17. Throughout implementation, loan repayment rates remained low. Repayment performance was directly correlated with GPC utilization and rose from less than 5% to about 12% with improvements in capacity utilization. At project completion in 2002, Rp16.7 billion was due; total repayment amounted to Rp2.0 billion or 12%. Repayment rates declined to less than 10% at evaluation. While the primary reason for low repayment rates was less-than-anticipated returns, other reasons included the lack of system and skills to manage a credit program, and long and cumbersome system of incentive payments to farmers’ groups for timely loan payment. The credit program was not self sustaining, and follow-up and loan collection has further declined since project completion. Follow-up on credit collection is now minimal, resulting in the decline of loan repayment performance to less than 10% of the amount due. On average, equipment to a farmers’ group amounted to Rp4 million to Rp5 million, or Rp160,000 to Rp250,000 per farmer, payable over 10 years. The terms may have been appropriate for replanting activities with long gestation periods but clearly not for GPCs or processing enterprises. The small long-term loans made it unfeasible to sustain credit recovery. The resource requirement to manage and follow up on such a program may prove to be prohibitively expensive, which may make the program unsustainable. The details of credit repayment are summarized in Appendix 2.
7 The terms and conditions were similar to the credit program on the Tree Crop Smallholder Sector Project (footnote
2), which provided credit for replanting of tree crops. At the time of completion review in 2002 for this previous project, the repayment rates were reported at about 3% of the amount due.

5
2. Part B: Factory Component
18. The activities under the component were to be cofinanced by CDC. The subsidiary loan agreements (SLAs) with PTPs XII and XVIII were finalized in September 1993. PTP XII had established the project offices before the inception mission and the engineering consultant for designing the factories were fielded in 1994/95. However, the dialogue between the Government and CDC, spread over 3 years from project inception, failed to reach an agreement on the cofinancing terms and conditions. This was a major setback for the component, and its activities were shelved. The Government embarked on a countrywide regrouping and merging of PTPs into state-owned estate enterprises (PTPNs), which led to the merger of PTPs XII and XVIII into PTPNs VI and XIII in 1996. The priorities and the business plans of PTPNs VI and XIII differed from those of the PTPs XII and XVIII. Less funding for the component was available, and the component required major realignment. In 1998, the component’s scope was reduced and new locations were identified for establishing 1 crumb rubber and 2 crude palm oil factories. East Kalimantan was included in the project area. The location of the rubber factory outside the areas covered by the GPC component led to lack of synergies between the intermediate and advanced farmers’ group processing—synergies that would have benefited the farmers and PTPN XIII. 19. As start-up activities and award of contracts for the factories were delayed, completion of the revised project scope required an extension of 3 years. All physical targets under the component were achieved and all 3 factories made operational. The component’s implementation schedule is in Appendix 3. As of March 2005, the crumb rubber factory in West Kalimantan and the crude oil palm factory in Jambi were operating at design capacity. However, the crude oil palm factory in East Kalimantan was operating at 36% of design capacity because of supply-related problems.8 The loan repayment of PTPNs VI and XIII is on schedule. 20. The activities under parts A and B were designed to complement each other but did not. As a result of the realignment of part B, the rubber factory was located in the area not covered by the smallholder group processing activities. The location of the factory in areas with the GPCs would have increased the income of smallholders and the factory. Similarly, farm empowerment was extended only to rubber farmers although it would equally have benefited palm oil farmers.
3. Part C: Support Service Component 21. The component was to build institutional and technical capacities of the extension staff and farmers’ groups by providing training, consulting services, and infrastructure, and by establishing PMUs.
a. Training 22. As appraised, the component was to provide 1,383 person-months of training for staff, and farmers, including women, in tree crop production, harvesting, processing, quality improvement, marketing, and rural enterprises. During early implementation, training needs, in
8 The factory paid farmers significantly lower prices than private factories. The PTPN is reducing the liabilities by
moving excess staff employed on the estate to other concerns, which would allow it to offer more competitive prices to farmers. This, combined with the additional areas of oil palm reaching maturity, should enable the factory to raise its production levels.
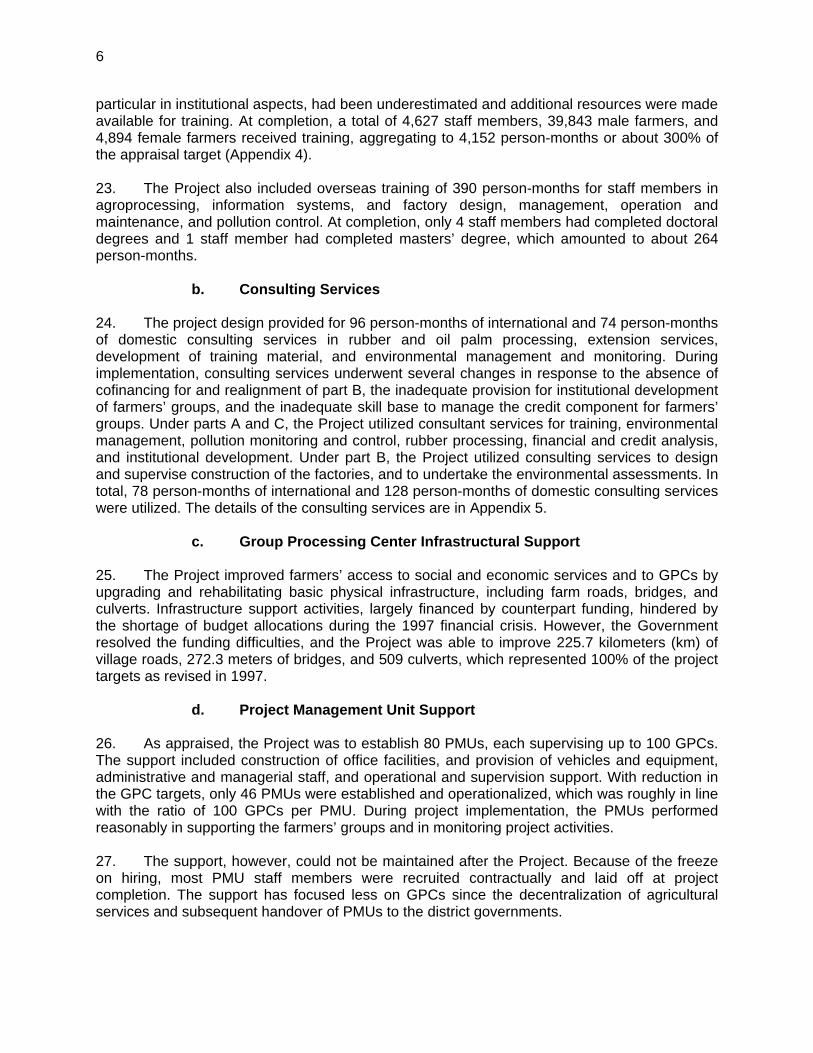
6
particular in institutional aspects, had been underestimated and additional resources were made available for training. At completion, a total of 4,627 staff members, 39,843 male farmers, and 4,894 female farmers received training, aggregating to 4,152 person-months or about 300% of the appraisal target (Appendix 4). 23. The Project also included overseas training of 390 person-months for staff members in agroprocessing, information systems, and factory design, management, operation and maintenance, and pollution control. At completion, only 4 staff members had completed doctoral degrees and 1 staff member had completed masters’ degree, which amounted to about 264 person-months.
b. Consulting Services 24. The project design provided for 96 person-months of international and 74 person-months of domestic consulting services in rubber and oil palm processing, extension services, development of training material, and environmental management and monitoring. During implementation, consulting services underwent several changes in response to the absence of cofinancing for and realignment of part B, the inadequate provision for institutional development of farmers’ groups, and the inadequate skill base to manage the credit component for farmers’ groups. Under parts A and C, the Project utilized consultant services for training, environmental management, pollution monitoring and control, rubber processing, financial and credit analysis, and institutional development. Under part B, the Project utilized consulting services to design and supervise construction of the factories, and to undertake the environmental assessments. In total, 78 person-months of international and 128 person-months of domestic consulting services were utilized. The details of the consulting services are in Appendix 5.
c. Group Processing Center Infrastructural Support 25. The Project improved farmers’ access to social and economic services and to GPCs by upgrading and rehabilitating basic physical infrastructure, including farm roads, bridges, and culverts. Infrastructure support activities, largely financed by counterpart funding, hindered by the shortage of budget allocations during the 1997 financial crisis. However, the Government resolved the funding difficulties, and the Project was able to improve 225.7 kilometers (km) of village roads, 272.3 meters of bridges, and 509 culverts, which represented 100% of the project targets as revised in 1997.
d. Project Management Unit Support 26. As appraised, the Project was to establish 80 PMUs, each supervising up to 100 GPCs. The support included construction of office facilities, and provision of vehicles and equipment, administrative and managerial staff, and operational and supervision support. With reduction in the GPC targets, only 46 PMUs were established and operationalized, which was roughly in line with the ratio of 100 GPCs per PMU. During project implementation, the PMUs performed reasonably in supporting the farmers’ groups and in monitoring project activities. 27. The support, however, could not be maintained after the Project. Because of the freeze on hiring, most PMU staff members were recruited contractually and laid off at project completion. The support has focused less on GPCs since the decentralization of agricultural services and subsequent handover of PMUs to the district governments.
7
e. Rehabilitation and Intensification of Rubber
28. The 1998 forest fires and the drought damaged vast areas of rubber plantations in Sumatra and Kalimantan, of which 21,600 ha belonged to farmers in the project area. Farmers’ livelihoods were severely damaged, and the sustainability of part A threatened. At the Government’s request, ADB approved rehabilitation and intensification of rubber plantations owned by active GPC members. The Project rehabilitated 10,345 ha of rubber plantations, and undertook intercropping on 10,345 ha and intensification on 10,620 ha, respectively representing 100%, 97%, and 83% of the revised targets. The detailed implementation schedule for the activity is in Appendix 6. C. Project Costs 29. At appraisal, the total project costs were estimated at $125.3 million, comprising $40.0 million for part A, $23.0 million for part B, $24.8 million for part C, $23.8 million for contingencies, and $13.7 million for the interest during construction. The foreign exchange cost accounted for $64.1 million, or 51% of the total project cost. The ADB and CDC loans together were to finance about 70% of the project costs. In June 1997, CDC and the Government formally informed ADB that they could not reach an agreement on CDC cofinancing. 30. At project completion, the total project cost was $65.7 million, or 52% of the original estimate. The foreign currency costs accounted for $37.5 million, local currency costs for $28.2 million. ADB financing amounted to $50.1 million, of which $37.5 million was for the foreign exchange costs and $12.6 million for the local currency costs. ADB financing accounted for 76% of the total project cost compared to envisaged financing of 70% by ADB and CDC. Higher than expected ADB financing was mainly on account of temporarily allowing for a higher percentage of financing immediately after the 1997 financial crisis. Detailed estimated and actual project costs by component are in Appendix 7. The foreign portion of the project costs increased from 51% to 57%, while the local cost decreased from 49% to 43%. 31. Actual project costs were lower than the appraisal estimates in dollar terms because of reduced project scope and local cost savings resulting from the rupiah’s depreciation against the dollar.9 D. Disbursements 32. The initial disbursement of $1 million was made to the imprest fund on 1 October 1993. Out of the original loan amount of $75.0 million, actual loan utilization amounted to $50.1 million. There were 4 loan cancellations: $10.7 million on 16 July 1998, $6.6 million on 7 August 1998, $5.1 million on 4 September 2000, and $2.607 million at loan closing on 1 July 2003. Disbursement of the loan funds was slow on account of start-up delays in part B and slow progress in parts A and C; at midterm, only 16% of the original loan amount had been utilized. The yearly loan utilization and details of loan cancellations are in Appendixes 8 and 9. 33. The loan funds were disbursed using a range of ADB disbursement procedures. The imprest account was used for parts A and C with a statement of expenditure ceiling of $50,000 per payment. DGE found the imprest advance useful, especially during the post 1997 financial crisis period in 1998–1999. The average turnover rate of the imprest account over the 10 years
9 As appraised, the price contingencies were large, suggesting that the costing was based on a constant nominal
exchange rate instead of constant real exchange rate.
8
was 1.58 (ADB’s standard turnover ratio is 2.00).10 In part B, the payment of the turn-key contracts was through direct payment and commitment letter procedures. 34. Up to 2001, the Ministry of Finance (Directorate of Budget Administration) prepared the withdrawal applications following submission of the relevant documents from the provincial treasury offices. The applications were sent to ADB directly by the directorate. In parts A and C, which involved numerous small payments, DGE had difficulty in financial control and monitoring of project expenditures, especially those for reimbursement. Among others, this system slowed down the utilization of the loan proceeds. The system was changed in 2001, when the Ministry of Finance was reorganized and responsibility for preparing withdrawal applications was entrusted to the Directorate of Foreign Loans. Under the new system, the executing agencies were given a more active role in preparing withdrawal applications. E. Project Schedule 35. The Project was originally scheduled to be implemented over 6 years, from September 1993. However, implementation took about 9 years, from 14 September 1993 to 30 September 2002. The implementation period was extended by 2 years in 1998 and by 1 more year in 2001, mainly to allow completion of part B. The key factors for delays in part B included (i) absence of CDC financing, (ii) reorganization and regrouping of the PTPs, (iii) realignment of the component and selection of new locations, and (iv) delays in finalization of the SLAs with PTPNs VI and XIII. Rubber rehabilitation and intensification under part C, introduced in 1998, could be completed only in 2002. F. Implementation Arrangements 36. DGE was the Project’s Executing Agency. It was responsible for implementing parts A and C, while PTPs XII and XVIII were responsible for implementing part B. Parts A and C were implemented largely as designed. In part B, the Government reorganized and regrouped the PTPs in March 1996, replacing PTPs XII and XVIII with PTPNs VI and XIII. 37. DGE had extensive experience in implementing similar ADB and World Bank projects. Similarly, the PTPs and PTPNs had sufficient experience in establishing and operating crumb rubber and crude palm oil factories. The national project management office (PMO), 6 provincial project offices (PPOs), and coordination mechanisms were established before loan effectiveness. The PPOs supervised and coordinated 46 PMUs, which facilitated farmer organization, farmer training, establishment of GPCs, loan collection from farmers’ groups, rubber rehabilitation and intensification, and development of rural infrastructure. 38. PMU staff members, however, lacked the skills to organize farmers. DGE was not the appropriate agency for managing a credit program for farmers’ groups. The agricultural services were devolved in 2001 to districts, but the Project had been designed for more conventional center-based implementation. Especially after project completion, support to farmers and follow-up on credit recovery was minimal.
10 The annualized imprest turnover rate is computed as the ratio of total liquidation over the time-weighted average
fund balance for 12 months.
9
G. Conditions and Covenants 39. Loan effectiveness was delayed by 3 months, mainly on account of delays in finalizing the subsidiary loan agreements (SLAs) with PTPs XII and XVIII. The delay had little effect on implementation, as the national and provincial offices had been established and staffed and the coordination mechanisms initiated before loan effectiveness. 40. With a few exceptions, compliance with major loan conditions and covenants was satisfactory (Appendix 10). The Loan Agreement was amended in 1998 to reflect the absence of CDC cofinancing and to allow for shifting the foreign exchange risk for the subsidiary loan agreements from the Borrower to the sub-borrowers (PTPNs VI and XIII). 41. Compliance with the covenants on recovery of credit from farmers and payment of incentives to farmers was partly satisfactory. Delayed payment of incentives for timely repayment was the main reason for poor credit recovery. Submission of progress reports and audited financial statements was occasionally delayed because PPO reports had to be consolidated and audit reports translated into English. The conditions and covenants were generally realistic. However, the Project’s sustainability could have been improved by including covenants on retaining trained staff members and on continuing support for farmers’ groups. H. Consultant Recruitment and Procurement
1. Consultant Recruitment 42. The consultants were engaged in accordance with the ADB’s Guidelines on the Use of Consultants. Compared with the appraisal provision of 96 person-months of international and 74 person-months of domestic consulting services, 78 person-months of international and 128 person-months of domestic consulting services were utilized. With the exception of consultants for part B, where component implementation was delayed, recruitment of consultants was timely.
2. Procurement of Goods and Services 43. The Project used a range of procurement methods, from direct purchase to international competitive bidding (ICB). Local contractors carried out civil works to build GPCs, roads, and office buildings under local competitive bidding (LCB). All supplies and equipment were procured in accordance with ADB’s Guidelines for Procurement. 44. At appraisal, contracts for part B were to be tendered separately, i.e., civil works by LCB, and machinery and equipment by ICB. However, during implementation, ADB approved a change in implementation arrangements to a turn-key contract procured through ICB. Procurement followed the 2-envelope procedure, with post-qualification of contractors during evaluation. 45. In 1999, ADB received a complaint relating to procurement of agrochemicals in South Kalimantan under the Tree Crop Smallholder Sector Project (footnote 2). This led to suspension of the project’s activities. As the loan was being implemented by the same executing agency and covered the same project area, ADB suspended the approval of procurement of similar agrochemicals for 6 months, which delayed rubber rehabilitation and replanting.
10
46. As the bulk of procurement under parts A and C was undertaken at the provincial and district levels, delays resulted because of field staff members’ lack of familiarity with ADB procedures. During initial implementation, the national staff members were trained in ADB procedures for procurement and loan management and disbursement. PTPN, provincial, and district staff members received similar training in ADB procedures during implementation. Training provincial and subprovincial staff members could have reduced implementation delays. I. Performance of Consultants, Contractors, and Suppliers 47. In general, the consultants performed satisfactorily. In parts A and C, additional expertise was provided for credit management and institutional development, both of which were weak in project design. The inclusion of institutional development specialist in 1997/98 was key in improving the quality of farmers’ groups and in integrating them into cooperatives, which had a visible impact on project performance. In hindsight, the Project could have benefited from a full-time domestic institutional development specialist covering the entire implementation period. The project design should have provided for a project benefit monitoring and evaluation specialist to help set up the national, provincial, and field monitoring and reporting systems. 48. In part B, tree crop processing engineering and environmental consultants worked with the PTPNs, designed the 3 factories, undertook the detailed initial environmental examinations (IEEs), prepared the tender documents, and supervised the establishment of the factories. The factories were designed to international standards and included provisions to mitigate adverse environmental impacts. The consultants’ performance was considered satisfactory. 49. The factories were constructed on turn-key contracts. Awarding of contracts was considerably delayed, but construction activities only minimally so, and factories were completed within stipulated time. The contractors provided on-the-job training to PTPN members staff during the test run and provided back-up for the first year of operations. Overall, performance of the contractors was satisfactory. 50. The contracts for civil works for GPCs, offices, roads, and bridges were awarded through LCB. Overall, the performance of the contractors was satisfactory. However, the quality of GPC construction in South Sumatra was poor during the initial implementation. J. Performance of the Borrower and the Executing Agency 51. The performance of the Borrower was satisfactory. The Government established the necessary imprest account and provided sufficient counterpart funds throughout project implementation. As a result of 1997 financial crisis, counterpart funding for GPC infrastructure was reduced but then fully restored on time. The reorganization and regrouping of PTPs into PTPNs delayed implementation of part B. However, the exercise improved the overall functioning of PTPNs and made factories more competitive by reducing overhead costs. 52. DGE’s performance as the Executing Agency was also satisfactory. It established and staffed the PMO and PPOs before the loan became effective. Overall, DGE met its responsibilities for project administration, coordination, and supervision, and was forthcoming in requesting assistance to respond to developments in the sector and in the overall implementation environment. However, DGE did not have the expertise, systems, or orientation to administer credit operations for the farmers. It was also weak in benefit monitoring and evaluation and socioeconomic impact assessment, primarily because of inadequate staff and

11
skills. Decentralizing agricultural support services to the districts has, however, weakened DGE’s ability to monitor and backstop farmers’ groups formed under the Project. 53. MOF satisfactorily supervised the SLAs and PTPNs VI and XIII in implementing part B. The PTPNs were successful in administration and in supervision of consultants and contractors, and the factories were constructed to international standards. K. Performance of the Asian Development Bank 54. ADB performance was satisfactory. ADB monitored the Project closely throughout its implementation and took timely steps to solve implementation problems. ADB fielded 15 missions to guide and support the Project. Throughout implementation, ADB was receptive to the changes warranted by developments in sector and the implementation environment. In particular, ADB acceded to the Government’s requests to reduce GPC targets, provide additional resources for local training and strengthening of farmers’ groups, realign part B, and rehabilitate rubber plantations damaged by the 1998 forest fires and drought. ADB also raised financing to 80% in 1998/99 to ensure that project activities were unaffected by the fiscal hardship resulting from 1997 financial crisis.
III. EVALUATION OF PERFORMANCE A. Relevance 55. The Project was relevant and consistent with the development strategies of the Government and ADB at appraisal and completion. The Project’s approach of improving farm incomes and reducing rural poverty by empowering farmers and developing agribusiness remains central to the Government’s policies. However, the Project design was deficient in key areas such as institutional development and market facilitation, which hindered the Project from achieving its objectives. Changes in the project scope provided additional resources to strengthen weak areas and improved the likelihood of achieving the project objectives. B. Efficacy in Achievement of Purpose 56. The Project had mixed success in achieving its outputs and purpose. About 96,700 smallholders, or 60% of the project target, covering about 213,000 ha, benefited from parts A and C. At appraisal, the useful life of GPCs was assessed at 10 years, and the assessment of the anticipated project benefits did not assume additional investments in GPC equipment and rehabilitation. In other words, the presence or absence of investments in replacement cost would not affect project performance. Based on the expected useful life, up to 43% of GPCs would have completed their useful lives at the time of evaluation. Against 57% of GPCs anticipated to be operational at the time of the evaluation, about 54% of the GPCs were reported to be active. 57. While the number of farmers improving the quality of their produce was considerably lower than the appraisal estimates, the levels were high within the operational GPCs. At project completion, only 3% of the operational GPCs were estimated to be engaged in producing lump rubber, the conventional product, while the GPCs that had switched to producing slab and sheet rubber made up 33% and 65%, respectively. Part B has significantly reduced postharvest losses by building processing centers close to the far-flung smallholders. The impact is greatest in the case of oil palm as the fruit is perishable and losses can be significant if processing facilities are far from the plantations. On average, the 2 crude palm oil factories have reduced travel

12
distances by about 100 km. Similarly, the crumb rubber factory serves 12,000–15,000 ha of smallholder-owned rubber that used to supply factories 300–350 km away. 58. Smallholders’ incomes improved by 20–59%, lower than the anticipated 75%. The Project reached only about 60% of the farmers envisaged at the appraisal. Lower-than-anticipated improvements are mainly caused by insufficient emphasis on institutional development and marketing, by changes in demand for Indonesian rubber, and by overly optimistic estimates of project benefits. The financial and economic analyses indicate that processors are suppressing the prices of intake from farmers, resulting in resource transfer from farmers to processors and to the Government. 59. The 10,345 ha of rubber planted to repair the damage inflicted by forest fires and droughts are yet to mature and hence so far have no impact. However, the newly planted trees are of superior clones and have been well maintained, and are anticipated to generate incremental annual per hectare incomes of Rp1.42 million. The associated intercropping and intensification provided additional income for farmers. 60. Overall, the Project was less efficacious in meeting its objectives. C. Efficiency in Achievement of Outputs and Purpose 61. The Project was less efficient in achieving its outputs and purpose. The appraisal had envisaged an economic internal rate of return (EIRR) of 34% for the Project, which was revised to 24% at the midterm in September 1997 and to 14% in August 1998. The initial assessment of the project performance indicates an EIRR of 9.7% for the overall Project, and 3.6% for parts A and C, and 17.2% for part B (Appendix 11). While the factory component was successful, the economic performance of GPC-related activities was poor because of farmers’ inability to penetrate the markets, lower utilization of GPCs, and underestimation of training needs. 62. As a result of high oil prices, the supply of synthetic rubber has suffered, leading to increased demand and prices for natural rubber. If rubber prices remain high for a long time, the Project’s economic performance is anticipated to improve. However, a 10% drop in crumb rubber prices and in crude palm oil prices would reduce the EIRR to 9.1%, and 6.4%, respectively. D. Preliminary Assessment of Sustainability 63. The overall Project is less likely to be sustainable. Part A’s performance was not as good as anticipated. The probability of replication of GPCs is low as the returns from processing were lower than anticipated, and the Indonesia rubber industry has been moving away from producing a mix of rubber products, including sheet rubber, to being dominated by crumb rubber. However, the impact of introducing processing to farmers is likely to last with continued production of slab rubber using the improved coagulation techniques promoted by the Project. 64. The institutional development of the farmers’ groups has improved farmers’ incomes. The Ministry of Agriculture emphasizes formation and strengthening of farmers’ groups through the farmer empowerment program. The rehabilitated and intensified rubber plantations have not matured but are being maintained and kept properly. The factories are fully operational and being managed and maintained professionally. PTPNs are considering installing production lines to double operational capacities in the crumb rubber factory at Sintang and the crude palm oil factory at Jambi.
13
65. Improved implementation capacities, including the trained staff and PMUs, have largely not been retained. Staff members had been recruited contractually and laid off at the project completion. While the PMU facilities are being used to provide extension services, they do not necessarily focus on tree crops or processing. E. Environmental, Sociocultural, and Other Impacts 66. The IEE, undertaken during project preparation, concluded that tree crop processing factories could have led to problems related to effluent and solid waste disposal, and that practical methodologies and techniques to mitigate these problems existed in Indonesia and in neighboring countries. With the realignment of part B and changes in factory locations, the IEEs were conducted for each of the 3 factories, which were designed and constructed to international standards and mitigated the identified adverse impacts. With the Project completed, the Ministry of Agriculture’s role in operating and maintaining the factories has become negligible, posing a potential risk that the vigilance in operating the factories may drop. 67. The Project helped improve the environment by training male and female farmers in improved tree crop management and environmentally friendly processing. The widespread adoption of the coagulation techniques introduced by the Project has improved quality of the farmers’ outputs without harming the environment. 68. Farmer empowerment under the Project led to a number of positive sociocultural impacts. The farmers’ groups and cooperatives formed through the Project were not limited to project-related activities and have often been functioning as socioeconomic entities. In a number of cooperatives visited by the PCR Mission, the farmers’ groups and cooperatives had established business partnerships with the suppliers and processors and were operating cooperative stores and tree crop nurseries. The capacity-building activities focused on improving female household members’ skills and income. Better physical infrastructure improved the communities’ access to neighboring communities and the cities. Better access improved linkages and reduced the costs of social and economic services. 69. GPCs were near the rubber plantations owned by the farmers’ groups. On average, each GPC required about 40 square meters of land, which the farmers’ groups contributed. The land represented lost utility but the impact was minimal as the farmers were free to choose the GPC location. Factories, however, were constructed on land owned by the Government and already used by PTPNs. 70. Overall, the environmental, sociocultural and other impacts were assessed as moderate.
IV. OVERALL ASSESSMENT AND RECOMMENDATIONS A. Overall Assessment 71. The Project met most of the revised targets and had mixed achievements in improving smallholder tree crop farmers’ incomes. The returns were below appraisal expectations on account of low returns to the rubber processed by the farmers’ groups, and realignment of the scope of the factory component. However, investment in institutional development of farmers paid good dividends. The factories are fully operational and have improved smallholder farmers’ access to processing.

14
72. Based on the project performance rating assessment criteria, the Project was rated partly successful. B. Lessons Learned 73. The following are the key lessons learned during project implementation:
(i) The Project aimed to change marketing regimes but lacked the inputs to do so. The Project should have emphasized farmer empowerment and organization of farmers’ groups into cooperatives.
(ii) The terms and conditions of cofinancing should have been agreed on between the Government and the cofinancier before ADB approval.
(iii) Credit operations should have been professionally managed, preferably by a financial institution. The incentives for early or timely repayment or collection of fees should have been paid at the time and point of collection.
(iv) The loan products should have been examined to ensure that they were appropriate for the interventions and cost-effective.
(v) While the country has excess capacity for rubber processing, some regions may need additional processing units. However, expansion of processing units should be carefully considered, as smaller units may have high processing costs and may not be competitive in an export-dominated market. The smaller units may not have outputs sizable enough to attract the foreign buyers that dominate the market. In light of the excess capacity, projects to process rubber or other tree crops should consider input supply potential and economies of scale in deciding on the regional need for additional factories.
(vi) Project preparation should be thorough and foresee the changes unfolding in the economy or sector. While it is not possible to fully predict the changes, the project design and implementation should be flexible and management should proactively address these changes during implementation. The input–output and output–outcome linkages should be carefully established, and the risks identified and mitigated.
C. Recommendations
1. Project-Related 74. The main project-related recommendations are as follows:
(i) The district governments, in coordination with the provincial governments and the Directorate General of Estate Crops Production (DGECP), should ensure continued support and monitoring of farmers’ groups. The DGECP-led farmer empowerment program could be appropriate for continuing support to groups and cooperatives formed under the Project.
(ii) The district governments, in coordination with the provinces and DGECP, should draw up plans to ensure the recovery of outstanding credit payments from farmers’ groups within 2 years. The implementation of the plan should be closely monitored by DGECP and the provincial governments.
(iii) DGECP, in coordination with the Ministry of Finance, should ensure that the backlog of incentive payments to farmers’ groups is cleared by December 2006.
(iv) The Directorate General of Processing and Marketing of Agricultural Products should help district governments oversee the environmental monitoring of factories.

15
(v) PTPNs VI and XIII should routinely review their procedures and operations to ensure maximum access of smallholders to the factories.
(vi) Through competitive pricing of the intake and innovative actions, including partnerships with the smallholders, PTPN XIII should improve utilization of the crude palm oil factory in East Kalimantan to achieve full utilization within 3 years.
(vii) If the project performance review is to be conducted, the mission should be fielded in about 3 years, as by that time the rehabilitated rubber should have matured and the project’s full benefits be assessable.
2. General
75. The key general recommendations include the following:
(i) The tree crop subsector has been a reliable source of income and exports. The productivity of major tree crops is lower than it could be and lower than in neighboring countries. The Government should consider improving productivity by introducing improved clones and management practices.
(ii) Staff members trained under the Project should be given preference over inexperienced staff members when recruiting for similar district, provincial, and national projects.
(iii) Projects should provide sufficient resources and consulting inputs to help establish the management information systems and benefit monitoring and evaluation systems.
(iv) With the delegation of responsibilities to districts, projects should provide adequate training to district and provincial staff in procedures and guidelines.
GROUP PROCESSING CENTERS TARGETS AND ACCOMPLISHMENTS
Province/ Target Actual per Fiscal YearDistrict/ Appraisal Revised Revised 1993/1994 1994/1995 1995/1996 1996/1997 1997/1998 1998/1999 TOTALPMU No. No. No. No. of Area No. of No. of Area No. of No. of Area No. of No. of Area No. of No. of Area No. of No. of Area No. of No. of Area No. of
(Mid-term) GPCs (Ha) Farmers GPCs (Ha) Farmers GPCs (Ha) Farmers GPCs (Ha) Farmers GPCs (Ha) Farmers GPCs (Ha) Farmers GPCs (Ha) Farmers
RIAUKamparBangkinang 100 100 100 4937 2534 0 0 0 0 0 0 0 0 0 0 0 0 0 0 0 100 4937 2534Rambah 100 100 0 0 0 100 4661 2439 0 0 0 0 0 0 0 0 0 0 0 0 100 4661 2439Lipat Kain 100 100 0 0 0 100 4832 2175 0 0 0 0 0 0 0 0 0 0 0 0 100 4832 2175Ujung Batu 50 50 0 0 0 50 2246 1181 0 0 0 0 0 0 0 0 0 0 0 0 50 2246 1181BengkalisTanah Putih 100 100 0 0 0 100 4699 2032 0 0 0 0 0 0 0 0 0 100 4699 2032
Subtotal 1800 450 450 100 4937 2534 250 11739 5795 100 4699 2032 0 0 0 0 0 0 0 0 0 450 21375 10361
JAMBIBatang HariSekernan 100 100 100 4784 1846 0 0 0 0 0 0 0 0 0 0 0 0 0 0 0 100 4784 1846Mestong 100 50 0 0 0 0 0 0 0 0 0 0 0 0 25 1077 516 25 1072 485 50 2149 1001Batin XXIV 100 50 0 0 0 0 0 0 0 0 0 0 0 0 25 1114 484 25 992 495 50 2106 979
Subtotal 1250 300 200 100 4784 1846 0 0 0 0 0 0 0 0 0 50 2191 1000 50 2064 980 200 9039 3826
S. SUMATERAMuara EnimTalang Ubi I/II 200 200 150 7304 3182 50 2435 1068 0 0 0 0 0 0 0 0 0 0 0 0 200 9739 4250Gunung Megang 100 100 0 0 0 100 5000 2500 0 0 0 0 0 0 0 0 0 0 0 0 100 5000 2500Talang Ubi III 100 100 0 0 0 100 5000 2500 0 0 0 0 0 0 0 0 0 0 0 0 100 5000 2500Musi RawasBkl.Ulu Terawas/M.Rupit 150 150 0 0 0 0 0 0 150 7296 3394 0 0 0 0 0 0 0 0 0 150 7296 3394Muara Beliti 100 100 0 0 0 0 0 0 100 4983 2245 0 0 0 0 0 0 0 0 0 100 4983 2245Muara Kelingi 100 100 0 0 0 0 0 0 100 4949 2351 0 0 0 0 0 0 0 0 0 100 4949 2351Musi BanyuasinLais/S.Keruh 75 75 0 0 0 0 0 0 0 0 0 0 0 0 50 2307 1106 25 1034 525 75 3341 1631BangkaSei Liat 75 75 0 0 0 0 0 0 0 0 0 50 3025 1274 25 1509 601 0 0 0 75 4534 1875Ogan Komering IlirPampangan 75 75 0 0 0 0 0 0 0 0 0 0 0 0 25 1080 540 50 2000 1000 75 3080 1540
Subtotal 2150 975 975 150 7304 3182 250 12435 6068 350 17228 7990 50 3025 1274 100 4896 2247 75 3034 1525 975 47922 22286W. KALIMANTANSambasSekura 100 100 67 3953 2010 23 1334 690 10 611 316 0 0 0 0 0 0 0 0 0 100 5898 3016Sambas 105 105 33 2046 805 57 3534 1368 15 930 360 0 0 0 0 0 0 0 0 0 105 6510 2533Samalantan 95 95 0 0 0 70 3990 1708 25 1402 610 0 0 0 0 0 0 0 0 0 95 5392 2318PontianakSei Ambawang 100 100 0 0 0 0 0 0 100 5848 2110 0 0 0 0 0 0 0 0 0 100 5848 2110Sei Raya 100 100 0 0 0 0 0 0 100 5376 2399 0 0 0 0 0 0 0 0 0 100 5376 2399Ngabang 150 90 0 0 0 0 0 0 0 0 0 0 0 0 0 0 0 90 5130 2160 90 5130 2160
16 Appendix 1
GROUP PROCESSING CENTERS TARGETS AND ACCOMPLISHMENTS
Province/ Target Actual per Fiscal YearDistrict/ Appraisal Revised Revised 1993/1994 1994/1995 1995/1996 1996/1997 1997/1998 1998/1999 TOTALPMU No. No. No. No. of Area No. of No. of Area No. of No. of Area No. of No. of Area No. of No. of Area No. of No. of Area No. of No. of Area No. of
(Mid-term) GPCs (Ha) Farmers GPCs (Ha) Farmers GPCs (Ha) Farmers GPCs (Ha) Farmers GPCs (Ha) Farmers GPCs (Ha) Farmers GPCs (Ha) Farmers
SanggauSei Kembayan 100 100 0 0 0 0 0 0 100 5496 2404 0 0 0 0 0 0 0 0 0 100 5496 2404Jangkang 100 100 0 0 0 0 0 0 0 0 0 100 5283 2277 0 0 0 0 0 0 100 5283 2277SintangSekadau 100 60 0 0 0 0 0 0 0 0 0 0 0 0 0 0 0 60 3060 1440 60 3060 1440KetapangKetapang 100 60 0 0 0 0 0 0 0 0 0 0 0 0 0 0 0 60 4500 1500 60 4500 1500
Subtotal 950 1050 910 100 5999 2815 150 8858 3766 350 19663 8199 100 5283 2277 0 0 0 210 12690 5100 910 52493 22157C.KALIMANTANBarito SelatanTamiang Layang 100 100 75 3975 1838 25 1342 612 0 0 0 0 0 0 0 0 0 0 0 0 100 5317 2450Ampah 100 100 75 4020 1725 25 1342 613 0 0 0 0 0 0 0 0 0 0 0 0 100 5362 2338Buntok 100 90 0 0 0 50 2375 1023 0 0 0 40 1989 818 90 4364 1841Barito UtaraMuara Teweh 100 100 0 0 0 100 5294 2477 0 0 0 0 0 0 0 0 0 0 0 0 100 5294 2477Puruk Cahu 100 35 0 0 0 0 0 0 0 0 0 35 2529 798 0 0 0 0 0 0 35 2529 798KapuasKapuas 75 65 0 0 0 0 0 0 65 3120 1625 0 0 0 0 0 0 0 0 0 65 3120 1625Bukit Rawi 75 65 0 0 0 0 0 0 65 3250 1610 0 0 0 0 0 0 0 0 0 65 3250 1610Kotawaringin BaratKudangan 50 30 0 0 0 0 0 0 0 0 0 0 0 0 0 0 0 30 1522 660 30 1522 660Kotawaringin TimurMentawa Baru Ketapang 50 30 0 0 0 0 0 0 0 0 0 0 0 0 0 0 0 30 1602 720 30 1602 720
Subtotal 950 750 615 150 7995 3563 200 10353 4725 130 6370 3235 75 4518 1616 0 0 0 60 3124 1380 615 32360 14519
S. KALIMANTANHulu Sungai UtaraBalangan 100 100 100 5461 2000 0 0 0 0 0 0 0 0 0 0 0 0 0 0 0 100 5461 2000Juai 100 100 0 0 0 50 2544 975 50 2544 974 0 0 0 0 0 0 0 0 0 100 5088 1949Hulu Sungai TengahBirayang 100 100 100 0 0 0 0 0 0 0 0 0 0 0 0 0 0 0 0 0 100 0 0Haruyan 100 100 0 0 0 0 0 0 50 2944 1233 50 2943 1232 0 0 0 0 0 0 100 5887 2465Hulu Sungai SelatanKandangan 100 100 0 0 0 0 0 0 50 2512 1250 0 0 0 50 2511 1250 0 0 0 100 5023 2500BanjarBanjar 175 175 0 0 0 0 0 0 50 2550 1100 50 2550 1100 75 3750 1650 0 0 0 175 8850 3850TapinRantau 100 100 0 0 0 0 0 0 0 0 0 0 0 0 100 5156 2500 0 0 0 100 5156 2500TabalongTanjung 175 175 0 0 0 0 0 0 0 0 0 100 5154 2500 75 3865 1875 0 0 0 175 9019 4375Tanta 100 100 0 0 0 100 5228 1980 0 0 0 0 0 0 0 0 0 0 0 0 100 5228 1980
Subtotal 900 1050 1050 200 5461 2000 150 7772 2955 200 10550 4557 200 10647 4832 300 15282 7275 0 0 0 1050 49712 21619TOTAL 8000 4575 4200 800 36480 15940 1000 51157 23309 1130 58510 26013 425 23473 9999 450 22369 10522 395 20912 8985 4200 212901 94768
Source: Directorate General of Estates data.
Appendix 1
17
No. of Farmers Amount No. of
Farmers Amount No. of Farmers Amount
% of Amount
Due
No. of Farmers Amount No. of
Farmers Amount % of
Amount Due
Riau 450 10,361 1,840,376 10,361 1,522,084 5,614 132,820 8.73 10,361 1,617,781 10,361 137,449 8.50 Jambi 200 3,826 1,214,132 3,826 915,614 678 135,151 14.76 3,826 2,188,934 3,826 234,767 10.73 South Sumatra 975 22,286 4,790,436 22,286 4,436,603 5,513 923,252 20.81 22,266 4,803,353 22,266 1,016,880 21.17 West Kalimantan 910 22,157 5,540,163 19,217 3,059,364 17,040 282,959 9.25 19,217 3,282,927 22,157 332,431 10.13 Central Kalimantan 615 14,519 3,903,850 615 921,904 3,800 126,478 13.72 615 1,129,864 14,519 153,041 13.55 South Kalimantan 1,050 23,619 7,532,590 23,619 5,836,063 23,510 420,571 7.21 23,619 6,227,682 23,619 487,172 7.82
TOTAL 4,200 96,768 24,821,547 79,924 16,691,632 56,155 2,021,231 12.11 79,904 19,250,541 96,748 2,361,740 12.27
Credit Repayment
CREDIT REPAYMENT PERFORMANCE(Rupiah '000)
As of March 2005 (At PCR)
Province No. of GPC
Original Investment Installment Due
As of Sept 2002 (At loan closing)
Credit Repayment Installment Due
18 Appendix 2
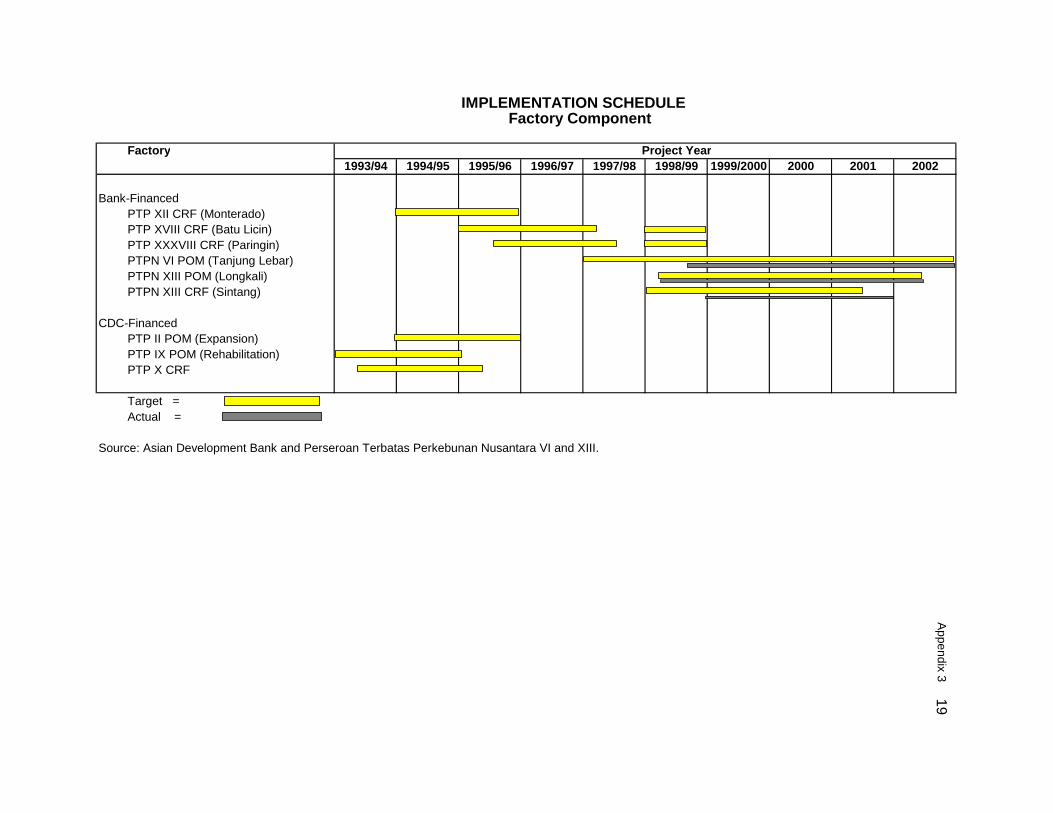
IMPLEMENTATION SCHEDULE Factory Component
Factory Project Year1993/94 1994/95 1995/96 1996/97 1997/98 1998/99 1999/2000 2000 2001 2002
Bank-FinancedPTP XII CRF (Monterado)PTP XVIII CRF (Batu Licin)PTP XXXVIII CRF (Paringin)PTPN VI POM (Tanjung Lebar)PTPN XIII POM (Longkali)PTPN XIII CRF (Sintang)
CDC-FinancedPTP II POM (Expansion)PTP IX POM (Rehabilitation)PTP X CRF
Target =Actual =
Source: Asian Development Bank and Perseroan Terbatas Perkebunan Nusantara VI and XIII.
Appendix 3 19

Training Courses 1993/94 1994/95 1995/96 1996/97 1997/98 1998/99 1999/2000 2000 2001 2002 Total(Number of persons)
A. StaffDomestic
1. Rubber processing and marketing 50 191 115 68 85 - 40 - - - 549 2. Tree crop and GPC management - 165 15 - 20 - - - - - 200 3. Extension methods - 30 285 53 115 - - - - - 483 4. Credit administration - 44 - - 38 - - - - - 82 5. Field interaction - - - - - 985 325 120 - - 1,430 6. Extension workers technical - - - - - 30 40 67 - - 137 7. Business management - - - - - - - 277 - - 277 8. Management by objective - - - - - - 68 305 - - 373 9. On-the-job training (cooperative) - - - - - - - 113 - - 113 10. Training agribusiness development
for advisory assistance team - - - - - 30 - 10 - 50 90 11. Training agribusiness development
for facilitators - - - - - 60 - 20 - 150 230 12. Workshop on agribusiness development - - - - - - - 325 - - 325 13. On-the-job training (marketing) - - - - - - - 25 - - 25 14. Agribusiness development - - 30 - - - - - - - 30 15. General affairs administration - 30 - - - - - - - - 30 16. Financial management - 30 - - - - - - - - 30 17. English for communication - 40 - - - - - - - - 40 18. MIS for credit repayment - - 14 - - - - - - - 14 19. Training of trainors on rubber processing - - 27 - - - - - - - 27
and marketing20. Training of trainors on agribusiness - - 48 - - - 36 - - - 84 21. Credit and collection - - 22 - - - - - - - 22 22. Business and cooperative - - - - - - 50 105 - - 155
Subtotal 50 530 556 121 258 1,105 559 1,367 - 200 4,746
Overseas23. Training on agribusiness (oveseas) - - - 20 - - - - - - 20 24. GPC management (overseas) - - - 10 - - - - - - 10 25. Master degree (overseas) - - - 1 - - - - - - 1 26. Doctorate degree (overseas) - - - 5 - - - - - - 5
Subtotal (Overseas) - - - 36 - - - - - - 36
Total (Staff) 50 530 556 157 258 1,105 559 1,367 - 200 4,782
TRAINING PROGRAMS
20 Appendix 4

Training Courses 1993/94 1994/95 1995/96 1996/97 1997/98 1998/99 1999/2000 2000 2001 2002 Total(Number of persons)
B. Farmer Participants (Domestic)1. Rubber processing and marketing 800 1,020 1,070 474 20 - - 300 - - 3,684 2. Tree crop and group processing - 2,000 - - - - - - - - 2,000
center management3. Farmer organization development - - 2,000 1,150 1,000 875 160 50 - - 5,235 4. Field interaction - - - 6,200 2,000 2,050 1,355 1,100 - - 12,705 5. Business management - - - - - - - 104 - - 104 6. On-the-job training (cooperative) - - - - 25 50 20 170 - - 265 7. On-the-job training (marketing) - - - - - 30 125 25 - - 180 8. Training agribusiness development
for farmers - - - - - 2,500 4,870 2,425 - 3,750 13,545 9. Training agribusiness development
for farmer group leaders - - - - - 500 1,000 250 - 350 2,100 10. Cooperative management - - - - - 25 - - - - 25
Total (Farmer Participants) 800 3,020 3,070 7,824 3,045 6,030 7,530 4,424 - 4,100 39,843
C. Women Participants (Domestic)1. Women in development 784 1,200 1,150 450 800 250 200 60 - - 4,894
Total (Women) 784 1,200 1,150 450 800 250 200 60 - - 4,894
GRAND TOTAL 1,634 4,750 4,776 8,431 4,103 7,385 8,289 5,851 - 4,300 49,519
TRAINING PROGRAMSAppendix 4 21
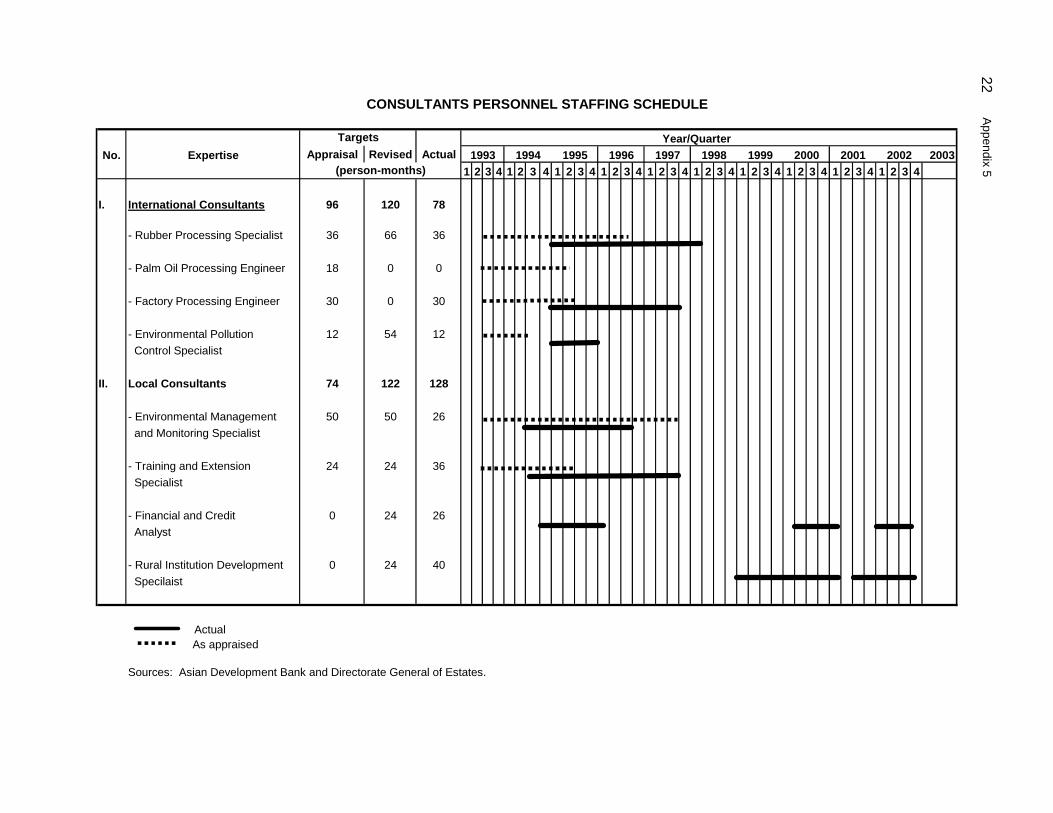
CONSULTANTS PERSONNEL STAFFING SCHEDULE
Year/QuarterNo. Expertise Appraisal Revised Actual 2003
1 2 3 4 1 2 3 4 1 2 3 4 1 2 3 4 1 2 3 4 1 2 3 4 1 2 3 4 1 2 3 4 1 2 3 4 1 2 3 4
I. International Consultants 96 120 78
- Rubber Processing Specialist 36 66 36
- Palm Oil Processing Engineer 18 0 0
- Factory Processing Engineer 30 0 30
- Environmental Pollution 12 54 12 Control Specialist
II. Local Consultants 74 122 128
- Environmental Management 50 50 26 and Monitoring Specialist
- Training and Extension 24 24 36 Specialist
- Financial and Credit 0 24 26 Analyst
- Rural Institution Development 0 24 40 Specilaist
Sources: Asian Development Bank and Directorate General of Estates.
1997 200220011995 1998 1999 20001993(person-months)
Targets19961994
ActualAs appraised
22 Appendix 5

Province Target Actual Per YearAppraisal Aug-98 1993/94 1994/95 1995/96 1996/97 1997/98 1998/99 1999/2000 2000 2001 2002 Total
RiauRehabilitation and Intercropping (ha) - 2,225 - - - - - 400 450 850 - 525 2,225 Intensification (ha) - 2,650 - - - - - 220 730 800 - 900 2,650
JambiRehabilitation and Intercropping (ha) - 900 - - - - - - - 900 - - 900 Intensification (ha) - 250 - - - - - 250 - - - - 250
South SumatraRehabilitation and Intercropping (ha) - 3,140 - - - - - 500 670 1,500 - 470 3,140 Intensification (ha) - 2,300 - - - - - 400 700 1,200 - - 2,300
West KalimantanRehabilitation and Intercropping (ha) - 1,375 - - - - - 500 475 - - 400 1,375 Intensification (ha) - 2,170 - - - - - - 1,420 - - 500 1,920
Central KalimantanRehabilitation and Intercropping (ha) - 1,075 - - - - - 350 225 500 - - 1,075 Intensification (ha) - 1,600 - - - - - 435 765 400 - - 1,600
South KalimantanRehabilitation and Intercropping (ha) - 1,630 - - - - - 500 684 246 - 200 1,630 Intensification (ha) - 1,900 - - - - - 590 342 658 - 310 1,900
TotalRehabilitation and Intercropping (ha) - 10,345 - - - - - 2,250 2,504 3,996 - 1,595 10,345 Intensification (ha) - 10,870 - - - - - 1,895 3,957 3,058 - 1,710 10,620
IMPLEMENTATION SCHEDULE OF REHABILITATION/INTERCROPPING AND INTENSIFICATION ACTIVITIES
Appendix 6 23

SUMMARY OF PROJECT COST($ million)
Appraisal ActualForeign Local Foreign Local
Exchange Currency Total Exchange Currency TotalComponent Cost Cost Cost Cost Cost Cost
A. Group Processing Centers1. Civil Works 6.20 11.50 17.70 2.84 4.56 7.40 2. Machinery and Equipment 14.50 7.80 22.30 4.37 2.11 6.48
Subtotal 20.70 19.30 40.00 7.21 6.67 13.88
B. Factories1. Civil Works 2.40 4.40 6.80 - 0.28 0.28 2. Machinery and Equipment 9.10 5.40 14.50 16.80 1.12 17.92 3. Consultancy/Training 1.30 0.30 1.60 - 0.16 0.16 4. Administrative Cost - 0.10 0.10 - - -
Subtotal 12.80 10.20 23.00 16.80 1.56 18.36
C. Support Services1. Training 1.90 0.60 2.50 1.89 2.37 4.26 2. Consultancy 1.00 0.70 1.70 0.41 0.45 0.86 3. Infrastructural Support 1.90 10.90 12.80 0.69 1.76 2.45 4. PMU Support
(I) Civil Works 0.40 0.80 1.20 - 0.19 0.19 (ii) Vehicles and Equipment 1.20 1.00 2.20 1.10 1.51 2.61 (iii) Administration/Management - 4.40 4.40 - 9.19 9.19
5. Rehabilitation - - - 0.42 3.69 4.11 6. Intercropping - - - 0.08 0.78 0.86
Subtotal 6.40 18.40 24.80 4.59 19.94 24.53
Total Base Cost 39.90 47.90 87.80 28.60 28.17 56.77
D. Contingencies1. Physical Contingencies 4.00 4.80 8.80 - - - 2. Price Escalation 6.50 8.50 15.00 - - -
E. Interest During Construction 13.70 - 13.70 8.90 - 8.90
Total Project Cost 64.10 61.20 125.30 37.50 28.17 65.67
Percent of Total Project Cost 51% 49% 57% 43%
Sources: Asian Development Bank, Directorate General of Estates, Perseroan Terbatas Perkebunan Nusantara VI and XIII.
24 Appendix 7

1993 1994 1995Component Allocation ADB GOI TOTAL ADB GOI TOTAL ADB GOI TOTAL
Part A - Group Processing Centers 13,376,576 - 41,191 41,191 3,256,253 76,090 3,332,343 477,773 139,013 616,786 Part B - Factories 16,849,000 - - - - - - - - - Part C -Support Services - Training 4,950,000 - - - 147,761 - 147,761 227,071 - 227,071 Part C - Support Services - Consultancy 1,261,500 - - - - - - 302,189 - 302,189 Part C - Support Services- Infrastructural Suppo 1,856,500 - - - - 431,936 431,936 256,568 109,638 366,206 Part C - Support Services- PMU Support 5,468,000 - 339,686 339,686 195,039 1,582,439 1,777,478 267,142 2,743,867 3,011,009 Civil Works 153,000 - - - - - - 11,010 - 11,010 Vehicles and Equipment 1,300,000 - 70,897 70,897 195,039 149,666 344,705 256,132 335,651 591,783 Rehabilitation and Intercropping 4,015,000 - - - - - - - - - Administration & Management - - 268,789 268,789 - 1,432,773 1,432,773 - 2,408,216 2,408,216 Total Investment Cost 43,761,576 0 380,877 380,877 3,599,053 2,090,465 5,689,518 1,530,743 2,992,518 4,523,261
Interest During Construction 8,900,000 54,908 - 54,908 339,878 - 339,878 778,477 - 778,477
GRAND TOTAL 52,661,576 54,908 380,877 435,785 3,938,931 2,090,465 6,029,396 2,309,220 2,992,518 5,301,738
Sources: Asian Development Bank, Directorate General of Esttates, Perseroan Terbatas Perkebunan Nusantara VI and XIII.
EXPENDITURES BY COMPONENT (In US$)
Appendix 7 25
1996 1997 1998Component ADB GOI TOTAL ADB GOI TOTAL ADB GOI TOTAL
Part A - Group Processing Centers 3,031,970 43,987 3,075,957 3,110,755 93,254 3,204,009 654,920 10,333 665,253 Part B - Factories - - - - 7,196 7,196 - 32,018 32,018 Part C -Support Services - Training 654,145 - 654,145 290,532 - 290,532 - - - Part C - Support Services - Consultancy 216,916 - 216,916 140,849 - 140,849 59,703 - 59,703 Part C - Support Services- Infrastructural Suppo 404,996 443,998 848,994 152,706 208,740 361,446 9,008 19,223 28,231 Part C - Support Services- PMU Support 622,638 1,221,565 1,844,203 156,736 1,996,365 2,153,101 52,284 1,069,025 1,121,309 Civil Works 80,957 - 80,957 11,767 - 11,767 - - - Vehicles and Equipment 541,682 132,351 674,033 144,969 272,687 417,656 52,284 13,024 65,308 Rehabilitation and Intercropping - - - - - - - 444,916 444,916 Administration & Management - 1,089,214 1,089,214 - 1,723,678 1,723,678 - 611,085 611,085 Total Investment Cost 4,930,666 1,709,550 6,640,216 3,851,578 2,305,555 6,149,937 775,915 1,130,599 1,906,514
Interest During Construction 1,054,847 - 1,054,847 1,282,569 - 1,282,569 1,409,214 - 1,409,214
GRAND TOTAL 5,985,513 1,709,550 7,695,063 5,134,147 2,305,555 7,439,702 2,185,129 1,130,599 3,315,728
Sources: Asian Development Bank, Directorate General of Esttates, Perseroan Terbatas Perkebunan Nusantara VI and XIII.
EXPENDITURES BY COMPONENT (In US$)
26 Appendix 7

1999 2000 2001Component ADB GOI TOTAL ADB GOI TOTAL ADB GOI TOTAL
Part A - Group Processing Centers 1,347,768 132,546 1,480,314 611,271 2,180 613,451 178,520 851 179,371 Part B - Factories - 53,281 53,281 3,256,955 138,969 3,395,924 8,126,310 1,326,774 9,453,084 Part C -Support Services - Training 245,571 - 245,571 475,950 - 475,950 564,202 - 564,202 Part C - Support Services - Consultancy 3,259 - 3,259 28,045 - 28,045 8,796 - 8,796 Part C - Support Services- Infrastructural Support 133,749 82,604 216,353 101,679 19,874 121,553 17,113 3,825 20,938 Part C - Support Services- PMU Support 301,139 1,481,326 1,782,465 134,556 1,087,690 1,222,246 201,272 319,598 520,870 Civil Works 3,835 - 3,835 44,285 - 44,285 - - - Vehicles and Equipment 55,496 352,997 408,493 22,444 - 22,444 - 392 392 Rehabilitation and Intercropping 241,808 274,048 515,856 67,827 778,805 846,632 201,272 - 201,272 Administration & Management - 854,281 854,281 - 308,885 308,885 - 319,206 319,206 Total Investment Cost 2,031,487 1,749,757 3,781,244 4,608,457 1,248,713 5,857,170 9,096,213 1,651,048 10,747,261
Interest During Construction 1,498,531 - 1,498,531 1,624,418 - 1,624,418 857,159 - 857,159
GRAND TOTAL 3,530,017 1,749,757 5,279,774 6,232,874 1,248,713 7,481,587 9,953,372 1,651,048 11,604,420
Sources: Asian Development Bank, Directorate General of Esttates, Perseroan Terbatas Perkebunan Nusantara VI and XIII.
EXPENDITURES BY COMPONENT (In US$)
Appendix 7 27
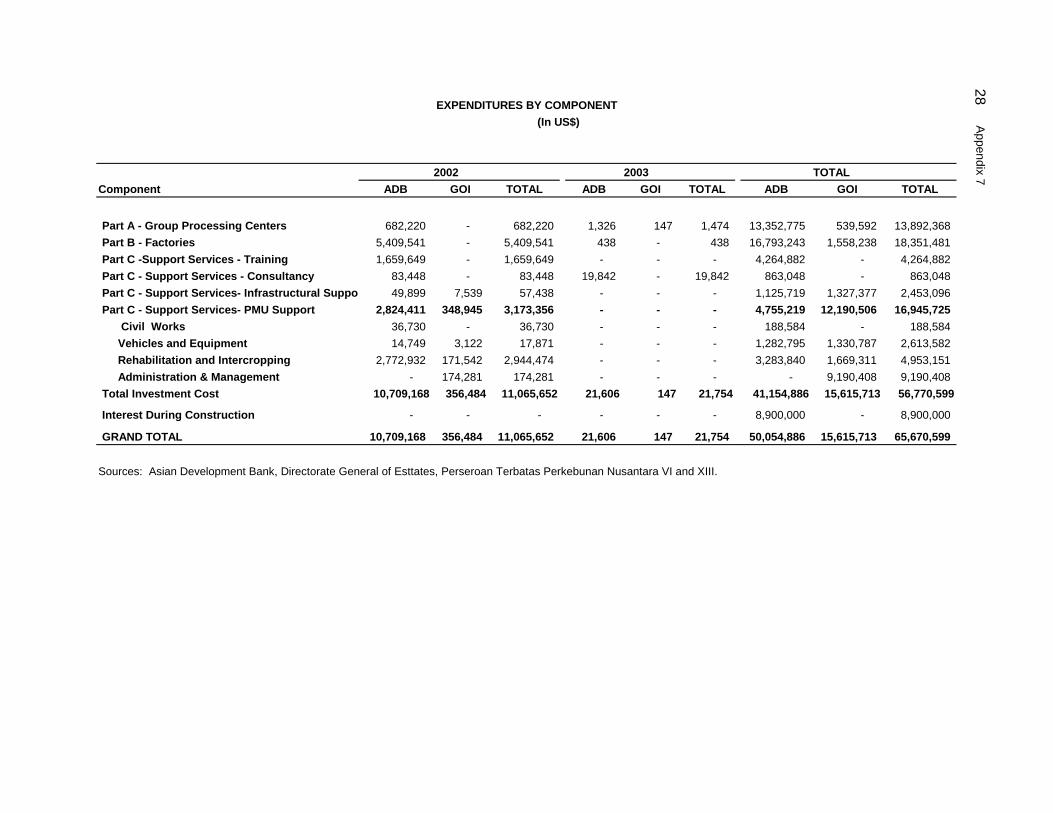
2002 2003 TOTALComponent ADB GOI TOTAL ADB GOI TOTAL ADB GOI TOTAL
Part A - Group Processing Centers 682,220 - 682,220 1,326 147 1,474 13,352,775 539,592 13,892,368 Part B - Factories 5,409,541 - 5,409,541 438 - 438 16,793,243 1,558,238 18,351,481 Part C -Support Services - Training 1,659,649 - 1,659,649 - - - 4,264,882 - 4,264,882 Part C - Support Services - Consultancy 83,448 - 83,448 19,842 - 19,842 863,048 - 863,048 Part C - Support Services- Infrastructural Suppo 49,899 7,539 57,438 - - - 1,125,719 1,327,377 2,453,096 Part C - Support Services- PMU Support 2,824,411 348,945 3,173,356 - - - 4,755,219 12,190,506 16,945,725 Civil Works 36,730 - 36,730 - - - 188,584 - 188,584 Vehicles and Equipment 14,749 3,122 17,871 - - - 1,282,795 1,330,787 2,613,582 Rehabilitation and Intercropping 2,772,932 171,542 2,944,474 - - - 3,283,840 1,669,311 4,953,151 Administration & Management - 174,281 174,281 - - - - 9,190,408 9,190,408 Total Investment Cost 10,709,168 356,484 11,065,652 21,606 147 21,754 41,154,886 15,615,713 56,770,599
Interest During Construction - - - - - - 8,900,000 - 8,900,000
GRAND TOTAL 10,709,168 356,484 11,065,652 21,606 147 21,754 50,054,886 15,615,713 65,670,599
Sources: Asian Development Bank, Directorate General of Esttates, Perseroan Terbatas Perkebunan Nusantara VI and XIII.
EXPENDITURES BY COMPONENT (In US$)
28 Appendix 7

Category
01A Civil W orks - Part A 15,904,000 7,500,000 0 1,841,652 477,773 1,268,684 1,788,445
01B Civil W orks - Part B - PTPN VI 891,000 0 0 0 0 0 0
01C Civil W orks - Part B - PTPN XIII 1,894,000 0 0 0 0 0 0
01D Civi l W orks - Part C - G PC Road Im provem ent 1,920,000 866,100 0 0 0 51,834 41,407
01E Civil W orks - Part C - PMU Support 811,000 990,400 0 0 256,568 353,162 111,299
02A Machinery, Equip & Veh - Part A 20,030,000 5,876,576 0 1,414,601 0 1,763,286 1,322,309
02B Machinery, Equip & Veh - Part B - PTPN VI 1,128,000 6,375,600 0 0 0 0 0
02C Machinery, Equip & Veh - Part B - PTPN XIII 3,157,000 10,473,400 0 0 0 0 0
02D Machinery, Equip & Veh - Part C - PMU Support 1,405,000 1,300,000 0 195,039 256,132 541,682 144,969
03A Consulting - Part B - PTPN VI 194,000 0 0 0 0 0 0
03B Consulting - Part B - PTPN XIII 306,000 0 0 0 0 0 0
03C Consulting - Part C 1,622,000 1,261,500 0 0 302,189 216,916 140,849
04 Training - Part C 2,487,000 4,950,000 0 147,761 227,071 654,145 290,532
05K Local Expenditures - GPC Site Planning 140,000 153,000 0 0 11,010 80,957 11,767
06 Interest During Construction 10,720,000 8,900,000 54,908 339,878 778,477 1,054,847 1,282,569
07 Unallocated 12,391,000 0 0 0 0 0 0
08 Rehabilitation 0 3,000,000 0 0 0 0 0
09 Intercropping 0 1,015,000 0 0 0 0 0
TOTAL 75,000,000 52,661,576 54,908 3,938,931 2,309,220 5,985,513 5,134,147
% of orig inal 0.1% 5.3% 8.4% 16.4% 23.2%% of total disb 0.1% 8.0% 12.6% 24.6% 34.8%
1996 1997
LOAN UTILIZATION BY YEAR(US$)
Allocation at Appraisal
Revised Allocation 1993 1994 1995
Appendix 8 29

LOAN UTILIZATION BY YEAR(US$)
Category Total Loan
Utilization
01A Civil Works - Part A 423,665 679,381 431,825 128,926 251,899 1,326 7,293,576
01B Civil Works - Part B - PTPN VI 0 0 0 0 0 0 0
01C Civil Works - Part B - PTPN XIII 0 0 0 0 0 0 0
01D Civi l Works - Part C - GPC Road Improvement 9,008 51,713 46,636 3,833 17,135 0 221,568
01E Civil Works - Part C - PMU Support 0 82,036 55,043 13,280 32,764 0 904,151
02A Machinery, Equip & Veh - Part A 231,254 668,387 179,446 49,594 430,321 0 6,059,199
02B Machinery, Equip & Veh - Part B - PTPN VI 0 0 0 3,121,642 3,243,854 0 6,365,496
02C Machinery, Equip & Veh - Part B - PTPN XIII 0 0 3,256,955 5,004,667 2,165,687 438 10,427,747
02D Machinery, Equip & Veh - Part C - PMU Support 52,284 55,496 22,444 0 14,749 0 1,282,795
03A Consulting - Part B - PTPN VI 0 0 0 0 0 0 0
03B Consulting - Part B - PTPN XIII 0 0 0 0 0 0 0
03C Consulting - Part C 59,703 3,259 28,045 8,796 83,448 19,842 863,048
04 Training - Part C 0 245,571 475,950 564,202 1,659,649 0 4,264,882
05K Local Expenditures - GPC Site Planning 0 3,835 44,285 0 36,730 0 188,584
06 Interest During Construction 1,409,214 1,498,531 1,624,418 857,159 0 0 8,900,000
07 Unallocated 0 0 0 0 0 0 0
08 Rehabilitation 0 241,808 67,827 201,272 2,265,621 0 2,776,530
09 Intercropping 0 0 0 0 507,311 0 507,311
TOTAL 2,185,129 3,530,017 6,232,874 9,953,372 10,709,168 21,606 50,054,886
26.1% 30.9% 39.2% 52.4% 66.7% 66.7% 66.7%39.2% 46.2% 58.7% 78.6% 100.0% 100.0% 100.0%
2000 20011998 2002 20031999
30 Appendix 8
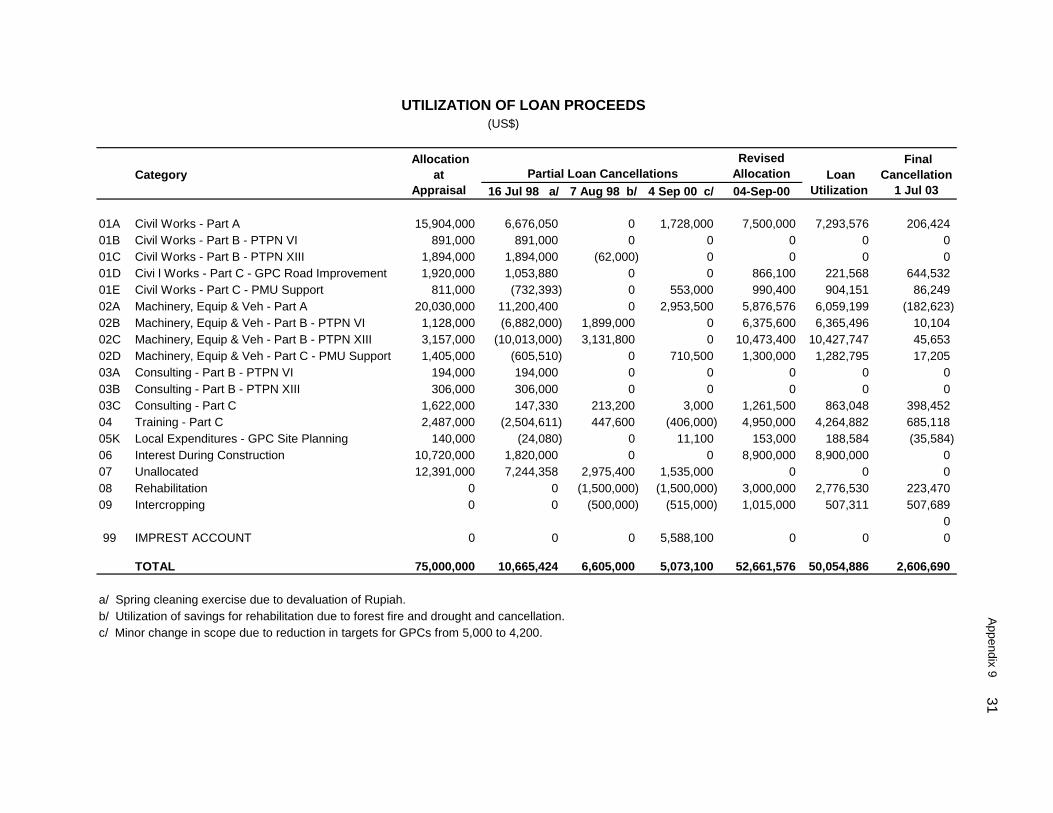
UTILIZATION OF LOAN PROCEEDS(US$)
Category16 Jul 98 a/ 7 Aug 98 b/ 4 Sep 00 c/ 04-Sep-00
01A Civil Works - Part A 15,904,000 6,676,050 0 1,728,000 7,500,000 7,293,576 206,42401B Civil Works - Part B - PTPN VI 891,000 891,000 0 0 0 0 001C Civil Works - Part B - PTPN XIII 1,894,000 1,894,000 (62,000) 0 0 0 001D Civi l Works - Part C - GPC Road Improvement 1,920,000 1,053,880 0 0 866,100 221,568 644,53201E Civil Works - Part C - PMU Support 811,000 (732,393) 0 553,000 990,400 904,151 86,24902A Machinery, Equip & Veh - Part A 20,030,000 11,200,400 0 2,953,500 5,876,576 6,059,199 (182,623)02B Machinery, Equip & Veh - Part B - PTPN VI 1,128,000 (6,882,000) 1,899,000 0 6,375,600 6,365,496 10,10402C Machinery, Equip & Veh - Part B - PTPN XIII 3,157,000 (10,013,000) 3,131,800 0 10,473,400 10,427,747 45,65302D Machinery, Equip & Veh - Part C - PMU Support 1,405,000 (605,510) 0 710,500 1,300,000 1,282,795 17,20503A Consulting - Part B - PTPN VI 194,000 194,000 0 0 0 0 003B Consulting - Part B - PTPN XIII 306,000 306,000 0 0 0 0 003C Consulting - Part C 1,622,000 147,330 213,200 3,000 1,261,500 863,048 398,45204 Training - Part C 2,487,000 (2,504,611) 447,600 (406,000) 4,950,000 4,264,882 685,11805K Local Expenditures - GPC Site Planning 140,000 (24,080) 0 11,100 153,000 188,584 (35,584)06 Interest During Construction 10,720,000 1,820,000 0 0 8,900,000 8,900,000 007 Unallocated 12,391,000 7,244,358 2,975,400 1,535,000 0 0 008 Rehabilitation 0 0 (1,500,000) (1,500,000) 3,000,000 2,776,530 223,47009 Intercropping 0 0 (500,000) (515,000) 1,015,000 507,311 507,689
099 IMPREST ACCOUNT 0 0 0 5,588,100 0 0 0
TOTAL 75,000,000 10,665,424 6,605,000 5,073,100 52,661,576 50,054,886 2,606,690
a/ Spring cleaning exercise due to devaluation of Rupiah.b/ Utilization of savings for rehabilitation due to forest fire and drought and cancellation.c/ Minor change in scope due to reduction in targets for GPCs from 5,000 to 4,200.
Allocation at
Appraisal Loan
Utilization
Final Cancellation
1 Jul 03
Revised Allocation Partial Loan Cancellations
Appendix 9 31
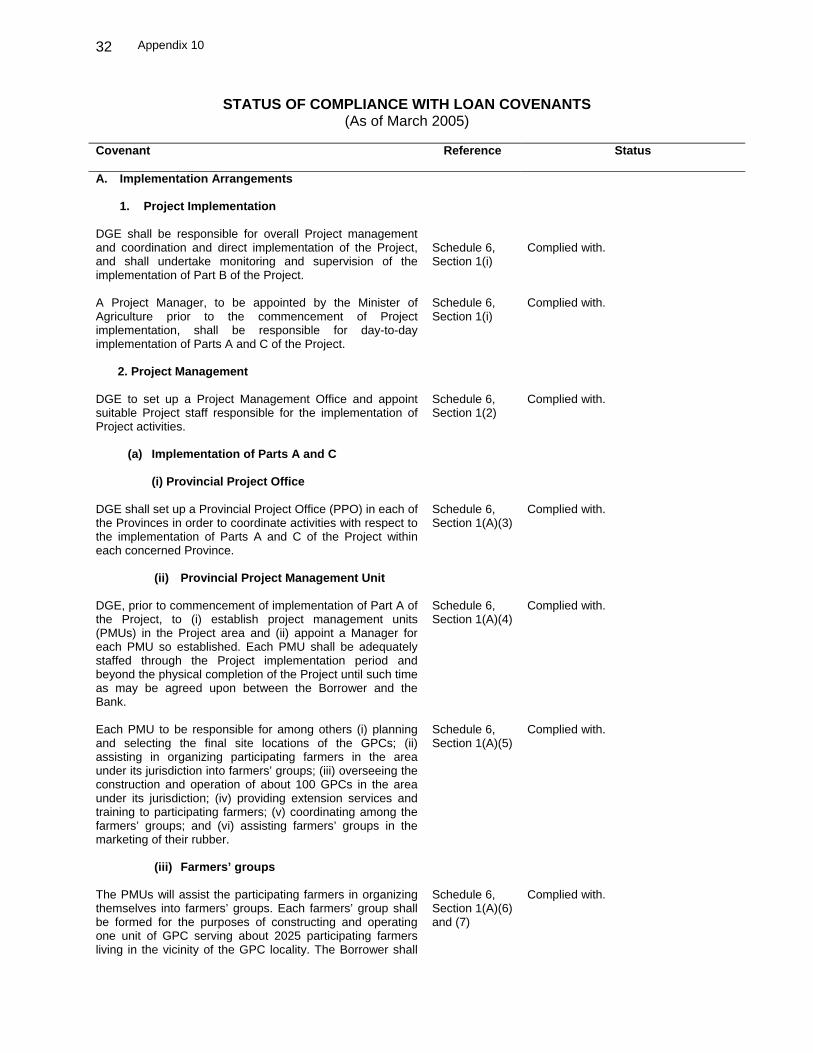
Appendix 10 32
STATUS OF COMPLIANCE WITH LOAN COVENANTS (As of March 2005)
Covenant
Reference Status
A. Implementation Arrangements
1. Project Implementation DGE shall be responsible for overall Project management and coordination and direct implementation of the Project, and shall undertake monitoring and supervision of the implementation of Part B of the Project.
Schedule 6, Section 1(i)
Complied with.
A Project Manager, to be appointed by the Minister of Agriculture prior to the commencement of Project implementation, shall be responsible for day-to-day implementation of Parts A and C of the Project.
Schedule 6, Section 1(i)
Complied with.
2. Project Management
DGE to set up a Project Management Office and appoint suitable Project staff responsible for the implementation of Project activities.
Schedule 6, Section 1(2)
Complied with.
(a) Implementation of Parts A and C
(i) Provincial Project Office
DGE shall set up a Provincial Project Office (PPO) in each of the Provinces in order to coordinate activities with respect to the implementation of Parts A and C of the Project within each concerned Province.
Schedule 6, Section 1(A)(3)
Complied with.
(ii) Provincial Project Management Unit
DGE, prior to commencement of implementation of Part A of the Project, to (i) establish project management units (PMUs) in the Project area and (ii) appoint a Manager for each PMU so established. Each PMU shall be adequately staffed through the Project implementation period and beyond the physical completion of the Project until such time as may be agreed upon between the Borrower and the Bank.
Schedule 6, Section 1(A)(4)
Complied with.
Each PMU to be responsible for among others (i) planning and selecting the final site locations of the GPCs; (ii) assisting in organizing participating farmers in the area under its jurisdiction into farmers’ groups; (iii) overseeing the construction and operation of about 100 GPCs in the area under its jurisdiction; (iv) providing extension services and training to participating farmers; (v) coordinating among the farmers’ groups; and (vi) assisting farmers’ groups in the marketing of their rubber.
Schedule 6, Section 1(A)(5)
Complied with.
(iii) Farmers’ groups
The PMUs will assist the participating farmers in organizing themselves into farmers’ groups. Each farmers’ group shall be formed for the purposes of constructing and operating one unit of GPC serving about 2025 participating farmers living in the vicinity of the GPC locality. The Borrower shall
Schedule 6, Section 1(A)(6) and (7)
Complied with.
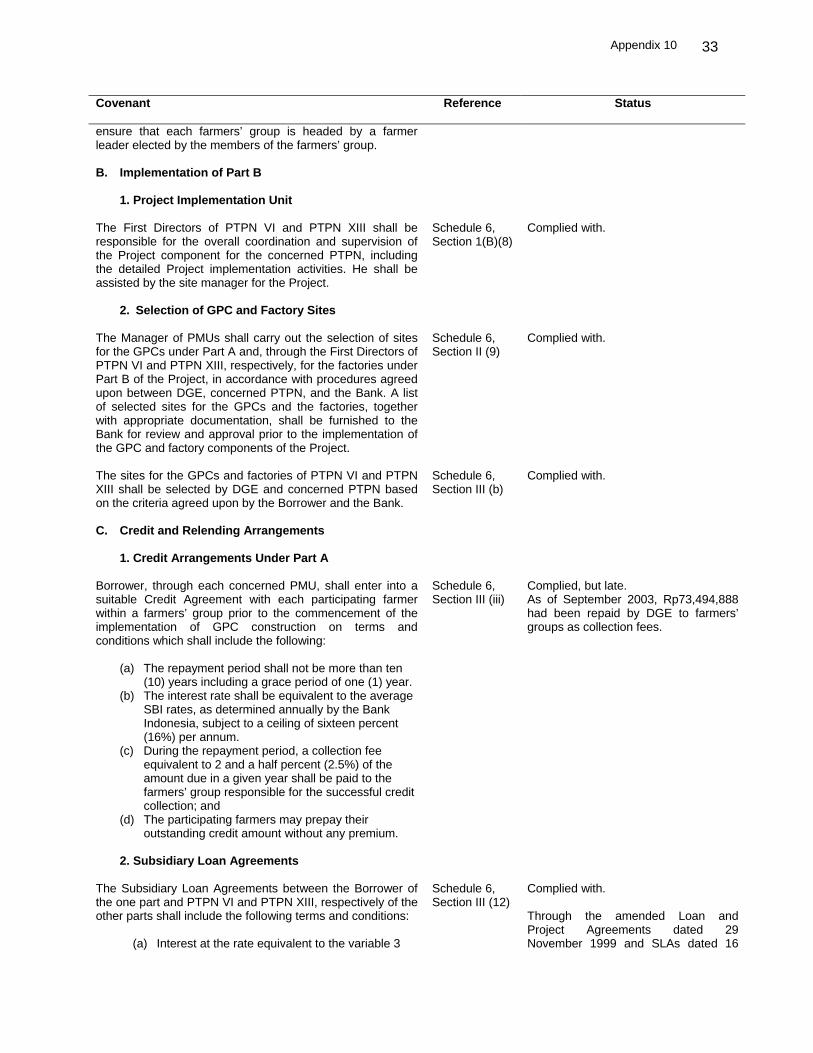
Appendix 10 33
Covenant
Reference Status
ensure that each farmers’ group is headed by a farmer leader elected by the members of the farmers’ group. B. Implementation of Part B 1. Project Implementation Unit
The First Directors of PTPN VI and PTPN XIII shall be responsible for the overall coordination and supervision of the Project component for the concerned PTPN, including the detailed Project implementation activities. He shall be assisted by the site manager for the Project.
Schedule 6, Section 1(B)(8)
Complied with.
2. Selection of GPC and Factory Sites The Manager of PMUs shall carry out the selection of sites for the GPCs under Part A and, through the First Directors of PTPN VI and PTPN XIII, respectively, for the factories under Part B of the Project, in accordance with procedures agreed upon between DGE, concerned PTPN, and the Bank. A list of selected sites for the GPCs and the factories, together with appropriate documentation, shall be furnished to the Bank for review and approval prior to the implementation of the GPC and factory components of the Project.
Schedule 6, Section II (9)
Complied with.
The sites for the GPCs and factories of PTPN VI and PTPN XIII shall be selected by DGE and concerned PTPN based on the criteria agreed upon by the Borrower and the Bank.
Schedule 6, Section III (b)
Complied with.
C. Credit and Relending Arrangements 1. Credit Arrangements Under Part A
Borrower, through each concerned PMU, shall enter into a suitable Credit Agreement with each participating farmer within a farmers’ group prior to the commencement of the implementation of GPC construction on terms and conditions which shall include the following:
(a) The repayment period shall not be more than ten (10) years including a grace period of one (1) year.
(b) The interest rate shall be equivalent to the average SBI rates, as determined annually by the Bank Indonesia, subject to a ceiling of sixteen percent (16%) per annum.
(c) During the repayment period, a collection fee equivalent to 2 and a half percent (2.5%) of the amount due in a given year shall be paid to the farmers’ group responsible for the successful credit collection; and
(d) The participating farmers may prepay their outstanding credit amount without any premium.
Schedule 6, Section III (iii)
Complied, but late. As of September 2003, Rp73,494,888 had been repaid by DGE to farmers’ groups as collection fees.
2. Subsidiary Loan Agreements
The Subsidiary Loan Agreements between the Borrower of the one part and PTPN VI and PTPN XIII, respectively of the other parts shall include the following terms and conditions:
(a) Interest at the rate equivalent to the variable 3
Schedule 6, Section III (12)
Complied with. Through the amended Loan and Project Agreements dated 29 November 1999 and SLAs dated 16
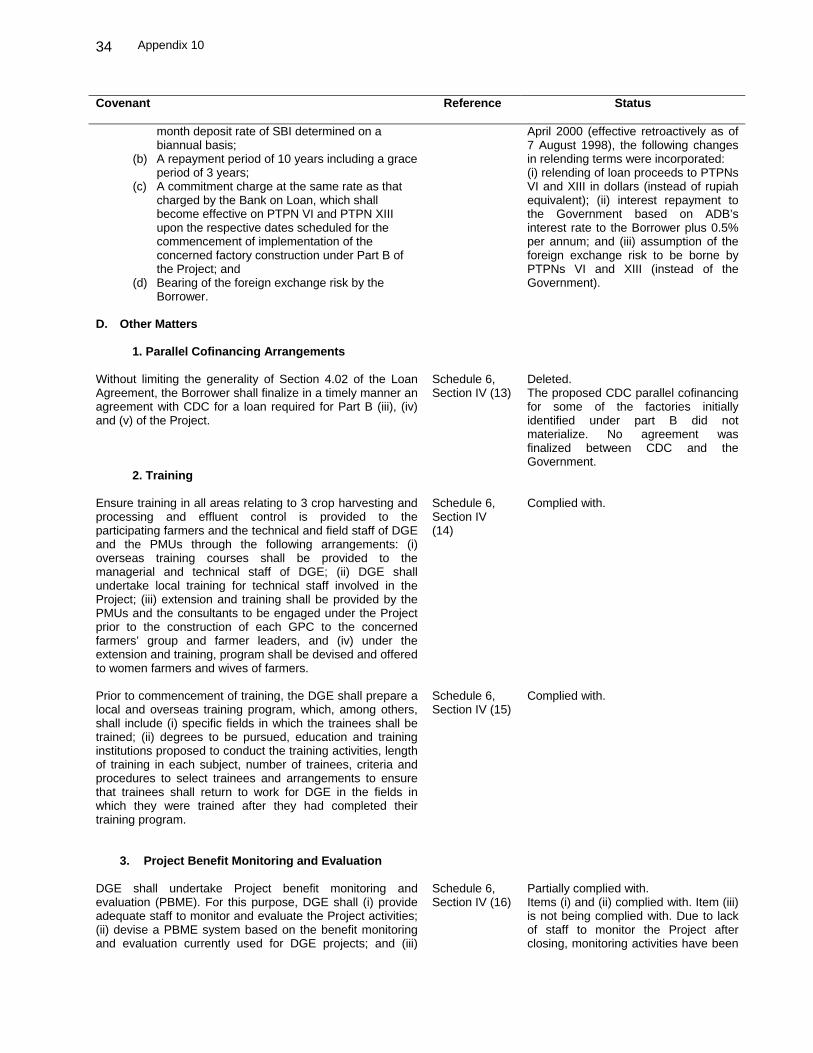
Appendix 10 34
Covenant
Reference Status
month deposit rate of SBI determined on a biannual basis;
(b) A repayment period of 10 years including a grace period of 3 years;
(c) A commitment charge at the same rate as that charged by the Bank on Loan, which shall become effective on PTPN VI and PTPN XIII upon the respective dates scheduled for the commencement of implementation of the concerned factory construction under Part B of the Project; and
(d) Bearing of the foreign exchange risk by the Borrower.
April 2000 (effective retroactively as of 7 August 1998), the following changes in relending terms were incorporated: (i) relending of loan proceeds to PTPNs VI and XIII in dollars (instead of rupiah equivalent); (ii) interest repayment to the Government based on ADB’s interest rate to the Borrower plus 0.5% per annum; and (iii) assumption of the foreign exchange risk to be borne by PTPNs VI and XIII (instead of the Government).
D. Other Matters
1. Parallel Cofinancing Arrangements Without limiting the generality of Section 4.02 of the Loan Agreement, the Borrower shall finalize in a timely manner an agreement with CDC for a loan required for Part B (iii), (iv) and (v) of the Project.
Schedule 6, Section IV (13)
Deleted. The proposed CDC parallel cofinancing for some of the factories initially identified under part B did not materialize. No agreement was finalized between CDC and the Government.
2. Training Ensure training in all areas relating to 3 crop harvesting and processing and effluent control is provided to the participating farmers and the technical and field staff of DGE and the PMUs through the following arrangements: (i) overseas training courses shall be provided to the managerial and technical staff of DGE; (ii) DGE shall undertake local training for technical staff involved in the Project; (iii) extension and training shall be provided by the PMUs and the consultants to be engaged under the Project prior to the construction of each GPC to the concerned farmers’ group and farmer leaders, and (iv) under the extension and training, program shall be devised and offered to women farmers and wives of farmers.
Schedule 6, Section IV (14)
Complied with.
Prior to commencement of training, the DGE shall prepare a local and overseas training program, which, among others, shall include (i) specific fields in which the trainees shall be trained; (ii) degrees to be pursued, education and training institutions proposed to conduct the training activities, length of training in each subject, number of trainees, criteria and procedures to select trainees and arrangements to ensure that trainees shall return to work for DGE in the fields in which they were trained after they had completed their training program.
Schedule 6, Section IV (15)
Complied with.
3. Project Benefit Monitoring and Evaluation DGE shall undertake Project benefit monitoring and evaluation (PBME). For this purpose, DGE shall (i) provide adequate staff to monitor and evaluate the Project activities; (ii) devise a PBME system based on the benefit monitoring and evaluation currently used for DGE projects; and (iii)
Schedule 6, Section IV (16)
Partially complied with. Items (i) and (ii) complied with. Item (iii) is not being complied with. Due to lack of staff to monitor the Project after closing, monitoring activities have been
Appendix 10 35
Covenant
Reference Status
evaluate the benefits of the Project after its completion.
discontinued in most PMUs.
For PBME under Part A of the Project, each PPO shall (i) prepare, within 3 months of GPC sites survey and selection, a GPC subproject profile for each Province, and (ii) on a quarterly basis, to report standard of GPC construction, performance of contractors, GPC utilization, performance of farmers’ groups in management and administration, quantity and quality or rubber produced, marketing facilities, price of dollar received, credit repayment, social problems and any other relevant data.
Schedule 6, Section IV (17)
Partially complied with. Incomplete data collected.
Under Part B of the Project, PTPN VI and PTPN XIII shall be responsible for PBME for Project activities carried out by each of them, which shall include preparation and submission to DGE by PTPN VI and XIII of their individual quarterly reports.
Schedule 6, Section IV (18)
Complied with.
4. Environmental Management and Monitoring DGE and concerned PTPN, in consultation with the Bank and the Central Commission on Environmental Impact Assessment by the Ministry of Agriculture, to prepare (a) preliminary environmental impact assessment (PIL) prior to the commencement of factory construction, (b) an environmental management plan (RKL) and (c) an environmental monitoring plan.
Schedule 6, Section IV (18)
Complied with.
5. Midterm Review A midterm review shall be conducted jointly by DGE and the Bank after 3 years of Project implementation.
Schedule 6, Section IV (18)
Complied with.
6. Semiannual Reports Semiannual reports on the carrying out of Parts A and C, and on the operation and management of the Project facilities shall be submitted by DGE. Such reports shall be submitted by PTPN VI and XIII, through DGE, to the Bank.
Article IV, para. 4.07(b)
Complied. Progress reports for parts A and C during the early part of the Project because of difficulties in collecting data from the provinces.
7. Audited Financial Statements DGE shall maintain separate accounts for Parts A and C of the Project; (ii) PTPN VI and XIII to maintain, separate accounts for Part B; and (iii) have such accounts and related financial statements audited annually, in accordance with sound auditing standards by auditors acceptable to the Bank; and (iv) furnish to the Bank not later than 9 months after the close of the fiscal year to which they relate, certified copies of audited accounts and financial statements and the report of the auditors, all in the English language.
Article IV, Section 4.97(b); PA Section 2.09(a)
Complied with but delayed submission.
CDC = Commonwealth Development Corporation (United Kingdom), DGE = Directorate General of Estates, GPC = group processing center, PBME = project benefit monitoring and evaluation, PMU = project management unit, PTPN Perseroan Terbatas Perkebunan Nusantara (state-owned estate enterprises). Source(s): Asian Development Bank and Directorate General of Estates records.

36 Appendix 11
FINANCIAL AND ECONOMIC ANALYSES A. Introduction 1. An initial assessment of the Project’s financial and economic performance has been undertaken following approach and methodology similar to that at the appraisal. The economic returns have been assessed for the Project as a whole as well as for the individual components. The assessment covered the financial returns to the individual farmers as well as to the factories established through the Project. B. Methodology
1. Period of Analyses 2. At appraisal, it was envisaged that the Project would be implemented over 6 years and that the benefits would accrue over 20 years from the Project’s start. The economic lives of the group processing centers (GPCs) and the factories were estimated at 10 years and 15 years, respectively. 3. The original period of analyses would not have captured the entire range of project benefits. Due to the delays in start-up of activities under part B, the factories were completed in 2001 and 2002, and the returns from these were expected to flow for 15 years from their completion. Similarly, the benefits from the rubber areas, rehabilitated from 1998 to 2002, are expected to flow for 25 years from the planting. To account for the full benefits from the main project activities, the analyses have been undertaken for 25 years from the Project’s start.
2. Exchange Rate and the Discount Rate 4. The analyses are undertaken in rupiah, and the relevant costs and benefits were converted into rupiah terms by using the interbank exchange rates that prevailed at the time of transaction. A discount rate of 12% was used to ascertain the net present values, and also as a cut-off point for the economic internal rate of return.
3. Price Assumptions 5. The benefits and costs are expressed in the constant 2005 terms using the manufacturers’ unit value index and Indonesian gross domestic product deflator. 6. Financial farm-gate prices are based on the farmer and factory feedback that the Mission received during the field visits. The analyses uses a world price numeraire, where the economic prices of the traded outputs and inputs have been derived from historic, actual, and projected prices, as published by the World Bank. The prices for the rubber products and crude palm oil have been estimated at the export parity (Tables A11.1–4). To take into account unemployment and underemployment, separable labor costs have been shadow priced at 0.80 of the wage rates while the non-traded inputs and outputs have been adjusted by the standard conversion factor (SCF) of 0.90.

Appendix 11 37
4. Production Models 7. The appraisal envisaged that all the GPCs would be producing the un-smoked sheet rubber. However, experience showed that, depending on market access, the GPCs were producing a range of products that included smoked sheet, un-smoked sheet, slab, and lump rubber. Based on the findings of the Borrower’s completion review and socioeconomic studies, and the Mission’s interaction during the field visits, the individual production models were constructed for the GPCs’ various common rubber products. The analyses take into account the GPCs’ underutilization by excluding the GPCs that largely remained nonoperational and by assuming average capacity utilization of 70% for the operational GPCs. The detailed GPC models are in Tables A11.5 and A11.6. 8. The rehabilitation of rubber plantations was not included in the project design and was added as a response to the damage to rubber plantations resulting from the 1998 forest fires and subsequent droughts. The rehabilitated areas are not yet mature and are not being tapped. The interaction with the farmers and field staff during the Mission’s field visits indicated that the rehabilitated rubber area is being well maintained and is expected to produce at full potential. During the first year after rehabilitation, the Project provided for intercropping of the rehabilitated areas with field crops such as paddy and maize, and intensification with alternate crops such as pineapple and banana. However, the benefits arising from these activities are not well documented. In the absence of data on the benefits from intercropping and intensification, the production models for rubber take into account only the benefits from the latex produced from the replanted areas. Planting material for rubber and other crops, and agricultural inputs were provided free to farmers, and the financial analyses of returns to the farmers only include the costs borne by the farmers themselves. Detailed rubber crop production models are in Tables A11.7 and A11.8. 9. Individual models were constructed for the crumb rubber factory and the 2 crude oil factories. The models were based on the operational data provided by PTPNs VI and XIII. At the appraisal and realignment of part B, the rubber factory was expected to produce a range of products, from high-grade latex rubber to lower-grade crumb rubber. However, in line with the shift of the rubber industry to crumb rubber, the factory at Sintang was designed to produce solely crumb rubber. Operating below full capacity, the crude palm oil factory in Longkali was assumed to reach 100 % capacity utilization over 5 years and to be able to maintain this level thereafter. The models for the factories are presented in Tables A11.9–11. D. Project Benefits
1. Benefit Area and Farms 10. At appraisal, the Project was expected to establish 8,000 GPCs serving 160,000 smallholders operating 400,000 ha of rubber plantations. As a result of reduction in the number of GPCs from 8,000 to 4,200, only 96,768 smallholders owning about 212,900 ha benefited from the Project. Of these, about 10% benefited from rehabilitation, intercropping, and intensification that covered 10,345 ha. 11. The Project was to establish 4 crumb rubber factories and one crude palm oil factory, and to rehabilitate one crude palm oil factory, which were to benefit about 14,800 rubber and 3,000 oil palm farmers. As a result of realignment of the component, one crumb rubber factory and 2 crude palm oil factories were established, serving about 6,000 rubber and 2,000 palm oil farmers.
38 Appendix 11
2. Quantified Benefits 12. Direct benefits to smallholders include the value addition through switching from lump rubber to processed rubber and the production from rehabilitated rubber areas. Rising oil prices have led to increased rubber prices because of the high cost of production of synthetic rubber. Continuous high prices for rubber in the medium term and improved returns to rubber farmers could lead to better capacity utilization of GPCs. However, the analyses conservatively assumes that the GPCs would continue to operate at present levels for the rest of their economic lives. As under the without-project scenario, the farmers’ groups with nonoperational GPCs are assumed to continue producing lower-quality lump rubber. Based on the feedback from the groups, farmers were assumed to switch back to producing lump rubber at the completion of the useful life of GPCs. 13. In rehabilitated rubber areas, tapping is expected to commence in 2006 and should lead to increased processing activities at the GPCs. However, the analyses only take into account the benefits accruing from the production of unprocessed rubber. The productive life of the rehabilitated areas is anticipated to be 25 years from planting. However, only the production during the analyses has been considered. The without-project scenario assumes that there would have been no investment in restoring productivity of the area during the analyses. 14. For the factory component, the analyses take into account the benefits resulting from production of crumb rubber and crude palm oil. The factories have been adequately maintained and are highly likely to remain operational for their entire economic lives. However, only the benefits accruing during the analyses have been considered.
3. Nonquantified Benefits 15. Apart from the production benefits, a number of benefits, while significant, have not been quantified for the analyses. These include the following: (i) the farmers’ groups and cooperatives are functioning beyond the envisaged role, and a number of them have become socioeconomic entities with cooperative stores and partnerships with suppliers and processors; (ii) capacity-building activities for female farmers have empowered them and expanded their skill base and earning opportunities; (iii) better physical infrastructure has improved the farmers’ groups’ access to processing centers as well as improved the communities’ access to the services and linkages with other communities; (iv) capacity building in sustainable tree crop management and environment-friendly processing techniques have helped improve the quality of the outputs without harming the environment; (v) intercropping and intensification in rehabilitated rubber areas have benefited the farmers; and (vi) the establishment of factories in remote locations has improved smallholders’ access to the processing facilities. E. Initial Assessment of Financial Returns
1. Financial Returns to the Smallholders 16. Results of the financial analyses for the farmers’ groups producing different rubber products are summarized in Table A11.5 and indicate increased earnings of 20.4%, 22.7%, and 59.2% for the smoked sheet, un-smoked sheet, and slab rubber over the production of lump rubber. In contrast to the anticipated 75.0% increase in earnings from the shift to production of sheet rubber, actual increases are estimated at 20.4–22.7%. On the other hand, the increase in earnings was much higher for the slab rubber, which better suited the production lines of the crumb factories. Interaction with farmers’ groups indicated that the incremental earnings for
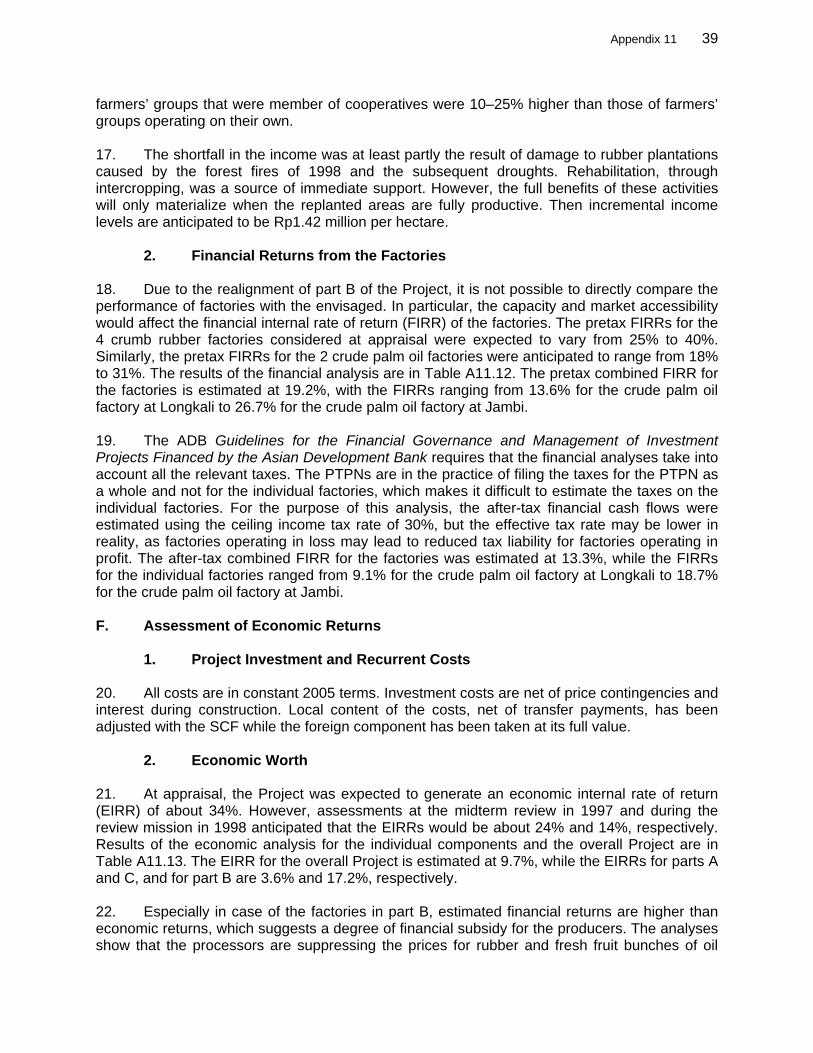
Appendix 11 39
farmers’ groups that were member of cooperatives were 10–25% higher than those of farmers’ groups operating on their own. 17. The shortfall in the income was at least partly the result of damage to rubber plantations caused by the forest fires of 1998 and the subsequent droughts. Rehabilitation, through intercropping, was a source of immediate support. However, the full benefits of these activities will only materialize when the replanted areas are fully productive. Then incremental income levels are anticipated to be Rp1.42 million per hectare.
2. Financial Returns from the Factories 18. Due to the realignment of part B of the Project, it is not possible to directly compare the performance of factories with the envisaged. In particular, the capacity and market accessibility would affect the financial internal rate of return (FIRR) of the factories. The pretax FIRRs for the 4 crumb rubber factories considered at appraisal were expected to vary from 25% to 40%. Similarly, the pretax FIRRs for the 2 crude palm oil factories were anticipated to range from 18% to 31%. The results of the financial analysis are in Table A11.12. The pretax combined FIRR for the factories is estimated at 19.2%, with the FIRRs ranging from 13.6% for the crude palm oil factory at Longkali to 26.7% for the crude palm oil factory at Jambi. 19. The ADB Guidelines for the Financial Governance and Management of Investment Projects Financed by the Asian Development Bank requires that the financial analyses take into account all the relevant taxes. The PTPNs are in the practice of filing the taxes for the PTPN as a whole and not for the individual factories, which makes it difficult to estimate the taxes on the individual factories. For the purpose of this analysis, the after-tax financial cash flows were estimated using the ceiling income tax rate of 30%, but the effective tax rate may be lower in reality, as factories operating in loss may lead to reduced tax liability for factories operating in profit. The after-tax combined FIRR for the factories was estimated at 13.3%, while the FIRRs for the individual factories ranged from 9.1% for the crude palm oil factory at Longkali to 18.7% for the crude palm oil factory at Jambi. F. Assessment of Economic Returns
1. Project Investment and Recurrent Costs 20. All costs are in constant 2005 terms. Investment costs are net of price contingencies and interest during construction. Local content of the costs, net of transfer payments, has been adjusted with the SCF while the foreign component has been taken at its full value.
2. Economic Worth 21. At appraisal, the Project was expected to generate an economic internal rate of return (EIRR) of about 34%. However, assessments at the midterm review in 1997 and during the review mission in 1998 anticipated that the EIRRs would be about 24% and 14%, respectively. Results of the economic analysis for the individual components and the overall Project are in Table A11.13. The EIRR for the overall Project is estimated at 9.7%, while the EIRRs for parts A and C, and for part B are 3.6% and 17.2%, respectively. 22. Especially in case of the factories in part B, estimated financial returns are higher than economic returns, which suggests a degree of financial subsidy for the producers. The analyses show that the processors are suppressing the prices for rubber and fresh fruit bunches of oil
40 Appendix 11
palm from farmers, resulting in resource transfer from the farmers to processors. As the processors are paying taxes on their income, the resource transfer in part is to the Government. 23. In light of the high oil prices and steady growth in the demand for palm oil, the prices for rubber and palm oil are expected to stay at least firm, if not rise. However, sensitivity analysis was undertaken to ascertain the impact of price reduction for these commodities. The results show that a 10% reduction in the prices of crumb rubber would reduce the EIRR to about 9.1% and to 6.4% with a similar reduction in the palm oil prices. In contrast, a 10% reduction in the sheet and slab rubber prices would raise the project EIRR to about 10.1%.
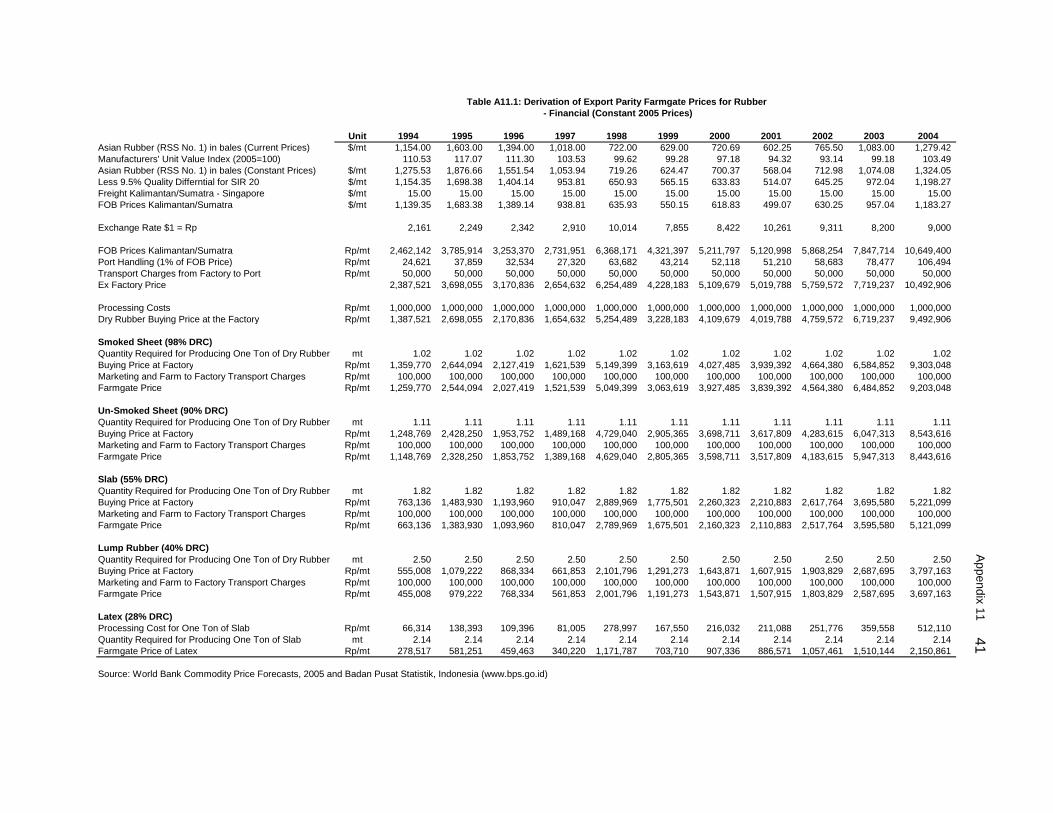
Table A11.1: Derivation of Export Parity Farmgate Prices for Rubber- Financial (Constant 2005 Prices)
Unit 1994 1995 1996 1997 1998 1999 2000 2001 2002 2003 2004Asian Rubber (RSS No. 1) in bales (Current Prices) $/mt 1,154.00 1,603.00 1,394.00 1,018.00 722.00 629.00 720.69 602.25 765.50 1,083.00 1,279.42 Manufacturers' Unit Value Index (2005=100) 110.53 117.07 111.30 103.53 99.62 99.28 97.18 94.32 93.14 99.18 103.49 Asian Rubber (RSS No. 1) in bales (Constant Prices) $/mt 1,275.53 1,876.66 1,551.54 1,053.94 719.26 624.47 700.37 568.04 712.98 1,074.08 1,324.05 Less 9.5% Quality Differntial for SIR 20 $/mt 1,154.35 1,698.38 1,404.14 953.81 650.93 565.15 633.83 514.07 645.25 972.04 1,198.27 Freight Kalimantan/Sumatra - Singapore $/mt 15.00 15.00 15.00 15.00 15.00 15.00 15.00 15.00 15.00 15.00 15.00 FOB Prices Kalimantan/Sumatra $/mt 1,139.35 1,683.38 1,389.14 938.81 635.93 550.15 618.83 499.07 630.25 957.04 1,183.27
Exchange Rate $1 = Rp 2,161 2,249 2,342 2,910 10,014 7,855 8,422 10,261 9,311 8,200 9,000
FOB Prices Kalimantan/Sumatra Rp/mt 2,462,142 3,785,914 3,253,370 2,731,951 6,368,171 4,321,397 5,211,797 5,120,998 5,868,254 7,847,714 10,649,400Port Handling (1% of FOB Price) Rp/mt 24,621 37,859 32,534 27,320 63,682 43,214 52,118 51,210 58,683 78,477 106,494 Transport Charges from Factory to Port Rp/mt 50,000 50,000 50,000 50,000 50,000 50,000 50,000 50,000 50,000 50,000 50,000 Ex Factory Price 2,387,521 3,698,055 3,170,836 2,654,632 6,254,489 4,228,183 5,109,679 5,019,788 5,759,572 7,719,237 10,492,906
Processing Costs Rp/mt 1,000,000 1,000,000 1,000,000 1,000,000 1,000,000 1,000,000 1,000,000 1,000,000 1,000,000 1,000,000 1,000,000 Dry Rubber Buying Price at the Factory Rp/mt 1,387,521 2,698,055 2,170,836 1,654,632 5,254,489 3,228,183 4,109,679 4,019,788 4,759,572 6,719,237 9,492,906
Smoked Sheet (98% DRC)Quantity Required for Producing One Ton of Dry Rubber mt 1.02 1.02 1.02 1.02 1.02 1.02 1.02 1.02 1.02 1.02 1.02 Buying Price at Factory Rp/mt 1,359,770 2,644,094 2,127,419 1,621,539 5,149,399 3,163,619 4,027,485 3,939,392 4,664,380 6,584,852 9,303,048 Marketing and Farm to Factory Transport Charges Rp/mt 100,000 100,000 100,000 100,000 100,000 100,000 100,000 100,000 100,000 100,000 100,000 Farmgate Price Rp/mt 1,259,770 2,544,094 2,027,419 1,521,539 5,049,399 3,063,619 3,927,485 3,839,392 4,564,380 6,484,852 9,203,048
Un-Smoked Sheet (90% DRC)Quantity Required for Producing One Ton of Dry Rubber mt 1.11 1.11 1.11 1.11 1.11 1.11 1.11 1.11 1.11 1.11 1.11 Buying Price at Factory Rp/mt 1,248,769 2,428,250 1,953,752 1,489,168 4,729,040 2,905,365 3,698,711 3,617,809 4,283,615 6,047,313 8,543,616 Marketing and Farm to Factory Transport Charges Rp/mt 100,000 100,000 100,000 100,000 100,000 100,000 100,000 100,000 100,000 100,000 100,000 Farmgate Price Rp/mt 1,148,769 2,328,250 1,853,752 1,389,168 4,629,040 2,805,365 3,598,711 3,517,809 4,183,615 5,947,313 8,443,616
Slab (55% DRC)Quantity Required for Producing One Ton of Dry Rubber mt 1.82 1.82 1.82 1.82 1.82 1.82 1.82 1.82 1.82 1.82 1.82 Buying Price at Factory Rp/mt 763,136 1,483,930 1,193,960 910,047 2,889,969 1,775,501 2,260,323 2,210,883 2,617,764 3,695,580 5,221,099 Marketing and Farm to Factory Transport Charges Rp/mt 100,000 100,000 100,000 100,000 100,000 100,000 100,000 100,000 100,000 100,000 100,000 Farmgate Price Rp/mt 663,136 1,383,930 1,093,960 810,047 2,789,969 1,675,501 2,160,323 2,110,883 2,517,764 3,595,580 5,121,099
Lump Rubber (40% DRC)Quantity Required for Producing One Ton of Dry Rubber mt 2.50 2.50 2.50 2.50 2.50 2.50 2.50 2.50 2.50 2.50 2.50 Buying Price at Factory Rp/mt 555,008 1,079,222 868,334 661,853 2,101,796 1,291,273 1,643,871 1,607,915 1,903,829 2,687,695 3,797,163 Marketing and Farm to Factory Transport Charges Rp/mt 100,000 100,000 100,000 100,000 100,000 100,000 100,000 100,000 100,000 100,000 100,000 Farmgate Price Rp/mt 455,008 979,222 768,334 561,853 2,001,796 1,191,273 1,543,871 1,507,915 1,803,829 2,587,695 3,697,163
Latex (28% DRC)Processing Cost for One Ton of Slab Rp/mt 66,314 138,393 109,396 81,005 278,997 167,550 216,032 211,088 251,776 359,558 512,110 Quantity Required for Producing One Ton of Slab mt 2.14 2.14 2.14 2.14 2.14 2.14 2.14 2.14 2.14 2.14 2.14 Farmgate Price of Latex Rp/mt 278,517 581,251 459,463 340,220 1,171,787 703,710 907,336 886,571 1,057,461 1,510,144 2,150,861
Source: World Bank Commodity Price Forecasts, 2005 and Badan Pusat Statistik, Indonesia (www.bps.go.id)
Appendix 11 41
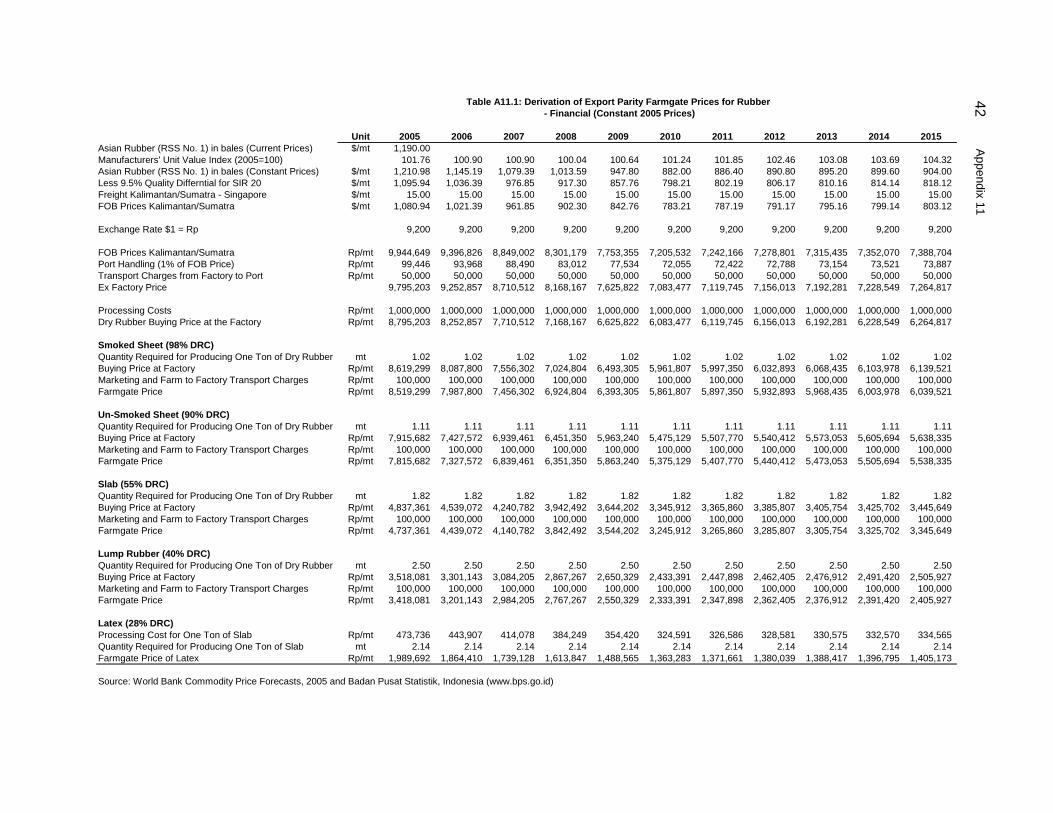
Table A11.1: Derivation of Export Parity Farmgate Prices for Rubber- Financial (Constant 2005 Prices)
Unit 2005 2006 2007 2008 2009 2010 2011 2012 2013 2014 2015Asian Rubber (RSS No. 1) in bales (Current Prices) $/mt 1,190.00 Manufacturers' Unit Value Index (2005=100) 101.76 100.90 100.90 100.04 100.64 101.24 101.85 102.46 103.08 103.69 104.32 Asian Rubber (RSS No. 1) in bales (Constant Prices) $/mt 1,210.98 1,145.19 1,079.39 1,013.59 947.80 882.00 886.40 890.80 895.20 899.60 904.00 Less 9.5% Quality Differntial for SIR 20 $/mt 1,095.94 1,036.39 976.85 917.30 857.76 798.21 802.19 806.17 810.16 814.14 818.12 Freight Kalimantan/Sumatra - Singapore $/mt 15.00 15.00 15.00 15.00 15.00 15.00 15.00 15.00 15.00 15.00 15.00 FOB Prices Kalimantan/Sumatra $/mt 1,080.94 1,021.39 961.85 902.30 842.76 783.21 787.19 791.17 795.16 799.14 803.12
Exchange Rate $1 = Rp 9,200 9,200 9,200 9,200 9,200 9,200 9,200 9,200 9,200 9,200 9,200
FOB Prices Kalimantan/Sumatra Rp/mt 9,944,649 9,396,826 8,849,002 8,301,179 7,753,355 7,205,532 7,242,166 7,278,801 7,315,435 7,352,070 7,388,704Port Handling (1% of FOB Price) Rp/mt 99,446 93,968 88,490 83,012 77,534 72,055 72,422 72,788 73,154 73,521 73,887 Transport Charges from Factory to Port Rp/mt 50,000 50,000 50,000 50,000 50,000 50,000 50,000 50,000 50,000 50,000 50,000 Ex Factory Price 9,795,203 9,252,857 8,710,512 8,168,167 7,625,822 7,083,477 7,119,745 7,156,013 7,192,281 7,228,549 7,264,817
Processing Costs Rp/mt 1,000,000 1,000,000 1,000,000 1,000,000 1,000,000 1,000,000 1,000,000 1,000,000 1,000,000 1,000,000 1,000,000Dry Rubber Buying Price at the Factory Rp/mt 8,795,203 8,252,857 7,710,512 7,168,167 6,625,822 6,083,477 6,119,745 6,156,013 6,192,281 6,228,549 6,264,817
Smoked Sheet (98% DRC)Quantity Required for Producing One Ton of Dry Rubber mt 1.02 1.02 1.02 1.02 1.02 1.02 1.02 1.02 1.02 1.02 1.02 Buying Price at Factory Rp/mt 8,619,299 8,087,800 7,556,302 7,024,804 6,493,305 5,961,807 5,997,350 6,032,893 6,068,435 6,103,978 6,139,521Marketing and Farm to Factory Transport Charges Rp/mt 100,000 100,000 100,000 100,000 100,000 100,000 100,000 100,000 100,000 100,000 100,000 Farmgate Price Rp/mt 8,519,299 7,987,800 7,456,302 6,924,804 6,393,305 5,861,807 5,897,350 5,932,893 5,968,435 6,003,978 6,039,521
Un-Smoked Sheet (90% DRC)Quantity Required for Producing One Ton of Dry Rubber mt 1.11 1.11 1.11 1.11 1.11 1.11 1.11 1.11 1.11 1.11 1.11 Buying Price at Factory Rp/mt 7,915,682 7,427,572 6,939,461 6,451,350 5,963,240 5,475,129 5,507,770 5,540,412 5,573,053 5,605,694 5,638,335Marketing and Farm to Factory Transport Charges Rp/mt 100,000 100,000 100,000 100,000 100,000 100,000 100,000 100,000 100,000 100,000 100,000 Farmgate Price Rp/mt 7,815,682 7,327,572 6,839,461 6,351,350 5,863,240 5,375,129 5,407,770 5,440,412 5,473,053 5,505,694 5,538,335
Slab (55% DRC)Quantity Required for Producing One Ton of Dry Rubber mt 1.82 1.82 1.82 1.82 1.82 1.82 1.82 1.82 1.82 1.82 1.82 Buying Price at Factory Rp/mt 4,837,361 4,539,072 4,240,782 3,942,492 3,644,202 3,345,912 3,365,860 3,385,807 3,405,754 3,425,702 3,445,649Marketing and Farm to Factory Transport Charges Rp/mt 100,000 100,000 100,000 100,000 100,000 100,000 100,000 100,000 100,000 100,000 100,000 Farmgate Price Rp/mt 4,737,361 4,439,072 4,140,782 3,842,492 3,544,202 3,245,912 3,265,860 3,285,807 3,305,754 3,325,702 3,345,649
Lump Rubber (40% DRC)Quantity Required for Producing One Ton of Dry Rubber mt 2.50 2.50 2.50 2.50 2.50 2.50 2.50 2.50 2.50 2.50 2.50 Buying Price at Factory Rp/mt 3,518,081 3,301,143 3,084,205 2,867,267 2,650,329 2,433,391 2,447,898 2,462,405 2,476,912 2,491,420 2,505,927Marketing and Farm to Factory Transport Charges Rp/mt 100,000 100,000 100,000 100,000 100,000 100,000 100,000 100,000 100,000 100,000 100,000 Farmgate Price Rp/mt 3,418,081 3,201,143 2,984,205 2,767,267 2,550,329 2,333,391 2,347,898 2,362,405 2,376,912 2,391,420 2,405,927
Latex (28% DRC)Processing Cost for One Ton of Slab Rp/mt 473,736 443,907 414,078 384,249 354,420 324,591 326,586 328,581 330,575 332,570 334,565 Quantity Required for Producing One Ton of Slab mt 2.14 2.14 2.14 2.14 2.14 2.14 2.14 2.14 2.14 2.14 2.14 Farmgate Price of Latex Rp/mt 1,989,692 1,864,410 1,739,128 1,613,847 1,488,565 1,363,283 1,371,661 1,380,039 1,388,417 1,396,795 1,405,173
Source: World Bank Commodity Price Forecasts, 2005 and Badan Pusat Statistik, Indonesia (www.bps.go.id)
42 Appendix 11
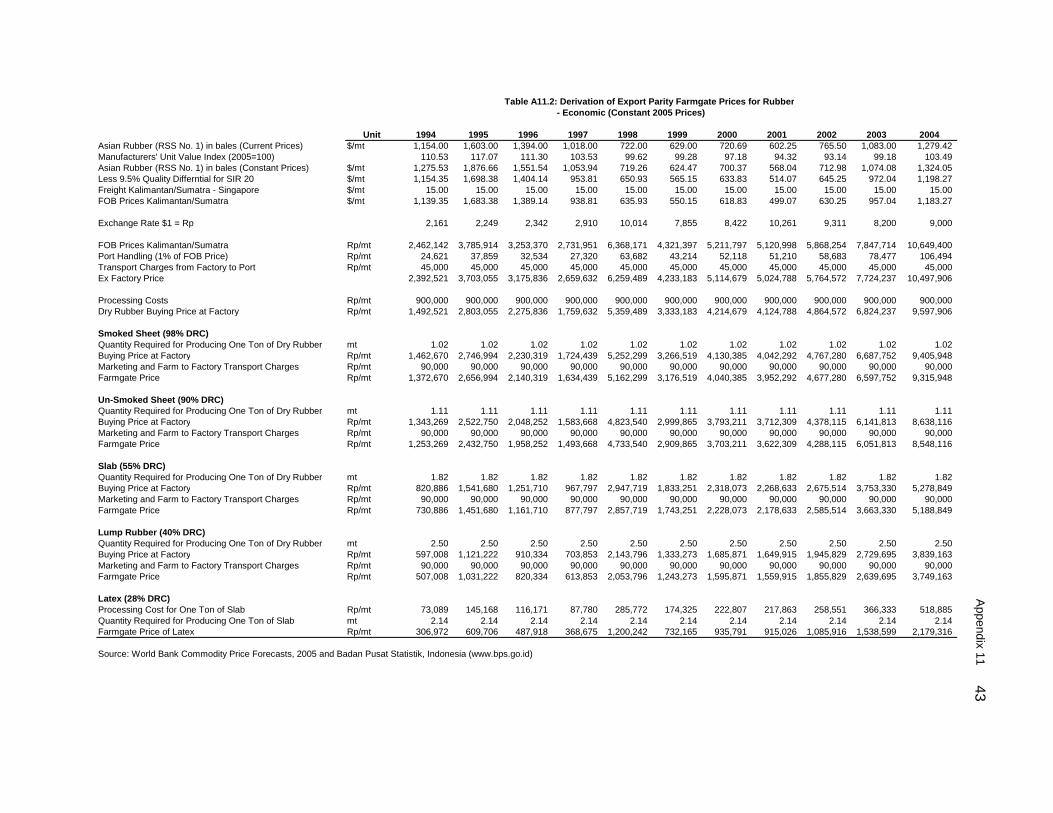
Table A11.2: Derivation of Export Parity Farmgate Prices for Rubber- Economic (Constant 2005 Prices)
Unit 1994 1995 1996 1997 1998 1999 2000 2001 2002 2003 2004Asian Rubber (RSS No. 1) in bales (Current Prices) $/mt 1,154.00 1,603.00 1,394.00 1,018.00 722.00 629.00 720.69 602.25 765.50 1,083.00 1,279.42 Manufacturers' Unit Value Index (2005=100) 110.53 117.07 111.30 103.53 99.62 99.28 97.18 94.32 93.14 99.18 103.49 Asian Rubber (RSS No. 1) in bales (Constant Prices) $/mt 1,275.53 1,876.66 1,551.54 1,053.94 719.26 624.47 700.37 568.04 712.98 1,074.08 1,324.05 Less 9.5% Quality Differntial for SIR 20 $/mt 1,154.35 1,698.38 1,404.14 953.81 650.93 565.15 633.83 514.07 645.25 972.04 1,198.27 Freight Kalimantan/Sumatra - Singapore $/mt 15.00 15.00 15.00 15.00 15.00 15.00 15.00 15.00 15.00 15.00 15.00 FOB Prices Kalimantan/Sumatra $/mt 1,139.35 1,683.38 1,389.14 938.81 635.93 550.15 618.83 499.07 630.25 957.04 1,183.27
Exchange Rate $1 = Rp 2,161 2,249 2,342 2,910 10,014 7,855 8,422 10,261 9,311 8,200 9,000
FOB Prices Kalimantan/Sumatra Rp/mt 2,462,142 3,785,914 3,253,370 2,731,951 6,368,171 4,321,397 5,211,797 5,120,998 5,868,254 7,847,714 10,649,400Port Handling (1% of FOB Price) Rp/mt 24,621 37,859 32,534 27,320 63,682 43,214 52,118 51,210 58,683 78,477 106,494 Transport Charges from Factory to Port Rp/mt 45,000 45,000 45,000 45,000 45,000 45,000 45,000 45,000 45,000 45,000 45,000 Ex Factory Price 2,392,521 3,703,055 3,175,836 2,659,632 6,259,489 4,233,183 5,114,679 5,024,788 5,764,572 7,724,237 10,497,906
Processing Costs Rp/mt 900,000 900,000 900,000 900,000 900,000 900,000 900,000 900,000 900,000 900,000 900,000 Dry Rubber Buying Price at Factory Rp/mt 1,492,521 2,803,055 2,275,836 1,759,632 5,359,489 3,333,183 4,214,679 4,124,788 4,864,572 6,824,237 9,597,906
Smoked Sheet (98% DRC)Quantity Required for Producing One Ton of Dry Rubber mt 1.02 1.02 1.02 1.02 1.02 1.02 1.02 1.02 1.02 1.02 1.02 Buying Price at Factory Rp/mt 1,462,670 2,746,994 2,230,319 1,724,439 5,252,299 3,266,519 4,130,385 4,042,292 4,767,280 6,687,752 9,405,948 Marketing and Farm to Factory Transport Charges Rp/mt 90,000 90,000 90,000 90,000 90,000 90,000 90,000 90,000 90,000 90,000 90,000 Farmgate Price Rp/mt 1,372,670 2,656,994 2,140,319 1,634,439 5,162,299 3,176,519 4,040,385 3,952,292 4,677,280 6,597,752 9,315,948
Un-Smoked Sheet (90% DRC)Quantity Required for Producing One Ton of Dry Rubber mt 1.11 1.11 1.11 1.11 1.11 1.11 1.11 1.11 1.11 1.11 1.11 Buying Price at Factory Rp/mt 1,343,269 2,522,750 2,048,252 1,583,668 4,823,540 2,999,865 3,793,211 3,712,309 4,378,115 6,141,813 8,638,116 Marketing and Farm to Factory Transport Charges Rp/mt 90,000 90,000 90,000 90,000 90,000 90,000 90,000 90,000 90,000 90,000 90,000 Farmgate Price Rp/mt 1,253,269 2,432,750 1,958,252 1,493,668 4,733,540 2,909,865 3,703,211 3,622,309 4,288,115 6,051,813 8,548,116
Slab (55% DRC)Quantity Required for Producing One Ton of Dry Rubber mt 1.82 1.82 1.82 1.82 1.82 1.82 1.82 1.82 1.82 1.82 1.82 Buying Price at Factory Rp/mt 820,886 1,541,680 1,251,710 967,797 2,947,719 1,833,251 2,318,073 2,268,633 2,675,514 3,753,330 5,278,849 Marketing and Farm to Factory Transport Charges Rp/mt 90,000 90,000 90,000 90,000 90,000 90,000 90,000 90,000 90,000 90,000 90,000 Farmgate Price Rp/mt 730,886 1,451,680 1,161,710 877,797 2,857,719 1,743,251 2,228,073 2,178,633 2,585,514 3,663,330 5,188,849
Lump Rubber (40% DRC)Quantity Required for Producing One Ton of Dry Rubber mt 2.50 2.50 2.50 2.50 2.50 2.50 2.50 2.50 2.50 2.50 2.50 Buying Price at Factory Rp/mt 597,008 1,121,222 910,334 703,853 2,143,796 1,333,273 1,685,871 1,649,915 1,945,829 2,729,695 3,839,163 Marketing and Farm to Factory Transport Charges Rp/mt 90,000 90,000 90,000 90,000 90,000 90,000 90,000 90,000 90,000 90,000 90,000 Farmgate Price Rp/mt 507,008 1,031,222 820,334 613,853 2,053,796 1,243,273 1,595,871 1,559,915 1,855,829 2,639,695 3,749,163
Latex (28% DRC)Processing Cost for One Ton of Slab Rp/mt 73,089 145,168 116,171 87,780 285,772 174,325 222,807 217,863 258,551 366,333 518,885 Quantity Required for Producing One Ton of Slab mt 2.14 2.14 2.14 2.14 2.14 2.14 2.14 2.14 2.14 2.14 2.14 Farmgate Price of Latex Rp/mt 306,972 609,706 487,918 368,675 1,200,242 732,165 935,791 915,026 1,085,916 1,538,599 2,179,316
Source: World Bank Commodity Price Forecasts, 2005 and Badan Pusat Statistik, Indonesia (www.bps.go.id)
Appendix 11 43
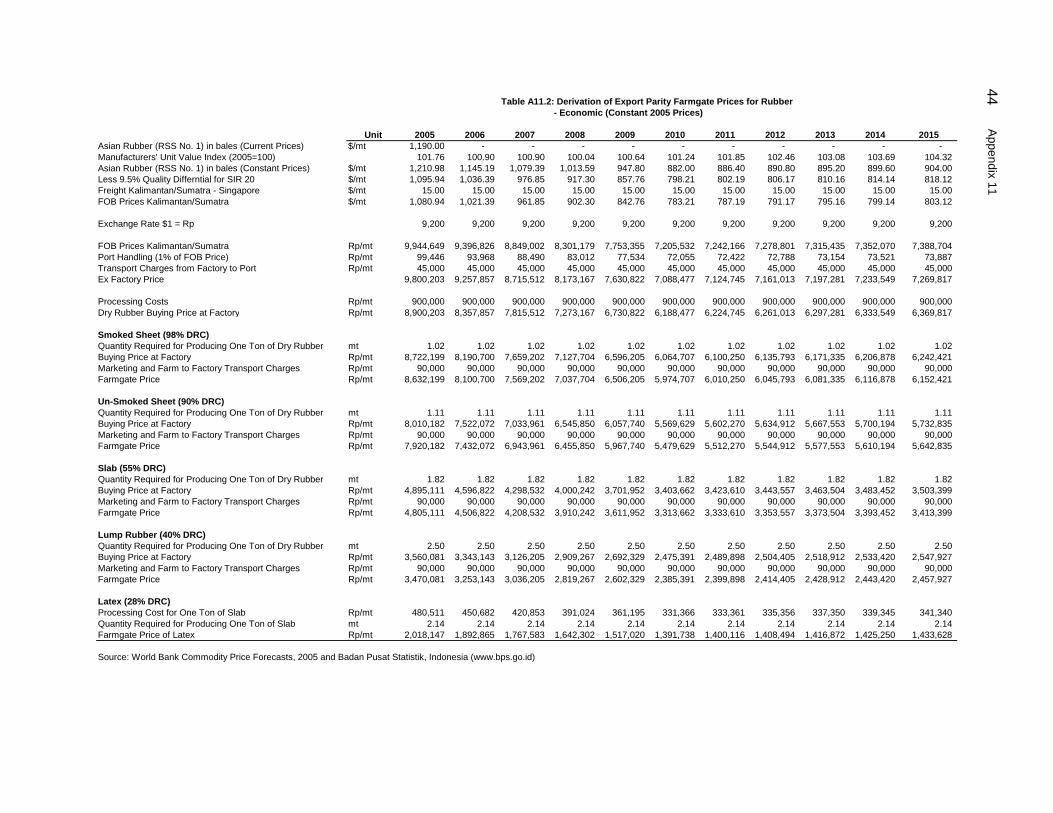
Table A11.2: Derivation of Export Parity Farmgate Prices for Rubber- Economic (Constant 2005 Prices)
Unit 2005 2006 2007 2008 2009 2010 2011 2012 2013 2014 2015Asian Rubber (RSS No. 1) in bales (Current Prices) $/mt 1,190.00 - - - - - - - - - - Manufacturers' Unit Value Index (2005=100) 101.76 100.90 100.90 100.04 100.64 101.24 101.85 102.46 103.08 103.69 104.32 Asian Rubber (RSS No. 1) in bales (Constant Prices) $/mt 1,210.98 1,145.19 1,079.39 1,013.59 947.80 882.00 886.40 890.80 895.20 899.60 904.00 Less 9.5% Quality Differntial for SIR 20 $/mt 1,095.94 1,036.39 976.85 917.30 857.76 798.21 802.19 806.17 810.16 814.14 818.12 Freight Kalimantan/Sumatra - Singapore $/mt 15.00 15.00 15.00 15.00 15.00 15.00 15.00 15.00 15.00 15.00 15.00 FOB Prices Kalimantan/Sumatra $/mt 1,080.94 1,021.39 961.85 902.30 842.76 783.21 787.19 791.17 795.16 799.14 803.12
Exchange Rate $1 = Rp 9,200 9,200 9,200 9,200 9,200 9,200 9,200 9,200 9,200 9,200 9,200
FOB Prices Kalimantan/Sumatra Rp/mt 9,944,649 9,396,826 8,849,002 8,301,179 7,753,355 7,205,532 7,242,166 7,278,801 7,315,435 7,352,070 7,388,704 Port Handling (1% of FOB Price) Rp/mt 99,446 93,968 88,490 83,012 77,534 72,055 72,422 72,788 73,154 73,521 73,887 Transport Charges from Factory to Port Rp/mt 45,000 45,000 45,000 45,000 45,000 45,000 45,000 45,000 45,000 45,000 45,000 Ex Factory Price 9,800,203 9,257,857 8,715,512 8,173,167 7,630,822 7,088,477 7,124,745 7,161,013 7,197,281 7,233,549 7,269,817
Processing Costs Rp/mt 900,000 900,000 900,000 900,000 900,000 900,000 900,000 900,000 900,000 900,000 900,000 Dry Rubber Buying Price at Factory Rp/mt 8,900,203 8,357,857 7,815,512 7,273,167 6,730,822 6,188,477 6,224,745 6,261,013 6,297,281 6,333,549 6,369,817
Smoked Sheet (98% DRC)Quantity Required for Producing One Ton of Dry Rubber mt 1.02 1.02 1.02 1.02 1.02 1.02 1.02 1.02 1.02 1.02 1.02 Buying Price at Factory Rp/mt 8,722,199 8,190,700 7,659,202 7,127,704 6,596,205 6,064,707 6,100,250 6,135,793 6,171,335 6,206,878 6,242,421 Marketing and Farm to Factory Transport Charges Rp/mt 90,000 90,000 90,000 90,000 90,000 90,000 90,000 90,000 90,000 90,000 90,000 Farmgate Price Rp/mt 8,632,199 8,100,700 7,569,202 7,037,704 6,506,205 5,974,707 6,010,250 6,045,793 6,081,335 6,116,878 6,152,421
Un-Smoked Sheet (90% DRC)Quantity Required for Producing One Ton of Dry Rubber mt 1.11 1.11 1.11 1.11 1.11 1.11 1.11 1.11 1.11 1.11 1.11 Buying Price at Factory Rp/mt 8,010,182 7,522,072 7,033,961 6,545,850 6,057,740 5,569,629 5,602,270 5,634,912 5,667,553 5,700,194 5,732,835 Marketing and Farm to Factory Transport Charges Rp/mt 90,000 90,000 90,000 90,000 90,000 90,000 90,000 90,000 90,000 90,000 90,000 Farmgate Price Rp/mt 7,920,182 7,432,072 6,943,961 6,455,850 5,967,740 5,479,629 5,512,270 5,544,912 5,577,553 5,610,194 5,642,835
Slab (55% DRC)Quantity Required for Producing One Ton of Dry Rubber mt 1.82 1.82 1.82 1.82 1.82 1.82 1.82 1.82 1.82 1.82 1.82 Buying Price at Factory Rp/mt 4,895,111 4,596,822 4,298,532 4,000,242 3,701,952 3,403,662 3,423,610 3,443,557 3,463,504 3,483,452 3,503,399 Marketing and Farm to Factory Transport Charges Rp/mt 90,000 90,000 90,000 90,000 90,000 90,000 90,000 90,000 90,000 90,000 90,000 Farmgate Price Rp/mt 4,805,111 4,506,822 4,208,532 3,910,242 3,611,952 3,313,662 3,333,610 3,353,557 3,373,504 3,393,452 3,413,399
Lump Rubber (40% DRC)Quantity Required for Producing One Ton of Dry Rubber mt 2.50 2.50 2.50 2.50 2.50 2.50 2.50 2.50 2.50 2.50 2.50 Buying Price at Factory Rp/mt 3,560,081 3,343,143 3,126,205 2,909,267 2,692,329 2,475,391 2,489,898 2,504,405 2,518,912 2,533,420 2,547,927 Marketing and Farm to Factory Transport Charges Rp/mt 90,000 90,000 90,000 90,000 90,000 90,000 90,000 90,000 90,000 90,000 90,000 Farmgate Price Rp/mt 3,470,081 3,253,143 3,036,205 2,819,267 2,602,329 2,385,391 2,399,898 2,414,405 2,428,912 2,443,420 2,457,927
Latex (28% DRC)Processing Cost for One Ton of Slab Rp/mt 480,511 450,682 420,853 391,024 361,195 331,366 333,361 335,356 337,350 339,345 341,340 Quantity Required for Producing One Ton of Slab mt 2.14 2.14 2.14 2.14 2.14 2.14 2.14 2.14 2.14 2.14 2.14 Farmgate Price of Latex Rp/mt 2,018,147 1,892,865 1,767,583 1,642,302 1,517,020 1,391,738 1,400,116 1,408,494 1,416,872 1,425,250 1,433,628
Source: World Bank Commodity Price Forecasts, 2005 and Badan Pusat Statistik, Indonesia (www.bps.go.id)
44 Appendix 11
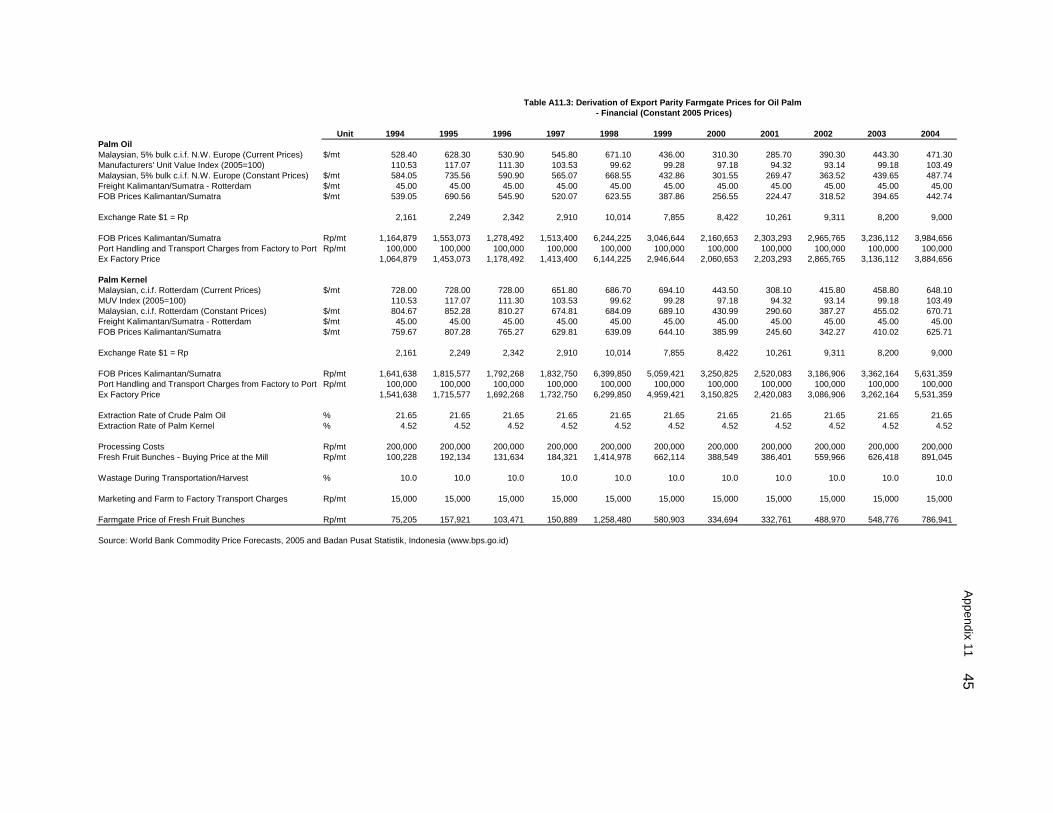
Unit 1994 1995 1996 1997 1998 1999 2000 2001 2002 2003 2004Palm OilMalaysian, 5% bulk c.i.f. N.W. Europe (Current Prices) $/mt 528.40 628.30 530.90 545.80 671.10 436.00 310.30 285.70 390.30 443.30 471.30 Manufacturers' Unit Value Index (2005=100) 110.53 117.07 111.30 103.53 99.62 99.28 97.18 94.32 93.14 99.18 103.49 Malaysian, 5% bulk c.i.f. N.W. Europe (Constant Prices) $/mt 584.05 735.56 590.90 565.07 668.55 432.86 301.55 269.47 363.52 439.65 487.74 Freight Kalimantan/Sumatra - Rotterdam $/mt 45.00 45.00 45.00 45.00 45.00 45.00 45.00 45.00 45.00 45.00 45.00 FOB Prices Kalimantan/Sumatra $/mt 539.05 690.56 545.90 520.07 623.55 387.86 256.55 224.47 318.52 394.65 442.74
Exchange Rate $1 = Rp 2,161 2,249 2,342 2,910 10,014 7,855 8,422 10,261 9,311 8,200 9,000
FOB Prices Kalimantan/Sumatra Rp/mt 1,164,879 1,553,073 1,278,492 1,513,400 6,244,225 3,046,644 2,160,653 2,303,293 2,965,765 3,236,112 3,984,656 Port Handling and Transport Charges from Factory to Port Rp/mt 100,000 100,000 100,000 100,000 100,000 100,000 100,000 100,000 100,000 100,000 100,000 Ex Factory Price 1,064,879 1,453,073 1,178,492 1,413,400 6,144,225 2,946,644 2,060,653 2,203,293 2,865,765 3,136,112 3,884,656
Palm KernelMalaysian, c.i.f. Rotterdam (Current Prices) $/mt 728.00 728.00 728.00 651.80 686.70 694.10 443.50 308.10 415.80 458.80 648.10 MUV Index (2005=100) 110.53 117.07 111.30 103.53 99.62 99.28 97.18 94.32 93.14 99.18 103.49 Malaysian, c.i.f. Rotterdam (Constant Prices) $/mt 804.67 852.28 810.27 674.81 684.09 689.10 430.99 290.60 387.27 455.02 670.71 Freight Kalimantan/Sumatra - Rotterdam $/mt 45.00 45.00 45.00 45.00 45.00 45.00 45.00 45.00 45.00 45.00 45.00 FOB Prices Kalimantan/Sumatra $/mt 759.67 807.28 765.27 629.81 639.09 644.10 385.99 245.60 342.27 410.02 625.71
Exchange Rate $1 = Rp 2,161 2,249 2,342 2,910 10,014 7,855 8,422 10,261 9,311 8,200 9,000
FOB Prices Kalimantan/Sumatra Rp/mt 1,641,638 1,815,577 1,792,268 1,832,750 6,399,850 5,059,421 3,250,825 2,520,083 3,186,906 3,362,164 5,631,359 Port Handling and Transport Charges from Factory to Port Rp/mt 100,000 100,000 100,000 100,000 100,000 100,000 100,000 100,000 100,000 100,000 100,000 Ex Factory Price 1,541,638 1,715,577 1,692,268 1,732,750 6,299,850 4,959,421 3,150,825 2,420,083 3,086,906 3,262,164 5,531,359
Extraction Rate of Crude Palm Oil % 21.65 21.65 21.65 21.65 21.65 21.65 21.65 21.65 21.65 21.65 21.65 Extraction Rate of Palm Kernel % 4.52 4.52 4.52 4.52 4.52 4.52 4.52 4.52 4.52 4.52 4.52
Processing Costs Rp/mt 200,000 200,000 200,000 200,000 200,000 200,000 200,000 200,000 200,000 200,000 200,000 Fresh Fruit Bunches - Buying Price at the Mill Rp/mt 100,228 192,134 131,634 184,321 1,414,978 662,114 388,549 386,401 559,966 626,418 891,045
Wastage During Transportation/Harvest % 10.0 10.0 10.0 10.0 10.0 10.0 10.0 10.0 10.0 10.0 10.0
Marketing and Farm to Factory Transport Charges Rp/mt 15,000 15,000 15,000 15,000 15,000 15,000 15,000 15,000 15,000 15,000 15,000
Farmgate Price of Fresh Fruit Bunches Rp/mt 75,205 157,921 103,471 150,889 1,258,480 580,903 334,694 332,761 488,970 548,776 786,941
Source: World Bank Commodity Price Forecasts, 2005 and Badan Pusat Statistik, Indonesia (www.bps.go.id)
Table A11.3: Derivation of Export Parity Farmgate Prices for Oil Palm - Financial (Constant 2005 Prices)
Appendix 11 45
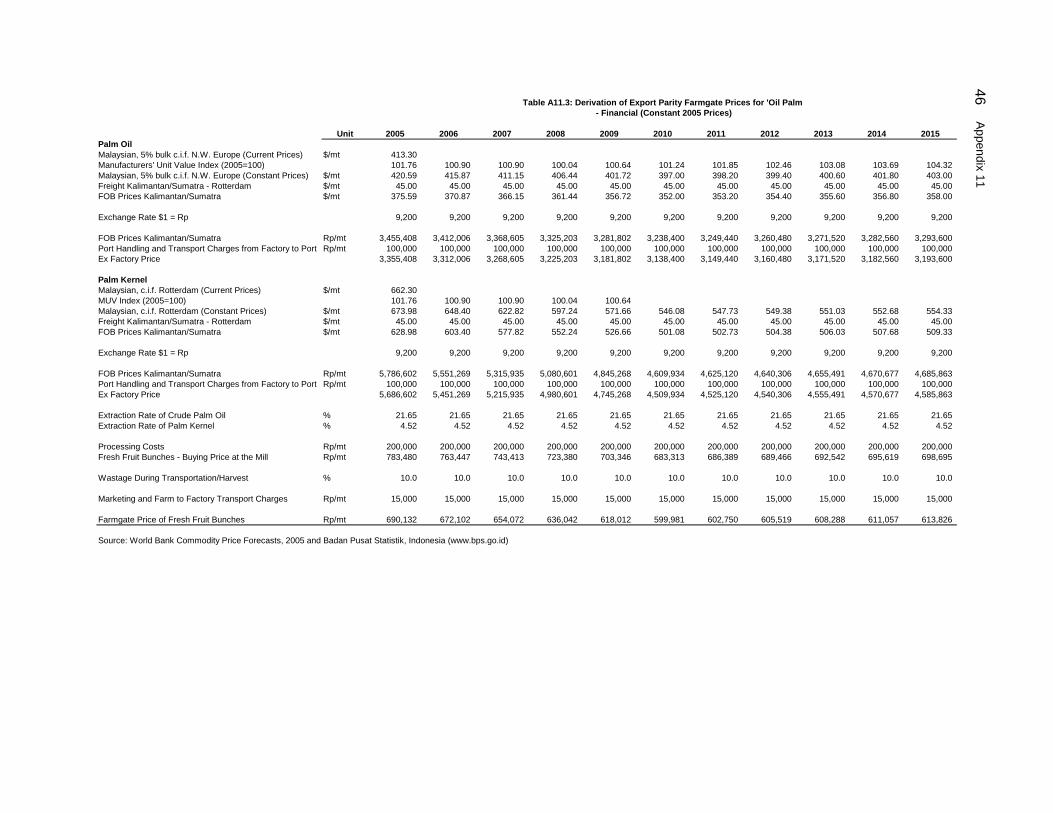
Unit 2005 2006 2007 2008 2009 2010 2011 2012 2013 2014 2015Palm OilMalaysian, 5% bulk c.i.f. N.W. Europe (Current Prices) $/mt 413.30 Manufacturers' Unit Value Index (2005=100) 101.76 100.90 100.90 100.04 100.64 101.24 101.85 102.46 103.08 103.69 104.32 Malaysian, 5% bulk c.i.f. N.W. Europe (Constant Prices) $/mt 420.59 415.87 411.15 406.44 401.72 397.00 398.20 399.40 400.60 401.80 403.00 Freight Kalimantan/Sumatra - Rotterdam $/mt 45.00 45.00 45.00 45.00 45.00 45.00 45.00 45.00 45.00 45.00 45.00 FOB Prices Kalimantan/Sumatra $/mt 375.59 370.87 366.15 361.44 356.72 352.00 353.20 354.40 355.60 356.80 358.00
Exchange Rate $1 = Rp 9,200 9,200 9,200 9,200 9,200 9,200 9,200 9,200 9,200 9,200 9,200
FOB Prices Kalimantan/Sumatra Rp/mt 3,455,408 3,412,006 3,368,605 3,325,203 3,281,802 3,238,400 3,249,440 3,260,480 3,271,520 3,282,560 3,293,600 Port Handling and Transport Charges from Factory to Port Rp/mt 100,000 100,000 100,000 100,000 100,000 100,000 100,000 100,000 100,000 100,000 100,000 Ex Factory Price 3,355,408 3,312,006 3,268,605 3,225,203 3,181,802 3,138,400 3,149,440 3,160,480 3,171,520 3,182,560 3,193,600
Palm KernelMalaysian, c.i.f. Rotterdam (Current Prices) $/mt 662.30 MUV Index (2005=100) 101.76 100.90 100.90 100.04 100.64 Malaysian, c.i.f. Rotterdam (Constant Prices) $/mt 673.98 648.40 622.82 597.24 571.66 546.08 547.73 549.38 551.03 552.68 554.33 Freight Kalimantan/Sumatra - Rotterdam $/mt 45.00 45.00 45.00 45.00 45.00 45.00 45.00 45.00 45.00 45.00 45.00 FOB Prices Kalimantan/Sumatra $/mt 628.98 603.40 577.82 552.24 526.66 501.08 502.73 504.38 506.03 507.68 509.33
Exchange Rate $1 = Rp 9,200 9,200 9,200 9,200 9,200 9,200 9,200 9,200 9,200 9,200 9,200
FOB Prices Kalimantan/Sumatra Rp/mt 5,786,602 5,551,269 5,315,935 5,080,601 4,845,268 4,609,934 4,625,120 4,640,306 4,655,491 4,670,677 4,685,863 Port Handling and Transport Charges from Factory to Port Rp/mt 100,000 100,000 100,000 100,000 100,000 100,000 100,000 100,000 100,000 100,000 100,000 Ex Factory Price 5,686,602 5,451,269 5,215,935 4,980,601 4,745,268 4,509,934 4,525,120 4,540,306 4,555,491 4,570,677 4,585,863
Extraction Rate of Crude Palm Oil % 21.65 21.65 21.65 21.65 21.65 21.65 21.65 21.65 21.65 21.65 21.65 Extraction Rate of Palm Kernel % 4.52 4.52 4.52 4.52 4.52 4.52 4.52 4.52 4.52 4.52 4.52
Processing Costs Rp/mt 200,000 200,000 200,000 200,000 200,000 200,000 200,000 200,000 200,000 200,000 200,000 Fresh Fruit Bunches - Buying Price at the Mill Rp/mt 783,480 763,447 743,413 723,380 703,346 683,313 686,389 689,466 692,542 695,619 698,695
Wastage During Transportation/Harvest % 10.0 10.0 10.0 10.0 10.0 10.0 10.0 10.0 10.0 10.0 10.0
Marketing and Farm to Factory Transport Charges Rp/mt 15,000 15,000 15,000 15,000 15,000 15,000 15,000 15,000 15,000 15,000 15,000
Farmgate Price of Fresh Fruit Bunches Rp/mt 690,132 672,102 654,072 636,042 618,012 599,981 602,750 605,519 608,288 611,057 613,826
Source: World Bank Commodity Price Forecasts, 2005 and Badan Pusat Statistik, Indonesia (www.bps.go.id)
Table A11.3: Derivation of Export Parity Farmgate Prices for 'Oil Palm - Financial (Constant 2005 Prices)
46 Appendix 11

Table A11.4: Derivation of Export Parity Farmgate Prices for Oil Palm- Economic (Constant 2005 Prices)
Unit 1994 1995 1996 1997 1998 1999 2000 2001 2002 2003 2004 2005Palm OilMalaysian, 5% bulk c.i.f. N.W. Europe (Current Prices) $/mt 528.40 628.30 530.90 545.80 671.10 436.00 310.30 285.70 390.30 443.30 471.30 413.30 Manufacturers' Unit Value Index (2005=100) 110.53 117.07 111.30 103.53 99.62 99.28 97.18 94.32 93.14 99.18 103.49 101.76 Malaysian, 5% bulk c.i.f. N.W. Europe (Constant Prices) $/mt 584.05 735.56 590.90 565.07 668.55 432.86 301.55 269.47 363.52 439.65 487.74 420.59 Freight Kalimantan/Sumatra - Rotterdam $/mt 45.00 45.00 45.00 45.00 45.00 45.00 45.00 45.00 45.00 45.00 45.00 45.00 FOB Prices Kalimantan/Sumatra $/mt 539.05 690.56 545.90 520.07 623.55 387.86 256.55 224.47 318.52 394.65 442.74 375.59
Exchange Rate $1 = Rp 2,161 2,249 2,342 2,910 10,014 7,855 8,422 10,261 9,311 8,200 9,000 9,200
FOB Prices Kalimantan/Sumatra Rp/mt 1,164,879 1,553,073 1,278,492 1,513,400 6,244,225 3,046,644 2,160,653 2,303,293 2,965,765 3,236,112 3,984,656 3,455,408Port Handling and Transport Charges from Factory to Port Rp/mt 90,000 90,000 90,000 90,000 90,000 90,000 90,000 90,000 90,000 90,000 90,000 90,000 Ex Factory Price 1,074,879 1,463,073 1,188,492 1,423,400 6,154,225 2,956,644 2,070,653 2,213,293 2,875,765 3,146,112 3,894,656 3,365,408
Palm KernelMalaysian, c.i.f. Rotterdam (Current Prices) $/mt 728.00 728.00 728.00 651.80 686.70 694.10 443.50 308.10 415.80 458.80 648.10 662.30 MUV Index (2005=100) 110.53 117.07 111.30 103.53 99.62 99.28 97.18 94.32 93.14 99.18 103.49 101.76 Malaysian, c.i.f. Rotterdam (Constant Prices) $/mt 804.67 852.28 810.27 674.81 684.09 689.10 430.99 290.60 387.27 455.02 670.71 673.98 Freight Kalimantan/Sumatra - Rotterdam $/mt 45.00 45.00 45.00 45.00 45.00 45.00 45.00 45.00 45.00 45.00 45.00 45.00 FOB Prices Kalimantan/Sumatra $/mt 759.67 807.28 765.27 629.81 639.09 644.10 385.99 245.60 342.27 410.02 625.71 628.98
Exchange Rate $1 = Rp 2,161 2,249 2,342 2,910 10,014 7,855 8,422 10,261 9,311 8,200 9,000 9,200
FOB Prices Kalimantan/Sumatra Rp/mt 1,641,638 1,815,577 1,792,268 1,832,750 6,399,850 5,059,421 3,250,825 2,520,083 3,186,906 3,362,164 5,631,359 5,786,602Port Handling and Transport Charges from Factory to Port Rp/mt 90,000 90,000 90,000 90,000 90,000 90,000 90,000 90,000 90,000 90,000 90,000 90,000 Ex Factory Price 1,551,638 1,725,577 1,702,268 1,742,750 6,309,850 4,969,421 3,160,825 2,430,083 3,096,906 3,272,164 5,541,359 5,696,602
Extraction Rate of Crude Palm Oil % 21.65 21.65 21.65 21.65 21.65 21.65 21.65 21.65 21.65 21.65 21.65 21.65 Extraction Rate of Palm Kernel % 4.52 4.52 4.52 4.52 4.52 4.52 4.52 4.52 4.52 4.52 4.52 4.52
Processing Costs Rp/mt 180,000 180,000 180,000 180,000 180,000 180,000 180,000 180,000 180,000 180,000 180,000 180,000 Fresh Fruit Bunches - Buying Price at the Mill Rp/mt 122,845 214,751 154,251 206,938 1,437,595 684,731 411,166 409,018 582,583 649,035 913,662 806,097 Wastage During Transportation/Harvest % 10.0 10.0 10.0 10.0 10.0 10.0 10.0 10.0 10.0 10.0 10.0 10.0
Marketing and Farm to Factory Transport Charges Rp/mt 13,500 13,500 13,500 13,500 13,500 13,500 13,500 13,500 13,500 13,500 13,500 13,500
Farmgate Price of Fresh Fruit Bunches Rp/mt 97,061 179,776 125,326 172,745 1,280,336 602,758 356,549 354,616 510,825 570,631 808,796 711,988
Source: World Bank Commodity Price Forecasts, 2005 and Badan Pusat Statistik, Indonesia (www.bps.go.id)
Appendix 11 47
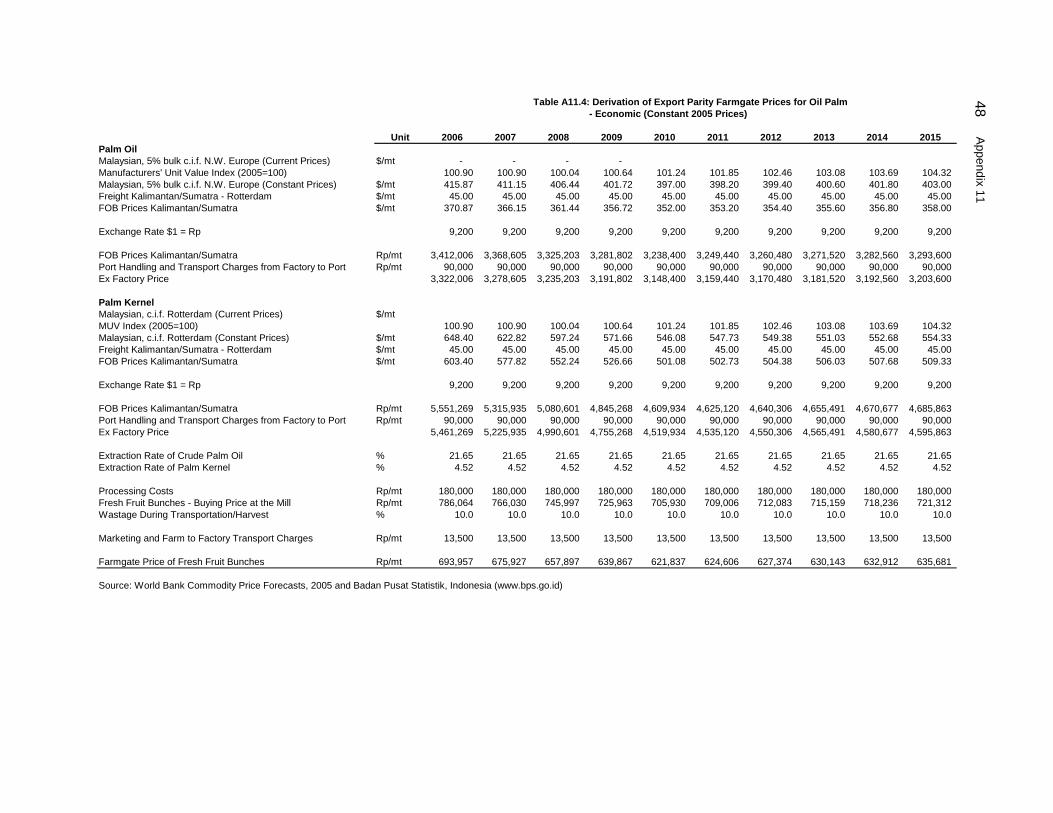
Table A11.4: Derivation of Export Parity Farmgate Prices for Oil Palm- Economic (Constant 2005 Prices)
Unit 2006 2007 2008 2009 2010 2011 2012 2013 2014 2015Palm OilMalaysian, 5% bulk c.i.f. N.W. Europe (Current Prices) $/mt - - - - Manufacturers' Unit Value Index (2005=100) 100.90 100.90 100.04 100.64 101.24 101.85 102.46 103.08 103.69 104.32 Malaysian, 5% bulk c.i.f. N.W. Europe (Constant Prices) $/mt 415.87 411.15 406.44 401.72 397.00 398.20 399.40 400.60 401.80 403.00 Freight Kalimantan/Sumatra - Rotterdam $/mt 45.00 45.00 45.00 45.00 45.00 45.00 45.00 45.00 45.00 45.00 FOB Prices Kalimantan/Sumatra $/mt 370.87 366.15 361.44 356.72 352.00 353.20 354.40 355.60 356.80 358.00
Exchange Rate $1 = Rp 9,200 9,200 9,200 9,200 9,200 9,200 9,200 9,200 9,200 9,200
FOB Prices Kalimantan/Sumatra Rp/mt 3,412,006 3,368,605 3,325,203 3,281,802 3,238,400 3,249,440 3,260,480 3,271,520 3,282,560 3,293,600Port Handling and Transport Charges from Factory to Port Rp/mt 90,000 90,000 90,000 90,000 90,000 90,000 90,000 90,000 90,000 90,000 Ex Factory Price 3,322,006 3,278,605 3,235,203 3,191,802 3,148,400 3,159,440 3,170,480 3,181,520 3,192,560 3,203,600
Palm KernelMalaysian, c.i.f. Rotterdam (Current Prices) $/mtMUV Index (2005=100) 100.90 100.90 100.04 100.64 101.24 101.85 102.46 103.08 103.69 104.32 Malaysian, c.i.f. Rotterdam (Constant Prices) $/mt 648.40 622.82 597.24 571.66 546.08 547.73 549.38 551.03 552.68 554.33 Freight Kalimantan/Sumatra - Rotterdam $/mt 45.00 45.00 45.00 45.00 45.00 45.00 45.00 45.00 45.00 45.00 FOB Prices Kalimantan/Sumatra $/mt 603.40 577.82 552.24 526.66 501.08 502.73 504.38 506.03 507.68 509.33
Exchange Rate $1 = Rp 9,200 9,200 9,200 9,200 9,200 9,200 9,200 9,200 9,200 9,200
FOB Prices Kalimantan/Sumatra Rp/mt 5,551,269 5,315,935 5,080,601 4,845,268 4,609,934 4,625,120 4,640,306 4,655,491 4,670,677 4,685,863Port Handling and Transport Charges from Factory to Port Rp/mt 90,000 90,000 90,000 90,000 90,000 90,000 90,000 90,000 90,000 90,000 Ex Factory Price 5,461,269 5,225,935 4,990,601 4,755,268 4,519,934 4,535,120 4,550,306 4,565,491 4,580,677 4,595,863
Extraction Rate of Crude Palm Oil % 21.65 21.65 21.65 21.65 21.65 21.65 21.65 21.65 21.65 21.65 Extraction Rate of Palm Kernel % 4.52 4.52 4.52 4.52 4.52 4.52 4.52 4.52 4.52 4.52
Processing Costs Rp/mt 180,000 180,000 180,000 180,000 180,000 180,000 180,000 180,000 180,000 180,000 Fresh Fruit Bunches - Buying Price at the Mill Rp/mt 786,064 766,030 745,997 725,963 705,930 709,006 712,083 715,159 718,236 721,312 Wastage During Transportation/Harvest % 10.0 10.0 10.0 10.0 10.0 10.0 10.0 10.0 10.0 10.0
Marketing and Farm to Factory Transport Charges Rp/mt 13,500 13,500 13,500 13,500 13,500 13,500 13,500 13,500 13,500 13,500
Farmgate Price of Fresh Fruit Bunches Rp/mt 693,957 675,927 657,897 639,867 621,837 624,606 627,374 630,143 632,912 635,681
Source: World Bank Commodity Price Forecasts, 2005 and Badan Pusat Statistik, Indonesia (www.bps.go.id)
48 Appendix 11
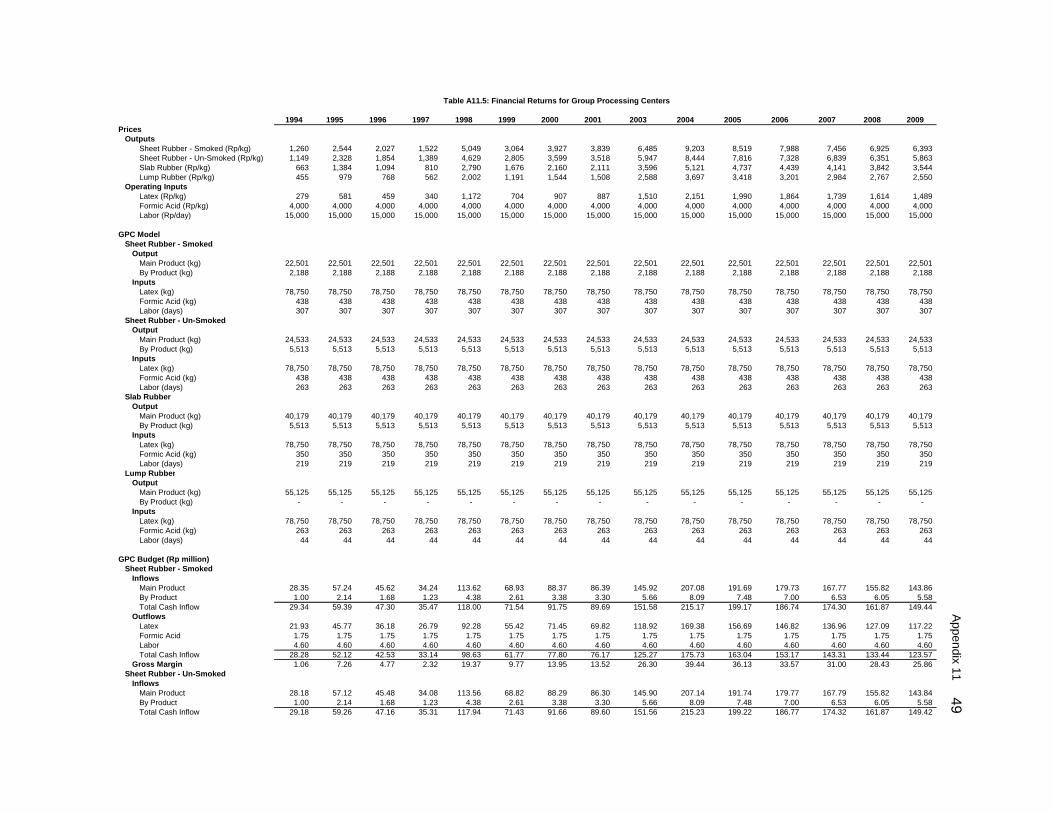
Table A11.5: Financial Returns for Group Processing Centers
1994 1995 1996 1997 1998 1999 2000 2001 2003 2004 2005 2006 2007 2008 2009Prices
OutputsSheet Rubber - Smoked (Rp/kg) 1,260 2,544 2,027 1,522 5,049 3,064 3,927 3,839 6,485 9,203 8,519 7,988 7,456 6,925 6,393 Sheet Rubber - Un-Smoked (Rp/kg) 1,149 2,328 1,854 1,389 4,629 2,805 3,599 3,518 5,947 8,444 7,816 7,328 6,839 6,351 5,863 Slab Rubber (Rp/kg) 663 1,384 1,094 810 2,790 1,676 2,160 2,111 3,596 5,121 4,737 4,439 4,141 3,842 3,544 Lump Rubber (Rp/kg) 455 979 768 562 2,002 1,191 1,544 1,508 2,588 3,697 3,418 3,201 2,984 2,767 2,550
Operating InputsLatex (Rp/kg) 279 581 459 340 1,172 704 907 887 1,510 2,151 1,990 1,864 1,739 1,614 1,489 Formic Acid (Rp/kg) 4,000 4,000 4,000 4,000 4,000 4,000 4,000 4,000 4,000 4,000 4,000 4,000 4,000 4,000 4,000 Labor (Rp/day) 15,000 15,000 15,000 15,000 15,000 15,000 15,000 15,000 15,000 15,000 15,000 15,000 15,000 15,000 15,000
GPC ModelSheet Rubber - Smoked
OutputMain Product (kg) 22,501 22,501 22,501 22,501 22,501 22,501 22,501 22,501 22,501 22,501 22,501 22,501 22,501 22,501 22,501 By Product (kg) 2,188 2,188 2,188 2,188 2,188 2,188 2,188 2,188 2,188 2,188 2,188 2,188 2,188 2,188 2,188
InputsLatex (kg) 78,750 78,750 78,750 78,750 78,750 78,750 78,750 78,750 78,750 78,750 78,750 78,750 78,750 78,750 78,750 Formic Acid (kg) 438 438 438 438 438 438 438 438 438 438 438 438 438 438 438 Labor (days) 307 307 307 307 307 307 307 307 307 307 307 307 307 307 307
Sheet Rubber - Un-SmokedOutput
Main Product (kg) 24,533 24,533 24,533 24,533 24,533 24,533 24,533 24,533 24,533 24,533 24,533 24,533 24,533 24,533 24,533 By Product (kg) 5,513 5,513 5,513 5,513 5,513 5,513 5,513 5,513 5,513 5,513 5,513 5,513 5,513 5,513 5,513
InputsLatex (kg) 78,750 78,750 78,750 78,750 78,750 78,750 78,750 78,750 78,750 78,750 78,750 78,750 78,750 78,750 78,750 Formic Acid (kg) 438 438 438 438 438 438 438 438 438 438 438 438 438 438 438 Labor (days) 263 263 263 263 263 263 263 263 263 263 263 263 263 263 263
Slab RubberOutput
Main Product (kg) 40,179 40,179 40,179 40,179 40,179 40,179 40,179 40,179 40,179 40,179 40,179 40,179 40,179 40,179 40,179 By Product (kg) 5,513 5,513 5,513 5,513 5,513 5,513 5,513 5,513 5,513 5,513 5,513 5,513 5,513 5,513 5,513
InputsLatex (kg) 78,750 78,750 78,750 78,750 78,750 78,750 78,750 78,750 78,750 78,750 78,750 78,750 78,750 78,750 78,750 Formic Acid (kg) 350 350 350 350 350 350 350 350 350 350 350 350 350 350 350 Labor (days) 219 219 219 219 219 219 219 219 219 219 219 219 219 219 219
Lump RubberOutput
Main Product (kg) 55,125 55,125 55,125 55,125 55,125 55,125 55,125 55,125 55,125 55,125 55,125 55,125 55,125 55,125 55,125 By Product (kg) - - - - - - - - - - - - - - -
InputsLatex (kg) 78,750 78,750 78,750 78,750 78,750 78,750 78,750 78,750 78,750 78,750 78,750 78,750 78,750 78,750 78,750 Formic Acid (kg) 263 263 263 263 263 263 263 263 263 263 263 263 263 263 263 Labor (days) 44 44 44 44 44 44 44 44 44 44 44 44 44 44 44
GPC Budget (Rp million)Sheet Rubber - Smoked
InflowsMain Product 28.35 57.24 45.62 34.24 113.62 68.93 88.37 86.39 145.92 207.08 191.69 179.73 167.77 155.82 143.86 By Product 1.00 2.14 1.68 1.23 4.38 2.61 3.38 3.30 5.66 8.09 7.48 7.00 6.53 6.05 5.58 Total Cash Inflow 29.34 59.39 47.30 35.47 118.00 71.54 91.75 89.69 151.58 215.17 199.17 186.74 174.30 161.87 149.44
OutflowsLatex 21.93 45.77 36.18 26.79 92.28 55.42 71.45 69.82 118.92 169.38 156.69 146.82 136.96 127.09 117.22 Formic Acid 1.75 1.75 1.75 1.75 1.75 1.75 1.75 1.75 1.75 1.75 1.75 1.75 1.75 1.75 1.75 Labor 4.60 4.60 4.60 4.60 4.60 4.60 4.60 4.60 4.60 4.60 4.60 4.60 4.60 4.60 4.60 Total Cash Inflow 28.28 52.12 42.53 33.14 98.63 61.77 77.80 76.17 125.27 175.73 163.04 153.17 143.31 133.44 123.57
Gross Margin 1.06 7.26 4.77 2.32 19.37 9.77 13.95 13.52 26.30 39.44 36.13 33.57 31.00 28.43 25.86 Sheet Rubber - Un-Smoked
InflowsMain Product 28.18 57.12 45.48 34.08 113.56 68.82 88.29 86.30 145.90 207.14 191.74 179.77 167.79 155.82 143.84 By Product 1.00 2.14 1.68 1.23 4.38 2.61 3.38 3.30 5.66 8.09 7.48 7.00 6.53 6.05 5.58 Total Cash Inflow 29.18 59.26 47.16 35.31 117.94 71.43 91.66 89.60 151.56 215.23 199.22 186.77 174.32 161.87 149.42
Appendix 11 49
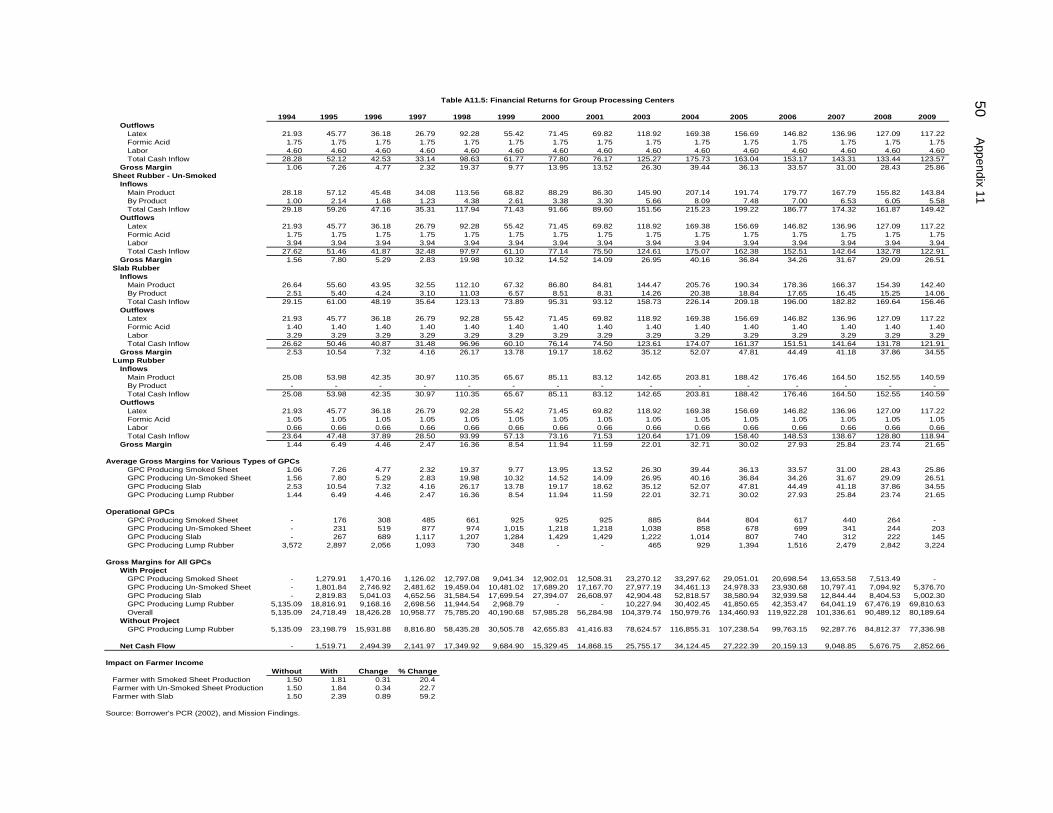
Table A11.5: Financial Returns for Group Processing Centers
1994 1995 1996 1997 1998 1999 2000 2001 2003 2004 2005 2006 2007 2008 2009Outflows
Latex 21.93 45.77 36.18 26.79 92.28 55.42 71.45 69.82 118.92 169.38 156.69 146.82 136.96 127.09 117.22 Formic Acid 1.75 1.75 1.75 1.75 1.75 1.75 1.75 1.75 1.75 1.75 1.75 1.75 1.75 1.75 1.75 Labor 4.60 4.60 4.60 4.60 4.60 4.60 4.60 4.60 4.60 4.60 4.60 4.60 4.60 4.60 4.60 Total Cash Inflow 28.28 52.12 42.53 33.14 98.63 61.77 77.80 76.17 125.27 175.73 163.04 153.17 143.31 133.44 123.57
Gross Margin 1.06 7.26 4.77 2.32 19.37 9.77 13.95 13.52 26.30 39.44 36.13 33.57 31.00 28.43 25.86 Sheet Rubber - Un-Smoked
InflowsMain Product 28.18 57.12 45.48 34.08 113.56 68.82 88.29 86.30 145.90 207.14 191.74 179.77 167.79 155.82 143.84 By Product 1.00 2.14 1.68 1.23 4.38 2.61 3.38 3.30 5.66 8.09 7.48 7.00 6.53 6.05 5.58 Total Cash Inflow 29.18 59.26 47.16 35.31 117.94 71.43 91.66 89.60 151.56 215.23 199.22 186.77 174.32 161.87 149.42
OutflowsLatex 21.93 45.77 36.18 26.79 92.28 55.42 71.45 69.82 118.92 169.38 156.69 146.82 136.96 127.09 117.22 Formic Acid 1.75 1.75 1.75 1.75 1.75 1.75 1.75 1.75 1.75 1.75 1.75 1.75 1.75 1.75 1.75 Labor 3.94 3.94 3.94 3.94 3.94 3.94 3.94 3.94 3.94 3.94 3.94 3.94 3.94 3.94 3.94 Total Cash Inflow 27.62 51.46 41.87 32.48 97.97 61.10 77.14 75.50 124.61 175.07 162.38 152.51 142.64 132.78 122.91
Gross Margin 1.56 7.80 5.29 2.83 19.98 10.32 14.52 14.09 26.95 40.16 36.84 34.26 31.67 29.09 26.51 Slab Rubber
InflowsMain Product 26.64 55.60 43.95 32.55 112.10 67.32 86.80 84.81 144.47 205.76 190.34 178.36 166.37 154.39 142.40 By Product 2.51 5.40 4.24 3.10 11.03 6.57 8.51 8.31 14.26 20.38 18.84 17.65 16.45 15.25 14.06 Total Cash Inflow 29.15 61.00 48.19 35.64 123.13 73.89 95.31 93.12 158.73 226.14 209.18 196.00 182.82 169.64 156.46
OutflowsLatex 21.93 45.77 36.18 26.79 92.28 55.42 71.45 69.82 118.92 169.38 156.69 146.82 136.96 127.09 117.22 Formic Acid 1.40 1.40 1.40 1.40 1.40 1.40 1.40 1.40 1.40 1.40 1.40 1.40 1.40 1.40 1.40 Labor 3.29 3.29 3.29 3.29 3.29 3.29 3.29 3.29 3.29 3.29 3.29 3.29 3.29 3.29 3.29 Total Cash Inflow 26.62 50.46 40.87 31.48 96.96 60.10 76.14 74.50 123.61 174.07 161.37 151.51 141.64 131.78 121.91
Gross Margin 2.53 10.54 7.32 4.16 26.17 13.78 19.17 18.62 35.12 52.07 47.81 44.49 41.18 37.86 34.55 Lump Rubber
InflowsMain Product 25.08 53.98 42.35 30.97 110.35 65.67 85.11 83.12 142.65 203.81 188.42 176.46 164.50 152.55 140.59 By Product - - - - - - - - - - - - - - - Total Cash Inflow 25.08 53.98 42.35 30.97 110.35 65.67 85.11 83.12 142.65 203.81 188.42 176.46 164.50 152.55 140.59
OutflowsLatex 21.93 45.77 36.18 26.79 92.28 55.42 71.45 69.82 118.92 169.38 156.69 146.82 136.96 127.09 117.22 Formic Acid 1.05 1.05 1.05 1.05 1.05 1.05 1.05 1.05 1.05 1.05 1.05 1.05 1.05 1.05 1.05 Labor 0.66 0.66 0.66 0.66 0.66 0.66 0.66 0.66 0.66 0.66 0.66 0.66 0.66 0.66 0.66 Total Cash Inflow 23.64 47.48 37.89 28.50 93.99 57.13 73.16 71.53 120.64 171.09 158.40 148.53 138.67 128.80 118.94
Gross Margin 1.44 6.49 4.46 2.47 16.36 8.54 11.94 11.59 22.01 32.71 30.02 27.93 25.84 23.74 21.65
Average Gross Margins for Various Types of GPCsGPC Producing Smoked Sheet 1.06 7.26 4.77 2.32 19.37 9.77 13.95 13.52 26.30 39.44 36.13 33.57 31.00 28.43 25.86 GPC Producing Un-Smoked Sheet 1.56 7.80 5.29 2.83 19.98 10.32 14.52 14.09 26.95 40.16 36.84 34.26 31.67 29.09 26.51 GPC Producing Slab 2.53 10.54 7.32 4.16 26.17 13.78 19.17 18.62 35.12 52.07 47.81 44.49 41.18 37.86 34.55 GPC Producing Lump Rubber 1.44 6.49 4.46 2.47 16.36 8.54 11.94 11.59 22.01 32.71 30.02 27.93 25.84 23.74 21.65
Operational GPCsGPC Producing Smoked Sheet - 176 308 485 661 925 925 925 885 844 804 617 440 264 - GPC Producing Un-Smoked Sheet - 231 519 877 974 1,015 1,218 1,218 1,038 858 678 699 341 244 203 GPC Producing Slab - 267 689 1,117 1,207 1,284 1,429 1,429 1,222 1,014 807 740 312 222 145 GPC Producing Lump Rubber 3,572 2,897 2,056 1,093 730 348 - - 465 929 1,394 1,516 2,479 2,842 3,224
Gross Margins for All GPCsWith Project
GPC Producing Smoked Sheet - 1,279.91 1,470.16 1,126.02 12,797.08 9,041.34 12,902.01 12,508.31 23,270.12 33,297.62 29,051.01 20,698.54 13,653.58 7,513.49 - GPC Producing Un-Smoked Sheet - 1,801.84 2,746.92 2,481.62 19,459.04 10,481.02 17,689.20 17,167.70 27,977.19 34,461.13 24,978.33 23,930.68 10,797.41 7,094.92 5,376.70 GPC Producing Slab - 2,819.83 5,041.03 4,652.56 31,584.54 17,699.54 27,394.07 26,608.97 42,904.48 52,818.57 38,580.94 32,939.58 12,844.44 8,404.53 5,002.30 GPC Producing Lump Rubber 5,135.09 18,816.91 9,168.16 2,698.56 11,944.54 2,968.79 - - 10,227.94 30,402.45 41,850.65 42,353.47 64,041.19 67,476.19 69,810.63Overall 5,135.09 24,718.49 18,426.28 10,958.77 75,785.20 40,190.68 57,985.28 56,284.98 104,379.74 150,979.76 134,460.93 119,922.28 101,336.61 90,489.12 80,189.64
Without ProjectGPC Producing Lump Rubber 5,135.09 23,198.79 15,931.88 8,816.80 58,435.28 30,505.78 42,655.83 41,416.83 78,624.57 116,855.31 107,238.54 99,763.15 92,287.76 84,812.37 77,336.98
Net Cash Flow - 1,519.71 2,494.39 2,141.97 17,349.92 9,684.90 15,329.45 14,868.15 25,755.17 34,124.45 27,222.39 20,159.13 9,048.85 5,676.75 2,852.66
Impact on Farmer IncomeWithout With Change % Change
Farmer with Smoked Sheet Production 1.50 1.81 0.31 20.4 Farmer with Un-Smoked Sheet Production 1.50 1.84 0.34 22.7 Farmer with Slab 1.50 2.39 0.89 59.2
Source: Borrower's PCR (2002), and Mission Findings.
50 Appendix 11
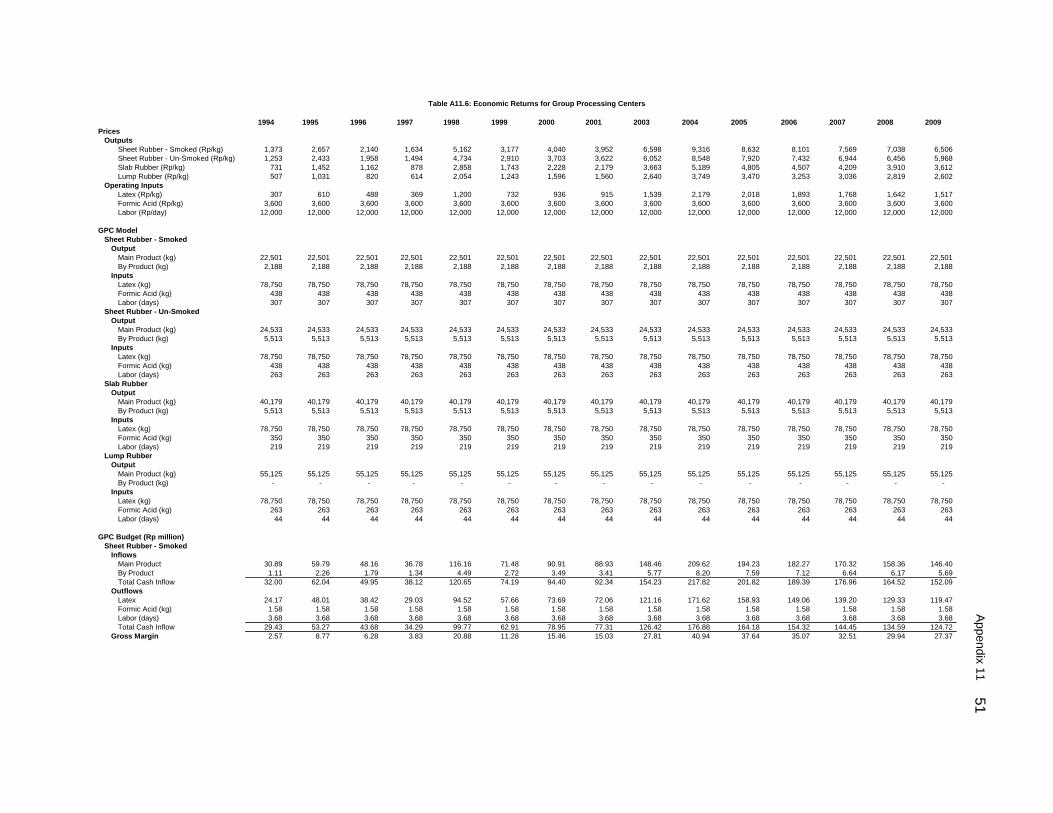
Table A11.6: Economic Returns for Group Processing Centers
1994 1995 1996 1997 1998 1999 2000 2001 2003 2004 2005 2006 2007 2008 2009Prices
OutputsSheet Rubber - Smoked (Rp/kg) 1,373 2,657 2,140 1,634 5,162 3,177 4,040 3,952 6,598 9,316 8,632 8,101 7,569 7,038 6,506 Sheet Rubber - Un-Smoked (Rp/kg) 1,253 2,433 1,958 1,494 4,734 2,910 3,703 3,622 6,052 8,548 7,920 7,432 6,944 6,456 5,968 Slab Rubber (Rp/kg) 731 1,452 1,162 878 2,858 1,743 2,228 2,179 3,663 5,189 4,805 4,507 4,209 3,910 3,612 Lump Rubber (Rp/kg) 507 1,031 820 614 2,054 1,243 1,596 1,560 2,640 3,749 3,470 3,253 3,036 2,819 2,602
Operating InputsLatex (Rp/kg) 307 610 488 369 1,200 732 936 915 1,539 2,179 2,018 1,893 1,768 1,642 1,517 Formic Acid (Rp/kg) 3,600 3,600 3,600 3,600 3,600 3,600 3,600 3,600 3,600 3,600 3,600 3,600 3,600 3,600 3,600 Labor (Rp/day) 12,000 12,000 12,000 12,000 12,000 12,000 12,000 12,000 12,000 12,000 12,000 12,000 12,000 12,000 12,000
GPC ModelSheet Rubber - Smoked
OutputMain Product (kg) 22,501 22,501 22,501 22,501 22,501 22,501 22,501 22,501 22,501 22,501 22,501 22,501 22,501 22,501 22,501 By Product (kg) 2,188 2,188 2,188 2,188 2,188 2,188 2,188 2,188 2,188 2,188 2,188 2,188 2,188 2,188 2,188
InputsLatex (kg) 78,750 78,750 78,750 78,750 78,750 78,750 78,750 78,750 78,750 78,750 78,750 78,750 78,750 78,750 78,750 Formic Acid (kg) 438 438 438 438 438 438 438 438 438 438 438 438 438 438 438 Labor (days) 307 307 307 307 307 307 307 307 307 307 307 307 307 307 307
Sheet Rubber - Un-SmokedOutput
Main Product (kg) 24,533 24,533 24,533 24,533 24,533 24,533 24,533 24,533 24,533 24,533 24,533 24,533 24,533 24,533 24,533 By Product (kg) 5,513 5,513 5,513 5,513 5,513 5,513 5,513 5,513 5,513 5,513 5,513 5,513 5,513 5,513 5,513
InputsLatex (kg) 78,750 78,750 78,750 78,750 78,750 78,750 78,750 78,750 78,750 78,750 78,750 78,750 78,750 78,750 78,750 Formic Acid (kg) 438 438 438 438 438 438 438 438 438 438 438 438 438 438 438 Labor (days) 263 263 263 263 263 263 263 263 263 263 263 263 263 263 263
Slab RubberOutput
Main Product (kg) 40,179 40,179 40,179 40,179 40,179 40,179 40,179 40,179 40,179 40,179 40,179 40,179 40,179 40,179 40,179 By Product (kg) 5,513 5,513 5,513 5,513 5,513 5,513 5,513 5,513 5,513 5,513 5,513 5,513 5,513 5,513 5,513
InputsLatex (kg) 78,750 78,750 78,750 78,750 78,750 78,750 78,750 78,750 78,750 78,750 78,750 78,750 78,750 78,750 78,750 Formic Acid (kg) 350 350 350 350 350 350 350 350 350 350 350 350 350 350 350 Labor (days) 219 219 219 219 219 219 219 219 219 219 219 219 219 219 219
Lump RubberOutput
Main Product (kg) 55,125 55,125 55,125 55,125 55,125 55,125 55,125 55,125 55,125 55,125 55,125 55,125 55,125 55,125 55,125 By Product (kg) - - - - - - - - - - - - - - -
InputsLatex (kg) 78,750 78,750 78,750 78,750 78,750 78,750 78,750 78,750 78,750 78,750 78,750 78,750 78,750 78,750 78,750 Formic Acid (kg) 263 263 263 263 263 263 263 263 263 263 263 263 263 263 263 Labor (days) 44 44 44 44 44 44 44 44 44 44 44 44 44 44 44
GPC Budget (Rp million)Sheet Rubber - Smoked
InflowsMain Product 30.89 59.79 48.16 36.78 116.16 71.48 90.91 88.93 148.46 209.62 194.23 182.27 170.32 158.36 146.40 By Product 1.11 2.26 1.79 1.34 4.49 2.72 3.49 3.41 5.77 8.20 7.59 7.12 6.64 6.17 5.69 Total Cash Inflow 32.00 62.04 49.95 38.12 120.65 74.19 94.40 92.34 154.23 217.82 201.82 189.39 176.96 164.52 152.09
OutflowsLatex 24.17 48.01 38.42 29.03 94.52 57.66 73.69 72.06 121.16 171.62 158.93 149.06 139.20 129.33 119.47 Formic Acid (kg) 1.58 1.58 1.58 1.58 1.58 1.58 1.58 1.58 1.58 1.58 1.58 1.58 1.58 1.58 1.58 Labor (days) 3.68 3.68 3.68 3.68 3.68 3.68 3.68 3.68 3.68 3.68 3.68 3.68 3.68 3.68 3.68 Total Cash Inflow 29.43 53.27 43.68 34.29 99.77 62.91 78.95 77.31 126.42 176.88 164.18 154.32 144.45 134.59 124.72
Gross Margin 2.57 8.77 6.28 3.83 20.88 11.28 15.46 15.03 27.81 40.94 37.64 35.07 32.51 29.94 27.37
Appendix 11 51
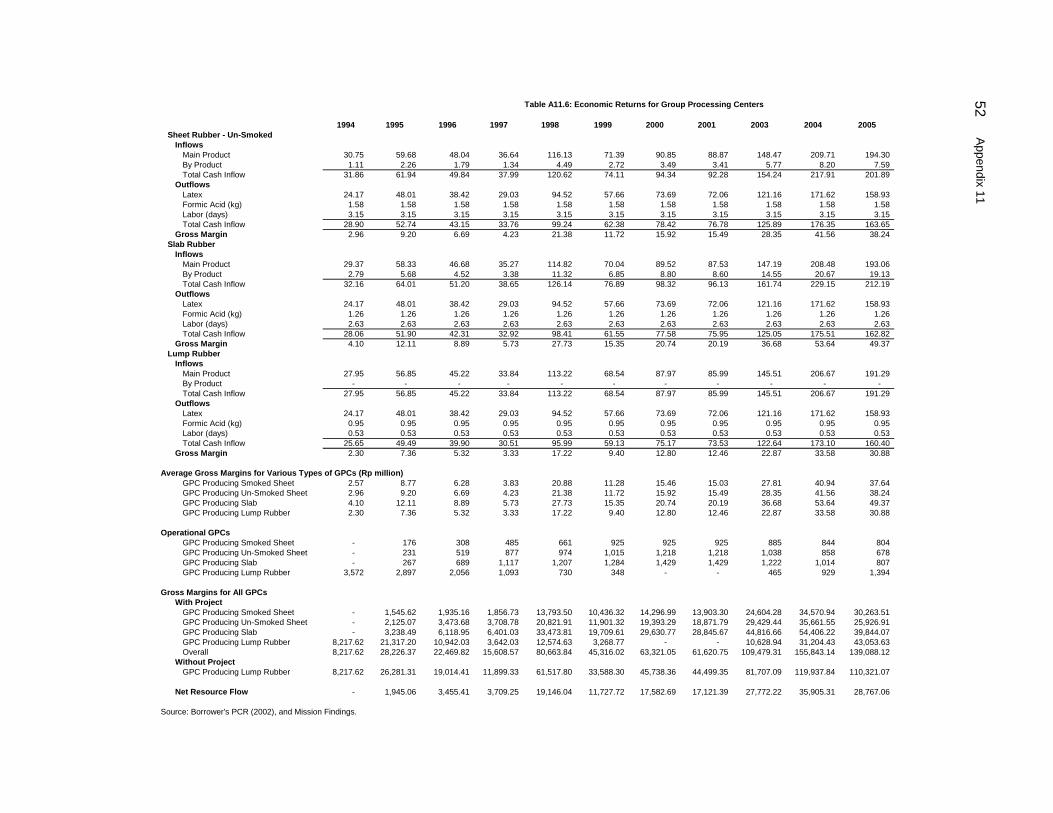
Table A11.6: Economic Returns for Group Processing Centers
1994 1995 1996 1997 1998 1999 2000 2001 2003 2004 2005Sheet Rubber - Un-Smoked
InflowsMain Product 30.75 59.68 48.04 36.64 116.13 71.39 90.85 88.87 148.47 209.71 194.30 By Product 1.11 2.26 1.79 1.34 4.49 2.72 3.49 3.41 5.77 8.20 7.59 Total Cash Inflow 31.86 61.94 49.84 37.99 120.62 74.11 94.34 92.28 154.24 217.91 201.89
OutflowsLatex 24.17 48.01 38.42 29.03 94.52 57.66 73.69 72.06 121.16 171.62 158.93 Formic Acid (kg) 1.58 1.58 1.58 1.58 1.58 1.58 1.58 1.58 1.58 1.58 1.58 Labor (days) 3.15 3.15 3.15 3.15 3.15 3.15 3.15 3.15 3.15 3.15 3.15 Total Cash Inflow 28.90 52.74 43.15 33.76 99.24 62.38 78.42 76.78 125.89 176.35 163.65
Gross Margin 2.96 9.20 6.69 4.23 21.38 11.72 15.92 15.49 28.35 41.56 38.24 Slab Rubber
InflowsMain Product 29.37 58.33 46.68 35.27 114.82 70.04 89.52 87.53 147.19 208.48 193.06 By Product 2.79 5.68 4.52 3.38 11.32 6.85 8.80 8.60 14.55 20.67 19.13 Total Cash Inflow 32.16 64.01 51.20 38.65 126.14 76.89 98.32 96.13 161.74 229.15 212.19
OutflowsLatex 24.17 48.01 38.42 29.03 94.52 57.66 73.69 72.06 121.16 171.62 158.93 Formic Acid (kg) 1.26 1.26 1.26 1.26 1.26 1.26 1.26 1.26 1.26 1.26 1.26 Labor (days) 2.63 2.63 2.63 2.63 2.63 2.63 2.63 2.63 2.63 2.63 2.63 Total Cash Inflow 28.06 51.90 42.31 32.92 98.41 61.55 77.58 75.95 125.05 175.51 162.82
Gross Margin 4.10 12.11 8.89 5.73 27.73 15.35 20.74 20.19 36.68 53.64 49.37 Lump Rubber
InflowsMain Product 27.95 56.85 45.22 33.84 113.22 68.54 87.97 85.99 145.51 206.67 191.29 By Product - - - - - - - - - - - Total Cash Inflow 27.95 56.85 45.22 33.84 113.22 68.54 87.97 85.99 145.51 206.67 191.29
OutflowsLatex 24.17 48.01 38.42 29.03 94.52 57.66 73.69 72.06 121.16 171.62 158.93 Formic Acid (kg) 0.95 0.95 0.95 0.95 0.95 0.95 0.95 0.95 0.95 0.95 0.95 Labor (days) 0.53 0.53 0.53 0.53 0.53 0.53 0.53 0.53 0.53 0.53 0.53 Total Cash Inflow 25.65 49.49 39.90 30.51 95.99 59.13 75.17 73.53 122.64 173.10 160.40
Gross Margin 2.30 7.36 5.32 3.33 17.22 9.40 12.80 12.46 22.87 33.58 30.88
Average Gross Margins for Various Types of GPCs (Rp million)GPC Producing Smoked Sheet 2.57 8.77 6.28 3.83 20.88 11.28 15.46 15.03 27.81 40.94 37.64 GPC Producing Un-Smoked Sheet 2.96 9.20 6.69 4.23 21.38 11.72 15.92 15.49 28.35 41.56 38.24 GPC Producing Slab 4.10 12.11 8.89 5.73 27.73 15.35 20.74 20.19 36.68 53.64 49.37 GPC Producing Lump Rubber 2.30 7.36 5.32 3.33 17.22 9.40 12.80 12.46 22.87 33.58 30.88
Operational GPCsGPC Producing Smoked Sheet - 176 308 485 661 925 925 925 885 844 804 GPC Producing Un-Smoked Sheet - 231 519 877 974 1,015 1,218 1,218 1,038 858 678 GPC Producing Slab - 267 689 1,117 1,207 1,284 1,429 1,429 1,222 1,014 807 GPC Producing Lump Rubber 3,572 2,897 2,056 1,093 730 348 - - 465 929 1,394
Gross Margins for All GPCsWith Project
GPC Producing Smoked Sheet - 1,545.62 1,935.16 1,856.73 13,793.50 10,436.32 14,296.99 13,903.30 24,604.28 34,570.94 30,263.51 GPC Producing Un-Smoked Sheet - 2,125.07 3,473.68 3,708.78 20,821.91 11,901.32 19,393.29 18,871.79 29,429.44 35,661.55 25,926.91 GPC Producing Slab - 3,238.49 6,118.95 6,401.03 33,473.81 19,709.61 29,630.77 28,845.67 44,816.66 54,406.22 39,844.07 GPC Producing Lump Rubber 8,217.62 21,317.20 10,942.03 3,642.03 12,574.63 3,268.77 - - 10,628.94 31,204.43 43,053.63 Overall 8,217.62 28,226.37 22,469.82 15,608.57 80,663.84 45,316.02 63,321.05 61,620.75 109,479.31 155,843.14 139,088.12
Without ProjectGPC Producing Lump Rubber 8,217.62 26,281.31 19,014.41 11,899.33 61,517.80 33,588.30 45,738.36 44,499.35 81,707.09 119,937.84 110,321.07
Net Resource Flow - 1,945.06 3,455.41 3,709.25 19,146.04 11,727.72 17,582.69 17,121.39 27,772.22 35,905.31 28,767.06
Source: Borrower's PCR (2002), and Mission Findings.
52 Appendix 11

Table A11.7: Financial Models of Rubber Rehabilitation Activities
1998 1999 2000 2001 2002 2003 2004 2005 2010 2015 2018Prices
OutputsMain Product
Latex (Rp/kg) 1,172 704 907 887 1,057 1,510 2,151 1,990 1,363 1,405 1,405 By Product
Intercrop (Rp/ha) - - - - - - - - - - - Inputs
Planting Material (Rp/ha) 1,150,000 1,150,000 1,150,000 1,150,000 1,150,000 1,150,000 1,150,000 1,150,000 1,150,000 1,150,000 1,150,000 Fertilizer (Rp/ha) 400,000 400,000 400,000 400,000 400,000 400,000 400,000 400,000 400,000 400,000 400,000 Intercropping Costs (Rp/ha) 1,855,000 1,855,000 1,855,000 1,855,000 1,855,000 1,855,000 1,855,000 1,855,000 1,855,000 1,855,000 1,855,000 Misc. Costs (Rp/ha) 500,000 500,000 500,000 500,000 500,000 500,000 500,000 500,000 500,000 500,000 500,000 Labor (Rp/day) 15,000 15,000 15,000 15,000 15,000 15,000 15,000 15,000 15,000 15,000 15,000
Crop Budgets (Rp. Million Per Hectare)Rubber Planted in 1998
Main ProductLatex - - - - - - 2.11 2.59 2.22 1.83 1.38
By ProductIntercrop - - - - - - - - - - -
Inflows - - - - - - 2.11 2.59 2.22 1.83 1.38 Inputs
Planting Material 1.15 - - - - - - - - - - Fertilizer 0.32 0.32 0.32 0.32 0.32 0.32 0.32 0.40 0.40 0.32 0.32 Intercropping 0.02 - - - - - - - - - - Misc. Costs 0.50 0.10 0.10 0.10 0.10 0.05 0.05 0.05 0.05 0.05 0.05 Labor (day) 2.63 0.75 0.75 0.75 0.75 0.75 0.75 1.20 1.50 1.35 1.05
Outflows 4.61 1.17 1.17 1.17 1.17 1.12 1.12 1.65 1.95 1.72 1.42 Cash Flow (4.61) (1.17) (1.17) (1.17) (1.17) (1.12) 0.99 0.94 0.27 0.11 (0.04) Cash Flow to Farmers (3.13) (0.85) (0.85) (0.85) (0.85) (0.80) 1.31 1.34 0.67 0.43 0.28
Rubber Planted in 1999Main Product
Latex - - - - - - - 1.95 2.22 1.83 1.38 By Product
Intercrop - - - - - - - - - - - Inflows - - - - - - - 1.95 2.22 1.83 1.38 Inputs
Planting Material - 1.15 - - - - - - - - - Fertilizer - 0.32 0.32 0.32 0.32 0.32 0.32 0.32 0.40 0.32 0.32 Intercropping - 0.02 - - - - - - - - - Misc. Costs - 0.50 0.10 0.10 0.10 0.10 0.05 0.05 0.05 0.05 0.05 Labor (day) - 2.63 0.75 0.75 0.75 0.75 0.75 0.75 1.50 1.35 1.35
Outflows - 4.61 1.17 1.17 1.17 1.17 1.12 1.12 1.95 1.72 1.72 Cash Flow - (4.61) (1.17) (1.17) (1.17) (1.17) (1.12) 0.83 0.27 0.11 (0.34) Cash Flow to Farmers - (3.13) (0.85) (0.85) (0.85) (0.85) (0.80) 1.15 0.67 0.43 (0.02)
Rubber Planted in 2000Main Product
Latex - - - - - - - - 2.22 1.83 1.83 By Product
Intercrop - - - - - - - - - - -
Appendix 11 53
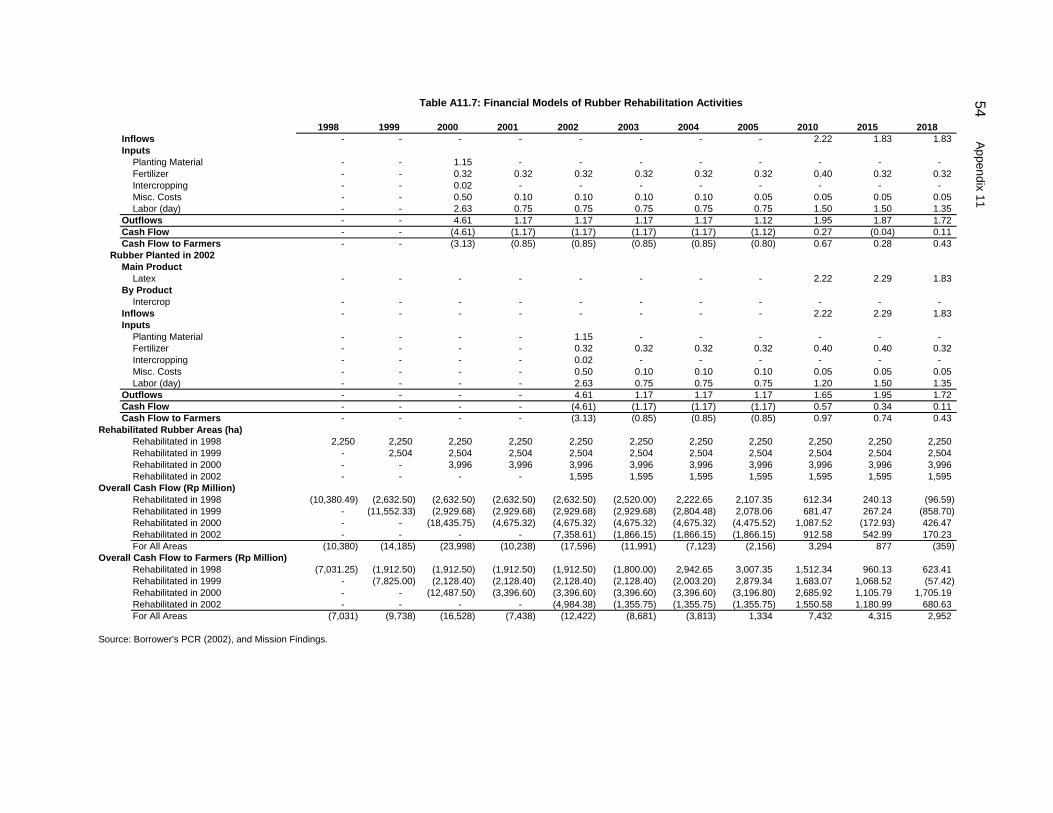
Table A11.7: Financial Models of Rubber Rehabilitation Activities
1998 1999 2000 2001 2002 2003 2004 2005 2010 2015 2018Inflows - - - - - - - - 2.22 1.83 1.83 Inputs
Planting Material - - 1.15 - - - - - - - - Fertilizer - - 0.32 0.32 0.32 0.32 0.32 0.32 0.40 0.32 0.32 Intercropping - - 0.02 - - - - - - - - Misc. Costs - - 0.50 0.10 0.10 0.10 0.10 0.05 0.05 0.05 0.05 Labor (day) - - 2.63 0.75 0.75 0.75 0.75 0.75 1.50 1.50 1.35
Outflows - - 4.61 1.17 1.17 1.17 1.17 1.12 1.95 1.87 1.72 Cash Flow - - (4.61) (1.17) (1.17) (1.17) (1.17) (1.12) 0.27 (0.04) 0.11 Cash Flow to Farmers - - (3.13) (0.85) (0.85) (0.85) (0.85) (0.80) 0.67 0.28 0.43
Rubber Planted in 2002Main Product
Latex - - - - - - - - 2.22 2.29 1.83 By Product
Intercrop - - - - - - - - - - - Inflows - - - - - - - - 2.22 2.29 1.83 Inputs
Planting Material - - - - 1.15 - - - - - - Fertilizer - - - - 0.32 0.32 0.32 0.32 0.40 0.40 0.32 Intercropping - - - - 0.02 - - - - - - Misc. Costs - - - - 0.50 0.10 0.10 0.10 0.05 0.05 0.05 Labor (day) - - - - 2.63 0.75 0.75 0.75 1.20 1.50 1.35
Outflows - - - - 4.61 1.17 1.17 1.17 1.65 1.95 1.72 Cash Flow - - - - (4.61) (1.17) (1.17) (1.17) 0.57 0.34 0.11 Cash Flow to Farmers - - - - (3.13) (0.85) (0.85) (0.85) 0.97 0.74 0.43
Rehabilitated Rubber Areas (ha)Rehabilitated in 1998 2,250 2,250 2,250 2,250 2,250 2,250 2,250 2,250 2,250 2,250 2,250 Rehabilitated in 1999 - 2,504 2,504 2,504 2,504 2,504 2,504 2,504 2,504 2,504 2,504 Rehabilitated in 2000 - - 3,996 3,996 3,996 3,996 3,996 3,996 3,996 3,996 3,996 Rehabilitated in 2002 - - - - 1,595 1,595 1,595 1,595 1,595 1,595 1,595
Overall Cash Flow (Rp Million)Rehabilitated in 1998 (10,380.49) (2,632.50) (2,632.50) (2,632.50) (2,632.50) (2,520.00) 2,222.65 2,107.35 612.34 240.13 (96.59) Rehabilitated in 1999 - (11,552.33) (2,929.68) (2,929.68) (2,929.68) (2,929.68) (2,804.48) 2,078.06 681.47 267.24 (858.70) Rehabilitated in 2000 - - (18,435.75) (4,675.32) (4,675.32) (4,675.32) (4,675.32) (4,475.52) 1,087.52 (172.93) 426.47 Rehabilitated in 2002 - - - - (7,358.61) (1,866.15) (1,866.15) (1,866.15) 912.58 542.99 170.23 For All Areas (10,380) (14,185) (23,998) (10,238) (17,596) (11,991) (7,123) (2,156) 3,294 877 (359)
Overall Cash Flow to Farmers (Rp Million)Rehabilitated in 1998 (7,031.25) (1,912.50) (1,912.50) (1,912.50) (1,912.50) (1,800.00) 2,942.65 3,007.35 1,512.34 960.13 623.41 Rehabilitated in 1999 - (7,825.00) (2,128.40) (2,128.40) (2,128.40) (2,128.40) (2,003.20) 2,879.34 1,683.07 1,068.52 (57.42) Rehabilitated in 2000 - - (12,487.50) (3,396.60) (3,396.60) (3,396.60) (3,396.60) (3,196.80) 2,685.92 1,105.79 1,705.19 Rehabilitated in 2002 - - - - (4,984.38) (1,355.75) (1,355.75) (1,355.75) 1,550.58 1,180.99 680.63 For All Areas (7,031) (9,738) (16,528) (7,438) (12,422) (8,681) (3,813) 1,334 7,432 4,315 2,952
Source: Borrower's PCR (2002), and Mission Findings.
54 Appendix 11
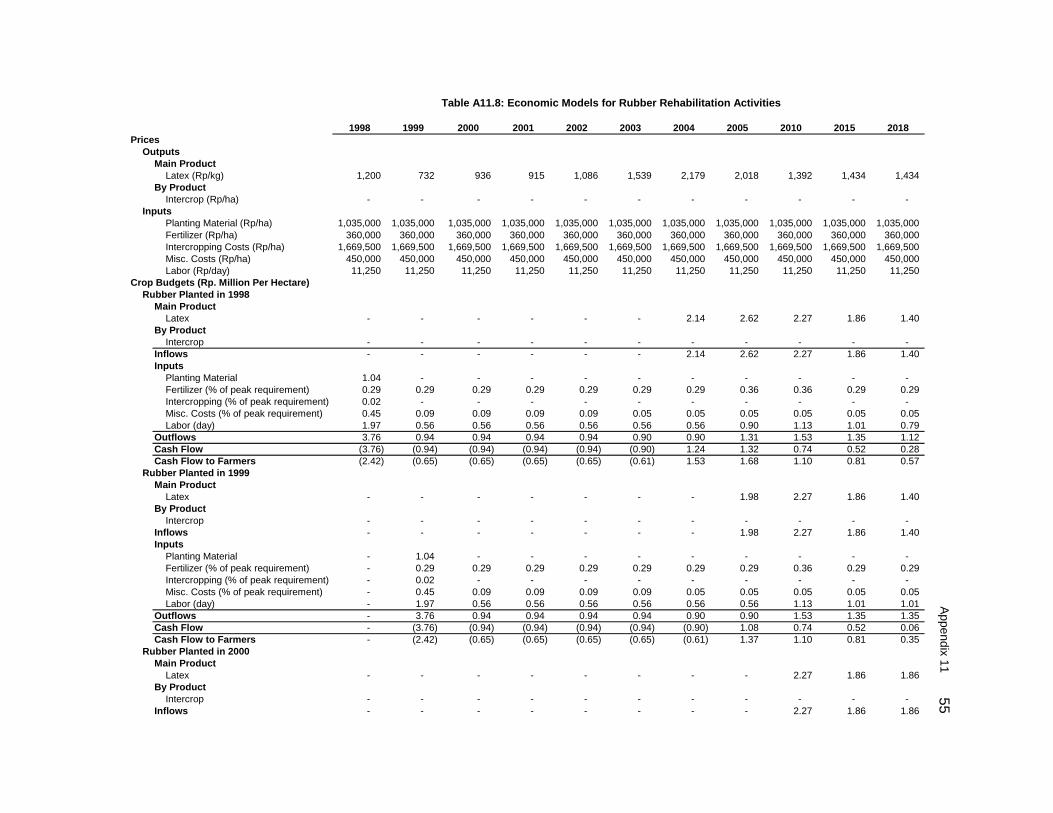
Table A11.8: Economic Models for Rubber Rehabilitation Activities
1998 1999 2000 2001 2002 2003 2004 2005 2010 2015 2018Prices
OutputsMain Product
Latex (Rp/kg) 1,200 732 936 915 1,086 1,539 2,179 2,018 1,392 1,434 1,434 By Product
Intercrop (Rp/ha) - - - - - - - - - - - Inputs
Planting Material (Rp/ha) 1,035,000 1,035,000 1,035,000 1,035,000 1,035,000 1,035,000 1,035,000 1,035,000 1,035,000 1,035,000 1,035,000Fertilizer (Rp/ha) 360,000 360,000 360,000 360,000 360,000 360,000 360,000 360,000 360,000 360,000 360,000 Intercropping Costs (Rp/ha) 1,669,500 1,669,500 1,669,500 1,669,500 1,669,500 1,669,500 1,669,500 1,669,500 1,669,500 1,669,500 1,669,500Misc. Costs (Rp/ha) 450,000 450,000 450,000 450,000 450,000 450,000 450,000 450,000 450,000 450,000 450,000 Labor (Rp/day) 11,250 11,250 11,250 11,250 11,250 11,250 11,250 11,250 11,250 11,250 11,250
Crop Budgets (Rp. Million Per Hectare)Rubber Planted in 1998
Main ProductLatex - - - - - - 2.14 2.62 2.27 1.86 1.40
By ProductIntercrop - - - - - - - - - - -
Inflows - - - - - - 2.14 2.62 2.27 1.86 1.40 Inputs
Planting Material 1.04 - - - - - - - - - - Fertilizer (% of peak requirement) 0.29 0.29 0.29 0.29 0.29 0.29 0.29 0.36 0.36 0.29 0.29 Intercropping (% of peak requirement) 0.02 - - - - - - - - - - Misc. Costs (% of peak requirement) 0.45 0.09 0.09 0.09 0.09 0.05 0.05 0.05 0.05 0.05 0.05 Labor (day) 1.97 0.56 0.56 0.56 0.56 0.56 0.56 0.90 1.13 1.01 0.79
Outflows 3.76 0.94 0.94 0.94 0.94 0.90 0.90 1.31 1.53 1.35 1.12 Cash Flow (3.76) (0.94) (0.94) (0.94) (0.94) (0.90) 1.24 1.32 0.74 0.52 0.28 Cash Flow to Farmers (2.42) (0.65) (0.65) (0.65) (0.65) (0.61) 1.53 1.68 1.10 0.81 0.57
Rubber Planted in 1999Main Product
Latex - - - - - - - 1.98 2.27 1.86 1.40 By Product
Intercrop - - - - - - - - - - - Inflows - - - - - - - 1.98 2.27 1.86 1.40 Inputs
Planting Material - 1.04 - - - - - - - - - Fertilizer (% of peak requirement) - 0.29 0.29 0.29 0.29 0.29 0.29 0.29 0.36 0.29 0.29 Intercropping (% of peak requirement) - 0.02 - - - - - - - - - Misc. Costs (% of peak requirement) - 0.45 0.09 0.09 0.09 0.09 0.05 0.05 0.05 0.05 0.05 Labor (day) - 1.97 0.56 0.56 0.56 0.56 0.56 0.56 1.13 1.01 1.01
Outflows - 3.76 0.94 0.94 0.94 0.94 0.90 0.90 1.53 1.35 1.35 Cash Flow - (3.76) (0.94) (0.94) (0.94) (0.94) (0.90) 1.08 0.74 0.52 0.06 Cash Flow to Farmers - (2.42) (0.65) (0.65) (0.65) (0.65) (0.61) 1.37 1.10 0.81 0.35
Rubber Planted in 2000Main Product
Latex - - - - - - - - 2.27 1.86 1.86 By Product
Intercrop - - - - - - - - - - - Inflows - - - - - - - - 2.27 1.86 1.86
Appendix 11 55
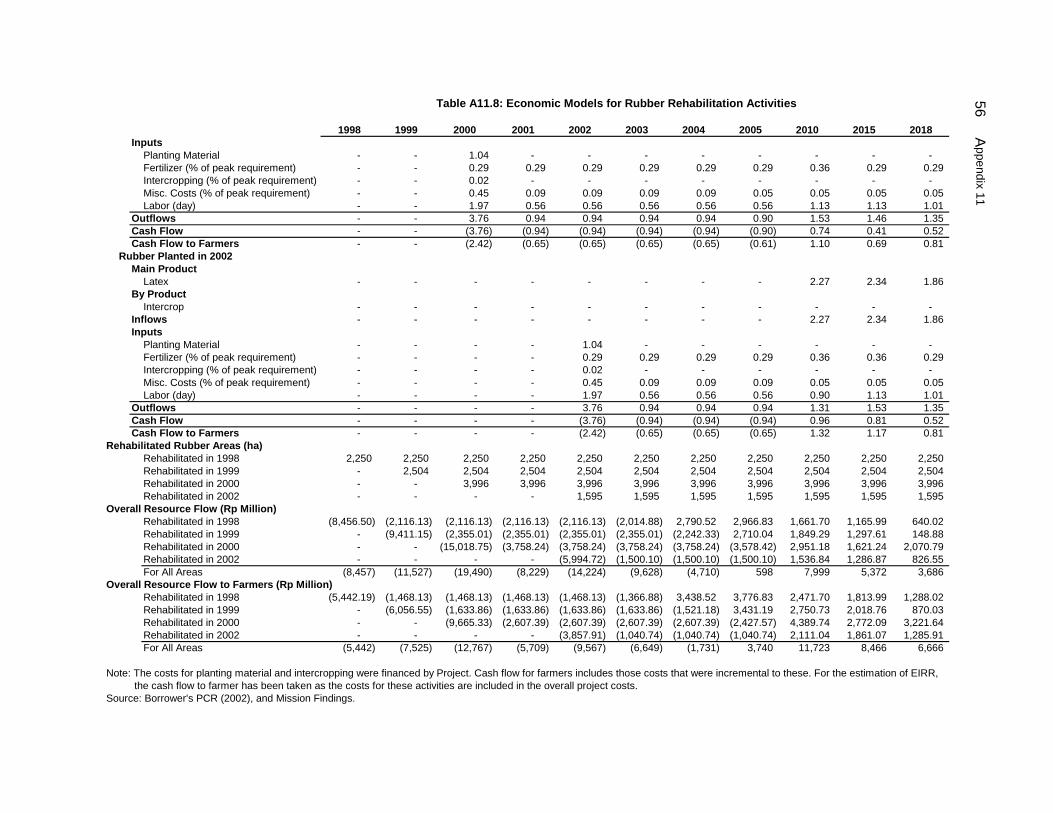
Table A11.8: Economic Models for Rubber Rehabilitation Activities
1998 1999 2000 2001 2002 2003 2004 2005 2010 2015 2018Inputs
Planting Material - - 1.04 - - - - - - - - Fertilizer (% of peak requirement) - - 0.29 0.29 0.29 0.29 0.29 0.29 0.36 0.29 0.29 Intercropping (% of peak requirement) - - 0.02 - - - - - - - - Misc. Costs (% of peak requirement) - - 0.45 0.09 0.09 0.09 0.09 0.05 0.05 0.05 0.05 Labor (day) - - 1.97 0.56 0.56 0.56 0.56 0.56 1.13 1.13 1.01
Outflows - - 3.76 0.94 0.94 0.94 0.94 0.90 1.53 1.46 1.35 Cash Flow - - (3.76) (0.94) (0.94) (0.94) (0.94) (0.90) 0.74 0.41 0.52 Cash Flow to Farmers - - (2.42) (0.65) (0.65) (0.65) (0.65) (0.61) 1.10 0.69 0.81
Rubber Planted in 2002Main Product
Latex - - - - - - - - 2.27 2.34 1.86 By Product
Intercrop - - - - - - - - - - - Inflows - - - - - - - - 2.27 2.34 1.86 Inputs
Planting Material - - - - 1.04 - - - - - - Fertilizer (% of peak requirement) - - - - 0.29 0.29 0.29 0.29 0.36 0.36 0.29 Intercropping (% of peak requirement) - - - - 0.02 - - - - - - Misc. Costs (% of peak requirement) - - - - 0.45 0.09 0.09 0.09 0.05 0.05 0.05 Labor (day) - - - - 1.97 0.56 0.56 0.56 0.90 1.13 1.01
Outflows - - - - 3.76 0.94 0.94 0.94 1.31 1.53 1.35 Cash Flow - - - - (3.76) (0.94) (0.94) (0.94) 0.96 0.81 0.52 Cash Flow to Farmers - - - - (2.42) (0.65) (0.65) (0.65) 1.32 1.17 0.81
Rehabilitated Rubber Areas (ha)Rehabilitated in 1998 2,250 2,250 2,250 2,250 2,250 2,250 2,250 2,250 2,250 2,250 2,250 Rehabilitated in 1999 - 2,504 2,504 2,504 2,504 2,504 2,504 2,504 2,504 2,504 2,504 Rehabilitated in 2000 - - 3,996 3,996 3,996 3,996 3,996 3,996 3,996 3,996 3,996 Rehabilitated in 2002 - - - - 1,595 1,595 1,595 1,595 1,595 1,595 1,595
Overall Resource Flow (Rp Million)Rehabilitated in 1998 (8,456.50) (2,116.13) (2,116.13) (2,116.13) (2,116.13) (2,014.88) 2,790.52 2,966.83 1,661.70 1,165.99 640.02 Rehabilitated in 1999 - (9,411.15) (2,355.01) (2,355.01) (2,355.01) (2,355.01) (2,242.33) 2,710.04 1,849.29 1,297.61 148.88 Rehabilitated in 2000 - - (15,018.75) (3,758.24) (3,758.24) (3,758.24) (3,758.24) (3,578.42) 2,951.18 1,621.24 2,070.79 Rehabilitated in 2002 - - - - (5,994.72) (1,500.10) (1,500.10) (1,500.10) 1,536.84 1,286.87 826.55 For All Areas (8,457) (11,527) (19,490) (8,229) (14,224) (9,628) (4,710) 598 7,999 5,372 3,686
Overall Resource Flow to Farmers (Rp Million)Rehabilitated in 1998 (5,442.19) (1,468.13) (1,468.13) (1,468.13) (1,468.13) (1,366.88) 3,438.52 3,776.83 2,471.70 1,813.99 1,288.02 Rehabilitated in 1999 - (6,056.55) (1,633.86) (1,633.86) (1,633.86) (1,633.86) (1,521.18) 3,431.19 2,750.73 2,018.76 870.03 Rehabilitated in 2000 - - (9,665.33) (2,607.39) (2,607.39) (2,607.39) (2,607.39) (2,427.57) 4,389.74 2,772.09 3,221.64 Rehabilitated in 2002 - - - - (3,857.91) (1,040.74) (1,040.74) (1,040.74) 2,111.04 1,861.07 1,285.91 For All Areas (5,442) (7,525) (12,767) (5,709) (9,567) (6,649) (1,731) 3,740 11,723 8,466 6,666
Note: The costs for planting material and intercropping were financed by Project. Cash flow for farmers includes those costs that were incremental to these. For the estimation of EIRR, the cash flow to farmer has been taken as the costs for these activities are included in the overall project costs.
Source: Borrower's PCR (2002), and Mission Findings.
56 Appendix 11
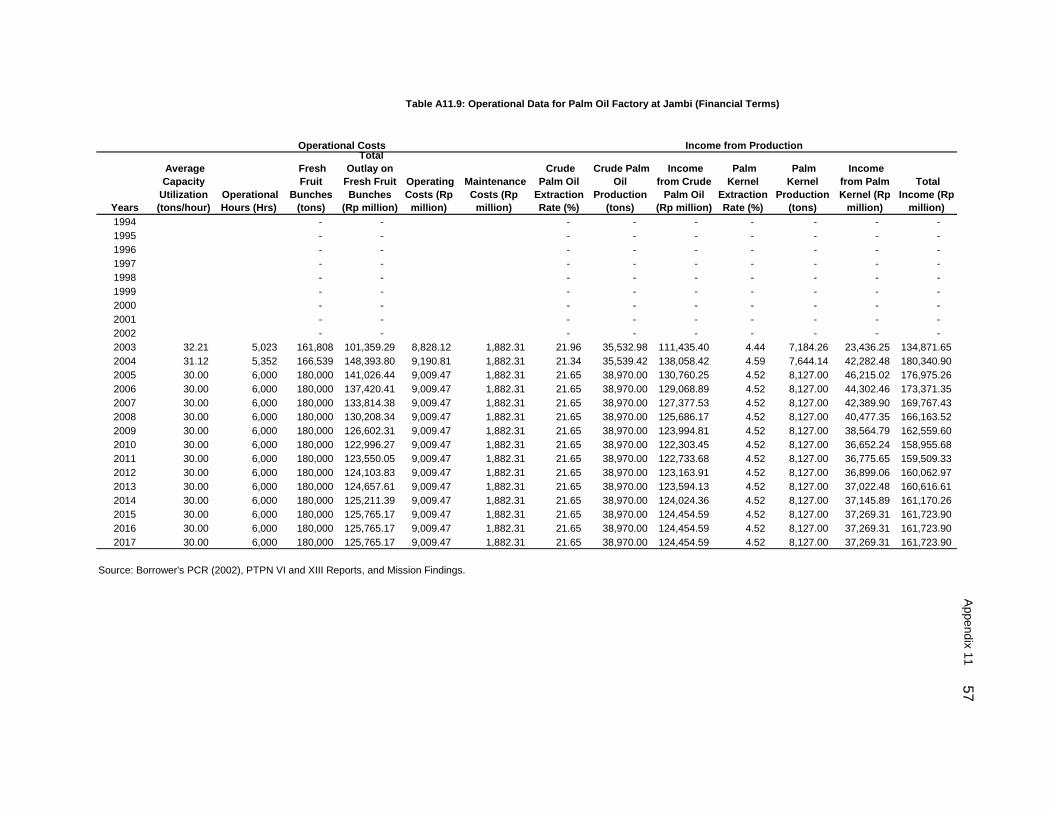
Table A11.9: Operational Data for Palm Oil Factory at Jambi (Financial Terms)
Years
Average Capacity
Utilization (tons/hour)
Operational Hours (Hrs)
Fresh Fruit
Bunches (tons)
Total Outlay on
Fresh Fruit Bunches
(Rp million)
Operating Costs (Rp
million)
Maintenance Costs (Rp
million)
Crude Palm Oil
Extraction Rate (%)
Crude Palm Oil
Production (tons)
Income from Crude
Palm Oil (Rp million)
Palm Kernel
Extraction Rate (%)
Palm Kernel
Production (tons)
Income from Palm Kernel (Rp
million)
Total Income (Rp
million) 1994 - - - - - - - - - 1995 - - - - - - - - - 1996 - - - - - - - - - 1997 - - - - - - - - - 1998 - - - - - - - - - 1999 - - - - - - - - - 2000 - - - - - - - - - 2001 - - - - - - - - - 2002 - - - - - - - - - 2003 32.21 5,023 161,808 101,359.29 8,828.12 1,882.31 21.96 35,532.98 111,435.40 4.44 7,184.26 23,436.25 134,871.65 2004 31.12 5,352 166,539 148,393.80 9,190.81 1,882.31 21.34 35,539.42 138,058.42 4.59 7,644.14 42,282.48 180,340.90 2005 30.00 6,000 180,000 141,026.44 9,009.47 1,882.31 21.65 38,970.00 130,760.25 4.52 8,127.00 46,215.02 176,975.26 2006 30.00 6,000 180,000 137,420.41 9,009.47 1,882.31 21.65 38,970.00 129,068.89 4.52 8,127.00 44,302.46 173,371.35 2007 30.00 6,000 180,000 133,814.38 9,009.47 1,882.31 21.65 38,970.00 127,377.53 4.52 8,127.00 42,389.90 169,767.43 2008 30.00 6,000 180,000 130,208.34 9,009.47 1,882.31 21.65 38,970.00 125,686.17 4.52 8,127.00 40,477.35 166,163.52 2009 30.00 6,000 180,000 126,602.31 9,009.47 1,882.31 21.65 38,970.00 123,994.81 4.52 8,127.00 38,564.79 162,559.60 2010 30.00 6,000 180,000 122,996.27 9,009.47 1,882.31 21.65 38,970.00 122,303.45 4.52 8,127.00 36,652.24 158,955.68 2011 30.00 6,000 180,000 123,550.05 9,009.47 1,882.31 21.65 38,970.00 122,733.68 4.52 8,127.00 36,775.65 159,509.33 2012 30.00 6,000 180,000 124,103.83 9,009.47 1,882.31 21.65 38,970.00 123,163.91 4.52 8,127.00 36,899.06 160,062.97 2013 30.00 6,000 180,000 124,657.61 9,009.47 1,882.31 21.65 38,970.00 123,594.13 4.52 8,127.00 37,022.48 160,616.61 2014 30.00 6,000 180,000 125,211.39 9,009.47 1,882.31 21.65 38,970.00 124,024.36 4.52 8,127.00 37,145.89 161,170.26 2015 30.00 6,000 180,000 125,765.17 9,009.47 1,882.31 21.65 38,970.00 124,454.59 4.52 8,127.00 37,269.31 161,723.90 2016 30.00 6,000 180,000 125,765.17 9,009.47 1,882.31 21.65 38,970.00 124,454.59 4.52 8,127.00 37,269.31 161,723.90 2017 30.00 6,000 180,000 125,765.17 9,009.47 1,882.31 21.65 38,970.00 124,454.59 4.52 8,127.00 37,269.31 161,723.90
Source: Borrower's PCR (2002), PTPN VI and XIII Reports, and Mission Findings.
Operational Costs Income from Production
Appendix 11 57

Table A11.10: Operational Data for Palm Oil Factory at Longkali (Financial Terms)
Years
Average Capacity
Utilization (tons/hour)
Operational Hours (Hrs)
Fresh Fruit
Bunches (tons)
Total Outlay on Fresh Fruit Bunches (Rp
million)
Operating Costs (Rp
million)
Maintenance Costs (Rp
million)
Crude Palm Oil
Extraction Rate (%)
Crude Palm Oil
Production (tons)
Income from Crude Palm
Oil (Rp million)
Palm Kernel
Extraction Rate (%)
Palm Kernel
Production (tons)
Income from Palm Kernel (Rp
million) 1994 - - - - - - - - 1995 - - - - - - - - 1996 - - - - - - - - 1997 - - - - - - - - 1998 - - - - - - - - 1999 - - - - - - - - 2000 - - - - - - - - 2001 - - - - - - - - 2002 6.73 5,700 38,361 21,481.08 2,965.16 1,980.66 21.65 8,305.24 23,800.86 4.52 1,732.02 5,346.57 2003 8.09 6,000 48,569 30,424.22 2,965.16 1,980.66 21.65 10,515.09 32,976.50 4.52 2,192.87 7,153.50 2004 10.83 6,000 64,979 57,899.57 7,851.20 1,980.66 21.65 14,068.03 54,649.47 4.52 2,933.82 16,228.00 2005 10.83 6,000 64,979 50,910.05 7,851.20 1,980.66 21.65 14,068.03 47,203.99 4.52 2,933.82 16,683.46 2006 14.66 6,000 87,983 67,170.71 7,851.20 1,980.66 21.65 19,048.43 63,088.51 4.52 3,972.45 21,654.92 2007 18.50 6,000 110,988 82,509.66 7,851.20 1,980.66 21.65 24,028.82 78,540.72 4.52 5,011.09 26,137.53 2008 22.33 6,000 133,992 96,926.91 7,851.20 1,980.66 21.65 29,009.21 93,560.61 4.52 6,049.73 30,131.28 2009 30.00 6,000 180,000 126,602.31 7,851.20 1,980.66 21.65 38,970.00 123,994.81 4.52 8,127.00 38,564.79 2010 30.00 6,000 180,000 122,996.27 7,851.20 1,980.66 21.65 38,970.00 122,303.45 4.52 8,127.00 36,652.24 2011 30.00 6,000 180,000 123,550.05 7,851.20 1,980.66 21.65 38,970.00 122,733.68 4.52 8,127.00 36,775.65 2012 30.00 6,000 180,000 124,103.83 7,851.20 1,980.66 21.65 38,970.00 123,163.91 4.52 8,127.00 36,899.06 2013 30.00 6,000 180,000 124,657.61 7,851.20 1,980.66 21.65 38,970.00 123,594.13 4.52 8,127.00 37,022.48 2014 30.00 6,000 180,000 125,211.39 7,851.20 1,980.66 21.65 38,970.00 124,024.36 4.52 8,127.00 37,145.89 2015 30.00 6,000 180,000 125,765.17 7,851.20 1,980.66 21.65 38,970.00 124,454.59 4.52 8,127.00 37,269.31 2016 30.00 6,000 180,000 125,765.17 7,851.20 1,980.66 21.65 38,970.00 124,454.59 4.52 8,127.00 37,269.31
Source: Borrower's PCR (2002), PTPN VI and XIII Reports, and Mission Findings.
Operational Costs Income from Production
58 Appendix 11
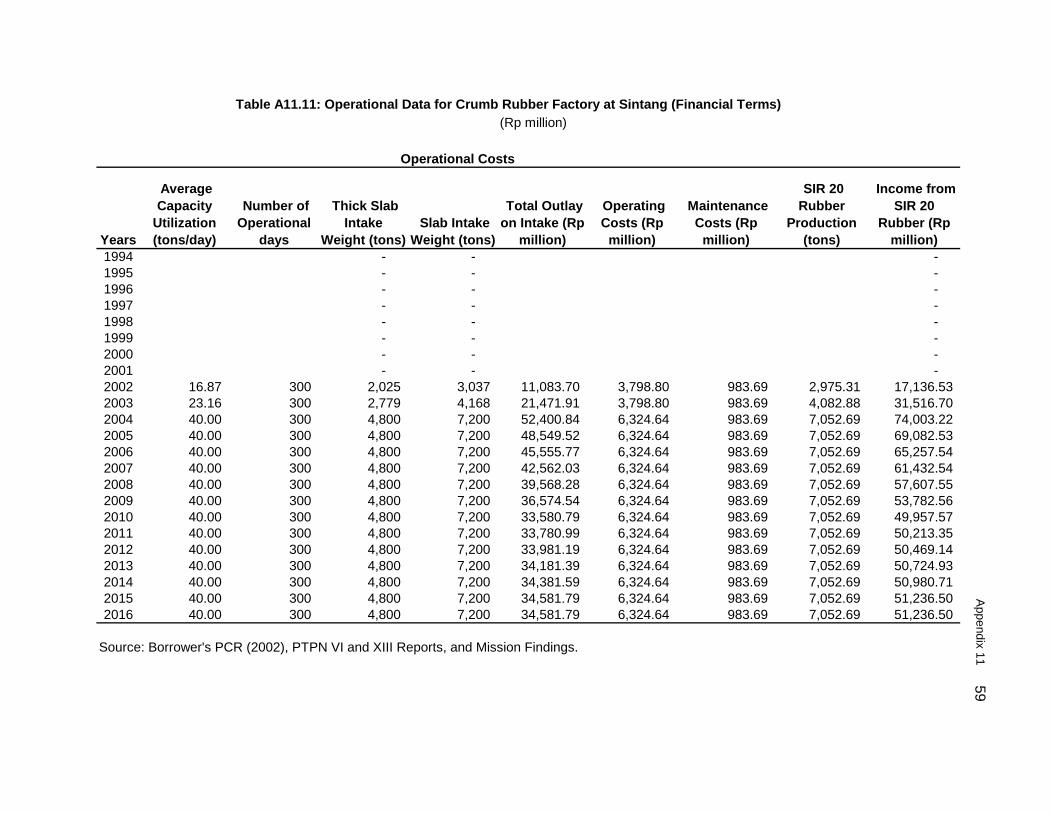
Table A11.11: Operational Data for Crumb Rubber Factory at Sintang (Financial Terms)(Rp million)
Years
Average Capacity
Utilization (tons/day)
Number of Operational
days
Thick Slab Intake
Weight (tons) Slab Intake
Weight (tons)
Total Outlay on Intake (Rp
million)
Operating Costs (Rp
million)
Maintenance Costs (Rp
million)
SIR 20 Rubber
Production (tons)
Income from SIR 20
Rubber (Rp million)
1994 - - - 1995 - - - 1996 - - - 1997 - - - 1998 - - - 1999 - - - 2000 - - - 2001 - - - 2002 16.87 300 2,025 3,037 11,083.70 3,798.80 983.69 2,975.31 17,136.53 2003 23.16 300 2,779 4,168 21,471.91 3,798.80 983.69 4,082.88 31,516.70 2004 40.00 300 4,800 7,200 52,400.84 6,324.64 983.69 7,052.69 74,003.22 2005 40.00 300 4,800 7,200 48,549.52 6,324.64 983.69 7,052.69 69,082.53 2006 40.00 300 4,800 7,200 45,555.77 6,324.64 983.69 7,052.69 65,257.54 2007 40.00 300 4,800 7,200 42,562.03 6,324.64 983.69 7,052.69 61,432.54 2008 40.00 300 4,800 7,200 39,568.28 6,324.64 983.69 7,052.69 57,607.55 2009 40.00 300 4,800 7,200 36,574.54 6,324.64 983.69 7,052.69 53,782.56 2010 40.00 300 4,800 7,200 33,580.79 6,324.64 983.69 7,052.69 49,957.57 2011 40.00 300 4,800 7,200 33,780.99 6,324.64 983.69 7,052.69 50,213.35 2012 40.00 300 4,800 7,200 33,981.19 6,324.64 983.69 7,052.69 50,469.14 2013 40.00 300 4,800 7,200 34,181.39 6,324.64 983.69 7,052.69 50,724.93 2014 40.00 300 4,800 7,200 34,381.59 6,324.64 983.69 7,052.69 50,980.71 2015 40.00 300 4,800 7,200 34,581.79 6,324.64 983.69 7,052.69 51,236.50 2016 40.00 300 4,800 7,200 34,581.79 6,324.64 983.69 7,052.69 51,236.50
Source: Borrower's PCR (2002), PTPN VI and XIII Reports, and Mission Findings.
Operational Costs
Appendix 11 59
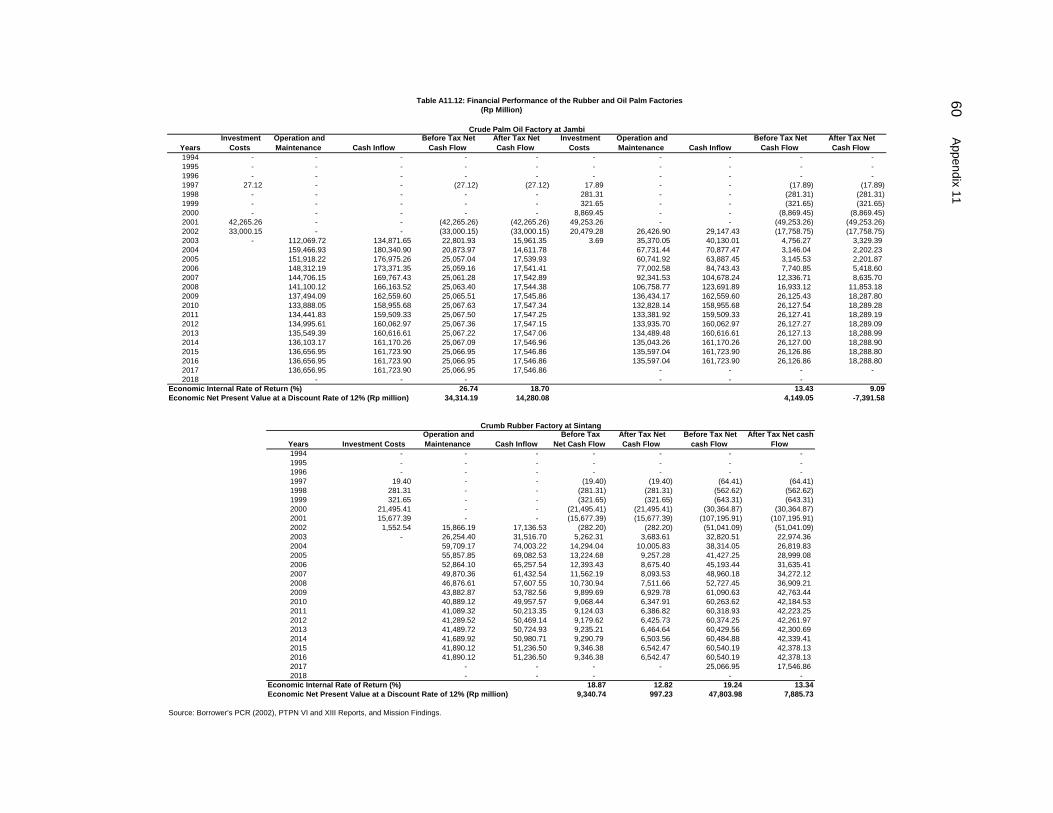
Table A11.12: Financial Performance of the Rubber and Oil Palm Factories(Rp Million)
Years Investment
Costs Operation and Maintenance Cash Inflow
Before Tax Net Cash Flow
After Tax Net Cash Flow
Investment Costs
Operation and Maintenance Cash Inflow
Before Tax Net Cash Flow
After Tax Net Cash Flow
1994 - - - - - - - - - - 1995 - - - - - - - - - - 1996 - - - - - - - - - - 1997 27.12 - - (27.12) (27.12) 17.89 - - (17.89) (17.89) 1998 - - - - - 281.31 - - (281.31) (281.31) 1999 - - - - - 321.65 - - (321.65) (321.65) 2000 - - - - - 8,869.45 - - (8,869.45) (8,869.45) 2001 42,265.26 - - (42,265.26) (42,265.26) 49,253.26 - - (49,253.26) (49,253.26) 2002 33,000.15 - - (33,000.15) (33,000.15) 20,479.28 26,426.90 29,147.43 (17,758.75) (17,758.75) 2003 - 112,069.72 134,871.65 22,801.93 15,961.35 3.69 35,370.05 40,130.01 4,756.27 3,329.39 2004 159,466.93 180,340.90 20,873.97 14,611.78 67,731.44 70,877.47 3,146.04 2,202.23 2005 151,918.22 176,975.26 25,057.04 17,539.93 60,741.92 63,887.45 3,145.53 2,201.87 2006 148,312.19 173,371.35 25,059.16 17,541.41 77,002.58 84,743.43 7,740.85 5,418.60 2007 144,706.15 169,767.43 25,061.28 17,542.89 92,341.53 104,678.24 12,336.71 8,635.70 2008 141,100.12 166,163.52 25,063.40 17,544.38 106,758.77 123,691.89 16,933.12 11,853.18 2009 137,494.09 162,559.60 25,065.51 17,545.86 136,434.17 162,559.60 26,125.43 18,287.80 2010 133,888.05 158,955.68 25,067.63 17,547.34 132,828.14 158,955.68 26,127.54 18,289.28 2011 134,441.83 159,509.33 25,067.50 17,547.25 133,381.92 159,509.33 26,127.41 18,289.19 2012 134,995.61 160,062.97 25,067.36 17,547.15 133,935.70 160,062.97 26,127.27 18,289.09 2013 135,549.39 160,616.61 25,067.22 17,547.06 134,489.48 160,616.61 26,127.13 18,288.99 2014 136,103.17 161,170.26 25,067.09 17,546.96 135,043.26 161,170.26 26,127.00 18,288.90 2015 136,656.95 161,723.90 25,066.95 17,546.86 135,597.04 161,723.90 26,126.86 18,288.80 2016 136,656.95 161,723.90 25,066.95 17,546.86 135,597.04 161,723.90 26,126.86 18,288.80 2017 136,656.95 161,723.90 25,066.95 17,546.86 - - - - 2018 - - - - - -
Economic Internal Rate of Return (%) 26.74 18.70 13.43 9.09Economic Net Present Value at a Discount Rate of 12% (Rp million) 34,314.19 14,280.08 4,149.05 -7,391.58
Years Investment Costs Operation and Maintenance Cash Inflow
Before Tax Net Cash Flow
After Tax Net Cash Flow
Before Tax Net cash Flow
After Tax Net cash Flow
1994 - - - - - - - 1995 - - - - - - - 1996 - - - - - - - 1997 19.40 - - (19.40) (19.40) (64.41) (64.41) 1998 281.31 - - (281.31) (281.31) (562.62) (562.62) 1999 321.65 - - (321.65) (321.65) (643.31) (643.31) 2000 21,495.41 - - (21,495.41) (21,495.41) (30,364.87) (30,364.87) 2001 15,677.39 - - (15,677.39) (15,677.39) (107,195.91) (107,195.91) 2002 1,552.54 15,866.19 17,136.53 (282.20) (282.20) (51,041.09) (51,041.09) 2003 - 26,254.40 31,516.70 5,262.31 3,683.61 32,820.51 22,974.36 2004 59,709.17 74,003.22 14,294.04 10,005.83 38,314.05 26,819.83 2005 55,857.85 69,082.53 13,224.68 9,257.28 41,427.25 28,999.08 2006 52,864.10 65,257.54 12,393.43 8,675.40 45,193.44 31,635.41 2007 49,870.36 61,432.54 11,562.19 8,093.53 48,960.18 34,272.12 2008 46,876.61 57,607.55 10,730.94 7,511.66 52,727.45 36,909.21 2009 43,882.87 53,782.56 9,899.69 6,929.78 61,090.63 42,763.44 2010 40,889.12 49,957.57 9,068.44 6,347.91 60,263.62 42,184.53 2011 41,089.32 50,213.35 9,124.03 6,386.82 60,318.93 42,223.25 2012 41,289.52 50,469.14 9,179.62 6,425.73 60,374.25 42,261.97 2013 41,489.72 50,724.93 9,235.21 6,464.64 60,429.56 42,300.69 2014 41,689.92 50,980.71 9,290.79 6,503.56 60,484.88 42,339.41 2015 41,890.12 51,236.50 9,346.38 6,542.47 60,540.19 42,378.13 2016 41,890.12 51,236.50 9,346.38 6,542.47 60,540.19 42,378.13 2017 - - - - 25,066.95 17,546.86 2018 - - - - -
Economic Internal Rate of Return (%) 18.87 12.82 19.24 13.34Economic Net Present Value at a Discount Rate of 12% (Rp million) 9,340.74 997.23 47,803.98 7,885.73
Source: Borrower's PCR (2002), PTPN VI and XIII Reports, and Mission Findings.
Crude Palm Oil Factory at Jambi
Crumb Rubber Factory at Sintang
60 Appendix 11

1994 37,406.65 8,217.62 8,217.62 (37,406.65) - (37,406.65) 1995 30,747.55 26,281.31 28,226.37 (28,802.48) - - (28,802.48) 1996 34,116.94 19,014.41 22,469.82 (30,661.52) - - (30,661.52) 1997 37,980.45 11,899.33 15,608.57 (34,271.21) 57.96 (57.96) (34,329.17) 1998 27,223.85 61,517.80 75,221.66 (13,520.00) 506.36 (506.36) (14,026.36) 1999 37,490.72 33,588.30 37,791.35 (33,287.67) 578.97 (578.97) (33,866.65) 2000 25,268.83 45,738.36 50,553.74 (20,453.45) 30,200.76 (30,200.76) (50,654.21) 2001 14,809.34 44,499.35 55,911.37 (3,397.32) 105,472.82 (105,472.82) (108,870.14)2002 56,455.58 54,696.13 66,046.66 (45,105.05) 55,031.96 45,237.19 46,399.21 (53,869.94) (98,974.99) 2003 174.51 81,707.09 102,830.45 20,948.85 3.69 177,854.61 207,093.03 29,234.73 50,183.58 2004 - 119,937.84 154,112.35 34,174.52 - 291,753.95 325,858.70 34,104.75 68,279.27 2005 - 110,321.07 142,827.83 32,506.77 - 273,686.98 310,621.49 36,934.51 69,441.28 2006 - 102,845.68 136,000.74 33,155.07 - 283,868.15 324,108.75 40,240.61 73,395.68 2007 - 95,370.29 120,118.12 24,747.84 - 293,127.60 336,674.85 43,547.24 68,295.08 2008 - 87,894.89 109,237.52 21,342.62 - 301,465.35 348,319.78 46,854.42 68,197.05 2009 - 80,419.50 96,834.40 16,414.89 - 325,581.54 379,878.96 54,297.42 70,712.31 2010 - 72,944.11 86,295.93 13,351.82 - 315,375.73 368,846.14 53,470.41 66,822.22 2011 - 73,444.01 86,795.83 13,351.82 - 316,683.49 370,209.21 53,525.72 66,877.54 2012 - 73,943.91 87,295.73 13,351.82 - 317,991.25 371,572.28 53,581.04 66,932.85 2013 - 74,443.81 87,795.63 13,351.82 - 319,299.01 372,935.36 53,636.35 66,988.17 2014 - 74,943.71 88,295.53 13,351.82 - 320,606.77 374,298.43 53,691.66 67,043.48 2015 - 75,443.61 88,795.42 13,351.82 - 321,914.52 375,661.50 53,746.98 67,098.79 2016 - 75,443.61 88,795.42 13,351.82 - 321,914.52 375,661.50 53,746.98 67,098.79 2017 - 75,443.61 88,795.42 13,351.82 - 142,741.06 162,194.87 19,453.81 32,805.62 2018 - 75,443.61 88,795.42 13,351.82 - - - - 13,351.82
Economic Internal Rate of Return (%) 3.64 17.15 9.72Economic Net Present Value at a Discount Rate of 12% (Rp million) -69,702.46 32,628.13 -37,074.33
Sensitivity AnalysisParts A & C Part B Overall Project
Base Case 3.64 17.15 9.72Sheet and Slab Prices 10% Lower than the Forecast 3.45 18.02 10.08Crumb Rubber Prices 10% Lower than the Forecast 3.64 15.81 9.05Crude Palm Oil Prices 10% Lower than the Forecast 3.64 10.45 6.41Palm Kernel Prices 10% Lower than the Forecast 3.64 15.37 8.81
Source: Mission's Estimates.
Table A11.13: Assessment of the Economic Performance(Rp Million)
Net Resource Flow
Operation and Maintenance in 2005 Economic
Terms
With Project Resource Flow in 2005 Economic
Terms
Investment Costs in 2005
Economic Terms
Parts A and C Part B
Net Resource Flow for Overall Project
With Project Resource Flow in 2005 Economic
Terms Net Resource
Flow Year
Investment Costs in 2005
Economic Terms
Without Project Resource Flow in 2005 Economic
Terms
Appendix 11 61


![ASIAN DEVELOPMENT BANK DEVELOPMENT BANK PCR: INO 24281 PROJECT COMPLETION REPORT ON THE SULAWESI RAIN-FED AGRICULTURE DEVELOPMENT PROJECT (Loan 1351-INO[SF]) IN INDONESIA ... CURRENCY](https://img.pdfslide.net/doc/110x75/5b2803dd7f8b9a03778b489c/asian-development-bank-development-bank-pcr-ino-24281-project-completion-report.jpg)