Embed Size (px)
Citation preview
Project Design Document (PDD) for a Waste to Energy (WTE) NAMA in The Republic of Moldova
Page 1 of 107
Project Design Document (PDD) for a Waste to Energy (WTE) NAMA in The Republic of Moldova
Chisinau ● December 2016
Project Design Document (PDD) for a Waste to Energy (WTE) NAMA in The Republic of Moldova
Page 2 of 107
Contact Information
Climate Change Office, Ministry of Environment / [email protected] Silvia Pana-Carp, United Nations Development Programme (UNDP), Programme Analyst,
Sustainable Development Cluster / [email protected]
Technical Oversight and Guidance
Dr. Vasile Scorpan, Senior Project Manager, Project UNDP “Moldova LECBP”, Climate Change
Office of Ministry of Environment
Sergiu Ungureanu, Manager, Project “ Moldova LECBP”
Authors
Carbon Partners Asiatica Co., Ltd; Tatiana Tugui, National Consultant
Contributors
Dr. Ion Comendant, National consultants
Acknowledgements
We would like to acknowledge the following stakeholders for their participation in the NAMA process: Ministry of Environment; Ministry of Economy; Energy Efficiency Agency; Moldova Technical University;
Institute of Power Engineering ASM; “Termoelectrica” S.A.
Special thanks to James Vener, Technical Specialist, LECBP Climate Change & Disaster Risk Reduction, Bureau for Policy and Programme Support, UNDP for valuable comments and recommendations on NAMA
design document improvement
Disclaimer: The views expressed in this publication are those of the author(s) and do not necessarily
express the views of the United Nations Development Programme or its Executive Board.
Project Design Document (PDD) for a Waste to Energy (WTE) NAMA in The Republic of Moldova
Page 3 of 107
FORWARD
The UNDP Low Emission Capacity Building (LECB) Programme is a country-driven initiative that promotes
essential cooperation between relevant institutions, engaging the public sector and industry in a concerted effort to design and implement approaches to low emission development that are consistent
with national development priorities. National counterparts are supported to strengthen technical and
institutional capacities to identify and formulate Nationally Appropriate Mitigation Actions (NAMAs) and Low Emission Development Strategies (LEDS) in the public and private sectors, and to strengthen the
underlying greenhouse gas inventory management and Measurement, Reporting and Verification (MRV)
systems.
The LECB Programme runs through 2016 and is active in 25 countries: Argentina, Bhutan, Chile, China,
Colombia, Costa Rica, the Democratic Republic of Congo (DRC), Ecuador, Egypt, Ghana, Indonesia, Kenya, Lebanon, Malaysia, Mexico, Moldova, Morocco, Peru, Philippines, Tanzania, Thailand, Trinidad and
Tobago, Uganda, Vietnam and Zambia.
The programme is supported through generous contributions from the European Commission, the German Federal Ministry for the Environment, Nature Conservation, Building and Nuclear Safety (BMUB),
and the Government of Australia.
More information can be found at www.lowemissiondevelopment.org
Project Design Document (PDD) for a Waste to Energy (WTE) NAMA in The Republic of Moldova
Page 4 of 107
Contents
List of Boxes .............................................................................. Error! Bookmark not defined.
List of Figures ...................................................................................................................... 6
List of Tables ........................................................................................................................ 6
Executive Summary .......................................................................................................... 8
Abbreviations and Acronyms ..................................................................................... 10
1. Introduction to a waste to energy NAMA ................................................... 11
2. Background of the waste sector in the Republic of Moldova............. 13
2.1 Current situation and trends of the Sector ........................................................ 13
2.2 Relevant Stakeholders ................................................................................................ 16
2.3 Purpose and Objectives of the NAMA ................................................................... 17
3. Policy Analysis ......................................................................................................... 19
3.1 Relevant National and Sector Strategies and Policies .................................. 19
3.2 Alignment with National and Sector Strategies and Policies ..................... 20
4. Baseline Information and NAMA Targets .................................................... 22
4.1 Baseline boundary and scenario ............................................................................. 22
4.2 GHG baseline and mitigation targets .................................................................... 25 4.2.1 Calculation for collection of LFG and the destruction of the methane contained
within the LFG (Element 1) .........................................................................................................................25 4.2.2 Calculation for RE electricity generation (Element 2) .........................................................29 4.2.3 Totals for baseline and project emissions ...............................................................................30 4.2.4 Baseline and mitigation target for the RP ...............................................................................31 4.2.5 Baseline and mitigation target for the NAMA ........................................................................32
4.3 SD baseline and co-benefit targets ....................................................................... 32
4.4 Transformational Change .......................................................................................... 34
5. Measures & Interventions under the NAMA .............................................. 36
5.1 Representative project ............................................................................................... 36
5.2 Replication ....................................................................................................................... 37
5.3 Total NAMA ...................................................................................................................... 37
5.4 Gap and barrier analyses and identification of measures ........................... 38
5.5 Further details about RP ............................................................................................ 38
6. Capacity Development ......................................................................................... 48
7. NAMA Financial Requirements and Mechanisms ..................................... 50
7.1 National and International Finance: Sources and Distribution
Mechanisms ............................................................................................................................... 54
7.2 National finance sources............................................................................................ 54
7.3 Financial distribution mechanisms ........................................................................ 54
Project Design Document (PDD) for a Waste to Energy (WTE) NAMA in The Republic of Moldova
Page 5 of 107
7.4 Indicative NAMA financing needs .......................................................................... 55
7.5 Budgeting and cash flow modelling ...................................................................... 61 7.5.1 Budget for the RP without financing factors ..........................................................................61 7.5.2 Budget for the Central NAMA Unit (BCNU) .............................................................................73 7.5.3 Cash flow modelling and analysis ..............................................................................................73
8. NAMA Implementation Structure.................................................................... 75
8.1 Phased implementation plan.................................................................................... 76
8.2 Implementation schedule .......................................................................................... 77
9. Measuring, Reporting & Verification ............................................................. 79
9.1 Measurement .................................................................................................................. 80 9.1.1 Emission Reductions ......................................................................................................................80 9.1.2 Sustainable Development ............................................................................................................86 9.1.3 Support ..............................................................................................................................................92 9.1.4 This will be gauged by the amounts of public sector financial assistance provided in
response the financial needs identified in Section 7.4.Transformative Change ........................92
9.2 Reporting .......................................................................................................................... 92
9.3 Verification & Evaluation ........................................................................................... 93
10. Risk Management ................................................................................................... 95
11. Conclusion .................................................................................................................. 98
References .......................................................................................................................... 99
Annex 1: NAMA Measures & Interventions and their Outputs, Activities,
and Inputs ......................................................................................................................... 100
Annex 2: Identified Risks and Risk Mitigation Options ............................... 102
Annex 3: Stakeholder consultations during the design phase ................. 104
Project Design Document (PDD) for a Waste to Energy (WTE) NAMA in The Republic of Moldova
Page 6 of 107
List of Figures
Figure 4-1: Diagrammatic representation of the BAU and NAMA scenarios.
Figure 9-1: Overall reporting and management structure of the NAMA.
Figure 9-2: List of parameters to calculate GHG emission reductions ex post.
Figure 9-3: Line diagram with all relevant measurement points.
List of Tables
Table 1-1: SWDS parameters of the RP.
Table 4-1: Identification of the most plausible baseline scenario option for the destruction of LFG
(Element 1).
Table 4-2: Identification of the most plausible baseline scenario option for the use of LFG for electricity
generation (Element 2).
Table 4-3: A summary of the expected GHG mitigation targets to be achieved by the RP.
Table 4-4: A summary of the expected GHG mitigation targets to be achieved by the NAMA.
Table 4-5: List of SD domains and performance indicators selected for the NAMA.
Table 4-6: Selection of a parameter for each chosen indicator for the WTE NAMA.
Table 5-2: SWDS parameters of the RP.
Table 5-3: Waste composition.
Project Design Document (PDD) for a Waste to Energy (WTE) NAMA in The Republic of Moldova
Page 7 of 107
Table 5-4: Annual quantity and density of the disposal waste.
Table 5-5: Amounts of methane collection (ex ante estimation).
Project Design Document (PDD) for a Waste to Energy (WTE) NAMA in The Republic of Moldova
Page 8 of 107
Table 5-6: Amounts of annual gross electricity generation.
Table 5-7: Amounts of internal power consumption and annual net electricity generation.
Table 7-9: Total investment costs of the LFG C&F systems for the RP.
Table 7-10: Total costs of the power generation facility for the RP.
Table 7-11: Total initial investment costs of the RP. Unit: USD
Error! Reference source not found.
Table 7-12: Total O&M costs for the RP. Unit: USD
Error! Reference source not found.
Table 7-14: Key budgeting parameters for the RP.
Table 7-15: Core Budget (i.e. without financing factors) for the RP.
Unit: USD
Table 7-16: Cash flow model for the RP without financing factors.
Table 7-3: Summary of national and international financial sources.
Error! Reference source not found.
Table 7-4: Cash flow model for the RP with financing factors.
Table 7-5: Cash flow model for the total NAMA with financing factors.
Table 8-1: Phased implementation plan of the NAMA.
Table 8-2: Gantt chart for Phases 1 and 2 of the NAMA
Table 9-1: Roles and responsibilities of MRV management and operational team.
Table 9-2: Measurement procedures for parameter “Wx” (ID 1).
Table 9-3: Measurement procedures for parameter “LFGc,y” (ID 2).
Table 9-4: Measurement procedures for parameter “LFGi,y” (ID 3).
Table 9-5: Measurement procedures for parameter “WCH4,y” (ID 4).
Table 9-6: Measurement procedures for parameter “Tt” (ID 5).
Table 9-7: Measurement procedures for parameter “Pt” (ID 6).
Table 9-8: Measurement procedures for parameter “EGy” (ID 7).
Table 9-9: Measurement procedures for parameter “EGgrid” (ID 8).
Table 9-10: Measurement procedures for parameter “Flamem” (ID 9).
Table 9-11: MRV procedures for parameter “Odour”.
Table 9-12: MRV procedures for parameter “Mitigation – Number of ERs accumulated”.
Table 9-13: MRV procedures for parameter “Skill level (number of training sessions)”.
Table 9-14: MRV procedures for parameter “Quantity of net electricity supplied by the project to the grid
(EGP,y)”.
Table 9-15: MRV procedures for parameter “Remuneration paid to employees (income generation)”.
Table 9-16: MRV procedures for parameter “Number of jobs created during construction and operation
phases”.
Table 9-17: MRV procedures for parameter “Implementation, processes and compliance with the SD
tool”.
Table 9-18: Summary of SD evaluation at an individual project level.
Table 9-19: The overall ambition and success of the NAMA (at an individual project level).
Project Design Document (PDD) for a Waste to Energy (WTE) NAMA in The Republic of Moldova
Page 9 of 107
Executive Summary
This Project Design Document (PDD) is prepared for a waste to energy (WTE) NAMA in Moldova, which is
expected to be implemented in phases. The data for its technical details are mainly based on a feasibility
study carried out by Deutsche Gesellschaft für Internationale Zusammenarbeit (GIZ) for waste
management zone 3 (WMZ 3) in southern Moldova. Besides the initial WTE facility that is analyzed in
detail in this document, the NAMA expects replicability for up to nine (9) similar projects, bringing the
total to ten (10).
1. Background
According to Moldova’s National Inventory Report 1990-2010, the waste sector accounted for
11.9% of the country’s greenhouse gas (GHG) emissions in 2010, with estimated emissions of
1,578,304 tCO2e. The waste sector was the third largest national source of emissions after the
energy and agriculture sectors. The bulk of the sector’s emissions came from solid waste.
From a public services viewpoint, increased attention is being paid to improve overall municipal
waste management, with the Moldovan government recognizing the need for improvement of the
entire system, including the collection, transfer, treatment and disposal of waste in regional
landfills and closure of existing dumpsites. The effort to improve the system has been supported
by numerous international agencies with GIZ, European Investment Bank (EIB) and Czech
Development Agency (CDA) funding feasibility studies for all eight (8) waste management regions
of the country. The NAMA’s WTE facilities will be installed at the solid waste disposal sites
(SWDS) that reflect these efforts, though the scope of the NAMA does not include improvement
of waste management public services per se.
Against this background, the WTE NAMA has been selected by the Moldovan government as one
of four (4) NAMAs to be put forward for international support.
2. WTE NAMA
The NAMA, to take place in SWDS, involves installation of systems of equipment to achieve two
elements in relation to GHG mitigation:
Element 1: Collection of landfill gas (LFG) and destruction of the methane contained in it; and
Element 2: Use of the collected LFG for renewable electricity generation without reliance on
fossil fuel.
The investment cost of each individual intervention is estimated as USD 1,502,798, and USD
15,027,976 for the full NAMA. At full deployment with 4 MW installed capacity, the NAMA will
achieve GHG emission reduction of an annual average of 109,262 tCO2e (a total of 3,387,114
tCO2e during the NAMA’s lifetime), and serve 492,500 tonnes of waste annually. Whilst small in
absolute terms, the NAMA constitutes a major undertaking in Moldova, a country with a small
population under 4 million, and will make a solid contribution to an important service affecting
the daily lives of the Moldovan people.
In addition to support for the individual interventions, the NAMA will include overall support for:
(a) capacity building related to LFG collection and utilization, in particular measurement,
reporting and verification (MRV), and (b) a detailed feasibility study specifically for the WTE
component of the waste management system. The feasibility study is essential in that the
abovementioned feasibility studies (the existing one by GIZ and those planned for other waste
management zones) are for broader regional waste management improvements with an
emphasis on upstream efforts such as waste collection.
The NAMA also aims at accelerating policy discussions in Moldova regarding LFG collection and
utilization, by way of providing successful examples.
Project Design Document (PDD) for a Waste to Energy (WTE) NAMA in The Republic of Moldova
Page 10 of 107
3. Financial Structure
Explained in detail in Section 0, the financial plan developed for the NAMA involves the public
sector providing interest-free bridge loans initially, on the understanding that they will be
refinanced by national finance sources after three years of successful WTE operation at each
SWDS. The amount of bridge loans required for full implementation is USD 7,449,675.
Added to the cost for the NAMA intervention are the estimated one-off cost (a grant) of USD
150,000 for a WTE feasibility study discussed in Section 2, as well as an estimated USD 750,000
for NAMA management, capacity building and awareness building.
It is noteworthy that the financial structure involves only a small amount of grant, in a marked
departure from typical NAMA financial structures. Consequently, the cost of international NAMA
support per tCO2e of emission reduction is low, calculated to be USD 0.63 - USD 2.24 / tCO2e,
depending on how the cost of bridge loans is accounted for. This assumes that the USD 750,000
for NAMA management, capacity building and awareness building will be borne by the Moldovan
government as part of the country’s national ambition potentially with funding support from other
programmes. Without such an assumption, the cost of international NAMA support will increase to
USD 0.85 - USD 2.46 / tCO2e, still representing a reasonable level. Please refer to Table 7-8 for
details of calculation.
Project Design Document (PDD) for a Waste to Energy (WTE) NAMA in The Republic of Moldova
Page 11 of 107
Abbreviations and Acronyms
ANRE Administration Council of the National Agency Energy Regulation
Asiatica Carbon Partners Asiatica Co., Ltd.
BAU Business as Usual BCNU Budget for Central NAMA Unit
BNIP Budget for NAMA Individual Project
BTN Budget for Total NAMA
BUR Biennial Update Report CAPEX Capital Expenditure
CDA Czech Development Agency
CDM Clean Development Mechanism CH4 Methane
C&F Collection and Flaring
EBRD European Bank for Reconstruction and Development EIB European Investment Bank
ERs Emission Reductions
E5P The Eastern Europe Energy Efficiency and Environmental Partnership FIT/FiT Feed-in Tariff
FOD First Order Decay
Genset Gas Engine and Generator
GHG Greenhouse Gas GIZ Deutsche Gesellschaft für Internationale Zusammenarbeit
INDC Intended Nationally Determined Contributions
IP Individual Projects IPCC Intergovernmental Panel on Climate Change
IRR Internal Rate of Return
kg Kilogram kW Kilowatt
LEDS Low Emission Development Strategy
LECB Low Emission Capacity Building LFG Landfill Gas
LMOP Landfill Methane Outreach Program
MoEN The Ministry of Environment MoSEFF Moldovan Sustainable Energy Financing Facility
MRV Measurement, Reporting and Verification
m3 Cubic Metre
MR Monitoring Report MSW Municipal Solid Waste
MW Megawatt
MWh Megawatt Hour NAMA Nationally Appropriate Mitigation Action
NAMA BM NAMA Budgeting Methodology
NIF Neighbourhood Investment Facility NPV Net Present Value
O&M Operation and Maintenance
PDD Project Design Document RE Renewable Energy
RP Representative Project
SD Sustainable Development
SIDA Swedish International Development Cooperation Agency SWDS Solid Waste Disposal Site
SWM Strategy for Waste Management in the Republic of Moldova for the years 2013-2027
tCO2e Tonne of Carbon Dioxide Equivalent tCH4 Tonne of Methane
tpd Tonne per Day
UNDP United Nations Development Programme UNFCCC United Nations Framework Convention on Climate Change
USD United States Dollar
WMZ 3 Waste Management Zone 3 WTE Waste to Energy
Project Design Document (PDD) for a Waste to Energy (WTE) NAMA in The Republic of Moldova
Page 12 of 107
1. Introduction to a waste to energy NAMA
The WTE NAMA for municipal solid waste (MSW) in the Republic of Moldova is composed of a
number of individual projects1, each of which involves the installation and operation of a LFG
collection system and a renewable energy power plant fuelled with the methane in the
collected LFG. After a small amount for internal consumption (for the LFG collection system,
the office building of the power plant, etc.), the electricity will be exported to the grid2.
The NAMA will contribute not only to greenhouse gases GHG mitigation, but also to national
sustainable development (SD).
In the absence of this WTE NAMA, the atmospheric release of the LFG from the SWDS would
be the Business as Usual (BAU) scenario in the Republic of Moldova, without being used to
generate renewable fuel-based electricity to displace fossil fuel-based electricity.
It is clarified that this NAMA follows on the plans for improved MSW management being
developed by the Moldovan government with the assistance of GIZ. However, consistent with
the notion of “Nationally Appropriate Mitigation Action”, the primary focus of the NAMA
intervention is GHG mitigation aspects of MSW management. Thus, the scope of the NAMA
intervention does not include MSW management activities unrelated to GHG mitigation.
Pending a thorough feasibility study associated with this NAMA, the following stepwise
approach is taken for NAMA design development:
Step 1: To select one individual project (hereinafter referred to as “representative
project” or “RP”) and conduct the GHG emission reductions estimation and the
financial analyses in detail.
Step 2: To replicate the RP based on the results obtained in Step 1.
As explained in Section 5.2, this NAMA PDD anticipates that a further study will find the
feasibility of 9 replication projects – a total to 10 when combined with the RP.
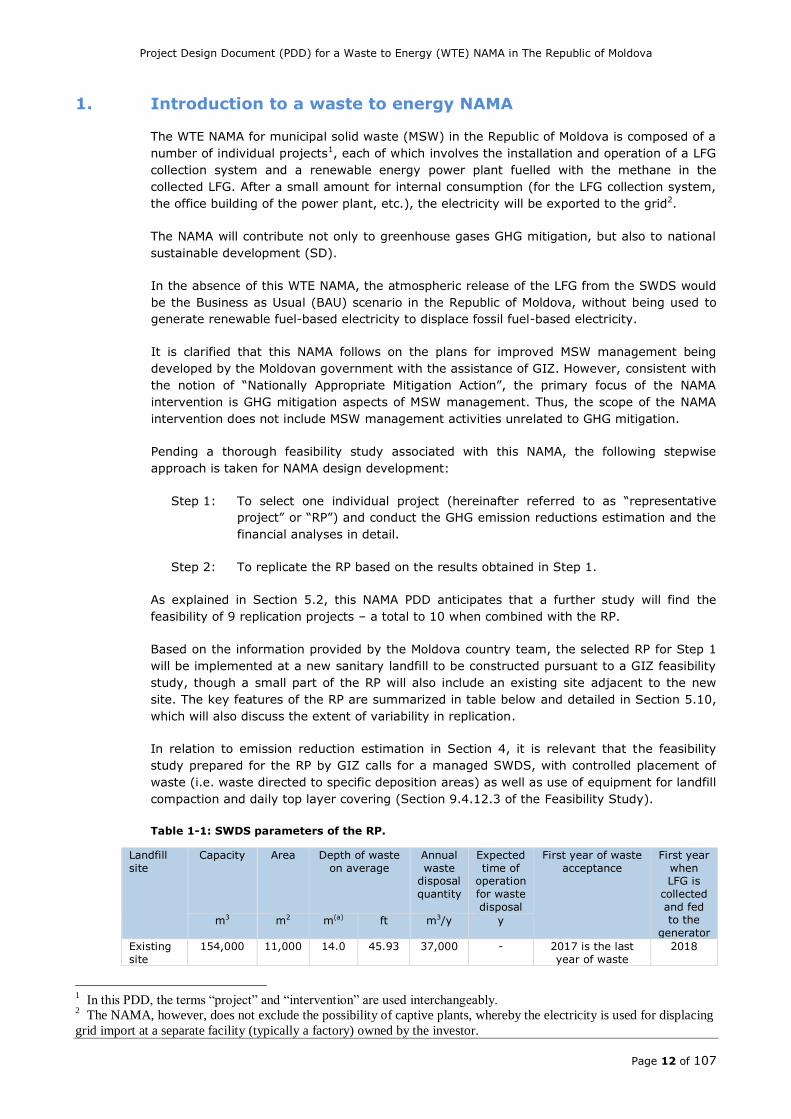
Based on the information provided by the Moldova country team, the selected RP for Step 1
will be implemented at a new sanitary landfill to be constructed pursuant to a GIZ feasibility
study, though a small part of the RP will also include an existing site adjacent to the new
site. The key features of the RP are summarized in table below and detailed in Section 5.10,
which will also discuss the extent of variability in replication.
In relation to emission reduction estimation in Section 4, it is relevant that the feasibility
study prepared for the RP by GIZ calls for a managed SWDS, with controlled placement of
waste (i.e. waste directed to specific deposition areas) as well as use of equipment for landfill
compaction and daily top layer covering (Section 9.4.12.3 of the Feasibility Study).
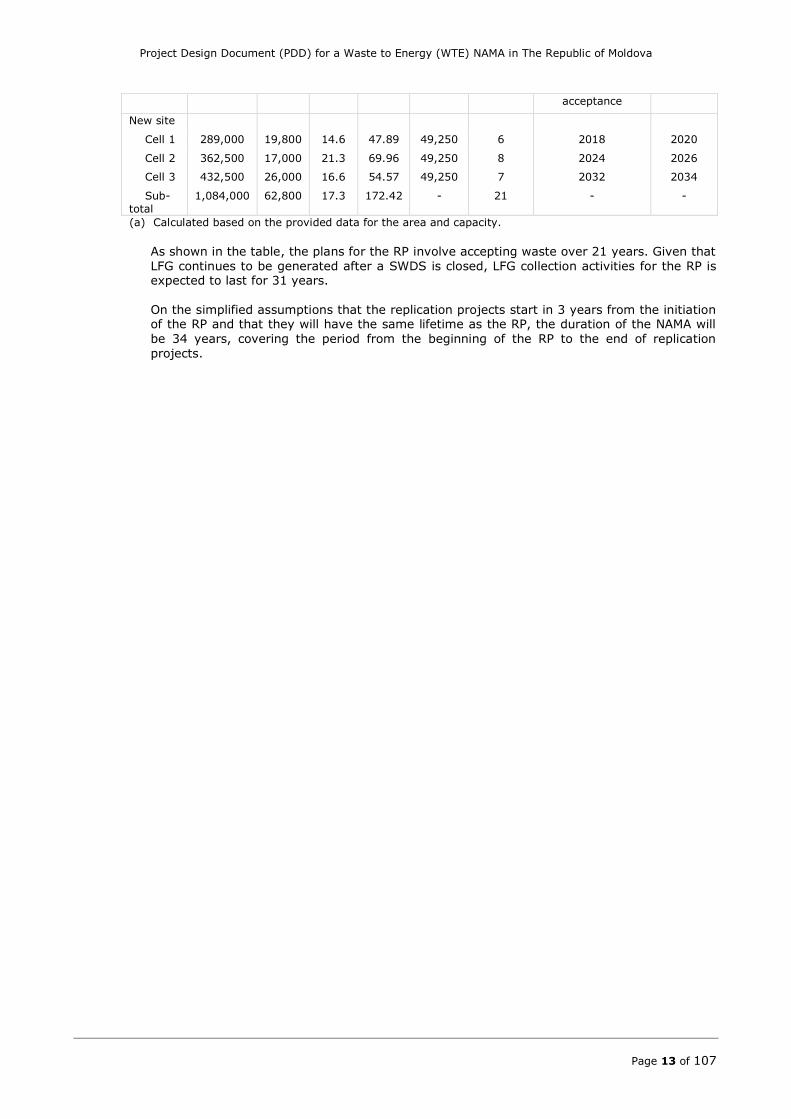
Table 1-1: SWDS parameters of the RP.
Landfill
site
Capacity Area Depth of waste
on average
Annual
waste disposal
quantity
Expected
time of operation
for waste
disposal
First year of waste
acceptance
First year
when LFG is
collected
and fed to the
generator m3 m2 m(a) ft m3/y y
Existing
site
154,000
11,000 14.0
45.93
37,000 - 2017 is the last
year of waste
2018
1 In this PDD, the terms “project” and “intervention” are used interchangeably.
2 The NAMA, however, does not exclude the possibility of captive plants, whereby the electricity is used for displacing
grid import at a separate facility (typically a factory) owned by the investor.
Project Design Document (PDD) for a Waste to Energy (WTE) NAMA in The Republic of Moldova
Page 13 of 107
acceptance
New site
Cell 1 289,000 19,800 14.6 47.89 49,250 6 2018 2020
Cell 2 362,500 17,000 21.3 69.96 49,250 8 2024 2026
Cell 3 432,500 26,000 16.6 54.57 49,250 7 2032 2034
Sub-
total
1,084,000 62,800 17.3 172.42 - 21 - -
(a) Calculated based on the provided data for the area and capacity.
As shown in the table, the plans for the RP involve accepting waste over 21 years. Given that
LFG continues to be generated after a SWDS is closed, LFG collection activities for the RP is expected to last for 31 years.
On the simplified assumptions that the replication projects start in 3 years from the initiation of the RP and that they will have the same lifetime as the RP, the duration of the NAMA will
be 34 years, covering the period from the beginning of the RP to the end of replication
projects.
Project Design Document (PDD) for a Waste to Energy (WTE) NAMA in The Republic of Moldova
Page 14 of 107
2. Background of the waste sector in the Republic of Moldova
2.1 Current situation and trends of the Sector
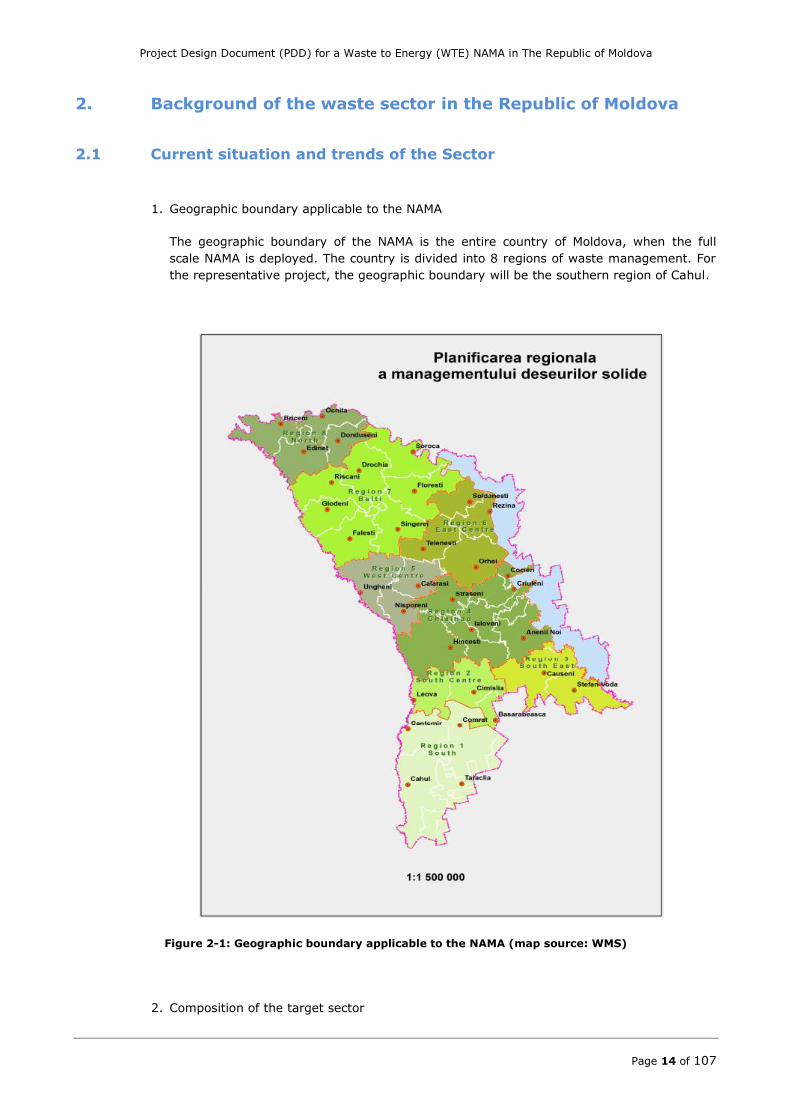
1. Geographic boundary applicable to the NAMA
The geographic boundary of the NAMA is the entire country of Moldova, when the full
scale NAMA is deployed. The country is divided into 8 regions of waste management. For
the representative project, the geographic boundary will be the southern region of Cahul.
Figure 2-1: Geographic boundary applicable to the NAMA (map source: WMS)
2. Composition of the target sector
Project Design Document (PDD) for a Waste to Energy (WTE) NAMA in The Republic of Moldova
Page 15 of 107
According to Moldova’s National Inventory Report 1990-2010 3 , the waste sector
accounted for 11.9% of the country’s GHG emissions in 2010, with estimated emissions
of 1,578,304 tCO2eq. It was the third largest national source of emissions after the
energy and agriculture sectors.
Within the waste sector, solid waste (excluding industrial waste) was estimated to have
emitted 66,098 tCH4 or 1,388,058 tCO2eq. When industrial waste is excluded, this
becomes 42,924 tCH4 or 901,402 tCO2eq4. After years of decline from this source due to
reduced economic output, there has been a steady increase of GHG emissions from solid
waste since 2006. Although other sectors started increasing GHG emissions from 2008,
two years after 2006, the overall trend is in line with other sectors.
One of five mitigation measures put forward as part of the Technology Needs
Assessment 5 , and being a part of a crucial public service in pressing need of
improvement, the target sector is well within the national emission reduction priorities.
3. Latest trends in the sector
According to the “National Waste Management Strategy of the Republic of Moldova (2013-
2027)”6 (“NWMS”), the “situation of the rural population, mainly in small villages is poor,
with few economic prospects and difficult access to relevant public services, including
sanitation of territories, waste collection and storage” with the most common method of
household waste treatment being “storing waste on the ground”.
Increased attention is being “paid to creation of capacities of [solid municipal waste]
storage in the district centers”. In line with this, waste management feasibility studies
have been carried out by GIZ for three regions, by the Czech Development Agency for
two regions, and EIB is funding feasibility studies this year in 2016 for the remaining
three regions7. The feasibility studies aim at proposing a system that will improve the
management of municipal waste for each region, which includes the collection, transfer,
treatment and disposal of waste in a regional landfill and closure of existing dumpsites.
It is noted that while the final versions of the feasibility studies are expected to make
mention of landfill gas collection infrastructure, the overwhelming priority will be to
increase collection capabilities, set up district collection stations and to construct sanitary
landfills.
While not a part of a trend, it is notable that there exists one WTE project in Moldova,
specifically the Tintareni project in the capital of Chisinau. As a privately-operated project,
its exact details are unknown. However, based on the project’s latest Clean Development
Mechanism (CDM) PDD8 and discussions with Moldovan stakeholders, it is believed that:
3 http://unfccc.int/resource/docs/natc/mdanir.pdf
4 The National Inventory uses a global warming potential of 21tCO2eq/tCH4. When revised to the current 25tCO2eq
/tCH4, the figure increases from 901,402 to 1,073,098 tCO2eq. 5 Technology Needs Assessment for Climate Change Mitigation Report 1 Technology Prioritization, May 2012,
http://unfccc.int/ttclear/misc_/StaticFiles/gnwoerk_static/TNR_CRE/e9067c6e3b97459989b2196f12155ad5/8a56956a4
f384bd4a113b7e941f7e992.pdf 6 National Waste Management Strategy of the Republic of Moldova (2013-2027), Ministry of Environment of the
Republic of Moldova, 2013
http://serviciilocale.md/public/files/deseuri/2013_01_24_NATIONAL_WASTE_MANAGEMENT_STRATEGY_2013
-27_ENG.pdf 7 http://www.eib.org/about/procurement/calls-technical-assistance/ta2015020.htm
8 Landfill Gas Recovery and Energy Production at the Tintareni Landfill Site, Chisinau, Moldova, 2012,
http://cdm.unfccc.int/filestorage/l/u/BFPGMOVQUHTIADYW32RES49NXKL0C5.pdf/PDD_ver_2.0.CDM_1%5B1%
Project Design Document (PDD) for a Waste to Energy (WTE) NAMA in The Republic of Moldova
Page 16 of 107
(a) the project received a grant, (b) the project negotiated a grid tariff, (c) the project
has been implemented, and (d) the project is presently not producing electricity for
export despite the price for export having been agreed to with ANRE9.
4. Barriers
While there is much focus on the waste management sector, there are several barriers in
implementing a NAMA measure.
a. Technology barrier
The technology to be adopted in the NAMA activity is a standard technology, proven in
countries around the globe – North and South America, Western Europe, Asia, and South
Africa – with projects in many South American and Asian non-Annex I countries having
reported accurate operational data to the UNFCCC as part of the CDM. However, with
landfill gas projects depending on decomposition of organic substances to create landfill
gas, often the sole fuel source except during startup, the gas quantity is highly
dependent on local conditions. Climatic conditions, waste volume and waste composition
characteristics all affect landfill gas generation amount and hence the financial bottom
line. For this reason, it is insufficient for an investor to be assured, for example, that a
landfill gas project in Wisconsin10 has been successful and that a similar project will be
successful in Moldova as the climate conditions are comparable.
In this sense, there is a real technology barrier for waste to energy in Moldova, where no
data is available from the sole WTE project (Tintareni, in Chisinau). A key strategy of the
NAMA is to have the RP act as a model case at the outset of the NAMA to mitigate risks
for all subsequent NAMA projects, by acting as an advanced feasibility study on local
waste characteristics, and as a model project to reaffirm the suitability of the technology
to Moldova. This strategy is elaborated in Section 0.
b. Policy barrier
The NAMA measures assume grid export of the electricity produced, an activity that
comes under the purview of the regulator National Energy Regulatory Agency (ANRE),
with which a power tariff must be individually negotiated by the exporter. Study of the
tariff calculation methodology and extensive discussion with energy experts suggest that
the project will not be able to negotiate a power tariff that gives the level of profitability
or cash flow that equity and debt investors find reasonable.
It is relevant to note that the new Renewable Energy Law was approved on 26 February
2016. While an accompanying new methodology is expected to be approved in the near
future, the new power tariff calculation methodology is unknown and Moldovan experts
believe that the power tariff is more likely to decrease than increase. This is all the more
reason why co-financing and NAMA financing are needed for WTE endeavours as the
present tariffs are insufficient for commercial sustainability.
c. Financial barrier
Consultations are being conducted with EIB for a Moldova Solid Waste Management
Framework Loan, with EIB proposing to loan 100 million Euros of the estimated total cost
5D.pdf?t=ZFB8bzdmNGl6fDAvBIoTMsEJiFWVF55sUQWW. The PDD has been left at validation stage and has not
been registered. 9 Electricity export to the grid was approved by ANRE at a tariff level of 1.73 bani/kWh (ANRE Decree no 519 from
30.05.2013) for a capacity of 320 kW. 10
A landfill gas project in Wisconsin is a part of the USEPA Landfill Methane Outreach Program
http://www.gundersenenvision.org/renewable-energy/using-waste-to-create-energy
Project Design Document (PDD) for a Waste to Energy (WTE) NAMA in The Republic of Moldova
Page 17 of 107
of 200 million Euros. It is foreseen that EBRD will co-finance the loan. It is also expected
that the programme will benefit from grants in the form of technical assistance and
investment grants from the Neighbourhood Investment Facility (NIF), Eastern Europe
Energy Efficiency and Environmental Partnership (E5P), and Swedish International
Development Cooperation Agency (SIDA), among others, to address affordability
constraints. While this is very positive, in the overall scheme, it is expected that the
waste to energy component is seen as least crucial, being both capital intensive
(elaborated in ensuing paragraphs) and having a less direct impact on the daily lives of
residents.
A waste to energy project has a high investment cost per unit installed capacity. Similar
to WTE projects in many parts of the world where there are few fiscal support measures,
in Moldova two financial barriers are present.
The first barrier is the lack of profitability to incentivise investment. In many countries,
the reward for taking a higher risk and successfully implementing a project is a
handsome profit. However, grid-connected projects in Moldova are required to
individually negotiate tariffs with the regulator ANRE. With a new regulation on
renewable energy tariffs expected in the imminent future, based on discussions with local
experts, there is uncertainty as to the new tariff calculation methodology, however,
discussions with Moldovan experts suggest that as a rule of thumb, the tariff will be set
with a 10-year payback period for the project owner in mind. Such a low profitability will
certainly not attract investment, taking into account the higher risk premium in Moldova.
The other barrier is unavailability of debt financing. Debt is extremely expensive in
Moldova, with some projects having to pay interest of close to 20% per annum,
exacerbating the lack of profitability. A greater problem however may be that commercial
banks are unwilling to lend at all. Indeed, an interview carried out with a leading
Moldovan commercial bank suggested a negative impression of WTE projects.
d. Other barriers
As mentioned in Section 2.1, increasing attention is being paid to the need for waste
management public services. There is a possibility of large funds being made available to
upgrade the current system (please refer to Section 3.2), which in itself is an extremely
positive outcome for Moldova. Assuming that credit will be approved for these upstream
activities up to and including the construction of a landfill, which in turn becomes the
host site for the NAMA measure, this presents a practical challenge – the possible need
for synchronization of those waste management projects and NAMA measures so that,
for instance, more affordable horizontal wells11 can be placed when (the relevant cells
of) the landfill is still empty.
2.2 Relevant Stakeholders
Three stakeholder consultations have been conducted during the NAMA design phase
between October 2015 and April 2016. Brief summaries of the consultation and outcomes are
provided in Annex 3. Stakeholder engagement played a critical role in NAMA design to
ensure local experts contributed to all NAMA aspects, notably including collaboration with the
Ministry of Environment (MoEN).
11
In the NAMA financial analysis that includes estimation of initial investment (elaborated in Section 7.5.1), it is
assumed that the project employs vertical wells that can be put in place after waste is landfilled, rather than horizontal
wells which are placed as the landfill is being filled up.
Project Design Document (PDD) for a Waste to Energy (WTE) NAMA in The Republic of Moldova
Page 18 of 107
2.3 Purpose and Objectives of the NAMA
The WTE NAMA aims at:
Collection of LFG and destruction of the methane contained in it, thereby preventing
the GHG emission that would otherwise be unabatedly released into the air at the
SWDS; and
Use of the collected LFG 12 as fuel for renewable electricity generation without
reliance on fossil fuel-based electricity.
Specifically, the objectives of the NAMA are two-fold. One is to assist the implementation of
actual projects to achieve the activities identified in the two bullet points above. The other is
to use successful implementation example(s) to encourage the Moldovan government to
introduce policies that mandate collection and utilization of LFG.
With the implementation of this WTE NAMA, it will contribute not only to GHG emissions
mitigation, but also to long-term SD co-benefits, with an ultimate goal at catalyzing
transformational change towards a low carbon society in Moldova. Impacts on the following
four aspects are anticipated.
1. GHG mitigation potential
Considering the fact that unabated release of LFG into the atmosphere of the SWDS is
identified as the BAU scenario (or baseline scenario) in Moldova, implementation of this
NAMA will lead to a positive and direct GHG emissions mitigation. This will be via: (a)
collection of LFG emitted from the MSW at the SWDS and destruction of the methane
contained in it, and (b) avoidance of fossil fuel-based electricity generation by using
the collected LFG for renewable electricity generation.
2. Sustainable development co-benefits
This NAMA will provide additional SD co-benefits beyond the reduction of GHG
emissions. Positive contribution on the following areas of SD are expected, as
elaborated in Section 4.3:
Air quality;
Climate change adaptation and mitigation;
Quality of employment;
Access to clean and sustainable energy;
Income generation;
Job creation; and
Compliance with laws and regulation.
3. Potential for transformational change
With the successful implementation of this NAMA, transformation of the national or
sectoral development towards to a low carbon intensive development path is foreseen.
These national or sectoral transformational changes include:
12
Precisely speaking, it is methane contained in LFG that is utilized.
Project Design Document (PDD) for a Waste to Energy (WTE) NAMA in The Republic of Moldova
Page 19 of 107
Change the prevailing practices of the waste management (i.e. collection
and/or destruction of methane contained in LFG emitted from MSW) and
energy supply (i.e. utilization of collected LFG for electricity generation)
sectors.
Broadening the context of GHG emissions mitigation activities in the energy
supply sector.
Achievement of the higher level emission reduction target through replicating
more individual projects in other regions after the successful implementation of
the first WTE facility (or RP).
Adoption of this innovative waste to energy approach/technology to other
sectors or industries.
4. Financial diversification
One of the objectives of the NAMA is to attract the investments into this type of GHG
mitigation activity by the private sector in future, via demonstration of successful
project implementation. Having said that private sector participation in regional waste
management infrastructure is not mandatory and is subject to the actual investment
conditions in each region.
The local communities will directly benefit from better air quality, clean and sustainable
electricity, more job opportunities, better quality of employment, as well as remuneration
income.
Project Design Document (PDD) for a Waste to Energy (WTE) NAMA in The Republic of Moldova
Page 20 of 107
3. Policy Analysis
3.1 Relevant National and Sector Strategies and Policies
The Republic of Moldova ratified the Kyoto Protocol on February 13, 2003. Though Moldova,
being a non-Annex I Party, had no commitments to reduce GHG emissions under the first
commitment period of the Kyoto Protocol, it has committed to promote sustainable
development, to contribute to the achievement of the United Nations Framework Convention
on Climate Change’s (UNFCCC) ultimate objective, and to assist Annex I Parties to fulfil their
commitments to limit and reduce GHG emissions.
In addition, the Republic of Moldova has communicated their Intended National Determined
Contribution (INDC) with the UNFCCC Secretariat and submitted a document entitled
“Republic of Moldova’s Intended National Determined Contribution”13 (hereinafter referred to
as “INDC document”) to the UNFCCC on 25 September 2015. Efforts made by the
Government of the Republic of Moldova are perceived through the developments in both pre-
and post- 2020 mitigation policy frameworks outlined in this INDC document14.
(a) Pre-2020 mitigation policy framework
In 2010, the Republic of Moldova participated in Copenhagen Accord and submitted an
emission reduction target that is stated in the Agreement “Nationally Appropriate
Mitigation Actions of the Developing Countries” to the UNFCCC, reproduced below:
“To reduce, to not less than 25% compared to the base year (1990), the total
national level of greenhouse gas emissions by 2020, by implementing economic
mechanisms focused on global climate change mitigation, in accordance with the
principles and provisions of the Convention.”
In 2014, the Moldovan Government approved the Environmental Protection Strategy for
the years 2014-2023 and the Action Plan for its implementation that aim at:
“A 20% GHG emissions reduction compared to the BAU scenario has to be
reached in the Republic of Moldova by 2020.”
“15% GHG emissions reduction compared to BAU scenario has to be achieved by
2020” for the waste sector.
(b) Post-2020 mitigation policy framework
Relevant legislative acts for the INDC implementation are necessary. Given this, it is
anticipated that a draft Low Emission Development Strategy (LEDS) of the Republic of
Moldova for the years 2021-2030 will be prepared for the Government approval by the
end of 2016. This draft strategic document will allow the country to adjust its
development path towards a low carbon economy and to achieve a green sustainable
development concurrently.
As noted in the INDC, “the Republic of Moldova intends to achieve an economy-wide
unconditional target of reducing its greenhouse gas emissions by 64-67 per cent below its
1990 level in 2030 and to make best efforts to reduce its emissions by 67 per cent. The
13
Government of the Republic of Moldova, 2015. Republic of Moldova’s Intended National Determined Contribution.
[pdf] Government of the Republic of Moldova. Available at: <
http://www4.unfccc.int/submissions/INDC/Published%20Documents/Republic%20of%20Moldova/1/INDC_Republic_
of_Moldova_25.09.2015.pdf > [Accessed 30 March 2016]. 14
Republic of Moldova’s Intended National Determined Contribution, p. 8.
Project Design Document (PDD) for a Waste to Energy (WTE) NAMA in The Republic of Moldova
Page 21 of 107
reduction commitment ... could be increased up to 78 per cent below 1990 level
conditional to, a global agreement addressing important topics including low-cost financial
resources, technology transfer, and technical cooperation, accessible to all at a scale
commensurate to the challenge of global climate change.” Energy and waste are both
sectors noted to be “covered” in the INDC.
In compliance with its national GHG mitigation objectives, the Strategy for Waste
Management in the Republic of Moldova for the years 2013-2027 (SWM 2013-2027) and a
number of legislative laws in relation to combating GHG emissions for the waste sector have
also been approved. However, none of them are focused on collecting and/or recovering the
energy stored in MSW, which substitutes the energy obtained by burning fossil fuels, but are
instead oriented towards discouraging waste storage in respective landfills and encouraging
their recycling15.
To elaborate, there is currently no national regulation in Moldova requiring municipal owners
or operators of landfills or SWDS to install and operate (a) LFG collection and treatment
systems, or (b) LFG destruction and/or utilization systems at the sites. Given no regulatory
requirements and contractual obligations, the atmospheric release of the LFG is the
prevailing waste management practice pertinent to MSW in most landfills or SWDS in
Moldova at the present time. This is consistent with the First Biennial Update Report16 (BUR)
that states, “The current Moldovan legal framework related to environmental protection
regulates the reduction of GHG emissions in the waste sector only in general terms. It lacks
stipulations on equipping the solid waste disposal sites and wastewater treatment plants with
biogas recovery systems”.
There are, however, stated policies in relation to waste management and renewable energy,
as follows.
Waste management: The SWM 2013-2027 states that Moldova will establish a legal and
institutional framework to support the gradual alignment of its waste management practices
to those of the European Union, which is to “prevent waste generation and to promote its
reuse, recycling and recovery in terms of environmental protection”.
Renewable energy: According to the BUR, one of two policies geared towards increasing
energy security is “attracting the renewable energy sources into the energy balance”, aiming
to increase the mix of renewable energy to 20% of demand by 2020.
It is added that the country experts who participated in the preparation of this NAMA PDD
are not aware of any policies or regulations in Moldova that stipulate mandatory LFG
collection and destruction/utilization for the sake of safe operation of the SWDS or
prevention of environmental degradation of neighbouring areas. This will be rectified as part
of the NAMA.
3.2 Alignment with National and Sector Strategies and Policies
The NAMA measure / intervention will be fully aligned with national and sector strategies and
policies.
1. National level
15
Ministry of Environment, 2013. Third National Communication of the Republic of Moldova Under the United
Nations Framework Convention on Climate Change. [pdf] Ministry of Environment. Available at: <
http://unfccc.int/resource/docs/natc/mdanc3.pdf > [Accessed 24 March 2016]. (p.145) 16
Ministry of Environment of the Republic of Moldova / United Nations Environment Programme, 2016, First
Biennial Update Report of the Republic of Moldova under the United Nations Framework Convention on Climate
Change
Project Design Document (PDD) for a Waste to Energy (WTE) NAMA in The Republic of Moldova
Page 22 of 107
At the national level, the NAMA is in full alignment with the Environmental Protection
Strategy with GHG reductions in the waste sector. The importance of this cannot be
overstated. Although the absolute volume of GHG emissions may be small due to the
small population, as is also pointed out in Section 2.1, the waste sector is the third
largest contributor of GHG emissions in Moldova after the energy and agricultural
sectors.
2. Sectoral level
The NAMA intervention will fall into the category of (energy) “recovery” as mentioned in
Section 2.1. Importantly, the project design assumes in the technology and financial
assumptions that recyclables will not be a part of the landfill gas-producing waste, thus
ensuring that there is no competition between the NAMA intervention and recycling
activities.
Viewed as part of a wider public service, due to the lack of basic waste management
services in many rural areas including waste collection that is taken for granted in
developed nations, the government in its NWMS report estimates that total investments
of between 375 and 470 million Euro will be needed solely for the municipal waste sector
in the period between 2013 and 2027.
3. Synergies with other relevant projects
The World Bank, EIB, European Bank for Reconstruction and Development (EBRD), and
GIZ are some international organizations that have supported waste management efforts
in Moldova.
Of particular relevance to the NAMA measure / intervention is EIB’s and EBRD’s recent
efforts to fund feasibility studies for three of eight waste management regions, with
possibilities to extend credit subsequent to the studies’ completion, as well as similar
potential for credit for other waste management regions whose studies have already
been completed. As mentioned elsewhere in this document, the NAMA project concept
relies on there being in place a landfill with a certain waste volume to generate the
necessary biogas, which presumes that credit will indeed be extended to the broader
waste management project by international supporters such as EIB and/or EBRD, and
such credit will be availed of by the Moldovan government. As the choice of gas piping
technology (vertical versus horizontal wells) will depend on the timing of the installation
relative to the timing of waste disposal, it is all the more important that there be linkages
with other international donors.
It is also apparent from discussion with Moldovan stakeholders that a cooperative
framework should be designed at the outset for cost effectiveness/diffusion and
enhanced transparency. This can include the sharing of fiscal and project management
resources between donors and between waste management regions.
Project Design Document (PDD) for a Waste to Energy (WTE) NAMA in The Republic of Moldova
Page 23 of 107
4. Baseline Information and NAMA Targets
4.1 Baseline boundary and scenario
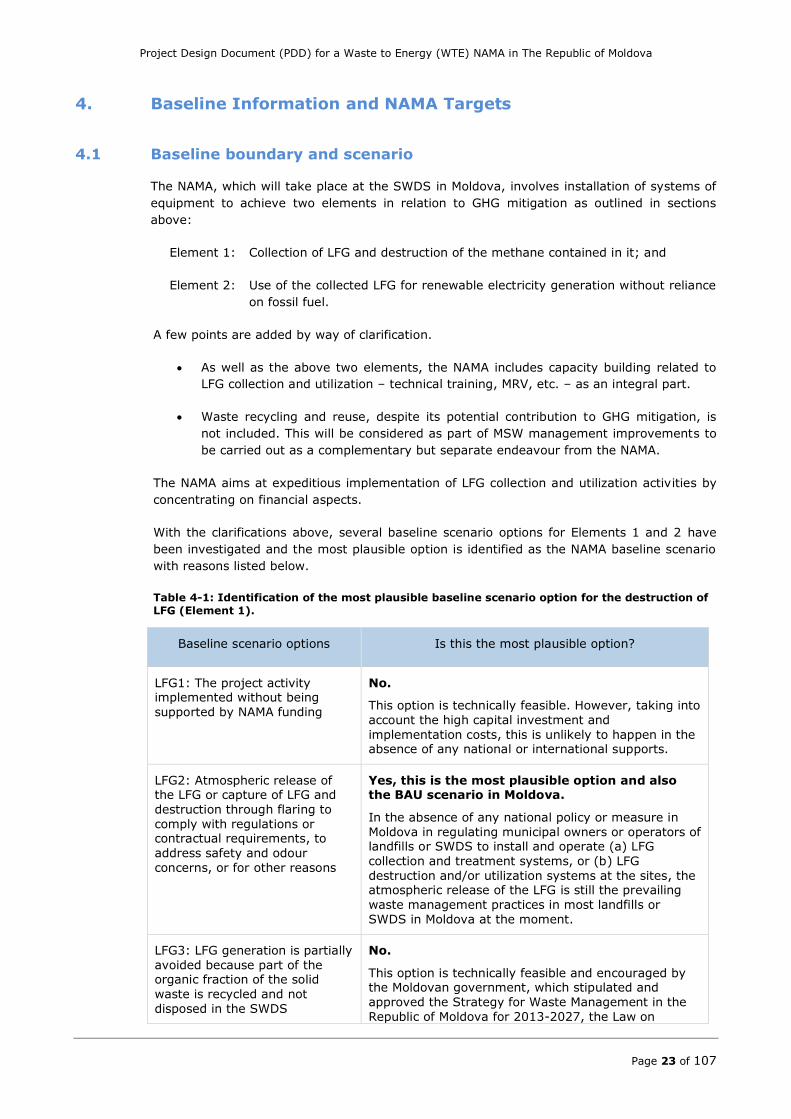
The NAMA, which will take place at the SWDS in Moldova, involves installation of systems of
equipment to achieve two elements in relation to GHG mitigation as outlined in sections
above:
Element 1: Collection of LFG and destruction of the methane contained in it; and
Element 2: Use of the collected LFG for renewable electricity generation without reliance
on fossil fuel.
A few points are added by way of clarification.
As well as the above two elements, the NAMA includes capacity building related to
LFG collection and utilization – technical training, MRV, etc. – as an integral part.
Waste recycling and reuse, despite its potential contribution to GHG mitigation, is
not included. This will be considered as part of MSW management improvements to
be carried out as a complementary but separate endeavour from the NAMA.
The NAMA aims at expeditious implementation of LFG collection and utilization activities by
concentrating on financial aspects.
With the clarifications above, several baseline scenario options for Elements 1 and 2 have
been investigated and the most plausible option is identified as the NAMA baseline scenario
with reasons listed below.
Table 4-1: Identification of the most plausible baseline scenario option for the destruction of
LFG (Element 1).
Baseline scenario options Is this the most plausible option?
LFG1: The project activity implemented without being
supported by NAMA funding
No.
This option is technically feasible. However, taking into
account the high capital investment and
implementation costs, this is unlikely to happen in the absence of any national or international supports.
LFG2: Atmospheric release of the LFG or capture of LFG and
destruction through flaring to
comply with regulations or contractual requirements, to
address safety and odour
concerns, or for other reasons
Yes, this is the most plausible option and also the BAU scenario in Moldova.
In the absence of any national policy or measure in
Moldova in regulating municipal owners or operators of landfills or SWDS to install and operate (a) LFG
collection and treatment systems, or (b) LFG
destruction and/or utilization systems at the sites, the atmospheric release of the LFG is still the prevailing
waste management practices in most landfills or
SWDS in Moldova at the moment.
LFG3: LFG generation is partially
avoided because part of the organic fraction of the solid
waste is recycled and not
disposed in the SWDS
No.
This option is technically feasible and encouraged by the Moldovan government, which stipulated and
approved the Strategy for Waste Management in the
Republic of Moldova for 2013-2027, the Law on
Project Design Document (PDD) for a Waste to Energy (WTE) NAMA in The Republic of Moldova
Page 24 of 107
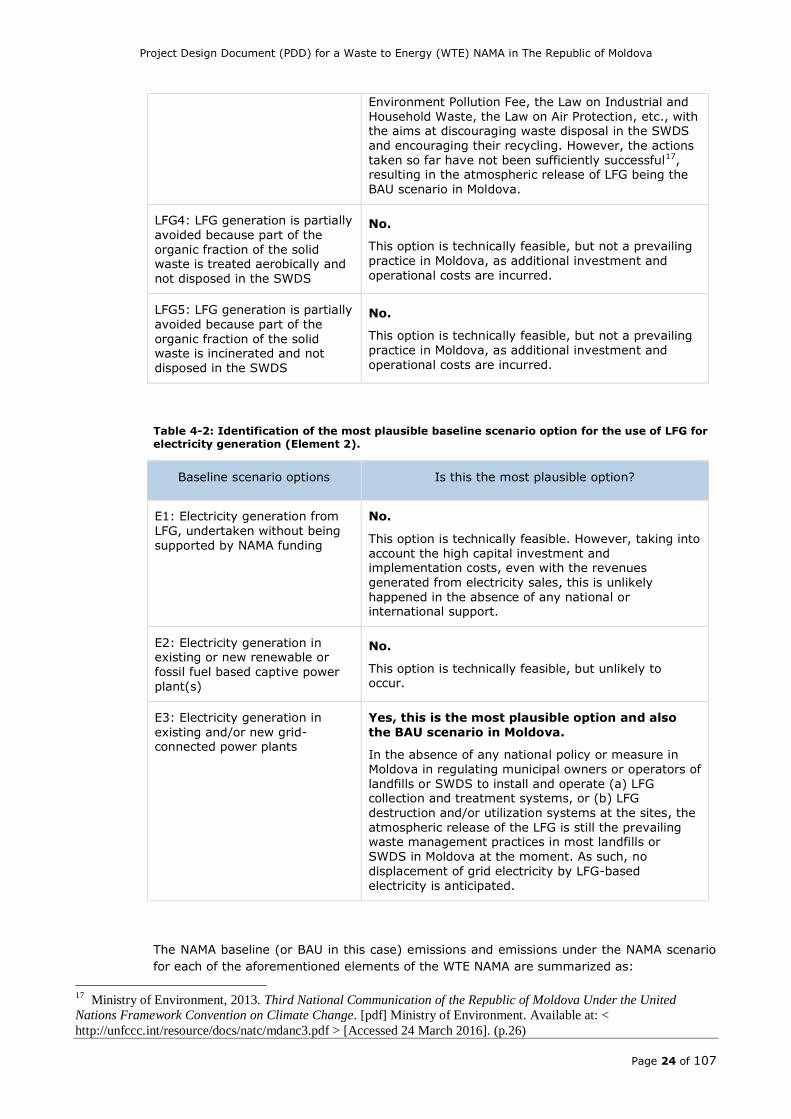
Environment Pollution Fee, the Law on Industrial and
Household Waste, the Law on Air Protection, etc., with the aims at discouraging waste disposal in the SWDS
and encouraging their recycling. However, the actions
taken so far have not been sufficiently successful17, resulting in the atmospheric release of LFG being the
BAU scenario in Moldova.
LFG4: LFG generation is partially
avoided because part of the
organic fraction of the solid waste is treated aerobically and
not disposed in the SWDS
No.
This option is technically feasible, but not a prevailing
practice in Moldova, as additional investment and
operational costs are incurred.
LFG5: LFG generation is partially
avoided because part of the
organic fraction of the solid waste is incinerated and not
disposed in the SWDS
No.
This option is technically feasible, but not a prevailing
practice in Moldova, as additional investment and
operational costs are incurred.
Table 4-2: Identification of the most plausible baseline scenario option for the use of LFG for
electricity generation (Element 2).
Baseline scenario options Is this the most plausible option?
E1: Electricity generation from
LFG, undertaken without being
supported by NAMA funding
No.
This option is technically feasible. However, taking into
account the high capital investment and implementation costs, even with the revenues
generated from electricity sales, this is unlikely
happened in the absence of any national or international support.
E2: Electricity generation in existing or new renewable or
fossil fuel based captive power
plant(s)
No.
This option is technically feasible, but unlikely to occur.
E3: Electricity generation in
existing and/or new grid-connected power plants
Yes, this is the most plausible option and also
the BAU scenario in Moldova.
In the absence of any national policy or measure in
Moldova in regulating municipal owners or operators of
landfills or SWDS to install and operate (a) LFG collection and treatment systems, or (b) LFG
destruction and/or utilization systems at the sites, the
atmospheric release of the LFG is still the prevailing waste management practices in most landfills or
SWDS in Moldova at the moment. As such, no
displacement of grid electricity by LFG-based
electricity is anticipated.
The NAMA baseline (or BAU in this case) emissions and emissions under the NAMA scenario
for each of the aforementioned elements of the WTE NAMA are summarized as:
17
Ministry of Environment, 2013. Third National Communication of the Republic of Moldova Under the United
Nations Framework Convention on Climate Change. [pdf] Ministry of Environment. Available at: <
http://unfccc.int/resource/docs/natc/mdanc3.pdf > [Accessed 24 March 2016]. (p.26)
Project Design Document (PDD) for a Waste to Energy (WTE) NAMA in The Republic of Moldova
Page 25 of 107
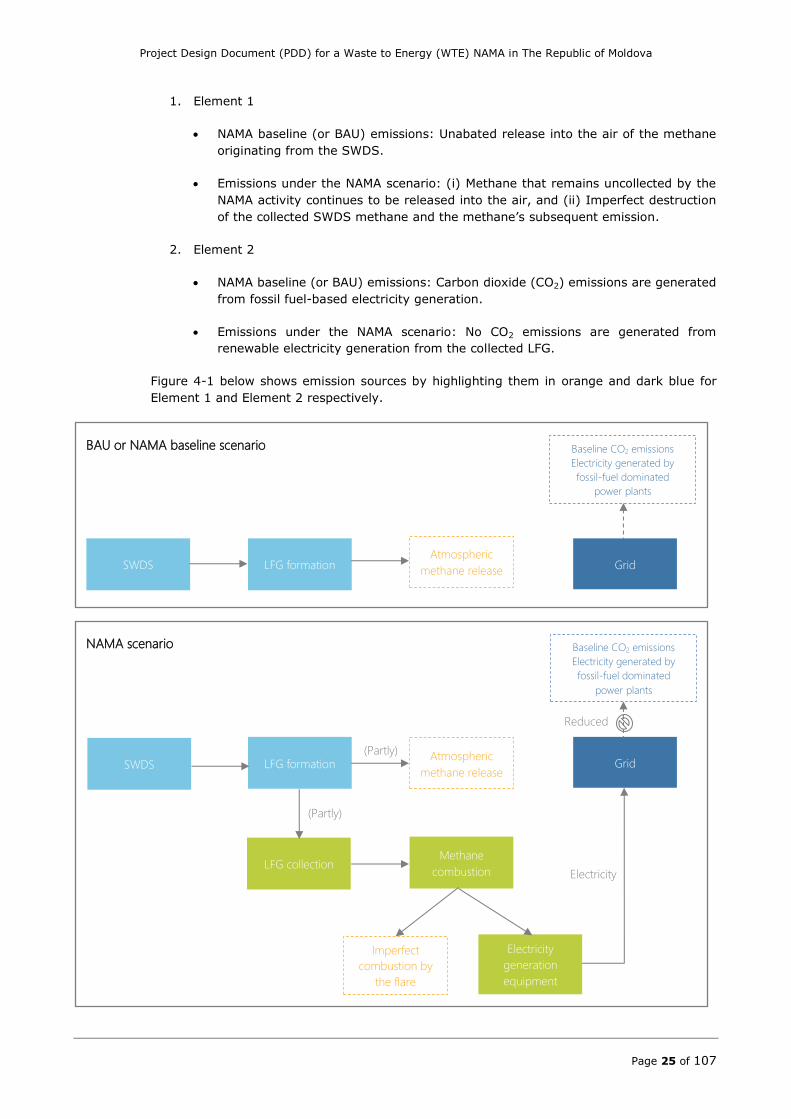
1. Element 1
NAMA baseline (or BAU) emissions: Unabated release into the air of the methane
originating from the SWDS.
Emissions under the NAMA scenario: (i) Methane that remains uncollected by the
NAMA activity continues to be released into the air, and (ii) Imperfect destruction
of the collected SWDS methane and the methane’s subsequent emission.
2. Element 2
NAMA baseline (or BAU) emissions: Carbon dioxide (CO2) emissions are generated
from fossil fuel-based electricity generation.
Emissions under the NAMA scenario: No CO2 emissions are generated from
renewable electricity generation from the collected LFG.
Figure 4-1 below shows emission sources by highlighting them in orange and dark blue for
Element 1 and Element 2 respectively.
SWDS LFG formation Atmospheric
methane release Grid
Baseline CO2 emissions
Electricity generated by
fossil-fuel dominated
power plants
BAU or NAMA baseline scenario
NAMA scenario
SWDS LFG formation Grid
Baseline CO2 emissions
Electricity generated by
fossil-fuel dominated
power plants
LFG collection Methane
combustion
Electricity
generation
equipment
Atmospheric
methane release
Imperfect
combustion by
the flare
Reduced
Electricity
(Partly)
(Partly)
Project Design Document (PDD) for a Waste to Energy (WTE) NAMA in The Republic of Moldova
Page 26 of 107
Figure 4-1: Diagrammatic representation of the BAU and NAMA scenarios.
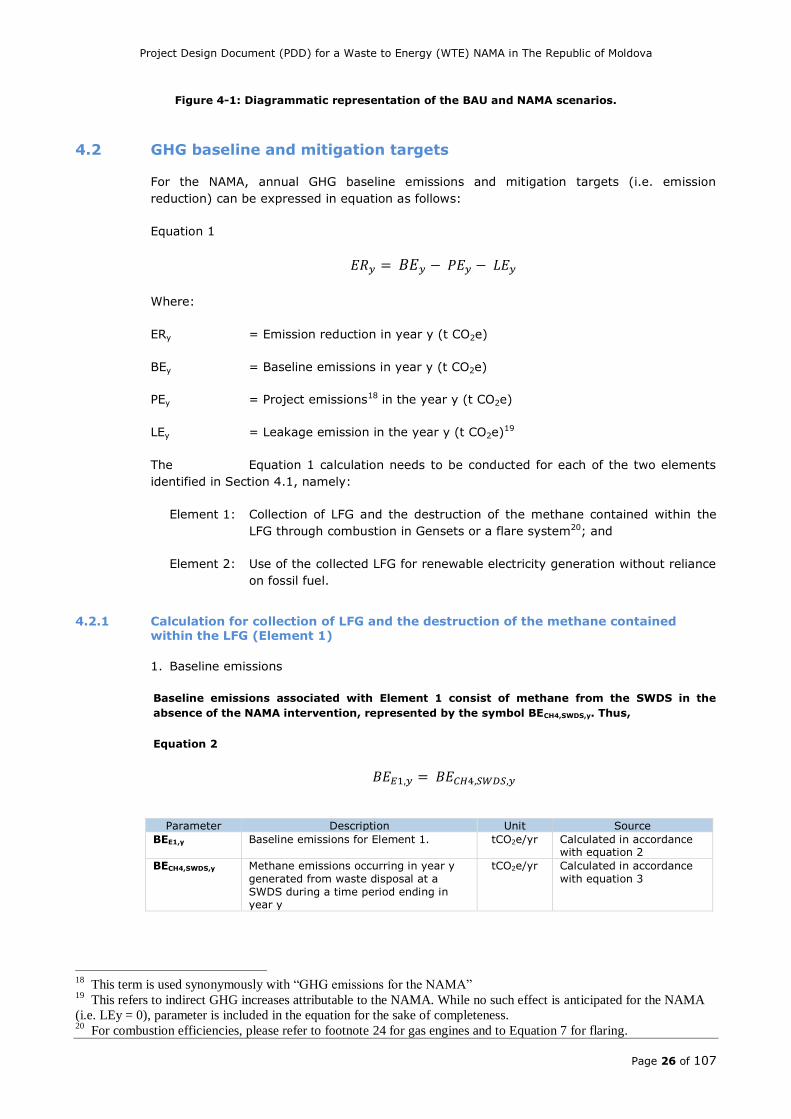
4.2 GHG baseline and mitigation targets
For the NAMA, annual GHG baseline emissions and mitigation targets (i.e. emission
reduction) can be expressed in equation as follows:
Equation 1
𝐸𝑅𝑦 = 𝐵𝐸𝑦 − 𝑃𝐸𝑦 − 𝐿𝐸𝑦
Where:
ERy = Emission reduction in year y (t CO2e)
BEy = Baseline emissions in year y (t CO2e)
PEy = Project emissions18 in the year y (t CO2e)
LEy = Leakage emission in the year y (t CO2e)19
The Equation 1 calculation needs to be conducted for each of the two elements
identified in Section 4.1, namely:
Element 1: Collection of LFG and the destruction of the methane contained within the
LFG through combustion in Gensets or a flare system20; and
Element 2: Use of the collected LFG for renewable electricity generation without reliance
on fossil fuel.
4.2.1 Calculation for collection of LFG and the destruction of the methane contained within the LFG (Element 1)
1. Baseline emissions
Baseline emissions associated with Element 1 consist of methane from the SWDS in the
absence of the NAMA intervention, represented by the symbol BECH4,SWDS,y. Thus,
Equation 2
𝐵𝐸𝐸1,𝑦 = 𝐵𝐸𝐶𝐻4,𝑆𝑊𝐷𝑆,𝑦
Parameter Description Unit Source
BEE1,y Baseline emissions for Element 1. tCO2e/yr Calculated in accordance with equation 2
BECH4,SWDS,y Methane emissions occurring in year y
generated from waste disposal at a
SWDS during a time period ending in year y
tCO2e/yr Calculated in accordance
with equation 3
18
This term is used synonymously with “GHG emissions for the NAMA” 19
This refers to indirect GHG increases attributable to the NAMA. While no such effect is anticipated for the NAMA
(i.e. LEy = 0), parameter is included in the equation for the sake of completeness. 20
For combustion efficiencies, please refer to footnote 24 for gas engines and to Equation 7 for flaring.
Project Design Document (PDD) for a Waste to Energy (WTE) NAMA in The Republic of Moldova
Page 27 of 107
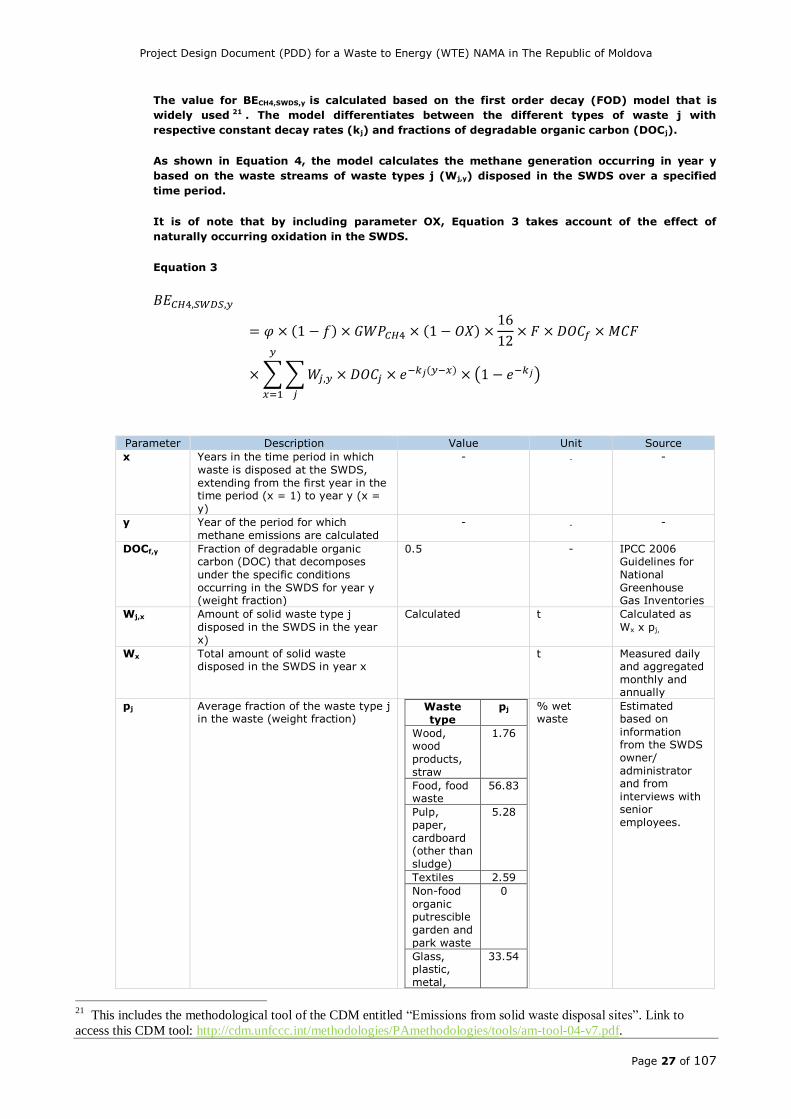
The value for BECH4,SWDS,y is calculated based on the first order decay (FOD) model that is
widely used 21 . The model differentiates between the different types of waste j with
respective constant decay rates (kj) and fractions of degradable organic carbon (DOCj).
As shown in Equation 4, the model calculates the methane generation occurring in year y
based on the waste streams of waste types j (Wj,y) disposed in the SWDS over a specified
time period.
It is of note that by including parameter OX, Equation 3 takes account of the effect of
naturally occurring oxidation in the SWDS.
Equation 3
𝐵𝐸𝐶𝐻4,𝑆𝑊𝐷𝑆,𝑦
= 𝜑 × (1 − 𝑓) × 𝐺𝑊𝑃𝐶𝐻4 × (1 − 𝑂𝑋) ×16
12× 𝐹 × 𝐷𝑂𝐶𝑓 × 𝑀𝐶𝐹
× ∑ ∑ 𝑊𝑗,𝑦
𝑗
𝑦
𝑥=1
× 𝐷𝑂𝐶𝑗 × 𝑒−𝑘𝑗(𝑦−𝑥) × (1 − 𝑒−𝑘𝑗)
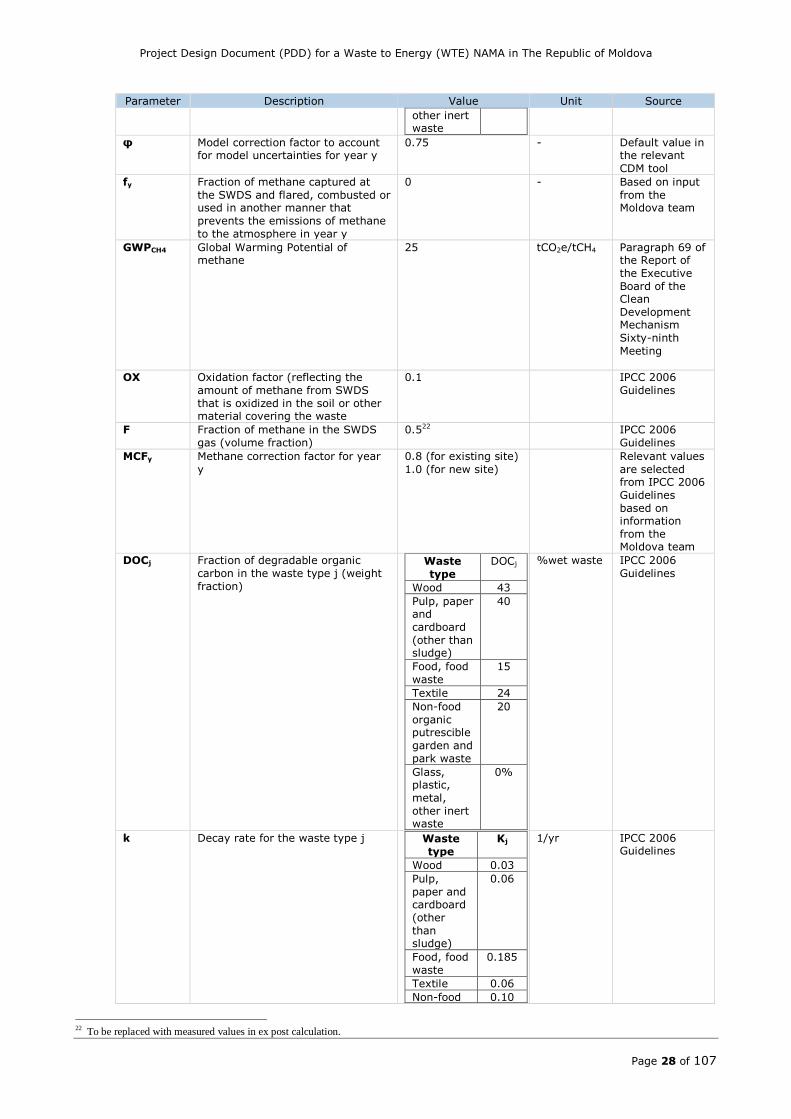
Parameter Description Value Unit Source
x Years in the time period in which
waste is disposed at the SWDS,
extending from the first year in the time period (x = 1) to year y (x =
y)
- - -
y Year of the period for which
methane emissions are calculated
- - -
DOCf,y Fraction of degradable organic carbon (DOC) that decomposes
under the specific conditions
occurring in the SWDS for year y (weight fraction)
0.5 - IPCC 2006 Guidelines for
National
Greenhouse Gas Inventories
Wj,x Amount of solid waste type j
disposed in the SWDS in the year x)
Calculated t Calculated as
Wx x pj,
Wx Total amount of solid waste disposed in the SWDS in year x
t Measured daily and aggregated
monthly and annually
pj Average fraction of the waste type j in the waste (weight fraction)
Waste
type
pj
Wood, wood
products,
straw
1.76
Food, food waste
56.83
Pulp,
paper,
cardboard (other than
sludge)
5.28
Textiles 2.59
Non-food
organic putrescible
garden and
park waste
0
Glass, plastic,
metal,
33.54
% wet waste
Estimated based on
information from the SWDS
owner/
administrator and from
interviews with senior
employees.
21
This includes the methodological tool of the CDM entitled “Emissions from solid waste disposal sites”. Link to
access this CDM tool: http://cdm.unfccc.int/methodologies/PAmethodologies/tools/am-tool-04-v7.pdf.
Project Design Document (PDD) for a Waste to Energy (WTE) NAMA in The Republic of Moldova
Page 28 of 107
Parameter Description Value Unit Source
other inert waste
φ Model correction factor to account for model uncertainties for year y
0.75 - Default value in the relevant
CDM tool
fy Fraction of methane captured at
the SWDS and flared, combusted or used in another manner that
prevents the emissions of methane
to the atmosphere in year y
0 - Based on input
from the Moldova team
GWPCH4 Global Warming Potential of methane
25 tCO2e/tCH4 Paragraph 69 of the Report of
the Executive
Board of the Clean
Development Mechanism
Sixty-ninth
Meeting
OX Oxidation factor (reflecting the
amount of methane from SWDS
that is oxidized in the soil or other material covering the waste
0.1 IPCC 2006
Guidelines
F Fraction of methane in the SWDS
gas (volume fraction)
0.522 IPCC 2006
Guidelines
MCFy Methane correction factor for year
y
0.8 (for existing site)
1.0 (for new site)
Relevant values
are selected from IPCC 2006
Guidelines
based on information
from the Moldova team
DOCj Fraction of degradable organic
carbon in the waste type j (weight
fraction)
Waste
type
DOCj
Wood 43
Pulp, paper and
cardboard
(other than sludge)
40
Food, food
waste
15
Textile 24
Non-food
organic putrescible
garden and
park waste
20
Glass, plastic,
metal,
other inert waste
0%
%wet waste IPCC 2006
Guidelines
k Decay rate for the waste type j Waste
type
Kj
Wood 0.03
Pulp,
paper and cardboard
(other
than sludge)
0.06
Food, food
waste
0.185
Textile 0.06
Non-food 0.10
1/yr IPCC 2006 Guidelines
22 To be replaced with measured values in ex post calculation.
Project Design Document (PDD) for a Waste to Energy (WTE) NAMA in The Republic of Moldova
Page 29 of 107
Parameter Description Value Unit Source
organic putrescibl
e garden and park
waste
Glass,
plastic, metal,
other inert
waste
0
j Type of residual waste or types of
waste in the MSW
- - -
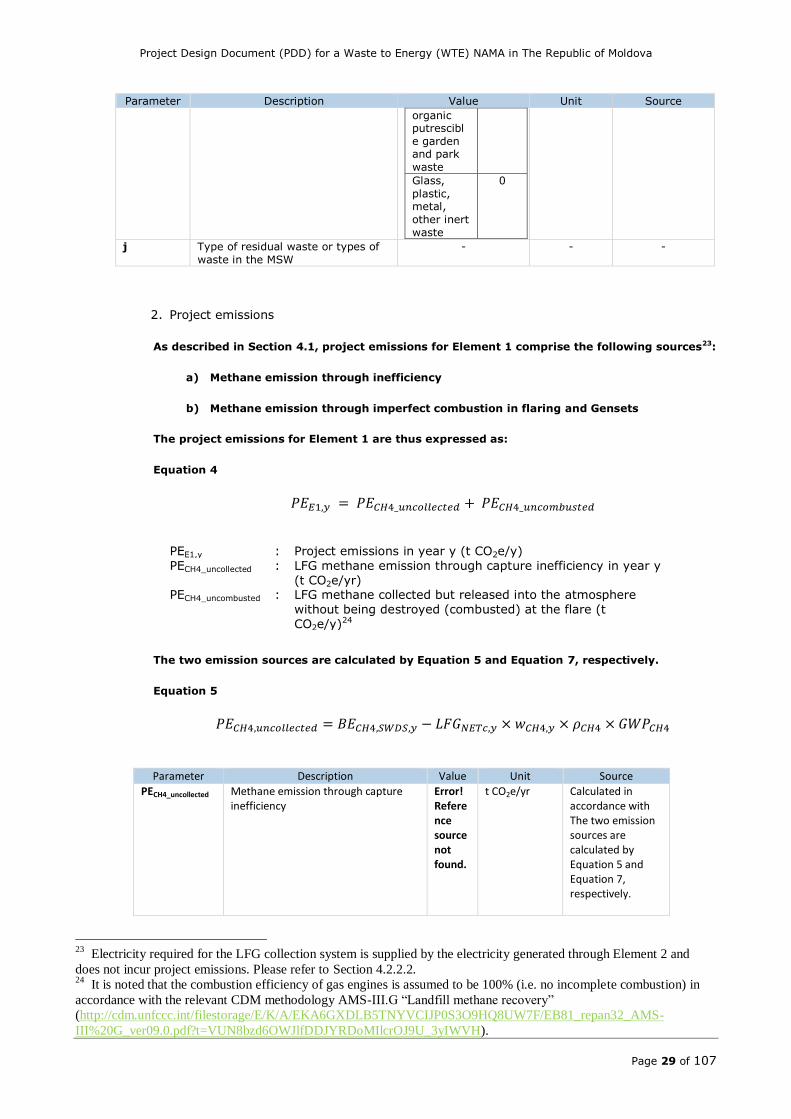
2. Project emissions
As described in Section 4.1, project emissions for Element 1 comprise the following sources23:
a) Methane emission through inefficiency
b) Methane emission through imperfect combustion in flaring and Gensets
The project emissions for Element 1 are thus expressed as:
Equation 4
𝑃𝐸𝐸1,𝑦 = 𝑃𝐸𝐶𝐻4_𝑢𝑛𝑐𝑜𝑙𝑙𝑒𝑐𝑡𝑒𝑑 + 𝑃𝐸𝐶𝐻4_𝑢𝑛𝑐𝑜𝑚𝑏𝑢𝑠𝑡𝑒𝑑
PEE1,y : Project emissions in year y (t CO2e/y)
PECH4_uncollected : LFG methane emission through capture inefficiency in year y
(t CO2e/yr) PECH4_uncombusted : LFG methane collected but released into the atmosphere
without being destroyed (combusted) at the flare (t
CO2e/y)24
The two emission sources are calculated by Equation 5 and Equation 7, respectively.
Equation 5
𝑃𝐸𝐶𝐻4,𝑢𝑛𝑐𝑜𝑙𝑙𝑒𝑐𝑡𝑒𝑑 = 𝐵𝐸𝐶𝐻4,𝑆𝑊𝐷𝑆,𝑦 − 𝐿𝐹𝐺𝑁𝐸𝑇𝑐,𝑦 × 𝑤𝐶𝐻4,𝑦 × 𝜌𝐶𝐻4 × 𝐺𝑊𝑃𝐶𝐻4
Parameter Description Value Unit Source
PECH4_uncollected Methane emission through capture inefficiency
Error! Reference source not found.
t CO2e/yr Calculated in accordance with The two emission sources are calculated by Equation 5 and Equation 7, respectively.
23
Electricity required for the LFG collection system is supplied by the electricity generated through Element 2 and
does not incur project emissions. Please refer to Section 4.2.2.2. 24
It is noted that the combustion efficiency of gas engines is assumed to be 100% (i.e. no incomplete combustion) in
accordance with the relevant CDM methodology AMS-III.G “Landfill methane recovery”
(http://cdm.unfccc.int/filestorage/E/K/A/EKA6GXDLB5TNYVCIJP0S3O9HQ8UW7F/EB81_repan32_AMS-
III%20G_ver09.0.pdf?t=VUN8bzd6OWJlfDDJYRDoMIlcrOJ9U_3yIWVH).
Project Design Document (PDD) for a Waste to Energy (WTE) NAMA in The Republic of Moldova
Page 30 of 107
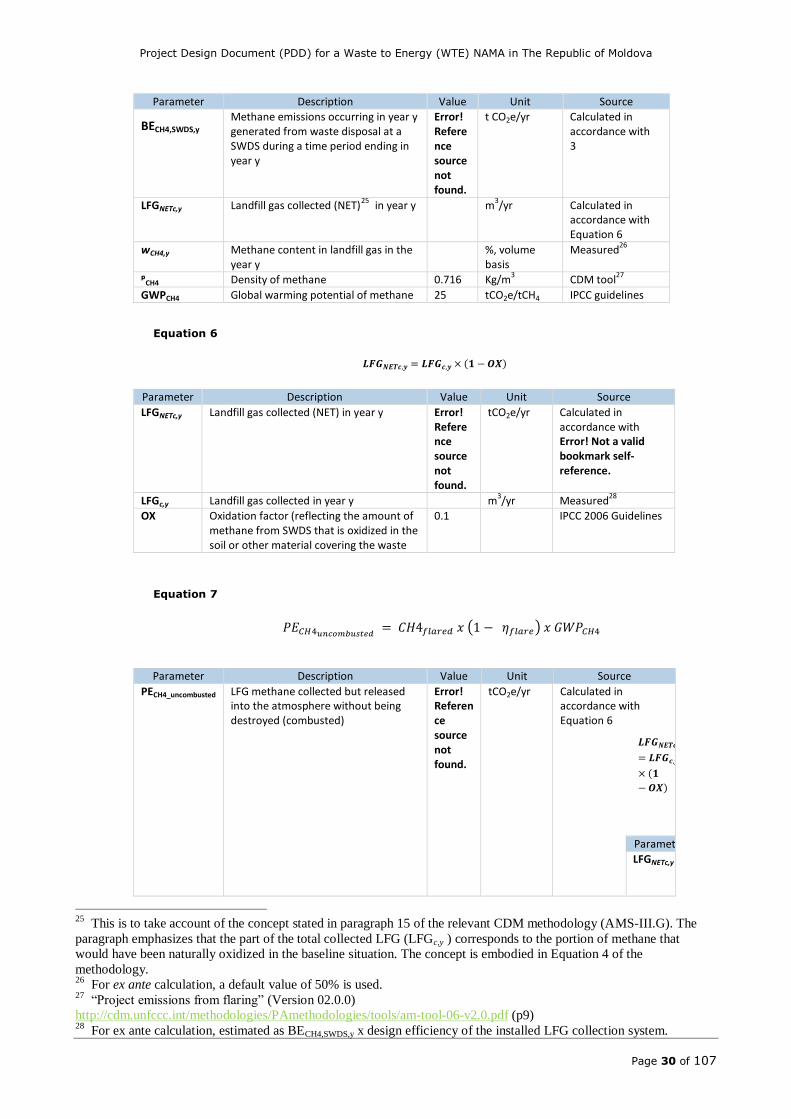
Parameter Description Value Unit Source
BECH4,SWDS,y
Methane emissions occurring in year y generated from waste disposal at a SWDS during a time period ending in year y
Error! Reference source not found.
t CO2e/yr Calculated in accordance with 3
LFGNETc,y Landfill gas collected (NET)25
in year y m3/yr Calculated in
accordance with Equation 6
wCH4,y Methane content in landfill gas in the year y
%, volume basis
Measured26
ᵖCH4 Density of methane 0.716 Kg/m3 CDM tool
27
GWPCH4 Global warming potential of methane 25 tCO2e/tCH4 IPCC guidelines
Equation 6
𝑳𝑭𝑮𝑵𝑬𝑻𝒄,𝒚 = 𝑳𝑭𝑮𝒄,𝒚 × (𝟏 − 𝑶𝑿)
Parameter Description Value Unit Source
LFGNETc,y Landfill gas collected (NET) in year y Error! Reference source not found.
tCO2e/yr Calculated in accordance with Error! Not a valid bookmark self-reference.
LFGc,y Landfill gas collected in year y m3/yr Measured
28
OX Oxidation factor (reflecting the amount of methane from SWDS that is oxidized in the soil or other material covering the waste
0.1 IPCC 2006 Guidelines
Equation 7
𝑃𝐸𝐶𝐻4𝑢𝑛𝑐𝑜𝑚𝑏𝑢𝑠𝑡𝑒𝑑 = 𝐶𝐻4𝑓𝑙𝑎𝑟𝑒𝑑 𝑥 (1 − 𝜂𝑓𝑙𝑎𝑟𝑒) 𝑥 𝐺𝑊𝑃𝐶𝐻4
Parameter Description Value Unit Source
PECH4_uncombusted LFG methane collected but released into the atmosphere without being destroyed (combusted)
Error! Reference source not found.
tCO2e/yr Calculated in accordance with Equation 6
𝑳𝑭𝑮𝑵𝑬𝑻𝒄,𝒚
= 𝑳𝑭𝑮𝒄,𝒚
× (𝟏
− 𝑶𝑿)
Parameter Description Value Unit Source
LFGNETc,y Landfill gas collected (NET) in year y Error! Reference
tCO2e/yr Calculated in accordance with Error! Not a valid
25
This is to take account of the concept stated in paragraph 15 of the relevant CDM methodology (AMS-III.G). The
paragraph emphasizes that the part of the total collected LFG (LFGc,y ) corresponds to the portion of methane that
would have been naturally oxidized in the baseline situation. The concept is embodied in Equation 4 of the
methodology. 26
For ex ante calculation, a default value of 50% is used. 27
“Project emissions from flaring” (Version 02.0.0)
http://cdm.unfccc.int/methodologies/PAmethodologies/tools/am-tool-06-v2.0.pdf (p9) 28
For ex ante calculation, estimated as BECH4,SWDS,y x design efficiency of the installed LFG collection system.
Project Design Document (PDD) for a Waste to Energy (WTE) NAMA in The Republic of Moldova
Page 31 of 107
source not found.
bookmark self-reference.
LFGc,y Landfill gas collected in year y m3/yr Measured
OX Oxidation factor (reflecting the amount of methane from SWDS that is oxidized in the soil or other material covering the waste
0.1 IPCC 2006 Guidelines
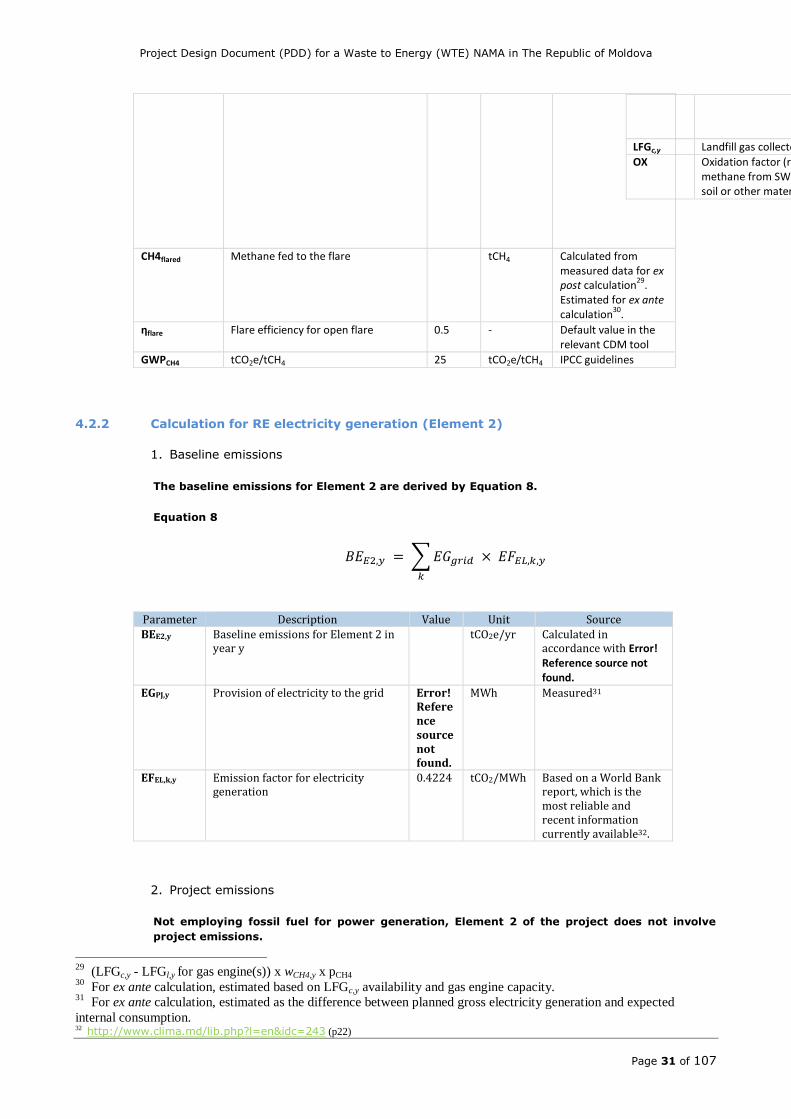
CH4flared Methane fed to the flare
tCH4 Calculated from measured data for ex post calculation
29.
Estimated for ex ante calculation
30.
ηflare Flare efficiency for open flare 0.5 - Default value in the relevant CDM tool
GWPCH4 tCO2e/tCH4 25 tCO2e/tCH4 IPCC guidelines
4.2.2 Calculation for RE electricity generation (Element 2)
1. Baseline emissions
The baseline emissions for Element 2 are derived by Equation 8.
Equation 8
𝐵𝐸𝐸2,𝑦 = ∑ 𝐸𝐺𝑔𝑟𝑖𝑑 × 𝐸𝐹𝐸𝐿,𝑘,𝑦
𝑘
Parameter Description Value Unit Source BEE2,y Baseline emissions for Element 2 in
year y tCO2e/yr Calculated in
accordance with Error! Reference source not found.
EGPJ,y Provision of electricity to the grid Error! Reference source not found.
MWh Measured31
EFEL,k,y Emission factor for electricity generation
0.4224 tCO2/MWh Based on a World Bank report, which is the most reliable and recent information currently available32.
2. Project emissions
Not employing fossil fuel for power generation, Element 2 of the project does not involve
project emissions.
29
(LFGc,y - LFGl,y for gas engine(s)) x wCH4,y x pCH4 30
For ex ante calculation, estimated based on LFGc,y availability and gas engine capacity. 31
For ex ante calculation, estimated as the difference between planned gross electricity generation and expected
internal consumption. 32 http://www.clima.md/lib.php?l=en&idc=243 (p22)
Project Design Document (PDD) for a Waste to Energy (WTE) NAMA in The Republic of Moldova
Page 32 of 107
A point that needs elaboration in relation to project emissions is the treatment of internal
demand – consumption of electricity for the operation of the project (e.g. for the LFG
collection system and in the building used for the project). If a project generates 100 units of
renewable energy (RE) and devotes 10 of the 100 to internal consumption, the project’s
genuine contribution to RE power generation is not represented by its gross generation of
100 units (i.e. before internal consumption) but by its net generation of 90 (i.e. after internal
consumption).
It is added that for this reason, the RE generation contribution of the project is gauged by its
net grid export (i.e. after deducting internal consumption), rather than its gross generation
(i.e. before the deduction of internal consumption).
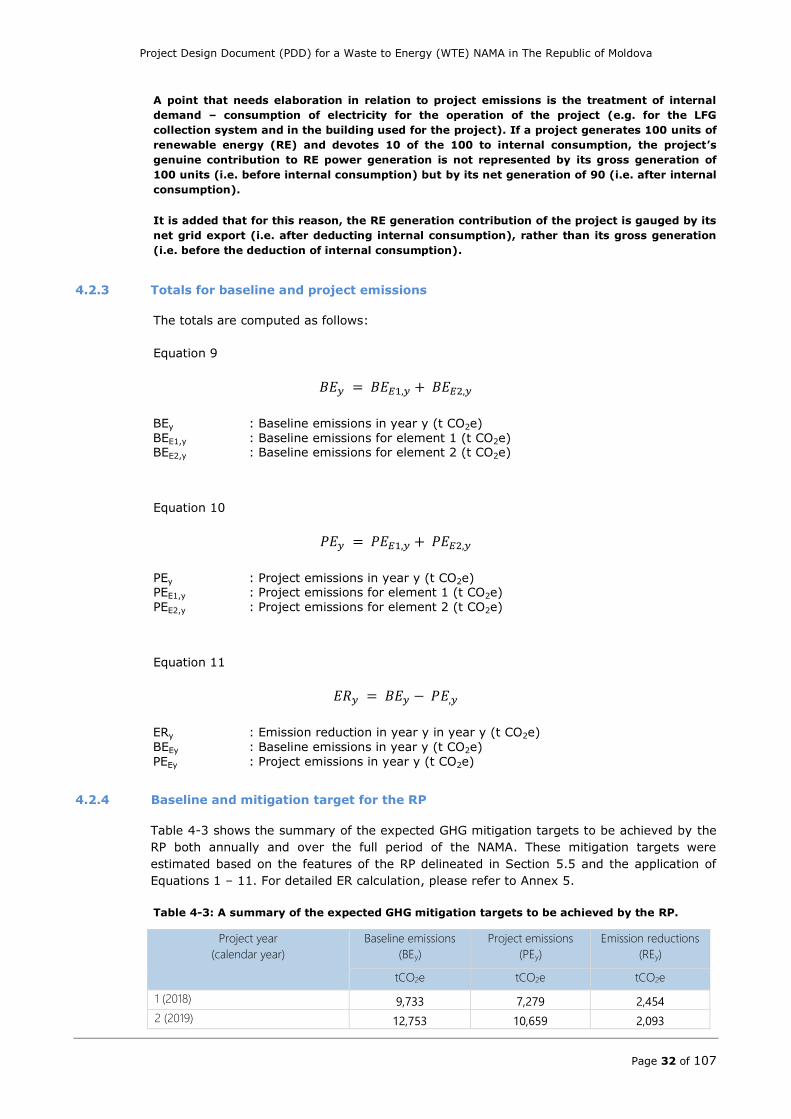
4.2.3 Totals for baseline and project emissions
The totals are computed as follows:
Equation 9
𝐵𝐸𝑦 = 𝐵𝐸𝐸1,𝑦 + 𝐵𝐸𝐸2,𝑦
BEy : Baseline emissions in year y (t CO2e)
BEE1,y : Baseline emissions for element 1 (t CO2e) BEE2,y : Baseline emissions for element 2 (t CO2e)
Equation 10
𝑃𝐸𝑦 = 𝑃𝐸𝐸1,𝑦 + 𝑃𝐸𝐸2,𝑦
PEy : Project emissions in year y (t CO2e) PEE1,y : Project emissions for element 1 (t CO2e)
PEE2,y : Project emissions for element 2 (t CO2e)
Equation 11
𝐸𝑅𝑦 = 𝐵𝐸𝑦 − 𝑃𝐸,𝑦
ERy : Emission reduction in year y in year y (t CO2e)
BEEy : Baseline emissions in year y (t CO2e)
PEEy : Project emissions in year y (t CO2e)
4.2.4 Baseline and mitigation target for the RP
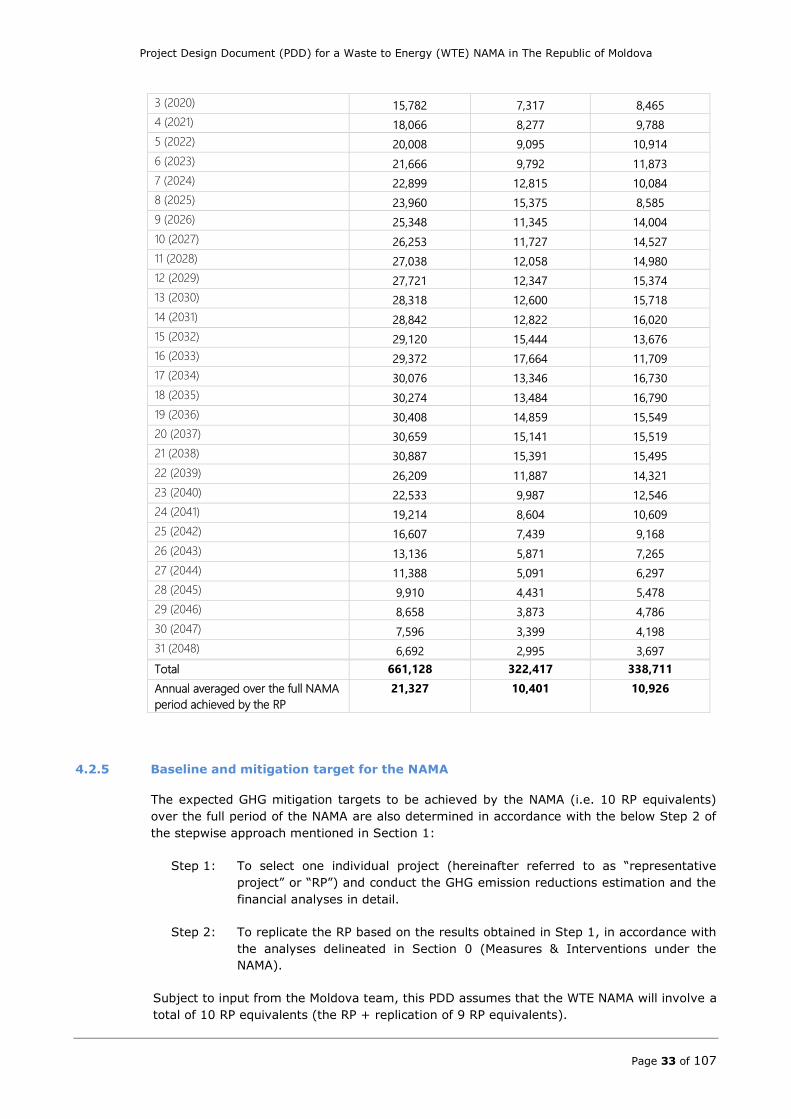
Table 4-3 shows the summary of the expected GHG mitigation targets to be achieved by the
RP both annually and over the full period of the NAMA. These mitigation targets were
estimated based on the features of the RP delineated in Section 5.5 and the application of
Equations 1 – 11. For detailed ER calculation, please refer to Annex 5.
Table 4-3: A summary of the expected GHG mitigation targets to be achieved by the RP.
Project year
(calendar year)
Baseline emissions
(BEy)
Project emissions
(PEy)
Emission reductions
(REy)
tCO2e tCO2e tCO2e
1 (2018) 9,733 7,279 2,454
2 (2019) 12,753 10,659 2,093
Project Design Document (PDD) for a Waste to Energy (WTE) NAMA in The Republic of Moldova
Page 33 of 107
3 (2020) 15,782 7,317 8,465
4 (2021) 18,066 8,277 9,788
5 (2022) 20,008 9,095 10,914
6 (2023) 21,666 9,792 11,873
7 (2024) 22,899 12,815 10,084
8 (2025) 23,960 15,375 8,585
9 (2026) 25,348 11,345 14,004
10 (2027) 26,253 11,727 14,527
11 (2028) 27,038 12,058 14,980
12 (2029) 27,721 12,347 15,374
13 (2030) 28,318 12,600 15,718
14 (2031) 28,842 12,822 16,020
15 (2032) 29,120 15,444 13,676
16 (2033) 29,372 17,664 11,709
17 (2034) 30,076 13,346 16,730
18 (2035) 30,274 13,484 16,790
19 (2036) 30,408 14,859 15,549
20 (2037) 30,659 15,141 15,519
21 (2038) 30,887 15,391 15,495
22 (2039) 26,209 11,887 14,321
23 (2040) 22,533 9,987 12,546
24 (2041) 19,214 8,604 10,609
25 (2042) 16,607 7,439 9,168
26 (2043) 13,136 5,871 7,265
27 (2044) 11,388 5,091 6,297
28 (2045) 9,910 4,431 5,478
29 (2046) 8,658 3,873 4,786
30 (2047) 7,596 3,399 4,198
31 (2048) 6,692 2,995 3,697
Total 661,128 322,417 338,711
Annual averaged over the full NAMA
period achieved by the RP
21,327 10,401 10,926
4.2.5 Baseline and mitigation target for the NAMA
The expected GHG mitigation targets to be achieved by the NAMA (i.e. 10 RP equivalents)
over the full period of the NAMA are also determined in accordance with the below Step 2 of
the stepwise approach mentioned in Section 1:
Step 1: To select one individual project (hereinafter referred to as “representative
project” or “RP”) and conduct the GHG emission reductions estimation and the
financial analyses in detail.
Step 2: To replicate the RP based on the results obtained in Step 1, in accordance with
the analyses delineated in Section 0 (Measures & Interventions under the
NAMA).
Subject to input from the Moldova team, this PDD assumes that the WTE NAMA will involve a
total of 10 RP equivalents (the RP + replication of 9 RP equivalents).
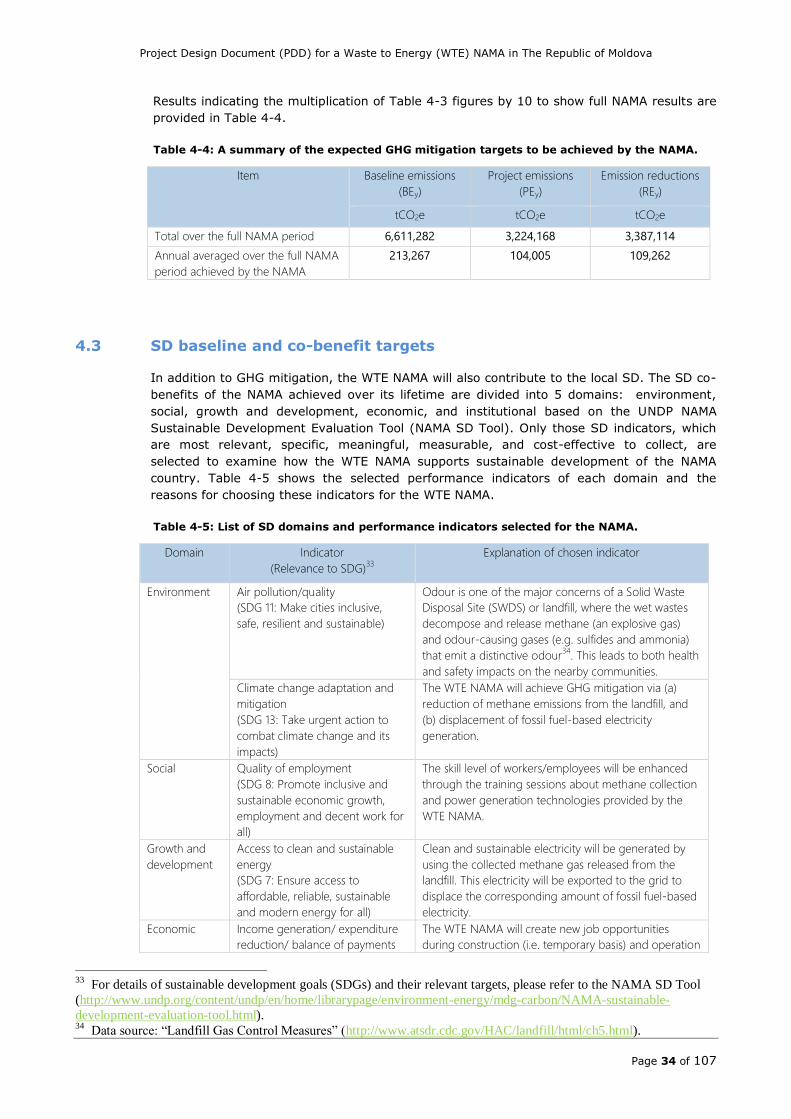
Project Design Document (PDD) for a Waste to Energy (WTE) NAMA in The Republic of Moldova
Page 34 of 107
Results indicating the multiplication of Table 4-3 figures by 10 to show full NAMA results are
provided in Table 4-4.
Table 4-4: A summary of the expected GHG mitigation targets to be achieved by the NAMA.
Item Baseline emissions
(BEy)
Project emissions
(PEy)
Emission reductions
(REy)
tCO2e tCO2e tCO2e
Total over the full NAMA period 6,611,282 3,224,168 3,387,114
Annual averaged over the full NAMA
period achieved by the NAMA
213,267 104,005 109,262
4.3 SD baseline and co-benefit targets
In addition to GHG mitigation, the WTE NAMA will also contribute to the local SD. The SD co-
benefits of the NAMA achieved over its lifetime are divided into 5 domains: environment,
social, growth and development, economic, and institutional based on the UNDP NAMA
Sustainable Development Evaluation Tool (NAMA SD Tool). Only those SD indicators, which
are most relevant, specific, meaningful, measurable, and cost-effective to collect, are
selected to examine how the WTE NAMA supports sustainable development of the NAMA
country. Table 4-5 shows the selected performance indicators of each domain and the
reasons for choosing these indicators for the WTE NAMA.
Table 4-5: List of SD domains and performance indicators selected for the NAMA.
Domain Indicator
(Relevance to SDG)33
Explanation of chosen indicator
Environment Air pollution/quality
(SDG 11: Make cities inclusive,
safe, resilient and sustainable)
Odour is one of the major concerns of a Solid Waste
Disposal Site (SWDS) or landfill, where the wet wastes
decompose and release methane (an explosive gas)
and odour-causing gases (e.g. sulfides and ammonia)
that emit a distinctive odour34
. This leads to both health
and safety impacts on the nearby communities.
Climate change adaptation and
mitigation
(SDG 13: Take urgent action to
combat climate change and its
impacts)
The WTE NAMA will achieve GHG mitigation via (a)
reduction of methane emissions from the landfill, and
(b) displacement of fossil fuel-based electricity
generation.
Social Quality of employment
(SDG 8: Promote inclusive and
sustainable economic growth,
employment and decent work for
all)
The skill level of workers/employees will be enhanced
through the training sessions about methane collection
and power generation technologies provided by the
WTE NAMA.
Growth and
development
Access to clean and sustainable
energy
(SDG 7: Ensure access to
affordable, reliable, sustainable
and modern energy for all)
Clean and sustainable electricity will be generated by
using the collected methane gas released from the
landfill. This electricity will be exported to the grid to
displace the corresponding amount of fossil fuel-based
electricity.
Economic Income generation/ expenditure
reduction/ balance of payments
The WTE NAMA will create new job opportunities
during construction (i.e. temporary basis) and operation
33
For details of sustainable development goals (SDGs) and their relevant targets, please refer to the NAMA SD Tool
(http://www.undp.org/content/undp/en/home/librarypage/environment-energy/mdg-carbon/NAMA-sustainable-
development-evaluation-tool.html). 34
Data source: “Landfill Gas Control Measures” (http://www.atsdr.cdc.gov/HAC/landfill/html/ch5.html).
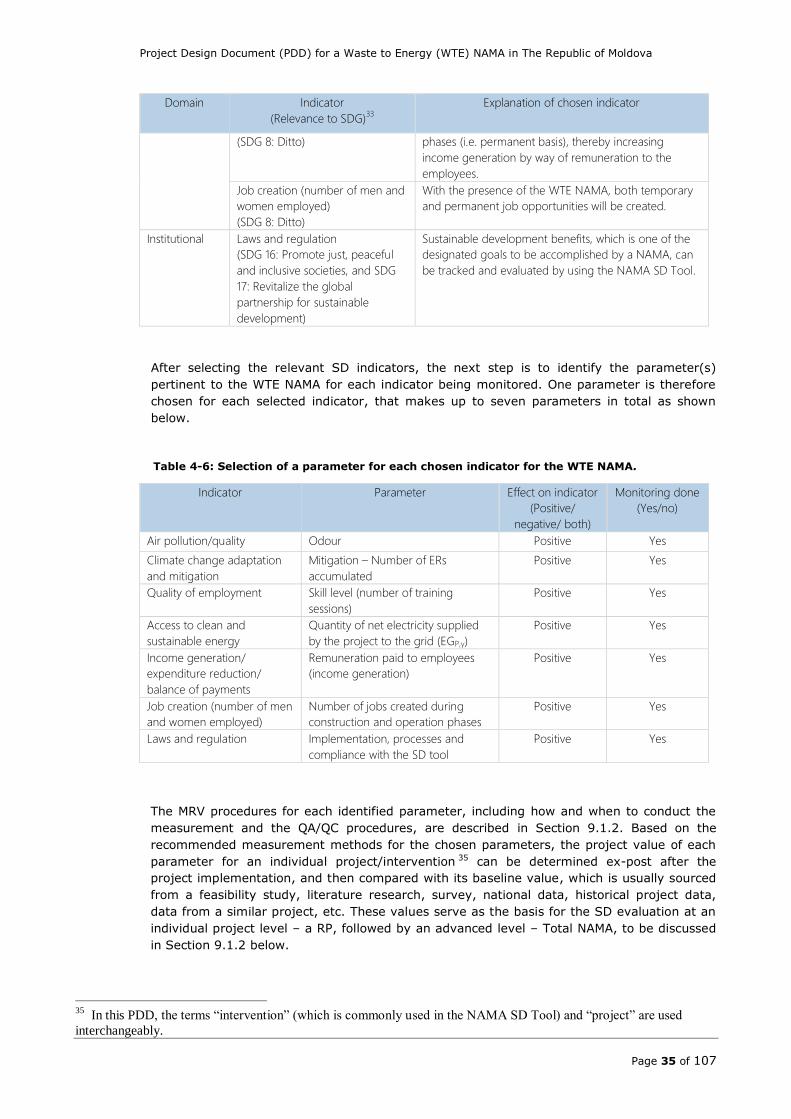
Project Design Document (PDD) for a Waste to Energy (WTE) NAMA in The Republic of Moldova
Page 35 of 107
Domain Indicator
(Relevance to SDG)33
Explanation of chosen indicator
(SDG 8: Ditto) phases (i.e. permanent basis), thereby increasing
income generation by way of remuneration to the
employees.
Job creation (number of men and
women employed)
(SDG 8: Ditto)
With the presence of the WTE NAMA, both temporary
and permanent job opportunities will be created.
Institutional Laws and regulation
(SDG 16: Promote just, peaceful
and inclusive societies, and SDG
17: Revitalize the global
partnership for sustainable
development)
Sustainable development benefits, which is one of the
designated goals to be accomplished by a NAMA, can
be tracked and evaluated by using the NAMA SD Tool.
After selecting the relevant SD indicators, the next step is to identify the parameter(s)
pertinent to the WTE NAMA for each indicator being monitored. One parameter is therefore
chosen for each selected indicator, that makes up to seven parameters in total as shown
below.
Table 4-6: Selection of a parameter for each chosen indicator for the WTE NAMA.
Indicator Parameter Effect on indicator
(Positive/
negative/ both)
Monitoring done
(Yes/no)
Air pollution/quality Odour Positive Yes
Climate change adaptation
and mitigation
Mitigation – Number of ERs
accumulated
Positive Yes
Quality of employment Skill level (number of training
sessions)
Positive Yes
Access to clean and
sustainable energy
Quantity of net electricity supplied
by the project to the grid (EGP,y)
Positive Yes
Income generation/
expenditure reduction/
balance of payments
Remuneration paid to employees
(income generation)
Positive Yes
Job creation (number of men
and women employed)
Number of jobs created during
construction and operation phases
Positive Yes
Laws and regulation Implementation, processes and
compliance with the SD tool
Positive Yes
The MRV procedures for each identified parameter, including how and when to conduct the
measurement and the QA/QC procedures, are described in Section 9.1.2. Based on the
recommended measurement methods for the chosen parameters, the project value of each
parameter for an individual project/intervention 35 can be determined ex-post after the
project implementation, and then compared with its baseline value, which is usually sourced
from a feasibility study, literature research, survey, national data, historical project data,
data from a similar project, etc. These values serve as the basis for the SD evaluation at an
individual project level – a RP, followed by an advanced level – Total NAMA, to be discussed
in Section 9.1.2 below.
35
In this PDD, the terms “intervention” (which is commonly used in the NAMA SD Tool) and “project” are used
interchangeably.
Project Design Document (PDD) for a Waste to Energy (WTE) NAMA in The Republic of Moldova
Page 36 of 107
4.4 Transformational Change
The NAMA intervention, coming in a sector with a dire need for improvement, has potential
for transformational change.
a. Innovation
Within the context of Moldova waste management, there currently is a “lack of
equipment for the waste collection and transportation, increasing quantity of
waste, lack of capacities for the waste disposal, no organized recycling system
for the moment, and a low level of public awareness about waste
management”36, landfill gas collection and flaring for safety purposes. The NAMA
activities consisting of landfill gas collection and power generation are innovative
technologies in that they offer significant leaps in reuse of waste material to help
satisfy a growing national energy demand.
b. Private sector37 involvement
Private sector can have various roles in a NAMA, including as equity investor,
debt investor, technology provider and formulator of a NAMA. Involvement of
private sector is seen as having a catalytic effect on transformational change38.
Mobilization of private sector financing in particular is seen as important for
scaling up of climate change mitigation efforts.
Being a new type of undertaking in the country and as part of a public service
sector, it is expected that the first wave of interventions for this WTE NAMA will
be carried out with domestic and international public sector funding.
Under the financial structure proposed in this document, however, private sector
involvement is encouraged to gradually increase as delineated in Section 0.
c. Impact beyond the scope of the project
As mentioned previously, waste management particularly in rural regions are
sometimes completely lacking. This poses sanitation problems for the population,
and also serious environmental problems including groundwater pollution.
Waste collection improvement and sanitary landfill construction planned under
the GIZ Feasibility Study will transform such waste management practices
entirely. However, these are considered non-NAMA interventions in that there
are no GHG reduction aspects to these activities.
The NAMA intervention, which is landfill gas capture and power generation, is
downstream of the abovementioned activities, and may have less direct
transformational impacts. Nevertheless, the NAMA will certainly add to the
improvements in the overall waste management system, with health and
environmental benefits trickling down to the general population. Specifically, the
NAMA provides (a) enhanced safety due to the combustion of landfill gas, (b)
improved odour and sanitation around the landfill site are direct positive impacts
often cited by residents surrounding existing landfill sites, (c) increased
36
Improvement of solid municipal waste management in the Republic of Moldova, 2014, Osteuropaverein
http://www.osteuropaverein.org/media/1547/mda.pdf 37
In this document, the term “private sector” refers to all entities other than central government units and includes
municipalities. 38
Potential for Transformational Change, NAMA Facility, 2015, http://www.nama-
facility.org/fileadmin/user_upload/pdf/NAMA_Facility_factsheet_transformational_change_potential.pdf
Project Design Document (PDD) for a Waste to Energy (WTE) NAMA in The Republic of Moldova
Page 37 of 107
electricity supply, and (d) depending on the overall system design, better
leachate management.
Other important impacts include:
An increase in use of native energy sources in a country which is highly
dependent on imported natural gas (Russia) and electricity (Ukraine and
Romania).
Strengthening of the institutional capacities of the national system to
bring Moldova onto a low-carbon development path, given that this is
one of four priority NAMA measures/interventions chosen by the
Moldovan government.
d. Replicability and scaling up
Moldova has a small population, with a total for the entire country being under 4
million39. Outside of the capital Chisinau that has a population of 0.7 million,
there are only five districts that have a population of over 0.1 million. Scaling up
is unlikely, taking into account economically (as well as environmentally) viable
transportation distance.
Replicability within Moldova will depend on the eventual design of the upstream
waste management services, i.e. the number of landfills etc. It is estimated that
the replicability potential is for 9 projects nationwide of a similar scale.
It is of note, however, that waste management issues are not unique to Moldova.
While not under the same NAMA umbrella, similar interventions with similar
financial structures modified as necessary to suit national circumstances, can be
encouraged in other non-Annex I countries, in particular neighbouring countries.
39
https://en.wikipedia.org/wiki/Demographics_of_Moldova#By_district
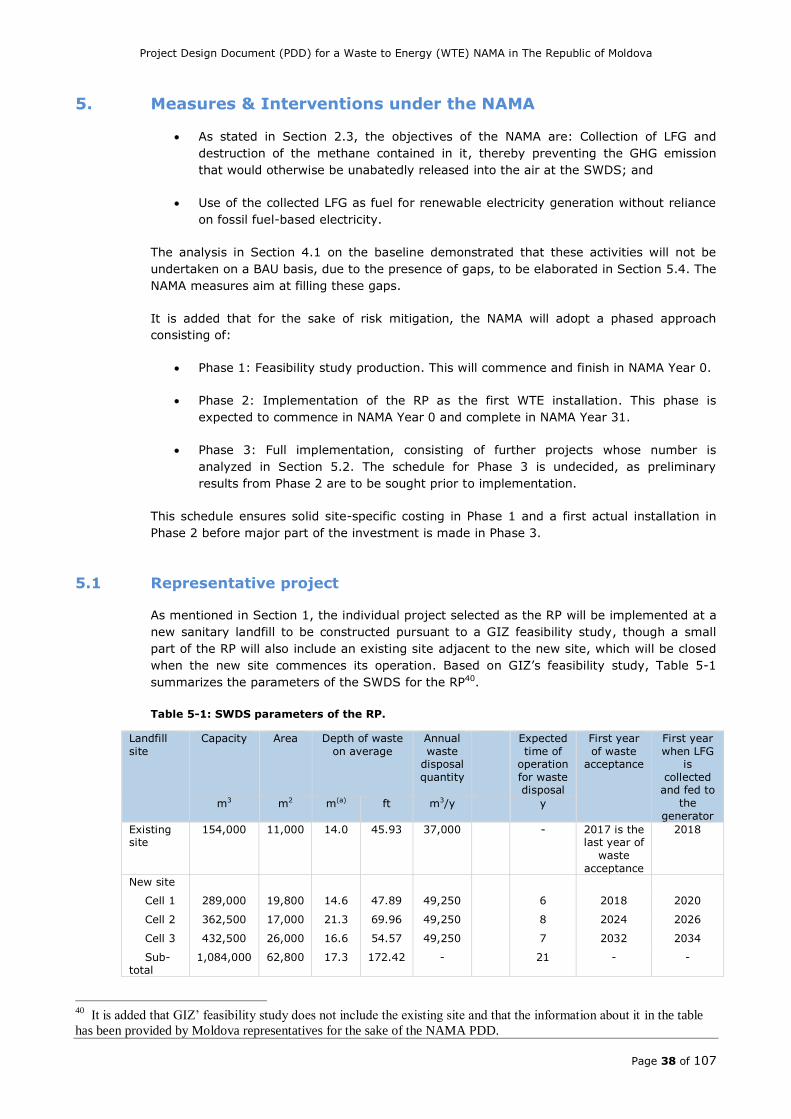
Project Design Document (PDD) for a Waste to Energy (WTE) NAMA in The Republic of Moldova
Page 38 of 107
5. Measures & Interventions under the NAMA
As stated in Section 2.3, the objectives of the NAMA are: Collection of LFG and
destruction of the methane contained in it, thereby preventing the GHG emission
that would otherwise be unabatedly released into the air at the SWDS; and
Use of the collected LFG as fuel for renewable electricity generation without reliance
on fossil fuel-based electricity.
The analysis in Section 4.1 on the baseline demonstrated that these activities will not be
undertaken on a BAU basis, due to the presence of gaps, to be elaborated in Section 5.4. The
NAMA measures aim at filling these gaps.
It is added that for the sake of risk mitigation, the NAMA will adopt a phased approach
consisting of:
Phase 1: Feasibility study production. This will commence and finish in NAMA Year 0.
Phase 2: Implementation of the RP as the first WTE installation. This phase is
expected to commence in NAMA Year 0 and complete in NAMA Year 31.
Phase 3: Full implementation, consisting of further projects whose number is
analyzed in Section 5.2. The schedule for Phase 3 is undecided, as preliminary
results from Phase 2 are to be sought prior to implementation.
This schedule ensures solid site-specific costing in Phase 1 and a first actual installation in
Phase 2 before major part of the investment is made in Phase 3.
5.1 Representative project
As mentioned in Section 1, the individual project selected as the RP will be implemented at a
new sanitary landfill to be constructed pursuant to a GIZ feasibility study, though a small
part of the RP will also include an existing site adjacent to the new site, which will be closed
when the new site commences its operation. Based on GIZ’s feasibility study, Table 5-1
summarizes the parameters of the SWDS for the RP40.
Table 5-1: SWDS parameters of the RP.
Landfill
site
Capacity Area Depth of waste
on average
Annual
waste disposal
quantity
Expected
time of operation
for waste disposal
First year
of waste acceptance
First year
when LFG is
collected and fed to
the
generator m3 m2 m(a) ft m3/y y
Existing site
154,000
11,000 14.0
45.93
37,000 - 2017 is the
last year of
waste
acceptance
2018
New site
Cell 1 289,000 19,800 14.6 47.89 49,250 6 2018 2020
Cell 2 362,500 17,000 21.3 69.96 49,250 8 2024 2026
Cell 3 432,500 26,000 16.6 54.57 49,250 7 2032 2034
Sub-total
1,084,000 62,800 17.3 172.42 - 21 - -
40
It is added that GIZ’ feasibility study does not include the existing site and that the information about it in the table
has been provided by Moldova representatives for the sake of the NAMA PDD.
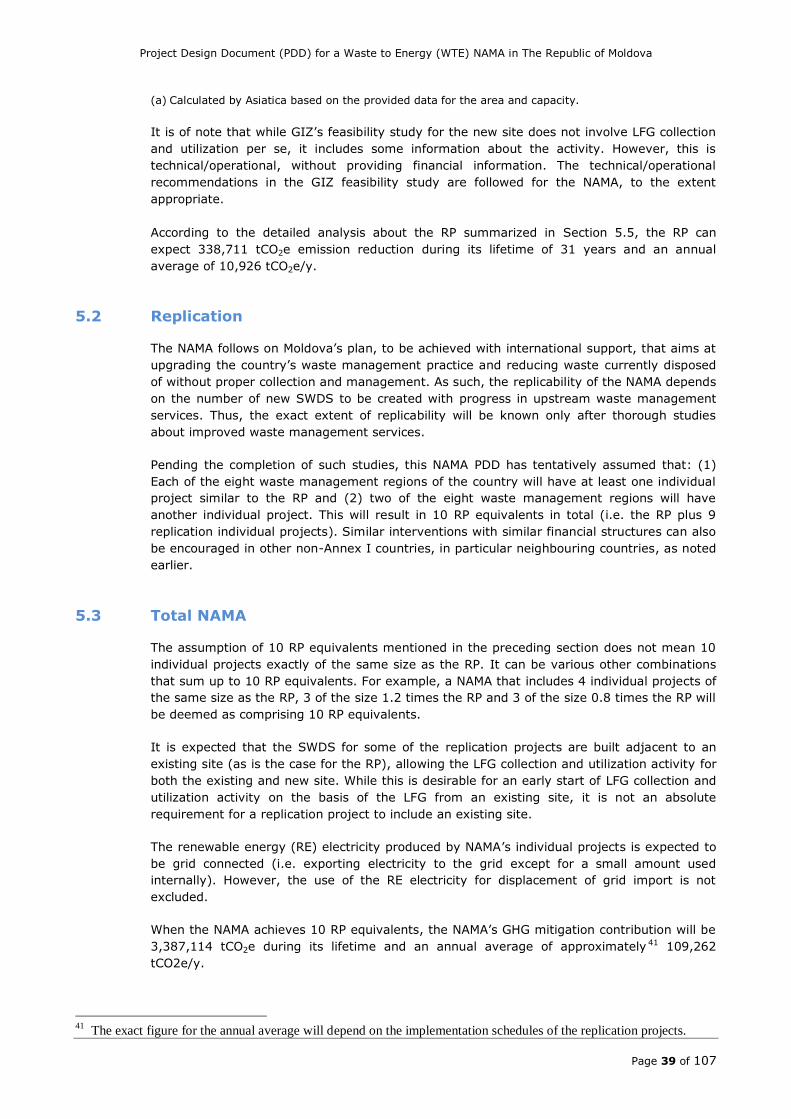
Project Design Document (PDD) for a Waste to Energy (WTE) NAMA in The Republic of Moldova
Page 39 of 107
(a) Calculated by Asiatica based on the provided data for the area and capacity.
It is of note that while GIZ’s feasibility study for the new site does not involve LFG collection
and utilization per se, it includes some information about the activity. However, this is
technical/operational, without providing financial information. The technical/operational
recommendations in the GIZ feasibility study are followed for the NAMA, to the extent
appropriate.
According to the detailed analysis about the RP summarized in Section 5.5, the RP can
expect 338,711 tCO2e emission reduction during its lifetime of 31 years and an annual
average of 10,926 tCO2e/y.
5.2 Replication
The NAMA follows on Moldova’s plan, to be achieved with international support, that aims at
upgrading the country’s waste management practice and reducing waste currently disposed
of without proper collection and management. As such, the replicability of the NAMA depends
on the number of new SWDS to be created with progress in upstream waste management
services. Thus, the exact extent of replicability will be known only after thorough studies
about improved waste management services.
Pending the completion of such studies, this NAMA PDD has tentatively assumed that: (1)
Each of the eight waste management regions of the country will have at least one individual
project similar to the RP and (2) two of the eight waste management regions will have
another individual project. This will result in 10 RP equivalents in total (i.e. the RP plus 9
replication individual projects). Similar interventions with similar financial structures can also
be encouraged in other non-Annex I countries, in particular neighbouring countries, as noted
earlier.
5.3 Total NAMA
The assumption of 10 RP equivalents mentioned in the preceding section does not mean 10
individual projects exactly of the same size as the RP. It can be various other combinations
that sum up to 10 RP equivalents. For example, a NAMA that includes 4 individual projects of
the same size as the RP, 3 of the size 1.2 times the RP and 3 of the size 0.8 times the RP will
be deemed as comprising 10 RP equivalents.
It is expected that the SWDS for some of the replication projects are built adjacent to an
existing site (as is the case for the RP), allowing the LFG collection and utilization activity for
both the existing and new site. While this is desirable for an early start of LFG collection and
utilization activity on the basis of the LFG from an existing site, it is not an absolute
requirement for a replication project to include an existing site.
The renewable energy (RE) electricity produced by NAMA’s individual projects is expected to
be grid connected (i.e. exporting electricity to the grid except for a small amount used
internally). However, the use of the RE electricity for displacement of grid import is not
excluded.
When the NAMA achieves 10 RP equivalents, the NAMA’s GHG mitigation contribution will be
3,387,114 tCO2e during its lifetime and an annual average of approximately 41 109,262
tCO2e/y.
41
The exact figure for the annual average will depend on the implementation schedules of the replication projects.
Project Design Document (PDD) for a Waste to Energy (WTE) NAMA in The Republic of Moldova
Page 40 of 107
5.4 Gap and barrier analyses and identification of measures
The analysis in Section 4.1 on the baseline demonstrated that these activities will not be
undertaken on a BAU basis, due to presence of gaps. One of them is financial as delineated
in Section 0. The other is capacity building / awareness building needs discussed in Section
0.
By filling these gaps through NAMA measures, the NAMA aims at enabling the
implementation of the afore-mentioned activities, thereby mitigating GHG emissions via: (a)
collection of LFG emitted from the MSW at the SWDS and destruction of the methane
contained in it, and (b) reduction of fossil fuel-based electricity generation by using the
collected LFG for renewable electricity generation. The NAMA will also provide SD co-benefits
in addition to the reduction of GHG emissions, as elaborated in Section 4.3.
5.5 Further details about RP
1. Capacity of the SWDS
The selected RP is composed of an existing site and a new sanitary landfill, adjacent to each
other. The solid waste has been disposed in one of the pits at the existing site since the early
1990s and it is expected that all the pits at the existing site, which has a waste disposal
capacity of 154,000 m3 (=11,000 m2 x 14 m), will be filled completely prior to the operation
of the new site.
The new site has a waste disposal capacity of 1,084,000 m3 and will be divided into 3 cells to
be constructed and filled with waste in phases. Cell 1 will be built along with the new site
construction in 2018 and started for waste disposal at the same year and in parallel with the
installation of the vertical gas wells and pipes. With the annual waste disposal quantity of
49,250 m3/y, it is anticipated that the lifetime of Cell 1 is approximately 6 years. Cell 2 will
then be constructed in-sequence and in parallel with the waste disposal in 2024. Based on
the same waste disposal rate, Cell 2 is expected to be fully filled in about 8 years. Following
this project implementation plan, Cell 3 will be constructed at the latest and is to be filled
from 2032 for another 7 years. This makes up the total lifetime of the new site of 21 years.
Table 5-2, which is reproduced from Table 1-1, summarizes the SWDS parameters of the RP.
Table 5-2: SWDS parameters of the RP.
Landfill
site
Capacity Area Depth of waste
on average
Annual
waste
disposal quantity
Expected
time of
operation for waste
disposal
First year
of waste
acceptance
First year
when LFG
is collected
and fed to the
generator m3 m2 m(a) ft m3/y y
Existing
site
154,000
11,000 14.0
45.93
37,000 - 2017 is the
last year of waste
acceptance
2018
New site
Cell 1 289,000 19,800 14.6 47.89 49,250 6 2018 2020
Cell 2 362,500 17,000 21.3 69.96 49,250 8 2024 2026
Cell 3 432,500 26,000 16.6 54.57 49,250 7 2032 2034
Sub-
total
1,084,000 62,800 17.3 172.42 - 21 - -
(a) Calculated based on the provided data for the area and capacity.
2. Waste composition
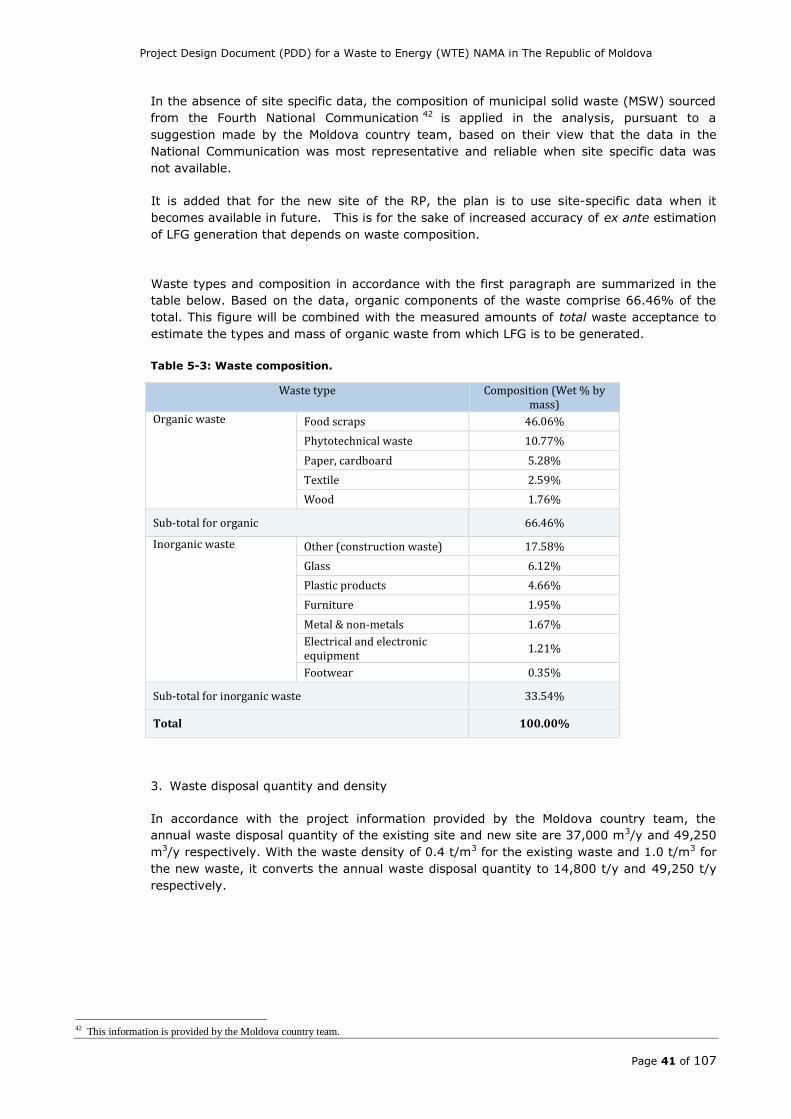
Project Design Document (PDD) for a Waste to Energy (WTE) NAMA in The Republic of Moldova
Page 41 of 107
In the absence of site specific data, the composition of municipal solid waste (MSW) sourced
from the Fourth National Communication 42 is applied in the analysis, pursuant to a
suggestion made by the Moldova country team, based on their view that the data in the
National Communication was most representative and reliable when site specific data was
not available.
It is added that for the new site of the RP, the plan is to use site-specific data when it
becomes available in future. This is for the sake of increased accuracy of ex ante estimation
of LFG generation that depends on waste composition.
Waste types and composition in accordance with the first paragraph are summarized in the
table below. Based on the data, organic components of the waste comprise 66.46% of the
total. This figure will be combined with the measured amounts of total waste acceptance to
estimate the types and mass of organic waste from which LFG is to be generated.
Table 5-3: Waste composition.
Waste type Composition (Wet % by mass)
Organic waste Food scraps 46.06%
Phytotechnical waste 10.77%
Paper, cardboard 5.28%
Textile 2.59%
Wood 1.76%
Sub-total for organic 66.46%
Inorganic waste Other (construction waste) 17.58%
Glass 6.12%
Plastic products 4.66%
Furniture 1.95%
Metal & non-metals 1.67%
Electrical and electronic equipment
1.21%
Footwear 0.35%
Sub-total for inorganic waste 33.54%
Total 100.00%
3. Waste disposal quantity and density
In accordance with the project information provided by the Moldova country team, the
annual waste disposal quantity of the existing site and new site are 37,000 m3/y and 49,250
m3/y respectively. With the waste density of 0.4 t/m3 for the existing waste and 1.0 t/m3 for
the new waste, it converts the annual waste disposal quantity to 14,800 t/y and 49,250 t/y
respectively.
42 This information is provided by the Moldova country team.
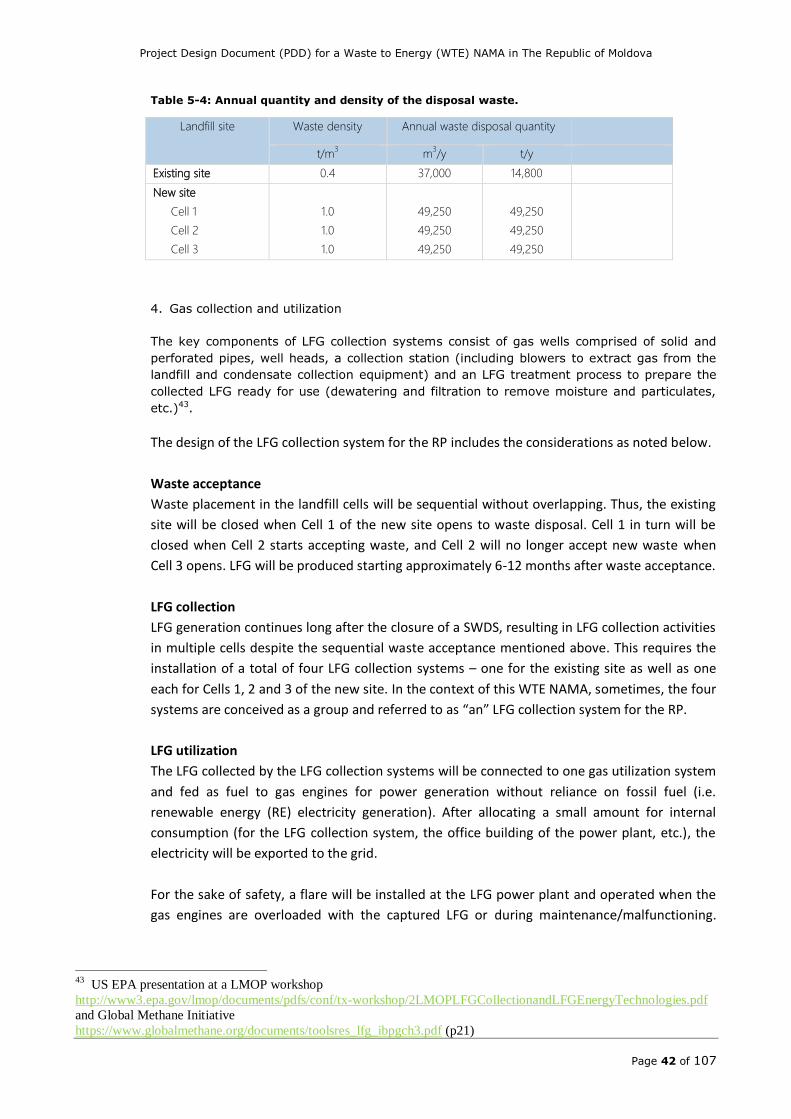
Project Design Document (PDD) for a Waste to Energy (WTE) NAMA in The Republic of Moldova
Page 42 of 107
Table 5-4: Annual quantity and density of the disposal waste.
Landfill site Waste density Annual waste disposal quantity
t/m3 m
3/y t/y
Existing site 0.4 37,000 14,800
New site
Cell 1 1.0 49,250 49,250
Cell 2 1.0 49,250 49,250
Cell 3 1.0 49,250 49,250
4. Gas collection and utilization
The key components of LFG collection systems consist of gas wells comprised of solid and
perforated pipes, well heads, a collection station (including blowers to extract gas from the
landfill and condensate collection equipment) and an LFG treatment process to prepare the
collected LFG ready for use (dewatering and filtration to remove moisture and particulates,
etc.)43.
The design of the LFG collection system for the RP includes the considerations as noted below.
Waste acceptance
Waste placement in the landfill cells will be sequential without overlapping. Thus, the existing
site will be closed when Cell 1 of the new site opens to waste disposal. Cell 1 in turn will be
closed when Cell 2 starts accepting waste, and Cell 2 will no longer accept new waste when
Cell 3 opens. LFG will be produced starting approximately 6-12 months after waste acceptance.
LFG collection
LFG generation continues long after the closure of a SWDS, resulting in LFG collection activities
in multiple cells despite the sequential waste acceptance mentioned above. This requires the
installation of a total of four LFG collection systems – one for the existing site as well as one
each for Cells 1, 2 and 3 of the new site. In the context of this WTE NAMA, sometimes, the four
systems are conceived as a group and referred to as “an” LFG collection system for the RP.
LFG utilization
The LFG collected by the LFG collection systems will be connected to one gas utilization system
and fed as fuel to gas engines for power generation without reliance on fossil fuel (i.e.
renewable energy (RE) electricity generation). After allocating a small amount for internal
consumption (for the LFG collection system, the office building of the power plant, etc.), the
electricity will be exported to the grid.
For the sake of safety, a flare will be installed at the LFG power plant and operated when the
gas engines are overloaded with the captured LFG or during maintenance/malfunctioning.
43
US EPA presentation at a LMOP workshop
http://www3.epa.gov/lmop/documents/pdfs/conf/tx-workshop/2LMOPLFGCollectionandLFGEnergyTechnologies.pdf
and Global Methane Initiative
https://www.globalmethane.org/documents/toolsres_lfg_ibpgch3.pdf (p21)
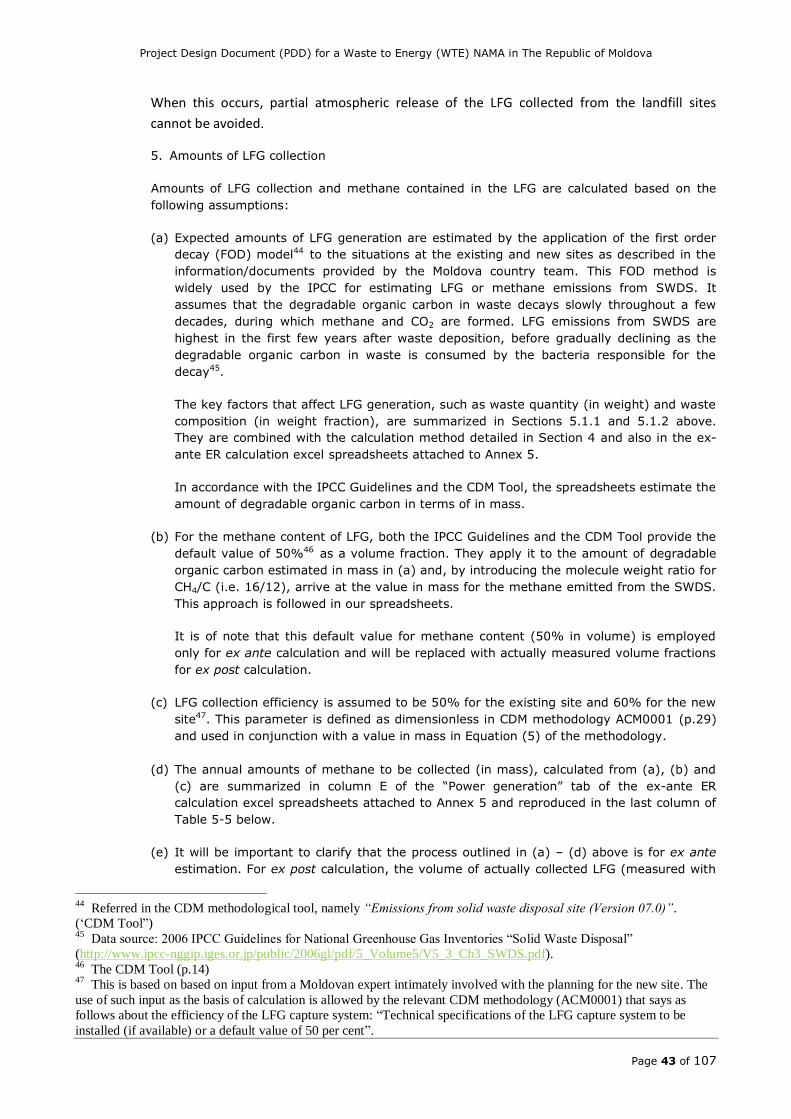
Project Design Document (PDD) for a Waste to Energy (WTE) NAMA in The Republic of Moldova
Page 43 of 107
When this occurs, partial atmospheric release of the LFG collected from the landfill sites
cannot be avoided.
5. Amounts of LFG collection
Amounts of LFG collection and methane contained in the LFG are calculated based on the
following assumptions:
(a) Expected amounts of LFG generation are estimated by the application of the first order
decay (FOD) model44 to the situations at the existing and new sites as described in the
information/documents provided by the Moldova country team. This FOD method is
widely used by the IPCC for estimating LFG or methane emissions from SWDS. It
assumes that the degradable organic carbon in waste decays slowly throughout a few
decades, during which methane and CO2 are formed. LFG emissions from SWDS are
highest in the first few years after waste deposition, before gradually declining as the
degradable organic carbon in waste is consumed by the bacteria responsible for the
decay45.
The key factors that affect LFG generation, such as waste quantity (in weight) and waste
composition (in weight fraction), are summarized in Sections 5.1.1 and 5.1.2 above.
They are combined with the calculation method detailed in Section 4 and also in the ex-
ante ER calculation excel spreadsheets attached to Annex 5.
In accordance with the IPCC Guidelines and the CDM Tool, the spreadsheets estimate the
amount of degradable organic carbon in terms of in mass.
(b) For the methane content of LFG, both the IPCC Guidelines and the CDM Tool provide the
default value of 50%46 as a volume fraction. They apply it to the amount of degradable
organic carbon estimated in mass in (a) and, by introducing the molecule weight ratio for
CH4/C (i.e. 16/12), arrive at the value in mass for the methane emitted from the SWDS.
This approach is followed in our spreadsheets.
It is of note that this default value for methane content (50% in volume) is employed
only for ex ante calculation and will be replaced with actually measured volume fractions
for ex post calculation.
(c) LFG collection efficiency is assumed to be 50% for the existing site and 60% for the new
site47. This parameter is defined as dimensionless in CDM methodology ACM0001 (p.29)
and used in conjunction with a value in mass in Equation (5) of the methodology.
(d) The annual amounts of methane to be collected (in mass), calculated from (a), (b) and
(c) are summarized in column E of the “Power generation” tab of the ex-ante ER
calculation excel spreadsheets attached to Annex 5 and reproduced in the last column of
Table 5-5 below.
(e) It will be important to clarify that the process outlined in (a) – (d) above is for ex ante
estimation. For ex post calculation, the volume of actually collected LFG (measured with
44
Referred in the CDM methodological tool, namely “Emissions from solid waste disposal site (Version 07.0)”.
(‘CDM Tool”) 45
Data source: 2006 IPCC Guidelines for National Greenhouse Gas Inventories “Solid Waste Disposal”
(http://www.ipcc-nggip.iges.or.jp/public/2006gl/pdf/5_Volume5/V5_3_Ch3_SWDS.pdf). 46
The CDM Tool (p.14) 47
This is based on based on input from a Moldovan expert intimately involved with the planning for the new site. The
use of such input as the basis of calculation is allowed by the relevant CDM methodology (ACM0001) that says as
follows about the efficiency of the LFG capture system: “Technical specifications of the LFG capture system to be
installed (if available) or a default value of 50 per cent”.
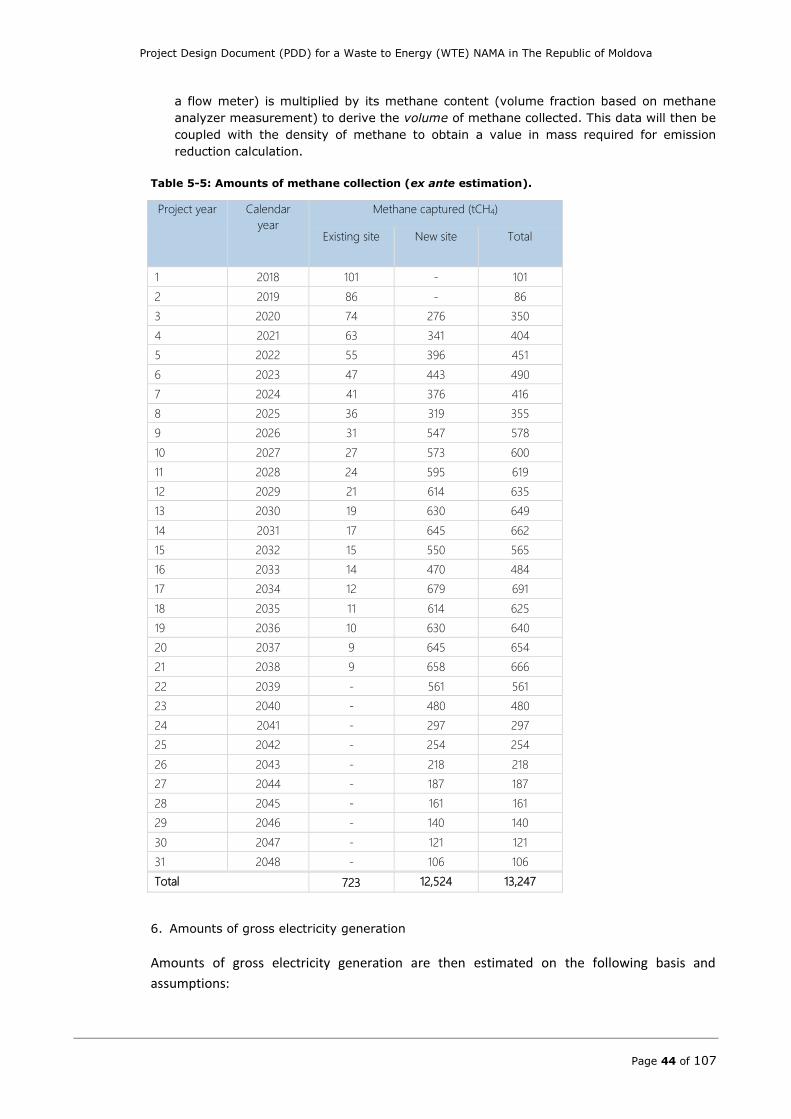
Project Design Document (PDD) for a Waste to Energy (WTE) NAMA in The Republic of Moldova
Page 44 of 107
a flow meter) is multiplied by its methane content (volume fraction based on methane
analyzer measurement) to derive the volume of methane collected. This data will then be
coupled with the density of methane to obtain a value in mass required for emission
reduction calculation.
Table 5-5: Amounts of methane collection (ex ante estimation).
Project year
Calendar
year
Methane captured (tCH4)
Existing site New site Total
1 2018 101 - 101
2 2019 86 - 86
3 2020 74 276 350
4 2021 63 341 404
5 2022 55 396 451
6 2023 47 443 490
7 2024 41 376 416
8 2025 36 319 355
9 2026 31 547 578
10 2027 27 573 600
11 2028 24 595 619
12 2029 21 614 635
13 2030 19 630 649
14 2031 17 645 662
15 2032 15 550 565
16 2033 14 470 484
17 2034 12 679 691
18 2035 11 614 625
19 2036 10 630 640
20 2037 9 645 654
21 2038 9 658 666
22 2039 - 561 561
23 2040 - 480 480
24 2041 - 297 297
25 2042 - 254 254
26 2043 - 218 218
27 2044 - 187 187
28 2045 - 161 161
29 2046 - 140 140
30 2047 - 121 121
31 2048 - 106 106
Total 723 12,524 13,247
6. Amounts of gross electricity generation
Amounts of gross electricity generation are then estimated on the following basis and
assumptions:
Project Design Document (PDD) for a Waste to Energy (WTE) NAMA in The Republic of Moldova
Page 45 of 107
(a) With an assumption of 33% for power generation efficiency and the default heat value of methane of 50.4 MJ/kg CH4, the following equation shows that 1 tonne of methane is capable of generating 4.62 MWh of electricity.
1 𝑡𝐶𝐻4 × 50.4 𝑀𝐽 𝑘𝑔 𝐶𝐻4 × 1000 𝑘𝑔 𝑡⁄ × 33% ÷ 3,600 𝑀𝐽 𝑀𝑊ℎ⁄ = 4.62 𝑀𝑊ℎ⁄
(b) Combination of this value with the amounts derived in Section 5.5.5.(e) above allows the calculation of the annual amounts of electricity that can potentially be generated from the methane contained in the collected LFG.
(c) Based on these amounts, required capacities of gas engines to be installed were determined. Taking project year 1 as an example, the potential amount of power generation is calculated by multiplying the total methane capture in year 1 (101 tCH4) and the power generation capability from a unit of methane (4.62 MWh/tCH4) as follows:
101𝑡𝐶𝐻4 × 4.62 𝑀𝑊ℎ 𝑡𝐶𝐻4⁄ = 468 𝑀𝑊ℎ 𝑦⁄
With the power generation capacity of a 100 kW (or 0.1 MW) gas engine being equivalent
to 876 MWh/y (=0.1 MW x 8760 h/y), the capacity factor48 of the power generation
facility for year 1 equals to 0.53, as calculated below:
468 𝑀𝑊ℎ 𝑦⁄ ÷ 876 𝑀𝑊ℎ 𝑦⁄ = 0.53
Following the same calculation approach for other years, the engine capacity should have a minimum level of 100 kW up to a maximum of 400 kW during the peak years of LFG generation.
(d) Expected gross amounts of annual electricity generation at the planned power generation facility correspond to smaller of the following two values: Value 1 (MWh/y): Methane collected in the year (tCH4) x 4.62 MWh/tCH4
Value 2 (MWh/y): Installed capacity (kW) x 0.001MW/kW x 8,760 h/y x 0.9549 They are calculated in column I of the “Power generation” tab of the ex-ante ER
calculation excel spreadsheets attached to Annex 5 and reproduced in
48
Actual output divided by potential output at full capacity. Please see the following link for more detail.
https://en.wikipedia.org/wiki/Capacity_factor 49
Considered by many as the maximum capacity factor achievable on an annual basis.
Project Design Document (PDD) for a Waste to Energy (WTE) NAMA in The Republic of Moldova
Page 46 of 107
Table 5-6 below.
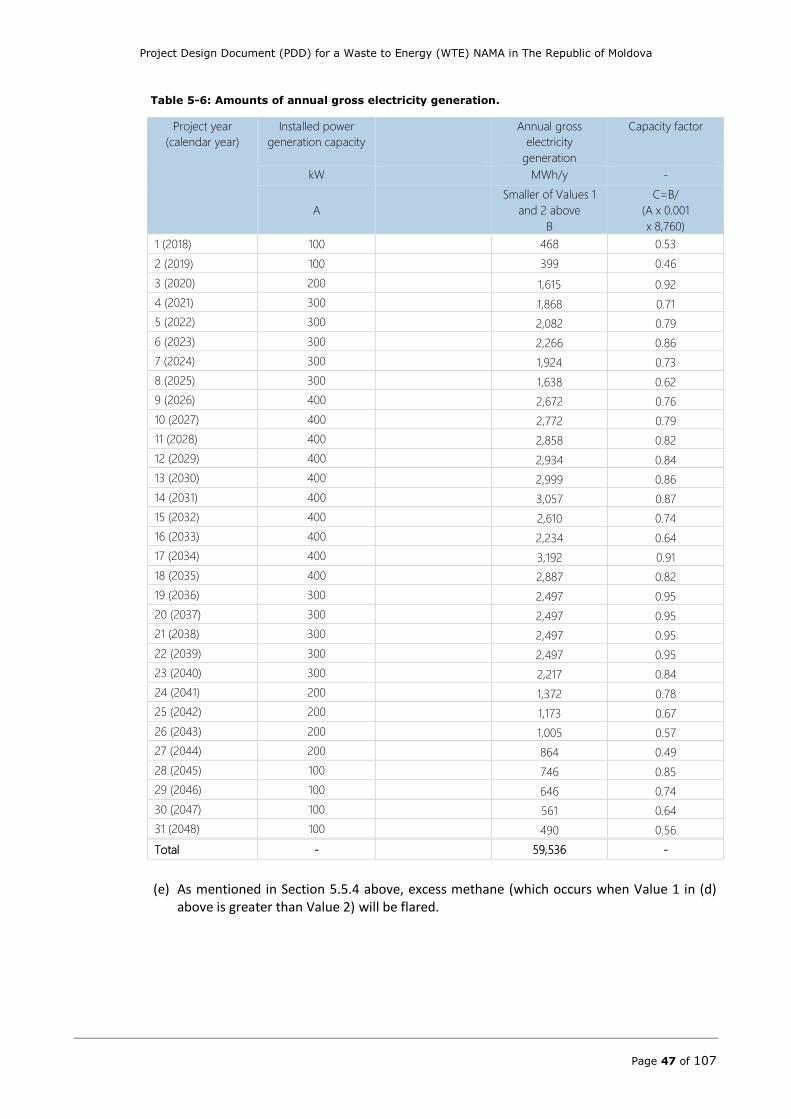
Project Design Document (PDD) for a Waste to Energy (WTE) NAMA in The Republic of Moldova
Page 47 of 107
Table 5-6: Amounts of annual gross electricity generation.
Project year
(calendar year)
Installed power
generation capacity
Annual gross
electricity
generation
Capacity factor
kW MWh/y -
A
Smaller of Values 1
and 2 above
B
C=B/
(A x 0.001
x 8,760)
1 (2018) 100 468 0.53
2 (2019) 100 399 0.46
3 (2020) 200 1,615 0.92
4 (2021) 300 1,868 0.71
5 (2022) 300 2,082 0.79
6 (2023) 300 2,266 0.86
7 (2024) 300 1,924 0.73
8 (2025) 300 1,638 0.62
9 (2026) 400 2,672 0.76
10 (2027) 400 2,772 0.79
11 (2028) 400 2,858 0.82
12 (2029) 400 2,934 0.84
13 (2030) 400 2,999 0.86
14 (2031) 400 3,057 0.87
15 (2032) 400 2,610 0.74
16 (2033) 400 2,234 0.64
17 (2034) 400 3,192 0.91
18 (2035) 400 2,887 0.82
19 (2036) 300 2,497 0.95
20 (2037) 300 2,497 0.95
21 (2038) 300 2,497 0.95
22 (2039) 300 2,497 0.95
23 (2040) 300 2,217 0.84
24 (2041) 200 1,372 0.78
25 (2042) 200 1,173 0.67
26 (2043) 200 1,005 0.57
27 (2044) 200 864 0.49
28 (2045) 100 746 0.85
29 (2046) 100 646 0.74
30 (2047) 100 561 0.64
31 (2048) 100 490 0.56
Total - 59,536 -
(e) As mentioned in Section 5.5.4 above, excess methane (which occurs when Value 1 in (d) above is greater than Value 2) will be flared.
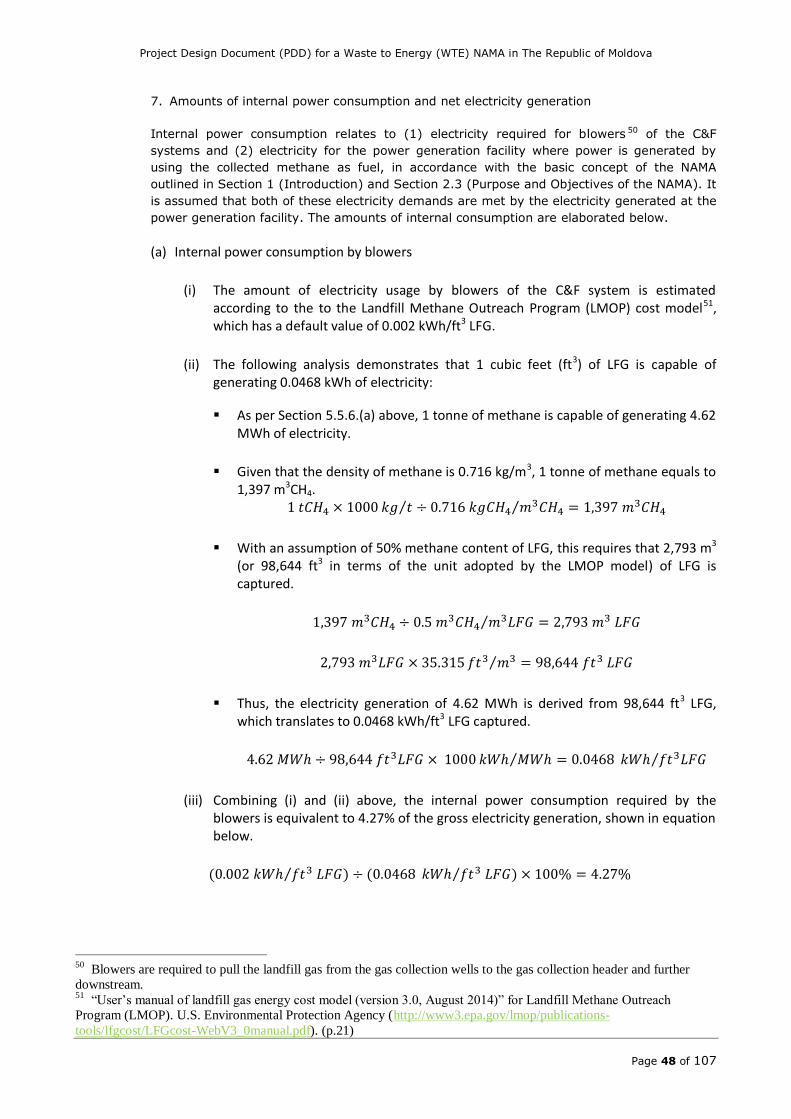
Project Design Document (PDD) for a Waste to Energy (WTE) NAMA in The Republic of Moldova
Page 48 of 107
7. Amounts of internal power consumption and net electricity generation
Internal power consumption relates to (1) electricity required for blowers 50 of the C&F
systems and (2) electricity for the power generation facility where power is generated by
using the collected methane as fuel, in accordance with the basic concept of the NAMA
outlined in Section 1 (Introduction) and Section 2.3 (Purpose and Objectives of the NAMA). It
is assumed that both of these electricity demands are met by the electricity generated at the
power generation facility. The amounts of internal consumption are elaborated below.
(a) Internal power consumption by blowers
(i) The amount of electricity usage by blowers of the C&F system is estimated according to the to the Landfill Methane Outreach Program (LMOP) cost model51, which has a default value of 0.002 kWh/ft3 LFG.
(ii) The following analysis demonstrates that 1 cubic feet (ft3) of LFG is capable of generating 0.0468 kWh of electricity:
As per Section 5.5.6.(a) above, 1 tonne of methane is capable of generating 4.62 MWh of electricity.
Given that the density of methane is 0.716 kg/m3, 1 tonne of methane equals to 1,397 m3CH4.
1 𝑡𝐶𝐻4 × 1000 𝑘𝑔 𝑡⁄ ÷ 0.716 𝑘𝑔𝐶𝐻4 𝑚3𝐶𝐻4⁄ = 1,397 𝑚3𝐶𝐻4
With an assumption of 50% methane content of LFG, this requires that 2,793 m3 (or 98,644 ft3 in terms of the unit adopted by the LMOP model) of LFG is captured.
1,397 𝑚3𝐶𝐻4 ÷ 0.5 𝑚3𝐶𝐻4 𝑚3𝐿𝐹𝐺⁄ = 2,793 𝑚3 𝐿𝐹𝐺
2,793 𝑚3𝐿𝐹𝐺 × 35.315 𝑓𝑡3 𝑚3⁄ = 98,644 𝑓𝑡3 𝐿𝐹𝐺
Thus, the electricity generation of 4.62 MWh is derived from 98,644 ft3 LFG, which translates to 0.0468 kWh/ft3 LFG captured.
4.62 𝑀𝑊ℎ ÷ 98,644 𝑓𝑡3𝐿𝐹𝐺 × 1000 𝑘𝑊ℎ 𝑀𝑊ℎ⁄ = 0.0468 𝑘𝑊ℎ 𝑓𝑡3𝐿𝐹𝐺⁄
(iii) Combining (i) and (ii) above, the internal power consumption required by the blowers is equivalent to 4.27% of the gross electricity generation, shown in equation below.
(0.002 𝑘𝑊ℎ 𝑓𝑡3 𝐿𝐹𝐺)⁄ ÷ (0.0468 𝑘𝑊ℎ 𝑓𝑡3 𝐿𝐹𝐺) × 100% = 4.27%⁄
50
Blowers are required to pull the landfill gas from the gas collection wells to the gas collection header and further
downstream. 51
“User’s manual of landfill gas energy cost model (version 3.0, August 2014)” for Landfill Methane Outreach
Program (LMOP). U.S. Environmental Protection Agency (http://www3.epa.gov/lmop/publications-
tools/lfgcost/LFGcost-WebV3_0manual.pdf). (p.21)
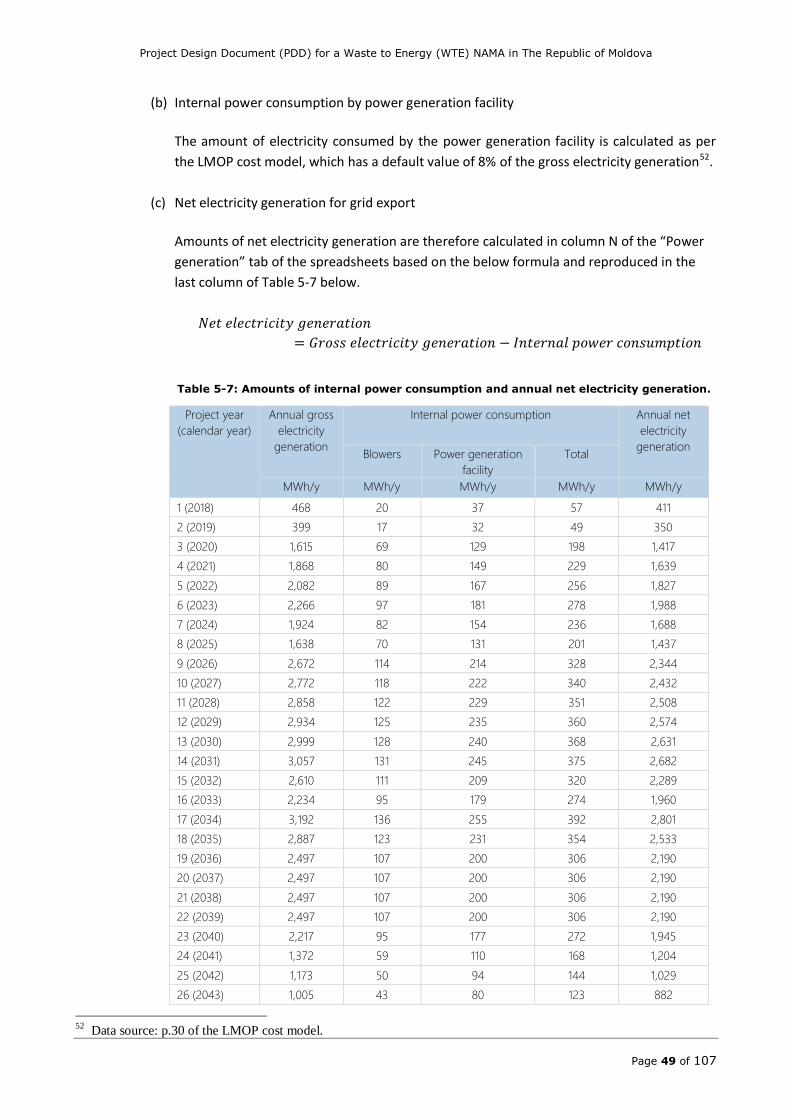
Project Design Document (PDD) for a Waste to Energy (WTE) NAMA in The Republic of Moldova
Page 49 of 107
(b) Internal power consumption by power generation facility
The amount of electricity consumed by the power generation facility is calculated as per
the LMOP cost model, which has a default value of 8% of the gross electricity generation52.
(c) Net electricity generation for grid export
Amounts of net electricity generation are therefore calculated in column N of the “Power
generation” tab of the spreadsheets based on the below formula and reproduced in the
last column of Table 5-7 below.
𝑁𝑒𝑡 𝑒𝑙𝑒𝑐𝑡𝑟𝑖𝑐𝑖𝑡𝑦 𝑔𝑒𝑛𝑒𝑟𝑎𝑡𝑖𝑜𝑛
= 𝐺𝑟𝑜𝑠𝑠 𝑒𝑙𝑒𝑐𝑡𝑟𝑖𝑐𝑖𝑡𝑦 𝑔𝑒𝑛𝑒𝑟𝑎𝑡𝑖𝑜𝑛 − 𝐼𝑛𝑡𝑒𝑟𝑛𝑎𝑙 𝑝𝑜𝑤𝑒𝑟 𝑐𝑜𝑛𝑠𝑢𝑚𝑝𝑡𝑖𝑜𝑛
Table 5-7: Amounts of internal power consumption and annual net electricity generation.
Project year
(calendar year)
Annual gross
electricity
generation
Internal power consumption Annual net
electricity
generation Blowers Power generation
facility
Total
MWh/y MWh/y MWh/y MWh/y MWh/y
1 (2018) 468 20 37 57 411
2 (2019) 399 17 32 49 350
3 (2020) 1,615 69 129 198 1,417
4 (2021) 1,868 80 149 229 1,639
5 (2022) 2,082 89 167 256 1,827
6 (2023) 2,266 97 181 278 1,988
7 (2024) 1,924 82 154 236 1,688
8 (2025) 1,638 70 131 201 1,437
9 (2026) 2,672 114 214 328 2,344
10 (2027) 2,772 118 222 340 2,432
11 (2028) 2,858 122 229 351 2,508
12 (2029) 2,934 125 235 360 2,574
13 (2030) 2,999 128 240 368 2,631
14 (2031) 3,057 131 245 375 2,682
15 (2032) 2,610 111 209 320 2,289
16 (2033) 2,234 95 179 274 1,960
17 (2034) 3,192 136 255 392 2,801
18 (2035) 2,887 123 231 354 2,533
19 (2036) 2,497 107 200 306 2,190
20 (2037) 2,497 107 200 306 2,190
21 (2038) 2,497 107 200 306 2,190
22 (2039) 2,497 107 200 306 2,190
23 (2040) 2,217 95 177 272 1,945
24 (2041) 1,372 59 110 168 1,204
25 (2042) 1,173 50 94 144 1,029
26 (2043) 1,005 43 80 123 882
52
Data source: p.30 of the LMOP cost model.
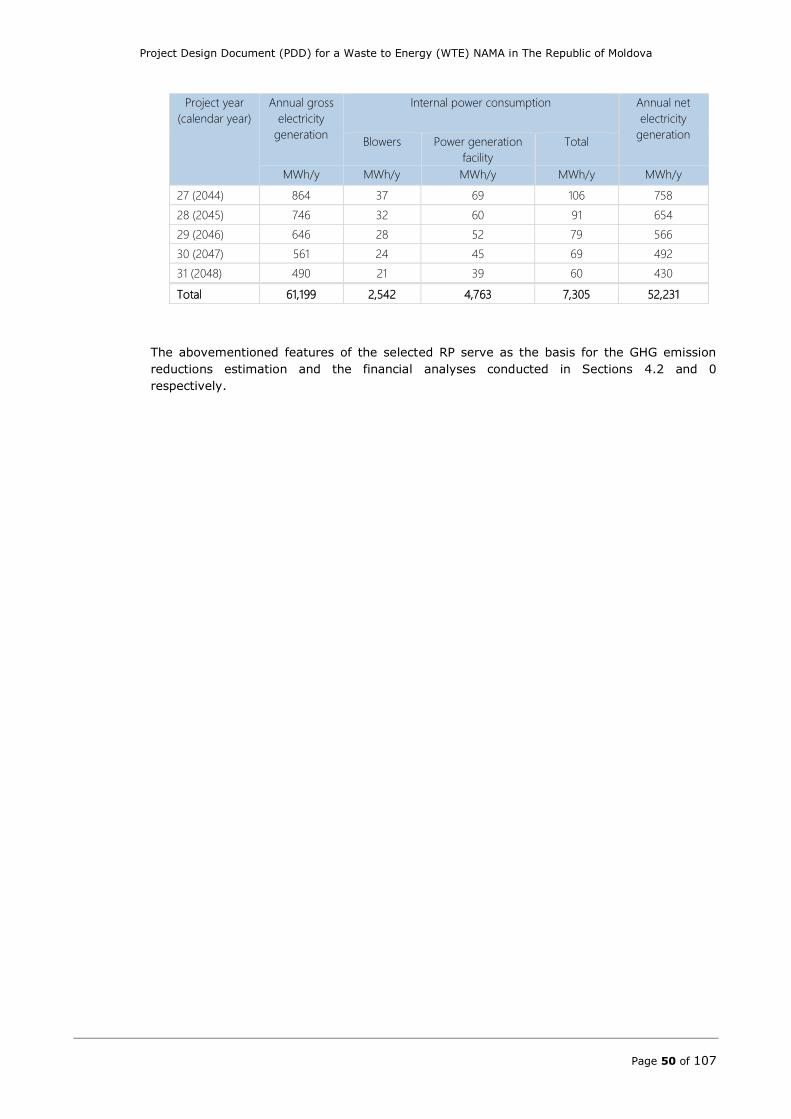
Project Design Document (PDD) for a Waste to Energy (WTE) NAMA in The Republic of Moldova
Page 50 of 107
Project year
(calendar year)
Annual gross
electricity
generation
Internal power consumption Annual net
electricity
generation Blowers Power generation
facility
Total
MWh/y MWh/y MWh/y MWh/y MWh/y
27 (2044) 864 37 69 106 758
28 (2045) 746 32 60 91 654
29 (2046) 646 28 52 79 566
30 (2047) 561 24 45 69 492
31 (2048) 490 21 39 60 430
Total 61,199 2,542 4,763 7,305 52,231
The abovementioned features of the selected RP serve as the basis for the GHG emission
reductions estimation and the financial analyses conducted in Sections 4.2 and 0
respectively.
Project Design Document (PDD) for a Waste to Energy (WTE) NAMA in The Republic of Moldova
Page 51 of 107
6. Capacity Development
Several capacity development needs have been identified:
1. Capacity at the NAMA central coordinating unit
The NAMA assumes municipality level participation, either as NAMA intervention project
owners and/or as the owners of the host landfill. One municipality however will only ever
deal with a WTE project once, and it will also be the first time to deal with a NAMA.
Central institutional knowhow must be developed for many aspects of the NAMA
intervention so that the central unit will be able to share their knowledge base to guide
individual NAMA participants. Specifically, these skills to be transferred include:
a. Basic WTE technology knowledge, including a database of potential technology
providers. Many first timers require a dedicated procurement specialist /
engineer for this purpose.
b. On the assumption that the intervention will also represent a municipality’s first
endeavour at negotiating a renewable energy tariff, intimate knowledge of the
latest relevant regulations, as well as knowledge of tariff negotiating
procedures. Due to the current regulatory uncertainty as mentioned in Section
2.1, a key component of the RP is the feasibility study that will include initiation
of tariff negotiations with ANRE. The knowhow and lessons learned from this
activity will be shared.
c. MRV requirements and procedures. While much of the data to be reported by
the intervention project owners will be collected in the course of usual business,
depending on the final MRV requirements there may be information considered
unimportant for day to day operations but which are crucial for climate change
accounting. As with CDM project owners, this knowledge will need to be shared
at the outset of a new intervention.
2. Technology
As mentioned in Section 2.1, the technology in itself is proven in many parts of the
world. The capacity to be developed here through the implementation of the RP in
addition to nine replicated units is first-hand knowledge of the application of WTE
technologies in the local context – a combination of climatic conditions, waste volume
and waste composition – and possible improvements to be shared with subsequent
replication projects from lessons learned.
3. Regulatory
While certainly not intended to hamper investment, the tariff setting mechanism that
assumes a project owner must suffer a payback period of as long as 10 years is wanting.
This may well be reasonable for a very large power station which are expected to operate
for many decades, but is not suited to a small private-owned project subject to a high
risk inherent to some types of renewable energy projects, and which typically has a
much shorter project lifetime.
This is exacerbated by the fact that when a project is able to obtain a grant to help
alleviate the high investment costs, the tariff calculation is iterated downwards to
achieve the same payback period. While acknowledging that this may be a valid measure
when a project’s only financial difficulty is high investment cost, this policy is detrimental
to a project which faces a profitability as this measure nullifies any improvement in
Project Design Document (PDD) for a Waste to Energy (WTE) NAMA in The Republic of Moldova
Page 52 of 107
profitability. Again, this is only suitable for very large power stations that are often
owned by state or quasi state enterprises.
Capacity development is required in this sense to formulate an enabling tariff setting
methodology, which starts with the understanding and appreciation of the very different
nature of investors for different types of power projects.
4. Effective disbursement of international funds
International funds are typically disbursed through local commercial banks where bank
charges are as high as 20%. There is plenty of room for capacity building, especially in
existing entities that already handle international funds, so that there can be less
reliance on commercial banks so that more funds can reach the intervention project
owner. The NAMA financial requirements are discussed in Section 7.
5. MRV
Measurement and reporting requirements for NAMAs, geared towards GHG and SD
accounting, are specialized and often baffle even those technically familiar with operation
of a landfill or a biogas power plant operation. A capacity building program focused on
the MRV activities for NAMAs is essential.
Project Design Document (PDD) for a Waste to Energy (WTE) NAMA in The Republic of Moldova
Page 53 of 107
7. NAMA Financial Requirements and Mechanisms
Budgeting and cash flow modelling are essential prerequisites for financial structuring
discussions in Sections 0 to 7.4. Based on the detailed analyses outlined in Section 7.5, the following tables provide the summary of the Core Budget of the RP and the cash flow model
for the RP without financial factors.
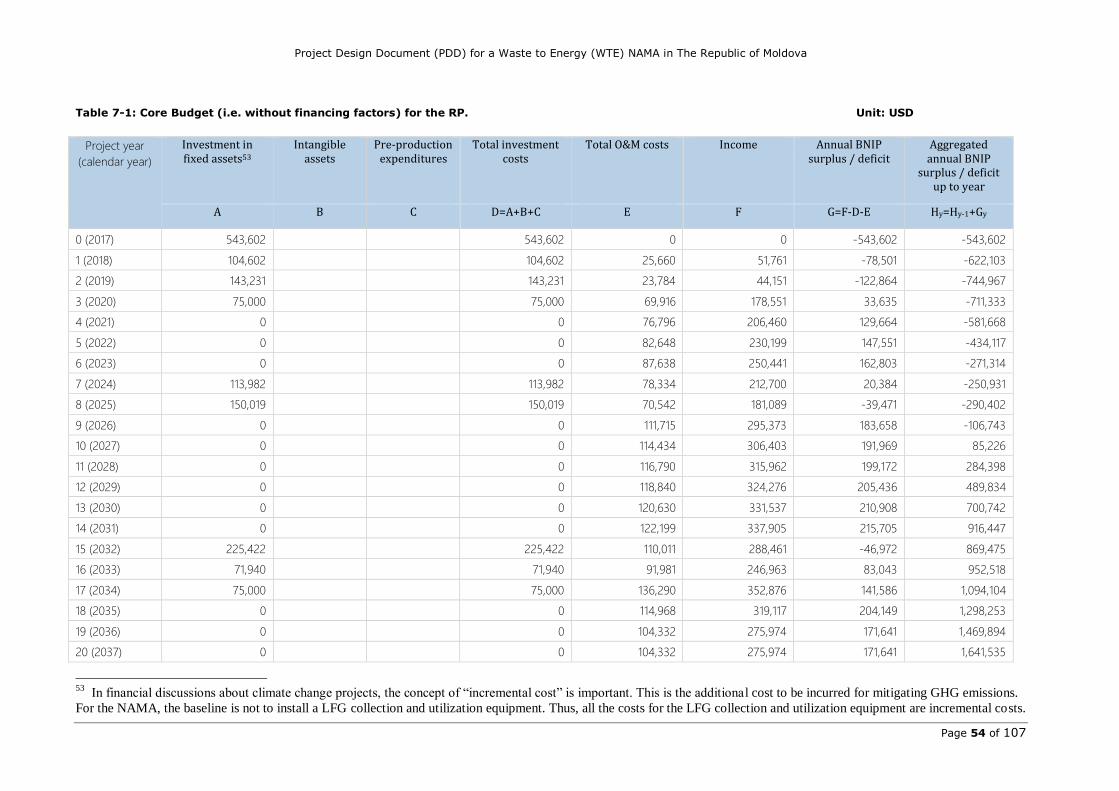
Project Design Document (PDD) for a Waste to Energy (WTE) NAMA in The Republic of Moldova
Page 54 of 107
Table 7-1: Core Budget (i.e. without financing factors) for the RP. Unit: USD
Project year
(calendar year)
Investment in fixed assets53
Intangible assets
Pre-production expenditures
Total investment costs
Total O&M costs Income Annual BNIP surplus / deficit
Aggregated annual BNIP
surplus / deficit up to year
A B C D=A+B+C E F G=F-D-E Hy=Hy-1+Gy
0 (2017) 543,602 543,602 0 0 -543,602 -543,602
1 (2018) 104,602 104,602 25,660 51,761 -78,501 -622,103
2 (2019) 143,231 143,231 23,784 44,151 -122,864 -744,967
3 (2020) 75,000 75,000 69,916 178,551 33,635 -711,333
4 (2021) 0 0 76,796 206,460 129,664 -581,668
5 (2022) 0 0 82,648 230,199 147,551 -434,117
6 (2023) 0 0 87,638 250,441 162,803 -271,314
7 (2024) 113,982 113,982 78,334 212,700 20,384 -250,931
8 (2025) 150,019 150,019 70,542 181,089 -39,471 -290,402
9 (2026) 0 0 111,715 295,373 183,658 -106,743
10 (2027) 0 0 114,434 306,403 191,969 85,226
11 (2028) 0 0 116,790 315,962 199,172 284,398
12 (2029) 0 0 118,840 324,276 205,436 489,834
13 (2030) 0 0 120,630 331,537 210,908 700,742
14 (2031) 0 0 122,199 337,905 215,705 916,447
15 (2032) 225,422 225,422 110,011 288,461 -46,972 869,475
16 (2033) 71,940 71,940 91,981 246,963 83,043 952,518
17 (2034) 75,000 75,000 136,290 352,876 141,586 1,094,104
18 (2035) 0 0 114,968 319,117 204,149 1,298,253
19 (2036) 0 0 104,332 275,974 171,641 1,469,894
20 (2037) 0 0 104,332 275,974 171,641 1,641,535
53
In financial discussions about climate change projects, the concept of “incremental cost” is important. This is the additional cost to be incurred for mitigating GHG emissions.
For the NAMA, the baseline is not to install a LFG collection and utilization equipment. Thus, all the costs for the LFG collection and utilization equipment are incremental costs.
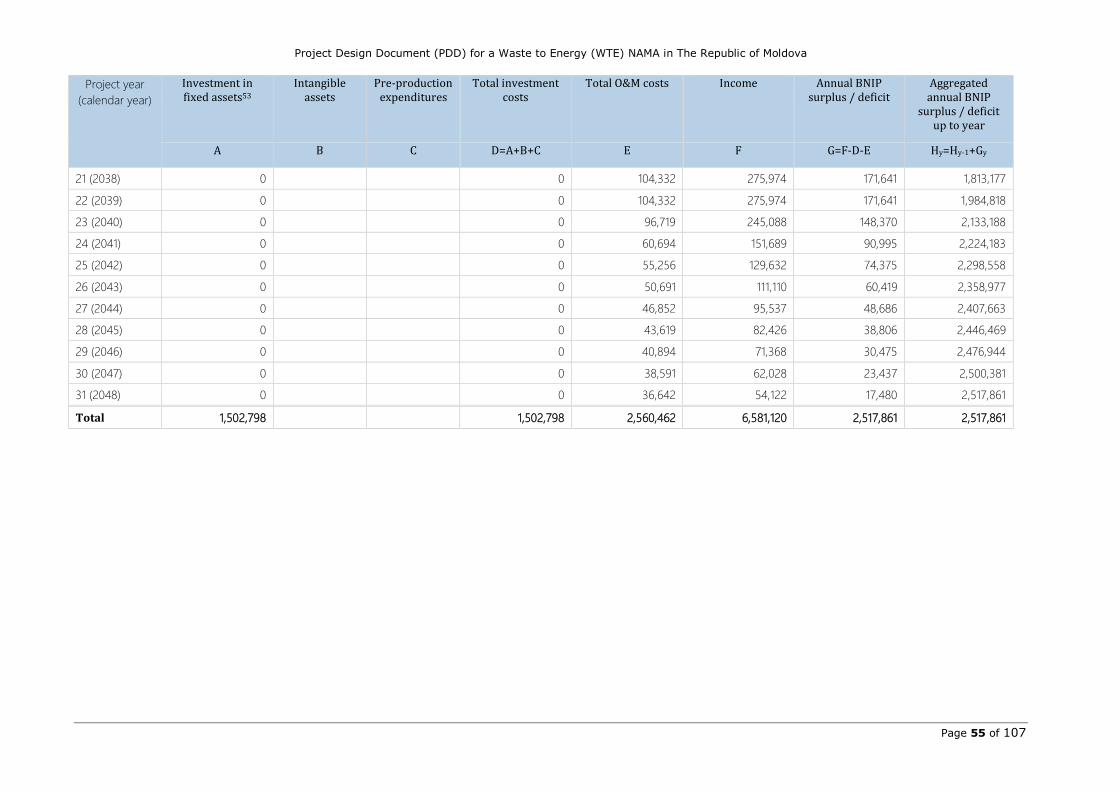
Project Design Document (PDD) for a Waste to Energy (WTE) NAMA in The Republic of Moldova
Page 55 of 107
Project year
(calendar year)
Investment in fixed assets53
Intangible assets
Pre-production expenditures
Total investment costs
Total O&M costs Income Annual BNIP surplus / deficit
Aggregated annual BNIP
surplus / deficit up to year
A B C D=A+B+C E F G=F-D-E Hy=Hy-1+Gy
21 (2038) 0 0 104,332 275,974 171,641 1,813,177
22 (2039) 0 0 104,332 275,974 171,641 1,984,818
23 (2040) 0 0 96,719 245,088 148,370 2,133,188
24 (2041) 0 0 60,694 151,689 90,995 2,224,183
25 (2042) 0 0 55,256 129,632 74,375 2,298,558
26 (2043) 0 0 50,691 111,110 60,419 2,358,977
27 (2044) 0 0 46,852 95,537 48,686 2,407,663
28 (2045) 0 0 43,619 82,426 38,806 2,446,469
29 (2046) 0 0 40,894 71,368 30,475 2,476,944
30 (2047) 0 0 38,591 62,028 23,437 2,500,381
31 (2048) 0 0 36,642 54,122 17,480 2,517,861
Total 1,502,798 1,502,798 2,560,462 6,581,120 2,517,861 2,517,861
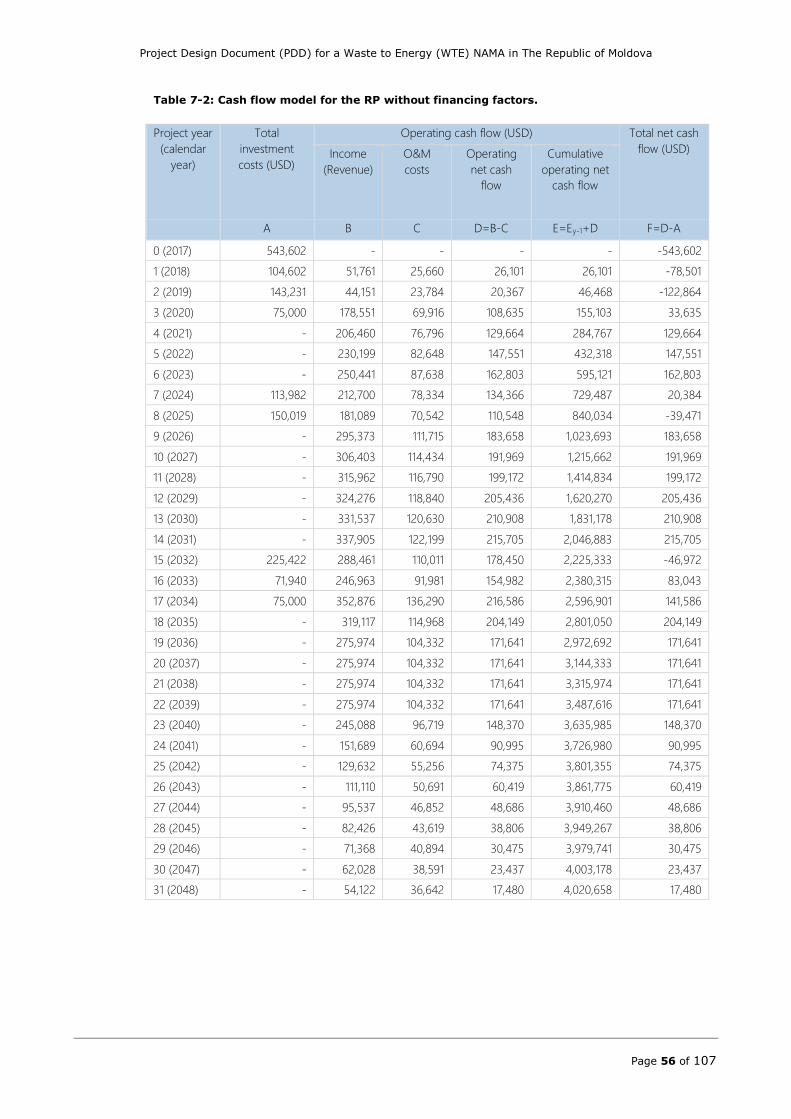
Project Design Document (PDD) for a Waste to Energy (WTE) NAMA in The Republic of Moldova
Page 56 of 107
Table 7-2: Cash flow model for the RP without financing factors.
Project year
(calendar
year)
Total
investment
costs (USD)
Operating cash flow (USD) Total net cash
flow (USD) Income
(Revenue)
O&M
costs
Operating
net cash
flow
Cumulative
operating net
cash flow
A B C D=B-C E=Ey-1+D F=D-A
0 (2017) 543,602 - - - - -543,602
1 (2018) 104,602 51,761 25,660 26,101 26,101 -78,501
2 (2019) 143,231 44,151 23,784 20,367 46,468 -122,864
3 (2020) 75,000 178,551 69,916 108,635 155,103 33,635
4 (2021) - 206,460 76,796 129,664 284,767 129,664
5 (2022) - 230,199 82,648 147,551 432,318 147,551
6 (2023) - 250,441 87,638 162,803 595,121 162,803
7 (2024) 113,982 212,700 78,334 134,366 729,487 20,384
8 (2025) 150,019 181,089 70,542 110,548 840,034 -39,471
9 (2026) - 295,373 111,715 183,658 1,023,693 183,658
10 (2027) - 306,403 114,434 191,969 1,215,662 191,969
11 (2028) - 315,962 116,790 199,172 1,414,834 199,172
12 (2029) - 324,276 118,840 205,436 1,620,270 205,436
13 (2030) - 331,537 120,630 210,908 1,831,178 210,908
14 (2031) - 337,905 122,199 215,705 2,046,883 215,705
15 (2032) 225,422 288,461 110,011 178,450 2,225,333 -46,972
16 (2033) 71,940 246,963 91,981 154,982 2,380,315 83,043
17 (2034) 75,000 352,876 136,290 216,586 2,596,901 141,586
18 (2035) - 319,117 114,968 204,149 2,801,050 204,149
19 (2036) - 275,974 104,332 171,641 2,972,692 171,641
20 (2037) - 275,974 104,332 171,641 3,144,333 171,641
21 (2038) - 275,974 104,332 171,641 3,315,974 171,641
22 (2039) - 275,974 104,332 171,641 3,487,616 171,641
23 (2040) - 245,088 96,719 148,370 3,635,985 148,370
24 (2041) - 151,689 60,694 90,995 3,726,980 90,995
25 (2042) - 129,632 55,256 74,375 3,801,355 74,375
26 (2043) - 111,110 50,691 60,419 3,861,775 60,419
27 (2044) - 95,537 46,852 48,686 3,910,460 48,686
28 (2045) - 82,426 43,619 38,806 3,949,267 38,806
29 (2046) - 71,368 40,894 30,475 3,979,741 30,475
30 (2047) - 62,028 38,591 23,437 4,003,178 23,437
31 (2048) - 54,122 36,642 17,480 4,020,658 17,480
Project Design Document (PDD) for a Waste to Energy (WTE) NAMA in The Republic of Moldova
Page 57 of 107
7.1 National and International Finance: Sources and Distribution
Mechanisms
One of the key objectives of the NAMA is to create an enabling environment for mobilizing
national finance sources. With this, the planned financial structure for the NAMA involves the
combination of an initial bridge loan by an international NAMA supporter, to be refinanced by
national finance sources, primarily municipalities. More details of the proposed mechanism
are provided in Sections 7.3 and 7.4 and further elaborated in Section 3 of Annex 4.
The following table provides the summary of national and international financial sources.
Table 7-3: Summary of national and international financial sources.
Finance Sources
National
1. Bridge loan refinancing, principally with funds from municipality investors
2. Tariff subsidy (Please refer to Section 7.2)
3. In-kind contribution to the management of the NAMA, provided by the
Moldovan government as part of the country’s national ambition (Please refer
to Section 7.2)
International 1. Initial bridge loan (Please refer to column 5 of Table 7-4 below and Section
3.1 of Annex 4 for details.)
2. Grant for a detailed technical feasibility study (Please refer to Section 7.3)
7.2 National finance sources
As well as the refinancing of the initial bridge loan, there are two other significant national
finance sources. One is the electricity tariff awarded under the feed-in tariff (FiT) system. In
Moldova, the revised FiT system, instituted in 2016, continues to grant support on the basis
of a case-by-case approach, and tariffs are calculated also case by case according to
methodology determined by the Moldavian National Energy Regulatory Authority. Based on
extensive discussions with the Moldova team, an electricity tariff of USD 126 / MWh is
recommended for the purposes of this PDD. Reasons for choosing this electricity tariff are
elaborated in Section 7.5.1.3 of this PDD and Section 2.1 of Annex 4.
The second source is in-kind contribution by the central Moldovan government for the
management of the NAMA, provision of capacity building training, awareness building, etc.
7.3 Financial distribution mechanisms
A primary objective of this section is elaborate how the financial mechanism identified in
Section 0 serves as a good measure to help the NAMA overcome the investment barriers it
faces.
The investment barriers for the NAMA projects have two distinct features.
The cash flow analysis for the NAMA reveals that unlike most other LFG collection and
utilization projects, the LFG to be collected and utilized by the NAMA projects will
come very heavily from a new site in addition to existing sites, to be created as part
of internationally assisted effort at improved waste management. As pointed out in
Section 5.4, this absence of historical data as the basis for future projections creates
a major financial barrier for the NAMA, with a result that no national investment
Project Design Document (PDD) for a Waste to Energy (WTE) NAMA in The Republic of Moldova
Page 58 of 107
(either from municipalities or pure private sector investors) can be expected for the
NAMA until it is fully demonstrated that the new site will receive the anticipated
amount of waste. It is imperative to develop a measure to help the NAMA overcome
this barrier.
It is equally important to note that based on the cash flow analysis, the return on
investment for the NAMA’s individual projects will not be discouragingly low when the
new site performs as planned and a reasonable FiT is granted. This enables the
development of a viable financial plan for the NAMA with some international support
that will not be prohibitively costly.
In the light of these two factors, the financial plan that was developed for the NAMA involves
the public sector providing a bridge loan initially, on the understanding that it will be
refinanced by national finance sources when the performance of the new site is convincingly
established. The refinancing is scheduled to start at the end of year 3, as elaborated in
Section 7.4 and illustrated for the RP in column 6 of Table 7-4.
Obviously, provision of such a loan involves risk for the public sector supporter. How to
mitigate this risk, briefly discussed in Section 5, is addressed in Section 0 on risk
management.
One of the key points in developing a financial mechanism for NAMAs is the respective
contributions by international and domestic financing. It is of note that the structure outlined
above represents co-finance between international funding and national funding and that this
co-finance takes place sequentially, rather than simultaneously, as is usually the case.
The proposed financial structure is not expected to require international grants, except for a
relatively small amount (up to USD 150,000) for a detailed technical feasibility study. This in
part is due to a reduced tariff through the FiT system for projects in receipt of international
funding grants.
7.4 Indicative NAMA financing needs
This section is composed of two components. The first is to identify the financial needs
required by the NAMA, followed by a cost estimation for tCO2e of emission reduction.
1. Summary of the NAMA’s indicative financial needs
The financial needs for the NAMA can be identified by integrating the budget and cash flow
model mentioned in Section 7.5 with the framework of financial mechanism discussed in
Section 7.3. In summary, they consist of (a) a grant of USD 150,000 for a detailed technical
feasibility study, (b) a grant of USD 750,000 for capacity building and NAMA management,
and (c) public sector loans with the following features.
(i) The loans will fully address the cash flow needs of the design and installation of the 10
WTE systems (or NAMA individual projects (IP)), including construction (year 0) and the first three years of the new site’s operation (years 1 – 3).
(ii) The loans will be project-based and of non-recourse54 type to ensure that the borrower
will not be left with liability in case the IP fails to perform as planned.
(iii) At the end of year 3, 1/3 of the loans will be repaid with capital injection from an
investor (who may or may not be the same institution as the site owner).
54
For a precise definition of “non-recourse”, please see http://www.investopedia.com/terms/n/nonrecoursedebt.asp as a
good example.
Project Design Document (PDD) for a Waste to Energy (WTE) NAMA in The Republic of Moldova
Page 59 of 107
(iv) The remaining 2/3 of the loans will be repaid in 10 equal annual installments, using the
cash flow generated by the IP.
(v) The loans will be interest-free.
Generous as the loans may seem, they actually represent a reasonable level of international
support per tCO2e of emission reduction, as seen in Section 7.4.2.
The following two tables present financial needs for the NAMA in specific numerical terms for the RP and for the Total NAMA55. As the title of this section indicates, they are indicative
pending a detailed feasibility study.
(a) The RP
The following table shows the cash flow model for the RP with financing factors. It is prepared
on the basis of Table 7-16 (dealing with the cash flow model for the RP without financing
factors) and adding financial factors pursuant to the financial mechanism described above.
The cost of a detailed technical feasibility study (USD 150,000) and the cost for capacity
building and NAMA management (USD 750,000) are discussed below in relation to the cash
flow for the BCNU, given that the output of the feasibility study and the grants for capacity
building and NAMA management will be shared with replication projects.
55
As mentioned in Section 8.2 and Section 0, the implementation of the NAMA will be phased out for the sake of risk
mitigation, with Phase 1 consisting of the implementation of the representative project (the initial project serving as the
first WTE facility).
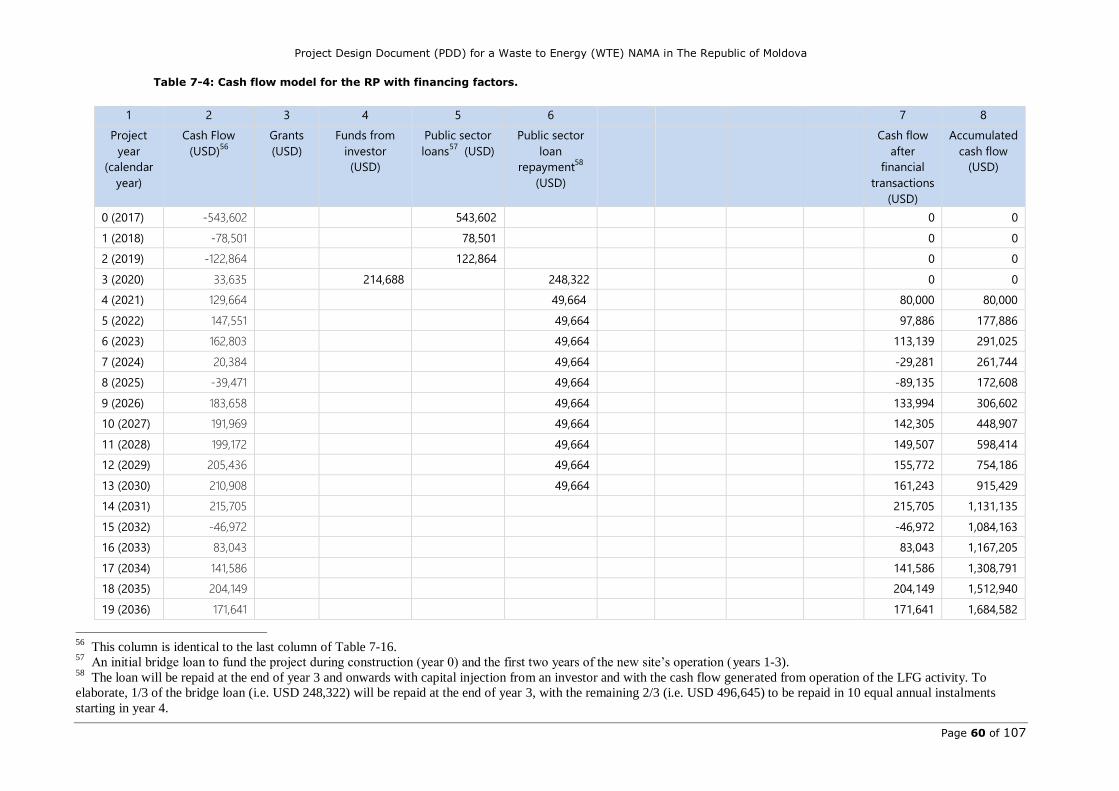
Project Design Document (PDD) for a Waste to Energy (WTE) NAMA in The Republic of Moldova
Page 60 of 107
Table 7-4: Cash flow model for the RP with financing factors.
1 2 3 4 5 6 7 8
Project
year
(calendar
year)
Cash Flow
(USD)56
Grants
(USD)
Funds from
investor
(USD)
Public sector
loans57
(USD)
Public sector
loan
repayment58
(USD)
Cash flow
after
financial
transactions
(USD)
Accumulated
cash flow
(USD)
0 (2017) -543,602 543,602 0 0
1 (2018) -78,501 78,501 0 0
2 (2019) -122,864 122,864 0 0
3 (2020) 33,635 214,688 248,322 0 0
4 (2021) 129,664 49,664 80,000 80,000
5 (2022) 147,551 49,664 97,886 177,886
6 (2023) 162,803 49,664 113,139 291,025
7 (2024) 20,384 49,664 -29,281 261,744
8 (2025) -39,471 49,664 -89,135 172,608
9 (2026) 183,658 49,664 133,994 306,602
10 (2027) 191,969 49,664 142,305 448,907
11 (2028) 199,172 49,664 149,507 598,414
12 (2029) 205,436 49,664 155,772 754,186
13 (2030) 210,908 49,664 161,243 915,429
14 (2031) 215,705 215,705 1,131,135
15 (2032) -46,972 -46,972 1,084,163
16 (2033) 83,043 83,043 1,167,205
17 (2034) 141,586 141,586 1,308,791
18 (2035) 204,149 204,149 1,512,940
19 (2036) 171,641 171,641 1,684,582
56
This column is identical to the last column of Table 7-16. 57
An initial bridge loan to fund the project during construction (year 0) and the first two years of the new site’s operation (years 1-3). 58
The loan will be repaid at the end of year 3 and onwards with capital injection from an investor and with the cash flow generated from operation of the LFG activity. To
elaborate, 1/3 of the bridge loan (i.e. USD 248,322) will be repaid at the end of year 3, with the remaining 2/3 (i.e. USD 496,645) to be repaid in 10 equal annual instalments
starting in year 4.
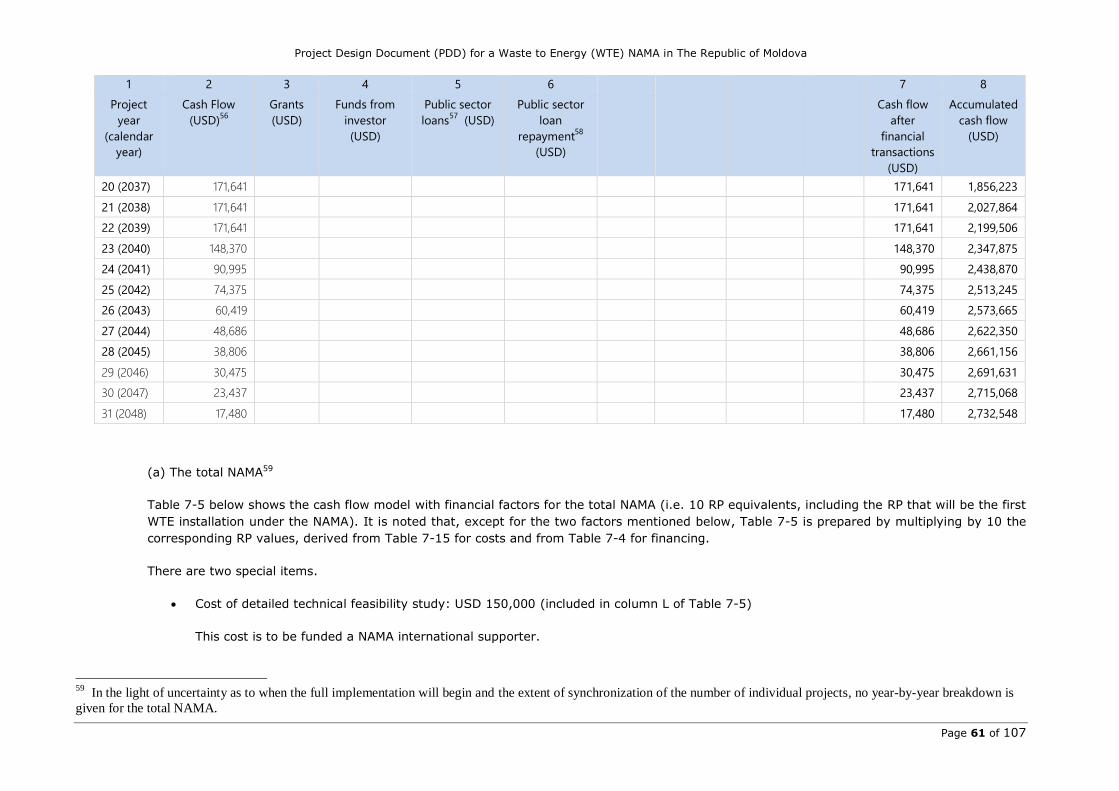
Project Design Document (PDD) for a Waste to Energy (WTE) NAMA in The Republic of Moldova
Page 61 of 107
1 2 3 4 5 6 7 8
Project
year
(calendar
year)
Cash Flow
(USD)56
Grants
(USD)
Funds from
investor
(USD)
Public sector
loans57
(USD)
Public sector
loan
repayment58
(USD)
Cash flow
after
financial
transactions
(USD)
Accumulated
cash flow
(USD)
20 (2037) 171,641 171,641 1,856,223
21 (2038) 171,641 171,641 2,027,864
22 (2039) 171,641 171,641 2,199,506
23 (2040) 148,370 148,370 2,347,875
24 (2041) 90,995 90,995 2,438,870
25 (2042) 74,375 74,375 2,513,245
26 (2043) 60,419 60,419 2,573,665
27 (2044) 48,686 48,686 2,622,350
28 (2045) 38,806 38,806 2,661,156
29 (2046) 30,475 30,475 2,691,631
30 (2047) 23,437 23,437 2,715,068
31 (2048) 17,480 17,480 2,732,548
(a) The total NAMA59
Table 7-5 below shows the cash flow model with financial factors for the total NAMA (i.e. 10 RP equivalents, including the RP that will be the first
WTE installation under the NAMA). It is noted that, except for the two factors mentioned below, Table 7-5 is prepared by multiplying by 10 the
corresponding RP values, derived from Table 7-15 for costs and from Table 7-4 for financing.
There are two special items.
Cost of detailed technical feasibility study: USD 150,000 (included in column L of Table 7-5)
This cost is to be funded a NAMA international supporter.
59
In the light of uncertainty as to when the full implementation will begin and the extent of synchronization of the number of individual projects, no year-by-year breakdown is
given for the total NAMA.
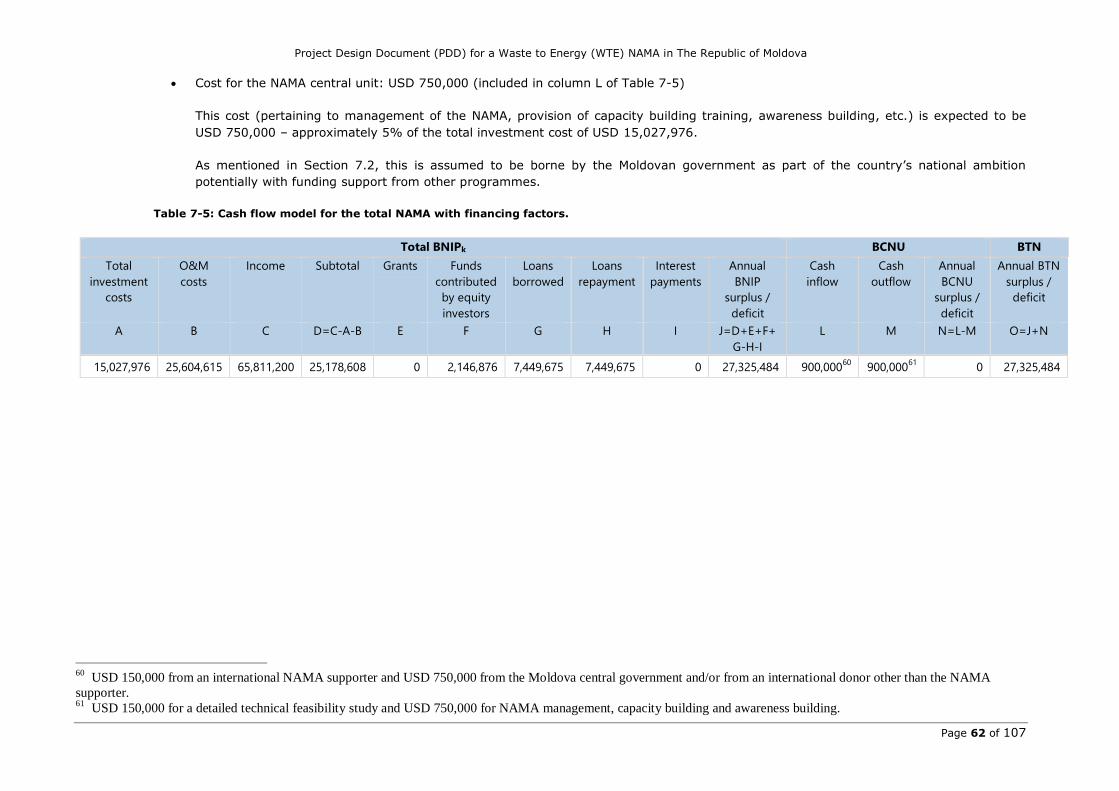
Project Design Document (PDD) for a Waste to Energy (WTE) NAMA in The Republic of Moldova
Page 62 of 107
Cost for the NAMA central unit: USD 750,000 (included in column L of Table 7-5)
This cost (pertaining to management of the NAMA, provision of capacity building training, awareness building, etc.) is expected to be
USD 750,000 – approximately 5% of the total investment cost of USD 15,027,976.
As mentioned in Section 7.2, this is assumed to be borne by the Moldovan government as part of the country’s national ambition
potentially with funding support from other programmes.
Table 7-5: Cash flow model for the total NAMA with financing factors.
Total BNIPk BCNU BTN
Total
investment
costs
O&M
costs
Income Subtotal Grants Funds
contributed
by equity
investors
Loans
borrowed
Loans
repayment
Interest
payments
Annual
BNIP
surplus /
deficit
Cash
inflow
Cash
outflow
Annual
BCNU
surplus /
deficit
Annual BTN
surplus /
deficit
A B C D=C-A-B E F G H I J=D+E+F+
G-H-I
L M N=L-M O=J+N
15,027,976 25,604,615 65,811,200 25,178,608 0 2,146,876 7,449,675 7,449,675 0 27,325,484 900,00060
900,00061
0 27,325,484
60
USD 150,000 from an international NAMA supporter and USD 750,000 from the Moldova central government and/or from an international donor other than the NAMA
supporter. 61
USD 150,000 for a detailed technical feasibility study and USD 750,000 for NAMA management, capacity building and awareness building.
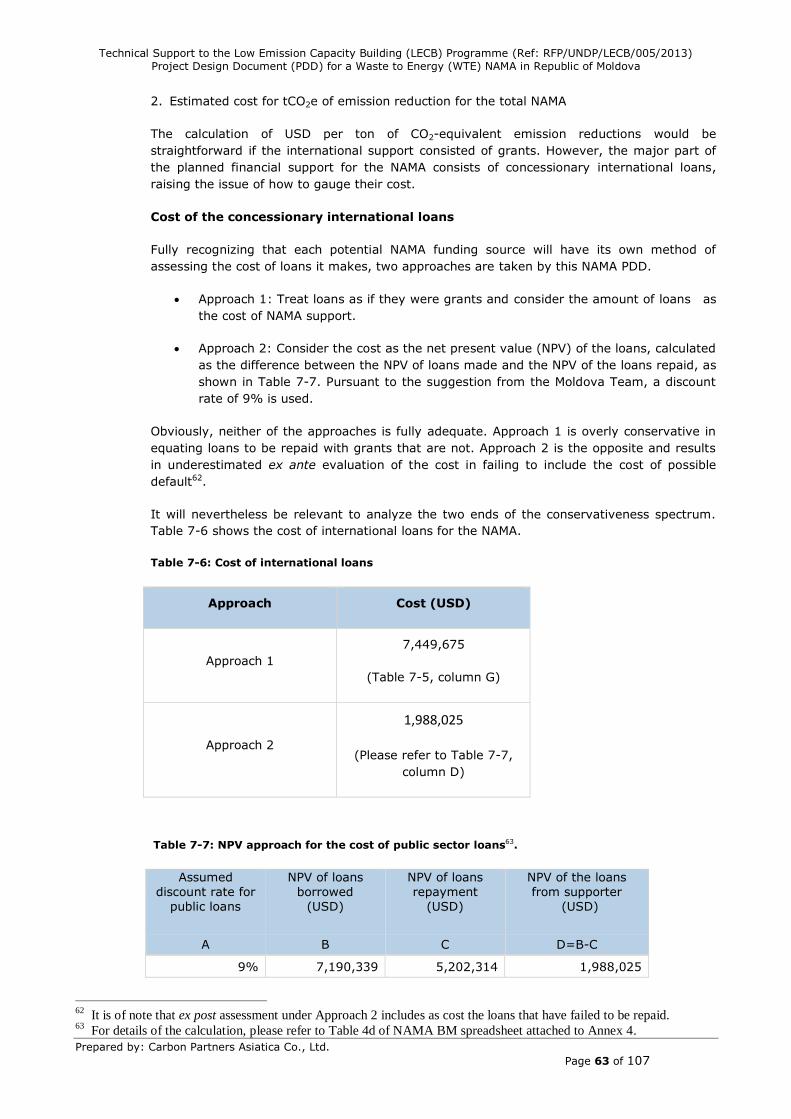
Technical Support to the Low Emission Capacity Building (LECB) Programme (Ref: RFP/UNDP/LECB/005/2013)
Project Design Document (PDD) for a Waste to Energy (WTE) NAMA in Republic of Moldova
Prepared by: Carbon Partners Asiatica Co., Ltd.
Page 63 of 107
2. Estimated cost for tCO2e of emission reduction for the total NAMA
The calculation of USD per ton of CO2-equivalent emission reductions would be
straightforward if the international support consisted of grants. However, the major part of
the planned financial support for the NAMA consists of concessionary international loans,
raising the issue of how to gauge their cost.
Cost of the concessionary international loans
Fully recognizing that each potential NAMA funding source will have its own method of
assessing the cost of loans it makes, two approaches are taken by this NAMA PDD.
Approach 1: Treat loans as if they were grants and consider the amount of loans as
the cost of NAMA support.
Approach 2: Consider the cost as the net present value (NPV) of the loans, calculated
as the difference between the NPV of loans made and the NPV of the loans repaid, as
shown in Table 7-7. Pursuant to the suggestion from the Moldova Team, a discount
rate of 9% is used.
Obviously, neither of the approaches is fully adequate. Approach 1 is overly conservative in
equating loans to be repaid with grants that are not. Approach 2 is the opposite and results
in underestimated ex ante evaluation of the cost in failing to include the cost of possible
default62.
It will nevertheless be relevant to analyze the two ends of the conservativeness spectrum.
Table 7-6 shows the cost of international loans for the NAMA.
Table 7-6: Cost of international loans
Approach Cost (USD)
Approach 1
7,449,675
(Table 7-5, column G)
Approach 2
1,988,025
(Please refer to Table 7-7,
column D)
Table 7-7: NPV approach for the cost of public sector loans63.
Assumed
discount rate for
public loans
NPV of loans
borrowed
(USD)
NPV of loans
repayment
(USD)
NPV of the loans
from supporter
(USD)
A B C D=B-C
9% 7,190,339 5,202,314 1,988,025
62
It is of note that ex post assessment under Approach 2 includes as cost the loans that have failed to be repaid. 63
For details of the calculation, please refer to Table 4d of NAMA BM spreadsheet attached to Annex 4.
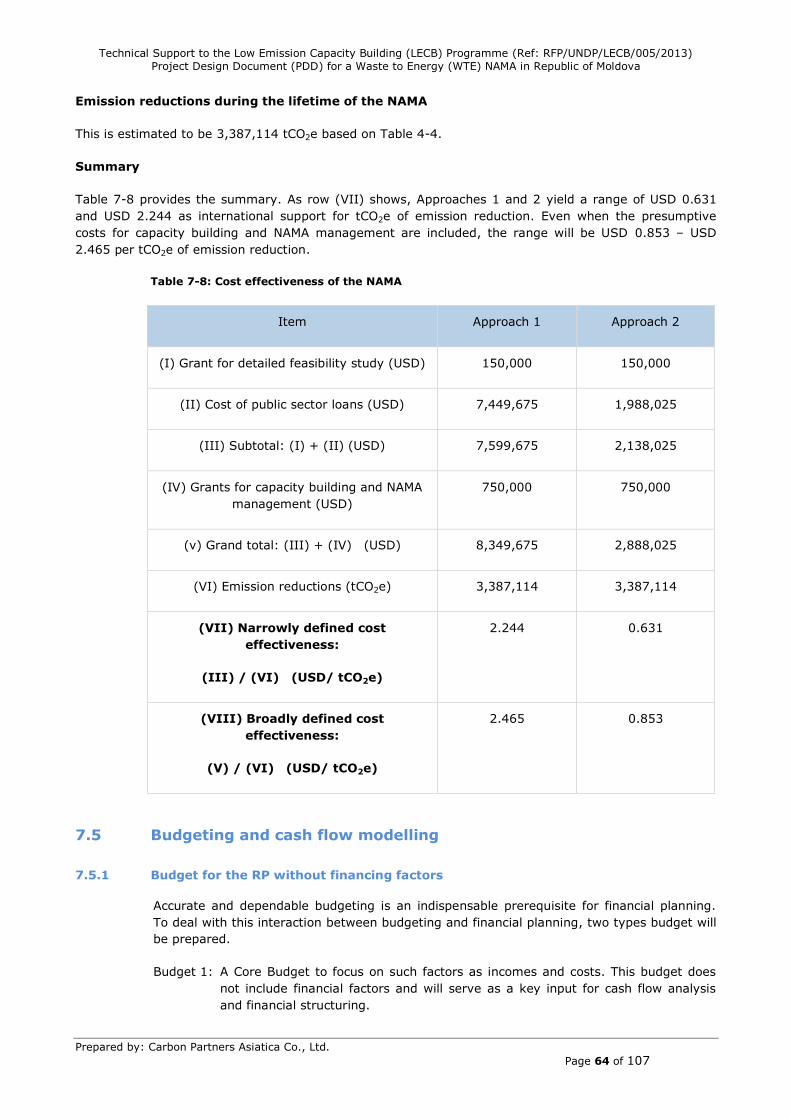
Technical Support to the Low Emission Capacity Building (LECB) Programme (Ref: RFP/UNDP/LECB/005/2013)
Project Design Document (PDD) for a Waste to Energy (WTE) NAMA in Republic of Moldova
Prepared by: Carbon Partners Asiatica Co., Ltd.
Page 64 of 107
Emission reductions during the lifetime of the NAMA
This is estimated to be 3,387,114 tCO2e based on Table 4-4.
Summary
Table 7-8 provides the summary. As row (VII) shows, Approaches 1 and 2 yield a range of USD 0.631
and USD 2.244 as international support for tCO2e of emission reduction. Even when the presumptive
costs for capacity building and NAMA management are included, the range will be USD 0.853 – USD
2.465 per tCO2e of emission reduction.
Table 7-8: Cost effectiveness of the NAMA
Item Approach 1 Approach 2
(I) Grant for detailed feasibility study (USD) 150,000 150,000
(II) Cost of public sector loans (USD) 7,449,675 1,988,025
(III) Subtotal: (I) + (II) (USD) 7,599,675 2,138,025
(IV) Grants for capacity building and NAMA
management (USD)
750,000 750,000
(v) Grand total: (III) + (IV) (USD) 8,349,675 2,888,025
(VI) Emission reductions (tCO2e) 3,387,114 3,387,114
(VII) Narrowly defined cost
effectiveness:
(III) / (VI) (USD/ tCO2e)
2.244 0.631
(VIII) Broadly defined cost
effectiveness:
(V) / (VI) (USD/ tCO2e)
2.465 0.853
7.5 Budgeting and cash flow modelling
7.5.1 Budget for the RP without financing factors
Accurate and dependable budgeting is an indispensable prerequisite for financial planning.
To deal with this interaction between budgeting and financial planning, two types budget will
be prepared.
Budget 1: A Core Budget to focus on such factors as incomes and costs. This budget does
not include financial factors and will serve as a key input for cash flow analysis
and financial structuring.
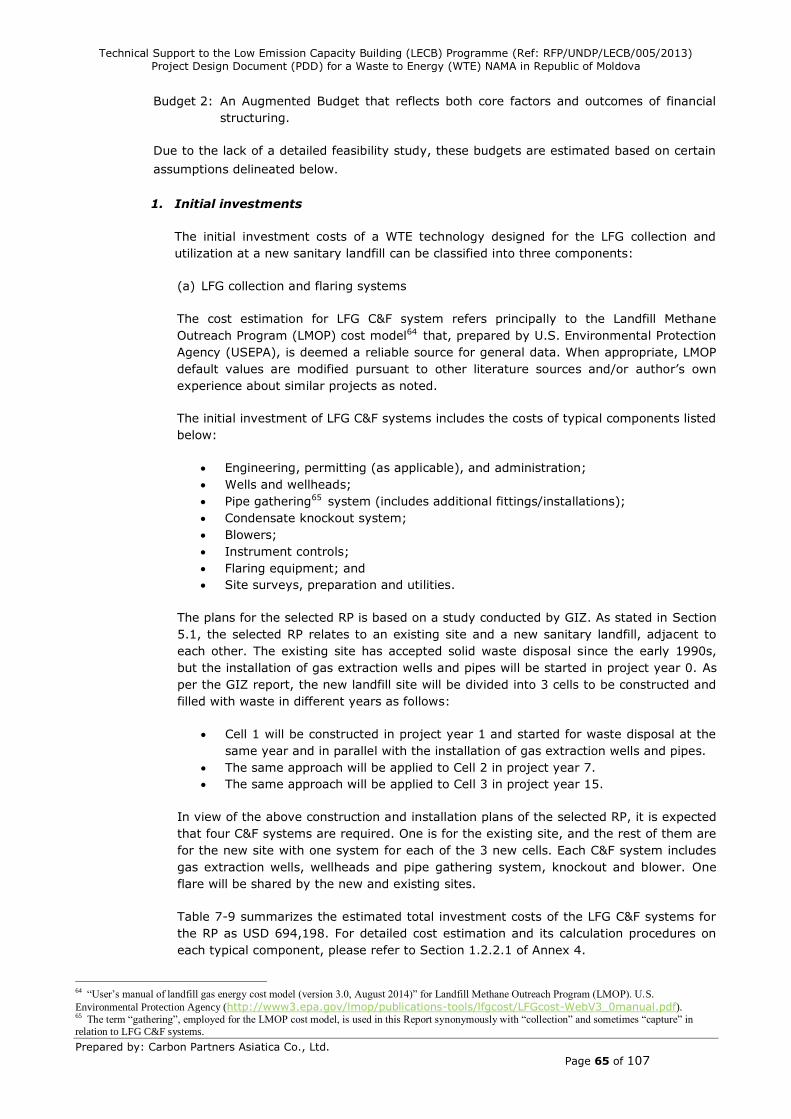
Technical Support to the Low Emission Capacity Building (LECB) Programme (Ref: RFP/UNDP/LECB/005/2013)
Project Design Document (PDD) for a Waste to Energy (WTE) NAMA in Republic of Moldova
Prepared by: Carbon Partners Asiatica Co., Ltd.
Page 65 of 107
Budget 2: An Augmented Budget that reflects both core factors and outcomes of financial
structuring.
Due to the lack of a detailed feasibility study, these budgets are estimated based on certain
assumptions delineated below.
1. Initial investments
The initial investment costs of a WTE technology designed for the LFG collection and
utilization at a new sanitary landfill can be classified into three components:
(a) LFG collection and flaring systems
The cost estimation for LFG C&F system refers principally to the Landfill Methane
Outreach Program (LMOP) cost model64 that, prepared by U.S. Environmental Protection
Agency (USEPA), is deemed a reliable source for general data. When appropriate, LMOP
default values are modified pursuant to other literature sources and/or author’s own
experience about similar projects as noted.
The initial investment of LFG C&F systems includes the costs of typical components listed
below:
Engineering, permitting (as applicable), and administration;
Wells and wellheads;
Pipe gathering65 system (includes additional fittings/installations);
Condensate knockout system;
Blowers;
Instrument controls;
Flaring equipment; and
Site surveys, preparation and utilities.
The plans for the selected RP is based on a study conducted by GIZ. As stated in Section
5.1, the selected RP relates to an existing site and a new sanitary landfill, adjacent to
each other. The existing site has accepted solid waste disposal since the early 1990s,
but the installation of gas extraction wells and pipes will be started in project year 0. As
per the GIZ report, the new landfill site will be divided into 3 cells to be constructed and
filled with waste in different years as follows:
Cell 1 will be constructed in project year 1 and started for waste disposal at the
same year and in parallel with the installation of gas extraction wells and pipes.
The same approach will be applied to Cell 2 in project year 7.
The same approach will be applied to Cell 3 in project year 15.
In view of the above construction and installation plans of the selected RP, it is expected
that four C&F systems are required. One is for the existing site, and the rest of them are
for the new site with one system for each of the 3 new cells. Each C&F system includes
gas extraction wells, wellheads and pipe gathering system, knockout and blower. One
flare will be shared by the new and existing sites.
Table 7-9 summarizes the estimated total investment costs of the LFG C&F systems for
the RP as USD 694,198. For detailed cost estimation and its calculation procedures on
each typical component, please refer to Section 1.2.2.1 of Annex 4.
64 “User’s manual of landfill gas energy cost model (version 3.0, August 2014)” for Landfill Methane Outreach Program (LMOP). U.S.
Environmental Protection Agency (http://www3.epa.gov/lmop/publications-tools/lfgcost/LFGcost-WebV3_0manual.pdf). 65 The term “gathering”, employed for the LMOP cost model, is used in this Report synonymously with “collection” and sometimes “capture” in
relation to LFG C&F systems.
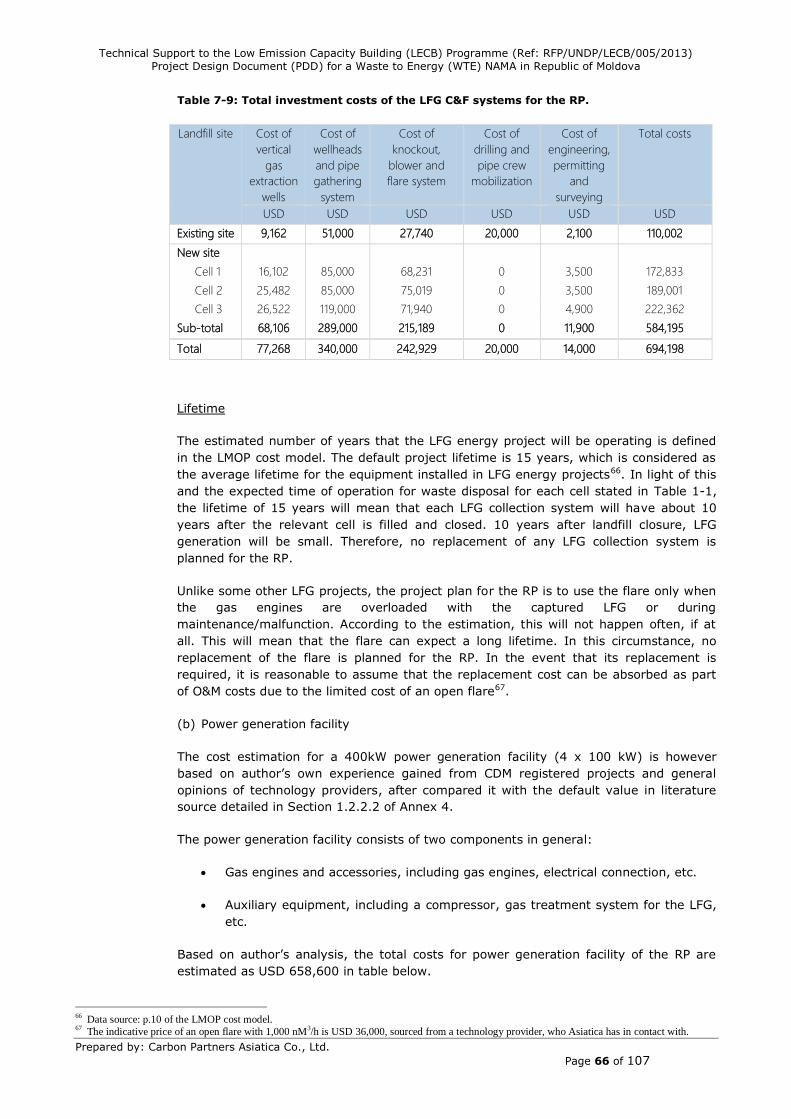
Technical Support to the Low Emission Capacity Building (LECB) Programme (Ref: RFP/UNDP/LECB/005/2013)
Project Design Document (PDD) for a Waste to Energy (WTE) NAMA in Republic of Moldova
Prepared by: Carbon Partners Asiatica Co., Ltd.
Page 66 of 107
Table 7-9: Total investment costs of the LFG C&F systems for the RP.
Landfill site Cost of
vertical
gas
extraction
wells
Cost of
wellheads
and pipe
gathering
system
Cost of
knockout,
blower and
flare system
Cost of
drilling and
pipe crew
mobilization
Cost of
engineering,
permitting
and
surveying
Total costs
USD USD USD USD USD USD
Existing site 9,162 51,000 27,740 20,000 2,100 110,002
New site
Cell 1 16,102 85,000 68,231 0 3,500 172,833
Cell 2 25,482 85,000 75,019 0 3,500 189,001
Cell 3 26,522 119,000 71,940 0 4,900 222,362
Sub-total 68,106 289,000 215,189 0 11,900 584,195
Total 77,268 340,000 242,929 20,000 14,000 694,198
Lifetime
The estimated number of years that the LFG energy project will be operating is defined
in the LMOP cost model. The default project lifetime is 15 years, which is considered as
the average lifetime for the equipment installed in LFG energy projects66. In light of this
and the expected time of operation for waste disposal for each cell stated in Table 1-1,
the lifetime of 15 years will mean that each LFG collection system will have about 10
years after the relevant cell is filled and closed. 10 years after landfill closure, LFG
generation will be small. Therefore, no replacement of any LFG collection system is
planned for the RP.
Unlike some other LFG projects, the project plan for the RP is to use the flare only when
the gas engines are overloaded with the captured LFG or during
maintenance/malfunction. According to the estimation, this will not happen often, if at
all. This will mean that the flare can expect a long lifetime. In this circumstance, no
replacement of the flare is planned for the RP. In the event that its replacement is
required, it is reasonable to assume that the replacement cost can be absorbed as part
of O&M costs due to the limited cost of an open flare67.
(b) Power generation facility
The cost estimation for a 400kW power generation facility (4 x 100 kW) is however
based on author’s own experience gained from CDM registered projects and general
opinions of technology providers, after compared it with the default value in literature
source detailed in Section 1.2.2.2 of Annex 4.
The power generation facility consists of two components in general:
Gas engines and accessories, including gas engines, electrical connection, etc.
Auxiliary equipment, including a compressor, gas treatment system for the LFG,
etc.
Based on author’s analysis, the total costs for power generation facility of the RP are
estimated as USD 658,600 in table below.
66 Data source: p.10 of the LMOP cost model. 67 The indicative price of an open flare with 1,000 nM3/h is USD 36,000, sourced from a technology provider, who Asiatica has in contact with.
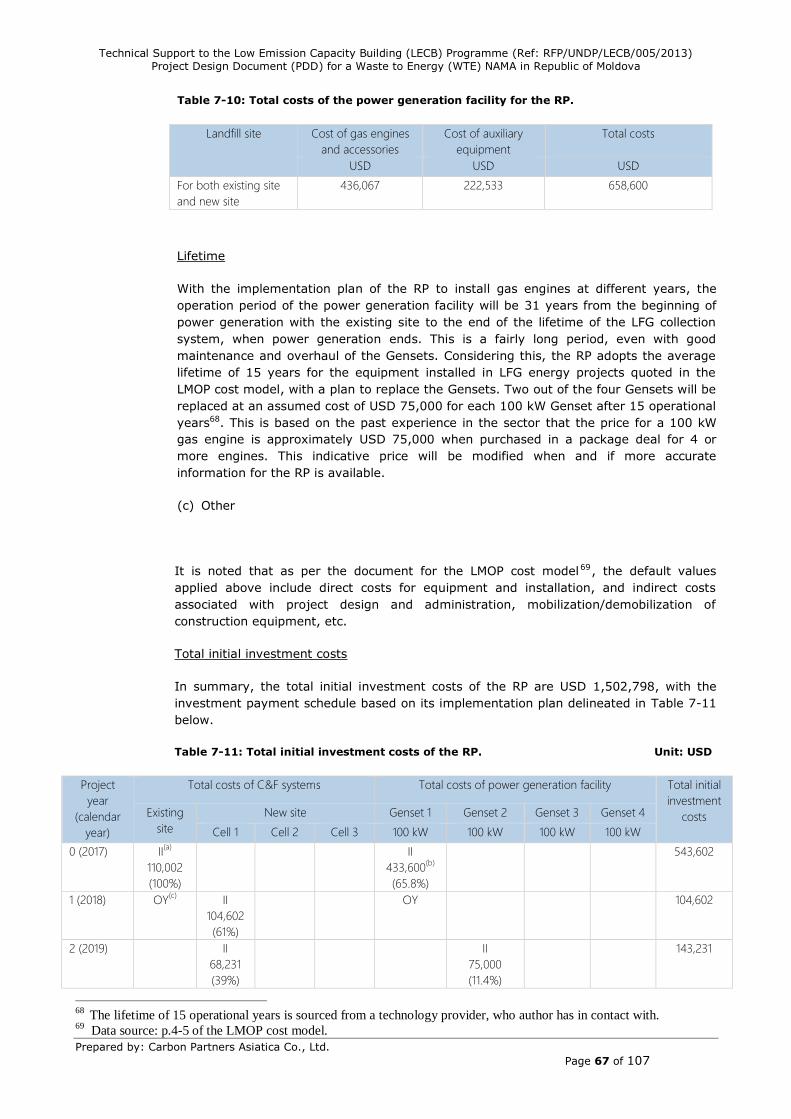
Technical Support to the Low Emission Capacity Building (LECB) Programme (Ref: RFP/UNDP/LECB/005/2013)
Project Design Document (PDD) for a Waste to Energy (WTE) NAMA in Republic of Moldova
Prepared by: Carbon Partners Asiatica Co., Ltd.
Page 67 of 107
Table 7-10: Total costs of the power generation facility for the RP.
Landfill site Cost of gas engines
and accessories
Cost of auxiliary
equipment
Total costs
USD USD USD
For both existing site
and new site
436,067 222,533 658,600
Lifetime
With the implementation plan of the RP to install gas engines at different years, the
operation period of the power generation facility will be 31 years from the beginning of
power generation with the existing site to the end of the lifetime of the LFG collection
system, when power generation ends. This is a fairly long period, even with good
maintenance and overhaul of the Gensets. Considering this, the RP adopts the average
lifetime of 15 years for the equipment installed in LFG energy projects quoted in the
LMOP cost model, with a plan to replace the Gensets. Two out of the four Gensets will be
replaced at an assumed cost of USD 75,000 for each 100 kW Genset after 15 operational
years68. This is based on the past experience in the sector that the price for a 100 kW
gas engine is approximately USD 75,000 when purchased in a package deal for 4 or
more engines. This indicative price will be modified when and if more accurate
information for the RP is available.
(c) Other
It is noted that as per the document for the LMOP cost model69, the default values
applied above include direct costs for equipment and installation, and indirect costs
associated with project design and administration, mobilization/demobilization of
construction equipment, etc.
Total initial investment costs
In summary, the total initial investment costs of the RP are USD 1,502,798, with the
investment payment schedule based on its implementation plan delineated in Table 7-11
below.
Table 7-11: Total initial investment costs of the RP. Unit: USD
Project
year
(calendar
year)
Total costs of C&F systems Total costs of power generation facility Total initial
investment
costs Existing
site
New site Genset 1 Genset 2 Genset 3 Genset 4
Cell 1 Cell 2 Cell 3 100 kW 100 kW 100 kW 100 kW
0 (2017) II(a)
110,002
(100%)
II
433,600(b)
(65.8%)
543,602
1 (2018) OY(c)
II
104,602
(61%)
OY 104,602
2 (2019) II
68,231
(39%)
II
75,000
(11.4%)
143,231
68
The lifetime of 15 operational years is sourced from a technology provider, who author has in contact with. 69
Data source: p.4-5 of the LMOP cost model.
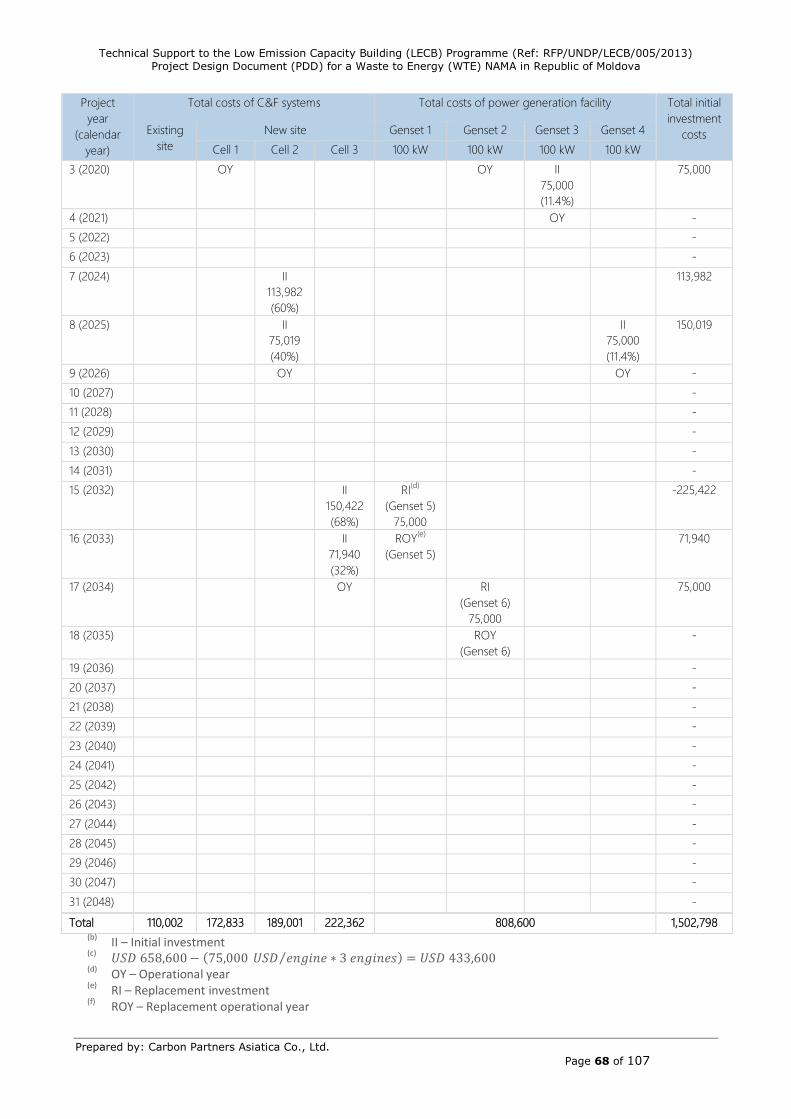
Technical Support to the Low Emission Capacity Building (LECB) Programme (Ref: RFP/UNDP/LECB/005/2013)
Project Design Document (PDD) for a Waste to Energy (WTE) NAMA in Republic of Moldova
Prepared by: Carbon Partners Asiatica Co., Ltd.
Page 68 of 107
Project
year
(calendar
year)
Total costs of C&F systems Total costs of power generation facility Total initial
investment
costs Existing
site
New site Genset 1 Genset 2 Genset 3 Genset 4
Cell 1 Cell 2 Cell 3 100 kW 100 kW 100 kW 100 kW
3 (2020) OY OY II
75,000
(11.4%)
75,000
4 (2021) OY -
5 (2022) -
6 (2023) -
7 (2024) II
113,982
(60%)
113,982
8 (2025) II
75,019
(40%)
II
75,000
(11.4%)
150,019
9 (2026) OY OY -
10 (2027) -
11 (2028) -
12 (2029) -
13 (2030) -
14 (2031) -
15 (2032) II
150,422
(68%)
RI(d)
(Genset 5)
75,000
-225,422
16 (2033) II
71,940
(32%)
ROY(e)
(Genset 5)
71,940
17 (2034) OY RI
(Genset 6)
75,000
75,000
18 (2035) ROY
(Genset 6)
-
19 (2036) -
20 (2037) -
21 (2038) -
22 (2039) -
23 (2040) -
24 (2041) -
25 (2042) -
26 (2043) -
27 (2044) -
28 (2045) -
29 (2046) -
30 (2047) -
31 (2048) -
Total 110,002 172,833 189,001 222,362 808,600 1,502,798 (b)
II – Initial investment (c)
𝑈𝑆𝐷 658,600 − (75,000 𝑈𝑆𝐷 𝑒𝑛𝑔𝑖𝑛𝑒⁄ ∗ 3 𝑒𝑛𝑔𝑖𝑛𝑒𝑠) = 𝑈𝑆𝐷 433,600 (d)
OY – Operational year (e)
RI – Replacement investment (f)
ROY – Replacement operational year
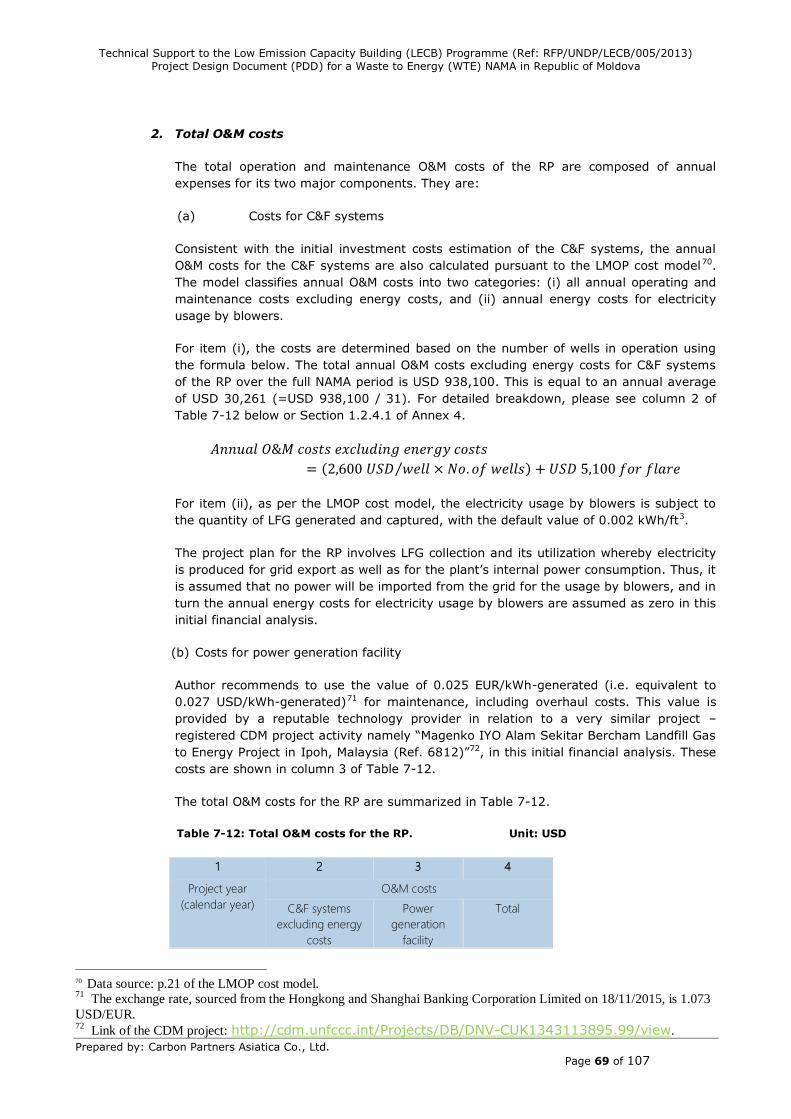
Technical Support to the Low Emission Capacity Building (LECB) Programme (Ref: RFP/UNDP/LECB/005/2013)
Project Design Document (PDD) for a Waste to Energy (WTE) NAMA in Republic of Moldova
Prepared by: Carbon Partners Asiatica Co., Ltd.
Page 69 of 107
2. Total O&M costs
The total operation and maintenance O&M costs of the RP are composed of annual
expenses for its two major components. They are:
(a) Costs for C&F systems
Consistent with the initial investment costs estimation of the C&F systems, the annual
O&M costs for the C&F systems are also calculated pursuant to the LMOP cost model70.
The model classifies annual O&M costs into two categories: (i) all annual operating and
maintenance costs excluding energy costs, and (ii) annual energy costs for electricity
usage by blowers.
For item (i), the costs are determined based on the number of wells in operation using
the formula below. The total annual O&M costs excluding energy costs for C&F systems
of the RP over the full NAMA period is USD 938,100. This is equal to an annual average
of USD 30,261 (=USD 938,100 / 31). For detailed breakdown, please see column 2 of
Table 7-12 below or Section 1.2.4.1 of Annex 4.
𝐴𝑛𝑛𝑢𝑎𝑙 𝑂&𝑀 𝑐𝑜𝑠𝑡𝑠 𝑒𝑥𝑐𝑙𝑢𝑑𝑖𝑛𝑔 𝑒𝑛𝑒𝑟𝑔𝑦 𝑐𝑜𝑠𝑡𝑠
= (2,600 𝑈𝑆𝐷 𝑤𝑒𝑙𝑙⁄ × 𝑁𝑜. 𝑜𝑓 𝑤𝑒𝑙𝑙𝑠) + 𝑈𝑆𝐷 5,100 𝑓𝑜𝑟 𝑓𝑙𝑎𝑟𝑒
For item (ii), as per the LMOP cost model, the electricity usage by blowers is subject to
the quantity of LFG generated and captured, with the default value of 0.002 kWh/ft3.
The project plan for the RP involves LFG collection and its utilization whereby electricity
is produced for grid export as well as for the plant’s internal power consumption. Thus, it
is assumed that no power will be imported from the grid for the usage by blowers, and in
turn the annual energy costs for electricity usage by blowers are assumed as zero in this
initial financial analysis.
(b) Costs for power generation facility
Author recommends to use the value of 0.025 EUR/kWh-generated (i.e. equivalent to
0.027 USD/kWh-generated)71 for maintenance, including overhaul costs. This value is
provided by a reputable technology provider in relation to a very similar project –
registered CDM project activity namely “Magenko IYO Alam Sekitar Bercham Landfill Gas
to Energy Project in Ipoh, Malaysia (Ref. 6812)”72, in this initial financial analysis. These
costs are shown in column 3 of Table 7-12.
The total O&M costs for the RP are summarized in Table 7-12.
Table 7-12: Total O&M costs for the RP. Unit: USD
1 2 3 4
Project year
(calendar year)
O&M costs
C&F systems
excluding energy
costs
Power
generation
facility
Total
70 Data source: p.21 of the LMOP cost model. 71
The exchange rate, sourced from the Hongkong and Shanghai Banking Corporation Limited on 18/11/2015, is 1.073
USD/EUR. 72
Link of the CDM project: http://cdm.unfccc.int/Projects/DB/DNV-CUK1343113895.99/view.
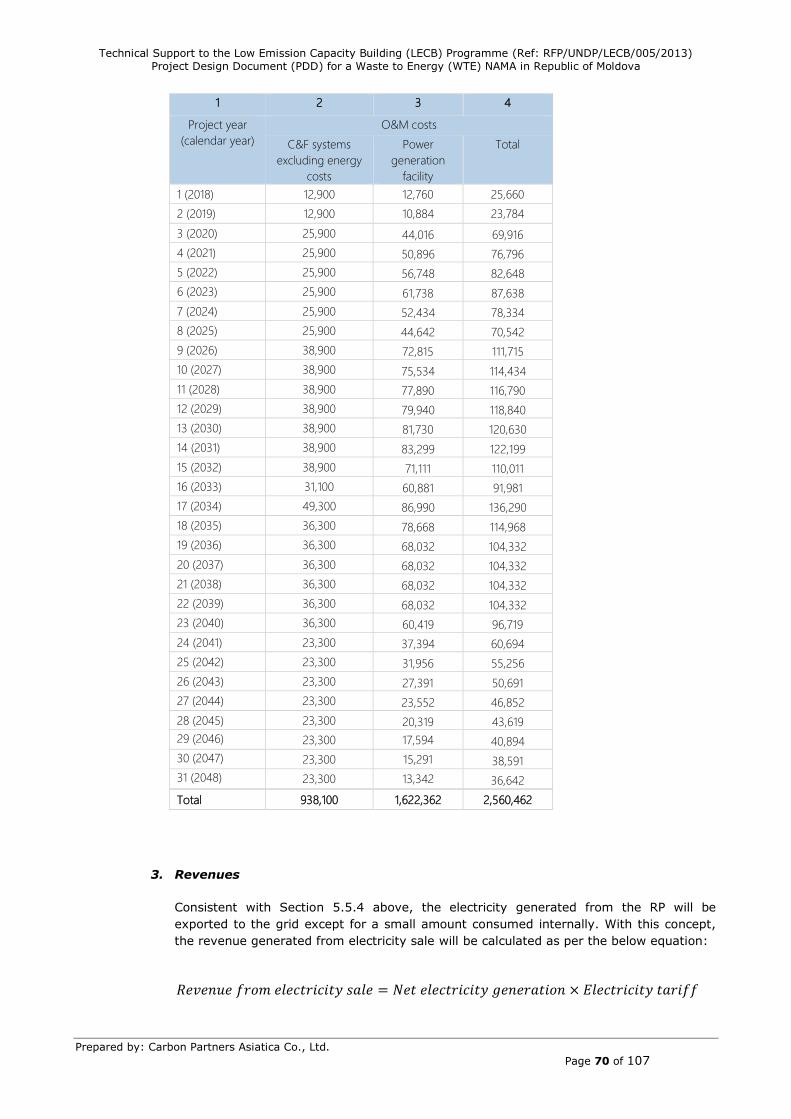
Technical Support to the Low Emission Capacity Building (LECB) Programme (Ref: RFP/UNDP/LECB/005/2013)
Project Design Document (PDD) for a Waste to Energy (WTE) NAMA in Republic of Moldova
Prepared by: Carbon Partners Asiatica Co., Ltd.
Page 70 of 107
1 2 3 4
Project year
(calendar year)
O&M costs
C&F systems
excluding energy
costs
Power
generation
facility
Total
1 (2018) 12,900 12,760 25,660
2 (2019) 12,900 10,884 23,784
3 (2020) 25,900 44,016 69,916
4 (2021) 25,900 50,896 76,796
5 (2022) 25,900 56,748 82,648
6 (2023) 25,900 61,738 87,638
7 (2024) 25,900 52,434 78,334
8 (2025) 25,900 44,642 70,542
9 (2026) 38,900 72,815 111,715
10 (2027) 38,900 75,534 114,434
11 (2028) 38,900 77,890 116,790
12 (2029) 38,900 79,940 118,840
13 (2030) 38,900 81,730 120,630
14 (2031) 38,900 83,299 122,199
15 (2032) 38,900 71,111 110,011
16 (2033) 31,100 60,881 91,981
17 (2034) 49,300 86,990 136,290
18 (2035) 36,300 78,668 114,968
19 (2036) 36,300 68,032 104,332
20 (2037) 36,300 68,032 104,332
21 (2038) 36,300 68,032 104,332
22 (2039) 36,300 68,032 104,332
23 (2040) 36,300 60,419 96,719
24 (2041) 23,300 37,394 60,694
25 (2042) 23,300 31,956 55,256
26 (2043) 23,300 27,391 50,691
27 (2044) 23,300 23,552 46,852
28 (2045) 23,300 20,319 43,619
29 (2046) 23,300 17,594 40,894
30 (2047) 23,300 15,291 38,591
31 (2048) 23,300 13,342 36,642
Total 938,100 1,622,362 2,560,462
3. Revenues
Consistent with Section 5.5.4 above, the electricity generated from the RP will be
exported to the grid except for a small amount consumed internally. With this concept,
the revenue generated from electricity sale will be calculated as per the below equation:
𝑅𝑒𝑣𝑒𝑛𝑢𝑒 𝑓𝑟𝑜𝑚 𝑒𝑙𝑒𝑐𝑡𝑟𝑖𝑐𝑖𝑡𝑦 𝑠𝑎𝑙𝑒 = 𝑁𝑒𝑡 𝑒𝑙𝑒𝑐𝑡𝑟𝑖𝑐𝑖𝑡𝑦 𝑔𝑒𝑛𝑒𝑟𝑎𝑡𝑖𝑜𝑛 × 𝐸𝑙𝑒𝑐𝑡𝑟𝑖𝑐𝑖𝑡𝑦 𝑡𝑎𝑟𝑖𝑓𝑓
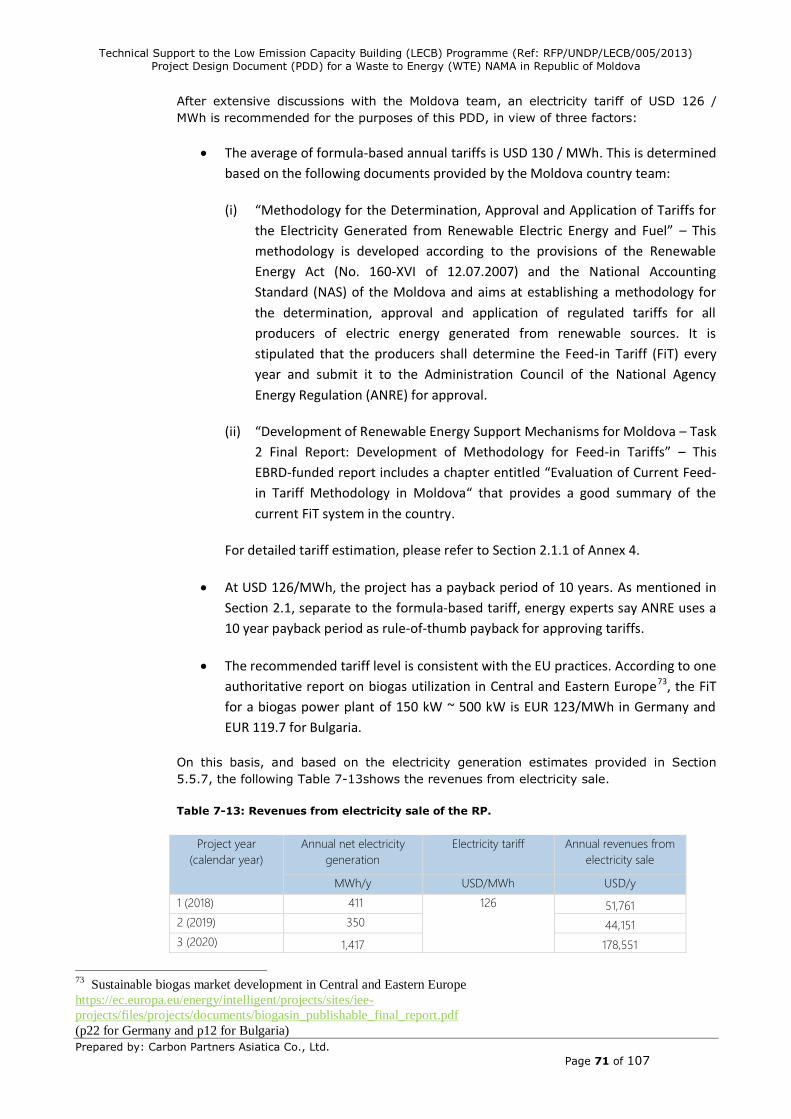
Technical Support to the Low Emission Capacity Building (LECB) Programme (Ref: RFP/UNDP/LECB/005/2013)
Project Design Document (PDD) for a Waste to Energy (WTE) NAMA in Republic of Moldova
Prepared by: Carbon Partners Asiatica Co., Ltd.
Page 71 of 107
After extensive discussions with the Moldova team, an electricity tariff of USD 126 /
MWh is recommended for the purposes of this PDD, in view of three factors:
The average of formula-based annual tariffs is USD 130 / MWh. This is determined
based on the following documents provided by the Moldova country team:
(i) “Methodology for the Determination, Approval and Application of Tariffs for
the Electricity Generated from Renewable Electric Energy and Fuel” – This
methodology is developed according to the provisions of the Renewable
Energy Act (No. 160-XVI of 12.07.2007) and the National Accounting
Standard (NAS) of the Moldova and aims at establishing a methodology for
the determination, approval and application of regulated tariffs for all
producers of electric energy generated from renewable sources. It is
stipulated that the producers shall determine the Feed-in Tariff (FiT) every
year and submit it to the Administration Council of the National Agency
Energy Regulation (ANRE) for approval.
(ii) “Development of Renewable Energy Support Mechanisms for Moldova – Task
2 Final Report: Development of Methodology for Feed-in Tariffs” – This
EBRD-funded report includes a chapter entitled “Evaluation of Current Feed-
in Tariff Methodology in Moldova“ that provides a good summary of the
current FiT system in the country.
For detailed tariff estimation, please refer to Section 2.1.1 of Annex 4.
At USD 126/MWh, the project has a payback period of 10 years. As mentioned in
Section 2.1, separate to the formula-based tariff, energy experts say ANRE uses a
10 year payback period as rule-of-thumb payback for approving tariffs.
The recommended tariff level is consistent with the EU practices. According to one
authoritative report on biogas utilization in Central and Eastern Europe73, the FiT
for a biogas power plant of 150 kW ~ 500 kW is EUR 123/MWh in Germany and
EUR 119.7 for Bulgaria.
On this basis, and based on the electricity generation estimates provided in Section
5.5.7, the following Table 7-13shows the revenues from electricity sale.
Table 7-13: Revenues from electricity sale of the RP.
Project year
(calendar year)
Annual net electricity
generation
Electricity tariff Annual revenues from
electricity sale
MWh/y USD/MWh USD/y
1 (2018) 411 126 51,761
2 (2019) 350 44,151
3 (2020) 1,417 178,551
73
Sustainable biogas market development in Central and Eastern Europe
https://ec.europa.eu/energy/intelligent/projects/sites/iee-
projects/files/projects/documents/biogasin_publishable_final_report.pdf
(p22 for Germany and p12 for Bulgaria)
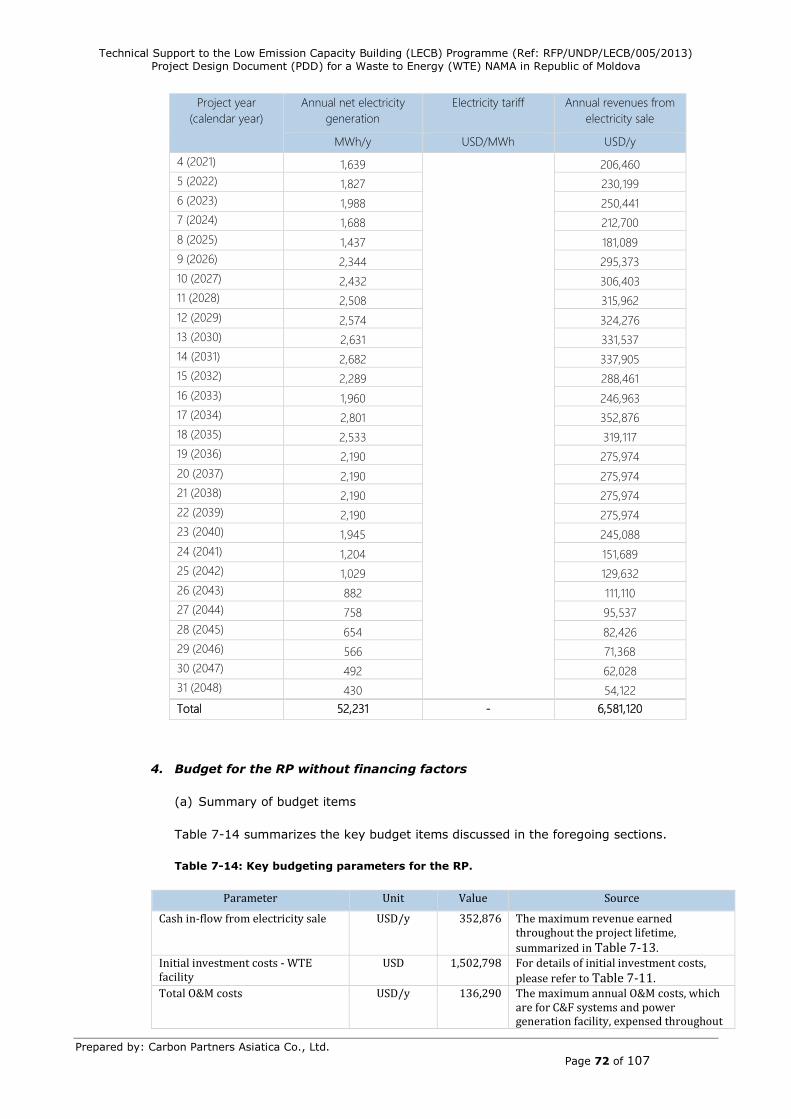
Technical Support to the Low Emission Capacity Building (LECB) Programme (Ref: RFP/UNDP/LECB/005/2013)
Project Design Document (PDD) for a Waste to Energy (WTE) NAMA in Republic of Moldova
Prepared by: Carbon Partners Asiatica Co., Ltd.
Page 72 of 107
Project year
(calendar year)
Annual net electricity
generation
Electricity tariff Annual revenues from
electricity sale
MWh/y USD/MWh USD/y
4 (2021) 1,639 206,460
5 (2022) 1,827 230,199
6 (2023) 1,988 250,441
7 (2024) 1,688 212,700
8 (2025) 1,437 181,089
9 (2026) 2,344 295,373
10 (2027) 2,432 306,403
11 (2028) 2,508 315,962
12 (2029) 2,574 324,276
13 (2030) 2,631 331,537
14 (2031) 2,682 337,905
15 (2032) 2,289 288,461
16 (2033) 1,960 246,963
17 (2034) 2,801 352,876
18 (2035) 2,533 319,117
19 (2036) 2,190 275,974
20 (2037) 2,190 275,974
21 (2038) 2,190 275,974
22 (2039) 2,190 275,974
23 (2040) 1,945 245,088
24 (2041) 1,204 151,689
25 (2042) 1,029 129,632
26 (2043) 882 111,110
27 (2044) 758 95,537
28 (2045) 654 82,426
29 (2046) 566 71,368
30 (2047) 492 62,028
31 (2048) 430 54,122
Total 52,231 - 6,581,120
4. Budget for the RP without financing factors
(a) Summary of budget items
Table 7-14 summarizes the key budget items discussed in the foregoing sections.
Table 7-14: Key budgeting parameters for the RP.
Parameter Unit Value Source
Cash in-flow from electricity sale USD/y 352,876
The maximum revenue earned throughout the project lifetime,
summarized in Table 7-13. Initial investment costs - WTE facility
USD 1,502,798
For details of initial investment costs,
please refer to Table 7-11. Total O&M costs USD/y 136,290 The maximum annual O&M costs, which
are for C&F systems and power generation facility, expensed throughout
Technical Support to the Low Emission Capacity Building (LECB) Programme (Ref: RFP/UNDP/LECB/005/2013)
Project Design Document (PDD) for a Waste to Energy (WTE) NAMA in Republic of Moldova
Prepared by: Carbon Partners Asiatica Co., Ltd.
Page 73 of 107
the project lifetime, listed in Table 7-12.
(b) Budget without financing factors
The budget corresponding to these input parameters is summarized in Table 7-15 that
constitutes the Core Budget of the RP (i.e. Budget 1).
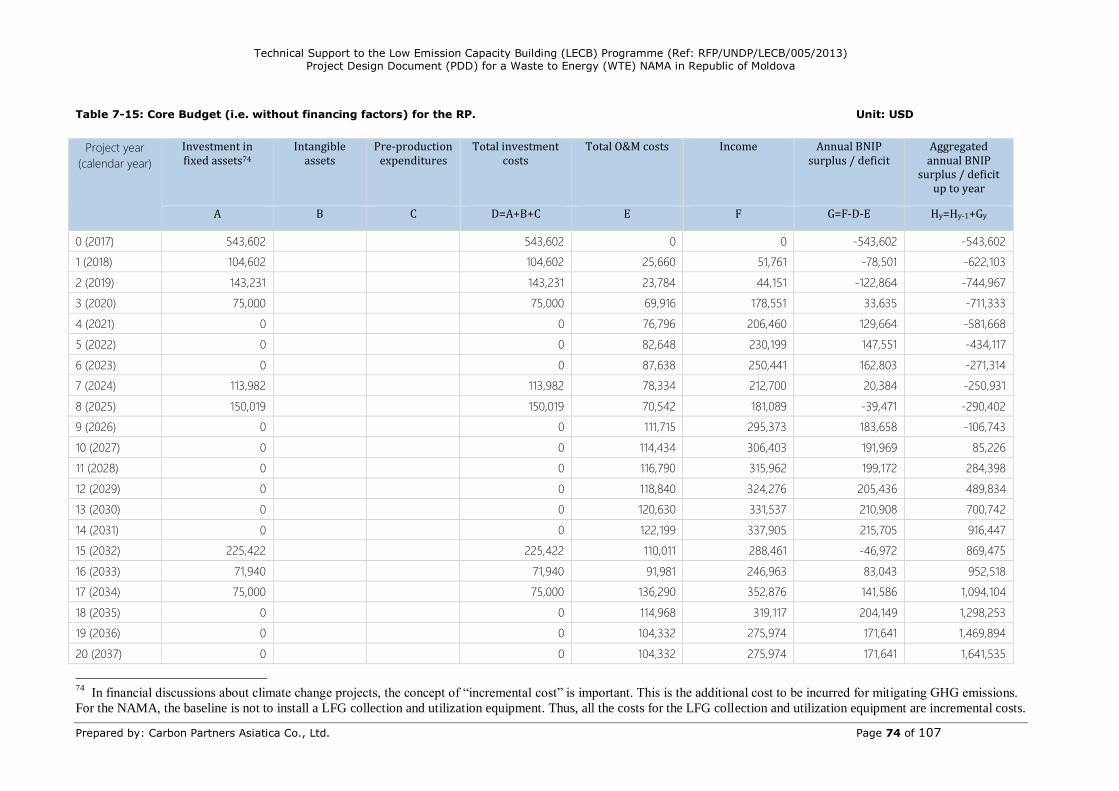
Technical Support to the Low Emission Capacity Building (LECB) Programme (Ref: RFP/UNDP/LECB/005/2013) Project Design Document (PDD) for a Waste to Energy (WTE) NAMA in Republic of Moldova
Prepared by: Carbon Partners Asiatica Co., Ltd. Page 74 of 107
Table 7-15: Core Budget (i.e. without financing factors) for the RP. Unit: USD
Project year
(calendar year)
Investment in fixed assets74
Intangible assets
Pre-production expenditures
Total investment costs
Total O&M costs Income Annual BNIP surplus / deficit
Aggregated annual BNIP
surplus / deficit up to year
A B C D=A+B+C E F G=F-D-E Hy=Hy-1+Gy
0 (2017) 543,602 543,602 0 0 -543,602 -543,602
1 (2018) 104,602 104,602 25,660 51,761 -78,501 -622,103
2 (2019) 143,231 143,231 23,784 44,151 -122,864 -744,967
3 (2020) 75,000 75,000 69,916 178,551 33,635 -711,333
4 (2021) 0 0 76,796 206,460 129,664 -581,668
5 (2022) 0 0 82,648 230,199 147,551 -434,117
6 (2023) 0 0 87,638 250,441 162,803 -271,314
7 (2024) 113,982 113,982 78,334 212,700 20,384 -250,931
8 (2025) 150,019 150,019 70,542 181,089 -39,471 -290,402
9 (2026) 0 0 111,715 295,373 183,658 -106,743
10 (2027) 0 0 114,434 306,403 191,969 85,226
11 (2028) 0 0 116,790 315,962 199,172 284,398
12 (2029) 0 0 118,840 324,276 205,436 489,834
13 (2030) 0 0 120,630 331,537 210,908 700,742
14 (2031) 0 0 122,199 337,905 215,705 916,447
15 (2032) 225,422 225,422 110,011 288,461 -46,972 869,475
16 (2033) 71,940 71,940 91,981 246,963 83,043 952,518
17 (2034) 75,000 75,000 136,290 352,876 141,586 1,094,104
18 (2035) 0 0 114,968 319,117 204,149 1,298,253
19 (2036) 0 0 104,332 275,974 171,641 1,469,894
20 (2037) 0 0 104,332 275,974 171,641 1,641,535
74
In financial discussions about climate change projects, the concept of “incremental cost” is important. This is the additional cost to be incurred for mitigating GHG emissions.
For the NAMA, the baseline is not to install a LFG collection and utilization equipment. Thus, all the costs for the LFG collection and utilization equipment are incremental costs.
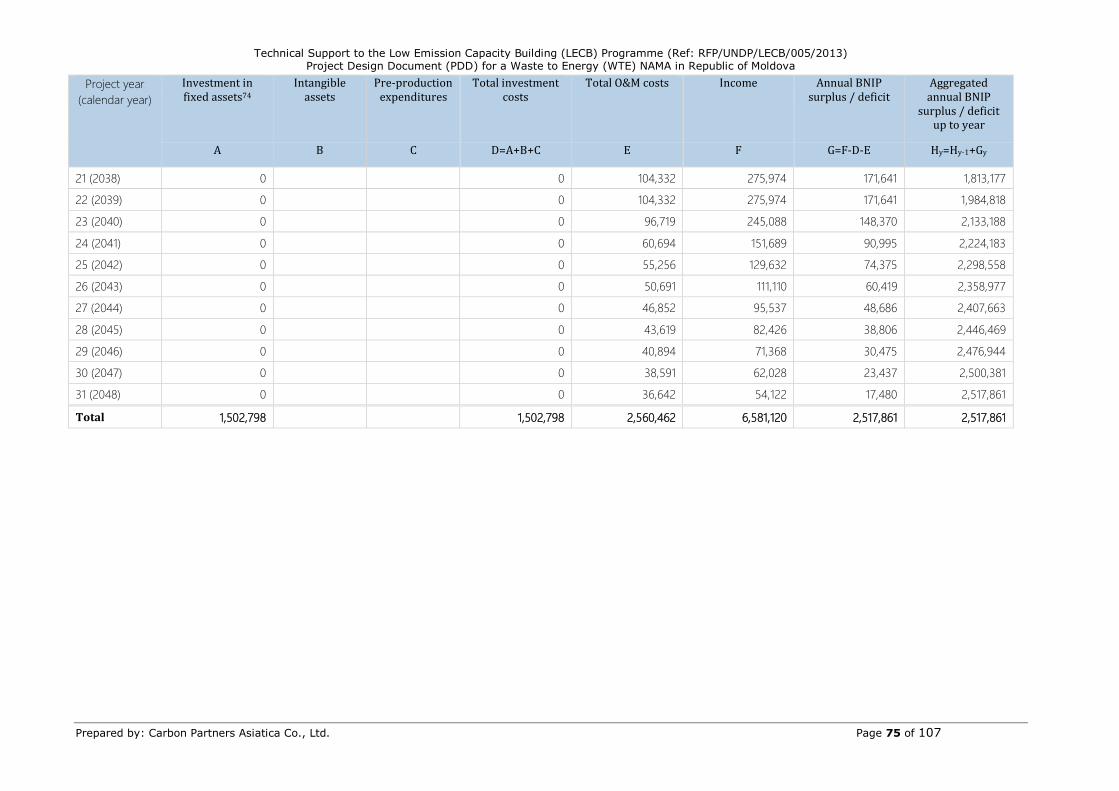
Technical Support to the Low Emission Capacity Building (LECB) Programme (Ref: RFP/UNDP/LECB/005/2013) Project Design Document (PDD) for a Waste to Energy (WTE) NAMA in Republic of Moldova
Prepared by: Carbon Partners Asiatica Co., Ltd. Page 75 of 107
Project year
(calendar year)
Investment in fixed assets74
Intangible assets
Pre-production expenditures
Total investment costs
Total O&M costs Income Annual BNIP surplus / deficit
Aggregated annual BNIP
surplus / deficit up to year
A B C D=A+B+C E F G=F-D-E Hy=Hy-1+Gy
21 (2038) 0 0 104,332 275,974 171,641 1,813,177
22 (2039) 0 0 104,332 275,974 171,641 1,984,818
23 (2040) 0 0 96,719 245,088 148,370 2,133,188
24 (2041) 0 0 60,694 151,689 90,995 2,224,183
25 (2042) 0 0 55,256 129,632 74,375 2,298,558
26 (2043) 0 0 50,691 111,110 60,419 2,358,977
27 (2044) 0 0 46,852 95,537 48,686 2,407,663
28 (2045) 0 0 43,619 82,426 38,806 2,446,469
29 (2046) 0 0 40,894 71,368 30,475 2,476,944
30 (2047) 0 0 38,591 62,028 23,437 2,500,381
31 (2048) 0 0 36,642 54,122 17,480 2,517,861
Total 1,502,798 1,502,798 2,560,462 6,581,120 2,517,861 2,517,861
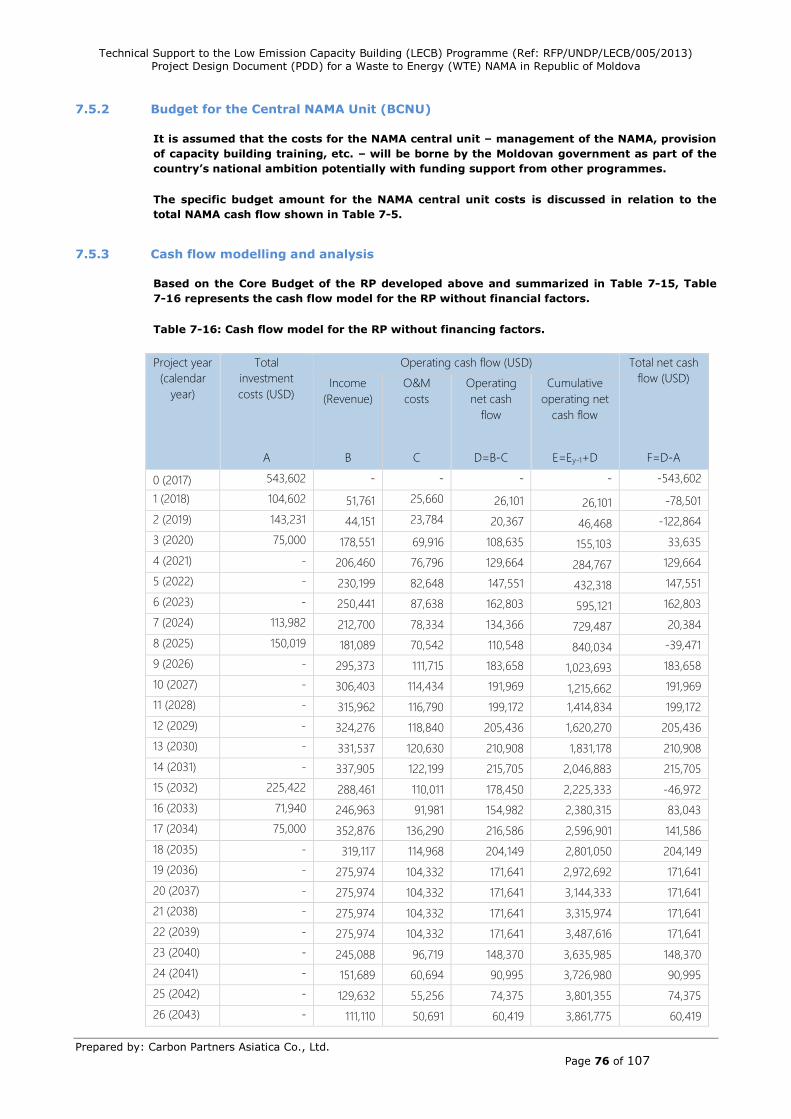
Technical Support to the Low Emission Capacity Building (LECB) Programme (Ref: RFP/UNDP/LECB/005/2013)
Project Design Document (PDD) for a Waste to Energy (WTE) NAMA in Republic of Moldova
Prepared by: Carbon Partners Asiatica Co., Ltd.
Page 76 of 107
7.5.2 Budget for the Central NAMA Unit (BCNU)
It is assumed that the costs for the NAMA central unit – management of the NAMA, provision
of capacity building training, etc. – will be borne by the Moldovan government as part of the
country’s national ambition potentially with funding support from other programmes.
The specific budget amount for the NAMA central unit costs is discussed in relation to the
total NAMA cash flow shown in Table 7-5.
7.5.3 Cash flow modelling and analysis
Based on the Core Budget of the RP developed above and summarized in Table 7-15, Table
7-16 represents the cash flow model for the RP without financial factors.
Table 7-16: Cash flow model for the RP without financing factors.
Project year
(calendar
year)
Total
investment
costs (USD)
Operating cash flow (USD) Total net cash
flow (USD) Income
(Revenue)
O&M
costs
Operating
net cash
flow
Cumulative
operating net
cash flow
A B C D=B-C E=Ey-1+D F=D-A
0 (2017) 543,602 - - - - -543,602
1 (2018) 104,602 51,761 25,660 26,101 26,101 -78,501
2 (2019) 143,231 44,151 23,784 20,367 46,468 -122,864
3 (2020) 75,000 178,551 69,916 108,635 155,103 33,635
4 (2021) - 206,460 76,796 129,664 284,767 129,664
5 (2022) - 230,199 82,648 147,551 432,318 147,551
6 (2023) - 250,441 87,638 162,803 595,121 162,803
7 (2024) 113,982 212,700 78,334 134,366 729,487 20,384
8 (2025) 150,019 181,089 70,542 110,548 840,034 -39,471
9 (2026) - 295,373 111,715 183,658 1,023,693 183,658
10 (2027) - 306,403 114,434 191,969 1,215,662 191,969
11 (2028) - 315,962 116,790 199,172 1,414,834 199,172
12 (2029) - 324,276 118,840 205,436 1,620,270 205,436
13 (2030) - 331,537 120,630 210,908 1,831,178 210,908
14 (2031) - 337,905 122,199 215,705 2,046,883 215,705
15 (2032) 225,422 288,461 110,011 178,450 2,225,333 -46,972
16 (2033) 71,940 246,963 91,981 154,982 2,380,315 83,043
17 (2034) 75,000 352,876 136,290 216,586 2,596,901 141,586
18 (2035) - 319,117 114,968 204,149 2,801,050 204,149
19 (2036) - 275,974 104,332 171,641 2,972,692 171,641
20 (2037) - 275,974 104,332 171,641 3,144,333 171,641
21 (2038) - 275,974 104,332 171,641 3,315,974 171,641
22 (2039) - 275,974 104,332 171,641 3,487,616 171,641
23 (2040) - 245,088 96,719 148,370 3,635,985 148,370
24 (2041) - 151,689 60,694 90,995 3,726,980 90,995
25 (2042) - 129,632 55,256 74,375 3,801,355 74,375
26 (2043) - 111,110 50,691 60,419 3,861,775 60,419
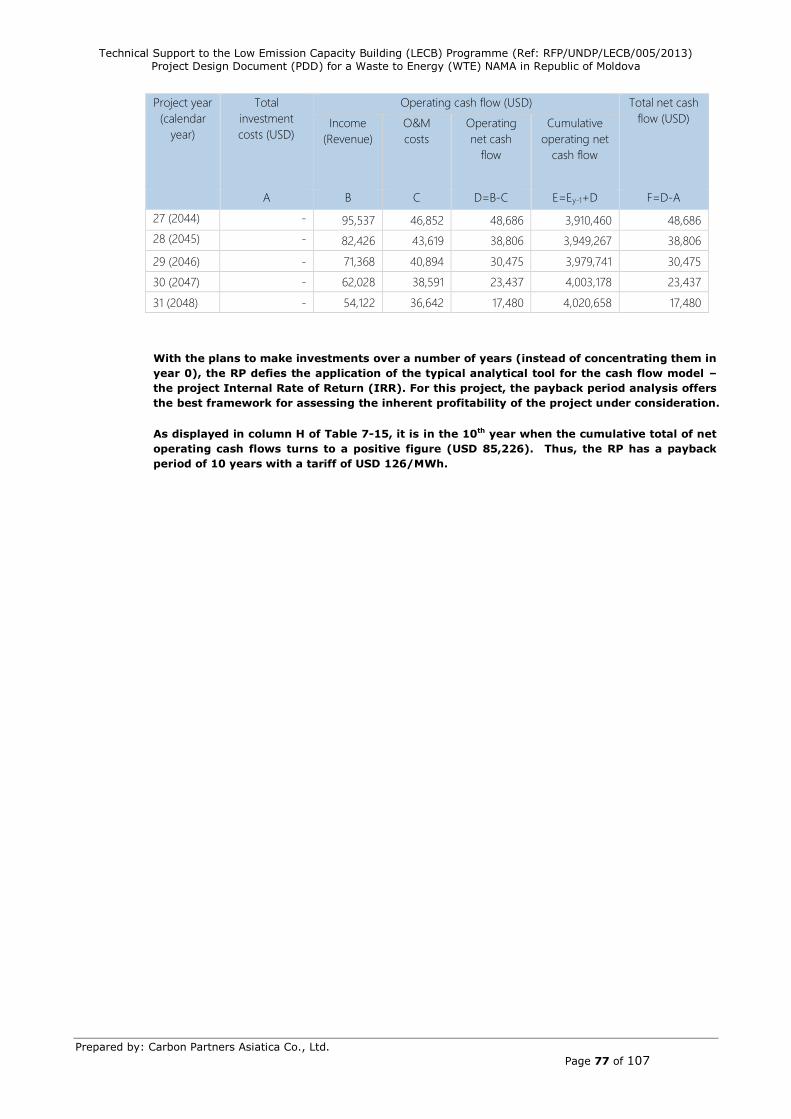
Technical Support to the Low Emission Capacity Building (LECB) Programme (Ref: RFP/UNDP/LECB/005/2013)
Project Design Document (PDD) for a Waste to Energy (WTE) NAMA in Republic of Moldova
Prepared by: Carbon Partners Asiatica Co., Ltd.
Page 77 of 107
Project year
(calendar
year)
Total
investment
costs (USD)
Operating cash flow (USD) Total net cash
flow (USD) Income
(Revenue)
O&M
costs
Operating
net cash
flow
Cumulative
operating net
cash flow
A B C D=B-C E=Ey-1+D F=D-A
27 (2044) - 95,537 46,852 48,686 3,910,460 48,686
28 (2045) - 82,426 43,619 38,806 3,949,267 38,806
29 (2046) - 71,368 40,894 30,475 3,979,741 30,475
30 (2047) - 62,028 38,591 23,437 4,003,178 23,437
31 (2048) - 54,122 36,642 17,480 4,020,658 17,480
With the plans to make investments over a number of years (instead of concentrating them in
year 0), the RP defies the application of the typical analytical tool for the cash flow model –
the project Internal Rate of Return (IRR). For this project, the payback period analysis offers
the best framework for assessing the inherent profitability of the project under consideration.
As displayed in column H of Table 7-15, it is in the 10th year when the cumulative total of net
operating cash flows turns to a positive figure (USD 85,226). Thus, the RP has a payback
period of 10 years with a tariff of USD 126/MWh.
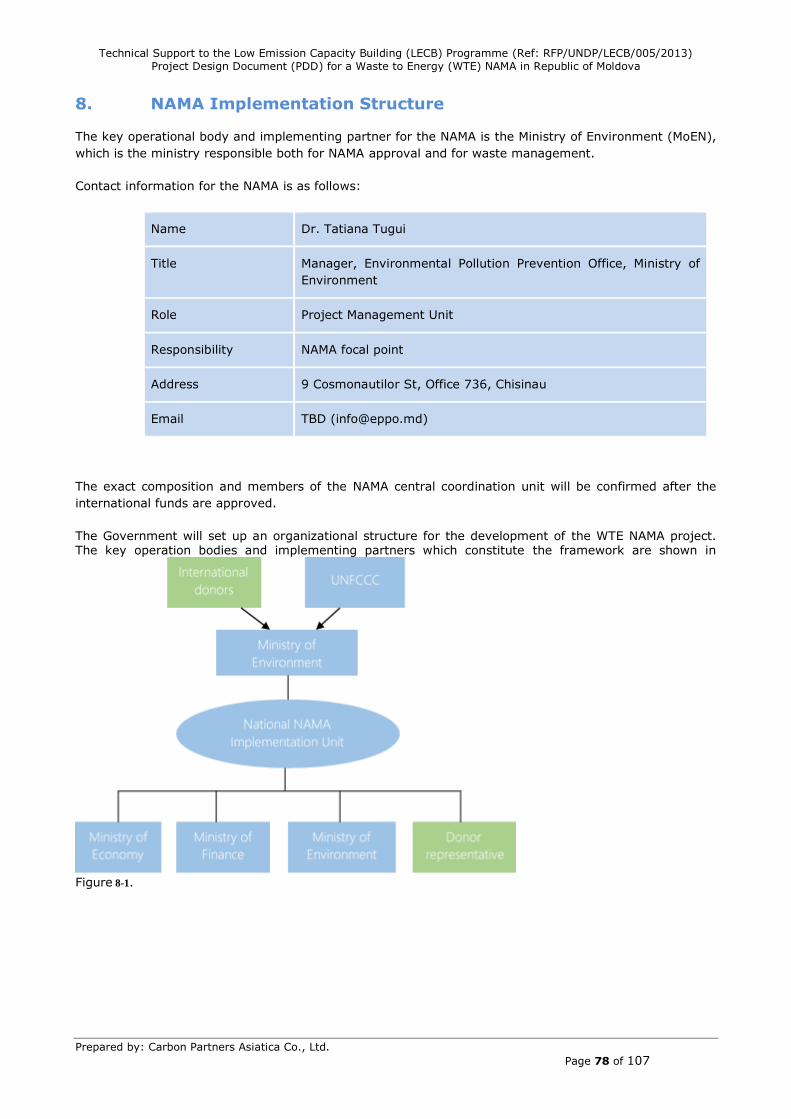
Technical Support to the Low Emission Capacity Building (LECB) Programme (Ref: RFP/UNDP/LECB/005/2013)
Project Design Document (PDD) for a Waste to Energy (WTE) NAMA in Republic of Moldova
Prepared by: Carbon Partners Asiatica Co., Ltd.
Page 78 of 107
8. NAMA Implementation Structure
The key operational body and implementing partner for the NAMA is the Ministry of Environment (MoEN),
which is the ministry responsible both for NAMA approval and for waste management.
Contact information for the NAMA is as follows:
Name Dr. Tatiana Tugui
Title Manager, Environmental Pollution Prevention Office, Ministry of
Environment
Role Project Management Unit
Responsibility NAMA focal point
Address 9 Cosmonautilor St, Office 736, Chisinau
Email TBD ([email protected])
The exact composition and members of the NAMA central coordination unit will be confirmed after the
international funds are approved.
The Government will set up an organizational structure for the development of the WTE NAMA project. The key operation bodies and implementing partners which constitute the framework are shown in
Figure 8-1.
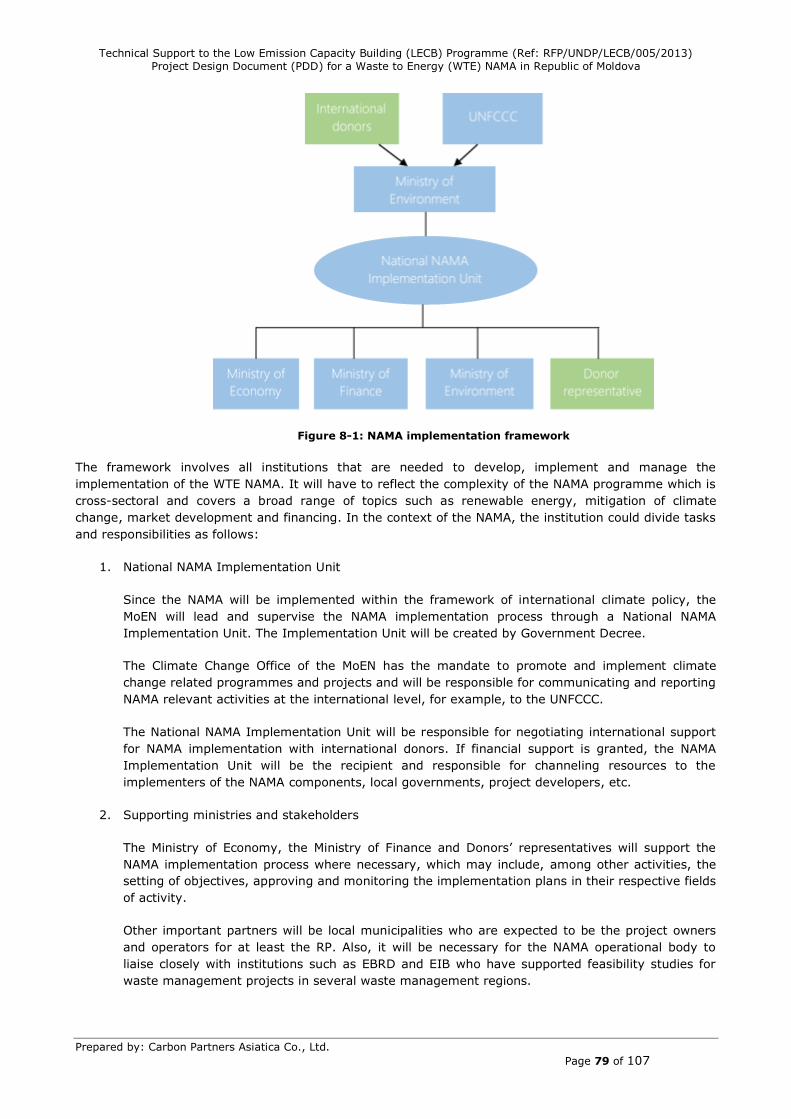
Technical Support to the Low Emission Capacity Building (LECB) Programme (Ref: RFP/UNDP/LECB/005/2013)
Project Design Document (PDD) for a Waste to Energy (WTE) NAMA in Republic of Moldova
Prepared by: Carbon Partners Asiatica Co., Ltd.
Page 79 of 107
Figure 8-1: NAMA implementation framework
The framework involves all institutions that are needed to develop, implement and manage the
implementation of the WTE NAMA. It will have to reflect the complexity of the NAMA programme which is
cross-sectoral and covers a broad range of topics such as renewable energy, mitigation of climate
change, market development and financing. In the context of the NAMA, the institution could divide tasks
and responsibilities as follows:
1. National NAMA Implementation Unit
Since the NAMA will be implemented within the framework of international climate policy, the
MoEN will lead and supervise the NAMA implementation process through a National NAMA
Implementation Unit. The Implementation Unit will be created by Government Decree.
The Climate Change Office of the MoEN has the mandate to promote and implement climate
change related programmes and projects and will be responsible for communicating and reporting
NAMA relevant activities at the international level, for example, to the UNFCCC.
The National NAMA Implementation Unit will be responsible for negotiating international support
for NAMA implementation with international donors. If financial support is granted, the NAMA
Implementation Unit will be the recipient and responsible for channeling resources to the
implementers of the NAMA components, local governments, project developers, etc.
2. Supporting ministries and stakeholders
The Ministry of Economy, the Ministry of Finance and Donors’ representatives will support the
NAMA implementation process where necessary, which may include, among other activities, the
setting of objectives, approving and monitoring the implementation plans in their respective fields
of activity.
Other important partners will be local municipalities who are expected to be the project owners
and operators for at least the RP. Also, it will be necessary for the NAMA operational body to
liaise closely with institutions such as EBRD and EIB who have supported feasibility studies for
waste management projects in several waste management regions.
Technical Support to the Low Emission Capacity Building (LECB) Programme (Ref: RFP/UNDP/LECB/005/2013)
Project Design Document (PDD) for a Waste to Energy (WTE) NAMA in Republic of Moldova
Prepared by: Carbon Partners Asiatica Co., Ltd.
Page 80 of 107
8.1 Phased implementation plan
In relation to risk mitigation discussed in Section 0, the NAMA will be implemented in three
phases. The table below summarizes objectives for each phase.
Table 8-1: Phased implementation plan of the NAMA.
Phase To begin in
Characterization Planned activities
1 As soon as
possible
(Project year 0 or
earlier)
Feasibility study Conduct detailed costing estimation.
Initiate discussion on the FiT with the
regulator, ANRE on the basis of the
above costing estimation.
2 2017
(Project year 0)
Implementation of the
RP as a first WTE facility
Check the accuracy of waste delivery
projection.
Confirm all equipment works properly,
with the planned level of efficiency.
Ascertain the actual costs incurred
(investment as well as operating).
Secure one FiT precedent for future
similar projects.
Ascertain the proper functioning of the
flow of international funds in a timely
and inexpensive manner.
3 To be decided
Full implementation, consisting of 9 further
projects
8.2 Implementation schedule
A Gantt chart is depicted for Phase 2 (i.e. the implementation of the RP) in Table 8-2. In the
light of uncertainty as to when the full implementation (i.e. the 9 further projects) will begin
and the extent of synchronization of the number of individual projects, no implementation
schedule is given for Phase 3 of the NAMA.
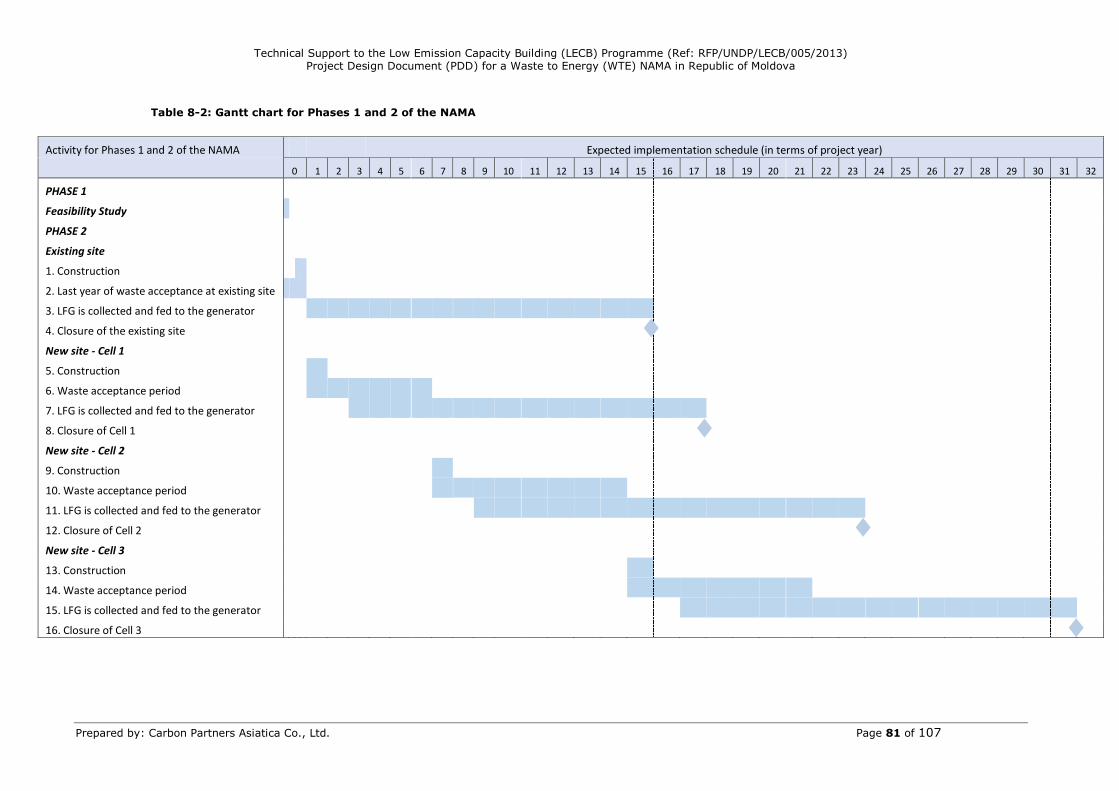
Technical Support to the Low Emission Capacity Building (LECB) Programme (Ref: RFP/UNDP/LECB/005/2013) Project Design Document (PDD) for a Waste to Energy (WTE) NAMA in Republic of Moldova
Prepared by: Carbon Partners Asiatica Co., Ltd. Page 81 of 107
Table 8-2: Gantt chart for Phases 1 and 2 of the NAMA
Activity for Phases 1 and 2 of the NAMA Expected implementation schedule (in terms of project year)
0 1 2 3 4 5 6 7 8 9 10 11 12 13 14 15 16 17 18 19 20 21 22 23 24 25 26 27 28 29 30 31 32
PHASE 1
Feasibility Study
PHASE 2
Existing site
1. Construction
2. Last year of waste acceptance at existing site
3. LFG is collected and fed to the generator
4. Closure of the existing site
New site - Cell 1
5. Construction
6. Waste acceptance period
7. LFG is collected and fed to the generator
8. Closure of Cell 1
New site - Cell 2
9. Construction
10. Waste acceptance period
11. LFG is collected and fed to the generator
12. Closure of Cell 2
New site - Cell 3
13. Construction
14. Waste acceptance period
15. LFG is collected and fed to the generator
16. Closure of Cell 3
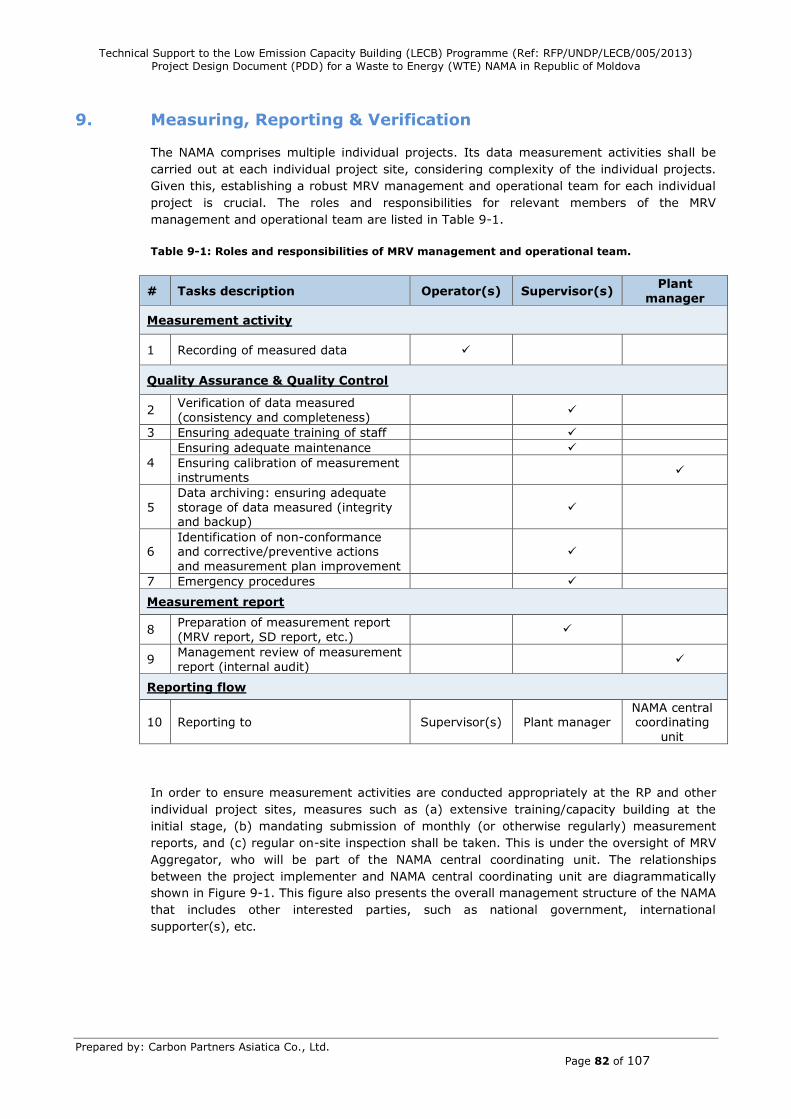
Technical Support to the Low Emission Capacity Building (LECB) Programme (Ref: RFP/UNDP/LECB/005/2013)
Project Design Document (PDD) for a Waste to Energy (WTE) NAMA in Republic of Moldova
Prepared by: Carbon Partners Asiatica Co., Ltd.
Page 82 of 107
9. Measuring, Reporting & Verification
The NAMA comprises multiple individual projects. Its data measurement activities shall be
carried out at each individual project site, considering complexity of the individual projects.
Given this, establishing a robust MRV management and operational team for each individual
project is crucial. The roles and responsibilities for relevant members of the MRV
management and operational team are listed in Table 9-1.
Table 9-1: Roles and responsibilities of MRV management and operational team.
# Tasks description Operator(s) Supervisor(s) Plant
manager
Measurement activity
1 Recording of measured data
Quality Assurance & Quality Control
2 Verification of data measured
(consistency and completeness)
3 Ensuring adequate training of staff
4
Ensuring adequate maintenance
Ensuring calibration of measurement
instruments
5
Data archiving: ensuring adequate
storage of data measured (integrity and backup)
6 Identification of non-conformance and corrective/preventive actions
and measurement plan improvement
7 Emergency procedures
Measurement report
8 Preparation of measurement report
(MRV report, SD report, etc.)
9 Management review of measurement
report (internal audit)
Reporting flow
10 Reporting to Supervisor(s) Plant manager NAMA central coordinating
unit
In order to ensure measurement activities are conducted appropriately at the RP and other
individual project sites, measures such as (a) extensive training/capacity building at the
initial stage, (b) mandating submission of monthly (or otherwise regularly) measurement
reports, and (c) regular on-site inspection shall be taken. This is under the oversight of MRV
Aggregator, who will be part of the NAMA central coordinating unit. The relationships
between the project implementer and NAMA central coordinating unit are diagrammatically
shown in Figure 9-1. This figure also presents the overall management structure of the NAMA
that includes other interested parties, such as national government, international
supporter(s), etc.
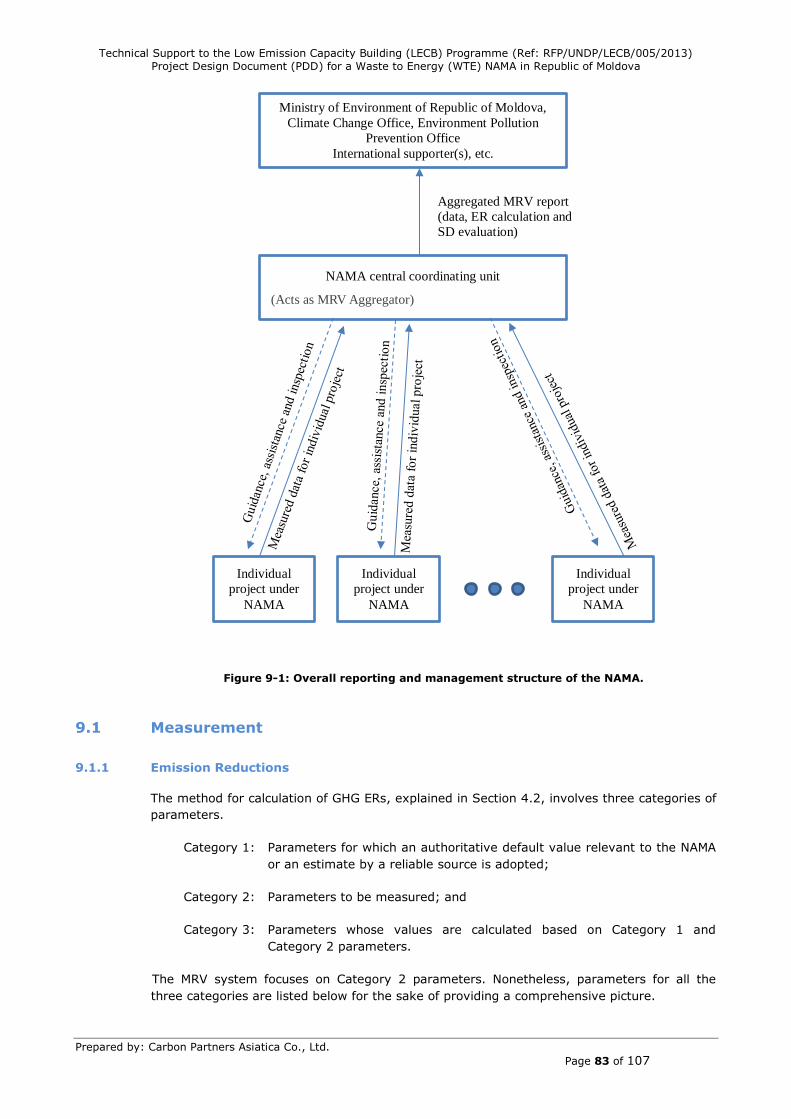
Technical Support to the Low Emission Capacity Building (LECB) Programme (Ref: RFP/UNDP/LECB/005/2013)
Project Design Document (PDD) for a Waste to Energy (WTE) NAMA in Republic of Moldova
Prepared by: Carbon Partners Asiatica Co., Ltd.
Page 83 of 107
Figure 9-1: Overall reporting and management structure of the NAMA.
9.1 Measurement
9.1.1 Emission Reductions
The method for calculation of GHG ERs, explained in Section 4.2, involves three categories of
parameters.
Category 1: Parameters for which an authoritative default value relevant to the NAMA
or an estimate by a reliable source is adopted;
Category 2: Parameters to be measured; and
Category 3: Parameters whose values are calculated based on Category 1 and
Category 2 parameters.
The MRV system focuses on Category 2 parameters. Nonetheless, parameters for all the
three categories are listed below for the sake of providing a comprehensive picture.
Ministry of Environment of Republic of Moldova,
Climate Change Office, Environment Pollution
Prevention Office
International supporter(s), etc.
NAMA central coordinating unit
(Acts as MRV Aggregator)
Individual
project under
NAMA
Individual
project under
NAMA
Individual
project under
NAMA
Aggregated MRV report
(data, ER calculation and
SD evaluation)
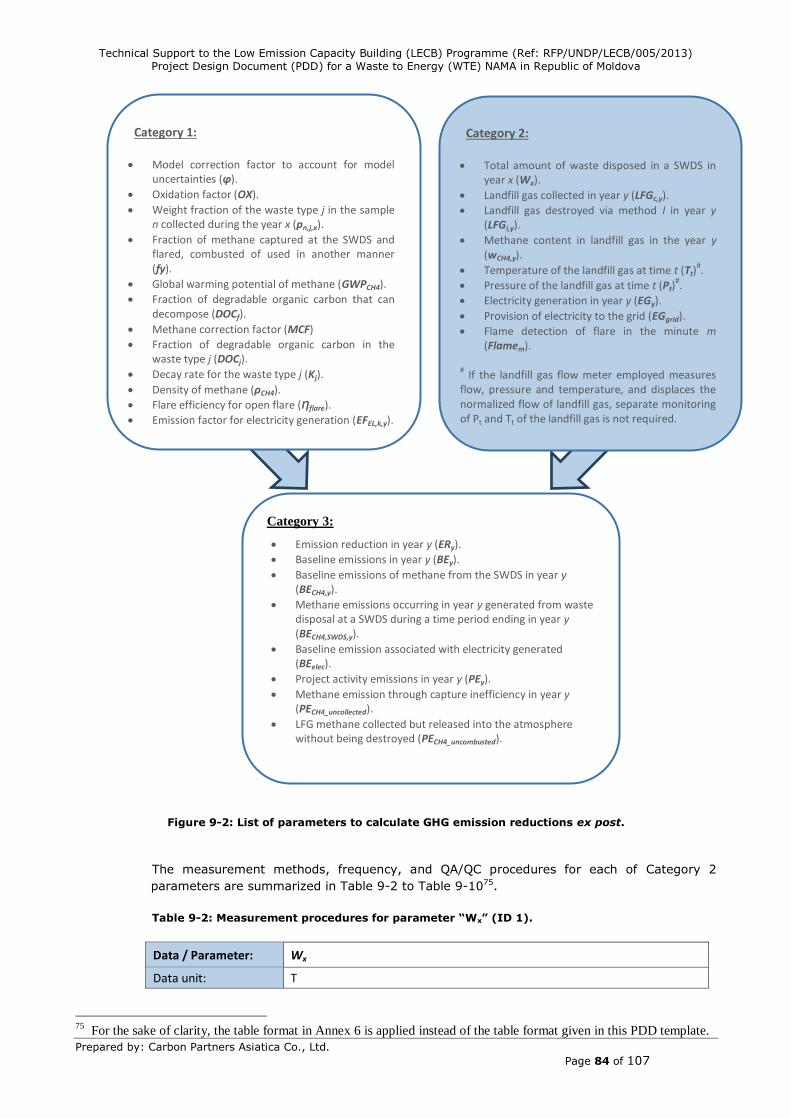
Technical Support to the Low Emission Capacity Building (LECB) Programme (Ref: RFP/UNDP/LECB/005/2013)
Project Design Document (PDD) for a Waste to Energy (WTE) NAMA in Republic of Moldova
Prepared by: Carbon Partners Asiatica Co., Ltd.
Page 84 of 107
Figure 9-2: List of parameters to calculate GHG emission reductions ex post.
The measurement methods, frequency, and QA/QC procedures for each of Category 2
parameters are summarized in Table 9-2 to Table 9-1075.
Table 9-2: Measurement procedures for parameter “Wx” (ID 1).
Data / Parameter: Wx
Data unit: T
75
For the sake of clarity, the table format in Annex 6 is applied instead of the table format given in this PDD template.
Category 2:
Total amount of waste disposed in a SWDS in year x (Wx).
Landfill gas collected in year y (LFGc,y).
Landfill gas destroyed via method I in year y (LFGi,y).
Methane content in landfill gas in the year y (wCH4,y).
Temperature of the landfill gas at time t (Tt)#.
Pressure of the landfill gas at time t (Pt)#.
Electricity generation in year y (EGy).
Provision of electricity to the grid (EGgrid).
Flame detection of flare in the minute m (Flamem).
# If the landfill gas flow meter employed measures
flow, pressure and temperature, and displaces the normalized flow of landfill gas, separate monitoring of Pt and Tt of the landfill gas is not required.
Category 3:
Emission reduction in year y (ERy).
Baseline emissions in year y (BEy).
Baseline emissions of methane from the SWDS in year y (BECH4,y).
Methane emissions occurring in year y generated from waste disposal at a SWDS during a time period ending in year y (BECH4,SWDS,y).
Baseline emission associated with electricity generated (BEelec).
Project activity emissions in year y (PEy).
Methane emission through capture inefficiency in year y (PECH4_uncollected).
LFG methane collected but released into the atmosphere without being destroyed (PECH4_uncombusted).
Category 1:
Model correction factor to account for model uncertainties (φ).
Oxidation factor (OX).
Weight fraction of the waste type j in the sample n collected during the year x (pn,j,x).
Fraction of methane captured at the SWDS and flared, combusted of used in another manner (fy).
Global warming potential of methane (GWPCH4).
Fraction of degradable organic carbon that can decompose (DOCf).
Methane correction factor (MCF)
Fraction of degradable organic carbon in the waste type j (DOCj).
Decay rate for the waste type j (Kj).
Density of methane (ρCH4).
Flare efficiency for open flare (Ƞflare).
Emission factor for electricity generation (EFEL,k,y).
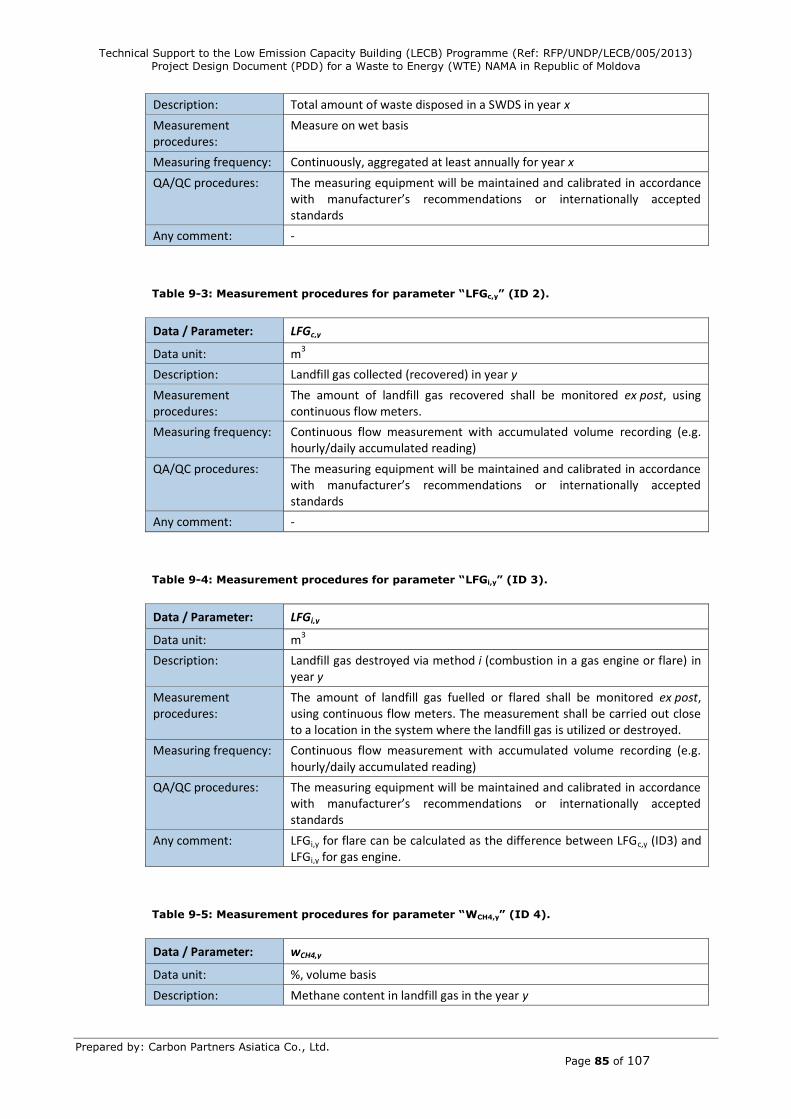
Technical Support to the Low Emission Capacity Building (LECB) Programme (Ref: RFP/UNDP/LECB/005/2013)
Project Design Document (PDD) for a Waste to Energy (WTE) NAMA in Republic of Moldova
Prepared by: Carbon Partners Asiatica Co., Ltd.
Page 85 of 107
Description: Total amount of waste disposed in a SWDS in year x
Measurement procedures:
Measure on wet basis
Measuring frequency: Continuously, aggregated at least annually for year x
QA/QC procedures: The measuring equipment will be maintained and calibrated in accordance with manufacturer’s recommendations or internationally accepted standards
Any comment: -
Table 9-3: Measurement procedures for parameter “LFGc,y” (ID 2).
Data / Parameter: LFGc,y
Data unit: m3
Description: Landfill gas collected (recovered) in year y
Measurement procedures:
The amount of landfill gas recovered shall be monitored ex post, using continuous flow meters.
Measuring frequency: Continuous flow measurement with accumulated volume recording (e.g. hourly/daily accumulated reading)
QA/QC procedures: The measuring equipment will be maintained and calibrated in accordance with manufacturer’s recommendations or internationally accepted standards
Any comment: -
Table 9-4: Measurement procedures for parameter “LFGi,y” (ID 3).
Data / Parameter: LFGi,y
Data unit: m3
Description: Landfill gas destroyed via method i (combustion in a gas engine or flare) in year y
Measurement procedures:
The amount of landfill gas fuelled or flared shall be monitored ex post, using continuous flow meters. The measurement shall be carried out close to a location in the system where the landfill gas is utilized or destroyed.
Measuring frequency: Continuous flow measurement with accumulated volume recording (e.g. hourly/daily accumulated reading)
QA/QC procedures: The measuring equipment will be maintained and calibrated in accordance with manufacturer’s recommendations or internationally accepted standards
Any comment: LFGi,y for flare can be calculated as the difference between LFGc,y (ID3) and LFGi,y for gas engine.
Table 9-5: Measurement procedures for parameter “WCH4,y” (ID 4).
Data / Parameter: wCH4,y
Data unit: %, volume basis
Description: Methane content in landfill gas in the year y
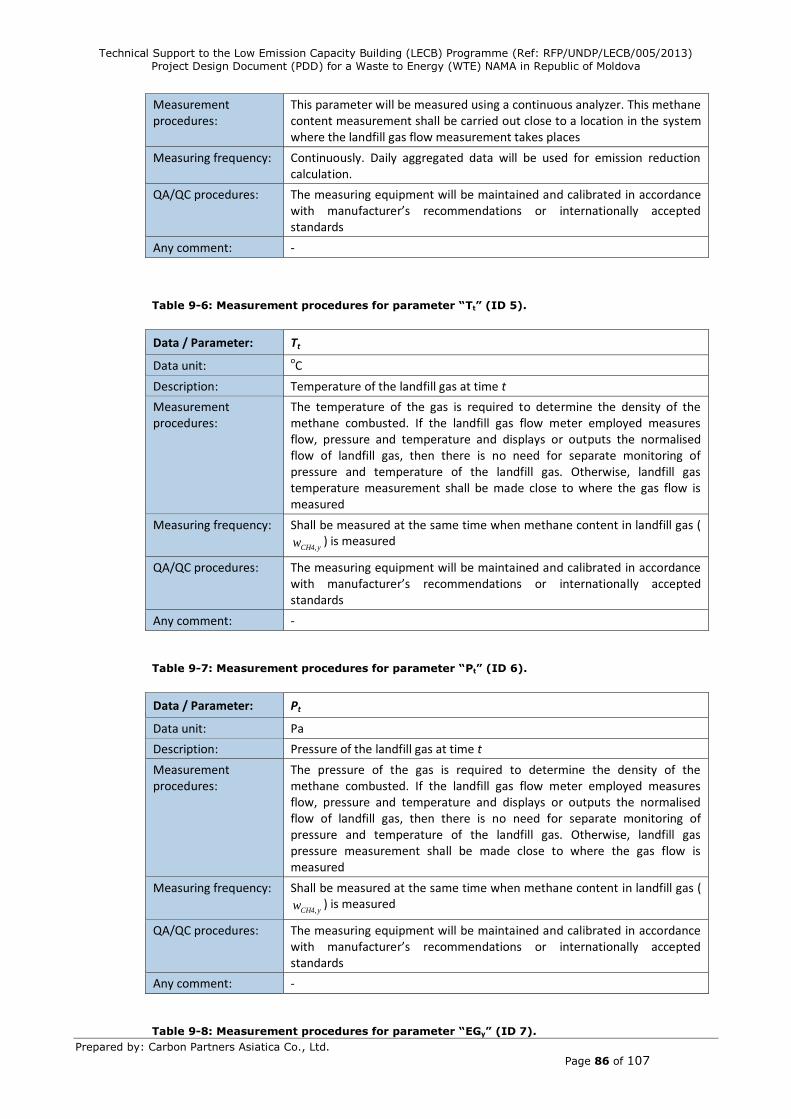
Technical Support to the Low Emission Capacity Building (LECB) Programme (Ref: RFP/UNDP/LECB/005/2013)
Project Design Document (PDD) for a Waste to Energy (WTE) NAMA in Republic of Moldova
Prepared by: Carbon Partners Asiatica Co., Ltd.
Page 86 of 107
Measurement procedures:
This parameter will be measured using a continuous analyzer. This methane content measurement shall be carried out close to a location in the system where the landfill gas flow measurement takes places
Measuring frequency: Continuously. Daily aggregated data will be used for emission reduction calculation.
QA/QC procedures: The measuring equipment will be maintained and calibrated in accordance with manufacturer’s recommendations or internationally accepted standards
Any comment: -
Table 9-6: Measurement procedures for parameter “Tt” (ID 5).
Data / Parameter: Tt
Data unit: oC
Description: Temperature of the landfill gas at time t
Measurement procedures:
The temperature of the gas is required to determine the density of the methane combusted. If the landfill gas flow meter employed measures flow, pressure and temperature and displays or outputs the normalised flow of landfill gas, then there is no need for separate monitoring of pressure and temperature of the landfill gas. Otherwise, landfill gas temperature measurement shall be made close to where the gas flow is measured
Measuring frequency: Shall be measured at the same time when methane content in landfill gas (
yCH4w ,) is measured
QA/QC procedures: The measuring equipment will be maintained and calibrated in accordance with manufacturer’s recommendations or internationally accepted standards
Any comment: -
Table 9-7: Measurement procedures for parameter “Pt” (ID 6).
Data / Parameter: Pt
Data unit: Pa
Description: Pressure of the landfill gas at time t
Measurement procedures:
The pressure of the gas is required to determine the density of the methane combusted. If the landfill gas flow meter employed measures flow, pressure and temperature and displays or outputs the normalised flow of landfill gas, then there is no need for separate monitoring of pressure and temperature of the landfill gas. Otherwise, landfill gas pressure measurement shall be made close to where the gas flow is measured
Measuring frequency: Shall be measured at the same time when methane content in landfill gas (
yCH4w ,) is measured
QA/QC procedures: The measuring equipment will be maintained and calibrated in accordance with manufacturer’s recommendations or internationally accepted standards
Any comment: -
Table 9-8: Measurement procedures for parameter “EGy” (ID 7).
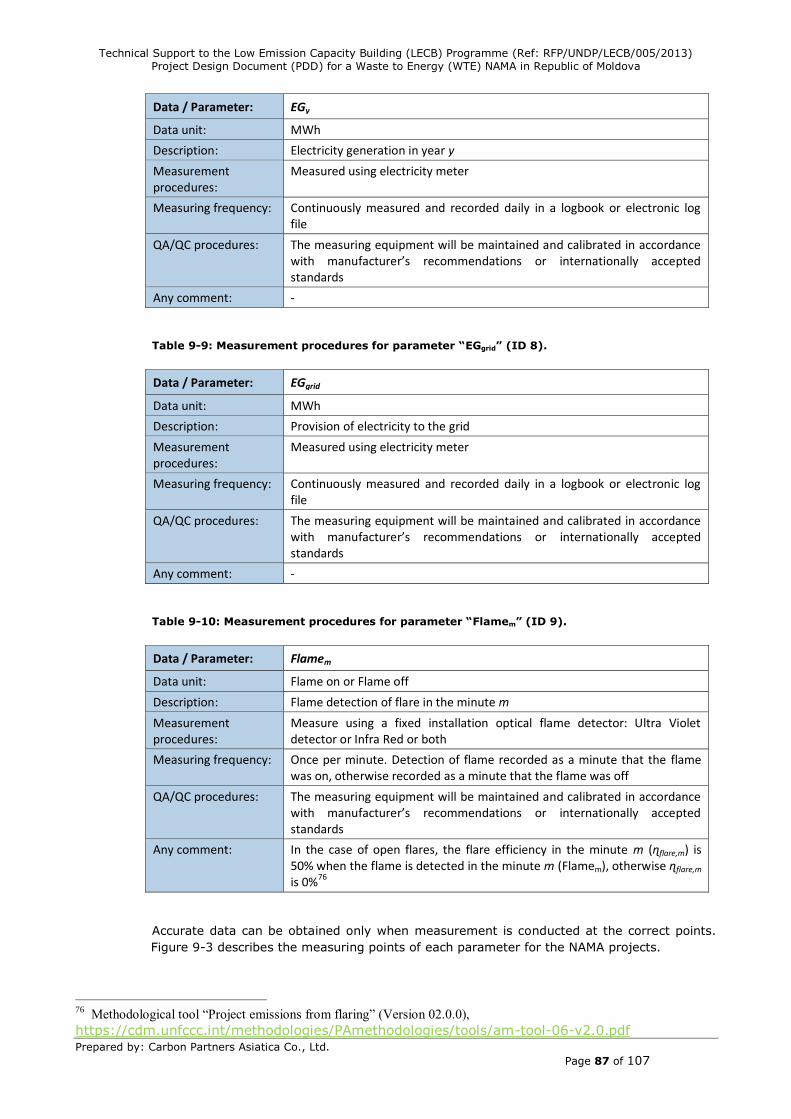
Technical Support to the Low Emission Capacity Building (LECB) Programme (Ref: RFP/UNDP/LECB/005/2013)
Project Design Document (PDD) for a Waste to Energy (WTE) NAMA in Republic of Moldova
Prepared by: Carbon Partners Asiatica Co., Ltd.
Page 87 of 107
Data / Parameter: EGy
Data unit: MWh
Description: Electricity generation in year y
Measurement procedures:
Measured using electricity meter
Measuring frequency: Continuously measured and recorded daily in a logbook or electronic log file
QA/QC procedures: The measuring equipment will be maintained and calibrated in accordance with manufacturer’s recommendations or internationally accepted standards
Any comment: -
Table 9-9: Measurement procedures for parameter “EGgrid” (ID 8).
Data / Parameter: EGgrid
Data unit: MWh
Description: Provision of electricity to the grid
Measurement procedures:
Measured using electricity meter
Measuring frequency: Continuously measured and recorded daily in a logbook or electronic log file
QA/QC procedures: The measuring equipment will be maintained and calibrated in accordance with manufacturer’s recommendations or internationally accepted standards
Any comment: -
Table 9-10: Measurement procedures for parameter “Flamem” (ID 9).
Data / Parameter: Flamem
Data unit: Flame on or Flame off
Description: Flame detection of flare in the minute m
Measurement procedures:
Measure using a fixed installation optical flame detector: Ultra Violet detector or Infra Red or both
Measuring frequency: Once per minute. Detection of flame recorded as a minute that the flame was on, otherwise recorded as a minute that the flame was off
QA/QC procedures: The measuring equipment will be maintained and calibrated in accordance with manufacturer’s recommendations or internationally accepted standards
Any comment: In the case of open flares, the flare efficiency in the minute m (ɳflare,m) is 50% when the flame is detected in the minute m (Flamem), otherwise ɳflare,m is 0%76
Accurate data can be obtained only when measurement is conducted at the correct points.
Figure 9-3 describes the measuring points of each parameter for the NAMA projects.
76
Methodological tool “Project emissions from flaring” (Version 02.0.0),
https://cdm.unfccc.int/methodologies/PAmethodologies/tools/am-tool-06-v2.0.pdf
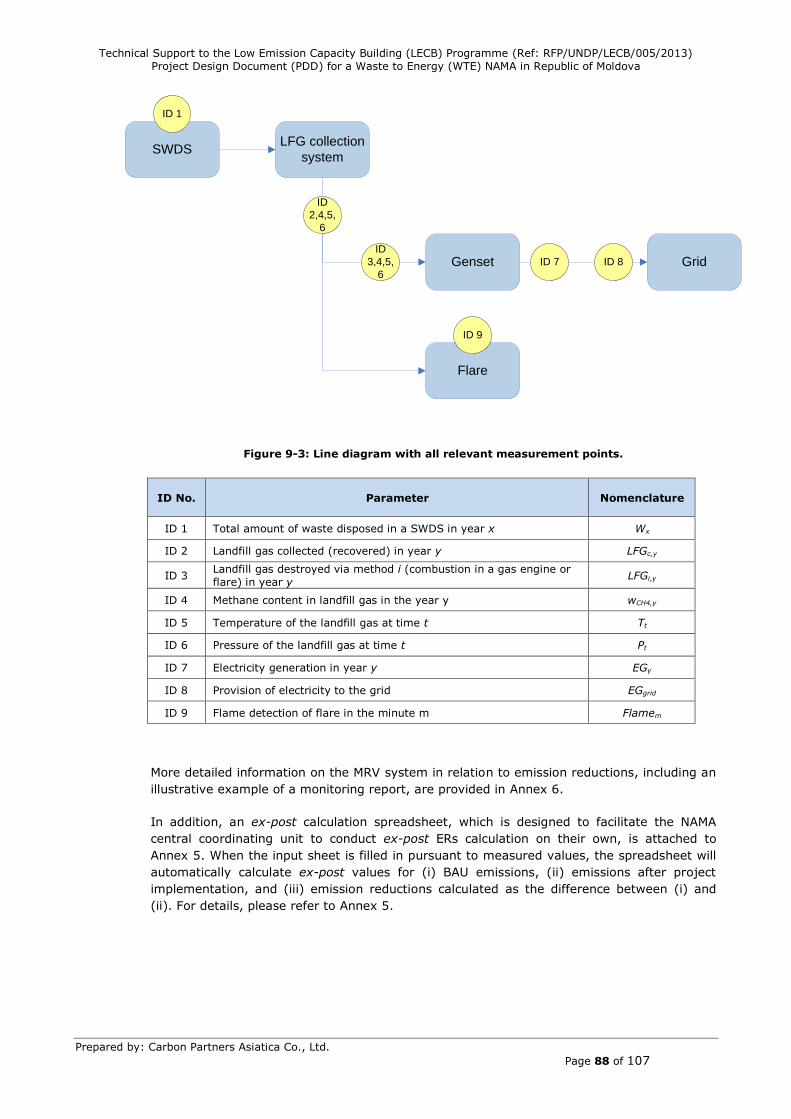
Technical Support to the Low Emission Capacity Building (LECB) Programme (Ref: RFP/UNDP/LECB/005/2013)
Project Design Document (PDD) for a Waste to Energy (WTE) NAMA in Republic of Moldova
Prepared by: Carbon Partners Asiatica Co., Ltd.
Page 88 of 107
SWDSLFG collection
system
Genset
Flare
Grid
ID 1
ID
2,4,5,
6
ID
3,4,5,
6
ID 7 ID 8
ID 9
Figure 9-3: Line diagram with all relevant measurement points.
ID No. Parameter Nomenclature
ID 1 Total amount of waste disposed in a SWDS in year x Wx
ID 2 Landfill gas collected (recovered) in year y LFGc,y
ID 3 Landfill gas destroyed via method i (combustion in a gas engine or
flare) in year y LFGi,y
ID 4 Methane content in landfill gas in the year y wCH4,y
ID 5 Temperature of the landfill gas at time t Tt
ID 6 Pressure of the landfill gas at time t Pt
ID 7 Electricity generation in year y EGy
ID 8 Provision of electricity to the grid EGgrid
ID 9 Flame detection of flare in the minute m Flamem
More detailed information on the MRV system in relation to emission reductions, including an
illustrative example of a monitoring report, are provided in Annex 6.
In addition, an ex-post calculation spreadsheet, which is designed to facilitate the NAMA
central coordinating unit to conduct ex-post ERs calculation on their own, is attached to
Annex 5. When the input sheet is filled in pursuant to measured values, the spreadsheet will
automatically calculate ex-post values for (i) BAU emissions, (ii) emissions after project
implementation, and (iii) emission reductions calculated as the difference between (i) and
(ii). For details, please refer to Annex 5.
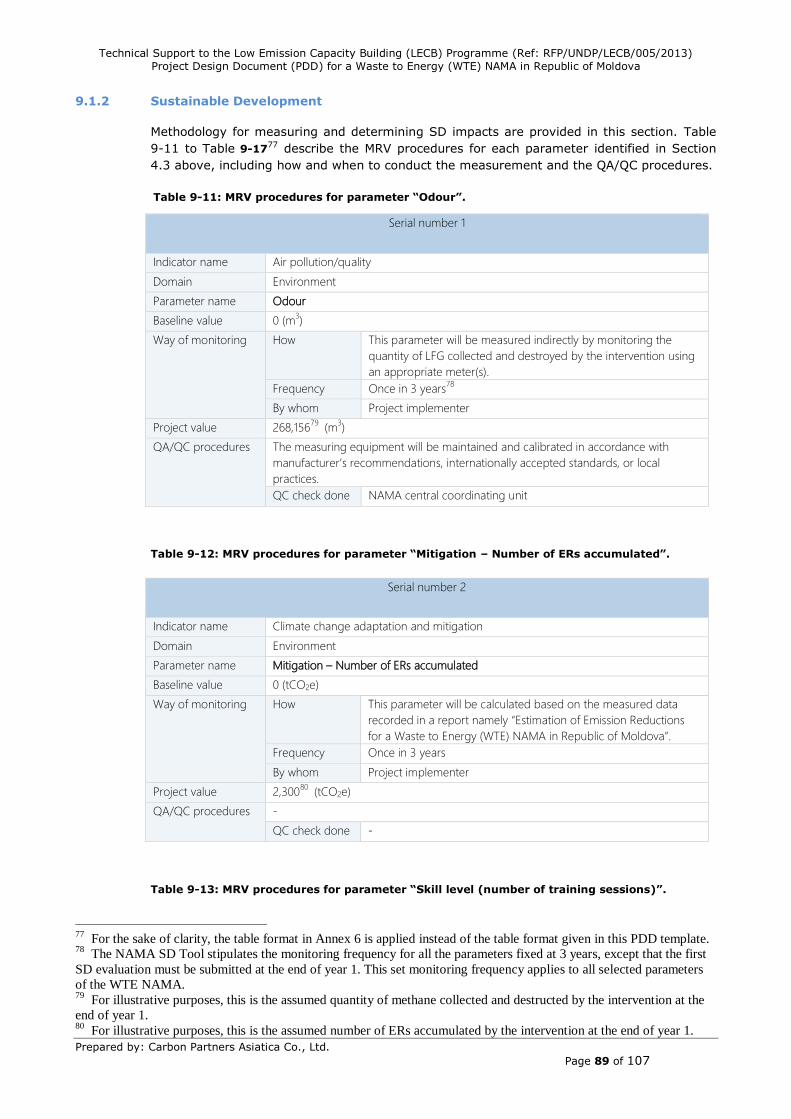
Technical Support to the Low Emission Capacity Building (LECB) Programme (Ref: RFP/UNDP/LECB/005/2013)
Project Design Document (PDD) for a Waste to Energy (WTE) NAMA in Republic of Moldova
Prepared by: Carbon Partners Asiatica Co., Ltd.
Page 89 of 107
9.1.2 Sustainable Development
Methodology for measuring and determining SD impacts are provided in this section. Table
9-11 to Table 9-1777 describe the MRV procedures for each parameter identified in Section
4.3 above, including how and when to conduct the measurement and the QA/QC procedures.
Table 9-11: MRV procedures for parameter “Odour”.
Serial number 1
Indicator name Air pollution/quality
Domain Environment
Parameter name Odour
Baseline value 0 (m3)
Way of monitoring How This parameter will be measured indirectly by monitoring the
quantity of LFG collected and destroyed by the intervention using
an appropriate meter(s).
Frequency Once in 3 years78
By whom Project implementer
Project value 268,15679
(m3)
QA/QC procedures The measuring equipment will be maintained and calibrated in accordance with
manufacturer’s recommendations, internationally accepted standards, or local
practices.
QC check done NAMA central coordinating unit
Table 9-12: MRV procedures for parameter “Mitigation – Number of ERs accumulated”.
Serial number 2
Indicator name Climate change adaptation and mitigation
Domain Environment
Parameter name Mitigation – Number of ERs accumulated
Baseline value 0 (tCO2e)
Way of monitoring How This parameter will be calculated based on the measured data
recorded in a report namely “Estimation of Emission Reductions
for a Waste to Energy (WTE) NAMA in Republic of Moldova”.
Frequency Once in 3 years
By whom Project implementer
Project value 2,30080
(tCO2e)
QA/QC procedures -
QC check done -
Table 9-13: MRV procedures for parameter “Skill level (number of training sessions)”.
77
For the sake of clarity, the table format in Annex 6 is applied instead of the table format given in this PDD template. 78
The NAMA SD Tool stipulates the monitoring frequency for all the parameters fixed at 3 years, except that the first
SD evaluation must be submitted at the end of year 1. This set monitoring frequency applies to all selected parameters
of the WTE NAMA. 79
For illustrative purposes, this is the assumed quantity of methane collected and destructed by the intervention at the
end of year 1. 80
For illustrative purposes, this is the assumed number of ERs accumulated by the intervention at the end of year 1.
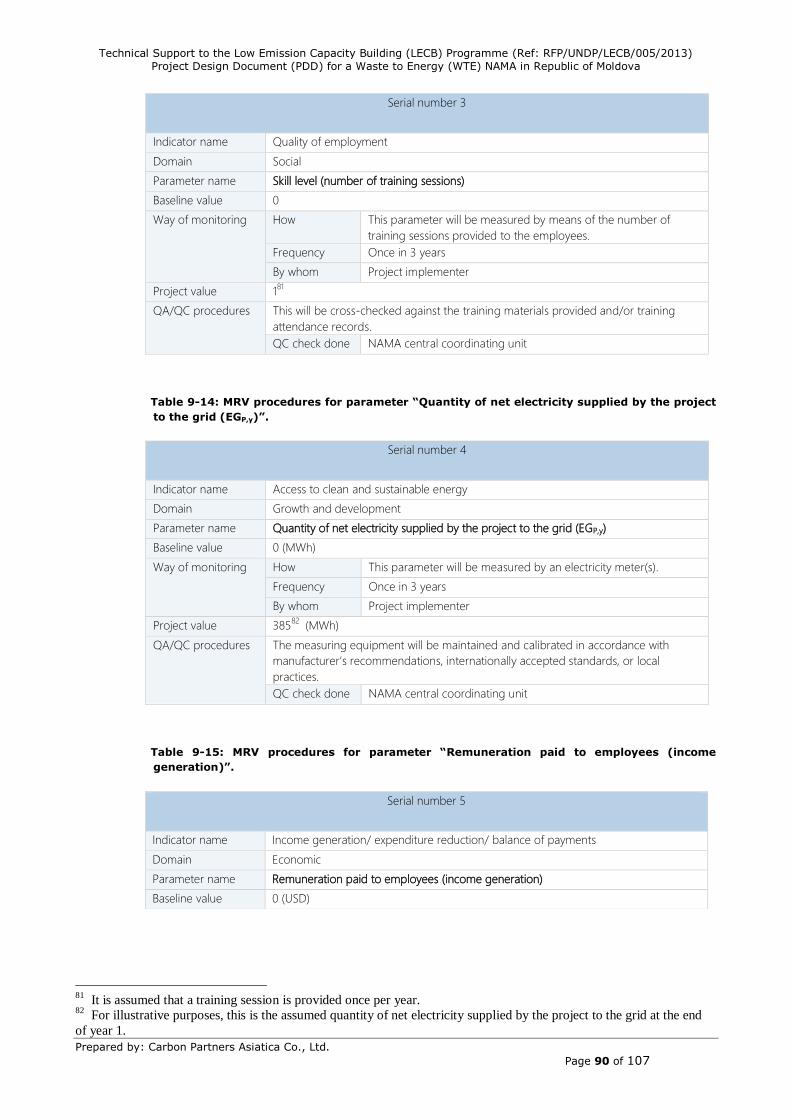
Technical Support to the Low Emission Capacity Building (LECB) Programme (Ref: RFP/UNDP/LECB/005/2013)
Project Design Document (PDD) for a Waste to Energy (WTE) NAMA in Republic of Moldova
Prepared by: Carbon Partners Asiatica Co., Ltd.
Page 90 of 107
Serial number 3
Indicator name Quality of employment
Domain Social
Parameter name Skill level (number of training sessions)
Baseline value 0
Way of monitoring How This parameter will be measured by means of the number of
training sessions provided to the employees.
Frequency Once in 3 years
By whom Project implementer
Project value 181
QA/QC procedures This will be cross-checked against the training materials provided and/or training
attendance records.
QC check done NAMA central coordinating unit
Table 9-14: MRV procedures for parameter “Quantity of net electricity supplied by the project
to the grid (EGP,y)”.
Serial number 4
Indicator name Access to clean and sustainable energy
Domain Growth and development
Parameter name Quantity of net electricity supplied by the project to the grid (EGP,y)
Baseline value 0 (MWh)
Way of monitoring How This parameter will be measured by an electricity meter(s).
Frequency Once in 3 years
By whom Project implementer
Project value 38582
(MWh)
QA/QC procedures The measuring equipment will be maintained and calibrated in accordance with
manufacturer’s recommendations, internationally accepted standards, or local
practices.
QC check done NAMA central coordinating unit
Table 9-15: MRV procedures for parameter “Remuneration paid to employees (income
generation)”.
81
It is assumed that a training session is provided once per year. 82
For illustrative purposes, this is the assumed quantity of net electricity supplied by the project to the grid at the end
of year 1.
Serial number 5
Indicator name Income generation/ expenditure reduction/ balance of payments
Domain Economic
Parameter name Remuneration paid to employees (income generation)
Baseline value 0 (USD)
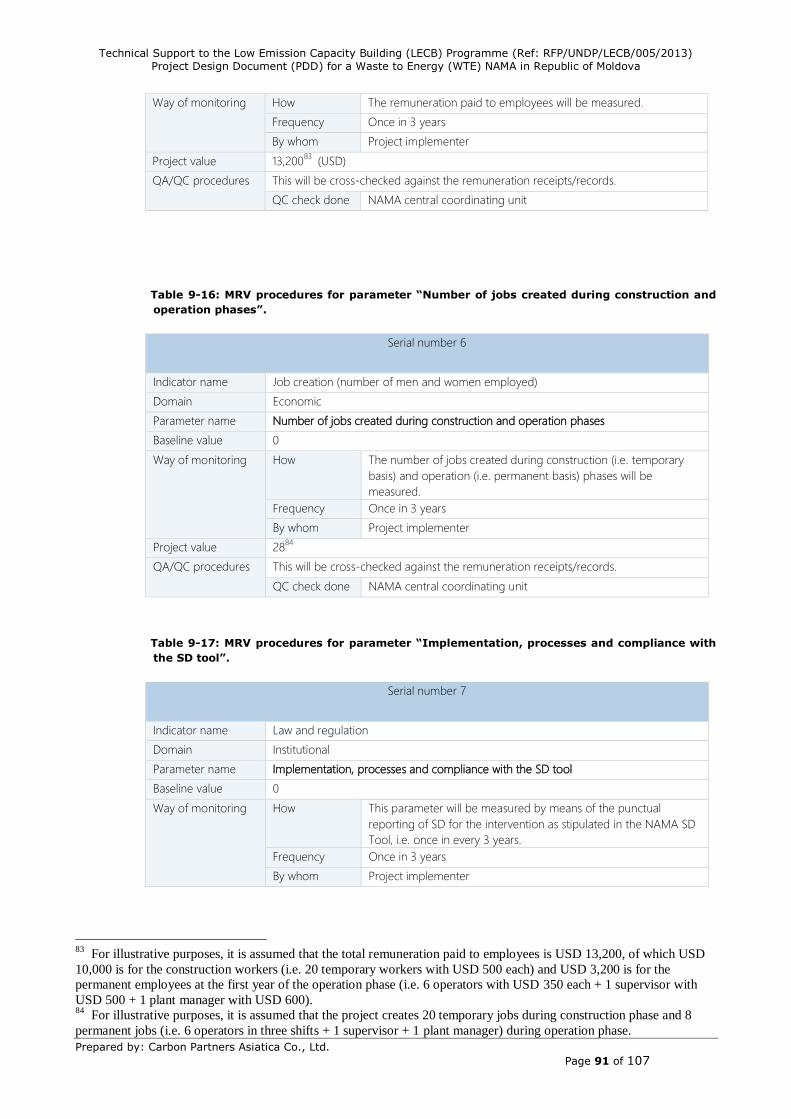
Technical Support to the Low Emission Capacity Building (LECB) Programme (Ref: RFP/UNDP/LECB/005/2013)
Project Design Document (PDD) for a Waste to Energy (WTE) NAMA in Republic of Moldova
Prepared by: Carbon Partners Asiatica Co., Ltd.
Page 91 of 107
Table 9-16: MRV procedures for parameter “Number of jobs created during construction and
operation phases”.
Serial number 6
Indicator name Job creation (number of men and women employed)
Domain Economic
Parameter name Number of jobs created during construction and operation phases
Baseline value 0
Way of monitoring How The number of jobs created during construction (i.e. temporary
basis) and operation (i.e. permanent basis) phases will be
measured.
Frequency Once in 3 years
By whom Project implementer
Project value 2884
QA/QC procedures This will be cross-checked against the remuneration receipts/records.
QC check done NAMA central coordinating unit
Table 9-17: MRV procedures for parameter “Implementation, processes and compliance with
the SD tool”.
Serial number 7
Indicator name Law and regulation
Domain Institutional
Parameter name Implementation, processes and compliance with the SD tool
Baseline value 0
Way of monitoring How This parameter will be measured by means of the punctual
reporting of SD for the intervention as stipulated in the NAMA SD
Tool, i.e. once in every 3 years.
Frequency Once in 3 years
By whom Project implementer
83
For illustrative purposes, it is assumed that the total remuneration paid to employees is USD 13,200, of which USD
10,000 is for the construction workers (i.e. 20 temporary workers with USD 500 each) and USD 3,200 is for the
permanent employees at the first year of the operation phase (i.e. 6 operators with USD 350 each + 1 supervisor with
USD 500 + 1 plant manager with USD 600). 84
For illustrative purposes, it is assumed that the project creates 20 temporary jobs during construction phase and 8
permanent jobs (i.e. 6 operators in three shifts + 1 supervisor + 1 plant manager) during operation phase.
Way of monitoring How The remuneration paid to employees will be measured.
Frequency Once in 3 years
By whom Project implementer
Project value 13,20083
(USD)
QA/QC procedures This will be cross-checked against the remuneration receipts/records.
QC check done NAMA central coordinating unit
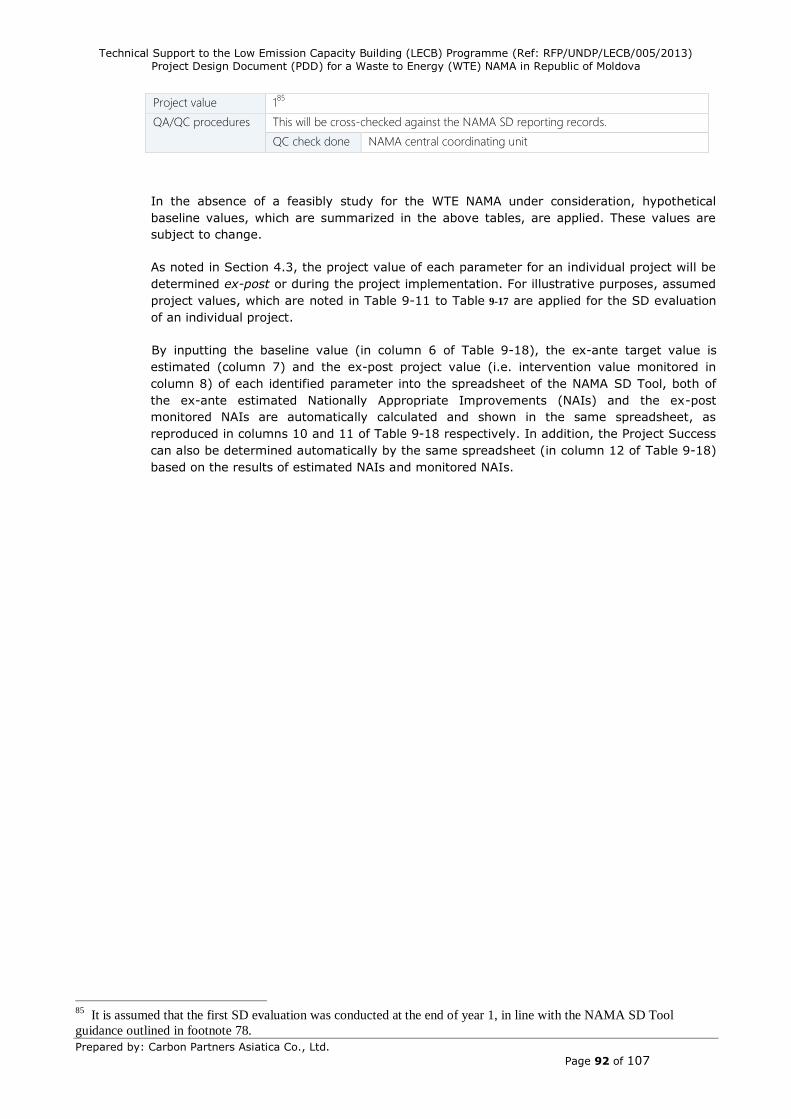
Technical Support to the Low Emission Capacity Building (LECB) Programme (Ref: RFP/UNDP/LECB/005/2013)
Project Design Document (PDD) for a Waste to Energy (WTE) NAMA in Republic of Moldova
Prepared by: Carbon Partners Asiatica Co., Ltd.
Page 92 of 107
Project value 185
QA/QC procedures This will be cross-checked against the NAMA SD reporting records.
QC check done NAMA central coordinating unit
In the absence of a feasibly study for the WTE NAMA under consideration, hypothetical
baseline values, which are summarized in the above tables, are applied. These values are
subject to change.
As noted in Section 4.3, the project value of each parameter for an individual project will be
determined ex-post or during the project implementation. For illustrative purposes, assumed
project values, which are noted in Table 9-11 to Table 9-17 are applied for the SD evaluation
of an individual project.
By inputting the baseline value (in column 6 of Table 9-18), the ex-ante target value is
estimated (column 7) and the ex-post project value (i.e. intervention value monitored in
column 8) of each identified parameter into the spreadsheet of the NAMA SD Tool, both of
the ex-ante estimated Nationally Appropriate Improvements (NAIs) and the ex-post
monitored NAIs are automatically calculated and shown in the same spreadsheet, as
reproduced in columns 10 and 11 of Table 9-18 respectively. In addition, the Project Success
can also be determined automatically by the same spreadsheet (in column 12 of Table 9-18)
based on the results of estimated NAIs and monitored NAIs.
85
It is assumed that the first SD evaluation was conducted at the end of year 1, in line with the NAMA SD Tool
guidance outlined in footnote 78.
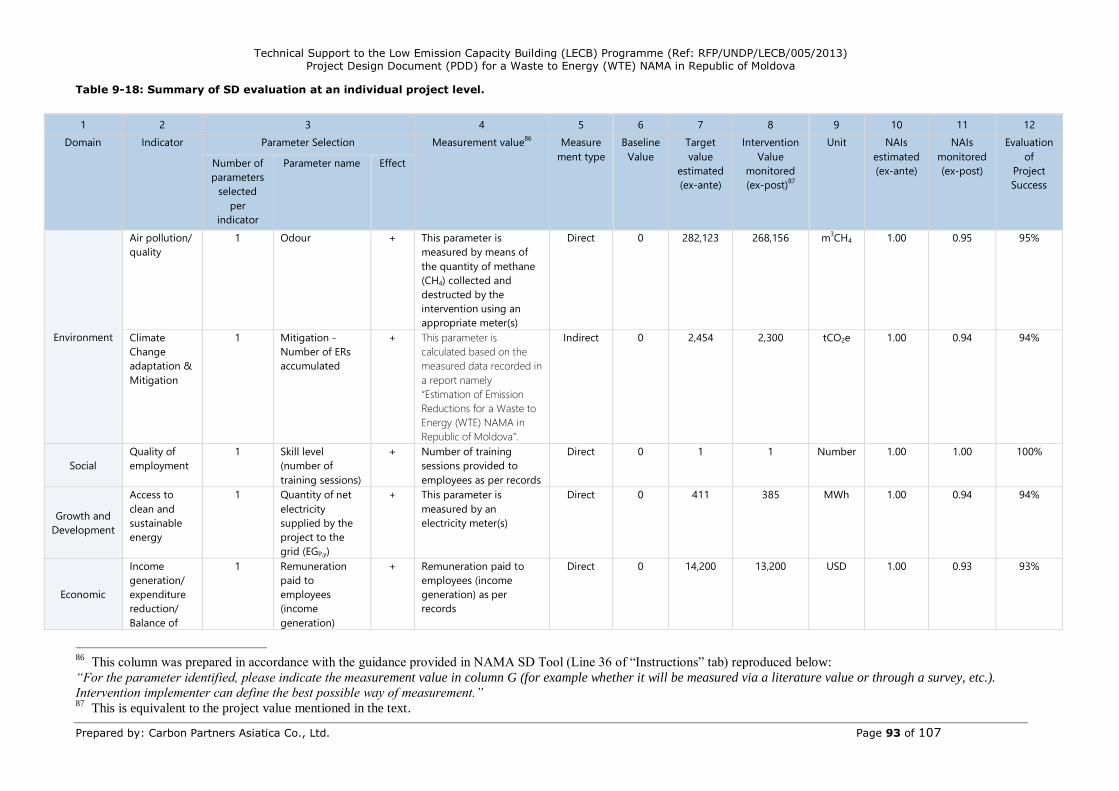
Technical Support to the Low Emission Capacity Building (LECB) Programme (Ref: RFP/UNDP/LECB/005/2013) Project Design Document (PDD) for a Waste to Energy (WTE) NAMA in Republic of Moldova
Prepared by: Carbon Partners Asiatica Co., Ltd. Page 93 of 107
Table 9-18: Summary of SD evaluation at an individual project level.
1 2 3 4 5 6 7 8 9 10 11 12
Domain Indicator Parameter Selection Measurement value86
Measure
ment type
Baseline
Value
Target
value
estimated
(ex-ante)
Intervention
Value
monitored
(ex-post)87
Unit NAIs
estimated
(ex-ante)
NAIs
monitored
(ex-post)
Evaluation
of
Project
Success
Number of
parameters
selected
per
indicator
Parameter name Effect
Environment
Air pollution/
quality
1 Odour + This parameter is
measured by means of
the quantity of methane
(CH4) collected and
destructed by the
intervention using an
appropriate meter(s)
Direct 0 282,123 268,156 m3CH4 1.00 0.95 95%
Climate
Change
adaptation &
Mitigation
1 Mitigation -
Number of ERs
accumulated
+ This parameter is
calculated based on the
measured data recorded in
a report namely
“Estimation of Emission
Reductions for a Waste to
Energy (WTE) NAMA in
Republic of Moldova”.
Indirect 0 2,454 2,300 tCO2e 1.00 0.94 94%
Social
Quality of
employment
1 Skill level
(number of
training sessions)
+ Number of training
sessions provided to
employees as per records
Direct 0 1 1 Number 1.00 1.00 100%
Growth and
Development
Access to
clean and
sustainable
energy
1 Quantity of net
electricity
supplied by the
project to the
grid (EGP,y)
+ This parameter is
measured by an
electricity meter(s)
Direct 0 411 385 MWh 1.00 0.94 94%
Economic
Income
generation/
expenditure
reduction/
Balance of
1 Remuneration
paid to
employees
(income
generation)
+ Remuneration paid to
employees (income
generation) as per
records
Direct 0 14,200 13,200 USD 1.00 0.93 93%
86
This column was prepared in accordance with the guidance provided in NAMA SD Tool (Line 36 of “Instructions” tab) reproduced below:
“For the parameter identified, please indicate the measurement value in column G (for example whether it will be measured via a literature value or through a survey, etc.).
Intervention implementer can define the best possible way of measurement.” 87
This is equivalent to the project value mentioned in the text.
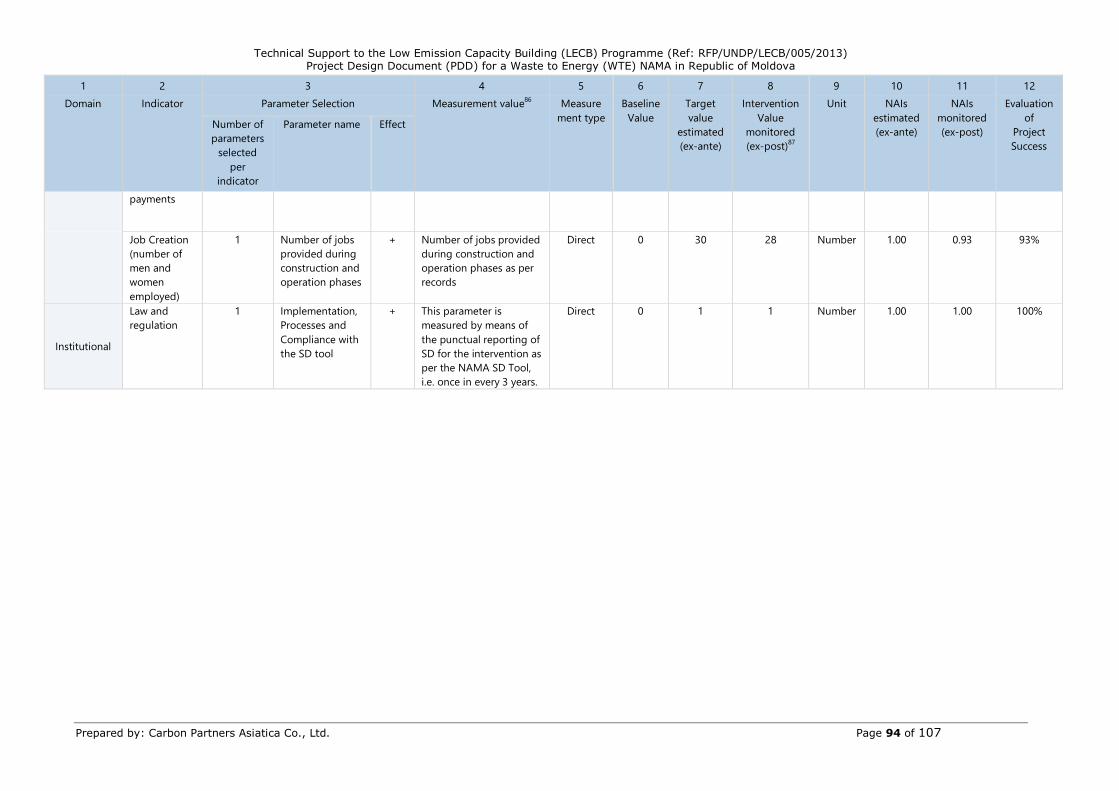
Technical Support to the Low Emission Capacity Building (LECB) Programme (Ref: RFP/UNDP/LECB/005/2013) Project Design Document (PDD) for a Waste to Energy (WTE) NAMA in Republic of Moldova
Prepared by: Carbon Partners Asiatica Co., Ltd. Page 94 of 107
1 2 3 4 5 6 7 8 9 10 11 12
Domain Indicator Parameter Selection Measurement value86
Measure
ment type
Baseline
Value
Target
value
estimated
(ex-ante)
Intervention
Value
monitored
(ex-post)87
Unit NAIs
estimated
(ex-ante)
NAIs
monitored
(ex-post)
Evaluation
of
Project
Success
Number of
parameters
selected
per
indicator
Parameter name Effect
payments
Job Creation
(number of
men and
women
employed)
1 Number of jobs
provided during
construction and
operation phases
+ Number of jobs provided
during construction and
operation phases as per
records
Direct 0 30 28 Number 1.00 0.93 93%
Institutional
Law and
regulation
1 Implementation,
Processes and
Compliance with
the SD tool
+ This parameter is
measured by means of
the punctual reporting of
SD for the intervention as
per the NAMA SD Tool,
i.e. once in every 3 years.
Direct 0 1 1 Number 1.00 1.00 100%
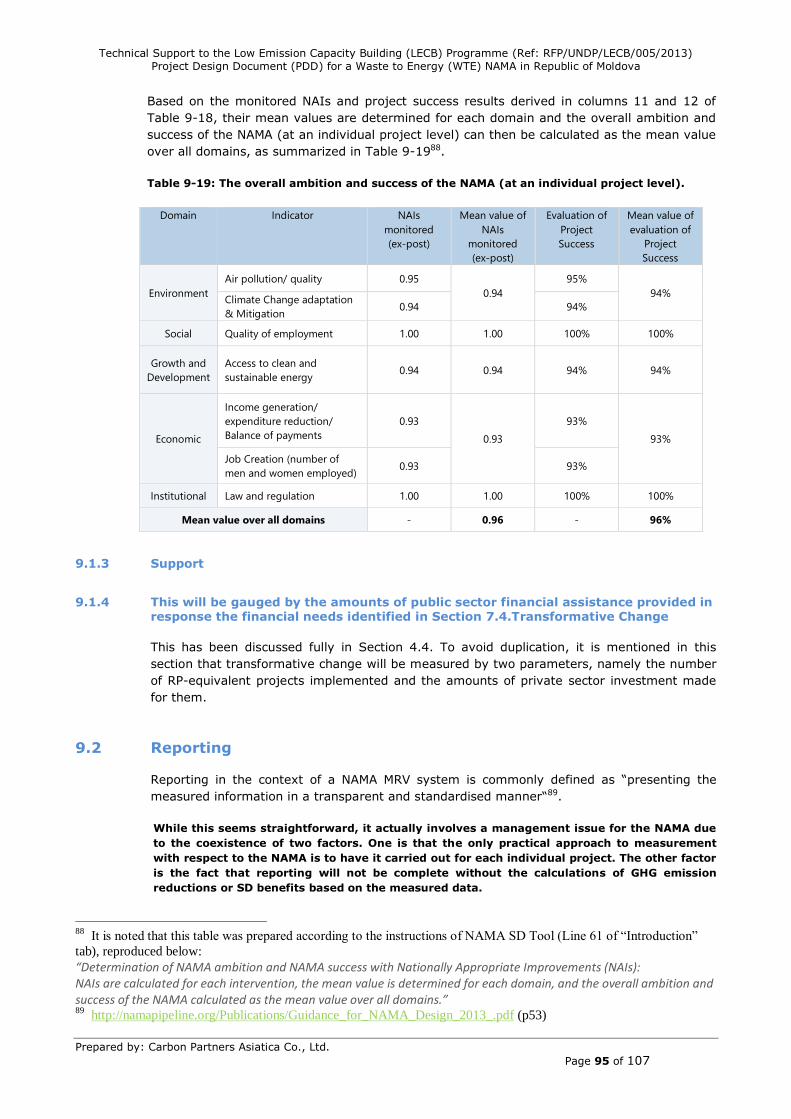
Technical Support to the Low Emission Capacity Building (LECB) Programme (Ref: RFP/UNDP/LECB/005/2013)
Project Design Document (PDD) for a Waste to Energy (WTE) NAMA in Republic of Moldova
Prepared by: Carbon Partners Asiatica Co., Ltd.
Page 95 of 107
Based on the monitored NAIs and project success results derived in columns 11 and 12 of
Table 9-18, their mean values are determined for each domain and the overall ambition and
success of the NAMA (at an individual project level) can then be calculated as the mean value
over all domains, as summarized in Table 9-1988.
Table 9-19: The overall ambition and success of the NAMA (at an individual project level).
Domain Indicator NAIs
monitored
(ex-post)
Mean value of
NAIs
monitored
(ex-post)
Evaluation of
Project
Success
Mean value of
evaluation of
Project
Success
Environment
Air pollution/ quality 0.95
0.94
95%
94% Climate Change adaptation
& Mitigation 0.94 94%
Social Quality of employment 1.00 1.00 100% 100%
Growth and
Development
Access to clean and
sustainable energy 0.94 0.94 94% 94%
Economic
Income generation/
expenditure reduction/
Balance of payments
0.93
0.93
93%
93%
Job Creation (number of
men and women employed) 0.93 93%
Institutional Law and regulation 1.00 1.00 100% 100%
Mean value over all domains - 0.96 - 96%
9.1.3 Support
9.1.4 This will be gauged by the amounts of public sector financial assistance provided in response the financial needs identified in Section 7.4.Transformative Change
This has been discussed fully in Section 4.4. To avoid duplication, it is mentioned in this
section that transformative change will be measured by two parameters, namely the number
of RP-equivalent projects implemented and the amounts of private sector investment made
for them.
9.2 Reporting
Reporting in the context of a NAMA MRV system is commonly defined as “presenting the
measured information in a transparent and standardised manner“89.
While this seems straightforward, it actually involves a management issue for the NAMA due
to the coexistence of two factors. One is that the only practical approach to measurement
with respect to the NAMA is to have it carried out for each individual project. The other factor
is the fact that reporting will not be complete without the calculations of GHG emission
reductions or SD benefits based on the measured data.
88
It is noted that this table was prepared according to the instructions of NAMA SD Tool (Line 61 of “Introduction”
tab), reproduced below:
“Determination of NAMA ambition and NAMA success with Nationally Appropriate Improvements (NAIs): NAIs are calculated for each intervention, the mean value is determined for each domain, and the overall ambition and success of the NAMA calculated as the mean value over all domains.” 89
http://namapipeline.org/Publications/Guidance_for_NAMA_Design_2013_.pdf (p53)
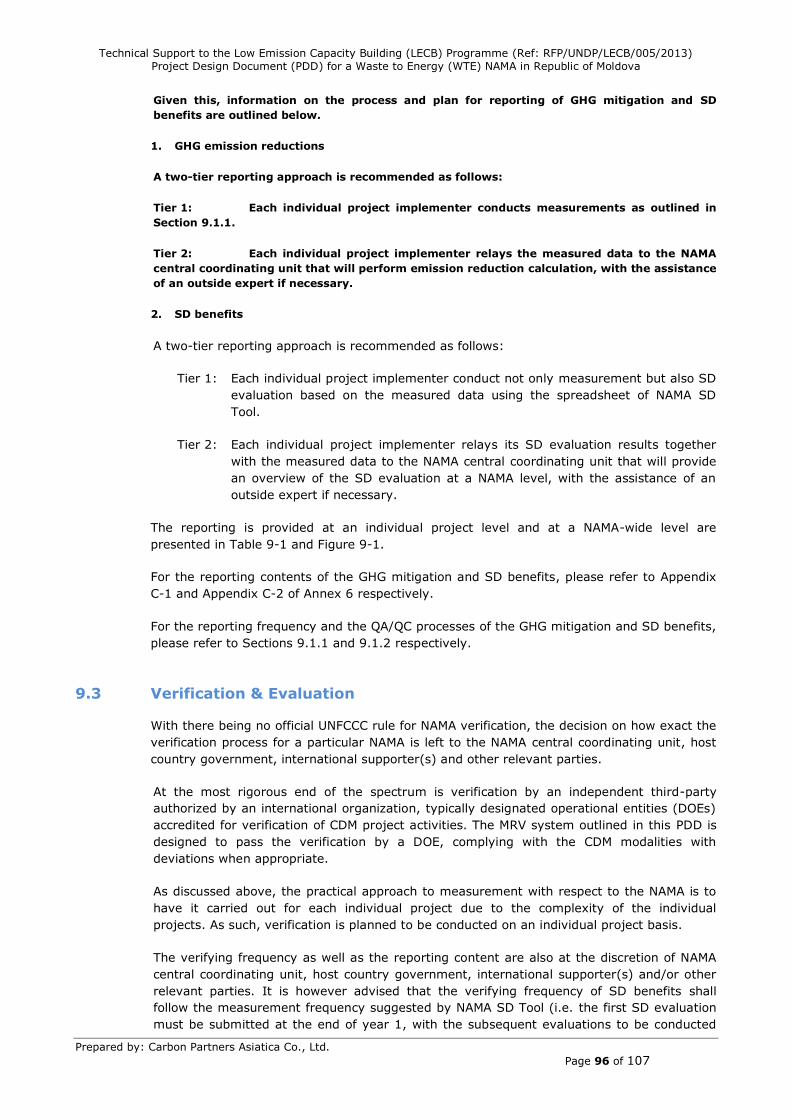
Technical Support to the Low Emission Capacity Building (LECB) Programme (Ref: RFP/UNDP/LECB/005/2013)
Project Design Document (PDD) for a Waste to Energy (WTE) NAMA in Republic of Moldova
Prepared by: Carbon Partners Asiatica Co., Ltd.
Page 96 of 107
Given this, information on the process and plan for reporting of GHG mitigation and SD
benefits are outlined below.
1. GHG emission reductions
A two-tier reporting approach is recommended as follows:
Tier 1: Each individual project implementer conducts measurements as outlined in
Section 9.1.1.
Tier 2: Each individual project implementer relays the measured data to the NAMA
central coordinating unit that will perform emission reduction calculation, with the assistance
of an outside expert if necessary.
2. SD benefits
A two-tier reporting approach is recommended as follows:
Tier 1: Each individual project implementer conduct not only measurement but also SD
evaluation based on the measured data using the spreadsheet of NAMA SD
Tool.
Tier 2: Each individual project implementer relays its SD evaluation results together
with the measured data to the NAMA central coordinating unit that will provide
an overview of the SD evaluation at a NAMA level, with the assistance of an
outside expert if necessary.
The reporting is provided at an individual project level and at a NAMA-wide level are
presented in Table 9-1 and Figure 9-1.
For the reporting contents of the GHG mitigation and SD benefits, please refer to Appendix
C-1 and Appendix C-2 of Annex 6 respectively.
For the reporting frequency and the QA/QC processes of the GHG mitigation and SD benefits,
please refer to Sections 9.1.1 and 9.1.2 respectively.
9.3 Verification & Evaluation
With there being no official UNFCCC rule for NAMA verification, the decision on how exact the
verification process for a particular NAMA is left to the NAMA central coordinating unit, host
country government, international supporter(s) and other relevant parties.
At the most rigorous end of the spectrum is verification by an independent third-party
authorized by an international organization, typically designated operational entities (DOEs)
accredited for verification of CDM project activities. The MRV system outlined in this PDD is
designed to pass the verification by a DOE, complying with the CDM modalities with
deviations when appropriate.
As discussed above, the practical approach to measurement with respect to the NAMA is to
have it carried out for each individual project due to the complexity of the individual
projects. As such, verification is planned to be conducted on an individual project basis.
The verifying frequency as well as the reporting content are also at the discretion of NAMA
central coordinating unit, host country government, international supporter(s) and/or other
relevant parties. It is however advised that the verifying frequency of SD benefits shall
follow the measurement frequency suggested by NAMA SD Tool (i.e. the first SD evaluation
must be submitted at the end of year 1, with the subsequent evaluations to be conducted
Technical Support to the Low Emission Capacity Building (LECB) Programme (Ref: RFP/UNDP/LECB/005/2013)
Project Design Document (PDD) for a Waste to Energy (WTE) NAMA in Republic of Moldova
Prepared by: Carbon Partners Asiatica Co., Ltd.
Page 97 of 107
once in every 3 years thereafter), whereas that of GHG mitigation may follow the same
verifying pattern as SD benefits or may be set as once a year.
As part of the quality control processes, both of the two-tiered MRV reports (Section 9.2)
and the verification and evaluation reports (prepared by a verifier or DOE based on a desk
review of MRV reports and/or on-site visit) for each individual project and the aggregated
report/summary for the NAMA (prepared by MRV aggregator) shall be reviewed by
interested parties, such as the project implementer, NAMA central coordinating unit,
Moldovan government, international supporter(s), etc.
Under this verification and evaluation arrangement, not only the performance of each
individual project, in turn the NAMA, can be tracked, but also the outcomes of GHG
mitigation and SD benefits can be quantified.
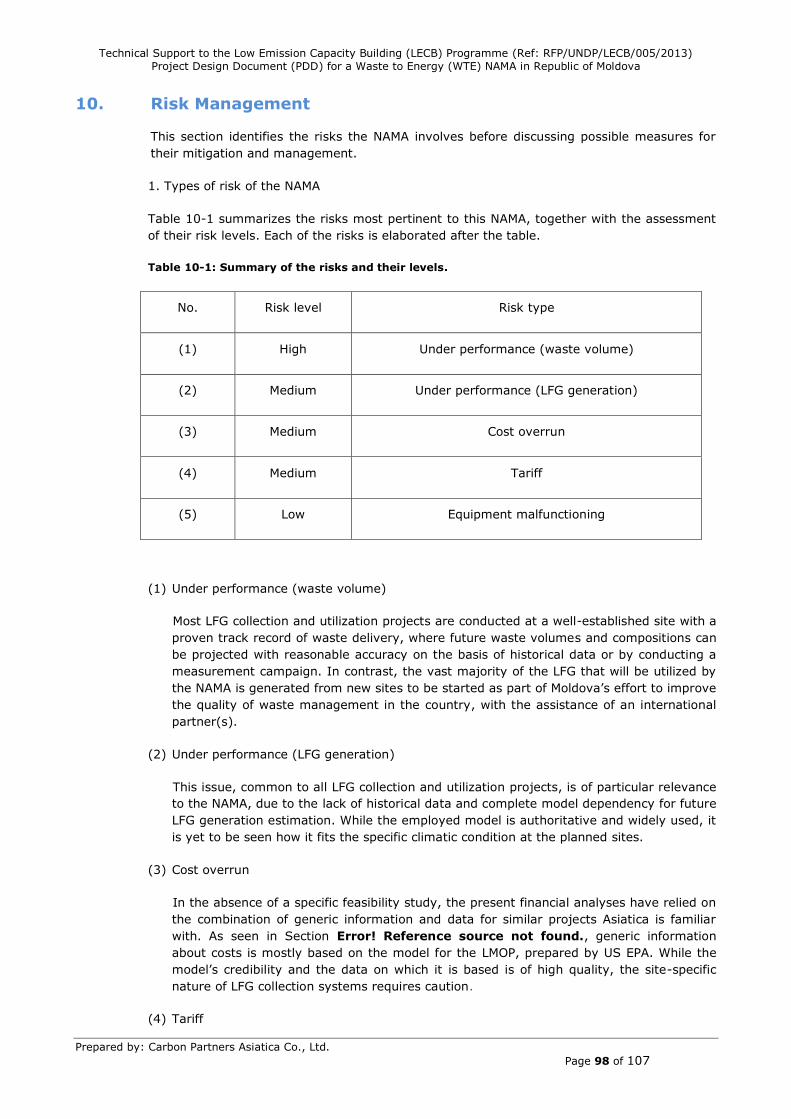
Technical Support to the Low Emission Capacity Building (LECB) Programme (Ref: RFP/UNDP/LECB/005/2013)
Project Design Document (PDD) for a Waste to Energy (WTE) NAMA in Republic of Moldova
Prepared by: Carbon Partners Asiatica Co., Ltd.
Page 98 of 107
10. Risk Management
This section identifies the risks the NAMA involves before discussing possible measures for
their mitigation and management.
1. Types of risk of the NAMA
Table 10-1 summarizes the risks most pertinent to this NAMA, together with the assessment
of their risk levels. Each of the risks is elaborated after the table.
Table 10-1: Summary of the risks and their levels.
No. Risk level Risk type
(1) High Under performance (waste volume)
(2) Medium Under performance (LFG generation)
(3) Medium Cost overrun
(4) Medium Tariff
(5) Low Equipment malfunctioning
(1) Under performance (waste volume)
Most LFG collection and utilization projects are conducted at a well-established site with a
proven track record of waste delivery, where future waste volumes and compositions can
be projected with reasonable accuracy on the basis of historical data or by conducting a
measurement campaign. In contrast, the vast majority of the LFG that will be utilized by
the NAMA is generated from new sites to be started as part of Moldova’s effort to improve
the quality of waste management in the country, with the assistance of an international
partner(s).
(2) Under performance (LFG generation)
This issue, common to all LFG collection and utilization projects, is of particular relevance
to the NAMA, due to the lack of historical data and complete model dependency for future
LFG generation estimation. While the employed model is authoritative and widely used, it
is yet to be seen how it fits the specific climatic condition at the planned sites.
(3) Cost overrun
In the absence of a specific feasibility study, the present financial analyses have relied on
the combination of generic information and data for similar projects Asiatica is familiar
with. As seen in Section Error! Reference source not found., generic information
about costs is mostly based on the model for the LMOP, prepared by US EPA. While the
model’s credibility and the data on which it is based is of high quality, the site-specific
nature of LFG collection systems requires caution.
(4) Tariff
Technical Support to the Low Emission Capacity Building (LECB) Programme (Ref: RFP/UNDP/LECB/005/2013)
Project Design Document (PDD) for a Waste to Energy (WTE) NAMA in Republic of Moldova
Prepared by: Carbon Partners Asiatica Co., Ltd.
Page 99 of 107
Revenues for the NAMA are dictated by the FiT granted to it. Having extensively
discussed the tariff issues, the Moldova team and Asiatica believe that the assumed tariff
level (USD 126/MWh) is reasonable. Nonetheless, this is without a confirmation at this
time.
(5) Equipment malfunctioning
LFG collection and utilization activity undertaken by the NAMA applies a proven
technology, functioning well in a great many countries in the world. It is different than
newer WTE technologies (such as anaerobic digestion and gasification) which, albeit
successful in some countries, cannot claim to have been universally established.
In this sense, the NAMA’s technology risk per se is limited. Nonetheless, there is a need
to be mindful of the highly site-specific nature of this technology in terms of waste
composition, geology, moisture, impurities, etc. in order to ensure proper functioning of
the LFG collection system and the electricity generation equipment.
It is added that as regards environmental and social aspects, the NAMA intervention will pose
little risk, while producing overwhelmingly positive effects.
2. Risk mitigation measures
The NAMA design includes measures to mitigate two of the five risks.
A detailed feasibility study planned and funded as an integral part of the NAMA will
substantially mitigate, though not eliminate, Risk (3) (i.e., cost overrun).
The availability of such a feasibility study will help finalize the FiT rate before
investments are committed, eliminating Risk (4).
3. Risk management
Unfortunately, the remaining three risks defy definite mitigation measures. Faced with this
type of situation, which is not rare in practice, the approach often adopted is to manage the
risks though financial structuring 90 . For the NAMA under discussion, this entails the
development of a financial structure that is agreeable to both an international supporter and
private sector investors, in terms of risk benefit comparison. The ensuing sections explain
how this is to be achieved.
For the private sector investors, the three risks (as well as the risk of cost overrun in
comparison with the detailed feasibility study) will be significantly reduced by the provision
of a bridge loan outlined in Section 7.3, which allows them to make investment only after
three years of successful operation.
Naturally, the investment is not risk free. For example, after successfully operating for the
first three years, the LFG collection system may be impaired by unusually heavy rainfall. It is
also possible that at some point after three years, one of the large communities whose waste
has been transported to the SWDS may decide to start its own composting programme,
greatly reducing the amount of organic waste supplied to the SWDS. Nonetheless, the
investor is likely to consider such risks as acceptable, in view of the reasonably good payback
period (10 years initially and 7 years when counted from the time private sector investment
is made after three years’ operation).
90
Please note the use of the term “manage” as opposed to “mitigate”. This is because financial structuring is a zero-
sum game, to use the term in game theory, and does not reduce the amount of the total risk. Instead, it attempts to
distribute the risks in such a way that will be acceptable to participants.
Technical Support to the Low Emission Capacity Building (LECB) Programme (Ref: RFP/UNDP/LECB/005/2013)
Project Design Document (PDD) for a Waste to Energy (WTE) NAMA in Republic of Moldova
Prepared by: Carbon Partners Asiatica Co., Ltd.
Page 100 of 107
For the international NAMA supporter, one of the good points of the proposed financial
structure is the following phased approach mentioned in Section 0.
Phase 1: Feasibility study
Phase 2: Implementation of the RP as the first WTE installation
Phase 3: Full implementation, consisting of 9 RP equivalents (10 RP equivalents in
total, combining Phases 2 and 3)
This phased approach will offer two benefits to the potential international NAMA supporter:
(1) Relatively small amounts required for Phase 1 (USD 150,000) and Phase 2 (USD
744,967); and (2) An opportunity to confirm the successful operation of the first WTE
installation before making a more substantial amount of commitment for Phase 3.
The proposed financial structure also means a cost effective way to assist GHG mitigation. As
shown in line (VII) of Table 7-8 in Section 7.4, the cost for the international NAMA supporter
per tCO2e of reduction is estimated to be between USD 0.631 and USD 2.244, depending on
how the costs of loans are calculated.
It is hoped that these two factors will convince the international NAMA supporter that
extending the bridge loans is a reasonable risk to assume, despite the presence of Risk (1), Risk (2) and Risk (5).
Technical Support to the Low Emission Capacity Building (LECB) Programme (Ref: RFP/UNDP/LECB/005/2013)
Project Design Document (PDD) for a Waste to Energy (WTE) NAMA in Republic of Moldova
Prepared by: Carbon Partners Asiatica Co., Ltd.
Page 101 of 107
11. Conclusion
The NAMA has four distinct advantages. It will:
1. Achieve GHG mitigation at a low cost (estimated to be USD 0.63 - USD 2.24 / tCO2e
reduction, depending on how the cost of loans is determined), while delivering a
substantial amount of GHG reduction (3,387,114 tCO2e) throughout the lifetime of the
NAMA;
2. Offer significant SD benefits; and
3. Set a good precedent for entities other than the central government to invest in climate
change mitigation projects and be instrumental in achieving transformational change.
4. The risks it involves can be controlled by phased implementation. For the first two phases
– a feasibility study and the implementation of the first WTE facility, the amount of
international support is limited to less than USD 1 million (USD 150,000 for a feasibility
study and USD 744,967 for the first WTE facility, totalling USD 894,967).
It is recommended to move forward expeditiously with the NAMA and seek international
support for the first two phases, in anticipation of full implementation (Phase 3) later.
Technical Support to the Low Emission Capacity Building (LECB) Programme (Ref: RFP/UNDP/LECB/005/2013)
Project Design Document (PDD) for a Waste to Energy (WTE) NAMA in Republic of Moldova
Prepared by: Carbon Partners Asiatica Co., Ltd.
Page 102 of 107
References
All sources of information referred to in the NAMA PDD are clarified in footnotes.
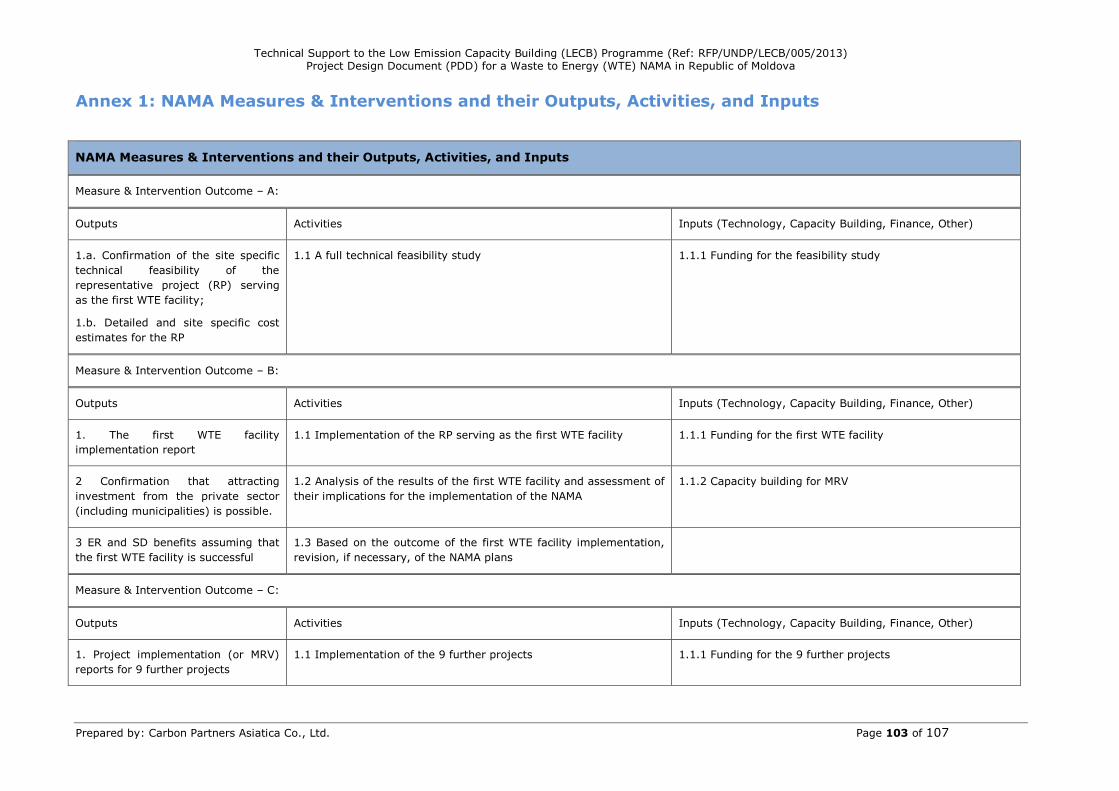
Technical Support to the Low Emission Capacity Building (LECB) Programme (Ref: RFP/UNDP/LECB/005/2013) Project Design Document (PDD) for a Waste to Energy (WTE) NAMA in Republic of Moldova
Prepared by: Carbon Partners Asiatica Co., Ltd. Page 103 of 107
Annex 1: NAMA Measures & Interventions and their Outputs, Activities, and Inputs
NAMA Measures & Interventions and their Outputs, Activities, and Inputs
Measure & Intervention Outcome – A:
Outputs Activities Inputs (Technology, Capacity Building, Finance, Other)
1.a. Confirmation of the site specific
technical feasibility of the
representative project (RP) serving
as the first WTE facility;
1.b. Detailed and site specific cost
estimates for the RP
1.1 A full technical feasibility study 1.1.1 Funding for the feasibility study
Measure & Intervention Outcome – B:
Outputs Activities Inputs (Technology, Capacity Building, Finance, Other)
1. The first WTE facility
implementation report
1.1 Implementation of the RP serving as the first WTE facility 1.1.1 Funding for the first WTE facility
2 Confirmation that attracting
investment from the private sector
(including municipalities) is possible.
1.2 Analysis of the results of the first WTE facility and assessment of
their implications for the implementation of the NAMA
1.1.2 Capacity building for MRV
3 ER and SD benefits assuming that
the first WTE facility is successful
1.3 Based on the outcome of the first WTE facility implementation,
revision, if necessary, of the NAMA plans
Measure & Intervention Outcome – C:
Outputs Activities Inputs (Technology, Capacity Building, Finance, Other)
1. Project implementation (or MRV)
reports for 9 further projects
1.1 Implementation of the 9 further projects 1.1.1 Funding for the 9 further projects
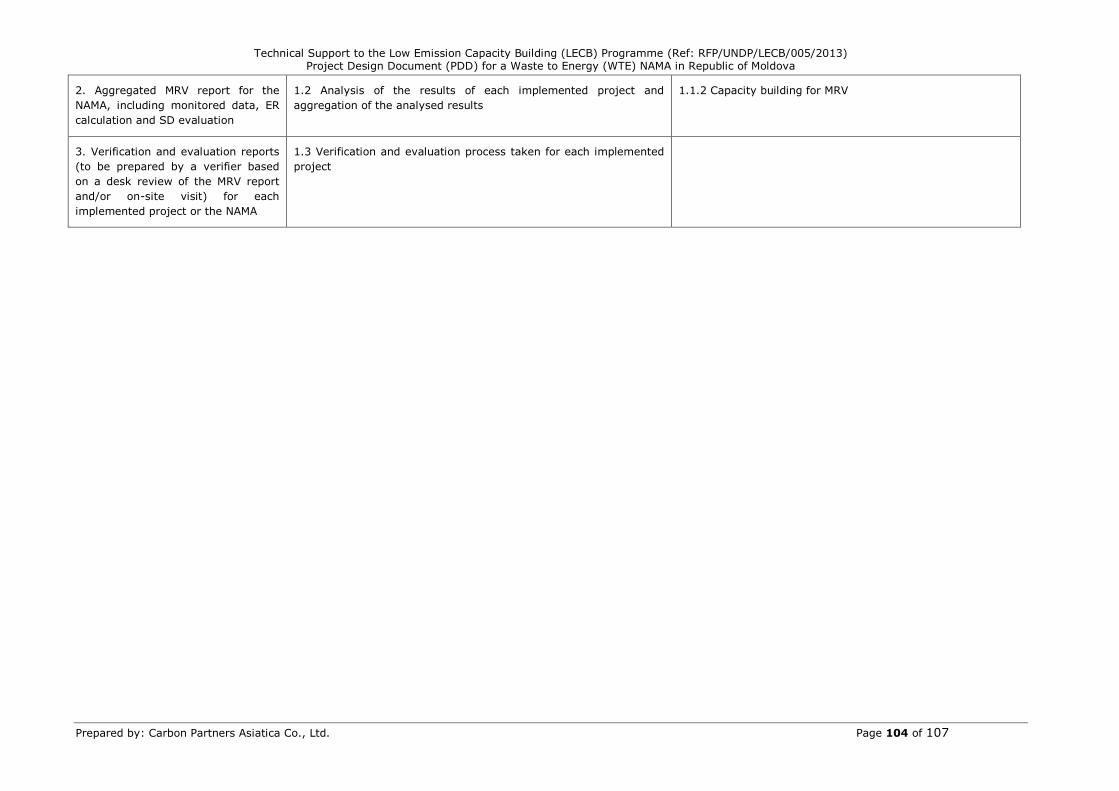
Technical Support to the Low Emission Capacity Building (LECB) Programme (Ref: RFP/UNDP/LECB/005/2013) Project Design Document (PDD) for a Waste to Energy (WTE) NAMA in Republic of Moldova
Prepared by: Carbon Partners Asiatica Co., Ltd. Page 104 of 107
2. Aggregated MRV report for the
NAMA, including monitored data, ER
calculation and SD evaluation
1.2 Analysis of the results of each implemented project and
aggregation of the analysed results
1.1.2 Capacity building for MRV
3. Verification and evaluation reports
(to be prepared by a verifier based
on a desk review of the MRV report
and/or on-site visit) for each
implemented project or the NAMA
1.3 Verification and evaluation process taken for each implemented
project
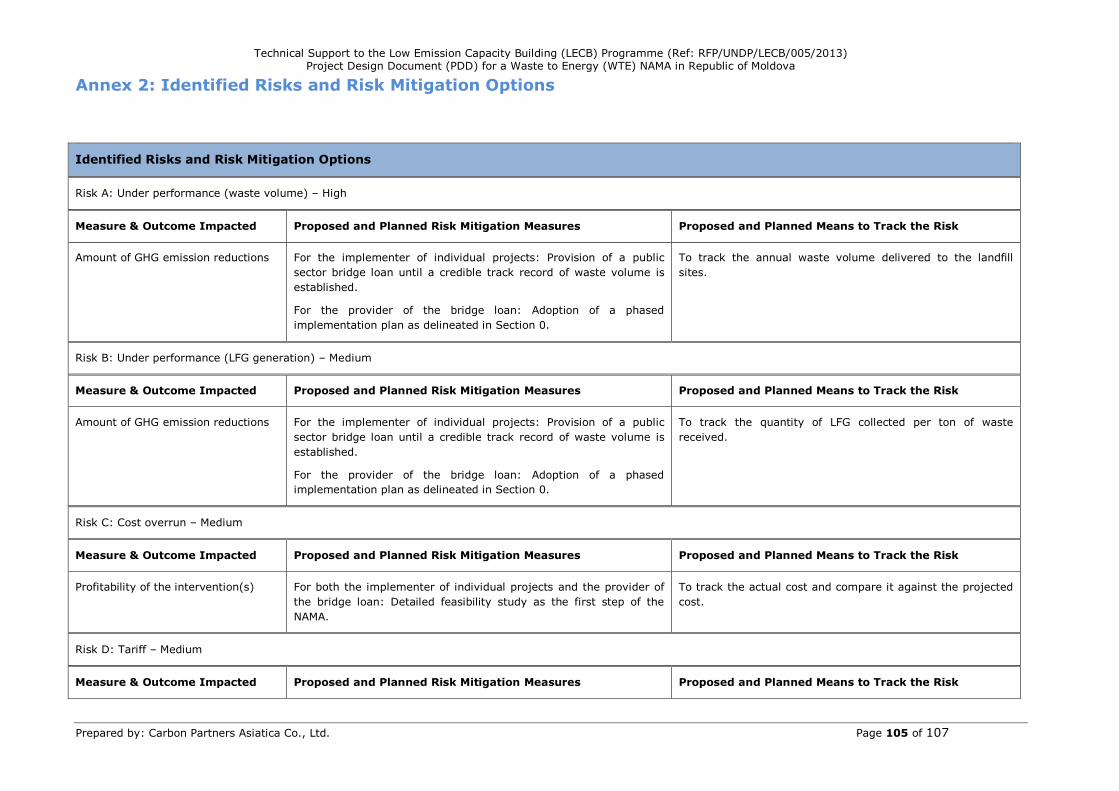
Technical Support to the Low Emission Capacity Building (LECB) Programme (Ref: RFP/UNDP/LECB/005/2013) Project Design Document (PDD) for a Waste to Energy (WTE) NAMA in Republic of Moldova
Prepared by: Carbon Partners Asiatica Co., Ltd. Page 105 of 107
Annex 2: Identified Risks and Risk Mitigation Options
Identified Risks and Risk Mitigation Options
Risk A: Under performance (waste volume) – High
Measure & Outcome Impacted Proposed and Planned Risk Mitigation Measures Proposed and Planned Means to Track the Risk
Amount of GHG emission reductions For the implementer of individual projects: Provision of a public
sector bridge loan until a credible track record of waste volume is
established.
For the provider of the bridge loan: Adoption of a phased
implementation plan as delineated in Section 0.
To track the annual waste volume delivered to the landfill
sites.
Risk B: Under performance (LFG generation) – Medium
Measure & Outcome Impacted Proposed and Planned Risk Mitigation Measures Proposed and Planned Means to Track the Risk
Amount of GHG emission reductions For the implementer of individual projects: Provision of a public
sector bridge loan until a credible track record of waste volume is
established.
For the provider of the bridge loan: Adoption of a phased
implementation plan as delineated in Section 0.
To track the quantity of LFG collected per ton of waste
received.
Risk C: Cost overrun – Medium
Measure & Outcome Impacted Proposed and Planned Risk Mitigation Measures Proposed and Planned Means to Track the Risk
Profitability of the intervention(s) For both the implementer of individual projects and the provider of
the bridge loan: Detailed feasibility study as the first step of the
NAMA.
To track the actual cost and compare it against the projected
cost.
Risk D: Tariff – Medium
Measure & Outcome Impacted Proposed and Planned Risk Mitigation Measures Proposed and Planned Means to Track the Risk
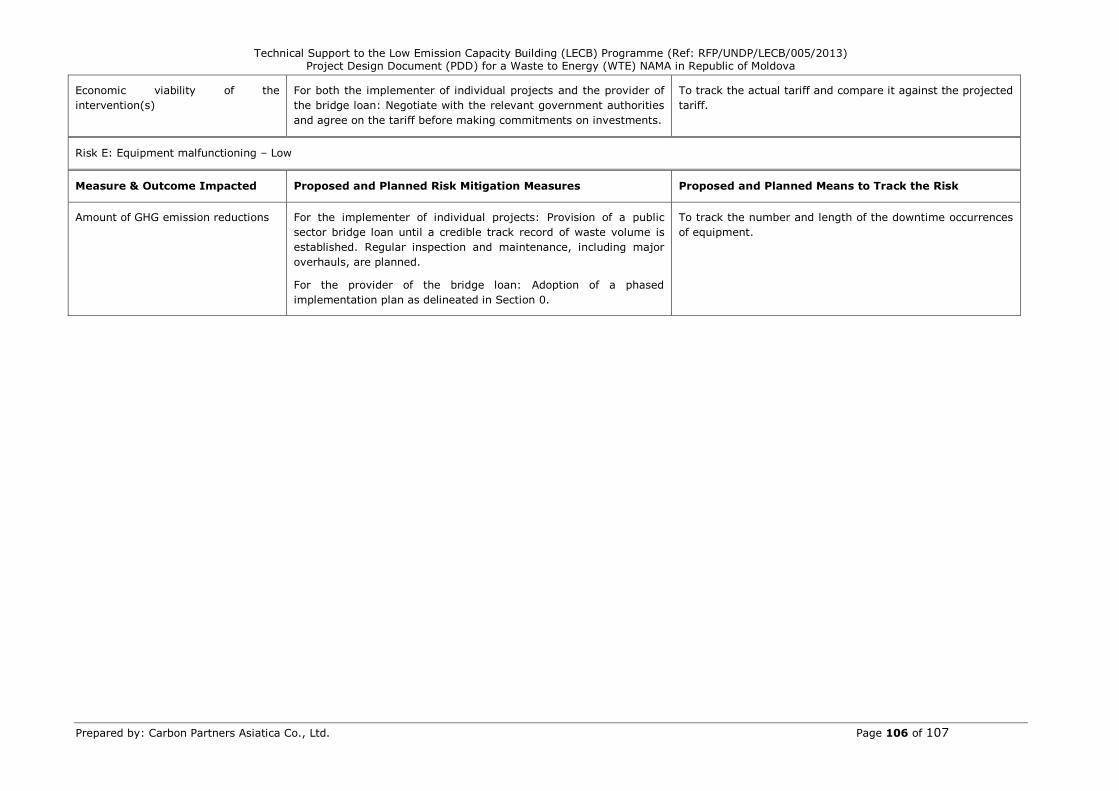
Technical Support to the Low Emission Capacity Building (LECB) Programme (Ref: RFP/UNDP/LECB/005/2013) Project Design Document (PDD) for a Waste to Energy (WTE) NAMA in Republic of Moldova
Prepared by: Carbon Partners Asiatica Co., Ltd. Page 106 of 107
Economic viability of the
intervention(s)
For both the implementer of individual projects and the provider of
the bridge loan: Negotiate with the relevant government authorities
and agree on the tariff before making commitments on investments.
To track the actual tariff and compare it against the projected
tariff.
Risk E: Equipment malfunctioning – Low
Measure & Outcome Impacted Proposed and Planned Risk Mitigation Measures Proposed and Planned Means to Track the Risk
Amount of GHG emission reductions For the implementer of individual projects: Provision of a public
sector bridge loan until a credible track record of waste volume is
established. Regular inspection and maintenance, including major
overhauls, are planned.
For the provider of the bridge loan: Adoption of a phased
implementation plan as delineated in Section 0.
To track the number and length of the downtime occurrences
of equipment.
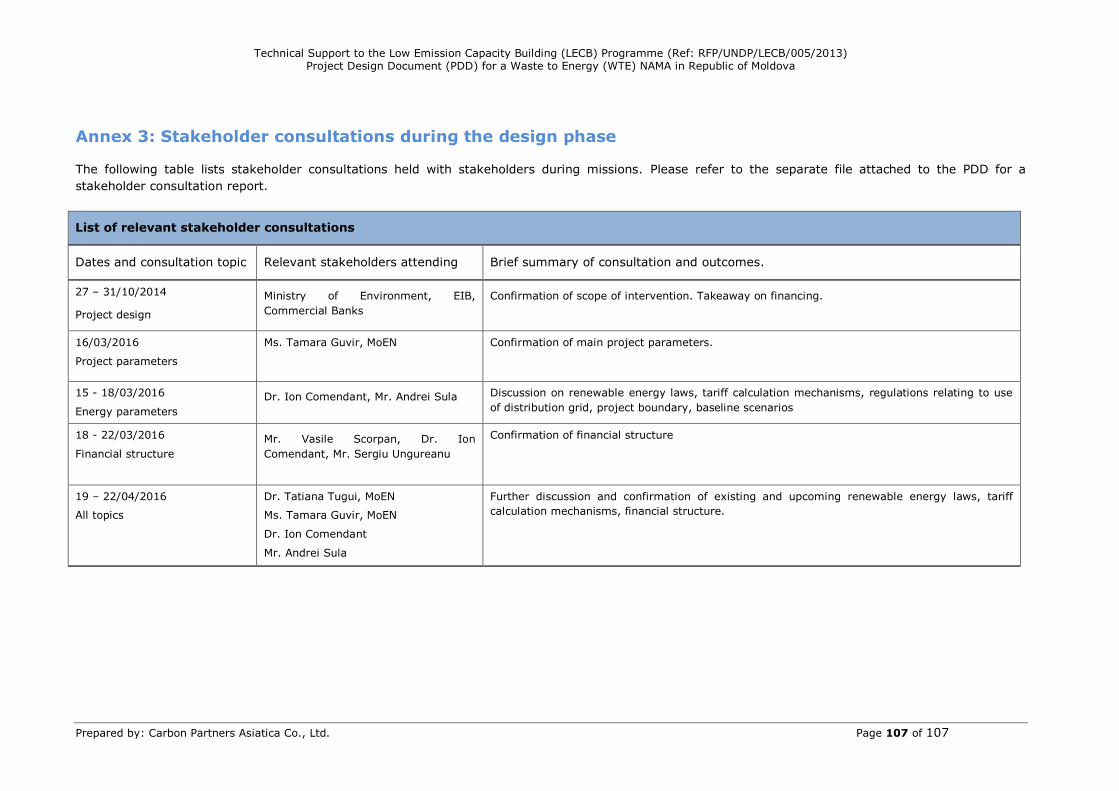
Technical Support to the Low Emission Capacity Building (LECB) Programme (Ref: RFP/UNDP/LECB/005/2013) Project Design Document (PDD) for a Waste to Energy (WTE) NAMA in Republic of Moldova
Prepared by: Carbon Partners Asiatica Co., Ltd. Page 107 of 107
Annex 3: Stakeholder consultations during the design phase
The following table lists stakeholder consultations held with stakeholders during missions. Please refer to the separate file attached to the PDD for a
stakeholder consultation report.
List of relevant stakeholder consultations
Dates and consultation topic Relevant stakeholders attending Brief summary of consultation and outcomes.
27 – 31/10/2014
Project design
Ministry of Environment, EIB,
Commercial Banks
Confirmation of scope of intervention. Takeaway on financing.
16/03/2016
Project parameters
Ms. Tamara Guvir, MoEN
Confirmation of main project parameters.
15 - 18/03/2016
Energy parameters
Dr. Ion Comendant, Mr. Andrei Sula Discussion on renewable energy laws, tariff calculation mechanisms, regulations relating to use
of distribution grid, project boundary, baseline scenarios
18 - 22/03/2016
Financial structure
Mr. Vasile Scorpan, Dr. Ion
Comendant, Mr. Sergiu Ungureanu
Confirmation of financial structure
19 – 22/04/2016
All topics
Dr. Tatiana Tugui, MoEN
Ms. Tamara Guvir, MoEN
Dr. Ion Comendant
Mr. Andrei Sula
Further discussion and confirmation of existing and upcoming renewable energy laws, tariff
calculation mechanisms, financial structure.