Embed Size (px)
Citation preview

www.efcnetwork.org
Project Economics and Financing for Energy
Management Projects
This program is made possible under a
cooperative agreement with EPA.

www.efcnetwork.org
A. Just call me Alan Greenspan!
B. I know my costs from my benefits.
C. I’m glad my life doesn’t depend on it.
D. What the heck is an NPV?
E. It’s “payback” time for you asking me this!
My level of familiarity with project
economics is:

www.efcnetwork.org
Project Economics: Comparing Costs &
Benefits

www.efcnetwork.org
Savings vs. Avoided Costs
Source: Energy Information Administration, 2009, Annual Energy Outlook, cited in ACEEE’s report on NC’s energy future: http://www.energync.net/Portals/14/Documents/EnergyPolicyCouncil/ACEEE_03182010_final_report_text.pdf

www.efcnetwork.org
Simple payback = Total cost of project ($)
(years) Annual savings ($/year)
Simple Payback Period: Definition
Source: NYSERDA, “Water & Wastewater Energy Management: Best Practices Handbook,” 2010.
www.efcnetwork.org
• Project A: Replace inefficient pump motors
• Cost: $200,000
• Savings: $100,000 per year in energy costs
• Life span: 5 years
• What is the simple payback?
Simple Payback Period: Example
Source: NYSERDA, “Water & Wastewater Energy Management: Best Practices Handbook,” 2010.
Simple payback = Total cost of project ($) =
(years) Annual savings ($/year)
2 years

www.efcnetwork.org
A type of cost benefit analysis
LCC ($) = Initial cost of project
+ Cost to operate
+ Cost to maintain
– Savings over the life of the project
Life-Cycle Cost Analysis: Definition
Source: NYSERDA, “Water & Wastewater Energy Management: Best Practices Handbook,” 2010.

www.efcnetwork.org
• Town of Derby, 10 min SE of Wichita, KS, population 23,600
• Project: Installation of VFDs on process mixers at WWTP
Life-Cycle Cost Analysis: Example
Simple payback = Total cost of project ($) =
(years) Annual savings ($/year)
3.64
years
Source: “The Quest for Energy Savings! City of Derby, KS. By Eddie Sheppard, Assistant Director of Public Works, Dec. 2012.

www.efcnetwork.org
• Assume 15 year lifespan of VFDs and DO meters
Life-Cycle Cost Analysis: Example
-$203,050
Source: “The Quest for Energy Savings! City of Derby, KS. By Eddie Sheppard, Assistant Director of Public Works, Dec. 2012.
LCC ($) = Cost of project =
– Savings over life of project

www.efcnetwork.org
Time Value of Money: Definition
The time value of money (TVM) is the idea that
money available at the present time is worth more
than the same amount in the future due to its
potential earning capacity.

www.efcnetwork.org
• Takes project cash flow in each year and “translates” it into what it’s worth today. Then adds all of that, crunching everything into one dollar value for the whole project.
Net Present Value: Definition
Where i = discount rate, N = total number of periods, t = the time of any given cash flow, and Rt = the net cash flow at time t.
• Useful for project prioritization using decision rules such as:– Do any project with positive NPV
– Choose the project with the greatest positive NPV

www.efcnetwork.org
• Project A: Business as usual (BAU)
• Project B: Put VFDs on 2 WTP pumps
• For project B, assume the initial investment in the pumps is made in “year 0”, and the project operates for 2 years (years 1 and 2).
• In either case, we sell the WTP in year 3.
• Which project should we do?
• We can use NPV to decide. Remember, NPV “translates” project cash flow in each year into what it’s worth today, and then adds all of those values.
Net Present Value (NPV): Example

www.efcnetwork.org
Project A: NPV Equals $6,587PROJECT A - BUSINESS-AS-USUAL - NET PRESENT VALUE ANALYSIS
0.05 Discount Rate (i.e. the interest rate or CoC)
YEAR 0 1 2 3
CASH IN
Flows
Water System Revenue 200,000 200,000
Stocks
WTP Liquidation Value of Initial Investment 950,000
WTP Liquidation Value of Capital Improvements 0
CASH IN SUB-TOTALS 0 200,000 200,000 950,000
CASH OUT
Flows
Water System Expenses 100,000 100,000
Stocks
WTP Initial Investment (i.e. plant value) 1,000,000
WTP Capital Improvements Investment 0
CASH OUT SUB-TOTALS 1,000,000 100,000 100,000 0
NET CASH FLOWS (1,000,000) 100,000 100,000 950,000
PRESENT VALUES OF NET CASH FLOWS (1,000,000) 95,238 90,703 820,646
NPV OF PROJECT $6,587

www.efcnetwork.org
Project B: NPV Equals $9,368PROJECT B - INSTALL VFD UNITS ON TWO PUMPS - NET PRESENT VALUE ANALYSIS
0.05 Discount Rate (i.e. the interest rate or CoC)
YEAR 0 1 2 3
CASH IN
Flows
Water System Revenue 200,000 200,000
Stocks
WTP Liquidation Value of Initial Investment 950,000
WTP Liquidation Value of Capital Improvements 40,000
CASH IN SUB-TOTALS 0 200,000 200,000 990,000
CASH OUT
Flows
Water System Expenses 82,130 82,130
Stocks
WTP Initial Investment (i.e. plant value) 1,000,000
WTP Capital Improvements Investment 65,000
CASH OUT SUB-TOTALS 1,065,000 82,130 82,130 0
NET CASH FLOWS (1,065,000) 117,870 117,870 990,000
PRESENT VALUES OF NET CASH FLOWS (1,065,000) 112,257 106,912 855,199
NPV OF PROJECT $9,368

www.efcnetwork.org
• NYSERDA’s Payback Analysis Toolhttp://www.nyserda.ny.gov/Energy-Efficiency-and-Renewable-Programs/Commercial-and-Industrial/Sectors/Municipal-Water-and-Wastewater-Facilities/MWWT-Tools-and-Materials.aspx
• Department of Energy’s MotorMaster+http://www1.eere.energy.gov/manufacturing/tech_assistance/software_motormaster.html
• Department of Energy’s Life Cycle Cost Analysis for Sustainable Buildingshttp://www1.eere.energy.gov/femp/program/lifecycle.html
Some Resources
www.efcnetwork.org
Financing Energy Projects

www.efcnetwork.org
How Do We Pay For Our Great Ideas?

www.efcnetwork.org
Whiteboard Video: Financial Benchmarking
https://www.youtube.com/user/efcunc

www.efcnetwork.org
Whiteboard Video: Financial Benchmarking
Terms to keep an eye out for:
• Operating ratio
• Expenses vs. expenditures
• Quick / current ratio
• Days cash on hand
• Infrastructure condition

www.efcnetwork.org
Operating Ratio
A measure of self sufficiency.
Natural Benchmark: > 1.0

www.efcnetwork.org
• Operating Expenses include asset
depreciation
• Operating Expenditures do not
include asset depreciation
Expenses vs. Expenditures

www.efcnetwork.org
Quick or Current Ratio
A measure of short-term liquidity: ability to pay your current bills
Accepted Benchmark: > 2

www.efcnetwork.org
Days Cash on Hand
A measure of ability to weather a significant temporary reduction in revenue
Benchmark: At the very least, enough to last a billing cycle (or until you expect a substantial inflow of cash)

www.efcnetwork.org
Debt Service Coverage Ratio
A measure of the ability to pay debt service with revenue left over after operating expenditures
Natural Benchmark: > 1

www.efcnetwork.org
Infrastructure Condition**Caveat – This indicator is only as good as your depreciation schedule and even then historic pricing is likely to distort the results.
Benchmark: Don’t get close to 100%
= Total Accumulated DepreciationTotal Assets Being Depreciated
A measure of how much of your total assets have already depreciated. As you approach 100%, your system is near the end of its expected life.
www.efcnetwork.org
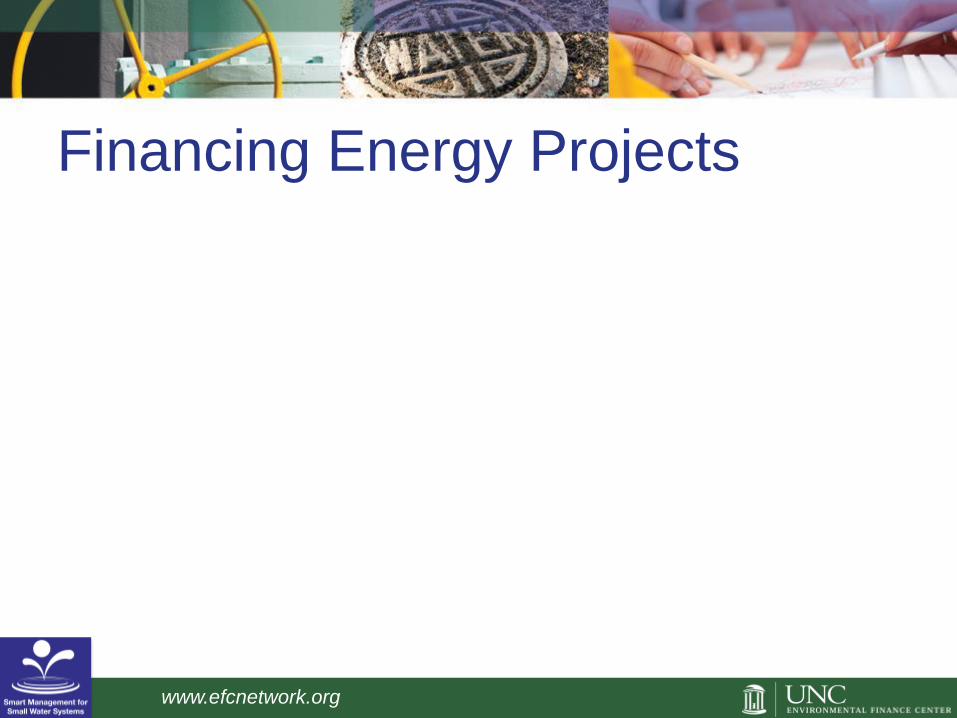
Quick Recap:
• Operating Ratio
• Quick Ratio
• Days Cash on Hand
• Debt Service Coverage Ratio

www.efcnetwork.org
Debt Service Coverage Ratio
Asset Depreciation
OperatingRatio
Quick Ratio
Days Cash on Hand
Can You Afford Capital Improvements?
• Is your utility (public enterprise) self sufficient?
• Can your utility meet its short term obligations?
• If your customers stop paying their bills, how long can you maintain operations?
• Are you able to cover your debt service after paying for your day to day operations?
• How much of your utility’s expected life has already run out (and how much is left)?

www.efcnetwork.org
Can You Afford Capital Improvements?
• Is your utility (public enterprise) self sufficient?
• Can your utility meet its short term obligations?
• If your customers stop paying their bills, how long can you maintain operations?
• Are you able to cover your debt service after paying for your day to day operations?
• How much of your utility’s expected life has already run out (and how much is left)?
OperatingRatio
Quick Ratio
Days Cash on Hand
Debt Service Coverage Ratio
Asset Depreciation

www.efcnetwork.org
Calculating affordability…
Average Annual Household Water Bill
Median Household Income
In other words, “the household that is half-way in the spectrum of all households in terms of
income is spending X% of their annual income on water and wastewater”
Can your customers afford capital
improvements?
=

www.efcnetwork.org
Where Capital Funding Comes From

www.efcnetwork.org
• An energy upgrade to water or
wastewater facility is really just a
capital improvement
• You can treat energy upgrades just like
any other capital improvement
Energy Improvements and
Capital Planning

www.efcnetwork.org
• Cash
• Grants (including State Revolving Funds)
• Debt market (including State Revolving Funds)
• Private partnerships
• Rates / Monthly bills
• System development charges (new customers)
• Special assessments (current customers)
• Transfers from the general fund (tax revenue)
Where Capital Funding Comes From

www.efcnetwork.org
• Save in advance and pay (fund balance)
• Pay as you go (current receipts)
• Pay later (someone loans you money)
• Let someone else pay (grants)
Ways to Pay

www.efcnetwork.org
How does your organization
pay for capital improvements?

www.efcnetwork.org
• Two types—Loans and Bonds
– Loans are universally available (from
banks, etc.)
– Bonds are typically only available to large
systems with significant revenues and
managerial capacity
The Debt Market – Pay Later

www.efcnetwork.org
But, grants aren’t completely free money:
• Application can be expensive – staff time and
money
• Applications can take months to process
• Often lots of strings attached
• Often require a percentage match
• Lots of competition
• Difficult to sustain
Grants – Let Someone Else Pay

www.efcnetwork.org
Catalog of Federal Funding
• Grants
• Local government
• Wastewater
• Get results in table format
http://water.epa.gov/grants_funding/
Catalog of Federal Funding
Sources for Watershed Protection
http://cfpub.epa.gov/fedfund
Find and Choose Grants

www.efcnetwork.org
Another way to find EPA Grants
http://water.epa.gov/type/drink/pws/smallsystems/financialhelp.cfm
Find and Choose Grants

www.efcnetwork.org
Find and Choose Grants
Grants.gov

www.efcnetwork.org
dsireusa.org
Find and Choose Grants

www.efcnetwork.org
• Trusts and charitable foundations offer some
grants - but local governments usually not
main target
• Can partner with a non-profit or community-
based group
• Helpful to highlight cultural significance of
your community if looking at environmental
justice grants
Grants from Non-Profits or the
Private Sector
41

www.efcnetwork.org
• Read RFP thoroughly
• Look over any sample grant applications
• Follow suggested outline
• Include maps and photos as appropriate
• Include letters of support from partner agencies
• Be specific with your work plan and timeline
• Cite measurable goals
• Focus on the results specific to this funding source
• Focus on your community’s unique needs and assets
• If applying as a group, choose as the lead the agency
with the most work or best relationship with the funder
• Apply on time
Grant Writing Tips

www.efcnetwork.org
• Ask the funder any questions you have
during the application process
– Know that your questions may be
published for other applicants to see
• If you are not funded, ask the funders
why
Grant Writing Tips

www.efcnetwork.org
• The SRF might award an “extra point” for a “green project”
when scoring applications to the program.
• Sometimes referred to as a “Green Project Reserve.”
Credit for proposing green projects to the
Drinking Water State Revolving Fund

www.efcnetwork.org
The SRF Program: How It Works

www.efcnetwork.org
• Under the Safe Drinking Water Act, states operate Drinking Water State Revolving Funds (DWSRF)
• There is also a similar fund for wastewater, the Clean Water State Revolving Fund (CWSRF)
• In general, DWSRF and CWSRF funds may address:
– Water and Sewer capital needs
– Stormwater, green stormwater infrastructure
– Source water protection
– Land conservation
– Failing decentralized wastewater systems
DWSRF Program: Background
www.efcnetwork.org
The SRF’s in North Carolina
• Drinking Water State Revolving Fund
(DWSRF)
• Clean Water State Revolving Fund
(CWSRF)
• See our NC Water and Wastewater
Funding Matrix for more details.

www.efcnetwork.org
• Have any of you already applied for a loan or
grant under one of the SRF programs?
• If so, was your project funded as part of the
Intended Use Program (IUP)?
• If so, what was that process like for you?
• If not, are you interested in applying for such
a loan or grant?
Discussion

www.efcnetwork.org
• http://www.efc.sog.unc.edu/reslib/item/s
ubsidized-funding-benefits-calculator
• Helps demonstrate the financial value
to your system of low-interest or zero-
interest loans, versus market rates.
UNC Environmental Finance Center:
Subsidized Funding Benefit Calculator

www.efcnetwork.org
1/19/2017

www.efcnetwork.org
• Will pass this out at the end of the day.
North Carolina Water and
Wastewater Funding Matrix

www.efcnetwork.org
Questions?