Embed Size (px)
Citation preview

Rajagiri College of Management and Applied Sciences
PART I ORGANIZATIONAL
STUDY
1

Rajagiri College of Management and Applied Sciences
INDUSTRY PROFILE
1.1 CHEMICAL INDUSTRY IN GENERAL
The chemical industry comprises of the companies that produce industrial chemical.
Chemical are used to make a wide variety of consumer goods, as well as thousands of
input to agriculture, manufacturing, constructions and service industry. The chemical
industry itself consumes 26% of its own output. Major industrial customers include
rubber and plastic product, textile, apparel, petroleum refining, pulp & paper and primary
metals.
Specialty chemicals are a category of relatively high value, rapidly growing chemicals
with diverse and product markets. They include electronic chemicals, industrial gases,
adhesives and sealant as well as coating industrial and institutional cleaning chemical
and catalysts. Chemicals in bulk petrochemicals and inter-chemicals are primarily made
from liquefied petroleum gas (LPG), natural gas and crude oil. Typical large volume
products include ethylene, propylene, benzene, toluene, xylem, methanol, vinyl chloride
monorher (VCM), styrene, and. Butadiene and ethylene oxide.
Other derivatives and basic industrial include synesthetic rubber, surfactants dyes and
pigments, turpentine, resins, carbon black, explosives, and rubber products contribute
about 20% of the basis chemical external sales. Inorganic chemicals (about12% of the
revenue output), include salt, chlorine, caustic soda, soda ash, acid (such as nitric,
phosphoric and sulphuric) titanium dioxide and hydrogen peroxide fertilizers (about 6%
of the revenue output) include phosphates, ammonia and potash chemicals. Consumer
products include direct product sale of chemical such as soaps, detergents and cosmetics.
2

Rajagiri College of Management and Applied Sciences
Chemical industry is highly heterogeneous with following major sector;
Petrochemicals
Inorganic chemicals
Organic chemicals
Fine of specialties
Bulk drugs
Agrochemicals
Paints & drugs
1.2 INDIAN CHEMICAL INDUSTRY
The Indian chemical industry is a significant components of the Indian economy with
revenue at about USD28 billion. Indian chemical industry contributes about 6.7% of
Indian GDP and 10% of total exports. The industry contributes around 20% as national
revenue by way of various taxes and levies. Volume of production by Indian chemical
industry position as the 3rd largest producer in Asia (next to China and Japan). The
chemical industry accounts for about 13% share in the manufacturing output. The
industry is a vital part of the agricultural and industrial development in India and has key
linkages with several other downstream industries such as automotive, consumer
durable, engineering and food processing etc. with the current level of performance the
Indian chemical industry ranks 12th in world production of chemicals. The chemicals
industry has achieved a growth rate of 8.6% over the last few years making it one of the
faster growing sectors in India. This industry’s growth rate has been twice the Asian
growth rate over the last five years. But the asset creation has been the lowest. The
Indian chemical industry is faced with multiple challenges. It is emerging from a
protected environment into a highly competitive global market. At the same time the
domestic market shows a path to path to maturity with a high demand potential for
chemical and products. In terms of consumption, Indian chemical industry itself is its
large consumers; as the basic chemicals undergo several processing to manufactures
downstream chemicals.
3

Rajagiri College of Management and Applied Sciences
The industry accounts for approximately one –third of the total consumption. Gujarat is
the major contributor to the basic chemical as well as petrochemical production with
54% and 54% share, in all production, respectively. Other major states producing basic
chemicals include Maharashtra (9%), Tamilnadu and Uttar Pradesh (6%) each. Other
major states producing petro chemicals include Maharashtra (18%), West Bengal (12%),
Uttar Pradesh (14%) and Tamilnadu (13%). India is also an importer of chemical
products. India’s chemical imports are either for the purpose of further processing in the
chemical industry or for wage as inter mediates in other manufacturing sector. India has
been sourcing its imports mainly from china (20% of the India’s total chemical imports)
followed by USA (8%), Saudi Arabia (6%), Singapore, Morocco and Germany (5%)
each. The government has been announced a number of measures to improve the
competitiveness of the Indian chemical industry. These include abolition of industrial
licensing to most the chemical sub-sector, expecting a small list of hazardous chemicals.
The government is also continuously reducing the list of reserved chemicals items for
production in the small scale sector, there by facilitating grates investment in technology
up gradation and modernization.
The government has initiated policies for setting up of integrated Petroleum, Chemicals
and Petrochemicals Investment Regions (PCPIR). Such an initiative is likely to attract
major investment, both domestic and foreign, into the regions, which would have
enabling infrastructure that would provide conducive and competitive environment for
setting up ofmanufacturing units. PCPIR would reap the benefits of co-sitting,
networking and greater efficiency through use of common infrastructure and support
service. Such an industrial complex would boost manufacturing activities, augment
exports and generate employment. Government is a signatory to chemical weapons
convention, which is a universal non-discriminatory, multilateral disarmament treaty that
bans the development, production, acquisition, transfer, use and stockpile of all chemical
weapons. India has passed the chemical weapons convention Act.2000, which has come
into force in 2005.
4

Rajagiri College of Management and Applied Sciences
Indian Chemical Council (ICC- also known as Indian Chemical Manufacturers
Association) is the nodal point/signatory representing India under the responsible care
initiative. ICC has prepared codes, guidance notes for implementation of process safety,
employee health and safety, pollution prevention, emergency response and product
safety. ICC is continuously interacting with regulatory bodies on various issues like
emergency preparedness and safe transportation of hazardous chemical. India chemical
firm to keep abreast of the technological development in global chemical industry and to
explore possibilities of adapting the technology to meet the specific requirement of the
Indian market, such a strategy helped the firm to have continuous up gradation in
technology, resulting in a wide and superior product portfolio. Strategies have also been
adopted by Indian chemical firm to cut down cost of production through leveraged buy-
out for sourcing cost efficient raw materials and solution for energy efficiency.
Some Indian chemical firms are engaged in continuous research and development
activities to innovate new application to increase and user segments. Consolidation
through buy-outs of brands and business as another strategy adopted by Indian chemical
firm, Indian chemical firms are leveraging their manufacturing expertise and enter into
contract manufacturing with multinational firm. These include custom manufacturing
and private labelling.
1.3 CHALLENGES AND STRATEGIES
CHALLENGES
Indian chemical sector has grown a long way since its early days of independence. The
sector has grown from a small-scale to multi-dimensional sector, which is taking on the
challenges of globalization. There are few factors, which hinders the growth of the
industry. These include;
High price of basic feed stock
Low Level of ICT interface
Low Level of Brand Development
5

Rajagiri College of Management and Applied Sciences
Low Level of Common Infrastructure
Environmental Regulations
Dumping / Import competition
STRATEGIES
Focus on Core Competence
Strengthening technological competence
Improving basic Management Capabilities
Adhering to Environmental Norms
Focus on Research & Development
Collaboration
Consolidation
Industry –Academia Linkages
Marketing and Promotion
Setting up of Chemical Parks or Mega Chemical Estates
De-reservation of Select Chemical Production
Creation of Modernization fund
Increasing Consumption Level of Chemicals
1.4MAJOR CHEMICAL GROUP AND SUB-SEGMENTS PRODUCED IN INDIA
Table: 1.1
6

Rajagiri College of Management and Applied Sciences
Alkali Such as Soda ash, Caustic soda, and Liquid Chlorine.
Inorganic
chemicals
Such as Aluminium fluoride, Calcium carbide, Carbon black,
Potassium chlorate, Titanium dioxide and Red phosphorus.
Organic
chemicals
Such as Acetic acid, Acetic anhydride, Acetone, Phenol,
Methanol, Formaldehyde, Nitrobenzene, Citric acid, Malefic
Anhydride, Penta Erithritiol, Aniline, Chloro methane, ONCB,
PNCB, MEK, Acetaldehyde, Ethanol amines, Ethyl acetate
and Ortho nitro toluene.
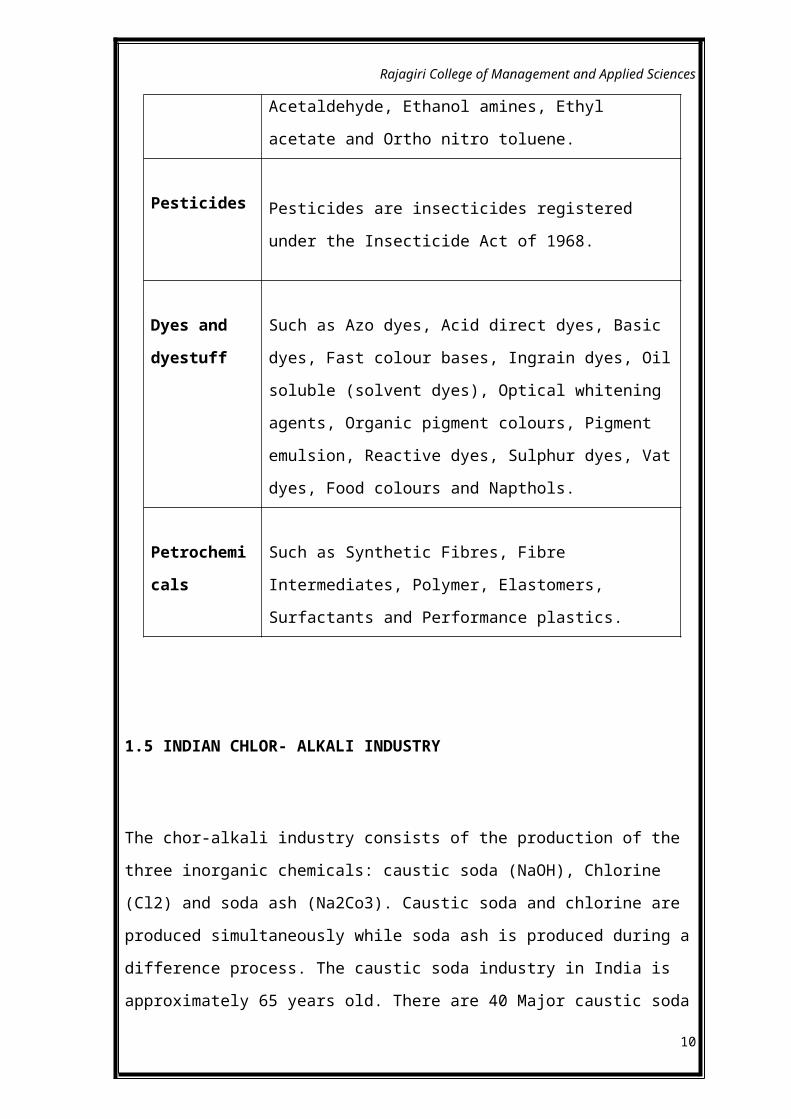
Pesticides Pesticides are insecticides registered under the Insecticide Act
of 1968.
Dyes and
dyestuff
Such as Azo dyes, Acid direct dyes, Basic dyes, Fast colour
bases, Ingrain dyes, Oil soluble (solvent dyes), Optical
whitening agents, Organic pigment colours, Pigment emulsion,
Reactive dyes, Sulphur dyes, Vat dyes, Food colours and
Napthols.
Petrochemical
s
Such as Synthetic Fibres, Fibre Intermediates, Polymer,
Elastomers, Surfactants and Performance plastics.
1.5 INDIAN CHLOR- ALKALI INDUSTRY
7

Rajagiri College of Management and Applied Sciences
The chor-alkali industry consists of the production of the three inorganic chemicals:
caustic soda (NaOH), Chlorine (Cl2) and soda ash (Na2Co3). Caustic soda and chlorine
are produced simultaneously while soda ash is produced during a difference process. The
caustic soda industry in India is approximately 65 years old. There are 40 Major caustic
soda plant with an average plant size of 150 tons per day (TPD), which is relatively small
compared to sizes found in developed countries (500TPD). The production of caustic
soda is associated with chlorine. This inevitable co-Production has been an issue for the
Chlor-alkali industry. Both Products are used for very different end users with differing
market dynamics and it is only by rare chance that demand for the two coincides. The
Indian Chlor-alkali industry is driven by the demand for caustic soda, and chlorine is
considered a by-product.
Energy Consumption
The raw materials necessary in the production of caustic soda consisting of salt and
water is abundant and inexpensive. Conversely, the electrical energy required to process
salt into caustic soda and chlorine is expensive and occasionally unreliable. Energy costs
represent 50 to 60% of the total cost of production. During the last 10 years, production
has shifted to membrane cell technology. This shift, Combined with technology
improvements in mercury and membrane cell processes and energy conservation has
resulted in an estimated overall energy savings of more than 10%.
Future Development and On-going Changes in the Caustic Soda and Chlorine
Industry
8

Rajagiri College of Management and Applied Sciences
The Indian domestic market is driven by the demand for caustic soda rather than the
demand for chlorine. Because of the inevitable co- production of both products,
European and North American markets are characterizes by caustic soda surplus. As
Indian needs and imports this product it is argued that excess production from abroad is
dumped in India. In contrast, chlorine a very hazardous product which is very dangerous
to transport, meaning that export of chlorine from India to the rest of the world is
difficult. The mercury cell technology, besides consuming excessive power also causes
mercury pollution. Some mercury is lost from the process to air and water and shows up
in products and wastes.
Potential for Energy Efficiency Improvement
The type of process used in the production of caustic soda has a significant impact on the
quantity of energy used. In that regard, India performs favourably compared to most of
the industrialized countries. The geographic distribution of caustic soda processes differs
noticeably worldwide. In Western Europe, the mercury cell process represents 22% and
membrane cell process only 20%. In the US, diaphragm cell process predominates with
75%, and in Japan, it is the membrane cell process that covered 90% of installed
capacity.
Categories of Energy efficiency Improvement
9
Rajagiri College of Management and Applied Sciences
Energy is used both as electricity and as head. About half of the energy expended is
converted into the enthalpy of the products. The rest is converted into heat transferred to
the air in the building and the products, which have to be cooled Energy savings, are
possible by redistributing the excess heat where it is necessary. Insulation of the cells and
salt dissolvers reduce the need for ventilation of the cell room and increase the amount of
heat transferable.
Adoption of membrane technology:
Energy savings by adopting membrane cell plants compared to mercury are about
1.3 Gigajoule/tonne per ton of NaOH produced. Plus, the additional thermal energy
requirement for the membrane process is not constantly necessary, as concentration of
caustic soda is not always needed.
Installation of Advanced Cell Controls:
Advance instrumentation system such as short circuit elimination, anode control and
protection devices help to operate the cell at minimum gap, thereby reducing power
requirements. The range of power saving obtained by these means is above 75Kilowatt
hour. The cost of installation such control systems depends upon the intended version
(i.e. automatic, semiautomatic) and age of the plant. Realizing its importance as a
potential energy saver, a few plants in the country have installed such advanced
instrumentation system and many others are intending to adopt them.
Conversion From Rubber Lined To Bare Bottom Configuration:
10

Rajagiri College of Management and Applied Sciences
Even today, many of the plants are still equipped with rubber lined cells, and hence there
is scope for energy Savings through their conversion to bare bottom orientation which
will reduce millivolt drops and bus losses. This will reduce the cathodic mV drop to the
tune of 40%.
Revamping of Electrical System:
Rectifier equipment is an important element on which power consumption depends. An
old generation mercury-arc rectifier, if it exists, could be replaced with a newer
generation silicon rectifier, which offers much better ACDC conversion Efficiency.
Installation of correct capacity rectifiers is essential, as underutilization of its capacity
reduces transformer losses.
Effective Utilization of Hydrogen as Fuel:
Hydrogen gas is produced as a by-product of caustic soda; it can be captured and used as
a fuel in on-site power cogeneration. The heat can be used for the evaporation of caustic
soda and for the preparation of the brine. Moreover hydrogen is clean fuel. The use of
by-product hydrogen gas can be substitute up to 35% of the total fuel requirement in a
caustic fusion plant.
Adoption of Energy Efficient Chlorine Handing System:
11
Rajagiri College of Management and Applied Sciences
Considerable energy savings can be achieved by revamping chlorine compressors,
refrigeration systems and avoiding inefficient capacity control practices such as hot gas
bypass.
Other Alternatives:
Alternatives other than those discussed above for energy savings in the Chlor-alkali
industry are wide range, and other methods that can be used effectively are listed below;
Brine recycling up to 40% for retention of thermal energy.
Direct hot lye pumping to concentrator plant for heat saving.
Minimization of exposed surface area of clarifiers and lagging of the same for
surface loss reduction.
Modification in brine pumping system to reduce the pumping power.
Application of modern flat belts in place of conventional V-belt to reduce
transmission losses.
Application of energy savers in drives with varying duty and machine side
capacity controls.
Application of variables speed drives of energy efficient capacity control in
varying duty fans and pumps.
Effective insulation of pipelines carrying hot cell liquor at 85°C from the cells to
the evaporations to save about 0.3 tone of steam per ton of caustic soda.
Controlling the water addition in the filters to save steam.
Scenarios of Future Energy Use
12

Rajagiri College of Management and Applied Sciences
Future Trends in Energy Efficiency
A new technology called Oxygen Depolarized Cathodes (ODC) is currently developed
with substantial potential energy savings of around 440-530 kilowatt hour per ton of
caustic soda (1.5 to2 Gigajoule tonne final energy/t NaOH) (IPPC, 2000). Energy
savings of nearly 30% are expected.
Soda Ash Industry Characteristics
The Indian soda ash industry is highly concentrated with three players accounting for
nearly 80% of the total installed capacity. Plants are mostly located in Gujarat to take
advantages of the availability of inputs like salt, limestone, coke, water, chemical
compounds and power. Soda ash in India is not obtained as a naturally occurring
product. Soda ash is produced by a total of 6 units with an average size of 1000tonnes
per day. Out of the plants, three are based on the standard Solvay process, one unit uses
the modified Solvay process or dual process and the two other units use the Akzo dry
lime process. The dual process soda ash in co-production with ammonium chloride,
which is used as a fertilizer. The dry lime process uses dry lime instead of lime milk for
ammonia recovery. This last process is considered as the state of the art technology. In
India, around 40% of the soda ash produced is consumed by the detergents industry. 20%
by glass, 16% by sodium silicate, and the remainder and consumed by the chemical
industry.
Energy Consumption
13

Rajagiri College of Management and Applied Sciences
The energy needed for production of soda ash taken on different forms; electrical,
thermal and mechanical energy and feed stocks. Coke is used as a source of carbon
dioxide in the soda ash produced; “light soda ash” with a specific weight of about
500kg/m dense soda ash” of about 1000. kilogram / meter. Light soda is transformed by
crystallization after drying to produce dense soda mainly used in the glass industry.
The basic advantage of the use of dry lime instead milk lime is a better steam balance
and the reduction in the raw material inputs, resulting in energy savings. The
consumption of steam and lime is much lower as compared to other process.
On-going Changes in the Soda Ash Industry
Demand for soda ash is mainly affected by the demand from glass industry. Demand Has
Decreased due to the fall in demand for container glass. Bottles made of container glass
are being replaced with PET (polyethylene terephthalate) bottles; this has affected the
demand for soda ash and driven up the demand for chlorine.
One of the main specific problems of the soda ash industry in India is that most of the
units are located in the western region, which has the advantage of being in close
proximity to the raw material source but far from consumers. Since soda ash is a high
volume low cost commodity, costs of transportation are high. This leaves other markets
like the eastern and the northern regions vulnerable to imports. Further, being a high
power consuming product, Indian producers are always at a disadvantage compared to
their foreign counter parts.
Energy use in Manufacturing of Soda form Trona Ore
14

Rajagiri College of Management and Applied Sciences
Potentials for energy savings in the soda ash industry in India are about 17%. Even
through India possesses some of the best technology available, potential savings remain
large and would require revamping the oldest plants. Nirmal Ltd represents the best
technology available in India; its specific energy consumption comes close to the EU
best practice.
Categories of Energy Efficiency Improvement
Cogeneration:
The Solvay process requires a large amount of steam, a big part of which is used as low
pressure steam, injected directly into the process for the recovery of ammonia (steam
stripping). Energy savings can be realized by reducing steam pressure in a set of turbo-
generators while generating electricity. This electricity is produced with a “cogeneration”
of stem, with an excellent efficiency (about 90%) because all the steam leaving the
turbines is used in the process. In comparison, the same quantity of energy will be
generated, in a classical power station, with a much lower efficiency (about30%) because
of the lost released steam. Comparison of the primary energy needs of a co-generation
unit (based on gas) – for a soda ash plant – with that required for the separate production
of steam and electricity (by a classical power station for electricity and boilers for
steam).Shows that it is possible to achieve 30% savings with co-generation.
Heat recovery:
15

Rajagiri College of Management and Applied Sciences
The recovery of heat has been gradually improved throughout the history of the process
by optimizing energy fluxes of different thermal levels contained in a gas and liquids
flowing through the process. Low-grade heat is used to preheat different steam such as;
Raw brine entering the brine purification step to improve purification efficiency
Raw water used for milk of lime production
Boiler feed water
Month liquor from the filtration to the recovery of ammonia by the distillation off
gas.
Vacuum flashing of distillation liquor may be used for producing low pressure
steam available foe distillation and evaporation units like salt production.
Energy minimization: The following techniques may be considered;
Carful control of burning of limestone and a good choice of raw material allow a
reduction of the primary energy necessary for the operation
Improvement of process control by the installation of distributed control system
(DCS)-reduction of water content of crude bicarbonate by configuration before
calcinations to minimize energy need for its decomposition
Back-pressure evaporation (e.g. calcium chloride liquors)
Energy management of stand-by machinery
Equipment lagging, steam trap control and elimination of energy losses
Future trends in energy efficiency
Potential energy savings in the soda ash industry are large, estimated at about 17%. The
sector is very concentrated; only six companies produce soda ash in India, which makes
the scope of the possible plants retrofit more focalized. However, soda ash industry is
rarely perceived to be an energy intensive one, and hence inadequate attention is given to
its potential energy savings.
The Chlor-alkali sector is every energy intensive sector where energy represents
approximately 60% of total production cost. In a country like India, where the cost of
industrial electricity is high, industries using large quantity of electricity such as the
caustic soda industry have been focusing more attention on reducing energy
16

Rajagiri College of Management and Applied Sciences
consumption. Hence some caustic soda and soda ash production have energy saving
potential of around 17%. The main weakness in the sector seems to be its lake of
indigenous technology equipment production. For example, membrane cell equipment
which needs to be changed every three years must be imported. There is no indigenous
producer. The potential development of caustic soda production through new ODC
technology is gradually emerging in market. India needs to take part in this future
advancement.
COMPANY PROFILE
1.6 INTRODUCTION
17

Rajagiri College of Management and Applied Sciences
The Travancore Cochin Chemicals Ltd., popularly known as TCC ltd., is a state public
sector undertaking owned by the government of Kerala. TCC is situated at
Udyogamandal in Cochin industrial belt. Incorporated in 1951, TCC is one of the oldest
chlor-alkali units in the country. TCC is a large chemical industry engaged in the
manufacture and marketing of Caustic soda, chlorine, hydrochloric acid and related
chemicals. TCC is an ISO 9001-2000 certified company. The company supports a large
number of industrial units of strategic importance by supplying basic chemicals.
1.7 HISTORY
Seshasayee brothers established the Travancore Mettur Chemicals in 1951 (under Indian
Company Act 1956) in joint venture with Fertilizers and Chemicals Travancore Ltd
(FACT). Commercial production was started in 1954 with a capacity of 20 TPD Caustic
sodas. It has the distinction of manufacturing unique product named Rayon Grade
Caustic soda. When financial problems happened to the company the then Travancore
Cochin govt. provided financial aid and it was taken over by the govt. Thus got renamed
as Travancore Cochin Chemicals and subsequently after independence it was taken over
by the Govt. of Kerala and it became a public Ltd company. At present its production
capacity is 175 TPD caustic soda and it plans to expand its capacity to225TPD Caustic
soda. About 50 crores and needed for the expansion which will take 2_3 years to
complete. The company undertook expansions in 1961, 1964and 1975 using Mercury
cell technology. As mercury cell technology is creating problems the company went for
the latest technology which resulted in the shifting of the company’s technology from
mercury cell technology to membrane cell technology which is an environment friendly
technology. Membrane cell technology was commissioned in 1997 with technical help of
ASAHI Glass Co Ltd in Japan. The products of TCC are Caustic soda, Chlorine,
Hydrochloric acid and Sodium Hypo Chlorite. The raw materials used for the production
of these products are common salt, Electricity and water. About 60% of production cost
is spending by TCC for Electricity. When mercury cell technology was used there was a
requirement of 3700 unit’s electricity for producing 1 TPD caustic soda. But due to the
18

Rajagiri College of Management and Applied Sciences
introduction of membrance cell technology the consumption got reduced to 2600 units of
electricity for the production of 1 TPD caustic soda. Common salt is brought mainly
from the salt pans of Tuticorin in Tamilnadu. Water needed for the production is met
from the river Periyar. At present TCC’s strength are about 800 workers which
comprises of 700employees and 100 managerial staff. TCC is accredited with ISO
9001:2008 certification in 2006 and company is planning to go for ISO14000
certification. TCC is the only public Ltd company manufacturing Caustic soda in India.
TCC’s competitors are all private companies. TCC has decided to join hands with Indian
Space Researches Organization (ISRO). Sodium per chlorite is used as fuel in rockets.
Sodium Chlorite is the essential raw material for making Sodium per chlorite. TCC and
ISRO have signed the deal for the production and supply of Sodium chlorite.
1.8 INITIAL INVESTMENT FOR THE COMPANY
Table: 1.2
Investors Amount (in crores)
Govt. of Kerala 11.90
KSIDC 8.11
FACT 6.50
Mettur Chemicals Ltd 3.50
TOTAL 30.01
1.9PRESENT CAPITAL INFORMATION
Table: 13
19

Rajagiri College of Management and Applied Sciences
Investors % of shares
Govt. of Kerala 80
KSIDC 17
FACT 2
Mettur Chemicals Ltd 1
TOTAL 100
1.10 MISSIONSTATEMENT
Supply quantity and quality chemicals at competitive prices to customers.
Customer satisfaction and concern for environment & safety.
Utmost level of conservation of all resources.
Cost effectiveness in all operations.
Regular up gradation of technologies used in processing.
1.11 STAGE OF GROWTH
1956 - A continuous Caustic Fusion Plant 20 TPD for producing Caustic Soda
flakes.
1958 - Chlorine Liquefaction Plant
20
Rajagiri College of Management and Applied Sciences
1960 - Capacity enhanced to 30 TPD further to 40 TPD.
Established new plant for manufacture of Sodium Hydrosulphite
3 TPD capacities
1967 - 7 TPD Sodium Hydrosulphite
60 TPD Caustic Fusion Plant
4 TPD Iron free Sodium Sulphate
1975 Added another 100 TPD Caustic Soda Membrane Unit thereby increased
the production capacity 200 TPD own Water Treatment Plant.
(By 1988, many of the old unit were dismantled)
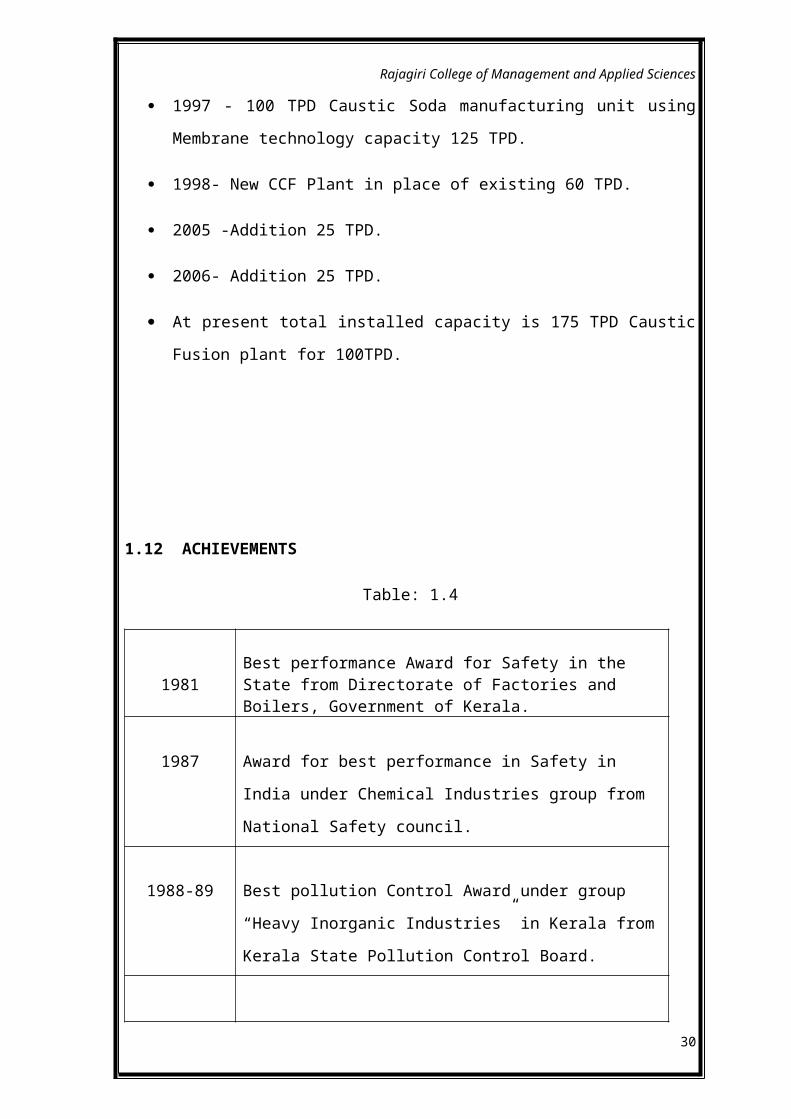
1997 - 100 TPD Caustic Soda manufacturing unit using Membrane technology
capacity 125 TPD.
1998- New CCF Plant in place of existing 60 TPD.
2005 -Addition 25 TPD.
2006- Addition 25 TPD.
At present total installed capacity is 175 TPD Caustic Fusion plant for 100TPD.
1.12 ACHIEVEMENTS
Table: 1.4
1981Best performance Award for Safety in the State from Directorate of Factories and Boilers, Government of Kerala.
21
Rajagiri College of Management and Applied Sciences
1987 Award for best performance in Safety in India under Chemical
Industries group from National Safety council.
1988-89 Best pollution Control Award under group “Heavy Inorganic
Industries” in Kerala from Kerala State Pollution Control Board.
1988-90 Price for Productivity from Kerala State Productivity Council.
1993
Best Performance Award for Energy Conservation in the State of
Kerala under group “Chemical and Fertilizers above 3000KVA”
from Government of Kerala.
1994-95 &
1995-96
Best Performance Award for the Productivity in the State of
Kerala under the group “Large Industries” from Kerala State
Productivity Council.
1996 Best Performance Award for Energy Conservation in the State of
Kerala under group “Major industries” from Energy
Management Centre, Government of Kerala.
1998 Performance Awarded for Energy conservation under the group
“Chlor-Alkali Sector” from Ministry of Power, Government of
Kerala.
2003 Kerala State Energy Conservation Award in Appreciation of the
outstanding achievements towards energy conservation and
management
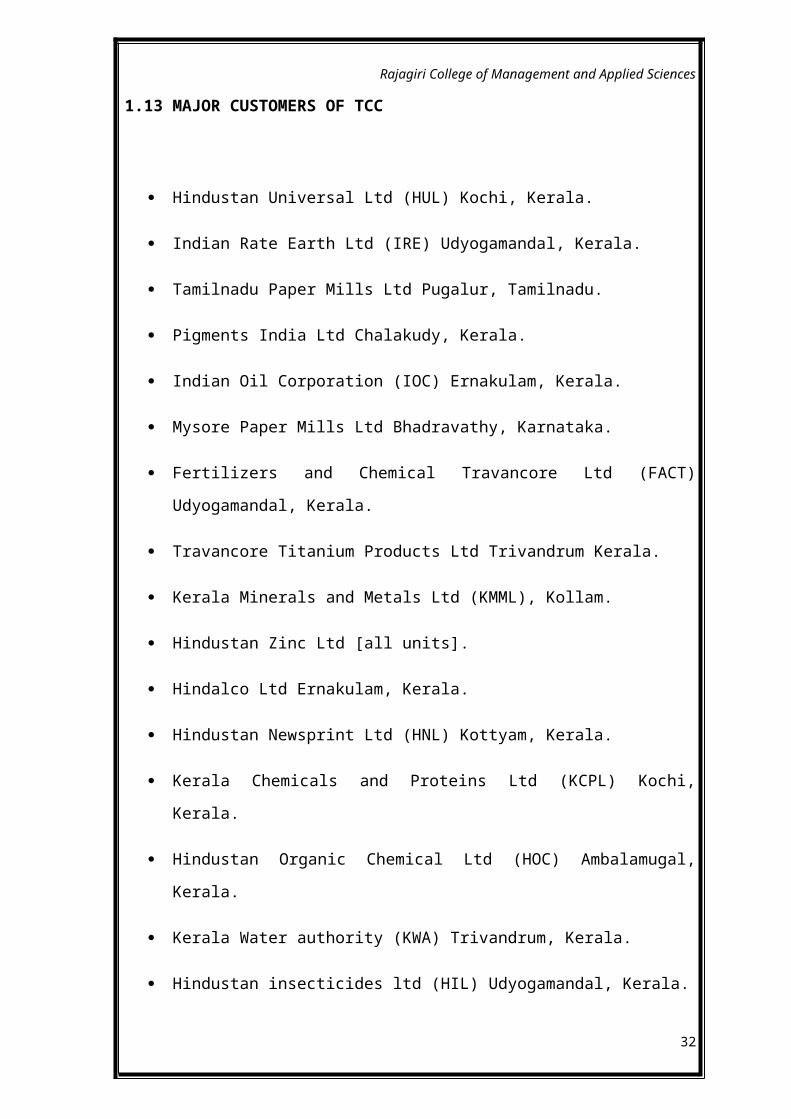
1.13 MAJOR CUSTOMERS OF TCC
Hindustan Universal Ltd (HUL) Kochi, Kerala.
22

Rajagiri College of Management and Applied Sciences
Indian Rate Earth Ltd (IRE) Udyogamandal, Kerala.
Tamilnadu Paper Mills Ltd Pugalur, Tamilnadu.
Pigments India Ltd Chalakudy, Kerala.
Indian Oil Corporation (IOC) Ernakulam, Kerala.
Mysore Paper Mills Ltd Bhadravathy, Karnataka.
Fertilizers and Chemical Travancore Ltd (FACT) Udyogamandal, Kerala.
Travancore Titanium Products Ltd Trivandrum Kerala.
Kerala Minerals and Metals Ltd (KMML), Kollam.
Hindustan Zinc Ltd [all units].
Hindalco Ltd Ernakulam, Kerala.
Hindustan Newsprint Ltd (HNL) Kottyam, Kerala.
Kerala Chemicals and Proteins Ltd (KCPL) Kochi, Kerala.
Hindustan Organic Chemical Ltd (HOC) Ambalamugal, Kerala.
Kerala Water authority (KWA) Trivandrum, Kerala.
Hindustan insecticides ltd (HIL) Udyogamandal, Kerala.
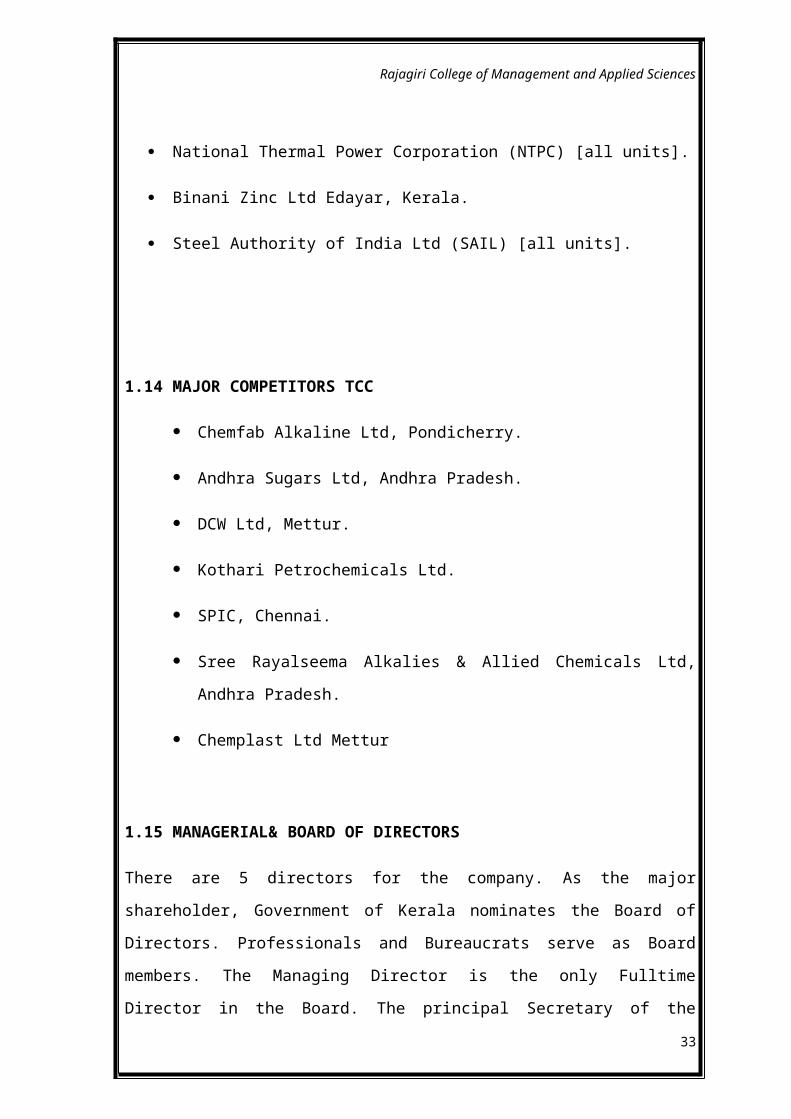
National Thermal Power Corporation (NTPC) [all units].
Binani Zinc Ltd Edayar, Kerala.
Steel Authority of India Ltd (SAIL) [all units].
1.14 MAJOR COMPETITORS TCC
Chemfab Alkaline Ltd, Pondicherry.
23

Rajagiri College of Management and Applied Sciences
Andhra Sugars Ltd, Andhra Pradesh.
DCW Ltd, Mettur.
Kothari Petrochemicals Ltd.
SPIC, Chennai.
Sree Rayalseema Alkalies & Allied Chemicals Ltd, Andhra Pradesh.
Chemplast Ltd Mettur
1.15 MANAGERIAL& BOARD OF DIRECTORS
There are 5 directors for the company. As the major shareholder, Government of Kerala
nominates the Board of Directors. Professionals and Bureaucrats serve as Board
members. The Managing Director is the only Fulltime Director in the Board. The
principal Secretary of the Industrial Department is Chairman.
Table: 1.5
Chairman K Sreenivasan IAS (Principal Secretary of Industrial Dept.
Managing
Director
V Muralidharan Nair
Board of Directors
M R Ramachandran (nominee from KSIDC)
N Thomas (nominated director)
N I Paulose (retired official nominated govt.)
24

Rajagiri College of Management and Applied Sciences
Company Secretary Smt. Susan Abraham
1.16 PRODUCTS AND MARKETSPRODUCT PROFILE
Caustic soda, Chlorine and Hydrochloric acid form the backbone of chemical Industry.
These are important to the country’s economy and very much to steel and cement. TCC’s
main raw materials are common salt (sodium chloride) electricity and water. The
company requires about 3700 units of electricity and 2 tonnes of salt per tonne of caustic
soda produced. Common salt is mainly imported from Gujarat and Tamil Nadu. Major
products are the following-Caustic Soda (NaOH) Caustic soda is a basic alkali. It came
into being in the latter half of 19th century with the development of electrolysis. Caustic
soda Lye, obtained from Membrane Cell is a clear colorless, odorless and soapy liquid.
TCC is producing two types of Caustic Soda Lye of concentration 30-33% and 50%.It is
used as a chemical for dissolving out extraneous matter from wood. It is also used in
preparing pure cellulose and for the preparation of Alkali cellulose and for the
production of viscose solution. Others use it as a specification agent and also in
bleaching, dyeing and mercerizing, For processing monazite and refining of Bauxite, as a
purification agent and absorbent for acidic gases and also as a clearing agent. Chlorine
(Cl2) Chlorine, a product obtained in the manufacturing process of Caustic soda is an
equally important basic chemical. It is renowned water purifying chemical. It is a
greenish yellow gas. Chlorine is sold after liquefying. It is used in producing insecticides
(DDT, BHC etc.) and pesticides like Aldine. It plays a huge role in purifying drinking
water and sterilizing sewage effluents. Chlorine is also used for manufacturing PVC and
allied co-polymers. It acts as a bleaching agent and is used in the production of
chloramines and its organic derivatives. Hydrochloric Acid(HCl)TCC also produces high
25
Rajagiri College of Management and Applied Sciences
purity Hydrochloric acid, it is yellowish green colour. The HCl produced have
concentration of 30-34%.Sodium hypochlorite Sodium Hypochlorite, known as soda
Bleach, finds its application in bleaching and as a disinfectant and also in the extraction
of rare earth chemicals. It is a pale yellowish green colour liquid. Soda bleach is the only
branded product that the company is producing under the brand name Ekoclean. It is
used as a bleaching agent and as a germicide and cleaning agent. It is also used for
sterilization. Caustic soda Flakes Caustic soda Lye is fused to product Caustic Soda
flakes. There is a continuous caustic fusion plant that produces Caustic soda flakes. It is
white deliquescent solid in flakes form. Caustic soda flake have concentration 98.99%.
1.17 PRODUCTS& PRODUCTION CAPACITY
Table: 1.6
Products Production capacity (in Tons per annum)
Caustic Soda Lyme 63875
Caustic Soda Flakes 36500
26

Rajagiri College of Management and Applied Sciences
Liquid Chlorine 26280
Commercial HCI 141255
Sodium Hypochlorite 16425
1.18 INDUSTRIES SERVED BY TCC PRODUCTS
Table: 1.7
Caustic Soda
Soap, Paper, Textile, fertilizers, Drugs and
Pharmaceuticals, Vanaspathi, Engineering,
Petroleum and Chemicals.
Chlorine
Paper, Textile, Insectide, Water Purification,
Drugs, Pharmaceuticals, Mineral Processing,
Sugar Fine Chemicals and Rubber.
Commercial HCI acid Fertilizing, Engineering, Mineral Processing,
Starch, Oessin and Plastics.
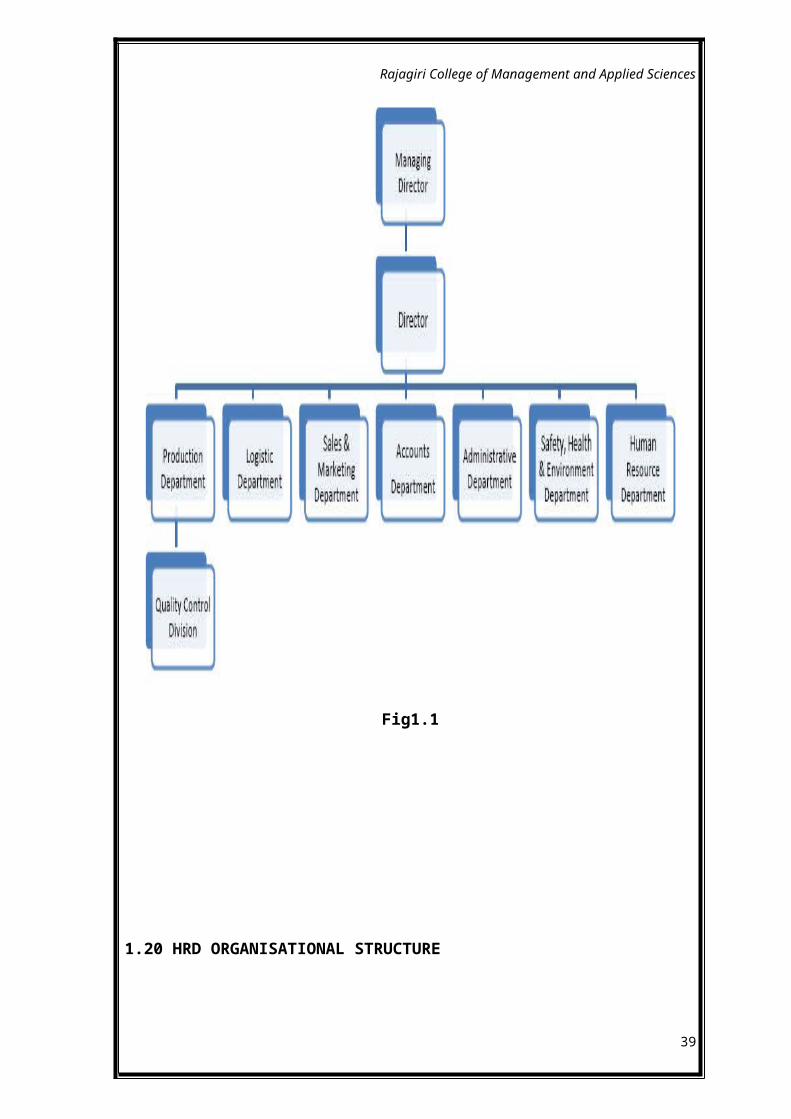
1.19 ORGANISATIONAL STRUCTURE
27

Rajagiri College of Management and Applied Sciences
Fig1.1
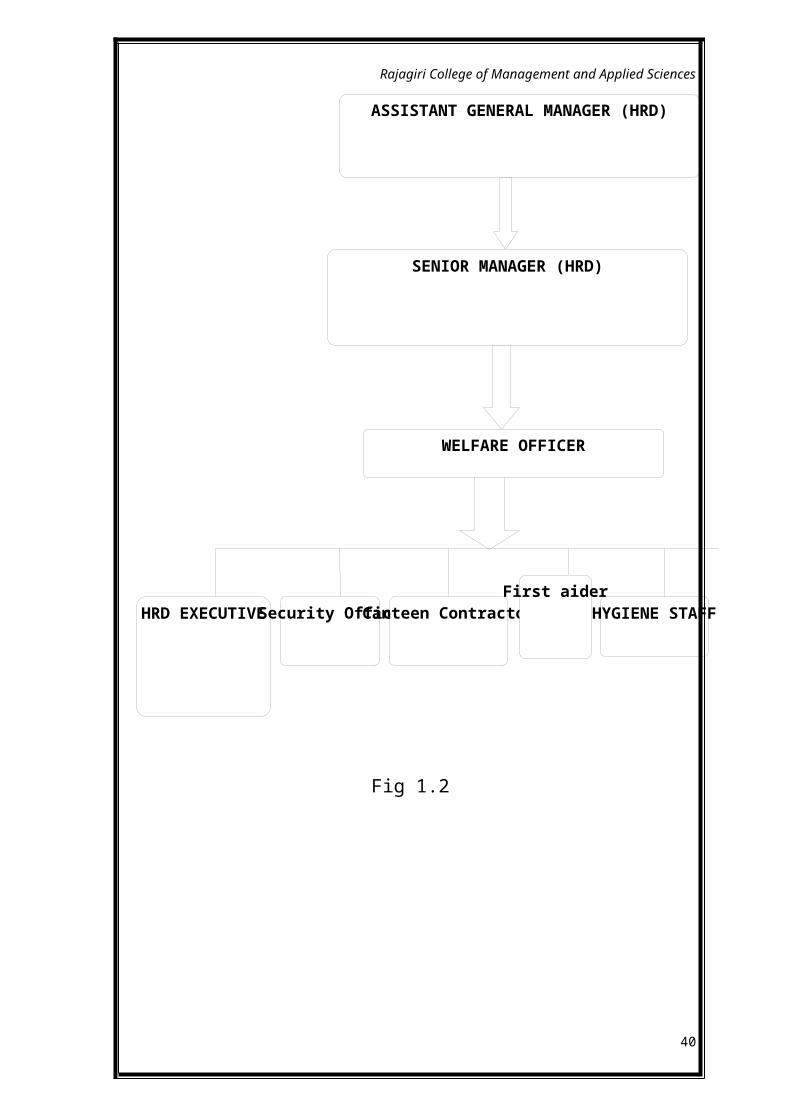
1.20 HRD ORGANISATIONAL STRUCTURE
28

ASSISTANT GENERAL MANAGER (HRD)
SENIOR MANAGER (HRD)
HRD EXECUTIVE Security OfficerCanteen ContractorFirst aider
HYGIENE STAFF
WELFARE OFFICER
Rajagiri College of Management and Applied Sciences
Fig 1.2
29
Rajagiri College of Management and Applied Sciences
PART- II
CHAPTER-1
INTRODUCTION AND
REVIEW OF
LITERATURE
1.1 INTRODUCTION
30

Rajagiri College of Management and Applied Sciences
Training can be introduced simply as a process of assisting a person for enhancing his
efficiency and effectiveness to a particular work area by getting more knowledge and
practices. Also training is important to establish specific skills, abilities and knowledge
to an employee. For an organization, training and development are important as well as
organizational growth, because the organizational growth and profit are also dependent
on the training. But the training is not a core of organizational development. It is a
function of the organizational development.
Training is different form education; particularly formal education. The education is
concerned mainly with enhancement of knowledge, but the aims of training are
increasing knowledge while changing attitudes and competences in good manner.
Basically the education is formulated within the framework and to syllabus, but the
training is not formed in to the frame and as well as syllabus. It may differ from one
employee to another, one group to another, even the group in the same class. The reason
for that can be mentioned as difference of attitudes and skills from one person to another.
Even the situation is that, after good training programme, all different type skilled one
group of employees can get in to similar capacity, similar skilled group. That is an
advantage of the trainings.
In the field of Human Resources Management, Training and Development is the field
concern with organizational activities which are aimed to bettering individual and group
performances in organizational settings. It has been known by many names in the field
HRM, such as employee development, human resources development, learning and
development etc. Training is really developing employees’ capacities through learning
and practicing.
Training and Development is the framework for helping employees to develop their
personal and organizational skills, knowledge, and abilities. The focus of all aspects of
Human Resource Development is on developing the most superior workforce so that the
organization and individual employees can accomplish their work goals in service to
customers.
31
Rajagiri College of Management and Applied Sciences
All employees want to be valuable and remain competitive in the labour market at all
times, because they make some demand for employees in the labour market. This can
only be achieved through employee training and development.
Hence employees have a chance to negotiate as well as employer has a good opportunity
to select most suitable person for his vacancy. Employees will always want to develop
career-enhancing skills, which will always lead to employee motivation. There is no
doubt that a well-trained and developed staff will be a valuable asset to the company and
thereby increasing the chances of his efficiency in discharging his or her duties.
Trainings in an organization can be mainly of two types; Internal and External training
sessions. Internal training involves when training is organized in-house by the human
resources department or training department using either a senior staff or any talented
staff in the particular department as a resource person.
On the other hand external training is normally arranged outside the firm and is mostly
organized by training institutes or consultants. Whichever training, it is very important
for all staff and helps in building career positioning and preparing staff for greater
challenges in developing world. However the training is costly. Because of that, people
who work at firms do not receive external trainings most of times. The cost is a major
issue for the lack of training programmes in Sri Lanka. But nowadays, a new concept has
come with these trainings which are “Trainers through trainees”. While training their
employees in large quantities, many countries use that method in present days to reduce
their training costs. The theory of this is, sending a little group or an individual for a
training programme under a bonding agreement or without a bond. When they come
back to work, the externally trained employees train the employees who have not
participated for above training programme by internal training programmes.
Employers of labour should enable employees to pursue training and development in a
direction that they choose and are interested in, not just in company-assigned directions.
32
Rajagiri College of Management and Applied Sciences
Companies should support learning, in general, and not just in support of knowledge
needed for the employee's current or next anticipated job. It should be noted that the key
factor is keeping the employee interested, attending, engaged, motivated and retained.
For every employee to perform well, especially Supervisors and Managers, there is a
need for constant training and development. The right employee training, development
and education provides big payoffs for the employer in increased productivity,
knowledge, loyalty, and contribution to general growth of the firm. In most cases
external trainings for instance provide participants
With the avenue to meet new set of people in the same field and network. The meeting
will give them the chance to compare issues and find out what is obtainable in each
other’s environment. This for sure will introduce positive changes where necessary.
It is not mentioned in anywhere that the employers, managers and supervisors are not
suitable for training programmes. They also must be highly trained if they are expected
to do their best for the organization. Through that they will have best abilities and
competencies to manage the organization. Training employees not only creates a more
positive corporate culture, but also add a value to its key resources.
Raw human resources can make only limited contribution to the organization to achieve
its goals and objectives. Hence the demands for the developed employees are
continuously increasing. Thus the training is a kind of investment.
1.2 TRAINING NEED IDENTIFICATION FOR A COMPANY
Training need identification is a tool utilized to identify what educational courses or
activities should be provided to employees to improve their work productivity. Here the
33

Rajagiri College of Management and Applied Sciences
focus should be placed on needs as opposed to desires of the employees for a
constructive outcome. In order to emphasize the importance of training need
identification we can focus on the following areas: -
To pinpoint if training will make a difference in productivity and the bottom line.
To decide what specific training each employee needs and what will improve his
or her job performance.
To differentiate between the need for training and organizational issues and bring
about a match between individual aspirations and organizational goals.
Identification of training needs (ITN), if done properly, provides the basis on which all
other training activities can be considered. Also requiring careful thought and analysis, it
is a process that needs to be carried out with sensitivity as people's learning is important
to them, and the reputation of the organization is also at stake.
Identification of training needs is important from both the organisational point of view as
well as from an individual's point of view. From an organisation's point of view it is
important because an organisation has objectives that it wants to achieve for the benefit
of all stakeholders or members, including owners, employees, customers, suppliers, and
neighbours. These objectives can be achieved only through harnessing the abilities of its
people, releasing potential and maximising opportunities for development.
Therefore people must know what they need to learn in order to achieve organisational
goals. Similarly if seen from an individual's point of view, people have aspirations, they
want to develop and in order to learn and use new abilities, and people need appropriate
opportunities, resources, and conditions. Therefore, to meet people's aspirations, the
organization must provide effective and attractive learning resources and conditions. And
it is also important to see that there is a suitable match between achieving organizational
goals and providing attractive learning opportunities.
1.3 DESIGNING TRAINING AND DEVELOPMENT PROGRAMME
34

Rajagiri College of Management and Applied Sciences
Every training and development programme must address certain vital issues
1. Who participates in the programme?
2. Who are the trainers?
3. What methods and techniques are to be used for training?
4. What should be the level of training?
5. What learning principles are needed?
6. Where is the program conducted?
Who are the trainers: Trainers should be selected on the basis of self- nomination,
recommendations of supervisors or by the HR department itself. Whatever is the basis, it
is advisable to have two or more target audience. For example, rank-and-file employees
and their supervisors or by the HR department itself.
Several people, including the following may conduct training and
Development programmes:
1. Immediate supervisors
2. Co-workers, as in buddy systems,
3. Members of the personnel staff,
4. Specialists in other parts of the company,
5. Outside consultants,
6. Industry associations, and faculty members at universities
1.4 DIFFERENT EMPLOYEE TRAINING & DEVELOPMENT METHODS
A. On-the-Job Training Methods
1. Job instructions:
35
Rajagiri College of Management and Applied Sciences
It is received directly on the job, and so it is often called “on-the-job” training
(OJT).
It is used primarily to teach an employee how to do their current jobs.
A trainer, supervisor, or co-worker serves as the instructor.
OJT includes several steps:
1. The trainee receives an overview of the job, its purpose, and its desired outcomes,
with an emphasis on the relevance of the training.
2. Trainer demonstrates the job to give the employee a model to copy.
3. Employee is allowed to mimic the trainer’s example.
4. Demonstrations by trainer and practice by the trainee are repeated until the job is
mastered.
5. Employee performs the job without supervision.
2. Job rotation:
Job rotation involves moving employees to various positions in the organization
to expand their skills, knowledge and abilities.
It can be either horizontal or vertical.
1. Vertical job rotation is promoting a worker into a new position.
2. Horizontal job rotation is short-term lateral transfer.
Benefits:
It is excellent method for broadening an individual’s exposure to company
operations and for turning a specialist into a generalist.
36

Rajagiri College of Management and Applied Sciences
Increase the individual’s experience
Allows an employee to absorb new information
Reduce boredom
Stimulate the development of new ideas.
Provide opportunities for a more comprehensive and reliable evaluation of the
employee by supervisors.
3. Assistant-To Position:
Assistant-to positions allow employees with potential to work under and be
coached by successful managers.
Working as staff assistants, perform many duties under watchful eye of a
supportive coach.
Benefits:
Employee experience a wide variety of management activities
Groomed for the duties of next higher level position
4. Committee assignments:
Committee assignments provide opportunities to an employee for:
1. Decision-making
37

Rajagiri College of Management and Applied Sciences
2. Learning by watching others
3. Becoming more familiar with organizational members and problems
Temporary committee:
Act as a taskforce to delve into a particular problem, ascertain alternative
solutions, and recommend a solution.
Temporary assignments can be interesting and rewarding to the employee’s
growth.
Permanent committee:
Increases the employee’s exposure to other members of the organization
Broadens his/her understanding
Provide an opportunity to grow and
Make recommendations under the scrutiny of other committee members
5. Apprenticeships and Coaching:
Apprenticeships involve learning from a more experiences employee or
employees.
It may be supplemented with off-the-job classroom training.
Assistantships and internships are similar to apprenticeships because they use
high levels of participation by the trainee and have high transferability to the job.
Coach attempts to provide a model for the trainee to copy.
38
Rajagiri College of Management and Applied Sciences
It is less formal than an apprenticeship program because there are few formal
classroom sessions.
Coaching is handled by the supervisor or manager not by HR department.
Manager or another professional plays the role of mentor; give both skills and
career advice.
B. Off-the-Job Training Methods
1. Lecture Courses & Seminars:
Traditional forms of instructions revolve around formal lecture courses and
seminars.
Helps the individuals acquire knowledge and develop their conceptual and
analytical abilities.
Many organizations offer these in-house, through outside vendors, or both.
Lecture courses and seminars benefit from today’s technology and are often
offered in a distance-learning format.
Feedback and participation can be improved when discussion is permitted along
with lecture process.
Benefits:
Relative economic method
2. Vestibules:
39
Rajagiri College of Management and Applied Sciences
Learning tasks on the same equipment that one actually will use on the job but in
simulated work environment.
Separate areas or vestibules are setup with equipment similar to that used on the
job.
This arrangement allows transference, repetition, and participation.
Benefits:
Not disrupting normal operations
3. Role Playing and Behaviour modeling:
Role-playing is a device that forces trainees to assume different identities.
For example, a male worker may assume the role of a female supervisor and a
female supervisor may assume the role of a male worker. Then both may be
given a typical work situation and told to respond, as they would expect the other
to do.
It is used to diversity training, to change attitudes and also helps to develop the
interpersonal skills.
Behaviour can be learned, modified and altered through this method where
individual is either “matching” or “copying” or “imitating”, through the
observation of some other individual.
It is an “observational learning” technique.
Learning takes place not through experience but through observing the others’
behaviour.
The re-creation of the behaviour may be videotaped so that trainer and the trainee
can review and critique it.
40

Rajagiri College of Management and Applied Sciences
Trainer and trainee observe the positive and negative consequences; the
employee receives vicarious reinforcement that encourages the correct behaviour.
4. Simulation:
Simulation refers to any artificial environment that attempts to closely mirror an
actual condition.
Learning a job by actually performing the work
May include case studies/case analysis, experimental exercises/decision games
and role-plays and group interactions and are intended to improve decision-
making.
It is similar to vestibules, except that the simulator more often provides
instantaneous feedback on performance.
Benefits:
Opportunities to attempt to create an environment similar to real situations
manager face, without high costs for poor outcomes.
Disadvantage:
Difficult to duplicate the pressures and realities of actual decision-making on the
job,
Individuals often act differently in real-life situations than do in simulated
exercise.
4.1. Case-study:
41

Rajagiri College of Management and Applied Sciences
Take actual experiences of organizations, these cases represent attempts to
describe, as accurately as possible, real problems. Trainees study these cases to
determine problems, analyse causes, develop alternative solutions, select what
they believe to be the best solution, and implement it.
If cases are meaningful and similar to work-related situations, it means
transference is there.
Participation can also increase by discussing these cases.
Benefits:
Provide stimulating discussions among participants
Excellent opportunities for individuals to defend their analytical and judgmental
abilities.
Improving decision-making abilities within the constraints of limited information.
4.2. Decision Games/ role-playing:
Played on computer program,
Player makes decision, and computer determines the outcome in the context of
the conditions under which it was programmed.
Provide opportunities for individuals to make decisions and to witness the
implications of their decisions for other segments of the organization.
Role-playing allows participants to act out problems and to deal with real people.
5. Self-study & Programmed Learning:
42

Rajagiri College of Management and Applied Sciences
Carefully planned instructional materials can be used to train and develop
employees.
It is computer programs or printed booklets that contain a series of questions and
answers.
After reading and answering a question, the reader gets immediate feedback. If
right, the learner proceeds; if wrong, the reader is directed to review the
accompanying materials.
Programmed materials provide learner participation, repetition, relevance, and
feedback.
It ranges from manuals to pre-recorded cassettes or videotapes.
Benefits: It is useful when employees are dispersed geographically or when .requires
little interaction.
6. Outdoor Training:
Outdoor training typically involves challenges, which teach trainees the
importance of teamwork/working together.
It typically involves some major emotional and physical challenge.
Purpose is to see how employees react to the difficulties that nature presents to
them. Do they “freak”? Or are they controlled and successful in achieving their
goal?
Benefits: It reinforced the importance of working closely with one another,
Building trusting relationships, and succeeding as a member of a group.
43

Rajagiri College of Management and Applied Sciences
CHAPTER- 2
RESEARCH
METHODOLOGY
2.1 TITLE OF STUDY
44
Rajagiri College of Management and Applied Sciences
A study on the effectiveness of training programmes for production employees in
The Travancore Cochin Chemicals ltd.
2.2 INTRODUCTION
The Travancore Cochin Ltd. Is a state owned undertaking engaged in the manufacture of
the basic chemicals required by various industries. The company, established in 1951 to
manufacture Rayon Grade Caustic Soda, expanded its production capacity in stages to
become a leading Chlor-Alkali unit in the country. By the middle of 2005, their
production capacity reached 150 MT Caustic Soda per day. Now, for Caustic Soda
production, they employ only Membrane Cell Technology which is energy efficient,
environment-friendly and state-of-the art technology. Their products are:
• Caustic Soda
• Liquid Chlorine
• Hydrochloric Acid
• Sodium Hypochlorite
2.3 STATEMENT OF PROBLEM
Training and development programmes play a crucial role in the development
process of an organization. Hence sound training and development policies are inevitable
for the survival and growth of an organization. These programmes would help the
organization to get their employees motivated and increase their productivity. Hence it is
important to evaluate the effectiveness of the training programmes on the basis of the
employee’s feedback and to explore the scope for any improvement. This study would
45
Rajagiri College of Management and Applied Sciences
help to understand the employees overall satisfaction level about these training and
development programmes.
2.4 SIGNIFICANCE OF STUDY
Training and development programmes are a pivotal function in an organization.
It decides the quality of the employees in an organization and therefore the productivity
of an organization. Thus it become important to study the training and development
programmes implemented in the organization and the employees opinion about them.
2.5 SCOPE OF STUDY
The project was conducted in The Travancore Cochin Chemicals ltd. to study the
effectiveness of training programmes on the basis of an employee’s feedback and
explore scope for improvement. This project mainly studies whether the training
programmes conducted by The Travancore Cochin Chemicals ltd.is effective and useful
in improving the personal growth and development of the employees of The Travancore
Cochin Chemicals ltd.
2.6 GENERAL OBJECTIVE
To evaluate the effectiveness of training programmes undergone by the
production employees of The Travancore Cochin Chemicals ltd.
46

Rajagiri College of Management and Applied Sciences
2.7SPECIFIC OBJECTIVES
To study whether the training programmes were helpful in improving the skills
and attitude of the employees.
To study whether the training programme were helpful in improving the personal
growth and development of the employees
To study whether the training programmes were helps in creating a sense of
motivation and security in the employees.
2.7 RESEARCH DESIGN
Research design used is descriptive in nature because the area of study and what
is to be measured is defined clearly. A descriptive research study required a clear
specification of who, what, when, where, why and how aspects of the research. The
sample size taken here is 80 by convenience sampling method.
2.8 DATA COLLECTION
PRIMARY DATA
The primary data was collected from the employees of the organization using the
questionnaire method.
SECONDARY DATA
The secondary data was collected from various publications and journals of the
institution, brochures, text book, web pages etc.
47

Rajagiri College of Management and Applied Sciences
2.9 POPULATION
The study was conducted within the population of 700 employees of The
Travancore Cochin Chemicals ltd.
2.10 SAMPLING TECHNIQUE
The sampling technique used by the researcher in this study is convenience
sampling method.
2.11SAMPLE SIZE
The sample size was 80 employees of The Travancore Cochin Chemicals ltd.
2.11 PERIOD OF STUDY
The present study on the effectiveness of training programmes for production
employees in The Travancore Cochin Chemicals ltd. was conducted for a period of one
week.
2.12 TOOLS FOR DATA COLLECTION AND ANALYSIS
Questionnaires were used for interviewing the respondents to acquire data.
Percentage, frequencies, charts and tables were used to analyze the collection data. Pie-
chart were used to represent the data graphically represent the data. The survey was
conducted among 80 employees of The Travancore Cochin Chemicals ltd. using the
questionnaires
48

Rajagiri College of Management and Applied Sciences
2.13 LIMITATION OF STUDY
The first and foremost limitation is the difficulty in getting the feedback form
back from respondents.
Investigation access to the workmen was limited due to the shift system.
Due to several constraints the respondents were not ready to give all their
personal data.
Survey is limited to only 80 employees.
Lack of time to interacts with respondents.
49

Rajagiri College of Management and Applied Sciences
CHAPTER- 3
DATA ANALYSIS
&
INTERPRETATION
INTRODUCTION
50

Rajagiri College of Management and Applied Sciences
The methodology described in the previous chapter provided the baseline for data
gathering. In this chapter, the presentation of data is systematically linked to the format
of the self-developed questionnaire attached in the appendix. The following will be used
to analyze data: description of the sample, main results, discussion, presentation and
interpretations of the results.
This chapter discusses the data analysis and interpretation. The research analysed and
interpreted the data into meaningful and applicable units. The data is presented in
frequencies and percentages. A total of 80 questionnaires were distributed and returned.
According to Grinnell and Williams (1992:127). The analysis and interpretation is
arranged according to each variable. The data was collected from the employees by
giving questionnaire and also by direct interview method.
Training and development play an important role in the effectiveness of organizations
and to the experiences of people in work. Training has implications for productivity,
health and safety at work and personal development. All organizations employing people
need to train and develop their staff. Most organizations are cognisant of this
requirement and invest effort and other resources in training and development. Such
investment can take the form of employing specialist training and development staff and
paying salaries to staff undergoing training and development. Investment in training and
development entails obtaining and maintaining space and equipment. It also means that
operational personnel, employed in the organization’s main business functions, such as
production, maintenance, sales, marketing and management support, must also direct
their attention and effort from time to time towards supporting training development and
delivery. This means they are required to give less attention to activities that are
obviously more productive in terms of the organization’s main business. However,
investment in training and development is generally regarded as good management
practice to maintain appropriate expertise now and in the future.
51

Rajagiri College of Management and Applied Sciences
Table showing age of the employees.
Table: 3.1
AGE FRQUENCY PERCENTAGE
20-25 1 1.25
25-30 2 2.5
ABOVE 25 77 96.25
20-251%
25-303%
above 3096%
20-2525-30above 30
Fig: 3.1
Diagram showing age of the employees.
INFERENCE
Among the employees 96% are above the age 30, 3% is between 25-25 age limit and 1%
of 20-25 age limit.
52

Rajagiri College of Management and Applied Sciences
Table showing employees sex.
Table: 3.2
SEX FRQUENCY PERCENTAGE
MALE 80 0
FEMALE 100 0
male female0
20
40
60
80
100
120
Series1
Fig: 3.2
Diagram showing employees sex.
INFERENCE
While analyzing the table, 100% of the employees in the factory are male workers and as
on observation female staffs were seen on office sections.
53

Rajagiri College of Management and Applied Sciences
Table showing marital status of the employees.
Table: 3.3
STATUS FRQUENCY PERCENTAGE
SINGLE 3 3.75
MARRIED 77 96.25
DIVORCED 0 0
single4%
married96%
singlemarrieddivorced
Fig: 3.3
Diagram showing marital status of the employees.
INFERENCE
Among the employees 77% are married and only 3% is single who are in the age of 20-
30 age limit.
54

Rajagiri College of Management and Applied Sciences
Table showing workers experience in the company.
Table: 3.4
EXPERIENCE FRQUENCY PERCENTAGE
LESS THAN 3 YRS. 2 2.5
3 TO 5 YRS. 3 3.75
MORE THAN 5 YRS. 75 93.75
less than 3 years2% 3 to 5 years
4%
5 years94%
less than 3years 3 to 5 years5 years
Fig: 3.4
Diagram showing workers experience in the company
INFERENCE
Among the employees 94% are working more than 5years, 4% belong to 3 to 4 years and
2% belong to less than 3 years’ experience in the organization.
55

Rajagiri College of Management and Applied Sciences
Table showing number of organization employer worked.
Table: 3.5
FRQUENCY PERCENTAGE
YES 57 71.25
NO 23 28.75
yes
no
57
23
Series1
Fig: 3.5
Diagram showing number of organization employer had worked.
INFERENCE
Among the employee’s 71.25% first organization is this and 28.75% had worked in other
organizations before.
56

Rajagiri College of Management and Applied Sciences
Table showing the organization gives materials and Equipment to employers
Table: 3.6
FRQUENCY PERCENTAGE
STRONGLY DISAGREE 0 0
DISAGREE 6 7.5
NEITHER AGREE NOR
DISAGREE
9 11.25
AGREE 15 18.75
STRONGLY AGREE 50 62.5
STRONGLY DISAGREE DISAGREE
NEITHER AGREE NOR DISAGREE
AGREESTRONGLY
AGREE
0
5
10
15
20
25
30
35
40
45
50
0
6 915
50
Series1
Fig: 3.6
Diagram showing the organization gives materials and Equipment to employers
INFERENCE
Among the employees 63% of employeesstrongly agree and 19% agree that the materials
and Equipment that you need to do your everyday work are provided, 11%neither agrees
nor disagree and &7%disagree.
57

Rajagiri College of Management and Applied Sciences
Table showing the employer performing a job that match their skills
Table: 3.7
FRQUENCY PERCENTAGE
STRONGLY DISAGREE 1 1.25
DISAGREE 4 5
NEITHER AGREE NOR
DISAGREE
14 17.5
AGREE 24 30
STRONGLY AGREE 37 46.25
STRONGLY DISAGREE DISAGREE
NEITHER AGREE NOR DISAGREE AGREE
STRONGLY AGREE
1 4
14
24
37
Series1
Fig: 3.7
Diagram showing the employer performing a job that match their skills
INFERENCE
Among the employees 46% strongly agree and 30% agree that they are performing a job
that matches their skills, 18%neither agrees nor disagree, 5% disagree and 1% strongly
disagree.
58

Rajagiri College of Management and Applied Sciences
Table showing working comfortability with their team members
Table: 3.8
FRQUENCY PERCENTAGE
STRONGLY DISAGREE 1 1.25
DISAGREE 3 3.75
NEITHER AGREE NOR
DISAGREE
9 11.25
AGREE 11 13.75
STRONGLY AGREE 56 70
STRONGLY DISAGREE DISAGREE
NEITHER AGREE NOR DISAGREE AGREE
STRONGLY AGREE
1 39 11
56
Series1
Fig: 3.8
Diagram showing working comfortability with their team members
INFERENCE
Among the employees 70% strongly agree and 14% agree that they neither feels
comfortable working with their team members, 11% neither agrees nor disagree, 4%
disagree and 1% strongly disagree.
59

Rajagiri College of Management and Applied Sciences
Table showing organization has created an attractive work area to promotes
productivity
Table: 3.9
FRQUENCY PERCENTAGE
STRONGLY DISAGREE 1 1.25
DISAGREE 6 7.5
NEITHER AGREE NOR
DISAGREE
26 32.5
AGREE 35 43.75
STRONGLY AGREE 12 15
STRONGLY DISAGREE1% DISAGREE
8%
NEITHER AGREE NOR DISAGREE
33%
AGREE44%
STRONGLY AGREE15%
Fig: 3.9
Diagram showing organization has created attractive work area to promotes productivity
INFERENCE
Among the employees 15% strongly agree and 44% agree thatorganization has created
professional, attractive work area that is functional and promotes productivity, 33%
neither agrees nor disagree, 7% disagree and 1% strongly disagrees.
60

Rajagiri College of Management and Applied Sciences
Table showing Company provides workers a safe work environment
Table: 3.10
FRQUENCY PERCENTAGE
STRONGLY DISAGREE 1 1.25
DISAGREE 2 2.5
NEITHER AGREE NOR
DISAGREE
12 15
AGREE 18 22.5
STRONGLY AGREE 47 58.75
STRONGLY DISAGREE1%
DISAGREE3%
NEITHER AGREE NOR DISAGREE
15%
AGREE23%
STRONGLY AGREE59%
Fig: 3.10
Diagram showing Company provides workers a safe work environment
INFERENCE
Among the employees 59% strongly agree and 23% agree thatthe Company provides
them a safe work environment by accident prevention & safety programs, 15% neither
agrees nor disagree, 2% disagree and 1% strongly disagree.
61

Rajagiri College of Management and Applied Sciences
Table showing Performance goals are Result-oriented and achievable
Table: 3.11
FRQUENCY PERCENTAGE
STRONGLY DISAGREE 5 6.25
DISAGREE 6 7.5
NEITHER AGREE NOR
DISAGREE
28 35
AGREE 26 32.5
STRONGLY AGREE 15 18.75
STRONGLY DISAGREE6%
DISAGREE8%
NEITHER AGREE NOR DISAGREE
35%AGREE33%
STRONGLY AGREE19%
Fig: 3.11
Diagram showing Performance goals are Result-oriented and achievable
INFERENCE
Among the employees 19% strongly agree and 33% agree thatperformance goals are
behavioral, result-oriented and achievable, 35% neither agrees nor disagree, 7% disagree
and 6% strongly disagree.
62

Rajagiri College of Management and Applied Sciences
Table showing Performance are regularly tracked and measured
Table: 3.12
FRQUENCY PERCENTAGE
STRONGLY DISAGREE 8 10
DISAGREE 12 15
NEITHER AGREE NOR
DISAGREE
26 32.5
AGREE 24 30
STRONGLY AGREE 9 11.25
STRONGLY DISAGREE10%
DISAGREE15%
NEITHER AGREE NOR DISAGREE
33%
AGREE30%
STRONGLY AGREE11%
Fig: 3.12
Diagram showing Performance are regularly tracked and measured
INFERENCE
Among the employees 12% strongly agree and 30% agree thatperformance is regularly
tracked and measured, 33% neither agrees nor disagree 15% disagree and 10% strongly
disagree.
63

Rajagiri College of Management and Applied Sciences
Table showing Performance measurement is used as criteria for promotions
Table: 3.13
FRQUENCY PERCENTAGE
STRONGLY DISAGREE 28 35
DISAGREE 17 21.25
NEITHER AGREE NOR
DISAGREE
14 17.5
AGREE 13 16.25
STRONGLY AGREE 10 12.5
STRONGLY DISAGREE DISAGREE
NEITHER AGREE NOR DISAGREE AGREE
STRONGLY AGREE
0
5
10
15
20
25
30
Fig: 3.13
Diagram showing Performance measurement is used as criteria for promotions
INFERENCE
Among the employees 12% strongly agree and 16% agree that performance measurement
is used as criteria for promotions, 17% neither agrees nor disagree 21% disagree and
34% strongly disagree.
64

Rajagiri College of Management and Applied Sciences
Table showing training & development programs are offered to improve skills
Table: 3.14
FRQUENCY PERCENTAGE
STRONGLY DISAGREE 4 5
DISAGREE 6 7.5
NEITHER AGREE NOR
DISAGREE
20 25
AGREE 25 31.25
STRONGLY AGREE 25 31.25
5%
8%
25%
31%
31%
STRONGLY DISAGREEDISAGREENEITHER AGREE NOR DISAGREEAGREESTRONGLY AGREE
Fig: 3.14
Diagram showing training & development programs are offered to improve skills
INFERENCE
Among the employees 31% strongly agree and 31% agree thata variety of training &
development programs are offered to improve their skills, 25% neither agrees nor
disagree 8% disagree and 5% strongly disagree.
65

Rajagiri College of Management and Applied Sciences
Table showing employees feel attached with your company, team & other
employees
Table: 3.15
FRQUENCY PERCENTAGE
STRONGLY DISAGREE 0 0
DISAGREE 2 2.5
NEITHER AGREE NOR
DISAGREE
15 18.75
AGREE 16 16
STRONGLY AGREE 47 58.75
DISAGREE3%
NEITHER AGREE NOR DISAGREE
19%
AGREE20%
STRONGLY AGREE59%
Fig: 3.15
Diagram showing employees feel attached with your company, team & other employees
INFERENCE
Among the employees 59% strongly agree and 20% agree that a variety of training &
development programs are offered to improve their skills, 19% neither agrees nor
disagree 2% disagree.
66

Rajagiri College of Management and Applied Sciences
Table showing supervisor respectful to employees
Table: 3.16
FRQUENCY PERCENTAGE
STRONGLY DISAGREE 3 3.75
DISAGREE 4 5
NEITHER AGREE NOR
DISAGREE
15 18.75
AGREE 25 31.25
STRONGLY AGREE 33 41.25
STRONGLY DISAGREE4% DISAGREE
5%
NEITHER AGREE NOR DISAGREE
19%
AGREE31%
STRONGLY AGREE41%
Fig: 3.16
Diagram showing supervisor respectful to employees
INFERENCE
Among the employees 41% strongly agree and 31% agree that a variety of training &
development programs are offered to improve their skills, 19% neither agrees nor
disagree 5% disagree and 4%strongly disagree .
67

Rajagiri College of Management and Applied Sciences
Table showing organization identifies the training needs for the employees
Table: 3.17
FRQUENCY PERCENTAGE
YES 48 60
NO 32 40
Yes60%
No40%
Fig: 3.17
Diagram showing organization identifies the training needs for the employees
INFERENCE
Among the employees 60% agree that the organization identifies the training needs for
the employees and 40% disagree with this.
68

Rajagiri College of Management and Applied Sciences
Table showing how much training and development Programme in a year (average)
Table: 3.18
No. Months FRQUENCY PERCENTAGE
One Month 80 100
Two Month 0 0
Three Month 0 0
One Month Two Month
Three Month
0
10
20
30
40
50
60
70
80
Two Month; 0Three Month; 0
Fig: 3.18
Diagram showing how much training and development Programme in a year
INFERENCE
Among the employees 100% say’s that, on an average they take only one month for
training and development programme.
69

Rajagiri College of Management and Applied Sciences
Table showing how many training programs done in previous year
Table: 3.19
No. FRQUENCY PERCENTAGE
One 80 100
Two 0 0
Three 0 0
OneTwo
Three
0
10
20
30
40
50
60
70
80
Two; 0
Three; 0
Fig: 3.19
Diagram showing how many training programs done in previous year
INFERENCE
Among the employees 100% say’s that they have attended only one training programme
in the past one year.
70

Rajagiri College of Management and Applied Sciences
Table showing how many employees have training programs in the coming
financial year
Table: 3.20
FRQUENCY PERCENTAGE
YES 57 71.25
NO 23 28.75
Yes71%
No29%
Fig: 3.20
Diagram showing how many employees have training programs in the coming
Financial year
INFERENCE
Among the employees 71% say’s that they are having trainingprograms in the coming
financial year and 29% are not having any training programs in the coming financial
year.
71

Rajagiri College of Management and Applied Sciences
Table showing top management taking feedback
Table: 3.21
FRQUENCY PERCENTAGE
YES 57 71.25
NO 23 28.75
Yes 71%
No29%
Fig: 3.21
Diagram showing top management taking feedback
INFERENCE
Among the employees 71% say’s that the top management takes feedback and 29%
disagree with thisstatement.
72
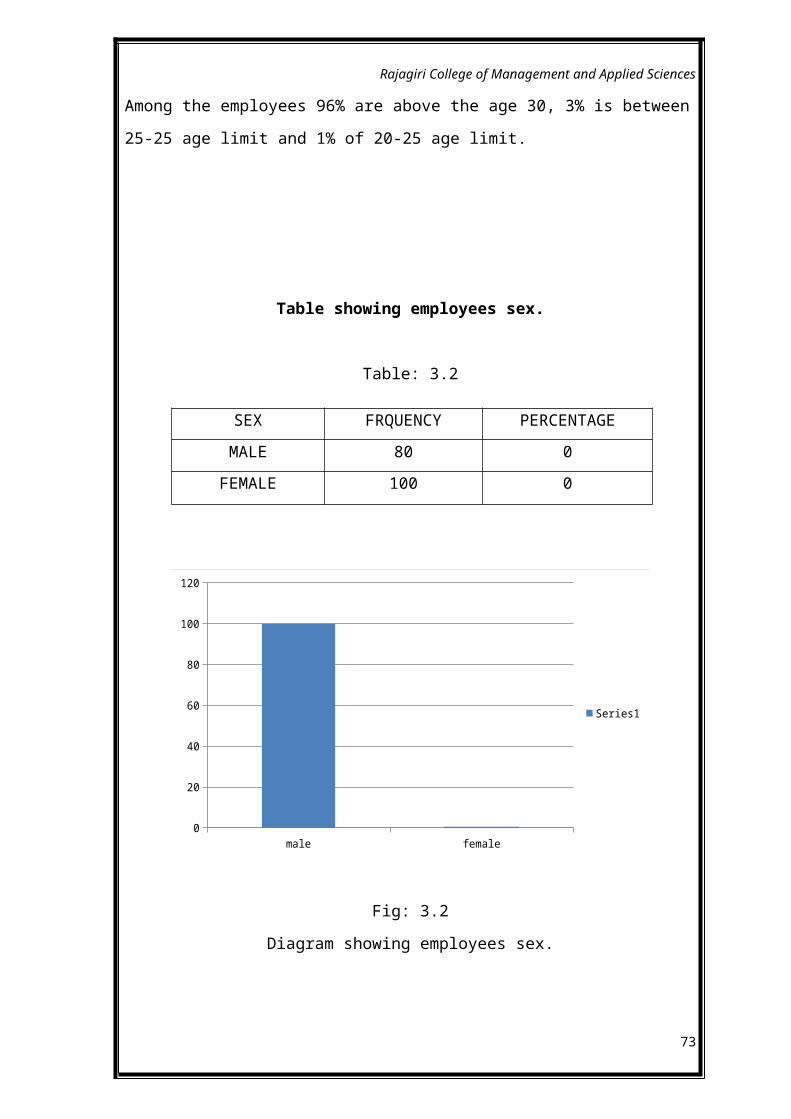
Rajagiri College of Management and Applied Sciences
Table showing Executive Director engage development activities for him/herself
Table: 3.22
FRQUENCY PERCENTAGE
YES 66 82.5
NO 14 17.5
Yes83%
No18%
Fig: 3.22
Diagram showing Executive Director engage development activities for him/herself
INFERENCE
Among the employees 82% say’s that theExecutive Director engage development
activities for him/her and 18% disagree with thisstatement.
73

Rajagiri College of Management and Applied Sciences
Table showing employees trust in your supervisors
Table: 3.23
FRQUENCY PERCENTAGE
YES 75 93.75
NO 5 6.25
Yes94%
No6%
Fig: 3.23
Diagram showing employees trust in your supervisors
INFERENCE
Among the employees 94% say’s that theyfeel trust in your supervisors and 18%
disagree with thisstatement.
74

Rajagiri College of Management and Applied Sciences
Table showing supervisors shows a positive attitude with employees
Table: 3.24
FRQUENCY PERCENTAGE
YES 78 97.5
NO 2 2.5
Yes98%
No3%
Fig: 3.25
Diagram showing supervisors shows a positive attitude with employees
INFERENCE
Among the employees 97% say’s that the practice's supervisors use positive attitude with
employees and 3% disagree with this statement.
75
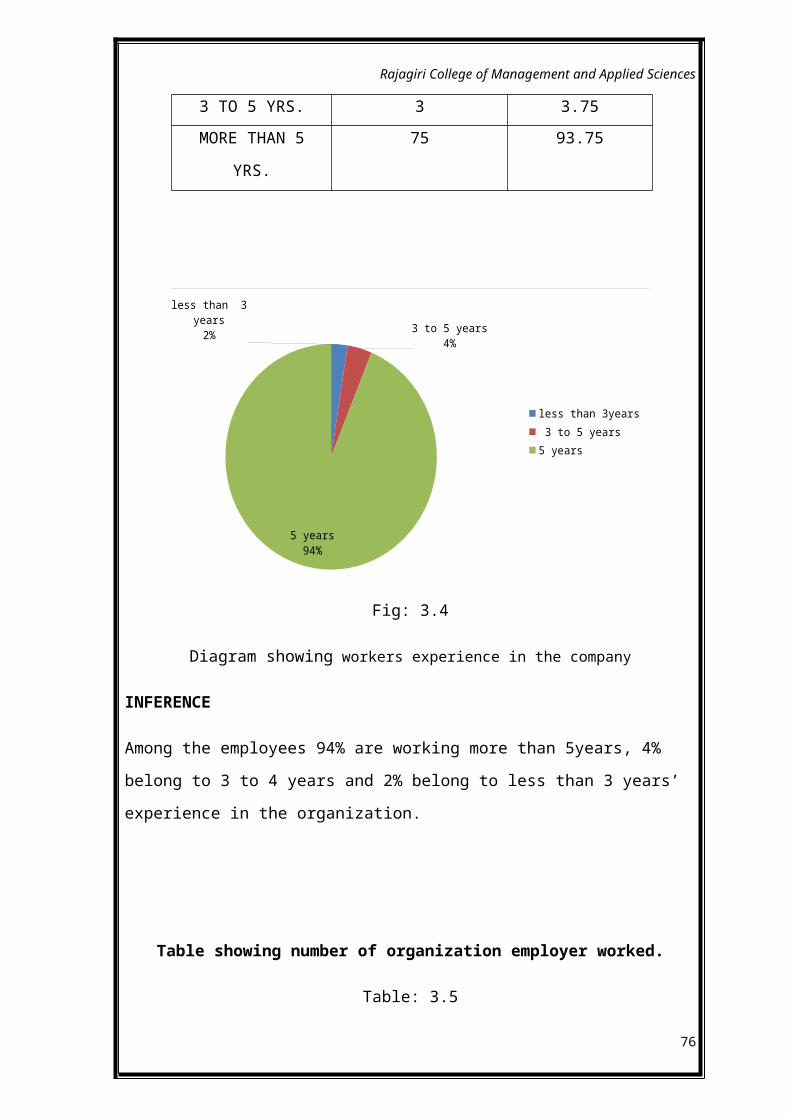
Rajagiri College of Management and Applied Sciences
Table showing organization evaluating individual Performance
Table: 3.25
FRQUENCY PERCENTAGE
YES 68 85
NO 12 15
Yes85%
No15%
Fig: 3.26
Diagram showing organization evaluating individual Performance
INFERENCE
Among the employees 85% say’s that the practice have a consistent, timely and fair
method for evaluating individual Performance and 15% disagree with this statement.
76

Rajagiri College of Management and Applied Sciences
Table showing company use a specific training process
Table: 3.26
FRQUENCY PERCENTAGE
YES 80 100
NO 0 0
Yes
No
0
10
20
30
40
50
60
70
80Yes; 80
No; 0
Fig: 3.26
Diagram showing company use a specific training process
INFERENCE
Among the employees 100% say’s thatcompany use a specific training process at every
year.
77

Rajagiri College of Management and Applied Sciences
Table showing conditions comfortable response
Table: 3.27
FRQUENCY PERCENTAGE
YES 64 80
NO 16 20
Yes80%
No20%
Fig: 3.27
Diagram showing conditions comfortable response
INFERENCE
Among the employees 80% say’s that office conditions comfortable and 15% disagree
with this statement.
78

Rajagiri College of Management and Applied Sciences
Table showing employees satisfy with organizational training and development
Programme
Table: 3.28
FRQUENCY PERCENTAGE
YES 80 100
NO 0 0
Yes
No
0
10
20
30
40
50
60
70
80Yes; 80
No; 0
Fig: 3.28
Diagram showing employees satisfy with organizational training and development
Programme
INFERENCE
Among the employees 100% say’s that they are satisfied with organizational training and
development Programme.
79
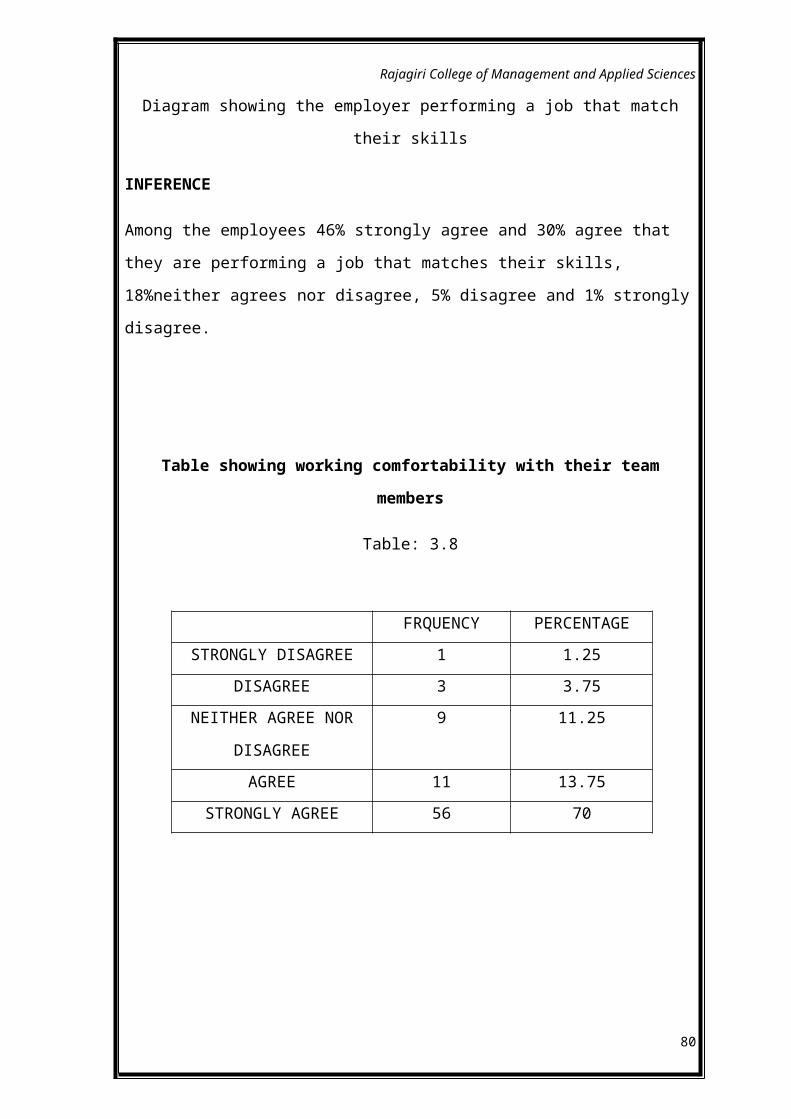
Rajagiri College of Management and Applied Sciences
CHAPTER-4
FINDINGS AND
CONCLUSION
80

Rajagiri College of Management and Applied Sciences
4.1 FINDINGS
From the study it is clear that all the employees said that employees are satisfied
with training and development programme.
No major environment pollution has been reported for the past 50 years of
operations.
The Company provides them a safe work environment.
The strength of TCC is the quality of their products, services and the delivery.
A variety of training & development programs are offered to improve skills of the
employees.
Company follows management by convenience and not management by
objectives
3 days HR training programme are done every year.
The training programmes strongly focus on technical and managerial capabilities
Majority of the respondents think that training will help their work effectively.
New technology of Membrane cell has the advantage of pollution free
environment and also it brings about 30% reductions in electric
power requirements.
81

Rajagiri College of Management and Applied Sciences
4.2 SUGGESTIONS
Safety training should be given to all the employees who are working in factories.
The company should try to organize variety of training programme.
There should be frequent training programme to improve communication
between employees.
Employee should be aware about the updated technology and also get advance
software packages.
The HR department should conduct briefing and debriefing sessions for
employees for Training as to give them an idea as to why this training is been
conducted and what they have to learn in the training program conducted and also
after training completion they should take a feedback as to how effective was the
training so that the necessary improvements in training programs can be
considered and implemented.
Needs for self-development must be emphasized among the employees.
The training session should be made more interactive and participative so that
trainees and trainer are in constant interaction.
82

Rajagiri College of Management and Applied Sciences
4.3 CONCLUSION
A detailed study is conducted on the topic “EFFECTIVENESS OF TRAINING AND
DEVELOPMENT OF EMPLOYEES” inThe Travancore Cochin Ltd.,Udyogamandal
From the study it is clear that the employees are satisfied in their job. All the employees
are satisfied with all type of training programme provided by the company. The training
programme will help to solve the problem in the industry.
Employees prefer the training and development system should be given twice in a year.
This will improve the efficiency of work. From the entire study, it can be concluded that
the training and development is a systematic HR practice, which plays a very important
role in shaping organizations future. Training and development boost the energy level of
employees.
In training and development the employees are up-dated to compete with modern
management and also it adds up their personality. Lastly, it brings a sense of
belongingness with organization.
The organisational study at TCC helped to have an industry exposure and to understand
the functions of managers and employees at different levels of the organisation. It also
helped to understand the environment in which the company works, strengths and
weaknesses of the firm. TCC was established in 1950, with a nominal production of 20
TPD. TCC has the distinction of being India’s pioneer producer of Rayon grade caustic
soda with a capacity of 175TPD. TCC have marked changes in the technology of process
and also stresses importance in productivity, employee’s morality quality and clean
environment. TCC is looking forward to achieve more and more greener pastures in the
days to come.
83
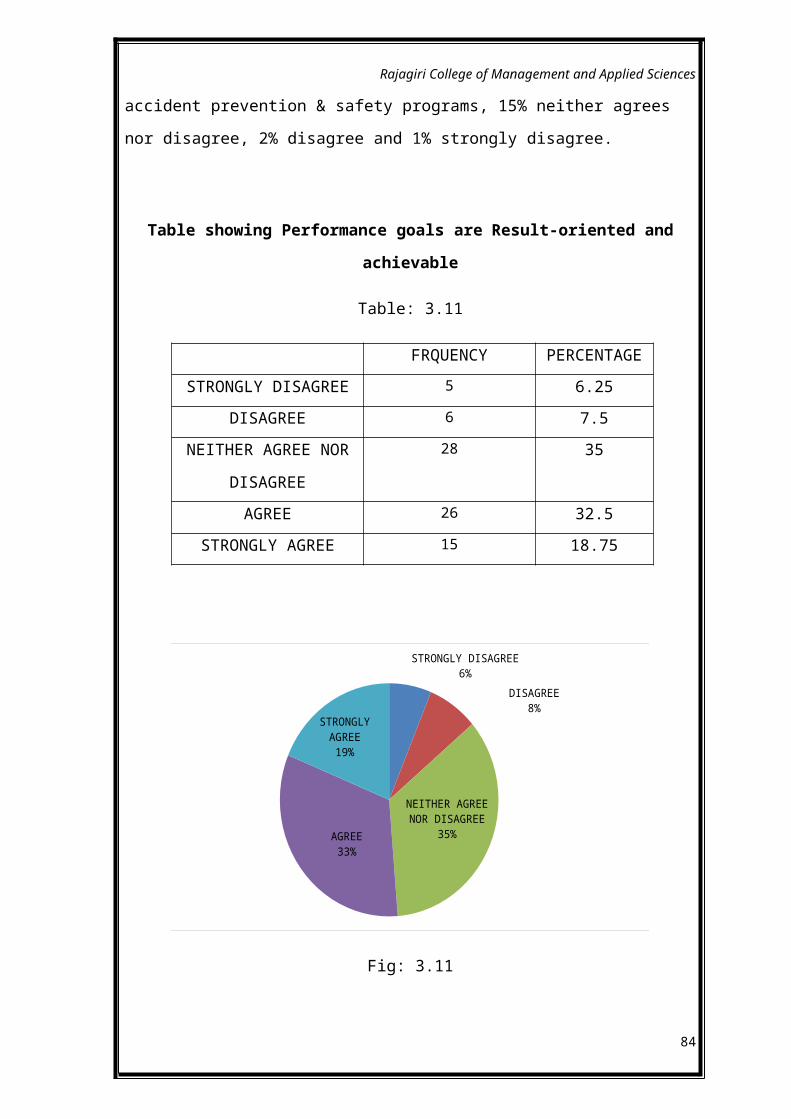
Rajagiri College of Management and Applied Sciences
The study has accomplished several goals. The study has helped to familiarize with
working condition of the organization. It has helped to study the co-ordination among
various departments. The study has given a general idea about the functioning of TCC. It
helped to analyse and understand the administrative functions. As per the study
conducted, it has been observed that the capacity of production has increased and the
company is recovering from the fall in profits.
Since an organization is a human grouping in which work is done for the
accomplishment of some specific goals or mission, this organization is trying to remain
on top position by utilizing and maintaining its resources to maximum. Proper
management is a challenging job, and here in this organization proper administration and
social system are prevailing and it accounts for the strength of the organization on order
to attain its objective.
84

Rajagiri College of Management and Applied Sciences
REFERENCES AND BIBLIOGRAPHY
Books:
Shashi k.Gupta & Rosy Joshi(2010) Human Resource Management,
Kalayani Publications
L.R.Potti, Research Methodology, Yamuna Publications.
David A. Decenzo/Stephen P. Robins (2004) Personal and Human Resource
Management
A. Monappa (2004), Personal Management
Allan Pepper (1999) A Handbook on Training and Development
Web pages:
Powered by Compare InfoBase Limited, Retrieved October 18, 2012,from
www.naukrihub/trainingand development.com
www.google,com
TCC. tcckerala. Retrieved May 5, 2012, from www.tcckerala.com
www.wikipedia.org
85
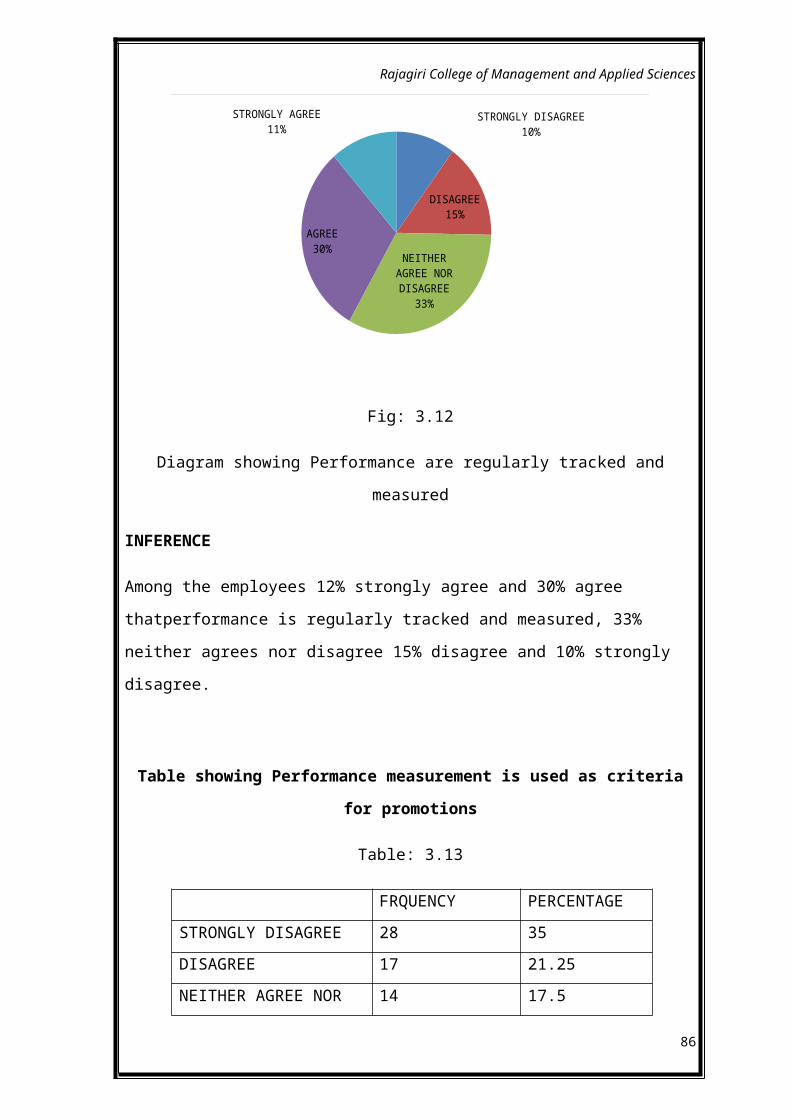
Rajagiri College of Management and Applied Sciences
APPENDIX
86

Rajagiri College of Management and Applied Sciences
QUESTIONNAIRE
Dear Sir/Madam,
I am doing a research work on Employees Training & Development. I would
request you kindly spare some time to fill up this questionnaire. Thank you very much
for your co-operation.
Name --------------------------------------------------
Designation-------------------------------------------
Department-------------------------------------------
Section I
Q1. Please mention your age
□ 20-25
□ 25-30
□ Above 30
Q2. Sex:
□ Male
□ Female
Q3. Marital Status:
□ Single
□ Married
□ Divorced
Q4. No. of years of experience:
□ Less than 3 years
□ 3 to 5 years
□ More than 5 years
Q5. Is this your first organization?
□ Yes
□ No
87

Rajagiri College of Management and Applied Sciences
Section II
NOTE: Please tick mark (√) the option you feel is most appropriate as per the following:
Rate on a scale of 1-5 to indicate your option, 1 being strongly disagree and 5 being
strongly agreed
Q1. You have the materials andEquipment that you
need to do your everyday work.1 2 3 4 5
Q2. You are performing a job that Match your skills1 2 3 4 5
Q3 You feels comfortable working with Your team
members1 2 3 4 5
Q4 Your organization has created Professional,
attractive work area That is functional and
promotes Productivity
1 2 3 4 5
Q5 The Company provides you a safe Work
environment by accident Prevention & safety
programs.
1 2 3 4 5
Q6 Performance goals are behavioral, Result-oriented
and achievable1 2 3 4 5
Q7 Performance is regularly tracked And measured1 2 3 4 5
Q8 Performance measurement is used As criteria for
promotions.1 2 3 4 5
Q9 A variety of training & development Programs are
offered to improve skills1 2 3 4 5
Q1
0
You feel attached with your company, Team &
other employees1 2 3 4 5
Q1
1
You has a supervisor who is Respectful and one
who inspires you 1 2 3 4 5
88

Rajagiri College of Management and Applied Sciences
Section III
Q1. If your organization identifies the training needs for the employees?
□ Yes
□ No
Q2. On an average, how much time did it used to take for training and development
Programme?
□ One Month
□ Two Month
□ Three Month
Q3. How much training programs has been made in the past one year?
□ One
□ Two
□ Three
Q4. Do you have any training programs in the coming financial year?
□ Yes
□ No
Q5. Does your top management take feedback?
□ Yes
□ No
Q6 Does the Executive Director engage development activities for him/herself?
□ Yes
□ No
Q7 Do you feel trust in your supervisors?
□ Yes
□ No
Q8 Do the practice's supervisors use positive attitude with employees?
□ Yes
□ No
89

Rajagiri College of Management and Applied Sciences
Q9 Does the practice have a consistent, timely and fair method for evaluating
individual Performance
□ Yes
□ No
Q10 Does your company use a specific training process?
□ Yes
□ No
Q11 Are office conditions comfortable?
□ Yes
□ No
Q12 Do you satisfy with organizational training and development Programme?
□ Yes
□ No
90