Embed Size (px)
Citation preview
CLEAN DEVELOPMENT MECHANISM SIMPLIFIED PROJECT DESIGN DOCUMENT
FOR SMALL SCALE PROJECT ACTIVITIES (SSC-PDD) Version 01 (21 January, 2003)
CONTENTS A. General description of project activity B. Baseline methodology C. Duration of the project activity / Crediting period D. Monitoring methodology and plan E. Calculation of GHG emission reductions by sources F. Environmental impacts G. Stakeholders comments Annexes Annex 1: Information on participants in the project activity Annex 2: Information regarding public funding Annex 3: Summary of the CEB expansion plan methodology
A. General Description of project activity A.1 Title of the project activity: Hapugastenne and Hulu Ganga Small Hydropower Projects.
A.2 Description of the project activity: This PDD presents a bundle of four (4) small-scale, run-of-river hydropower plants in Sri Lanka. The four plants represent four distinct investment projects at different locations and with start dates spanning a five year period. The rationale for grouping of the projects in one PDD is based on the fact that one company will build, own and operate all four facilities. The four hydropower plants, which range in size from 2.4 MW to 4.8 MW, have a combined capacity of 13.15 MW and an estimated output of 56.7 GWh/yr. The electricity from each of the hydropower plants will be sold to the monopoly government-owned utility in Sri Lanka, the Ceylon Electricity Board (CEB), through a standard power purchase agreement available to all renewable energy based power generators under 10 MW, including small hydropower. The CEB pays producers of renewable energy an amount (adjusted annually) based on short run avoided energy costs of operating thermal power stations. The payment is based on actual electricity generated by the small hydropower facilities and does not include a capacity charge. Currently, the marginal thermal power plants operate on fuel oil or diesel and the share of thermal power in Sri Lanka is expected to increase dramatically over the next ten years. The small hydropower projects do not figure in the CEB expansion plan, nor are they factored into the annual electricity supply-demand forecasts. Operation of these small hydropower plants will result in a displacement of electricity from the highest marginal cost thermal power stations. Applying the simplified methodologies specified for small-scale projects, these small hydropower projects will result in an annual emissions avoidance of 0.863 kilograms of CO2 equivalent per kilowatt hour generated (kg CO2e/kWh). This figure is based on the weighted average emissions of grid-connected thermal power stations operating as of August 2003. Other project benefits include reductions in NOx and SOx pollution, generation of short- and long-term local employment, and direct financial contributions to community development projects at each site. A.3 Project participants: This project has three project participants. Eco Power (Private) Limited (EPL) is a private Sri Lankan company that will build and operate the four small hydro power plants. EPL’s sole business activity is to build and operate small hydro power plants in Sri Lanka. Up to April 2003, the company had commissioned six (6) such plants with a combined total installed capacity of 14.5 MW. EPL is seeking registration of its small hydropower projects under the Clean Development Mechanism as a means to buffer the higher investment and financial risks associated with the renewables energy marketplace in Sri Lanka. International Resources Group (IRG), an energy and environmental management consulting firm, is the exclusive representative of EPL for the purposes of the marketing and sale of emissions reductions from
2
the four projects described in this document. IRG is also the designated official contact for the proposed CDM project activities. The IFC-Netherlands Carbon Facility (INCAF) Facility is an arrangement under which the International Finance Corporation (IFC) will purchase greenhouse gas (GHG) emission reductions for the benefit of the Government of the Netherlands using the Clean Development Mechanism. The Netherlands will use these emission reductions to help meet its commitments under the Kyoto Protocol. EPL and INCAF have entered into a preliminary agreement (a letter of intent) by which EPL agrees to sell and INCAF agrees to purchase eligible greenhouse gas emissions reductions associated with the projects described in this PDD. See Annex I for contact information of all project participants. A.4 Technical description of the project activity:
A.4.1 Location of the project activity A.4.1.1 Host country Party (ies): Sri Lanka
The Government of Sri Lanka ratified the UNFCCC on 23 November 1993. The country subsequently acceded to the Kyoto Protocol on September 3, 2002. The Government recently established its Designated National Authority, which is now registered with the CDM Executive Board. The DNA contact point is Dr. B M S Batagoda, Director, Environmental Economics and Global Affairs Division, Ministry of Environment and Natural Resources (Tel: 94-1-887452; e-mail: [email protected]; [email protected]).
A.4.1.2 Region/State/Province etc.:
For Hapugastenne Phase I and Phase II projects – Sabaragamuwa Province, Ratnapura District For Hulu Ganga I and Hulu Ganga II projects – Central Province, Kandy District
A.4.1.3 City/Town/Community etc:
For Hapugastenne Phase I and Phase II projects – Near the town of Ratnapura For Hulu Ganga I and Hulu Ganga II projects – Near the village of Panwila, north of the town of Kandy
A.4.1.4 Detailed description of the physical location allowing the unique
identification of the project activities:
Hapugastenne Phase I and Phase II Small Hydropower Projects are both located within close proximity of one another at the
3
Hapugastenne Estate. Both projects are found at the following coordinates: Longitude N 6o 42.1’ / Latitude E 80o 30.3’
The next two projects, although quite close, are also two distinct power generation facilities. They are located at the following coordinates:
Hulu Ganga Phase I Small Hydropower Project
Longitude N 7o 23.5’ / Latitude E 80o 44.8’ Hulu Ganga Phase II Small Hydropower Project Longitude N 7o23.3’ / Latitude E 80o 44.5’
A.4.2 Type and category(ies) and technology of project activity
The proposed projects fall under the category I.D., Renewable Electricity Generation for a Grid. All four of the project sites involve installation of a run-of-river hydropower plant system using well-established technologies. Run-of-river hydropower facilities are emissions-free and considered one of the best forms of low impact renewable energy available today. The civil structures at each project site consist of a gated weir designed to store a low volume of water, an intake arrangement, a channel, a desilting/forebay arrangement, a penstock, a powerhouse and a tailrace. Run-of-river hydropower has very low impact on river flow volumes and all water diverted to the powerhouse is returned to the main stream. The Hapugastenne projects run on a Pelton Turbine whereas the Hulu Ganga projects rely on a Francis type turbine. Both turbine types have well-demonstrated application around the world and are considered optimal for the particular sites being developed. Detailed engineering information on all four projects is available with the project operator, EPL. All electricity generated from these projects will be sold to the CEB, the monopoly government-owned power utility. The CEB will dispatch the electricity from the hydropower projects to end-users connected to the national power grid.
A.4.3 Brief statement on how anthropogenic emissions of greenhouse gases (GHGs)
by sources are to be reduced by the proposed CDM project activity: The projects will result in a reduction of anthropogenic emissions of greenhouse gas by displacing an equivalent volume of electricity that would otherwise be generated by the most expensive thermal power plants tied into the national grid. This expected outcome can be traced back to the expansion plans, dispatch procedures, and small power purchase policies of the Ceylon Electricity Board. These plans, procedures and policies are discussed in greater detail in Section B of the PDD. Each year, the CEB prepares an annual energy demand forecast for each of the 8,760 hours in a year. The CEB determines the power supply forecast based on strict merit order beginning with the power plant with the lowest generation cost per kilowatt hour. Small-scale renewables, including the projects in this PDD, are not included in the supply forecast. Instead, the CEB buys small hydropower output and other small-scale renewable energy generation as a substitute for its
4
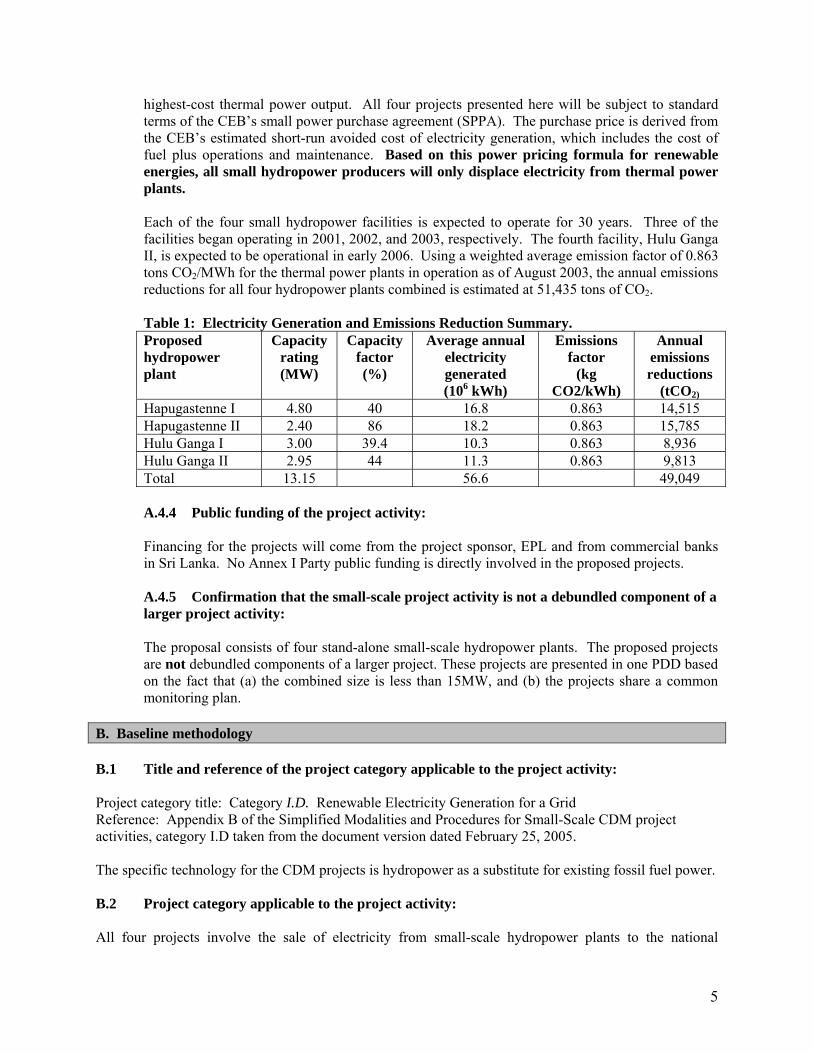
highest-cost thermal power output. All four projects presented here will be subject to standard terms of the CEB’s small power purchase agreement (SPPA). The purchase price is derived from the CEB’s estimated short-run avoided cost of electricity generation, which includes the cost of fuel plus operations and maintenance. Based on this power pricing formula for renewable energies, all small hydropower producers will only displace electricity from thermal power plants. Each of the four small hydropower facilities is expected to operate for 30 years. Three of the facilities began operating in 2001, 2002, and 2003, respectively. The fourth facility, Hulu Ganga II, is expected to be operational in early 2006. Using a weighted average emission factor of 0.863 tons CO2/MWh for the thermal power plants in operation as of August 2003, the annual emissions reductions for all four hydropower plants combined is estimated at 51,435 tons of CO2. Table 1: Electricity Generation and Emissions Reduction Summary. Proposed hydropower plant
Capacity rating (MW)
Capacity factor (%)
Average annual electricity generated (106 kWh)
Emissions factor
(kg CO2/kWh)
Annual emissions reductions
(tCO2)
Hapugastenne I 4.80 40 16.8 0.863 14,515 Hapugastenne II 2.40 86 18.2 0.863 15,785 Hulu Ganga I 3.00 39.4 10.3 0.863 8,936 Hulu Ganga II 2.95 44 11.3 0.863 9,813 Total 13.15 56.6 49,049 A.4.4 Public funding of the project activity: Financing for the projects will come from the project sponsor, EPL and from commercial banks in Sri Lanka. No Annex I Party public funding is directly involved in the proposed projects. A.4.5 Confirmation that the small-scale project activity is not a debundled component of a larger project activity: The proposal consists of four stand-alone small-scale hydropower plants. The proposed projects are not debundled components of a larger project. These projects are presented in one PDD based on the fact that (a) the combined size is less than 15MW, and (b) the projects share a common monitoring plan.
B. Baseline methodology B.1 Title and reference of the project category applicable to the project activity: Project category title: Category I.D. Renewable Electricity Generation for a Grid Reference: Appendix B of the Simplified Modalities and Procedures for Small-Scale CDM project activities, category I.D taken from the document version dated February 25, 2005. The specific technology for the CDM projects is hydropower as a substitute for existing fossil fuel power. B.2 Project category applicable to the project activity: All four projects involve the sale of electricity from small-scale hydropower plants to the national
5
monopoly grid manager, the Ceylon Electricity Board. This scenario is the only option available to the project developer and it corresponds precisely with the SSC CDM category I.D. B.3 Description of how the anthropogenic GHG emissions by sources are reduced below those that would have occurred in the absence of the proposed CDM project activity (i.e. explanation of how and why this project is additional and therefore not identifical with the baseline scenario)
Power generation capacity expansion is an urgent issue in Sri Lanka. Energy demand in the country has been growing at an average rate of about 7-8% per annum in the past 20 years, a trend that is expected to accelerate over the next decade. According to the CEB, further exploitation of large hydro resources is becoming increasingly difficult owing to social and/or environmental impacts associated with large-scale developments. In addition, the extensive reliance on hydropower makes the power system of this island nation overly vulnerable to drought. Severe drought led to power cuts in 2001 and the CEB has expressed its concern that cuts could occur again in the absence of capacity expansion. The CEB is the government-owned monopoly power utility that prepares and manages the implementation of the country’s power generation expansion plan. To meet the rapid growth in energy demand, the CEB expansion plan forecasts the addition of 2,690 MW in installed capacity between 2002 and 2016. The generation expansion plan takes into consideration contributions from existing and committed power facilities, and identifies additional capacity needs to meet future energy demand at the least possible generation cost. While the existing generating system is predominantly based on hydro power (69% of installed capacity), the base case expansion plan focuses on growth in thermal power. Specifically, it includes only 220 MW of hydro power additions (in 2004 and 2008) and 2,470 MW of thermal power additions. Annex II summarizes the data, methods and results of the CEB expansion plan.
The potential for small scale hydropower to access the marketplace in Sri Lanka is restricted by the fact that CEB controls access to and the terms for power production. The CEB is the major owner and operator of most power plants in Sri Lanka and is responsible for issuance of power production licenses. All power generation licenses specify that output must be sold to the CEB. Over the past five-seven years, the CEB has increasingly turned towards commissioning power plants on build, operate, own and transfer (BOOT) contracts with private operators. Note that all BOOT contracts have been for the construction of thermal power plant facilities. The CEB nevertheless maintains control of the process of identifying and licensing these new facilities. Similarly, all small-scale projects must have the pre-approval of the CEB and developers must accept the CEB’s energy purchase price that changes annually -- not based on verifiable, objective criteria, but rather changes in accordance with the CEB internal calculations. This discussion serves to highlight the dominating role of the CEB in setting the specific market and policy conditions for sector expansion. Given the tremendous growth in electricity demand, the CEB has instituted a number of policies and practices that strongly favor investments in thermal generation combined with only two new investments in large-scale, publicly-managed hydropower facilities. As the rest of this section demonstrates, the four small-scale hydropower projects in this PDD are considered additional to the Sri Lanka energy sector emissions baseline based on an analysis of selected barriers listed in Attachment A to Appendix B, the simplified project design document for small-scale CDM project activities (SSC-PDD). Specifically, we demonstrate that the projects face significant barriers related to (i) heightened investment risk (common to all small-scale renewable investments in Sri Lanka), (ii) low market penetration of run-of-river small hydropower technology, and (iii) non-transparent procedures in the calculation of tariff schedules for small hydropower operators.
(i) investment risk barrier
6
Energy generation investment opportunity in Sri Lanka is relatively limited. In that limited market, small hydropower investments are subject to much higher risks than investments in thermal power projects. The difference in levels of risk are in large part linked to the power purchase terms set by the CEB. In the case of thermal power plants the CEB pays a capacity charge sufficient to cover all up-front capital costs including an agreed rate of return on the investment. In addition, separate payments are made for energy on a pass through basis. Thus, private thermal power plant operators and investors are guaranteed a no risk rate of return on their investment provided the technical aspects of the plant are sound. In contrast, investors and operators of small hydropower facilities (and other small renewables) do not receive a capacity charge. Instead, small hydropower developers are paid based strictly on the CEB's short-run avoided costs. These avoided costs can fluctuate considerably from year to year and small hydro developers can and have in the past suffered losses in individual years. Unlike thermal power plant operators, small hydropower investors cannot claim a payment to compensate for drought-induced generation shortfalls. These arrangements act as a disincentive to investments in small-scale hydropower and argue for the additionality of the EPL investments at Hapugastenne and Hulu Ganga. (ii) Low market penetration/uncommon practice barrier Previous studies conclude that the country has limited potential for small-scale hydropower (100-200 MW). A World Bank project document notes that installed small hydropower was 30 MW at the end of 2001, which is equal to less than 2% of total capacity in the country. Looking at the impact of the four projects in this PDD, it is clear that they make very marginal contributions to the current and future generation mix. For example, the four projects in this PDD will generate a combined 56.6 GWh/year, which corresponds to only 0.82% of the national annual electricity generation of 6,843 GWh in 2000, and a mere 0.39% of the total capacity of 14,278 GWh forecast in 2012. With an aggressive schedule for future expansion of thermal power capacity, small scale hydropower will continue to be a marginal technology in Sri Lanka with low market penetration, unless CDM revenues enable small hydro developers to take on the higher risks associated with investing in small run of river hydro plants. (iii) barriers related to uncertainties in power purchase agreement conditions
Small-scale hydropower investors like EPL also face uncertainties and risks related to power purchase terms of the CEB, a monopoly utility. Each year the CEB sets a power purchase agreement price level for the wet and dry seasons. That figure is based on a 3-year running average of avoided costs. However, the CEB does not transparently demonstrate to small power producers the methodology for calculating these rolling averages. As a result, private investors have considerable difficulty predicting the direction of price changes and the degree of fluctuation from one year to the next. For example, the CEB recently announced the 2004 prices for small hydro independent power producers. Despite one of the worst droughts in decades and a steep rise in oil prices, the CEB reduced the tariff 28% below its 2003 level. The only recourse is for producers to enter into arbitration over rate calculations. However, EPL has learned from experience that arbitration can easily continue, with no resolution, for several years. This analysis of three different barriers suggests that small hydropower investments like the ones at Hapugastenne and Hulu Ganga are additional to a national baseline which is clearly oriented to favor large-scale thermal investments combined with a limited number of large-scale, publicly managed hydropower investments. Faced with the multiple investment barriers described here, EPL began in early 2000 to evaluate the possibility of improving project rates of return and reducing its financial risks through registration of its projects under the CDM.
7
B.4 Description of the project boundary for the project activity: The boundaries for the four projects encompass the physical, geographical site of the four hydropower plants. B.5 Details of the baseline and its development: B.5.1 Specify the baseline for the proposed project activity using a methodology specified in
the applicable project category for small-scale CDM project activities contained in appendix B of the simplified M&P for small-scale CDM project activities:
The CEB, as a monopoly entity that controls the country’s power grid, prepares annual demand and supply forecasts, manages most power generation facilities in Sri Lanka (except for thermal power plants introduced in the past eight years), sets the terms of small power purchase agreements and leads development of grid expansion plans. The expansion plan (updated every two years) is designed to respond to two key concerns. First, electricity demand in Sri Lanka is growing at an average annual rate of 7-8%, which will require major investments in new generation facilities over the next decade. Second, further exploitation of large scale hydro resources (which have historically provided a large percentage of total power) is becoming increasingly difficult owing to social and/or environmental impacts associated with such developments. The CEB’s 2002-2016 national expansion plan, therefore turns to thermal power plants as the primary solution to meeting the country’s growing energy needs. Specifically, the CEB forecasts thermal power generation capacity to increase from its 2002 level of 751 MW to a target level of 2,754 MW in 2016. This forecast reflects a steady trend of increasing reliance on thermal power sources since the late 1990s. For example, between 1997 and 2003, the country added 724 MW of thermal power generation capacity. On the other hand, facilities less than 15 MW in size, which includes the small hydropower plants described in this PDD, are not incorporated into the national expansion plan. So, all small hydropower and other renewables are not part of the default power generation baseline. Baseline uncertainties and alternative scenarios. Based on the facts regarding how CEB prepares and guides both the dispatch of current energy supply as well as the options for future energy investments, the most likely baseline scenario in Sri Lanka is the one that conforms to the CEB’s current generation mix plus the base case expansion plan. The major uncertainties related to this scenario are (i) emergency conditions that lead to generation short-falls and power outages; and (ii) delays in building new power generation facilities. Either of these scenarios is likely to increase average emissions levels because (a) older, higher emissions thermal power plants will have to be used longer and for more operating hours per year, and (b) emergency diesel generators will be required to overcome generation shortfalls. A third possible scenario is a substantial increase in small-scale renewable energy or a greater investment in large-scale hydropower. However, as the earlier discussion emphasized, small-scale hydropower and wind power have very limited potential (100-200 MW for small-scale hydropower) compared to the total expected growth in generation over the next 15 years. Similarly, the country has nearly exhausted its options for large-scale hydropower because of environmental and social concerns. The latest version of the small-scale CDM project guidelines issued on January 24, 2003, offers two options for calculating baseline emissions of category I.D. projects. The baseline for the Hapugastenne and Hulu Ganga projects is based on the second option identified in Appendix B of the simplified modalities and procedures for small-scale CDM. According to this option the baseline is defined as the kWh produced by the small hydropower plants multiplied by an emission coefficient (measured in KgCO2/kWh) calculated in a transparent and conservative manner as follows:
8
The average of the “approximate operating margin” and the “build margin: where:
(i) The “approximate operating margin” is the weighted average emissions (in kg CO2equ/kWh) of all generating sources serving the system, excluding hydro, geothermal, wind, low-cost biomass, nuclear and solar generation;
(ii) The “build margin” is the weighted average emissions (in kg CO2equ/kWh) of recent capacity additions to the system, which capacity additions are defined as the greater (in MWh) of most recent 20% of existing plants or the 5 most recent plants.
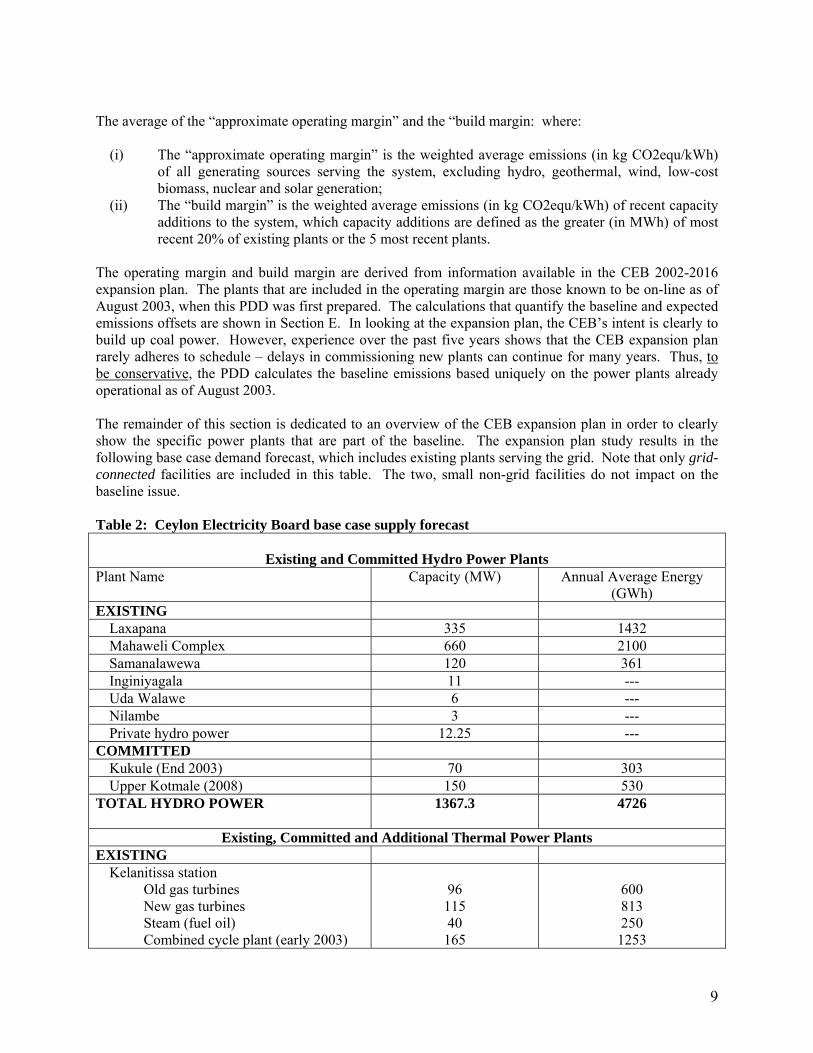
The operating margin and build margin are derived from information available in the CEB 2002-2016 expansion plan. The plants that are included in the operating margin are those known to be on-line as of August 2003, when this PDD was first prepared. The calculations that quantify the baseline and expected emissions offsets are shown in Section E. In looking at the expansion plan, the CEB’s intent is clearly to build up coal power. However, experience over the past five years shows that the CEB expansion plan rarely adheres to schedule – delays in commissioning new plants can continue for many years. Thus, to be conservative, the PDD calculates the baseline emissions based uniquely on the power plants already operational as of August 2003. The remainder of this section is dedicated to an overview of the CEB expansion plan in order to clearly show the specific power plants that are part of the baseline. The expansion plan study results in the following base case demand forecast, which includes existing plants serving the grid. Note that only grid-connected facilities are included in this table. The two, small non-grid facilities do not impact on the baseline issue. Table 2: Ceylon Electricity Board base case supply forecast
Existing and Committed Hydro Power Plants
Plant Name Capacity (MW) Annual Average Energy (GWh)
EXISTING Laxapana 335 1432 Mahaweli Complex 660 2100 Samanalawewa 120 361 Inginiyagala 11 --- Uda Walawe 6 --- Nilambe 3 --- Private hydro power 12.25 ---
COMMITTED Kukule (End 2003) 70 303 Upper Kotmale (2008) 150 530
TOTAL HYDRO POWER
1367.3 4726
Existing, Committed and Additional Thermal Power Plants EXISTING
Kelanitissa station Old gas turbines New gas turbines Steam (fuel oil) Combined cycle plant (early 2003)
96
115 40
165
600 813 250
1253
9
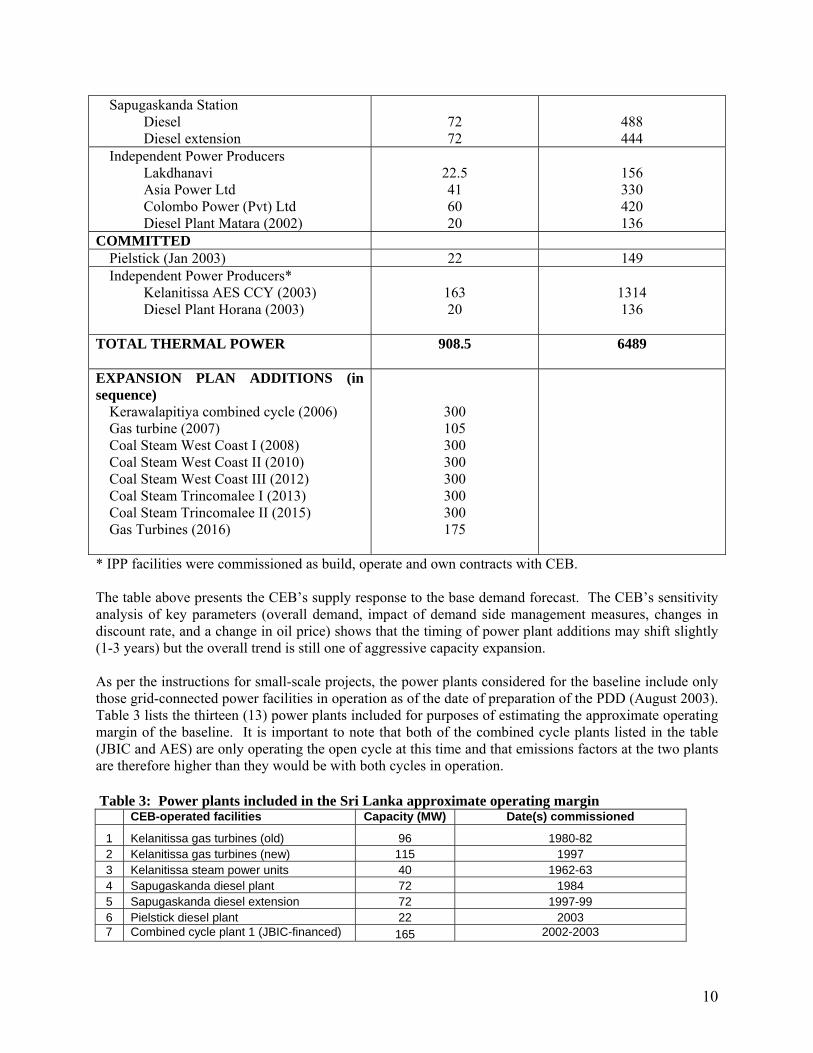
Sapugaskanda Station Diesel Diesel extension
72 72
488 444
Independent Power Producers Lakdhanavi Asia Power Ltd Colombo Power (Pvt) Ltd Diesel Plant Matara (2002)
22.5 41 60 20
156 330 420 136
COMMITTED Pielstick (Jan 2003) 22 149 Independent Power Producers*
Kelanitissa AES CCY (2003) Diesel Plant Horana (2003)
163 20
1314 136
TOTAL THERMAL POWER
908.5 6489
EXPANSION PLAN ADDITIONS (in sequence)
Kerawalapitiya combined cycle (2006) Gas turbine (2007) Coal Steam West Coast I (2008) Coal Steam West Coast II (2010) Coal Steam West Coast III (2012) Coal Steam Trincomalee I (2013) Coal Steam Trincomalee II (2015) Gas Turbines (2016)
300 105 300 300 300 300 300 175
* IPP facilities were commissioned as build, operate and own contracts with CEB. The table above presents the CEB’s supply response to the base demand forecast. The CEB’s sensitivity analysis of key parameters (overall demand, impact of demand side management measures, changes in discount rate, and a change in oil price) shows that the timing of power plant additions may shift slightly (1-3 years) but the overall trend is still one of aggressive capacity expansion. As per the instructions for small-scale projects, the power plants considered for the baseline include only those grid-connected power facilities in operation as of the date of preparation of the PDD (August 2003). Table 3 lists the thirteen (13) power plants included for purposes of estimating the approximate operating margin of the baseline. It is important to note that both of the combined cycle plants listed in the table (JBIC and AES) are only operating the open cycle at this time and that emissions factors at the two plants are therefore higher than they would be with both cycles in operation. Table 3: Power plants included in the Sri Lanka approximate operating margin
CEB-operated facilities Capacity (MW) Date(s) commissioned
1 Kelanitissa gas turbines (old) 96 1980-82 2 Kelanitissa gas turbines (new) 115 1997 3 Kelanitissa steam power units 40 1962-63 4 Sapugaskanda diesel plant 72 1984 5 Sapugaskanda diesel extension 72 1997-99 6 Pielstick diesel plant 22 2003
7 Combined cycle plant 1 (JBIC-financed) 165 2002-2003
10
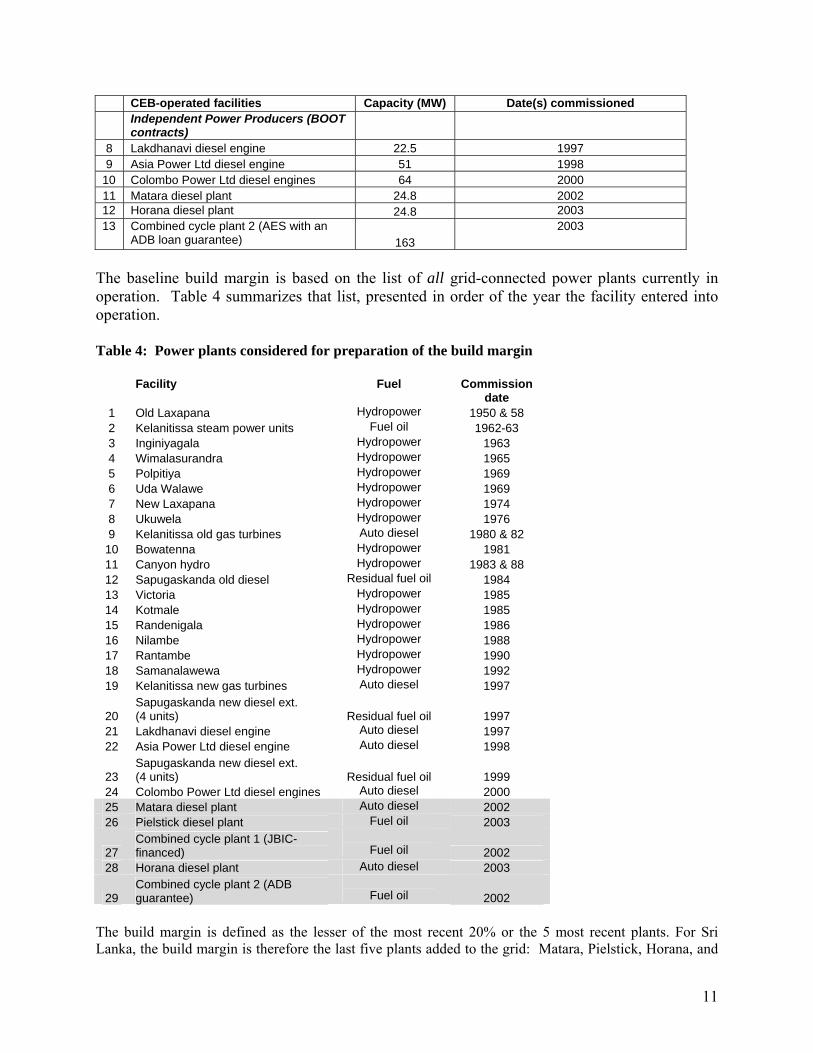
CEB-operated facilities Capacity (MW) Date(s) commissioned
Independent Power Producers (BOOT contracts)
8 Lakdhanavi diesel engine 22.5 1997 9 Asia Power Ltd diesel engine 51 1998
10 Colombo Power Ltd diesel engines 64 2000 11 Matara diesel plant 24.8 2002 12 Horana diesel plant 24.8 2003 13 Combined cycle plant 2 (AES with an
ADB loan guarantee) 163 2003
The baseline build margin is based on the list of all grid-connected power plants currently in operation. Table 4 summarizes that list, presented in order of the year the facility entered into operation. Table 4: Power plants considered for preparation of the build margin Facility Fuel Commission
date 1 Old Laxapana Hydropower 1950 & 58 2 Kelanitissa steam power units Fuel oil 1962-63 3 Inginiyagala Hydropower 1963 4 Wimalasurandra Hydropower 1965 5 Polpitiya Hydropower 1969 6 Uda Walawe Hydropower 1969 7 New Laxapana Hydropower 1974 8 Ukuwela Hydropower 1976 9 Kelanitissa old gas turbines Auto diesel 1980 & 82
10 Bowatenna Hydropower 1981 11 Canyon hydro Hydropower 1983 & 88 12 Sapugaskanda old diesel Residual fuel oil 1984 13 Victoria Hydropower 1985 14 Kotmale Hydropower 1985 15 Randenigala Hydropower 1986 16 Nilambe Hydropower 1988 17 Rantambe Hydropower 1990 18 Samanalawewa Hydropower 1992 19 Kelanitissa new gas turbines Auto diesel 1997
20 Sapugaskanda new diesel ext. (4 units) Residual fuel oil 1997
21 Lakdhanavi diesel engine Auto diesel 1997 22 Asia Power Ltd diesel engine Auto diesel 1998
23 Sapugaskanda new diesel ext. (4 units) Residual fuel oil 1999
24 Colombo Power Ltd diesel engines Auto diesel 2000 25 Matara diesel plant Auto diesel 2002 26 Pielstick diesel plant Fuel oil 2003
27 Combined cycle plant 1 (JBIC-financed)
Fuel oil 2002
28 Horana diesel plant Auto diesel 2003
29 Combined cycle plant 2 (ADB guarantee)
Fuel oil 2002
The build margin is defined as the lesser of the most recent 20% or the 5 most recent plants. For Sri Lanka, the build margin is therefore the last five plants added to the grid: Matara, Pielstick, Horana, and
11
two combined cycle power plants (shown in grey in Table 4). Section E applies this baseline list of power plants to calculate the expected GHG emissions reductions associated with the four small hydropower projects. B.5.2 Date of completing the final draft of this baseline section : The final draft of the baseline was completed on September 20, 2003. A revised presentation of the baseline was completed on June 24, 2004. B.5.3 Name of person/entity determining the baseline: Andrew Keck International Resources Group (IRG) 8455 Colesville Road Suite 1225 Silver Spring, MD 20910 USA Telephone: 301-608-3666, extension 316 Fax: 301-608-3667 E-mail: [email protected] and Dr. Romesh Bandaranaike Eco Power (Private) Limited 21 Gower Street Colombo, Sri Lanka Telephone: 94 (0) 74-513470 / 1 / 2 e-mail: [email protected]
Mr. Keck is an employee of IRG, one of the project participants listed in Annex 1 of this document. Dr. Bandaranaike is the CEO of EPL and is also listed as a project participant in Annex 1.
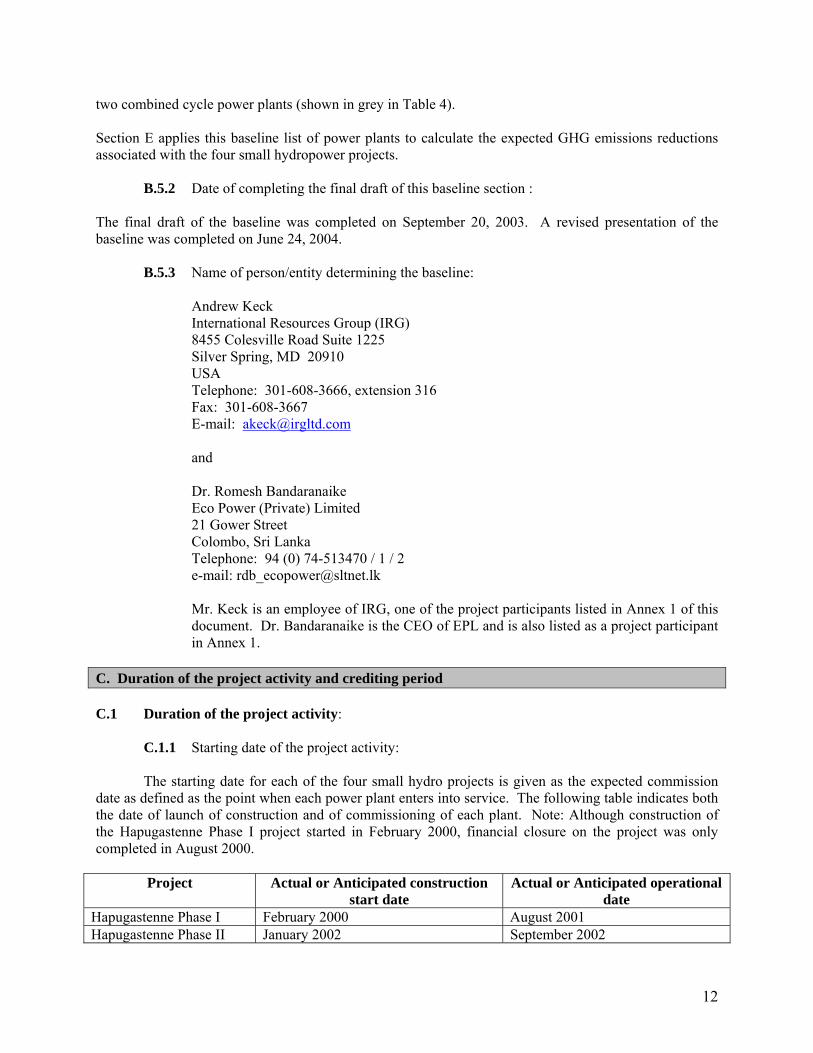
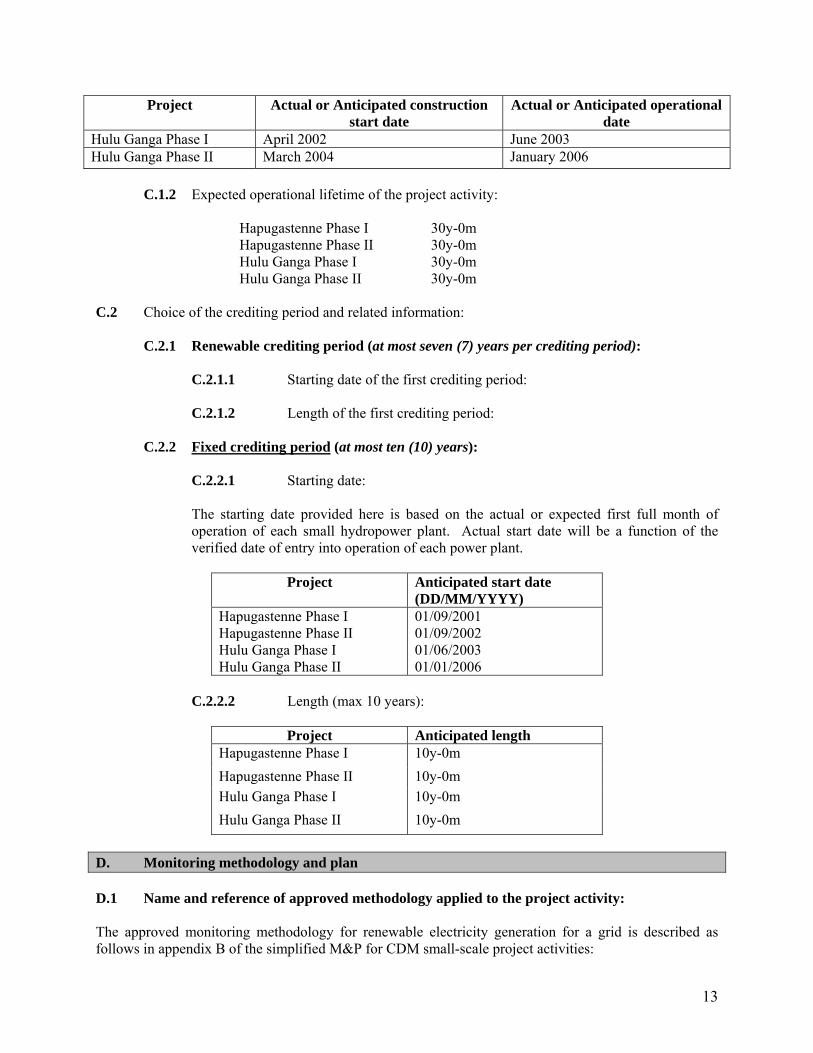
C. Duration of the project activity and crediting period C.1 Duration of the project activity: C.1.1 Starting date of the project activity: The starting date for each of the four small hydro projects is given as the expected commission date as defined as the point when each power plant enters into service. The following table indicates both the date of launch of construction and of commissioning of each plant. Note: Although construction of the Hapugastenne Phase I project started in February 2000, financial closure on the project was only completed in August 2000.
Project Actual or Anticipated construction start date
Actual or Anticipated operational date
Hapugastenne Phase I February 2000 August 2001 Hapugastenne Phase II January 2002 September 2002
12
Project Actual or Anticipated construction start date
Actual or Anticipated operational date
Hulu Ganga Phase I April 2002 June 2003 Hulu Ganga Phase II March 2004 January 2006 C.1.2 Expected operational lifetime of the project activity:
Hapugastenne Phase I 30y-0m Hapugastenne Phase II 30y-0m Hulu Ganga Phase I 30y-0m Hulu Ganga Phase II 30y-0m
C.2 Choice of the crediting period and related information: C.2.1 Renewable crediting period (at most seven (7) years per crediting period): C.2.1.1 Starting date of the first crediting period: C.2.1.2 Length of the first crediting period: C.2.2 Fixed crediting period (at most ten (10) years): C.2.2.1 Starting date:
The starting date provided here is based on the actual or expected first full month of operation of each small hydropower plant. Actual start date will be a function of the verified date of entry into operation of each power plant.
Project
Anticipated start date (DD/MM/YYYY)
Hapugastenne Phase I Hapugastenne Phase II Hulu Ganga Phase I Hulu Ganga Phase II
01/09/2001 01/09/2002 01/06/2003 01/01/2006
C.2.2.2 Length (max 10 years):
Project Anticipated length Hapugastenne Phase I 10y-0m Hapugastenne Phase II 10y-0m Hulu Ganga Phase I 10y-0m Hulu Ganga Phase II 10y-0m
D. Monitoring methodology and plan
D.1 Name and reference of approved methodology applied to the project activity: The approved monitoring methodology for renewable electricity generation for a grid is described as follows in appendix B of the simplified M&P for CDM small-scale project activities:
13
14
“Monitoring shall consist of metering the electricity generated by the renewable technology.” This precise methodology will be applied to all four of the EPL small hydropower projects in this PDD. D.2. Justification of the choice of the methodology and why it is applicable to the project activity: The choice of methodology reflects the exact recommendations of appendix B for projects that generate renewable energy to a grid. The four small hydropower projects will generate energy that will service the national grid in Sri Lanka.
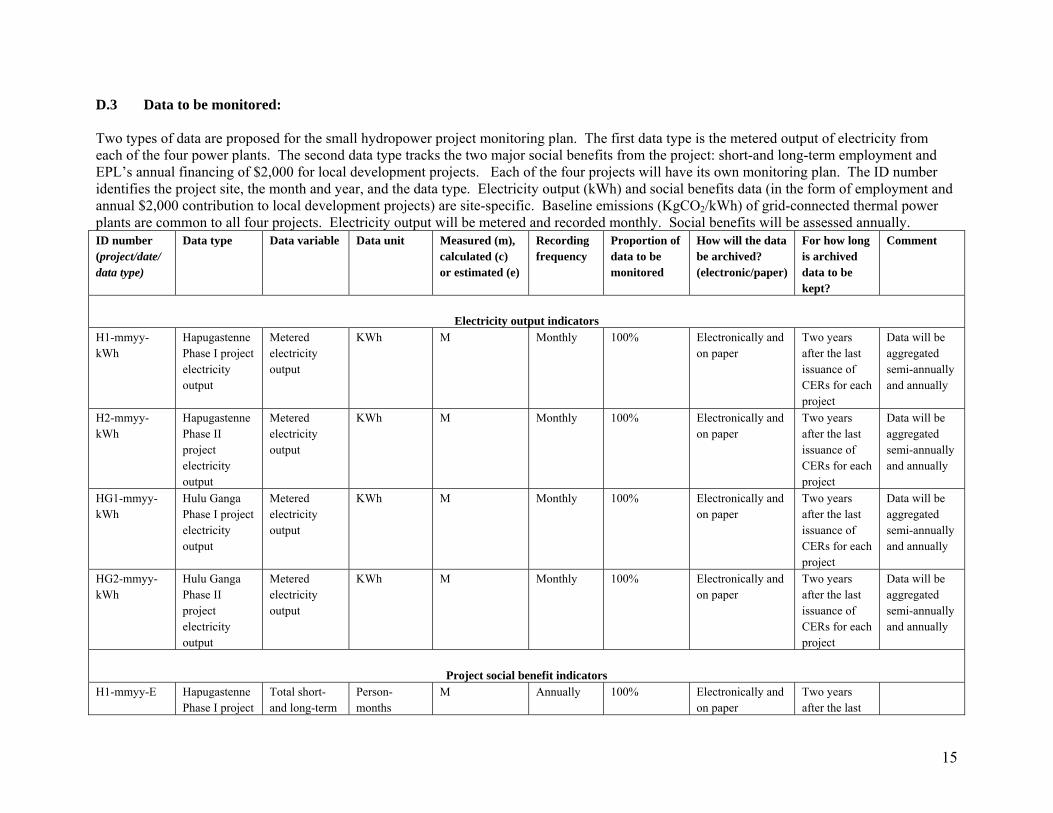
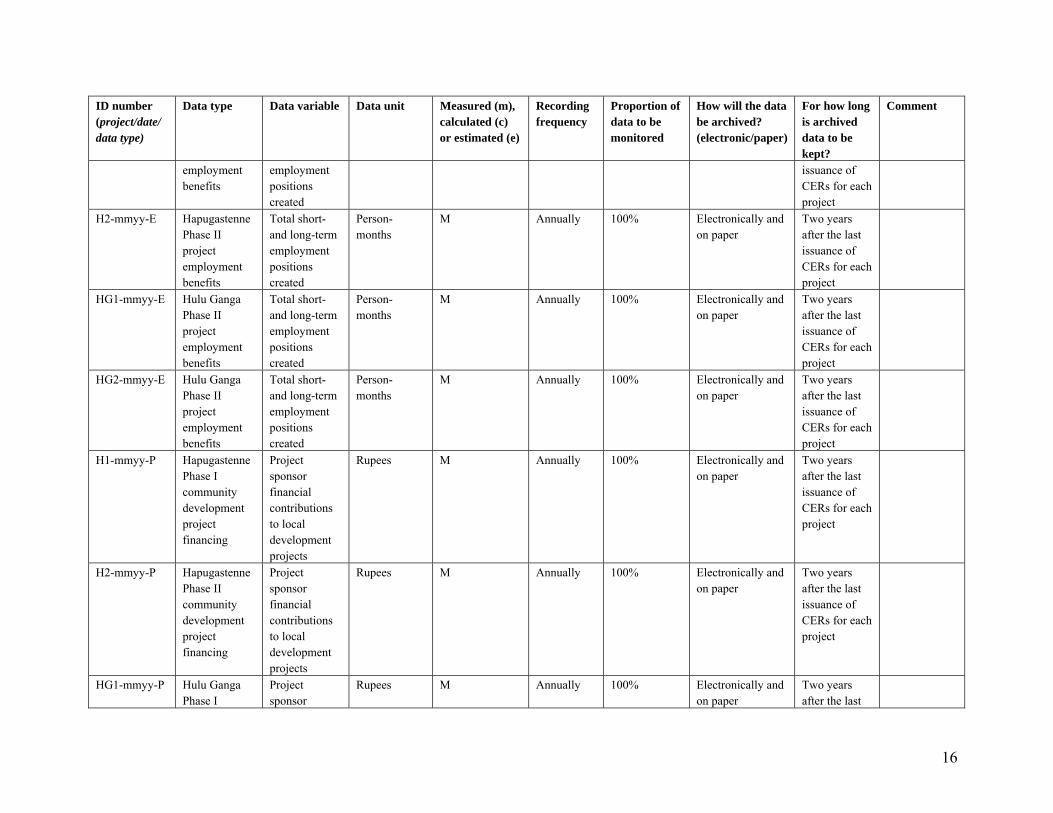
D.3 Data to be monitored: Two types of data are proposed for the small hydropower project monitoring plan. The first data type is the metered output of electricity from each of the four power plants. The second data type tracks the two major social benefits from the project: short-and long-term employment and EPL’s annual financing of $2,000 for local development projects. Each of the four projects will have its own monitoring plan. The ID number identifies the project site, the month and year, and the data type. Electricity output (kWh) and social benefits data (in the form of employment and annual $2,000 contribution to local development projects) are site-specific. Baseline emissions (KgCO2/kWh) of grid-connected thermal power plants are common to all four projects. Electricity output will be metered and recorded monthly. Social benefits will be assessed annually. ID number (project/date/ data type)
Data type Data variable Data unit Measured (m), calculated (c) or estimated (e)
Recording frequency
Proportion of data to be monitored
How will the data be archived? (electronic/paper)
For how long is archived data to be kept?
Comment
Electricity output indicators
H1-mmyy-kWh
Hapugastenne Phase I project electricity output
Metered electricity output
KWh M Monthly 100% Electronically andon paper
Two years after the last issuance of CERs for each project
Data will be aggregated semi-annually and annually
H2-mmyy-kWh
Hapugastenne Phase II project electricity output
Metered electricity output
KWh M Monthly 100% Electronically andon paper
Two years after the last issuance of CERs for each project
Data will be aggregated semi-annually and annually
HG1-mmyy-kWh
Hulu Ganga Phase I project electricity output
Metered electricity output
KWh M Monthly 100% Electronically andon paper
Two years after the last issuance of CERs for each project
Data will be aggregated semi-annually and annually
HG2-mmyy-kWh
Hulu Ganga Phase II project electricity output
Metered electricity output
KWh M Monthly 100% Electronically andon paper
Two years after the last issuance of CERs for each project
Data will be aggregated semi-annually and annually
Project social benefit indicators
H1-mmyy-E HapugastennePhase I project
Total short- and long-term
Person-months
M Annually 100% Electronically andon paper
Two years after the last
15
ID number (project/date/ data type)
Data type Data variable Data unit Measured (m), calculated (c) or estimated (e)
Recording frequency
Proportion of data to be monitored
How will the data be archived? (electronic/paper)
For how long is archived data to be kept?
Comment
employment benefits
employment positions created
issuance of CERs for each project
H2-mmyy-E HapugastennePhase II project employment benefits
Total short- and long-term employment positions created
Person-months
M Annually 100% Electronically andon paper
Two years after the last issuance of CERs for each project
HG1-mmyy-E Hulu GangaPhase II project employment benefits
Total short- and long-term employment positions created
Person-months
M Annually 100% Electronically andon paper
Two years after the last issuance of CERs for each project
HG2-mmyy-E Hulu GangaPhase II project employment benefits
Total short- and long-term employment positions created
Person-months
M Annually 100% Electronically andon paper
Two years after the last issuance of CERs for each project
H1-mmyy-P HapugastennePhase I community development project financing
Project sponsor financial contributions to local development projects
Rupees M Annually 100% Electronically andon paper
Two years after the last issuance of CERs for each project
H2-mmyy-P HapugastennePhase II community development project financing
Project sponsor financial contributions to local development projects
Rupees M Annually 100% Electronically andon paper
Two years after the last issuance of CERs for each project
HG1-mmyy-P Hulu GangaPhase I
Project sponsor
Rupees M Annually 100% Electronically andon paper
Two years after the last
16
17
r project/date/
Data type Data variable Data unit Measured (m), calculated (c) or estimated (e)
Recording frequency
Proportion of data to be monitored
How will the data be archived? (electronic/paper)
For how long is archived data to be kept?
Comment
ID numbe(data type)
community development project financing
financial contributions to local development projects
issuance of CERs for each project
HG2-mmyy-P Hulu GangaPhase II community development project financing
Project sponsor financial contributions to local development projects
Rupees M Annually 100% Electronically andon paper
Two years after the last issuance of CERs for each project
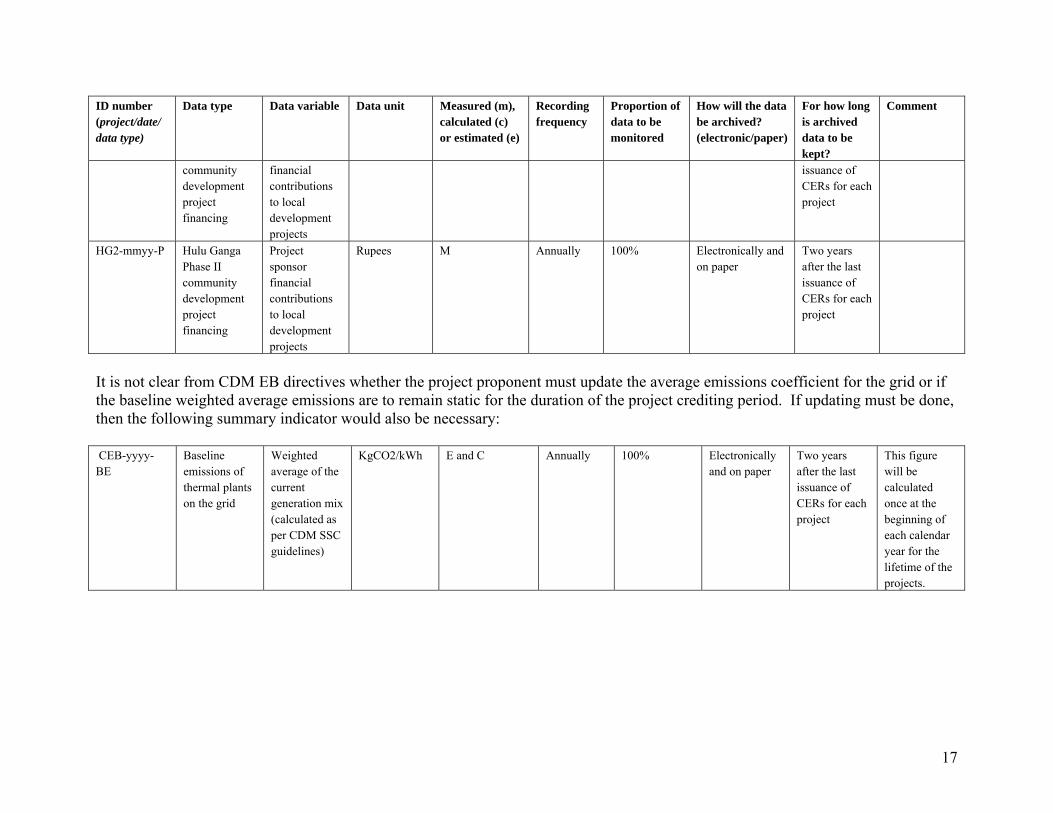
It is not clear from CDM EB directives whether the project proponent must update the average emissions coefficient for the grid or if the baseline weighted average emissions are to remain static for the duration of the project crediting period. If updating must be done, then the following summary indicator would also be necessary:
CEB-yyyy-BE
Baseline emissions of thermal plants on the grid
Weighted average of the current generation mix (calculated as per CDM SSC guidelines)
KgCO2/kWh E and C Annually 100% Electronically and on paper
Two years after the last issuance of CERs for each project
This figure will be calculated once at the beginning of each calendar year for the lifetime of the projects.
Monitoring procedures and responsibilities. The EPL projects are remarkably simple to monitor. The key point is that the only quantitative figure that requires monitoring is the actual generation of electricity from each project site. The steps to ensure this is done correctly are as follows. First, upon completion of construction, the CEB, as the purchaser of EPL’s power, requires an independent testing of the Facility and an inspection of its equipment. The CEB witnesses the testing procedure. Second, the CEB installs and maintains a primary meter for purposes of billing and payment to EPL. The Metering Equipment is located in close proximity to the Facility and is sealed. Third, the equipment is tested and calibrated annually. Both parties also have the right to request a calibration at any time if they believe that the meter is dysfunctional. For monitoring purposes, the project will conform the standard schedule negotiated with the CEB. This involves a CEB reading of the meter at the end of each month for determination of the electrical energy delivered to and accepted by CEB under the terms of the SPPA. EPL power plant operators back this information up by taking daily (sometimes hourly) readings of generation levels and recording them on site. Monitoring data adjustments and uncertainties can only arise if the CEB does not read the meter precisely on the same date each month. In the case of payment of energy supplied, this is handled by the CEB by pro-rating the reading for the number of days in the relevant month. The same approach can be use for emissions reductions. There is no need for special monitoring training of EPL personnel. The power plants are all automatic and the operators take down periodic readings. If there is some problem with operation, the operator contacts a senior engineer over the phone. In addition, emergencies cannot cause unintended emissions since there is no fuel used by the plants. In the event of a shut-down of the grid, the hydropower facility will automatically switch off and water will no longer be diverted to the turbine. At the point of project verification, records of electricity generation, meter calibration and CEB power purchase receipts will be available at EPL’s offices in Colombo. The verifier will also be invited to visit individual project sites to confirm the status of operations. The EPL CEO will have direct responsibility for ensuring adherence to and review of compliance with these procedures. IRG will be responsible for assisting EPL in finalizing the data reporting and recording process and in responding to any issues or corrective actions identified by the project verifier. D.4 Name of person/entity determining the monitoring methodology: Andrew Keck International Resources Group (IRG) 8455 Colesville Road Suite 1225 Silver Spring, MD 20910 USA Telephone: 301-608-3666, extension 316 Fax: 301-608-3667 E-mail: [email protected] Mr. Keck is an employee of IRG, one of the project participants listed in annex 1 of this document. E. Calculation of GHG emission reductions by sources E.1 Formulae used:
18
E.1.1 Selected formulae as provided in appendix B:
Calculation of the EPL project GHG emissions reductions apply a weighted average emissions factor for all thermal plants that are operational on the national grid as of August 2003. Appendix B of the simplified M&P for CDM small-scale project activities does not provide specific formulae for this calculation. See Section E.1.2 for a description of variables and formulae used.
E.1.2 Description of formulae when not provided in appendix B:
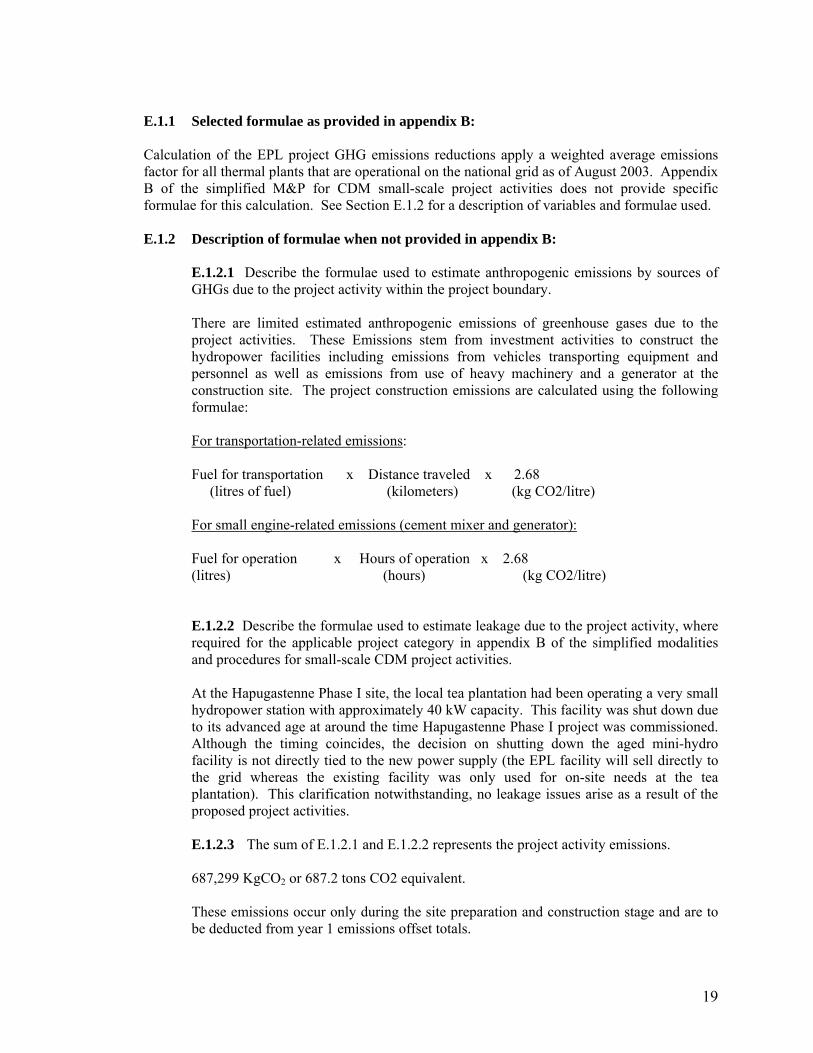
E.1.2.1 Describe the formulae used to estimate anthropogenic emissions by sources of GHGs due to the project activity within the project boundary. There are limited estimated anthropogenic emissions of greenhouse gases due to the project activities. These Emissions stem from investment activities to construct the hydropower facilities including emissions from vehicles transporting equipment and personnel as well as emissions from use of heavy machinery and a generator at the construction site. The project construction emissions are calculated using the following formulae: For transportation-related emissions: Fuel for transportation x Distance traveled x 2.68 (litres of fuel) (kilometers) (kg CO2/litre) For small engine-related emissions (cement mixer and generator): Fuel for operation x Hours of operation x 2.68 (litres) (hours) (kg CO2/litre) E.1.2.2 Describe the formulae used to estimate leakage due to the project activity, where required for the applicable project category in appendix B of the simplified modalities and procedures for small-scale CDM project activities. At the Hapugastenne Phase I site, the local tea plantation had been operating a very small hydropower station with approximately 40 kW capacity. This facility was shut down due to its advanced age at around the time Hapugastenne Phase I project was commissioned. Although the timing coincides, the decision on shutting down the aged mini-hydro facility is not directly tied to the new power supply (the EPL facility will sell directly to the grid whereas the existing facility was only used for on-site needs at the tea plantation). This clarification notwithstanding, no leakage issues arise as a result of the proposed project activities. E.1.2.3 The sum of E.1.2.1 and E.1.2.2 represents the project activity emissions. 687,299 KgCO2 or 687.2 tons CO2 equivalent. These emissions occur only during the site preparation and construction stage and are to be deducted from year 1 emissions offset totals.
19
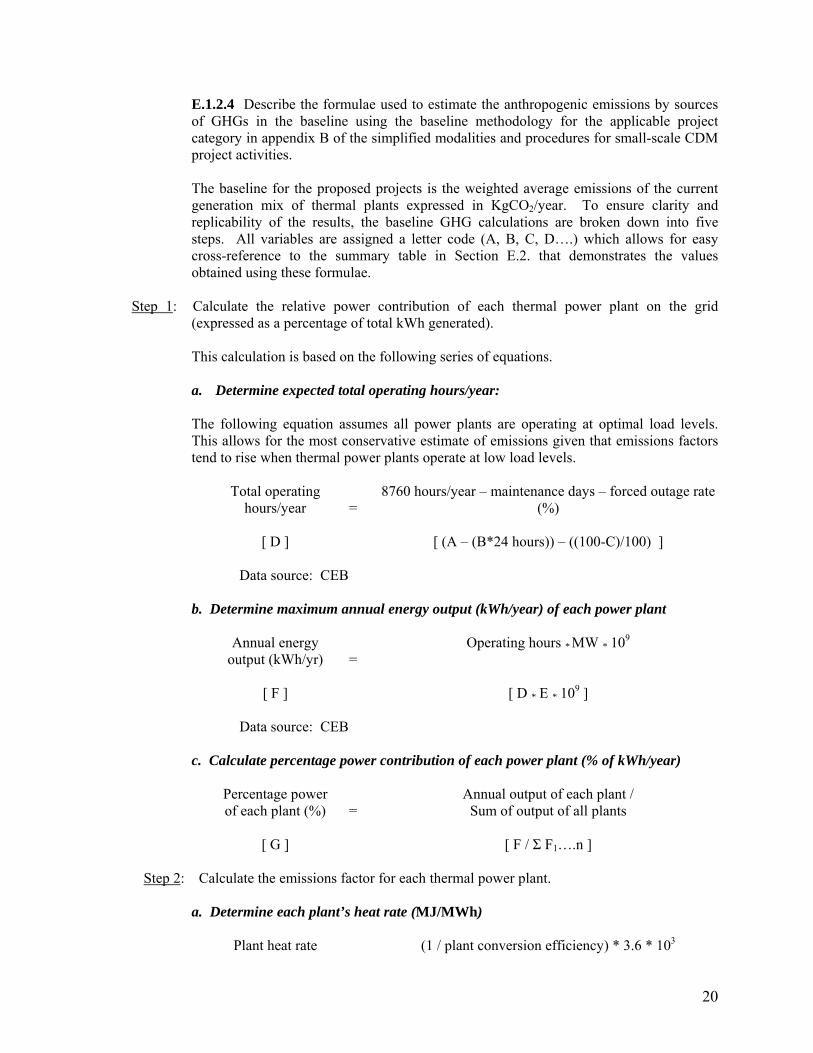
E.1.2.4 Describe the formulae used to estimate the anthropogenic emissions by sources of GHGs in the baseline using the baseline methodology for the applicable project category in appendix B of the simplified modalities and procedures for small-scale CDM project activities. The baseline for the proposed projects is the weighted average emissions of the current generation mix of thermal plants expressed in KgCO2/year. To ensure clarity and replicability of the results, the baseline GHG calculations are broken down into five steps. All variables are assigned a letter code (A, B, C, D….) which allows for easy cross-reference to the summary table in Section E.2. that demonstrates the values obtained using these formulae.
Step 1: Calculate the relative power contribution of each thermal power plant on the grid (expressed as a percentage of total kWh generated). This calculation is based on the following series of equations. a. Determine expected total operating hours/year: The following equation assumes all power plants are operating at optimal load levels. This allows for the most conservative estimate of emissions given that emissions factors tend to rise when thermal power plants operate at low load levels.
Total operating hours/year
[ D ]
=
8760 hours/year – maintenance days – forced outage rate (%)
[ (A – (B*24 hours)) – ((100-C)/100) ]
Data source: CEB b. Determine maximum annual energy output (kWh/year) of each power plant
Annual energy output (kWh/yr)
[ F ]
=
Operating hours * MW * 109
[ D * E * 109 ] Data source: CEB
c. Calculate percentage power contribution of each power plant (% of kWh/year)
Percentage power of each plant (%)
[ G ]
=
Annual output of each plant / Sum of output of all plants
[ F / Σ F1….n ]
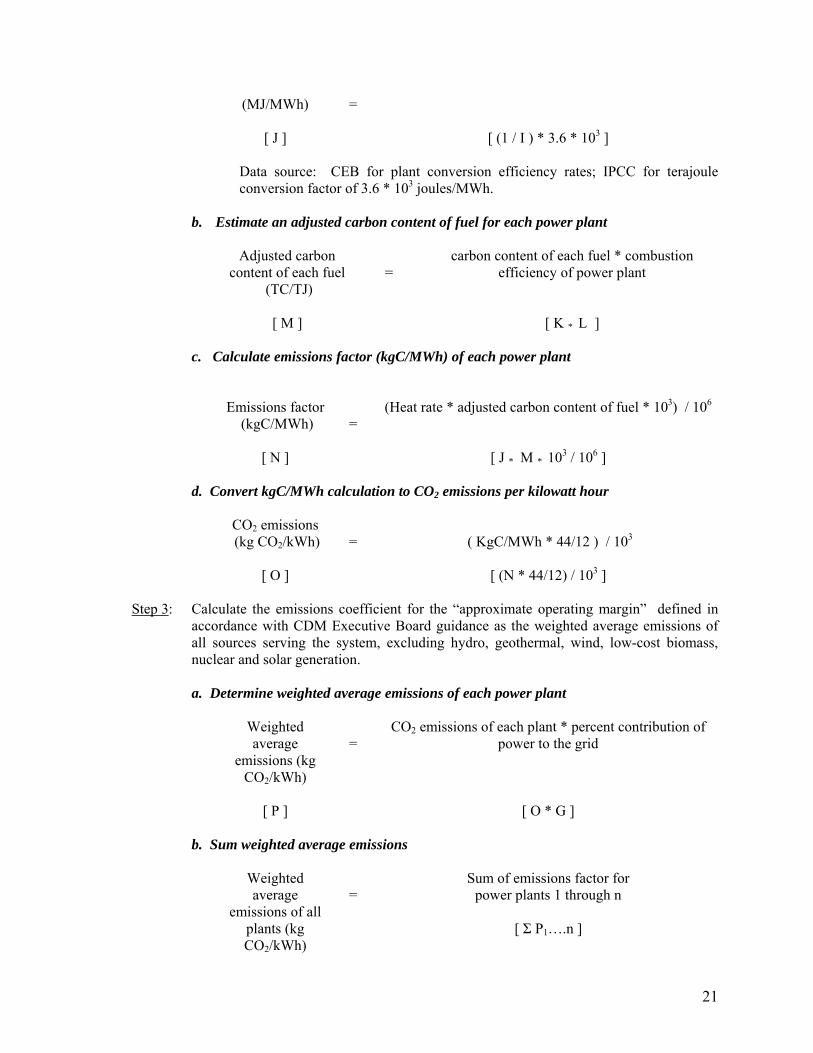
Step 2: Calculate the emissions factor for each thermal power plant. a. Determine each plant’s heat rate (MJ/MWh)
Plant heat rate (1 / plant conversion efficiency) * 3.6 * 103
20
(MJ/MWh)
[ J ]
=
[ (1 / I ) * 3.6 * 103 ]
Data source: CEB for plant conversion efficiency rates; IPCC for terajoule conversion factor of 3.6 * 103 joules/MWh.
b. Estimate an adjusted carbon content of fuel for each power plant
Adjusted carbon
content of each fuel (TC/TJ)
[ M ]
=
carbon content of each fuel * combustion efficiency of power plant
[ K * L ] c. Calculate emissions factor (kgC/MWh) of each power plant
Emissions factor (kgC/MWh)
[ N ]
=
(Heat rate * adjusted carbon content of fuel * 103) / 106
[ J * M * 103 / 106 ]
d. Convert kgC/MWh calculation to CO2 emissions per kilowatt hour
CO2 emissions (kg CO2/kWh)
[ O ]
=
( KgC/MWh * 44/12 ) / 103
[ (N * 44/12) / 103 ]
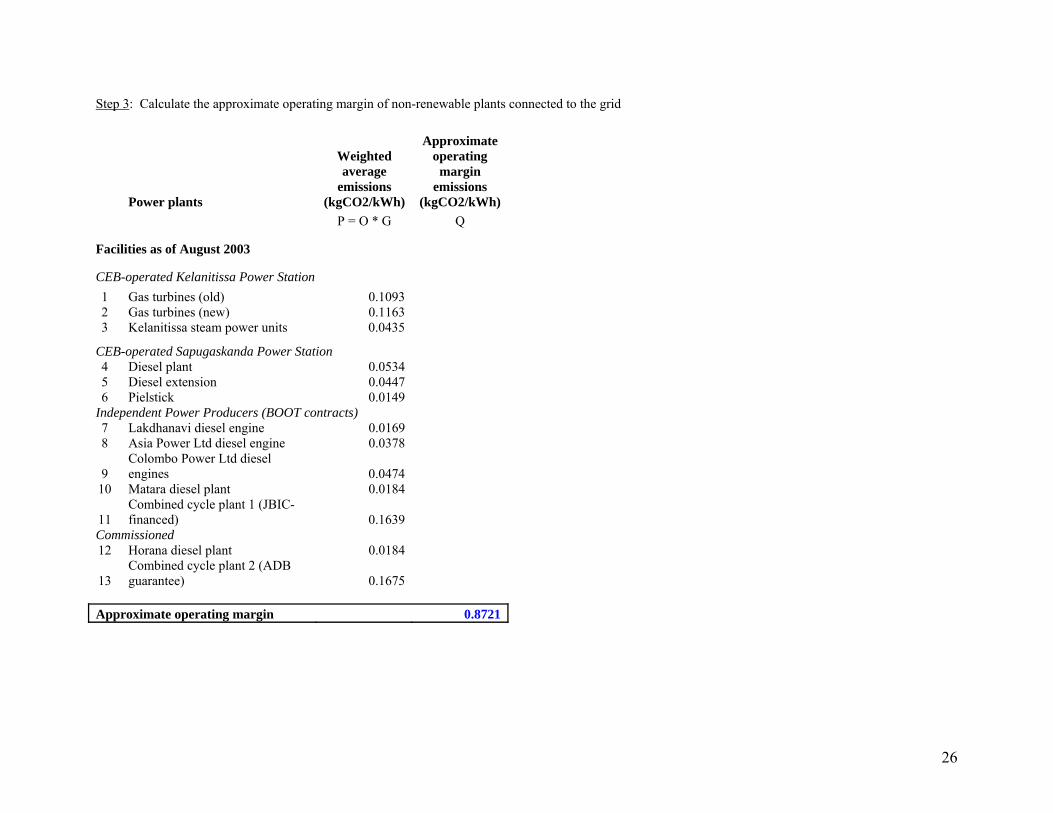
Step 3: Calculate the emissions coefficient for the “approximate operating margin” defined in
accordance with CDM Executive Board guidance as the weighted average emissions of all sources serving the system, excluding hydro, geothermal, wind, low-cost biomass, nuclear and solar generation.
a. Determine weighted average emissions of each power plant
Weighted average
emissions (kg CO2/kWh)
[ P ]
=
CO2 emissions of each plant * percent contribution of power to the grid
[ O * G ] b. Sum weighted average emissions
Weighted average
emissions of all plants (kg CO2/kWh)
=
Sum of emissions factor for power plants 1 through n
[ Σ P1….n ]
21
[ Q ]
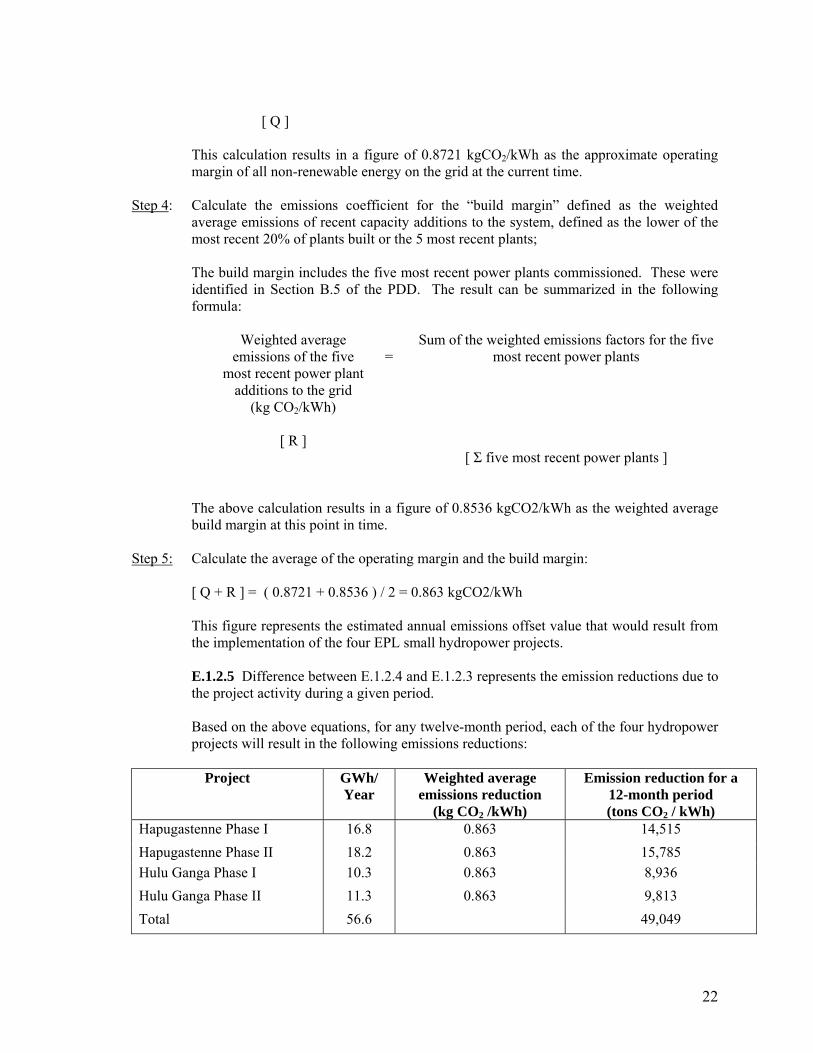
This calculation results in a figure of 0.8721 kgCO2/kWh as the approximate operating margin of all non-renewable energy on the grid at the current time.
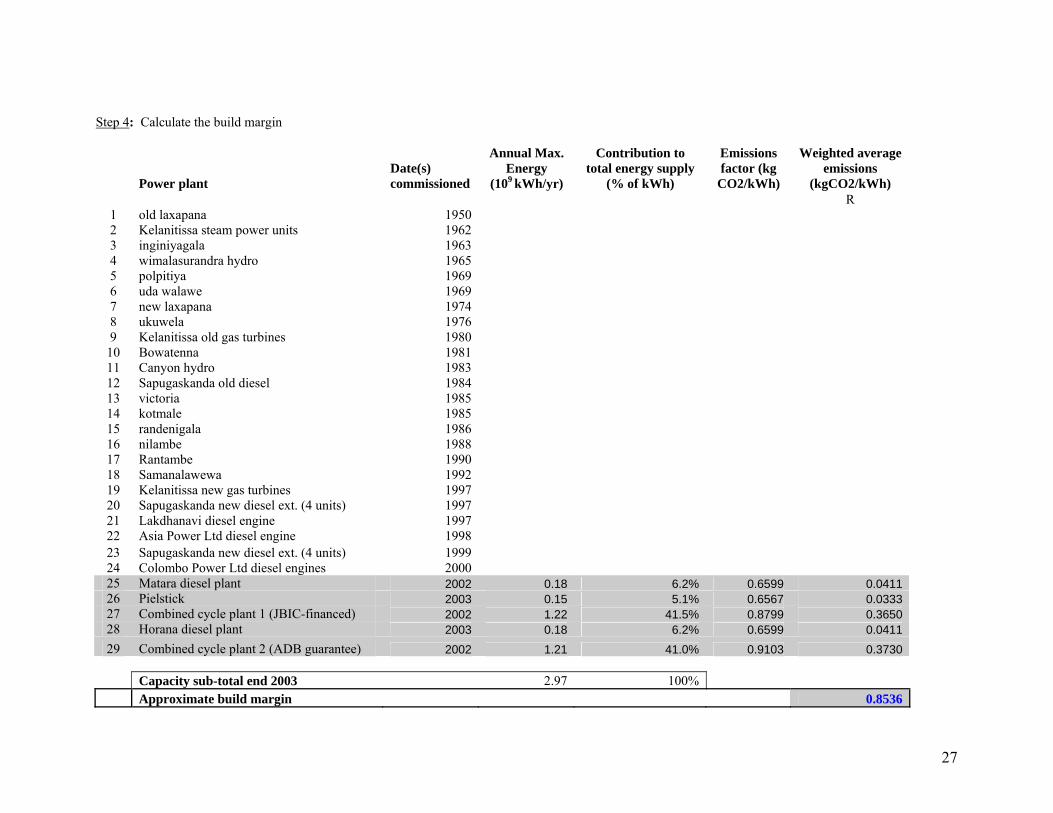
Step 4: Calculate the emissions coefficient for the “build margin” defined as the weighted average emissions of recent capacity additions to the system, defined as the lower of the most recent 20% of plants built or the 5 most recent plants;
The build margin includes the five most recent power plants commissioned. These were identified in Section B.5 of the PDD. The result can be summarized in the following formula:
Weighted average emissions of the five
most recent power plant additions to the grid
(kg CO2/kWh)
[ R ]
=
Sum of the weighted emissions factors for the five most recent power plants
[ Σ five most recent power plants ]
The above calculation results in a figure of 0.8536 kgCO2/kWh as the weighted average build margin at this point in time.
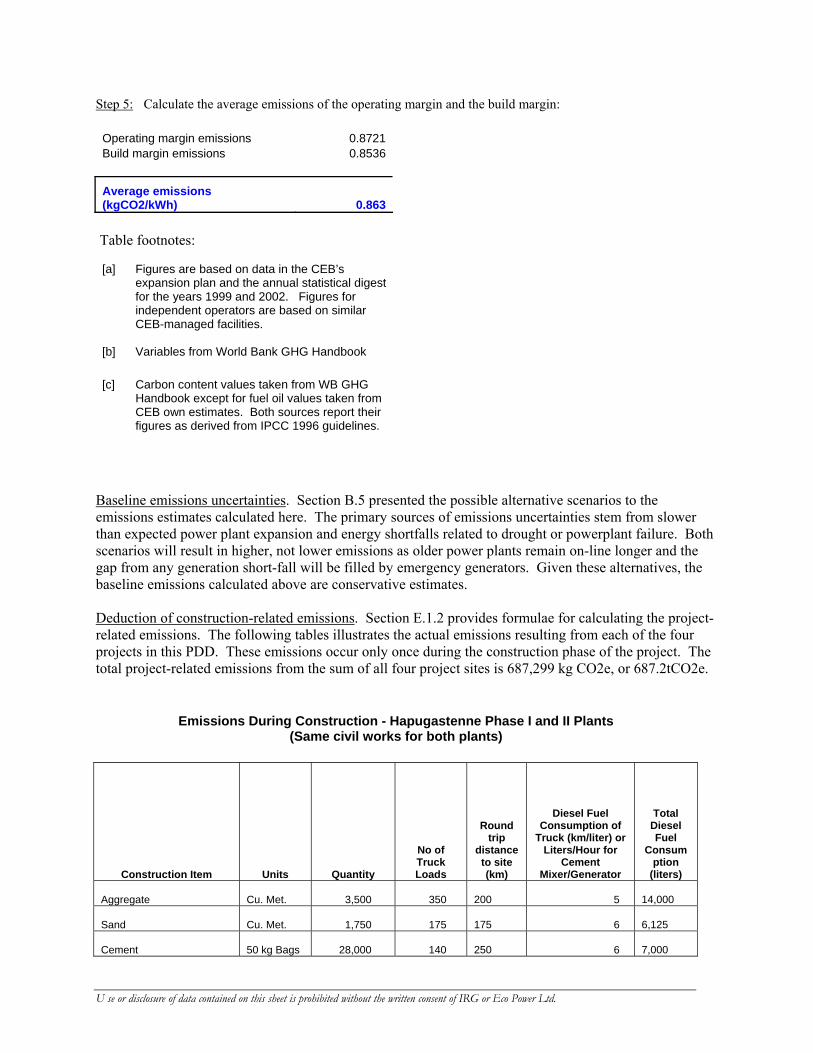
Step 5: Calculate the average of the operating margin and the build margin: [ Q + R ] = ( 0.8721 + 0.8536 ) / 2 = 0.863 kgCO2/kWh This figure represents the estimated annual emissions offset value that would result from
the implementation of the four EPL small hydropower projects.
E.1.2.5 Difference between E.1.2.4 and E.1.2.3 represents the emission reductions due to the project activity during a given period. Based on the above equations, for any twelve-month period, each of the four hydropower projects will result in the following emissions reductions:
Project
GWh/ Year
Weighted average emissions reduction
(kg CO2 /kWh)
Emission reduction for a 12-month period (tons CO2 / kWh)
Hapugastenne Phase I 16.8 0.863 14,515 Hapugastenne Phase II 18.2 0.863 15,785 Hulu Ganga Phase I 10.3 0.863 8,936 Hulu Ganga Phase II 11.3 0.863 9,813 Total 56.6 49,049
22

23
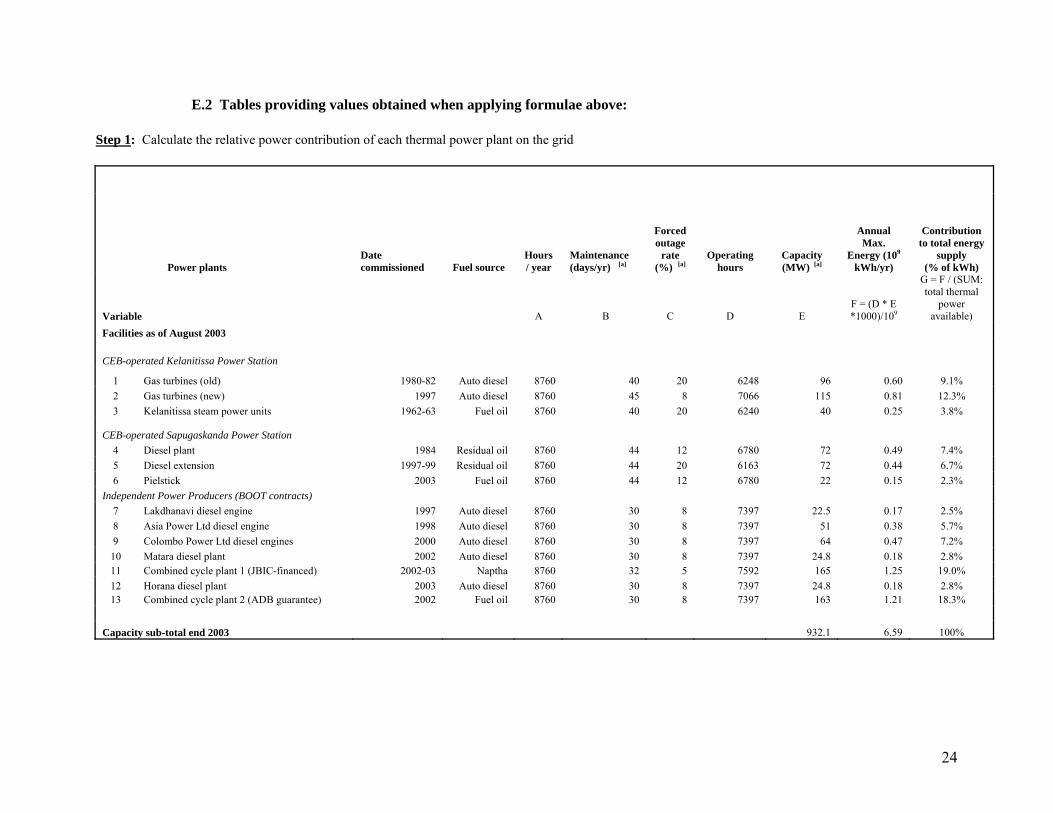
E.2 Tables providing values obtained when applying formulae above:
Step 1: Calculate the relative power contribution of each thermal power plant on the grid
Power plantsDate commissioned Fuel source
Hours / year
Maintenance (days/yr) [a]
Forced outage
rate (%) [a]
Operating hours
Capacity (MW) [a]
Annual Max.
Energy (109
kWh/yr)
Contribution to total energy
supply (% of kWh)
Variable BA C D E F = (D * E *1000)/109
G = F / (SUM: total thermal
power available)
Facilities as of August 2003
CEB-operated Kelanitissa Power Station
1 Gas turbines (old) 1980-82 Auto diesel 8760 40 20 6248 96 0.60 9.1% 2 Gas turbines (new) 1997 Auto diesel 8760 45 8 7066 115 0.81 12.3% 3 Kelanitissa steam power units 1962-63 Fuel oil 8760 40 20 6240 40 0.25 3.8%
CEB-operated Sapugaskanda Power Station 4 Diesel plant 1984 Residual oil 8760 44 12 6780 72 0.49 7.4% 5 Diesel extension 1997-99 Residual oil 8760 44 20 6163 72 0.44 6.7% 6 Pielstick 2003 Fuel oil 8760 44 12 6780 22 0.15 2.3%
Independent Power Producers (BOOT contracts) 7 Lakdhanavi diesel engine 1997 Auto diesel 8760 30 8 7397 22.5 0.17 2.5%8 Asia Power Ltd diesel engine 1998 Auto diesel 8760 30 8 7397 51 0.38 5.7% 9 Colombo Power Ltd diesel engines 2000 Auto diesel 8760 30 8 7397 64 0.47 7.2%10 Matara diesel plant 2002 Auto diesel 8760 30 8 7397 24.8 0.18 2.8%11 Combined cycle plant 1 (JBIC-financed) 2002-03 Naptha 8760 32 5 7592 165 1.25 19.0% 12 Horana diesel plant 2003 Auto diesel 8760 30 8 7397 24.8 0.18 2.8% 13 Combined cycle plant 2 (ADB guarantee) 2002 Fuel oil 8760 30 8 7397 163 1.21 18.3%
Capacity sub-total end 2003 932.1 6.59 100%
24
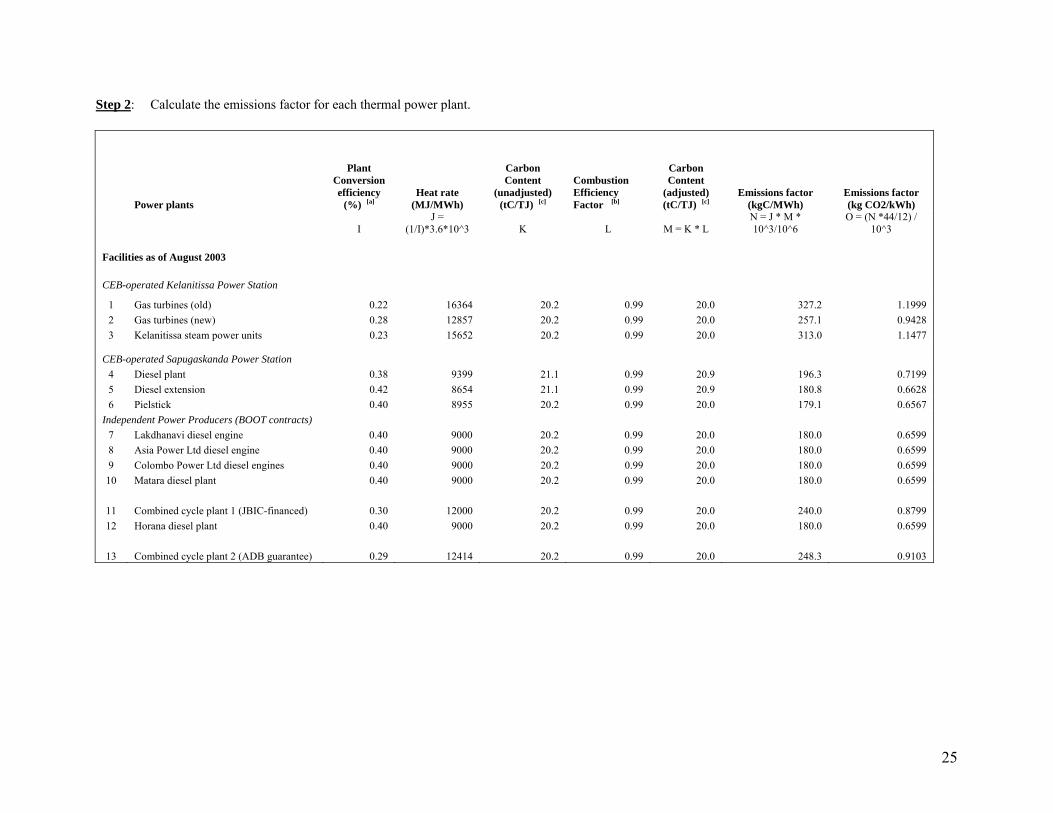
Step 2: Calculate the emissions factor for each thermal power plant.
Power plants
Plant Conversion efficiency
(%) [a]Heat rate
(MJ/MWh)
Carbon Content
(unadjusted) (tC/TJ) [c]
Combustion Efficiency Factor [b]
Carbon Content
(adjusted) (tC/TJ) [c]
Emissions factor (kgC/MWh)
Emissions factor (kg CO2/kWh)
IJ =
(1/I)*3.6*10^3 K L M = K * L N = J * M * 10^3/10^6
O = (N *44/12) / 10^3
Facilities as of August 2003
CEB-operated Kelanitissa Power Station
1 Gas turbines (old) 0.22 16364 20.2 0.99 20.0 327.2 1.1999 2 Gas turbines (new) 0.28 12857 20.2 0.99 20.0 257.1 0.9428 3 Kelanitissa steam power units 0.23 15652 20.2 0.99 20.0 313.0 1.1477
CEB-operated Sapugaskanda Power Station 4 Diesel plant 0.38 9399 21.1 0.99 20.9 196.3 0.71995 Diesel extension 0.42 8654 21.1 0.99 20.9 180.8 0.66286 Pielstick 0.40 8955 20.2 0.99 20.0 179.1 0.6567
Independent Power Producers (BOOT contracts) 7 Lakdhanavi diesel engine 0.40 9000 20.2 0.99 20.0 180.0 0.65998 Asia Power Ltd diesel engine 0.40 9000 20.2 0.99 20.0 180.0 0.65999 Colombo Power Ltd diesel engines 0.40 9000 20.2 0.99 20.0 180.0 0.6599 10 Matara diesel plant 0.40 9000 20.2 0.99 20.0 180.0 0.6599
11 Combined cycle plant 1 (JBIC-financed) 0.30 12000 20.2 0.99 20.0 240.0 0.8799 12 Horana diesel plant 0.40 9000 20.2 0.99 20.0 180.0 0.6599
13 Combined cycle plant 2 (ADB guarantee) 0.29 12414 20.2 0.99 20.0 248.3 0.9103
25
Step 3: Calculate the approximate operating margin of non-renewable plants connected to the grid
Power plants
Weighted average
emissions (kgCO2/kWh)
Approximate operating
margin emissions
(kgCO2/kWh) P = O * G Q
Facilities as of August 2003
CEB-operated Kelanitissa Power Station 1 Gas turbines (old) 0.1093 2 Gas turbines (new) 0.1163 3 Kelanitissa steam power units 0.0435
CEB-operated Sapugaskanda Power Station 4 Diesel plant 0.0534
5 Diesel extension
0.04476 Pielstick 0.0149
Independent Power Producers (BOOT contracts) 7 Lakdhanavi diesel engine 0.0169 8 Asia Power Ltd diesel engine 0.0378
9 Colombo Power Ltd diesel engines 0.0474
10 Matara diesel plant 0.0184
11 Combined cycle plant 1 (JBIC-financed) 0.1639
Commissioned 12 Horana diesel plant 0.0184
13
Combined cycle plant 2 (ADB guarantee)
0.1675
Approximate operating margin 0.8721
26
27
Step 4: Calculate the build margin
Power plant Date(s) commissioned
Annual Max. Energy
(109 kWh/yr)
Contribution to total energy supply
(% of kWh)
Emissions factor (kg
CO2/kWh)
Weighted average emissions
(kgCO2/kWh)
R 1 old laxapana 19502 Kelanitissa steam power units
1962
3 inginiyagala 19634 wimalasurandra hydro
1965
5 polpitiya 19696 uda walawe 19697 new laxapana
1974
8 ukuwela 1976 9 Kelanitissa old gas turbines
1980
10 Bowatenna 198111 Canyon hydro 198312 Sapugaskanda old diesel
1984
13 victoria 1985 14 kotmale 198515 randenigala
1986
16 nilambe 1988 17 Rantambe 199018 Samanalawewa 199219 Kelanitissa new gas turbines 1997 20 Sapugaskanda new diesel ext. (4 units) 1997 21 Lakdhanavi diesel engine 1997 22 Asia Power Ltd diesel engine 1998 23 Sapugaskanda new diesel ext. (4 units) 1999 24 Colombo Power Ltd diesel engines 2000 25 Matara diesel plant 2002 0.18 6.2% 0.6599 0.0411 26 Pielstick 2003 0.15 5.1% 0.6567 0.0333 27 Combined cycle plant 1 (JBIC-financed) 2002 1.22 41.5% 0.8799 0.3650 28 Horana diesel plant 2003 0.18 6.2% 0.6599 0.0411 29 Combined cycle plant 2 (ADB guarantee) 2002 1.21 41.0% 0.9103 0.3730
Capacity sub-total end 2003 2.97 100%
Approximate build margin 0.8536
Step 5: Calculate the average emissions of the operating margin and the build margin: Operating margin emissions 0.8721 Build margin emissions 0.8536
Average emissions (kgCO2/kWh) 0.863
Table footnotes: [a]
Figures are based on data in the CEB’s expansion plan and the annual statistical digest for the years 1999 and 2002. Figures for independent operators are based on similar CEB-managed facilities.
[b]
Variables from World Bank GHG Handbook
[c]
Carbon content values taken from WB GHG Handbook except for fuel oil values taken from CEB own estimates. Both sources report their figures as derived from IPCC 1996 guidelines.
Baseline emissions uncertainties. Section B.5 presented the possible alternative scenarios to the emissions estimates calculated here. The primary sources of emissions uncertainties stem from slower than expected power plant expansion and energy shortfalls related to drought or powerplant failure. Both scenarios will result in higher, not lower emissions as older power plants remain on-line longer and the gap from any generation short-fall will be filled by emergency generators. Given these alternatives, the baseline emissions calculated above are conservative estimates. Deduction of construction-related emissions. Section E.1.2 provides formulae for calculating the project-related emissions. The following tables illustrates the actual emissions resulting from each of the four projects in this PDD. These emissions occur only once during the construction phase of the project. The total project-related emissions from the sum of all four project sites is 687,299 kg CO2e, or 687.2tCO2e.
Emissions During Construction - Hapugastenne Phase I and II Plants (Same civil works for both plants)
Construction Item Units Quantity
No of Truck Loads
Round trip
distance to site (km)
Diesel Fuel Consumption of
Truck (km/liter) or Liters/Hour for
Cement Mixer/Generator
Total Diesel Fuel
Consumption
(liters)
Aggregate Cu. Met. 3,500 350 200 5
14,000
Sand Cu. Met. 1,750 175 175 6
6,125
Cement 50 kg Bags 28,000 140 250 6
7,000
U se or disclosure of data contained on this sheet is prohibited without the written consent of IRG or Eco Power Ltd.
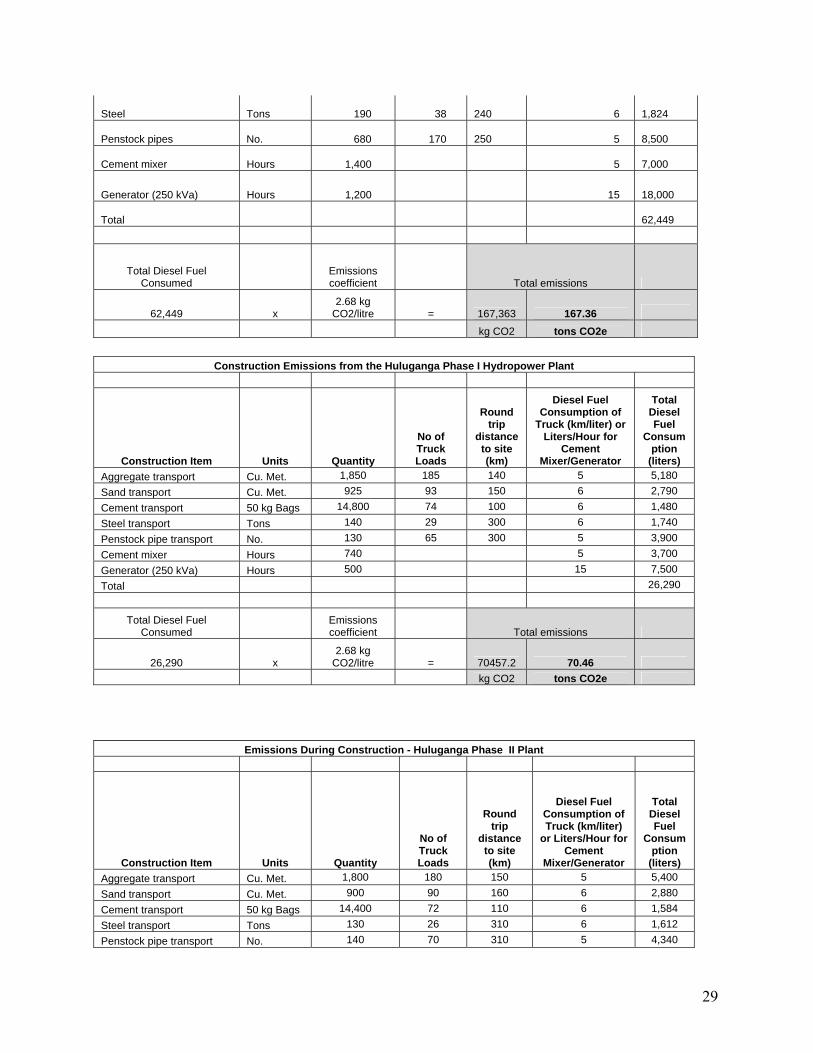
Steel Tons 190 38 240 6
1,824
Penstock pipes No. 680 170 250 5
8,500
Cement mixer Hours 1,400 5 7,000
Generator (250 kVa) Hours 1,200 15 18,000
Total 62,449
Total Diesel Fuel Consumed
Emissions coefficient Total emissions
62,449 x 2.68 kg
CO2/litre = 167,363 167.36 kg CO2 tons CO2e
Construction Emissions from the Huluganga Phase I Hydropower Plant
Construction Item Units Quantity
No of Truck Loads
Round trip
distance to site (km)
Diesel Fuel Consumption of
Truck (km/liter) or Liters/Hour for
Cement Mixer/Generator
Total Diesel Fuel
Consumption
(liters) Aggregate transport Cu. Met. 1,850 185 140 5 5,180 Sand transport Cu. Met. 925 93 150 6 2,790 Cement transport 50 kg Bags 14,800 74 100 6 1,480 Steel transport Tons 140 29 300 6 1,740 Penstock pipe transport No. 130 65 300 5 3,900 Cement mixer Hours 740 5 3,700 Generator (250 kVa) Hours 500 15 7,500 Total 26,290
Total Diesel Fuel Consumed
Emissions coefficient Total emissions
26,290 x 2.68 kg
CO2/litre = 70457.2 70.46 kg CO2 tons CO2e
Emissions During Construction - Huluganga Phase II Plant
Construction Item Units Quantity
No of Truck Loads
Round trip
distance to site (km)
Diesel Fuel Consumption of Truck (km/liter)
or Liters/Hour for Cement
Mixer/Generator
Total Diesel Fuel
Consumption
(liters) Aggregate transport Cu. Met. 1,800 180 150 5 5,400 Sand transport Cu. Met. 900 90 160 6 2,880 Cement transport 50 kg Bags 14,400 72 110 6 1,584 Steel transport Tons 130 26 310 6 1,612 Penstock pipe transport No. 140 70 310 5 4,340
29
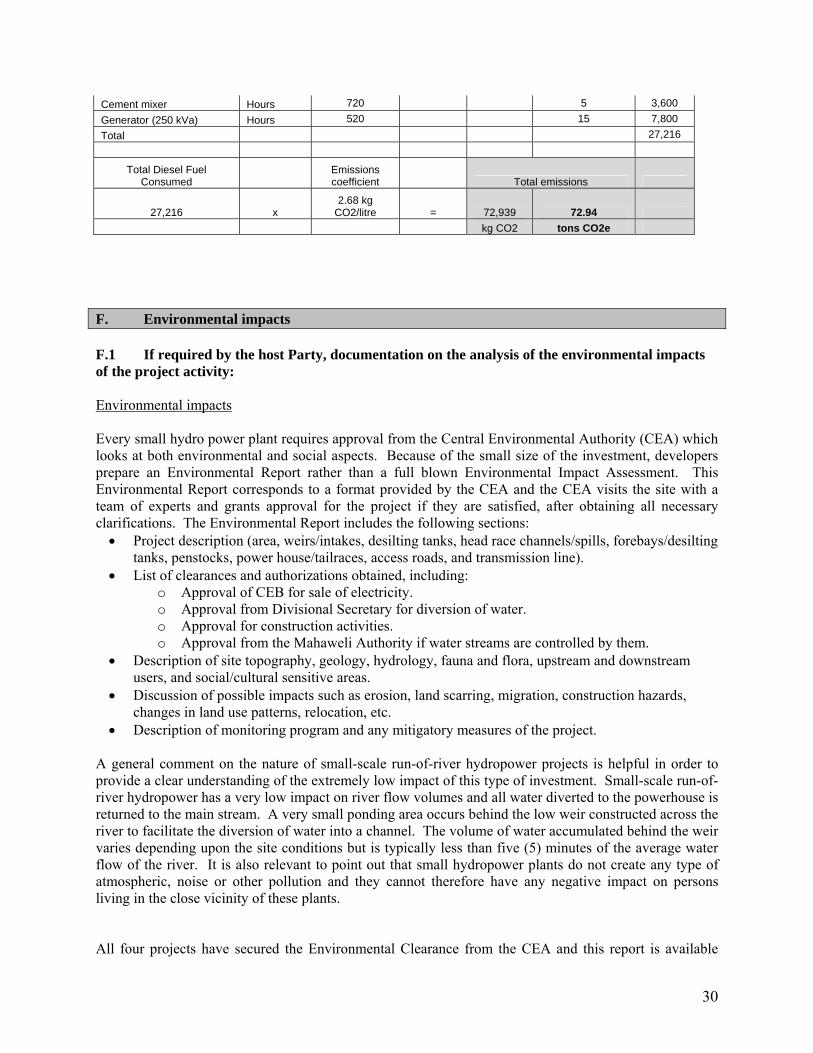
Cement mixer Hours 720 5 3,600 Generator (250 kVa) Hours 520 15 7,800 Total 27,216
Total Diesel Fuel Consumed
Emissions coefficient Total emissions
27,216 x 2.68 kg
CO2/litre = 72,939 72.94 kg CO2 tons CO2e
F. Environmental impacts F.1 If required by the host Party, documentation on the analysis of the environmental impacts of the project activity: Environmental impacts Every small hydro power plant requires approval from the Central Environmental Authority (CEA) which looks at both environmental and social aspects. Because of the small size of the investment, developers prepare an Environmental Report rather than a full blown Environmental Impact Assessment. This Environmental Report corresponds to a format provided by the CEA and the CEA visits the site with a team of experts and grants approval for the project if they are satisfied, after obtaining all necessary clarifications. The Environmental Report includes the following sections: • Project description (area, weirs/intakes, desilting tanks, head race channels/spills, forebays/desilting
tanks, penstocks, power house/tailraces, access roads, and transmission line). • List of clearances and authorizations obtained, including:
o Approval of CEB for sale of electricity. o Approval from Divisional Secretary for diversion of water. o Approval for construction activities. o Approval from the Mahaweli Authority if water streams are controlled by them.
• Description of site topography, geology, hydrology, fauna and flora, upstream and downstream users, and social/cultural sensitive areas.
• Discussion of possible impacts such as erosion, land scarring, migration, construction hazards, changes in land use patterns, relocation, etc.
• Description of monitoring program and any mitigatory measures of the project. A general comment on the nature of small-scale run-of-river hydropower projects is helpful in order to provide a clear understanding of the extremely low impact of this type of investment. Small-scale run-of-river hydropower has a very low impact on river flow volumes and all water diverted to the powerhouse is returned to the main stream. A very small ponding area occurs behind the low weir constructed across the river to facilitate the diversion of water into a channel. The volume of water accumulated behind the weir varies depending upon the site conditions but is typically less than five (5) minutes of the average water flow of the river. It is also relevant to point out that small hydropower plants do not create any type of atmospheric, noise or other pollution and they cannot therefore have any negative impact on persons living in the close vicinity of these plants. All four projects have secured the Environmental Clearance from the CEA and this report is available
30
through the offices of EPL. Environmental Clearance for the Hapugastenne Phase I and Phase II projects was issued on October 25, 1999. Environmental Clearance for Hulu Ganga Phase I and II projects was issued on October 25, 2001. These clearances reflect the finding that the environmental impact of the four projects is negligible. The general and specific conditions of approval of the EAs are in most instances generic, i.e., guidance on minimizing impacts of site preparation. Also, all projects require an environmental monitoring plan that cover surface water (not relevant in practice for run-of-river projects), flora and fauna within the river and below the diversion point, river bank erosion, and sediments upstream of the weir. The noteworthy conditions specific to each of the project sites are summarized below. Hapugastenne Phases I and II:
o To maintain the downstream in proper condition, a continuous uninterrupted flow of 50 litres/sec shall be maintained by a suitable openings through the weir.
Hulu Ganga Phases I and II:
o To maintain the downstream in proper condition, a continuous uninterrupted flow of 50 litres/sec shall be maintained by a suitable openings through the weirs of both phases.
Social and Economic Benefits Although not required in the PDD, the following summarizes the social benefits associated with all of EPL’s hydropower project investments. • During the construction phase of all of the plants (which is typically about one year in duration) the
civil engineering firms undertaking the construction of the plants hire a large number of skilled and unskilled workers from the nearby communities, thereby providing additional employment during the period.
• After commissioning the plants typically have a small complement of staff of 10-15 persons including
plant operators, labourers, security staff, etc. Over 50% of these persons are typically hired from the nearby communities.
• In most of the plants, additional roads have been/will be built by EPL to access the power houses.
These roads are available for use by the local people and in some cases provide motorable access to their homes where there were only footpaths before.
• During the construction phase various additional work beneficial to the local communities is carried out
by EPL free of charge. An example would be the expansion of the playing field of the nearby school using bulldozers and excavators in the case of the Hulu Ganga Phase I project.
• After every project is commissioned EPL provides a separate Rs 200,000 ($2,000) per year budget for
the local community to use for community development projects of their choice.
31
• All power from the power plants are carried to the CEB grid through the existing 33 kV distribution lines in the area. If these lines are not working for any reason EPL cannot sell its power. In rural Sri Lanka where all of the plants built/being built by EPL are located there are frequent breakdowns in supply and the CEB local authorities take their own time to repair these breakdowns. After EPL builds this power plant it will pay a retainer to the local CEB authorities to cover the costs associated with repair of the distribution lines in the area. As a result the grid outage rates suffered by others consumers in the area also reduced significantly.
• The four projects generate electrical energy using water. If they had not been constructed the same
amount of energy would have been generated using oil which is imported. The country would therefore save on the foreign exchange required to import the oil.
G. Stakeholder comments G.1 Brief description of the process by which comments by local stakeholders have been invited and compiled: The stakeholders for each of the four projects were identified as part of the process of seeking environmental clearance to proceed with the project. In all cases EPL has held meetings with the individuals living and working in the vicinity to explain the project’s objectives and benefits. Due to the remote nature of the Hulu Ganga and Hapugastenne projects, there are very few local residents or structures. Those consultations allowed the developer to design the projects so that they did not/will not interfere with current land use and economic activity. In addition, as part of gaining the approval of the CEA, EPL has received approval (in writing) from the elected local government authority which represents the local community. EPL has found that there are usually a range of small issues connected with the operation of its hydropower plants which impact on the local communities in the vicinity of the plants which were unanticipated at the time prior to construction of the plants. These issues are typically addressed through an ongoing dialogue that EPL conducts with the local communities. G.2 Summary of the comments received: Comments received from local stakeholders are generally positive. Participants are eager to participate as employees of the project and are particularly enthusiastic regarding EPLs commitment to provide an annual Rs 200,000 ($2,000) budget for the local community to use for community development projects of their choice. G.3 Report on how due account was taken of any comments received: As was stated in G.1., the stakeholder consultation process allowed EPL to map and take into account current land uses and economic activities in the final project design.
32
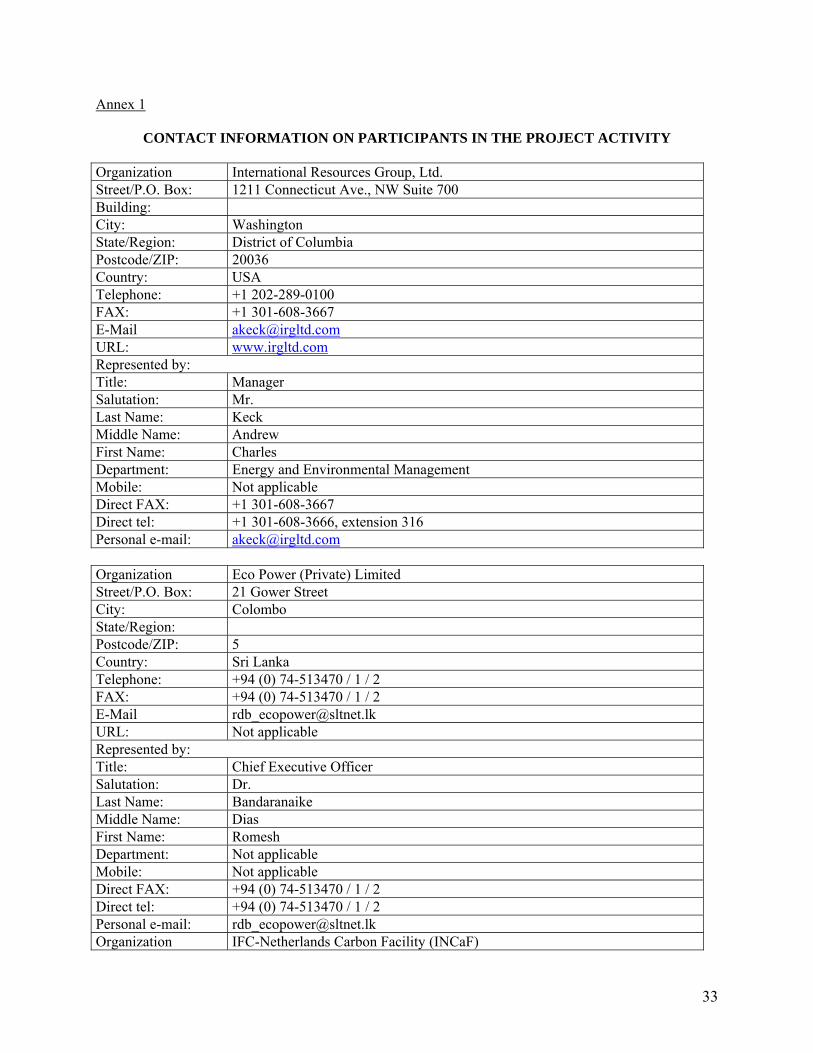
Annex 1
CONTACT INFORMATION ON PARTICIPANTS IN THE PROJECT ACTIVITY Organization International Resources Group, Ltd. Street/P.O. Box: 1211 Connecticut Ave., NW Suite 700 Building: City: Washington State/Region: District of Columbia Postcode/ZIP: 20036 Country: USA Telephone: +1 202-289-0100 FAX: +1 301-608-3667 E-Mail [email protected]: www.irgltd.comRepresented by: Title: Manager Salutation: Mr. Last Name: Keck Middle Name: Andrew First Name: Charles Department: Energy and Environmental Management Mobile: Not applicable Direct FAX: +1 301-608-3667 Direct tel: +1 301-608-3666, extension 316 Personal e-mail: [email protected] Organization Eco Power (Private) Limited Street/P.O. Box: 21 Gower Street City: Colombo State/Region: Postcode/ZIP: 5 Country: Sri Lanka Telephone: +94 (0) 74-513470 / 1 / 2 FAX: +94 (0) 74-513470 / 1 / 2 E-Mail [email protected] URL: Not applicable Represented by: Title: Chief Executive Officer Salutation: Dr. Last Name: Bandaranaike Middle Name: Dias First Name: Romesh Department: Not applicable Mobile: Not applicable Direct FAX: +94 (0) 74-513470 / 1 / 2 Direct tel: +94 (0) 74-513470 / 1 / 2 Personal e-mail: [email protected] Organization IFC-Netherlands Carbon Facility (INCaF)
33

Street/P.O. Box: 2121 Pennsylvania Avenue, NW City: Washington State/Region: District of Columbia Postcode/ZIP: 20433 Country: USA Telephone: +1 202-473-1368 FAX: +1 202-974-4404 E-Mail [email protected]: http://www.ifc.org/carbonfinanceRepresented by: Title: Program Manager, Carbon Finance Salutation: Mr. Last Name: Widge Middle Name: First Name: Vikram Department: Mobile: Direct FAX: (202) 974-4404 Direct tel: (202) 473-1368 Personal e-mail:
34

Annex 2
INFORMATION REGARDING PUBLIC FUNDING
The Hapugastenne and Hulu Ganga projects do not require public funding.
35
Annex 3
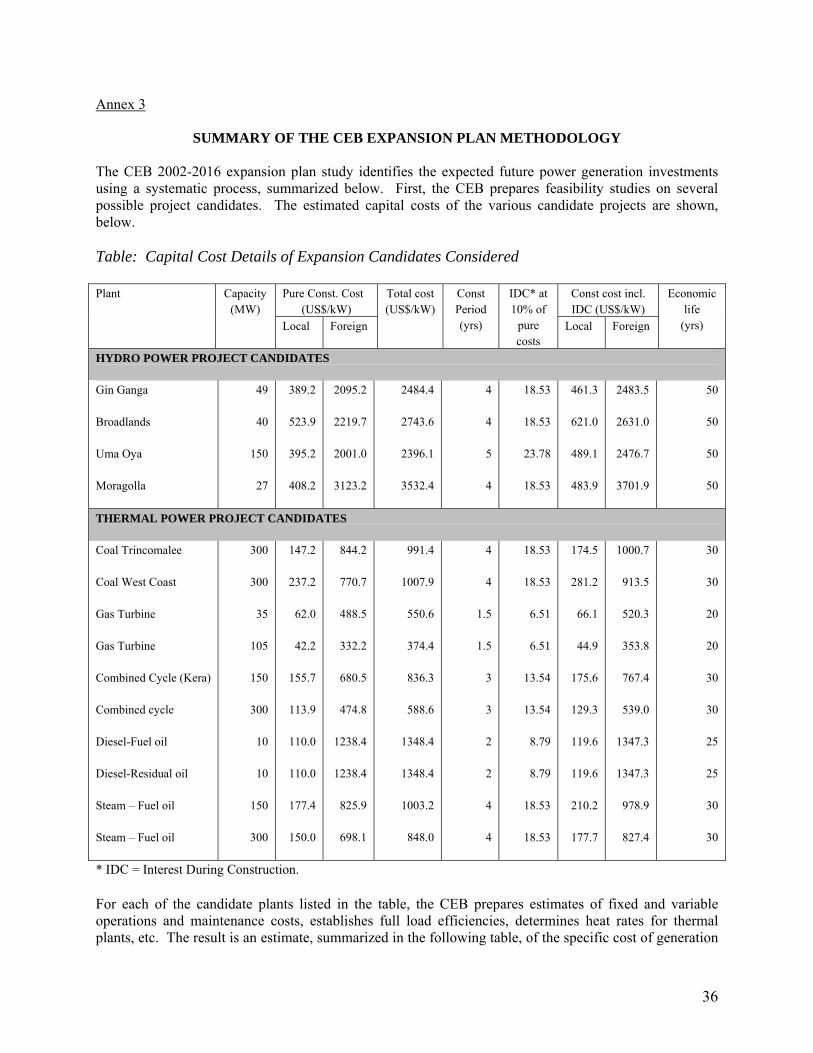
SUMMARY OF THE CEB EXPANSION PLAN METHODOLOGY The CEB 2002-2016 expansion plan study identifies the expected future power generation investments using a systematic process, summarized below. First, the CEB prepares feasibility studies on several possible project candidates. The estimated capital costs of the various candidate projects are shown, below. Table: Capital Cost Details of Expansion Candidates Considered
Pure Const. Cost (US$/kW)
Const cost incl. IDC (US$/kW)
Plant Capacity (MW)
Local Foreign
Total cost (US$/kW)
Const Period (yrs)
IDC* at 10% of
pure costs
Local Foreign
Economic life
(yrs)
HYDRO POWER PROJECT CANDIDATES Gin Ganga Broadlands Uma Oya Moragolla
49
40
150
27
389.2
523.9
395.2
408.2
2095.2
2219.7
2001.0
3123.2
2484.4
2743.6
2396.1
3532.4
4
4
5
4
18.53
18.53
23.78
18.53
461.3
621.0
489.1
483.9
2483.5
2631.0
2476.7
3701.9
50
50
50
50
THERMAL POWER PROJECT CANDIDATES
Coal Trincomalee Coal West Coast Gas Turbine Gas Turbine Combined Cycle (Kera) Combined cycle Diesel-Fuel oil Diesel-Residual oil Steam – Fuel oil Steam – Fuel oil
300
300
35
105
150
300
10
10
150
300
147.2
237.2
62.0
42.2
155.7
113.9
110.0
110.0
177.4
150.0
844.2
770.7
488.5
332.2
680.5
474.8
1238.4
1238.4
825.9
698.1
991.4
1007.9
550.6
374.4
836.3
588.6
1348.4
1348.4
1003.2
848.0
4
4
1.5
1.5
3
3
2
2
4
4
18.53
18.53
6.51
6.51
13.54
13.54
8.79
8.79
18.53
18.53
174.5
281.2
66.1
44.9
175.6
129.3
119.6
119.6
210.2
177.7
1000.7
913.5
520.3
353.8
767.4
539.0
1347.3
1347.3
978.9
827.4
30
30
20
20
30
30
25
25
30
30
* IDC = Interest During Construction.
For each of the candidate plants listed in the table, the CEB prepares estimates of fixed and variable operations and maintenance costs, establishes full load efficiencies, determines heat rates for thermal plants, etc. The result is an estimate, summarized in the following table, of the specific cost of generation
36
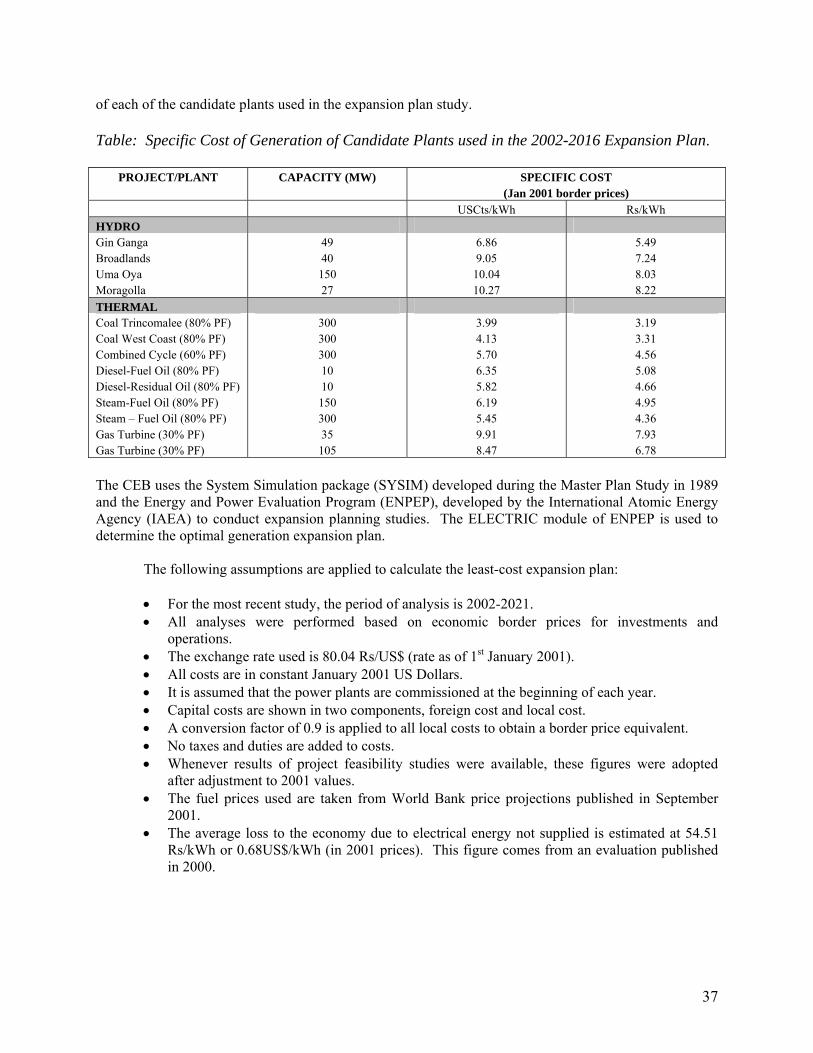
of each of the candidate plants used in the expansion plan study. Table: Specific Cost of Generation of Candidate Plants used in the 2002-2016 Expansion Plan.
PROJECT/PLANT CAPACITY (MW) SPECIFIC COST (Jan 2001 border prices)
USCts/kWh Rs/kWh HYDRO Gin Ganga Broadlands Uma Oya Moragolla
49 40 150 27
6.86 9.05
10.04 10.27
5.49 7.24 8.03 8.22
THERMAL Coal Trincomalee (80% PF) Coal West Coast (80% PF) Combined Cycle (60% PF) Diesel-Fuel Oil (80% PF) Diesel-Residual Oil (80% PF) Steam-Fuel Oil (80% PF) Steam – Fuel Oil (80% PF) Gas Turbine (30% PF) Gas Turbine (30% PF)
300 300 300 10 10 150 300 35 105
3.99 4.13 5.70 6.35 5.82 6.19 5.45 9.91 8.47
3.19 3.31 4.56 5.08 4.66 4.95 4.36 7.93 6.78
The CEB uses the System Simulation package (SYSIM) developed during the Master Plan Study in 1989 and the Energy and Power Evaluation Program (ENPEP), developed by the International Atomic Energy Agency (IAEA) to conduct expansion planning studies. The ELECTRIC module of ENPEP is used to determine the optimal generation expansion plan.
The following assumptions are applied to calculate the least-cost expansion plan:
• For the most recent study, the period of analysis is 2002-2021. • All analyses were performed based on economic border prices for investments and
operations. • The exchange rate used is 80.04 Rs/US$ (rate as of 1st January 2001). • All costs are in constant January 2001 US Dollars. • It is assumed that the power plants are commissioned at the beginning of each year. • Capital costs are shown in two components, foreign cost and local cost. • A conversion factor of 0.9 is applied to all local costs to obtain a border price equivalent. • No taxes and duties are added to costs. • Whenever results of project feasibility studies were available, these figures were adopted
after adjustment to 2001 values. • The fuel prices used are taken from World Bank price projections published in September
2001. • The average loss to the economy due to electrical energy not supplied is estimated at 54.51
Rs/kWh or 0.68US$/kWh (in 2001 prices). This figure comes from an evaluation published in 2000.
37