Embed Size (px)
Citation preview
EUROGRAPHICS 2021/ B. Sousa Santos and G. Domik Education Paper
Project in Visualization and Data Analysis:Experiences in Designing and Coordinating the Course
K. Kucher1 , R. M. Martins1 , and A. Kerren1,2
1Department of Computer Science and Media Technology, Linnaeus University, Sweden2Department of Science and Technology, Linköping University, Sweden
Study Period 1 Study Period 2
Project In Visualization and Data Analysis (10 ECTS)
Data Mining (5 ECTS)
Advanced Information Visualization and Applications (5 ECTS)Information Visualization (5 ECTS)
Winter Break
Lectures and Tutorials
Proposals and Major Reports
Seminars and Presentations
Project Releases and Release Update Reports
Figure 1: The timeline of our full term project course (18 study weeks) and the relevant ongoing courses offered for the same target audience.
AbstractVisual analytics involves both visual and computational components for empowering human analysts who face the challengesof making sense and making use of large and heterogeneous data sets in various application domains. In order to facilitate thelearning process for the students at higher education institutions with regard to both the theoretical knowledge and practicalskills in visual analytics, the respective courses must cover a variety of topics and include multiple assessment methods andactivities. In this paper, we report on the design and first instantiation of a full term project-based course in visualization anddata analysis, which was recently offered to graduate and post-graduate students at our department and met with positivefeedback from the course participants.
CCS Concepts• Human-centered computing → Visual analytics; • Information systems → Data mining; • Social and professional topics→ Computing education;
1. Introduction
Visual analytic systems [KKEM10, SSS∗14] bring data analysiscloser to end users by effectively combining interactive visualiza-tion and complex algorithms, guided by the underlying analyticalprocesses inherent to the data and the application at hand. Themethods and specific techniques proposed within the informationvisualization (InfoVis) and visual analytics (VA) research commu-nities have been attracting a lot of attention within academia, in-dustry, and public sector, as they can facilitate the processes of rep-resenting and exploring complex data [FvWSN08], deriving newinsights and knowledge from the data [SSS∗14], externalizing the
respective findings and models [ALA∗18], and raising the trustwor-thiness of the underlying analyses and models [CMJ∗20].
However, implementation of VA solutions requires understand-ing of the concepts and mastery of the skills corresponding to com-putational methods, interactive visualization design [Mun09], inte-gration of both groups of approaches, and user-centered evaluationof the resulting solutions [Pur12, IIC∗13, CE19]. This wide varietyof topics and skills presents challenges for educational activitiesfocusing on VA, in particular, higher education courses. Thus, fur-ther discussion of the design and outcomes of such courses can behelpful for the community of academic educators.
© 2021 The Author(s)Eurographics Proceedings © 2021 The Eurographics Association.
DOI: 10.2312/eged.20211005
Kucher et al. / Project in Visualization and Data Analysis
• Importance of data and visualization for answering analytical questions• Selected examples of state-of-the-art VA systems• Information visualization and visual analytics in applied projects• Data analysis and processing in realistic projects• Tools, services, and software libraries for data analysis and visualization• Challenges and opportunities at the interfaces between the human
analyst, computational models, and visual display
• Evaluation of visualizations in applied projects• Types of bias in data, analysis, and visualization
Table 1: The PVDA course topics specified in the syllabus.
Inspired by the existing work discussing the design and imple-mentation of courses in InfoVis and VA, we report on the designand first instantiation of a full term PVDA (Project in Visualiza-tion and Data Analysis) course, which was offered to graduate andpost-graduate students at Linnaeus University during autumn term2020 (see Figure 1) and met with positive feedback from the courseparticipants.
The course is designed to cover multiple topics in VA, as listedin Table 1, and it focuses on a VA project with a given analyticalproblem and setting. The students are expected to work using agileprocesses [CH01, HC01] in teams. They are first introduced to thetheoretical aspects and tools for VA as the initial preparation forthe project work. Afterwards, the course participants are expectedto create the conceptual design of the VA project, implement theirdesigns as a VA software prototype, conduct an evaluation of theirsolution, and finally, present and reflect on the results.
In the rest of this education paper, we describe the design ofour PVDA course in the context of the curriculum and additionalcircumstances regarding graduate and post-graduate education atour department. We describe the design of our course, the specificdetails of the first course offering that took place during autumnterm 2020, and the respective outcomes.
2. Related work
The general pedagogical principles, guidelines, and techniques ap-plicable for higher education have been discussed by, for instance,Anderson and Krathwohl [AK01], Collis and Moonen [CM12],Ramsden [Ram03], and Biggs and Tang [BT07]. Curricula for com-puter science and related fields [Joi13] have been proposed andwidely discussed, too.
More specific publications relevant to our paper include the pre-vious reports and discussions of courses in InfoVis and VA, includ-ing the works by Domik [Dom00], Hanrahan [Han05], Rushmeieret al. [RDDY07], Kerren et al. [KSD08], Owen et al. [ODE∗13],Kerren [Ker13], Rohrdantz et al. [RMNK14], Ahlers [Ahl15], andSpence [Spe16]. These contributions were very useful for the de-sign of instructional materials and assessment activities for ourcourse, which are discussed in the next section. Finally, we shouldalso acknowledge the existing works addressing the challenges andopportunities of offering visualization courses outside (or on thefringe) of the scope of traditional computer science educational
programs, including the contributions by Domik [Dom09, Dom12,Dom16], Elmqvist and Ebert [EE12], Jänicke [Jän20], Santos andPerer [SP20], and Burch and Melby [BM20], among others. Theseworks are relevant to our course as we had anticipated the scenariosinvolving admission of graduate and post-graduate students with-out prior knowledge in visualization or even limited knowledge incomputer science in general, as discussed in more detail below.
3. PVDA course design
In this section, we describe the design of our course, starting withtop-level concerns and circumstances, and proceeding with the dis-cussion of lecture materials and assessment methods.
3.1. Curriculum and intended participants
While the research and educational agenda of our departmentstrongly focuses on the field of software engineering, our researchgroup offers several courses in computer graphics (for bachelor’sstudents) and visualization (for master’s students). The PVDAcourse is a recent addition to the curriculum, and it is designedas a 10 ECTS (European Credit Transfer and Accumulation Sys-tem) credits course with 33% activity rate lasting a complete termof 18 study weeks + 2 weeks of the winter break (see Figure 1). Atthe same time, most of the other courses offered at our departmentare designed for a single study period (quarter). This presents bothchallenges and opportunities with regard to scheduling, as this con-straint also has to be reflected in the design of course prerequisites,as discussed below.
The PVDA course is designed for master’s students who are ex-pected to be reasonably proficient in programming tasks as well asteam work within software development projects [CH01, HC01].However, no prior knowledge or skills in InfoVis or VA are ex-pected from most students (including international and exchangestudents, among others). Therefore, the syllabus for the PVDAcourse does not include any formal prerequisites for visualizationcourses, and this project course is thus designed to be self-sufficientwith regard to teaching material and tasks on the respective top-ics. The students are notified and strongly encouraged, however, toenroll in at least the first InfoVis course offered in the first studyperiod of the same term (see Figure 1).
Besides master’s students, we have also allowed PhD studentsat our department to participate in the PVDA course; furthermore,as our department is part of an interdisciplinary knowledge centerat our university, we have agreed to potentially admit the respec-tive PhD students majoring in different disciplines at our univer-sity, as long as they have the sufficient set of skills in data analysisand programming. This decision has been motivated by the interestfor visualization and visual analysis skills and techniques from re-searchers and practitioners from a variety of disciplines and fields.We had expected that PhD students would be interested in imme-diately applying the knowledge and skills from our course to theirongoing research tasks, or perhaps be inspired with new ideas re-lated to their fields of study. Thus, our intention was to allow PhDstudents to suggest their own data sets and tasks in order to workindividually within the scope of this course; in contrast, master’sstudents would be required to work in teams.
© 2021 The Author(s)Eurographics Proceedings © 2021 The Eurographics Association.
40
Kucher et al. / Project in Visualization and Data Analysis
After completing the course the student shall be able to:
Knowledge and Understanding
• Explain and motivate information visualization and visual analytics from a human-computer perspective as well as how these areas facilitate data analysis• Identify characteristics of state-of-the-art VA systems
Skills and Abilities
• Independently organize and carry out an agile project• Independently learn to use tools, methods, and software libraries used within InfoVis and VA• Identify analytical requirements/tasks and based on these decide which visualizations, data analyses, and interaction methods are most suitable (design goals and choices)• Implement and deploy a VA system using reasonable technical solutions• Based on the design goals, define and perform evaluations of a VA system
Judgement and Approach
• Reflect on which types of questions and analysis processes are best supported by different combinations of visualization techniques and data analysis algorithms• Reflect on how the choice of visualizations is affected by the groups of people that will use the system with respect to, e.g., used metaphors and common understanding• Reflect on the bias that exists in the system based on collected data, data processing, analysis methods, and visualization techniques
Table 2: Intended learning outcomes for the PVDA course.
The PVDA course syllabus specifies the topics listed in Ta-ble 1, and the intended learning outcomes included in the syllabusare designed appropriately to structure and facilitate the students’learning process. In accordance with the educational guidelines atour department, the intended learning outcomes (see Table 2) aregrouped in three categories motivated by the revised Bloom’s tax-onomy of educational objectives [AK01], namely, knowledge andunderstanding, skills and abilities, and judgment and approach.The instructional materials and assessment activities designed forthis course in order to achieve constructive alignment with the in-tended learning outcomes [BT07] are discussed in the followingsubsections.
3.2. Instructional materials
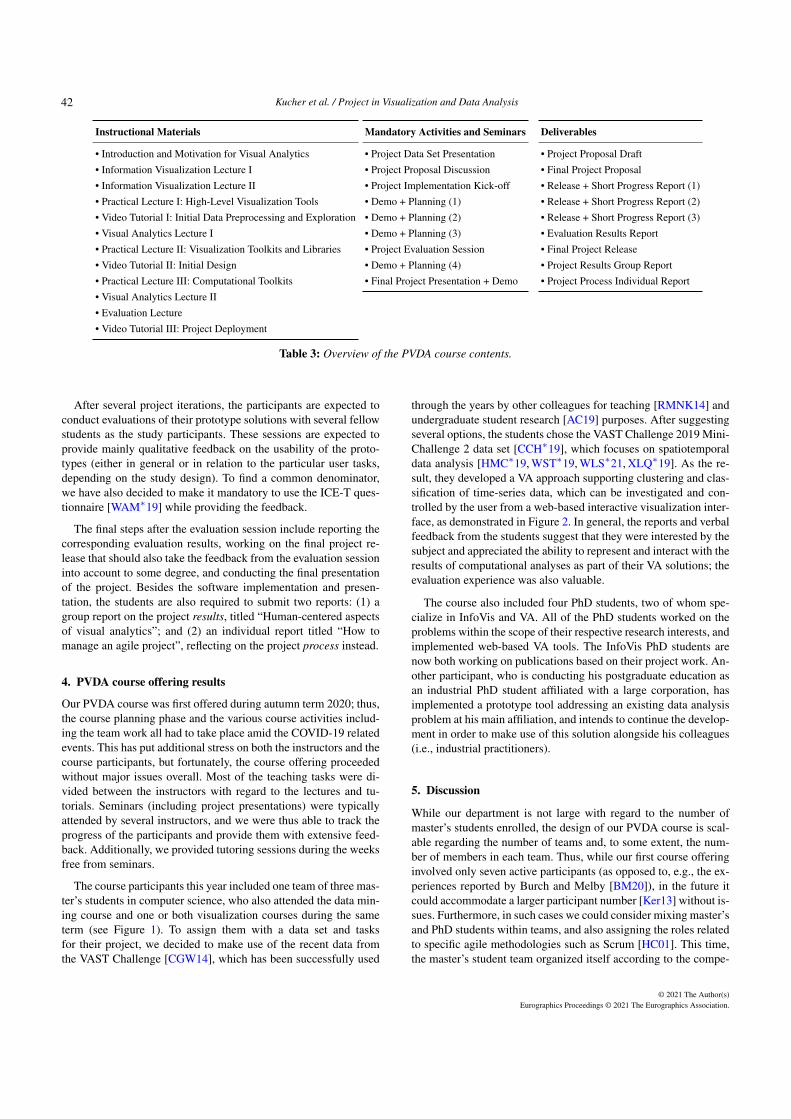
While it would be possible to focus exclusively on the students’project work within the scope of this course, we understand thatit would be extremely challenging for the master’s and even PhDstudents who lack prior experiences with InfoVis techniques, andeven more so, VA approaches. Thus, we designed the first part ofthe course (7 weeks) to contain a number of lectures focusing ontheoretical and practical aspects of VA (with a strong focus on vi-sualization), supplemented with several pre-recorded practical tu-torial videos in order to provide the students with initial examplesand tips. The list of our lecture and tutorial topics is provided inTable 3, and it was designed to address the course topics specifiedin the syllabus (see Table 1). We have tried to balance the more the-oretical (or research-oriented) materials with the practical lecturesand tutorials related to the existing software (e.g., Tableau) and pro-gramming toolkits (e.g., Plotly, Bokeh, D3.js, but also scikit-learn,for instance) that might be useful for the students both within andbeyond the scope of this course.
After discussing the overall VA approach as well as its visual andcomputational aspects, we proceed with a discussion of several ex-ample state-of-the-art VA systems as an inspiration for the students’project work. The next major topic is evaluation of VA approaches,which is discussed from several points of view and aimed at prepar-ing the students for the evaluation of their own projects by the end
of our course. Finally, one of the more practical aspects addressedby our tutorials was the deployment of the resulting VA applica-tions, as we intended for most students to develop their projects asweb applications (at least with regard to the interactive visualiza-tion components).
While we did not include any mandatory reading tasks in thiscourse and also aimed to design the instructional materials tobe self-sufficient, the course literature recommended to the stu-dents involved the books by Munzner [Mun14] (focusing on vi-sualization), Keim et al. [KKEM10] (visual analytics), and Pur-chase [Pur12] (evaluation methods).
3.3. Assessment and examination
The PVDA course was intended to focus on project work, includ-ing team work (for master’s students) and presentation activities.Our general expectations for a project topic include the presence ofboth computational and interactive visual components in the corre-sponding software implementations; the more concrete analyticalrequirements, user tasks, and designs would have to be proposed bythe students for the chosen problem and the respective data set. ThePhD students are also allowed—and in fact strongly encouraged—to propose their own research problems and data sets for the project.
All of the submissions and mandatory sessions are centeredaround the preliminary exploration of the provided data set, for-mulation of an initial design of a VA approach for the data set, anditerative project work according to the agile development princi-ples, as demonstrated in Table 3. The active phase of such projectwork would start after the initial block of lectures and tutorials wascompleted (see the timeline in Figure 1). By the end of each projectiteration (typically lasting two weeks), the participants are requiredto make a working release of their prototype (we use a local in-stallation of Gitlab for these purposes), supplement it with a shortreport (essentially, notes about the progress and plans for the nextiteration), and demonstrate this updated prototype during a semi-nar afterwards. During these seminars (as well as optional tutoringsessions), the participants would then receive feedback from theinstructors as well as other students.
© 2021 The Author(s)Eurographics Proceedings © 2021 The Eurographics Association.
41
Kucher et al. / Project in Visualization and Data Analysis
Instructional Materials
• Introduction and Motivation for Visual Analytics• Information Visualization Lecture I• Information Visualization Lecture II• Practical Lecture I: High-Level Visualization Tools• Video Tutorial I: Initial Data Preprocessing and Exploration• Visual Analytics Lecture I• Practical Lecture II: Visualization Toolkits and Libraries• Video Tutorial II: Initial Design• Practical Lecture III: Computational Toolkits• Visual Analytics Lecture II• Evaluation Lecture• Video Tutorial III: Project Deployment
Mandatory Activities and Seminars
• Project Data Set Presentation• Project Proposal Discussion• Project Implementation Kick-off• Demo + Planning (1)• Demo + Planning (2)• Demo + Planning (3)• Project Evaluation Session• Demo + Planning (4)• Final Project Presentation + Demo
Deliverables
• Project Proposal Draft• Final Project Proposal• Release + Short Progress Report (1)• Release + Short Progress Report (2)• Release + Short Progress Report (3)• Evaluation Results Report• Final Project Release• Project Results Group Report• Project Process Individual Report
Table 3: Overview of the PVDA course contents.
After several project iterations, the participants are expected toconduct evaluations of their prototype solutions with several fellowstudents as the study participants. These sessions are expected toprovide mainly qualitative feedback on the usability of the proto-types (either in general or in relation to the particular user tasks,depending on the study design). To find a common denominator,we have also decided to make it mandatory to use the ICE-T ques-tionnaire [WAM∗19] while providing the feedback.
The final steps after the evaluation session include reporting thecorresponding evaluation results, working on the final project re-lease that should also take the feedback from the evaluation sessioninto account to some degree, and conducting the final presentationof the project. Besides the software implementation and presen-tation, the students are also required to submit two reports: (1) agroup report on the project results, titled “Human-centered aspectsof visual analytics”; and (2) an individual report titled “How tomanage an agile project”, reflecting on the project process instead.
4. PVDA course offering results
Our PVDA course was first offered during autumn term 2020; thus,the course planning phase and the various course activities includ-ing the team work all had to take place amid the COVID-19 relatedevents. This has put additional stress on both the instructors and thecourse participants, but fortunately, the course offering proceededwithout major issues overall. Most of the teaching tasks were di-vided between the instructors with regard to the lectures and tu-torials. Seminars (including project presentations) were typicallyattended by several instructors, and we were thus able to track theprogress of the participants and provide them with extensive feed-back. Additionally, we provided tutoring sessions during the weeksfree from seminars.
The course participants this year included one team of three mas-ter’s students in computer science, who also attended the data min-ing course and one or both visualization courses during the sameterm (see Figure 1). To assign them with a data set and tasksfor their project, we decided to make use of the recent data fromthe VAST Challenge [CGW14], which has been successfully used
through the years by other colleagues for teaching [RMNK14] andundergraduate student research [AC19] purposes. After suggestingseveral options, the students chose the VAST Challenge 2019 Mini-Challenge 2 data set [CCH∗19], which focuses on spatiotemporaldata analysis [HMC∗19, WST∗19, WLS∗21, XLQ∗19]. As the re-sult, they developed a VA approach supporting clustering and clas-sification of time-series data, which can be investigated and con-trolled by the user from a web-based interactive visualization inter-face, as demonstrated in Figure 2. In general, the reports and verbalfeedback from the students suggest that they were interested by thesubject and appreciated the ability to represent and interact with theresults of computational analyses as part of their VA solutions; theevaluation experience was also valuable.
The course also included four PhD students, two of whom spe-cialize in InfoVis and VA. All of the PhD students worked on theproblems within the scope of their respective research interests, andimplemented web-based VA tools. The InfoVis PhD students arenow both working on publications based on their project work. An-other participant, who is conducting his postgraduate education asan industrial PhD student affiliated with a large corporation, hasimplemented a prototype tool addressing an existing data analysisproblem at his main affiliation, and intends to continue the develop-ment in order to make use of this solution alongside his colleagues(i.e., industrial practitioners).
5. Discussion
While our department is not large with regard to the number ofmaster’s students enrolled, the design of our PVDA course is scal-able regarding the number of teams and, to some extent, the num-ber of members in each team. Thus, while our first course offeringinvolved only seven active participants (as opposed to, e.g., the ex-periences reported by Burch and Melby [BM20]), in the future itcould accommodate a larger participant number [Ker13] without is-sues. Furthermore, in such cases we could consider mixing master’sand PhD students within teams, and also assigning the roles relatedto specific agile methodologies such as Scrum [HC01]. This time,the master’s student team organized itself according to the compe-
© 2021 The Author(s)Eurographics Proceedings © 2021 The Eurographics Association.
42

Kucher et al. / Project in Visualization and Data Analysis
Figure 2: Visualization front-end of the tool implemented by a team of master’s students for the VAST Challenge 2019 Mini-Challenge 2 dataset as part of our initial course offering in autumn term 2020.
tency and interests, which aligns well with the general agile prin-ciples [CH01]. The team work and communication were somewhathindered by the necessity for remote work due to COVID-19, whichwas mentioned by the students in their reflection reports. We alsowitnessed several complications during the VA prototype evalua-tion sessions, which also had to be conducted remotely via Zoom;hopefully, during the future course offerings this issue will not beactual anymore. Finally, one additional idea for a future course im-provement is to slightly adjust the schedule in the first half of thecourse, so that the active project work would start earlier and sev-eral further project iterations could be included into the time plan.
6. Conclusions
In this paper, we have described the design of a full term projectcourse on visualization and data analysis that we had recently de-veloped. Both graduate and post-graduate student participants wereoverall positive about the first course offering that took place dur-ing autumn term 2020. Our analysis of their activity and resultsin comparison to the intended learning outcomes also indicates thepositive results, despite the unexpected circumstances caused byCOVID-19. We have also discussed the lessons learned and theplans for future adjustments of the course contents and schedule.We hope this report will be useful to other educators who are de-signing or planning to update their courses in visual analytics.
Acknowledgements
This work was partially supported through the ELLIIT environmentfor strategic research in Sweden. The authors would also like tothank the participants of our course given at LNU during autumnterm 2020.
References[AC19] ANDREWS C. P., CROUSER R. J.: Using the VAST challenge in
undergraduate CS research. Journal of Computing Sciences in Colleges35, 3 (Oct. 2019), 57–66. 4
[Ahl15] AHLERS V.: Teaching information visualization: A playgroundfor classroom response systems and declarative programming projects.Poster Abstracts of IEEE VIS (2015), 25–30. 2
[AK01] ANDERSON L. W., KRATHWOHL D. R. (Eds.): A Taxonomy forLearning, Teaching, and Assessing: A Revision of Bloom’s Taxonomy ofEducational Objectives. Longman, 2001. 2, 3
[ALA∗18] ANDRIENKO N., LAMMARSCH T., ANDRIENKO G., FUCHSG., KEIM D. A., MIKSCH S., RIND A.: Viewing visual analytics asmodel building. Computer Graphics Forum 37, 6 (Sept. 2018), 275–299.doi:10.1111/cgf.13324. 1
[BM20] BURCH M., MELBY E.: What more than a hundred projectgroups reveal about teaching visualization. Journal of Visualization 23,5 (Oct. 2020), 895–911. doi:10.1007/s12650-020-00659-6.2, 4
[BT07] BIGGS J., TANG C.: Teaching for Quality Learning at Univer-sity: What the Student Does, 3rd ed. Society for Research into HighterEducation. McGraw-Hill, 2007. 2, 3
[CCH∗19] COOK K., CROUSER J., HAACK J., FALLON J., STAHELID., LIGGETT K.: VAST Challenge 2019, 2019. Accessed on March13, 2021. URL: http://cs.umd.edu/hcil/varepository/benchmarks.php#VAST2019. 4
[CE19] CHEN M., EBERT D. S.: An ontological framework for sup-porting the design and evaluation of visual analytics systems. ComputerGraphics Forum 38, 3 (June 2019), 131–144. doi:10.1111/cgf.13677. 1
[CGW14] COOK K., GRINSTEIN G., WHITING M.: The VAST Chal-lenge: History, scope, and outcomes. Information Visualization 13, 4(2014), 301–312. doi:10.1177/1473871613490678. 4
[CH01] COCKBURN A., HIGHSMITH J.: Agile software development:The people factor. Computer 34, 11 (Nov. 2001), 131–133. doi:10.1109/2.963450. 2, 5
© 2021 The Author(s)Eurographics Proceedings © 2021 The Eurographics Association.
43
Kucher et al. / Project in Visualization and Data Analysis
[CM12] COLLIS B., MOONEN J.: Flexible Learning in a Digital World:Experiences and Expectations. Open and Flexible Learning Series. Rout-ledge, 2012. 2
[CMJ∗20] CHATZIMPARMPAS A., MARTINS R. M., JUSUFI I.,KUCHER K., ROSSI F., KERREN A.: The state of the art in en-hancing trust in machine learning models with the use of visualiza-tions. Computer Graphics Forum 39, 3 (June 2020), 713–756. doi:10.1111/cgf.14034. 1
[Dom00] DOMIK G.: Do we need formal education in visualization?IEEE Computer Graphics and Applications 20, 4 (July 2000), 16–19.doi:10.1109/38.851744. 2
[Dom09] DOMIK G.: Who is on my team: Building strong teams in in-terdisciplinary visualization courses. In ACM SIGGRAPH ASIA 2009Educators Program (2009), SIGGRAPH ASIA ’09, ACM, pp. 9:1–9:7.doi:10.1145/1666611.1666620. 2
[Dom12] DOMIK G.: Fostering collaboration and self-motivated learn-ing: Best practices in a one-semester visualization course. IEEE Com-puter Graphics and Applications 32, 1 (Jan.–Feb. 2012), 87–91. doi:10.1109/MCG.2012.18. 2
[Dom16] DOMIK G.: A data visualization course at the University ofPaderborn. In Proceedings of the Pedagogy of Data Visualization Work-shop at IEEE VIS (2016), PDVW ’16. 2
[EE12] ELMQVIST N., EBERT D. S.: Leveraging multidisciplinarity ina visual analytics graduate course. IEEE Computer Graphics and Ap-plications 32, 3 (May 2012), 84–87. doi:10.1109/MCG.2012.55.2
[FvWSN08] FEKETE J.-D., VAN WIJK J. J., STASKO J. T., NORTH C.:The value of information visualization. In Information Visualization:Human-Centered Issues and Perspectives, vol. 4950 of LNCS. Springer,2008, pp. 1–18. doi:10.1007/978-3-540-70956-5_1. 1
[Han05] HANRAHAN P.: Teaching visualization. ACM SIGGRAPH Com-puter Graphics 39, 1 (Feb. 2005), 4–5. doi:10.1145/1057792.1057798. 2
[HC01] HIGHSMITH J., COCKBURN A.: Agile software development:The business of innovation. Computer 34, 9 (Sept. 2001), 120–127.doi:10.1109/2.947100. 2, 4
[HMC∗19] HU Y., MA Q., CHEN Y., CHEN H., JIN W., YE F.: Vi-sual analysis of multivariate time series of static and mobile sensors.In Proceedings of the IEEE Conference on Visual Analytics Scienceand Technology (2019), IEEE VAST ’19, IEEE, pp. 118–119. doi:10.1109/VAST47406.2019.8986910. 4
[IIC∗13] ISENBERG T., ISENBERG P., CHEN J., SEDLMAIR M.,MÖLLER T.: A systematic review on the practice of evaluating visu-alization. IEEE Transactions on Visualization and Computer Graphics19, 12 (Dec. 2013), 2818–2827. doi:10.1109/TVCG.2013.126.1
[Jän20] JÄNICKE S.: Teaching on the intersection of visualization anddigital humanities. In Proceedings of the 15th International Joint Con-ference on Computer Vision, Imaging and Computer Graphics The-ory and Applications (VISIGRAPP ’20) — Volume 3: IVAPP, (2020),IVAPP ’20, INSTICC, SciTePress, pp. 100–109. doi:10.5220/0008987101000109. 2
[Joi13] JOINT TASK FORCE ON COMPUTING CURRICULA: ASSOCIA-TION FOR COMPUTING MACHINERY (ACM) AND IEEE COMPUTERSOCIETY: Computer Science Curricula 2013: Curriculum Guidelinesfor Undergraduate Degree Programs in Computer Science. ACM, 2013.doi:10.1145/2534860. 2
[Ker13] KERREN A.: Information visualization courses for students witha computer science background. IEEE Computer Graphics and Appli-cations 33, 2 (Mar. 2013), 12–15. doi:10.1109/MCG.2013.27. 2,4
[KKEM10] KEIM D. A., KOHLHAMMER J., ELLIS G., MANSMANN F.(Eds.): Mastering the Information Age: Solving Problems with VisualAnalytics. Eurographics Association, 2010. 1, 3
[KSD08] KERREN A., STASKO J. T., DYKES J.: Teaching informationvisualization. In Information Visualization: Human-Centered Issues andPerspectives, vol. 4950 of LNCS. Springer, 2008, pp. 65–91. doi:10.1007/978-3-540-70956-5_4. 2
[Mun09] MUNZNER T.: A nested model for visualization design and val-idation. IEEE Transactions on Visualization and Computer Graphics 15,6 (Nov. 2009), 921–928. doi:10.1109/TVCG.2009.111. 1
[Mun14] MUNZNER T.: Visualization Analysis and Design. A K PetersVisualization Series. CRC Press, 2014. 3
[ODE∗13] OWEN G. S., DOMIK G., EBERT D. S., KOHLHAMMER J.,RUSHMEIER H., SANTOS B. S., WEISKOPF D.: How visualizationcourses have changed over the past 10 years. IEEE Computer Graph-ics and Applications 33, 4 (July–Aug. 2013), 14–19. doi:10.1109/MCG.2013.57. 2
[Pur12] PURCHASE H. C.: Experimental Human-Computer Interaction:A Practical Guide with Visual Examples. Cambridge University Press,2012. 1, 3
[Ram03] RAMSDEN P.: Learning to Teach in Higher Education, 2nd ed.Routledge, 2003. doi:10.4324/9780203507711. 2
[RDDY07] RUSHMEIER H., DYKES J., DILL J., YOON P.: Revisitingthe need for formal education in visualization. IEEE Computer Graph-ics and Applications 27, 6 (Nov.–Dec. 2007), 12–16. doi:10.1109/MCG.2007.156. 2
[RMNK14] ROHRDANTZ C., MANSMANN F., NORTH C., KEIM D. A.:Augmenting the educational curriculum with the Visual Analytics Sci-ence and Technology Challenge: Opportunities and pitfalls. Infor-mation Visualization 13, 4 (Oct. 2014), 313–325. doi:10.1177/1473871613481693. 2, 4
[SP20] SANTOS B. S., PERER A.: Visualization for data scientists:How specific is it? In Proceedings of Eurographics 2020 — Edu-cation Papers (2020), EG ’20, The Eurographics Association. doi:10.2312/eged.20201033. 2
[Spe16] SPENCE R.: Teaching information visualization. In Proceedingsof the Pedagogy of Data Visualization Workshop at IEEE VIS (2016),PDVW ’16. 2
[SSS∗14] SACHA D., STOFFEL A., STOFFEL F., KWON B. C., EL-LIS G., KEIM D. A.: Knowledge generation model for visual analyt-ics. IEEE Transactions on Visualization and Computer Graphics 20, 12(Dec. 2014), 1604–1613. doi:10.1109/TVCG.2014.2346481. 1
[WAM∗19] WALL E., AGNIHOTRI M., MATZEN L., DIVIS K., HAASSM., ENDERT A., STASKO J.: A heuristic approach to value-driven eval-uation of visualizations. IEEE Transactions on Visualization and Com-puter Graphics 25, 1 (Jan. 2019), 491–500. doi:10.1109/TVCG.2018.2865146. 4
[WLS∗21] WEI D., LI C., SHAO H., TAN Z., LIN Z., DONG X.,YUAN X.: SensorAware: Visual analysis of both static and mobile sen-sor information. Journal of Visualization (2021). doi:10.1007/s12650-020-00717-z. 4
[WST∗19] WEI D., SHAO H., TAN Z., LI C., LIN Z., DONG X., YUANX.: Award for outstanding comprehensive Mini-Challenge 2 solution —RadiationMonitor: An interactive system for visualizing and exploringspatial-temporal data. In Proceedings of the IEEE Conference on Vi-sual Analytics Science and Technology (2019), IEEE VAST ’19, IEEE,pp. 114–115. doi:10.1109/VAST47406.2019.8986939. 4
[XLQ∗19] XU S., LIN Y., QU D., REN K., ZHANG H.: MC2 — SUA:A sensor uncertainty analysis tool of radiation measurement data (VASTChallenge 2019 Award — Integrated tool with rich data encodings). InProceedings of the IEEE Conference on Visual Analytics Science andTechnology (2019), IEEE VAST ’19, IEEE, pp. 116–117. doi:10.1109/VAST47406.2019.8986938. 4
© 2021 The Author(s)Eurographics Proceedings © 2021 The Eurographics Association.
44