Embed Size (px)
Citation preview
Deliverable B5.2
Infrastructure Development Scheme
TREND_B5-Report_IVE-2006_08_30
Project N°: TREN-05-FP6TR-S07.43661-513504
TREND
Towards new Rail freight quality and concepts in the European Network in respect to market Demand
Deliverable B5.2 (work package B5): Infrastructure Development Scheme
Instrument: CO-ORDINATION ACTION
Thematic Priority: Sustainable Surface Transport
Due date of deliverable: PM 12 Actual submission date: 20.07.2006 Start date of project: 01.02.2005 Duration: 18 Month until 31.07.2006
Lead contractor for this deliverable: IVE, Universität Hannover, Hannover (DE) Authors: Silke Janßen, Bernd Seidel
Revision: Version of 30.08.2006
Project co-funded by the European Commission within the Sixth Framework Programme (2002-2006)
Dissemination Level
PU Public
PP Restricted to other programme participants (including the Commission Services)
RE Restricted to a group specified by the consortium (including the Commission Services) X
CO Confidential, only for members of the consortium (including the Commission Services)
Deliverable B5.2
Infrastructure Development Scheme
TREND_B5-Report_IVE-2006_08_30 Page I
Index
Index of figures IV
Index of tables VII
List of abbreviations VIII
Annexes X
1 Introduction 1
2 Work package B5 2
2.1 Objectives and content of Deliverable DB 5.2 2
2.2 Work package B5 in the context of TREND 4
2.3 Organisational structure of WP B5 6
3 Framework for Infrastructure Development Schemes 9
3.1 Definition and objectives of the TREND Infrastructure Development Scheme 9
3.2 Railway infrastructure: essential element for efficient rail services 11
3.3 European legislation and the Trans-European Transport Network 12
3.4 The evolution of a new framework for European railway infrastructure 16
3.5 Interoperability in the rail sector 17
3.6 Joining forces at European level 22 3.6.1 The Memorandum of Understanding 22 3.6.2 A methodology for corridor analysis 22 3.6.3 European Rail Infrastructure Master Plan 23
3.7 Planning and evaluation of railway infrastructure 24 3.7.1 Processes and tools 25 3.7.2 TREND data sources and data quality 32 3.7.3 The TREND network 38
Deliverable B5.2
Infrastructure Development Scheme
TREND_B5-Report_IVE-2006_08_30 Page II
4 TREND Infrastructure Development Scheme 44
4.1 Problems of an international approach 44
4.2 Methodology 45 4.2.1 Sub tasks 46 4.2.2 Corridor analyses 48 4.2.3 Network analysis 49
4.3 User requirements 49 4.3.1 The perspective of RUs and conclusions for infrastructure
development 49 4.3.2 Setting standards for international rail freight services 50 4.3.3 The TREND standard for international rail freight services 53
4.4 Corridor analysis - results 56 4.4.1 Impediments to efficient rail freight operations - Corridor A 56 4.4.2 Impediments to efficient rail freight operations - Corridor B-West 61 4.4.3 Impediments to efficient rail freight operations - Corridor B-East 65 4.4.4 Impediments to efficient rail freight operations - Corridor C 67 4.4.5 Impediments to efficient rail freight operations - Corridor D 73 4.4.6 Impediments to efficient rail freight operations - Corridor E 77 4.4.7 Impediments to efficient rail freight operations - Corridor F 79
4.5 Network analysis – results 81 4.5.1 Transport demand 81 4.5.2 Network analysis - Compliance of TREND network with market
requirements 85
5 GIS-Tool 89
5.1 Definitions and objectives 89
5.2 GIS data availability 90
5.3 Data compatibility and software evaluation 92
5.4 Collection and processing of infrastructure database 94
5.5 Technical description 95 5.5.1 Graphic user interface 95 5.5.2 Technical implementation 96
Deliverable B5.2
Infrastructure Development Scheme
TREND_B5-Report_IVE-2006_08_30 Page III
5.6 Visualisation of results 99 5.6.1 Important operational facilities and installations 99 5.6.2 Track gauge 101 5.6.3 Number of tracks 102 5.6.4 Loading gauge 103 5.6.5 Intermodal loading gauge 104 5.6.6 Line category 106 5.6.7 Maximum train load 107 5.6.8 Maximum freight train speed 109 5.6.9 Maximum train length 110 5.6.10 Safety systems 111 5.6.11 Energy systems 112 5.6.12 Network load and capacity 114
6 Results 123
6.1 Infrastructure development scheme 123
6.2 GIS tool 127
7 Recommendations 128
Deliverable B5.2
Infrastructure Development Scheme
TREND_B5-Report_IVE-2006_08_30 Page IV
Index of figures
Figure 1: Overview of workflow of WP B5 3
Figure 2: Position of work package B5 in the framework of TREND 4
Figure 3: TREND corridors 6
Figure 4: Involved subcontractors (10 IMs and 3 RUs) 7
Figure 5: Functions of the partners in WP B5 8
Figure 6: Schedule of WP B5 8
Figure 7: TEN-T outline plan “Railways”, February 2004 15
Figure 8: The players and their interaction in the European railway market 17
Figure 9: ETCS-Net CCS-TSI 21
Figure 10: Usage of infrastructure models: transition of level of detail of data 27
Figure 11: Macroscopic model approach 31
Figure 12: ERIM network 36
Figure 13: ERTMS network 37
Figure 14: Overview of TREND corridors 39
Figure 15: TREND network 41
Figure 16: Network comparison of TREND, ERIM and ERTMS 42
Figure 17: Main technical and operational parameters on TREND Corridor A - infrastructure 58
Figure 18: Main technical and operational parameters on TREND Corridor A - traction 59
Figure 19: Main technical and operational parameters on TREND Corridor A – international services 59
Figure 20: Main technical and operational parameters on TREND Corridor B-West 62
Figure 21: Intermodal profiles in Switzerland and Italy 64
Figure 22: Maximum train lengths between Freiburg and Milan 64
Figure 23: Maximum gross loads between Freiburg and Milan 65
Figure 24: Main technical and operational parameters on TREND Corridor B-East 66
Deliverable B5.2
Infrastructure Development Scheme
TREND_B5-Report_IVE-2006_08_30 Page V
Figure 25: Train path availability per day for additional regular freight trains on Corridor C 70
Figure 26: Main technical and operational parameters on TREND Corridor C (Seaport branch) 71
Figure 27: Main technical and operational parameters on TREND Corridor C (Ruhr branch) 72
Figure 28: Main technical and operational parameters on TREND Corridor D (main branch) 75
Figure 29: Main technical and operational parameters on TREND Corridor D (alternative branches) 76
Figure 30: Main technical and operational parameters on TREND Corridor E 78
Figure 31: Main technical and operational parameters on TREND Corridor F 79
Figure 32: Freight flows along TREND corridors, freight volumes; all modes 82
Figure 33: Modal Split of freight flows between/through Netherlands and Germany 83
Figure 34: Modal Split of freight flows between Italy and Germany 83
Figure 35: Modal Split of freight flows between/through Poland and Germany 84
Figure 36: Modal Split of freight flows between/through Czech Republic and Germany 84
Figure 37: Modal Split of freight flows between/through Switzerland and Germany 85
Figure 38: User interface TREND GIS-tool, example layer “length of section [km]” 95
Figure 39: Access of subcontractors and partners while GIS-tool is under construction 96
Figure 40: Detailed link information for partners and subcontractors 97
Figure 41: System of GIS-based demonstrator on TREND web site 98
Figure 42: Important TREND nodes 99
Figure 43: Number of border crossings in the TREND network 100
Figure 44: Track gauge 101
Figure 45: Number of tracks 102
Figure 46: Loading gauges GA, GB and GC from UIC leaflet 506 103
Figure 47: UIC loading gauge 104
Figure 48: Intermodal loading gauge 105
Figure 49: Line categories of UIC leaflet 700 V 106
Figure 50: UIC line categories in TREND network 107
Deliverable B5.2
Infrastructure Development Scheme
TREND_B5-Report_IVE-2006_08_30 Page VI
Figure 51: Maximum possible train loads for existing gradients in the TREND network 108
Figure 52: Maximum possible freight train speed 109
Figure 53: Maximum possible train length 110
Figure 54: Safety systems 112
Figure 55: Energy systems in TREND network 113
Figure 56: Number of passenger trains per day 114
Figure 57: Number of freight trains per day 115
Figure 58: Total number of train paths per day 116
Figure 59: Theoretically available capacity [train paths/day] 118
Figure 60: Additional available train paths per day when considering existing traffic 119
Figure 61: Overcrowded bottle neck area around Mannheim 120
Figure 62: Capacity employment rates of TREND network 121
Figure 63: locations of planned measures on TREND network 122
Deliverable B5.2
Infrastructure Development Scheme
TREND_B5-Report_IVE-2006_08_30 Page VII
Index of tables
Table 1: Team WP B5 7
Table 2: Methods for evaluating railway infrastructure and operations 29
Table 3: Examples of publicly available railway infrastructure data in network statements 38
Table 4: Comparison of TREND corridors’ main characteristics 40
Table 5: TREND corridors 41
Table 6: Comparative presentation of harmonisation parameters: AGTC, TER, ERIM and TREND 54
Table 7: Exemplarily train parameters required by market demand 56
Table 8: Infrastructural impediments ascribed to lines capacity 57
Table 9: Permitted train parameters for non-stop operating on Corridor A 60
Table 10: Infrastructural impediments ascribed to lines capacity 61
Table 11: Permitted train parameters for non-stop operating on Corridor B-West 63
Table 12: Infrastructural impediments ascribed to stations/nodes capacity 65
Table 13: Infrastructural impediments ascribed to lines capacity 66
Table 14: Infrastructural impediments ascribed to stations/nodes capacity 68
Table 15: Infrastructural impediments ascribed to lines capacity and quality 68
Table 16: Infrastructural impediments ascribed to stations/nodes capacity 74
Table 17: Infrastructural impediments ascribed to lines capacity and quality 74
Table 18: Model-train requirements fulfilled on TREND network 86
Table 19: Market requirements NOT fulfilled by TREND network* 87
Table 20: GIS data required 91
Table 21: Evaluation of GIS software 93
Table 22: Number of important installations and terminals 100
Table 23: List of estimated aliased: UIC loading gauge and intermodal gauge 105
Deliverable B5.2
Infrastructure Development Scheme
TREND_B5-Report_IVE-2006_08_30 Page VIII
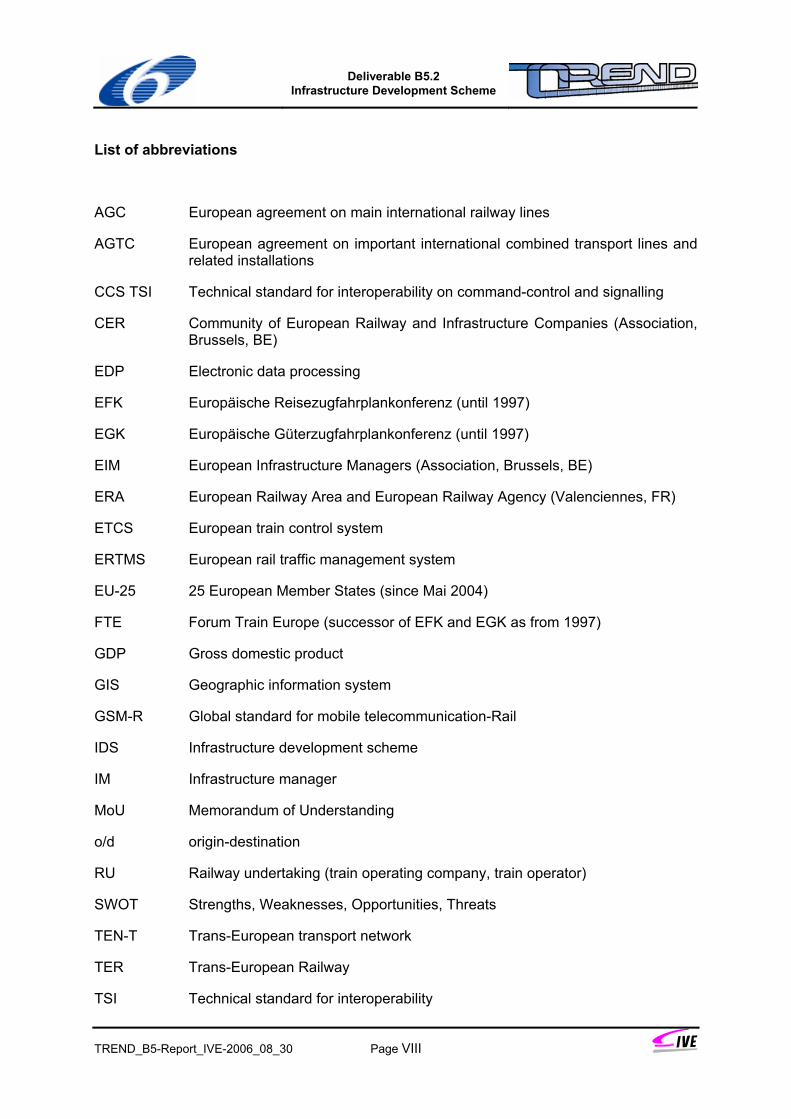
List of abbreviations
AGC European agreement on main international railway lines
AGTC European agreement on important international combined transport lines and related installations
CCS TSI Technical standard for interoperability on command-control and signalling
CER Community of European Railway and Infrastructure Companies (Association, Brussels, BE)
EDP Electronic data processing
EFK Europäische Reisezugfahrplankonferenz (until 1997)
EGK Europäische Güterzugfahrplankonferenz (until 1997)
EIM European Infrastructure Managers (Association, Brussels, BE)
ERA European Railway Area and European Railway Agency (Valenciennes, FR)
ETCS European train control system
ERTMS European rail traffic management system
EU-25 25 European Member States (since Mai 2004)
FTE Forum Train Europe (successor of EFK and EGK as from 1997)
GDP Gross domestic product
GIS Geographic information system
GSM-R Global standard for mobile telecommunication-Rail
IDS Infrastructure development scheme
IM Infrastructure manager
MoU Memorandum of Understanding
o/d origin-destination
RU Railway undertaking (train operating company, train operator)
SWOT Strengths, Weaknesses, Opportunities, Threats
TEN-T Trans-European transport network
TER Trans-European Railway
TSI Technical standard for interoperability

Deliverable B5.2
Infrastructure Development Scheme
TREND_B5-Report_IVE-2006_08_30 Page IX
UIC Union Internationale des Chemins de Fer (International Union of Railways) (Association, Paris, FR)
UNECE United Nations Economic Commission for Europe (Geneva, CH)
UNIFE European Association for Railway Interoperability (Association)
Deliverable B5.2
Infrastructure Development Scheme
TREND_B5-Report_IVE-2006_08_30 Page X
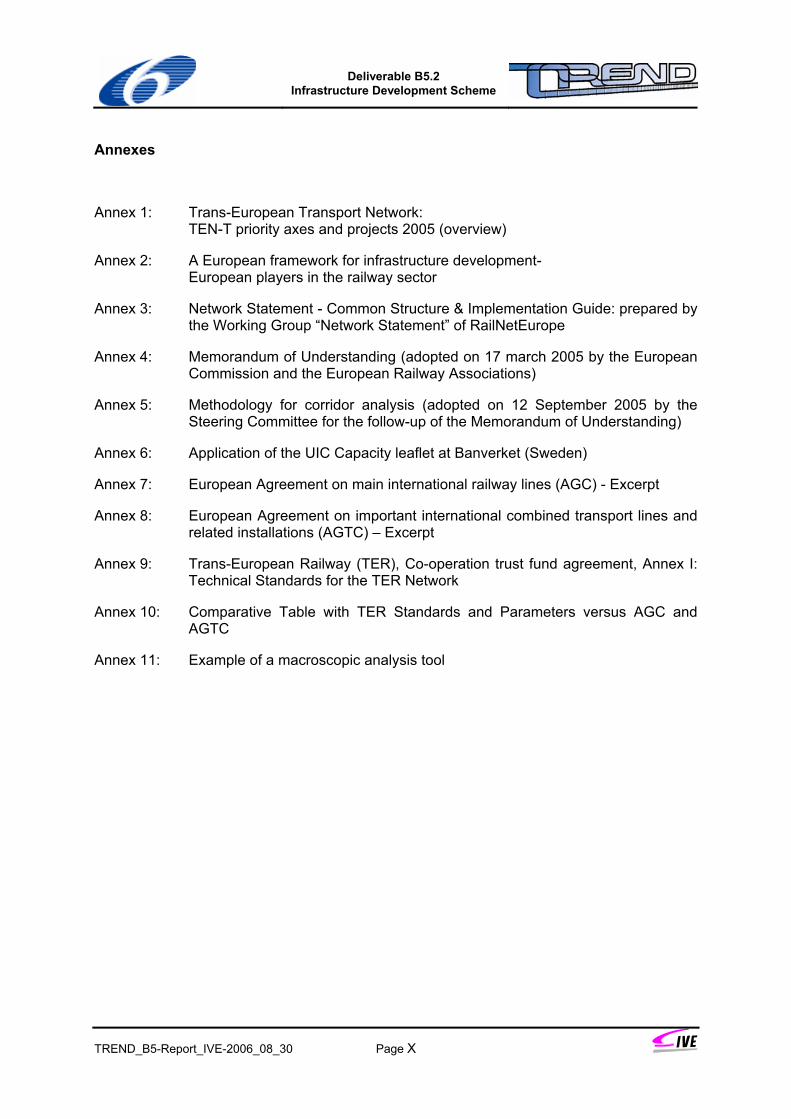
Annexes
Annex 1: Trans-European Transport Network: TEN-T priority axes and projects 2005 (overview)
Annex 2: A European framework for infrastructure development- European players in the railway sector
Annex 3: Network Statement - Common Structure & Implementation Guide: prepared by the Working Group “Network Statement” of RailNetEurope
Annex 4: Memorandum of Understanding (adopted on 17 march 2005 by the European Commission and the European Railway Associations)
Annex 5: Methodology for corridor analysis (adopted on 12 September 2005 by the Steering Committee for the follow-up of the Memorandum of Understanding)
Annex 6: Application of the UIC Capacity leaflet at Banverket (Sweden)
Annex 7: European Agreement on main international railway lines (AGC) - Excerpt
Annex 8: European Agreement on important international combined transport lines and related installations (AGTC) – Excerpt
Annex 9: Trans-European Railway (TER), Co-operation trust fund agreement, Annex I: Technical Standards for the TER Network
Annex 10: Comparative Table with TER Standards and Parameters versus AGC and AGTC
Annex 11: Example of a macroscopic analysis tool
Deliverable B5.2
Infrastructure Development Scheme
TREND_B5-Report_IVE-2006_08_30 Page 1
1 Introduction
Railways were invented in Europe some 180 years ago and have since then undergone a tremendous evolution. Railways became motor of the industrial revolution and led to an unknown mobility of people and goods. Railways became an industry in themselves, innovation in that sector influencing also other industrial sectors.
But by the 1970s at the latest railways in Europe turned into a severely sickened patient. The private car in passenger traffic and the lorry in freight traffic became the major competitors of the system. Lacking modernisation and chronic under financing of the State owned railways led to a continuous decline in market share of motorised travel and transport. The inefficient and overstaffed bodies became one of the most expensive public sectors of the European States.
The ever worsening environmental situation, caused to a major extend by road traffic, and the unbearable situation of overloaded roads and cities finally led to a turnaround in European rail policy. Initiated by the European Commission and supported by the European Parliament, the European Member States agreed on a railway policy that was intended to liberalise the rail transport market and to develop a framework that would allow railways to effectively compete with other transport modes.
The rail sector, starting in 1991, was the last transport sector in Europe to be liberalised. The vision still driving the process is to provide a railway infrastructure largely independent from train operators (railway undertakings), the latter competing “on rail” (intramodal competition) and thus unleash the forces of the operators to provide market driven, high quality rail services. The train operators using the infrastructure provided, maintained and operated by infrastructure managers (IMs) shall contribute to the infrastructure cost by paying user charges (also track access or infrastructure charges).
The careful attempt of the European legislator to, among others, separate the management and accounts of railway infrastructure from the operation of train services (Directive 91/440/EEC of 29 July 1991) was not very effective. Many incumbent national State railways resisted to the efforts of European legislation and did not allow the process to gain speed.
Therefore the European Commission started to submit a series of legislative packages some five years ago to speed up the process. Meanwhile the opening of the market in some of the Member States had reached a quite mature state. The upcoming of new train operators (“new entrants”), competing with the train operators descending from the former State railways, also attempted to operate in States not yet fully liberalised. This puts pressure on the national Governments still protecting their national companies and markets. However, the decline of rail in these non-liberalised countries proved liberalisation of the rail sector being the right way to stimulate increases in efficiency and additional transport demand.
As a result, international rail freight traffic constantly gains in relevance in successful countries and represents the fastest growing rail transport segment. Therefore a “cross-border” approach to developing European railway infrastructure is more urgently required than ever. This TREND work package therefore analyses methodologies and chances to overcome the impediments of national borders to infrastructure development. The roles of various players are demonstrated and possible support systems discussed.
Deliverable B5.2
Infrastructure Development Scheme
TREND_B5-Report_IVE-2006_08_30 Page 2
2 Work package B5
2.1 Objectives and content of Deliverable DB 5.2
TREND deliverable DB 5.2 - this document – presents the results of two work steps undertaken in Work Package B5 in TREND:
• methodology and application of the Infrastructure Development Scheme (IDS);
• development of an internet-based GIS tool for displaying and analysing railway infrastructure.
The GIS tool was used to process, display, and analyse the infrastructure data received from the TREND experts in the preparation of the IDS. Nevertheless, it is has to be considered a B5 result on it own being a demonstrator for the public display of railway infrastructure data, a novelty by the time of publication.
Infrastructure Development Scheme (IDS)
The IDS shall contribute to improve the essentials of international rail freight transport. The objective of the IDS is to pave the way for a coherent, interoperable railway infrastructure network across Europe to facilitate seamless, fast, and reliable rail freight services to the benefit of the European citizens, the European economy, and the environment.
The overall TREND approach, part B, focuses on a corridor approach to exemplify the methodologies applied and to reflect the high freight transport demand on some European axes. The corridors chosen for investigation have been identified as primary international rail freight corridors in 2010. They were selected by the TREND Consortium together with the TREND experts, all of them representatives from the infrastructure mangers of the countries involved in TREND.
The work that was undertaken is based on the TREND approach (methodology) to infrastructure evaluation and development. It is presented in this report and includes the following task clusters:
• elaboration of an overview over the current European framework for infrastructure development;
• description of the state-of-the art of infrastructure analysis and evaluation methodologies for large-scale infrastructure analysis;
• comparative analysis of railway infrastructure requirements stemming from various external sources and TREND requirements defined in Work Package B3;
• analysis of the TREND network and presentation of results;
• development of a set of recommendations for further developing railway infrastructure at European level.
The analysis results incorporate the findings from TREND B2, “Corridor analysis”, displaying the bottlenecks and weak spots in the network. The recommendations take up the action plans of the same previous Work Package.
Deliverable B5.2
Infrastructure Development Scheme
TREND_B5-Report_IVE-2006_08_30 Page 3
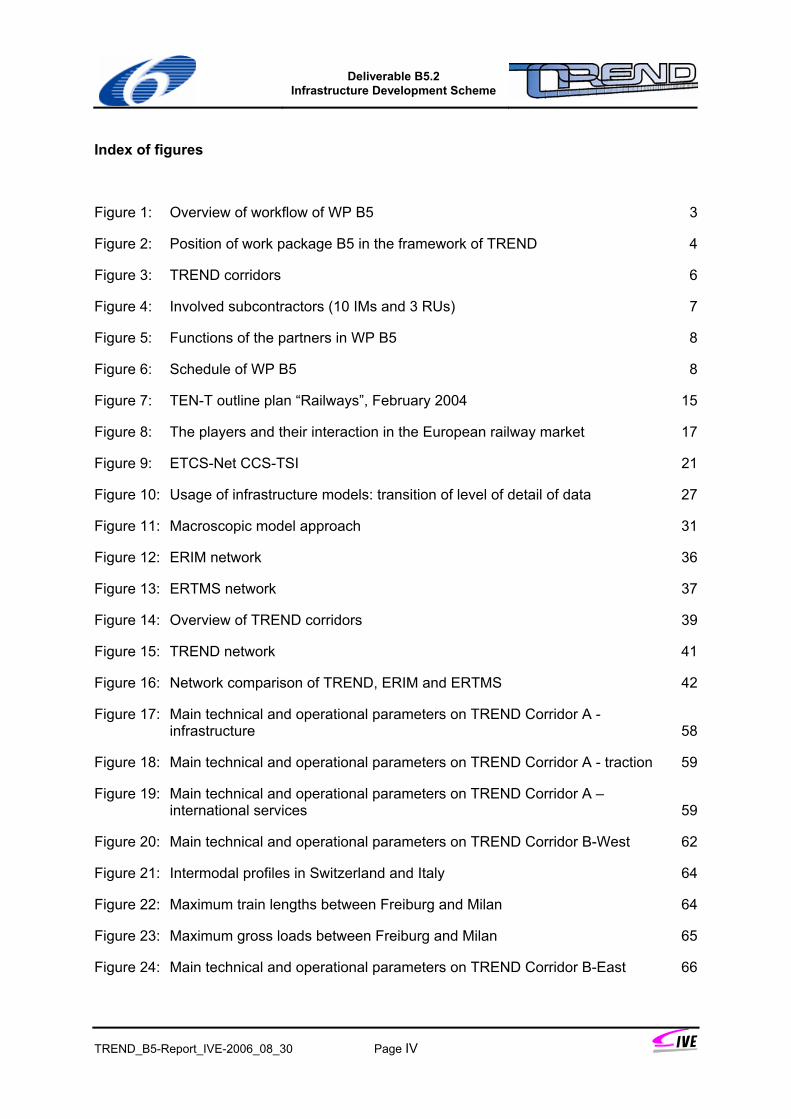
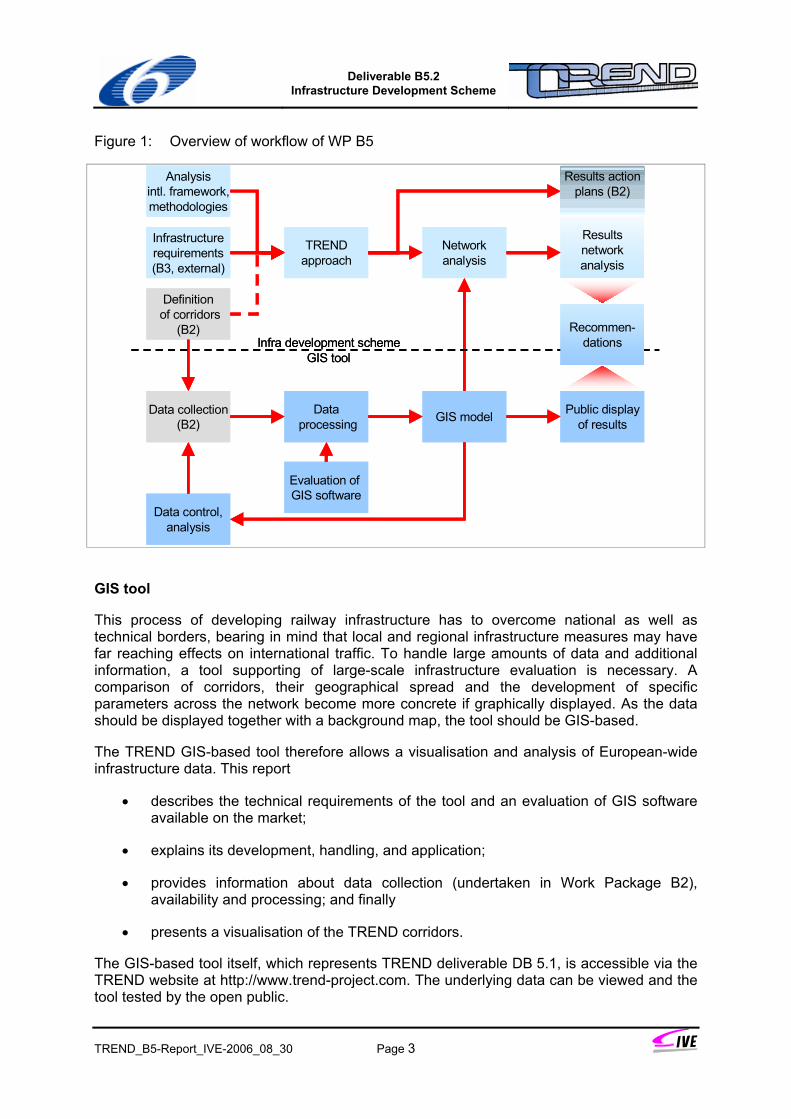
Figure 1: Overview of workflow of WP B5
Definitionof corridors
(B2)
Data collection(B2)
Dataprocessing GIS model
Evaluation of GIS software
Data control,analysis
Networkanalysis
TRENDapproach
Resultsnetworkanalysis
Analysisintl. framework,methodologies
Infrastructurerequirements(B3, external)
Public displayof results
Infra development schemeGIS tool
Recommen-dations
Results actionplans (B2)
GIS tool
This process of developing railway infrastructure has to overcome national as well as technical borders, bearing in mind that local and regional infrastructure measures may have far reaching effects on international traffic. To handle large amounts of data and additional information, a tool supporting of large-scale infrastructure evaluation is necessary. A comparison of corridors, their geographical spread and the development of specific parameters across the network become more concrete if graphically displayed. As the data should be displayed together with a background map, the tool should be GIS-based.
The TREND GIS-based tool therefore allows a visualisation and analysis of European-wide infrastructure data. This report
• describes the technical requirements of the tool and an evaluation of GIS software available on the market;
• explains its development, handling, and application;
• provides information about data collection (undertaken in Work Package B2), availability and processing; and finally
• presents a visualisation of the TREND corridors.
The GIS-based tool itself, which represents TREND deliverable DB 5.1, is accessible via the TREND website at http://www.trend-project.com. The underlying data can be viewed and the tool tested by the open public.
Deliverable B5.2
Infrastructure Development Scheme
TREND_B5-Report_IVE-2006_08_30 Page 4
The general B5 workflow is displayed in the previous figure. The horizontal line clearly demonstrates the split between the two tasks of developing and the infrastructure development scheme and the GIS tool.
2.2 Work package B5 in the context of TREND
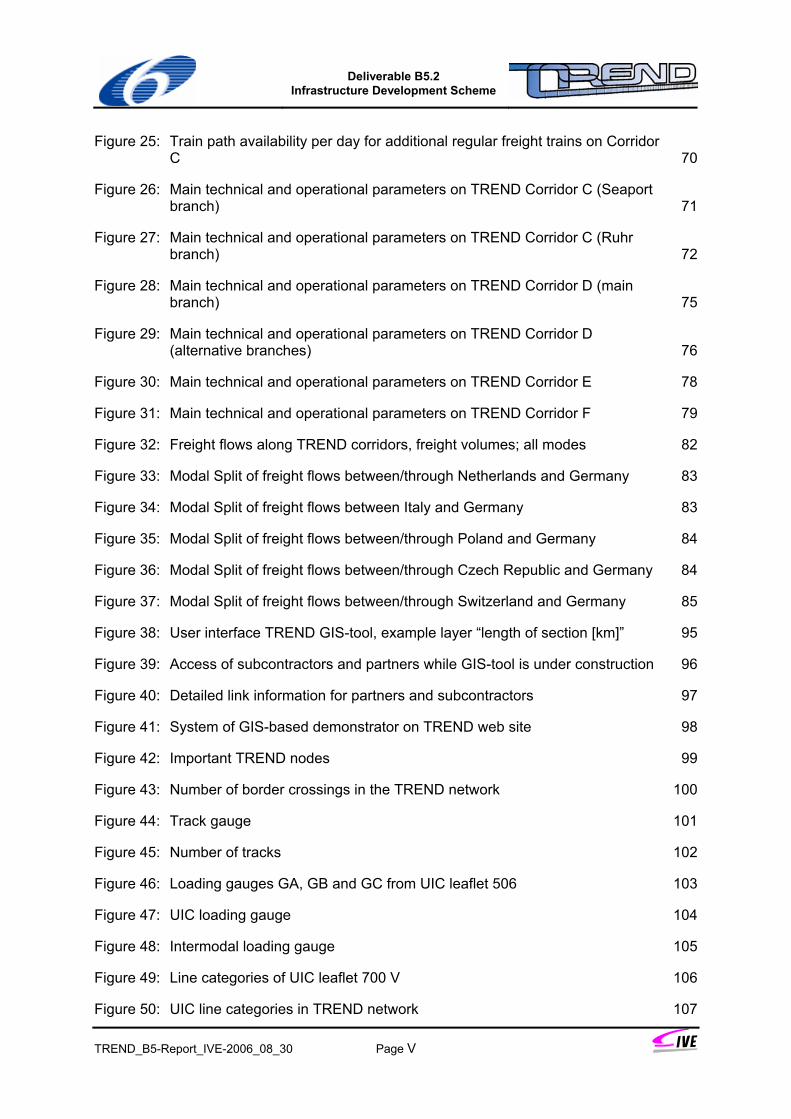
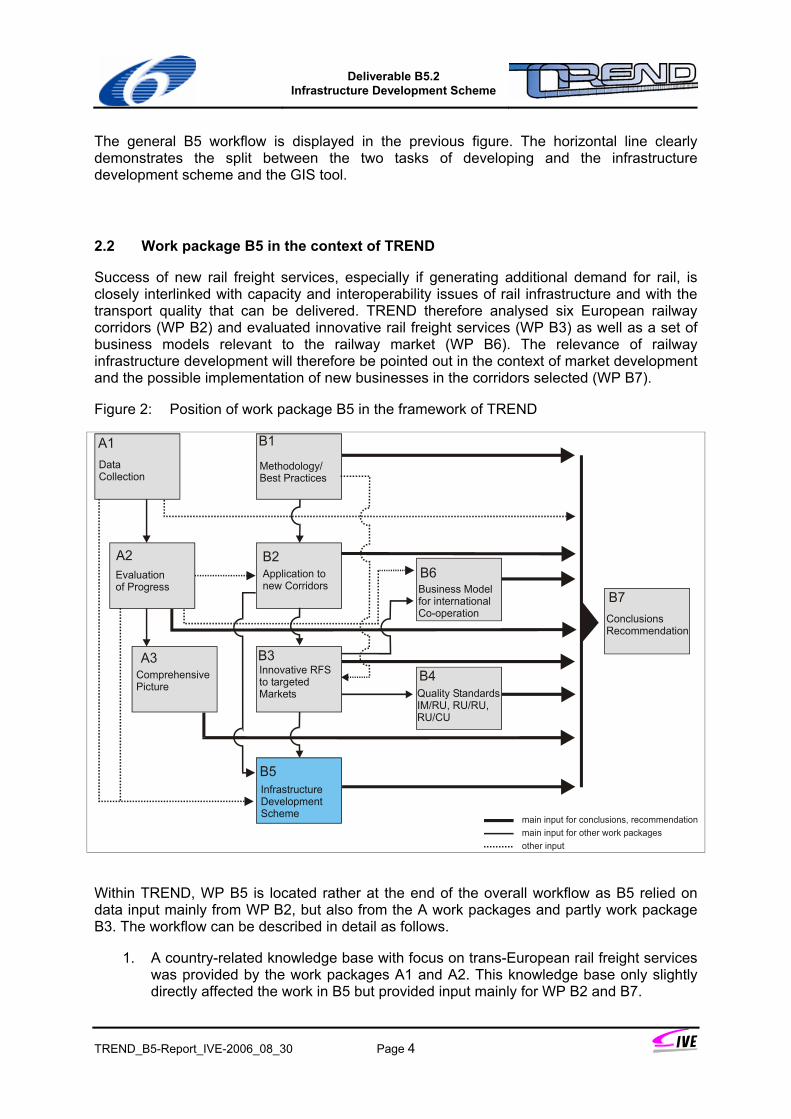
Success of new rail freight services, especially if generating additional demand for rail, is closely interlinked with capacity and interoperability issues of rail infrastructure and with the transport quality that can be delivered. TREND therefore analysed six European railway corridors (WP B2) and evaluated innovative rail freight services (WP B3) as well as a set of business models relevant to the railway market (WP B6). The relevance of railway infrastructure development will therefore be pointed out in the context of market development and the possible implementation of new businesses in the corridors selected (WP B7).
Figure 2: Position of work package B5 in the framework of TREND
A1 B1
B6
B4
A2 B2
A3 B3
B5
DataCollection
Evaluationof Progress
ComprehensivePicture
Methodology/Best Practices
Application to new Corridors
Innovative RFS to targeted Markets Quality Standards
IM/RU, RU/RU, RU/CU
InfrastructureDevelopment Scheme
Business Model for international Co-operation
B7ConclusionsRecommendation
main input for conclusions, recommendationmain input for other work packagesother input
Within TREND, WP B5 is located rather at the end of the overall workflow as B5 relied on data input mainly from WP B2, but also from the A work packages and partly work package B3. The workflow can be described in detail as follows.
1. A country-related knowledge base with focus on trans-European rail freight services was provided by the work packages A1 and A2. This knowledge base only slightly directly affected the work in B5 but provided input mainly for WP B2 and B7.
Deliverable B5.2
Infrastructure Development Scheme
TREND_B5-Report_IVE-2006_08_30 Page 5
2. The methodology guideline for corridor evaluation elaborated in WP B1 was the basis for data collection in WP B2.
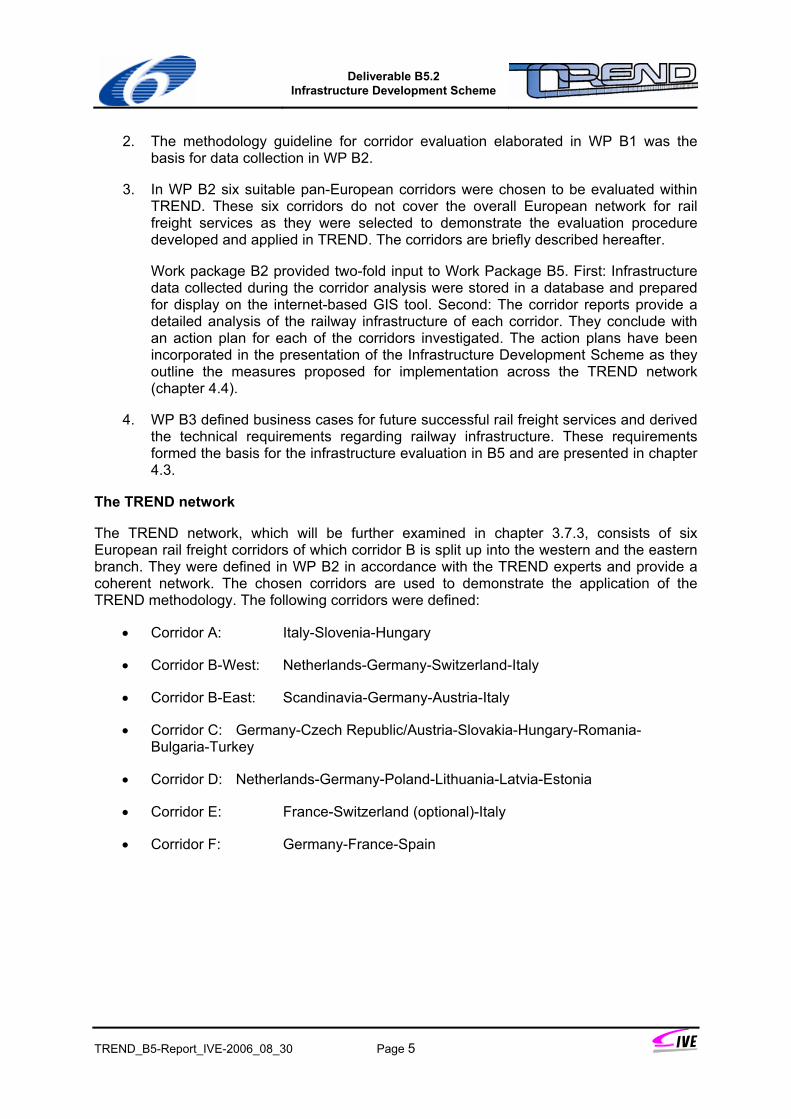
3. In WP B2 six suitable pan-European corridors were chosen to be evaluated within TREND. These six corridors do not cover the overall European network for rail freight services as they were selected to demonstrate the evaluation procedure developed and applied in TREND. The corridors are briefly described hereafter.
Work package B2 provided two-fold input to Work Package B5. First: Infrastructure data collected during the corridor analysis were stored in a database and prepared for display on the internet-based GIS tool. Second: The corridor reports provide a detailed analysis of the railway infrastructure of each corridor. They conclude with an action plan for each of the corridors investigated. The action plans have been incorporated in the presentation of the Infrastructure Development Scheme as they outline the measures proposed for implementation across the TREND network (chapter 4.4).
4. WP B3 defined business cases for future successful rail freight services and derived the technical requirements regarding railway infrastructure. These requirements formed the basis for the infrastructure evaluation in B5 and are presented in chapter 4.3.
The TREND network
The TREND network, which will be further examined in chapter 3.7.3, consists of six European rail freight corridors of which corridor B is split up into the western and the eastern branch. They were defined in WP B2 in accordance with the TREND experts and provide a coherent network. The chosen corridors are used to demonstrate the application of the TREND methodology. The following corridors were defined:
• Corridor A: Italy-Slovenia-Hungary
• Corridor B-West: Netherlands-Germany-Switzerland-Italy
• Corridor B-East: Scandinavia-Germany-Austria-Italy
• Corridor C: Germany-Czech Republic/Austria-Slovakia-Hungary-Romania-Bulgaria-Turkey
• Corridor D: Netherlands-Germany-Poland-Lithuania-Latvia-Estonia
• Corridor E: France-Switzerland (optional)-Italy
• Corridor F: Germany-France-Spain
Deliverable B5.2
Infrastructure Development Scheme
TREND_B5-Report_IVE-2006_08_30 Page 6
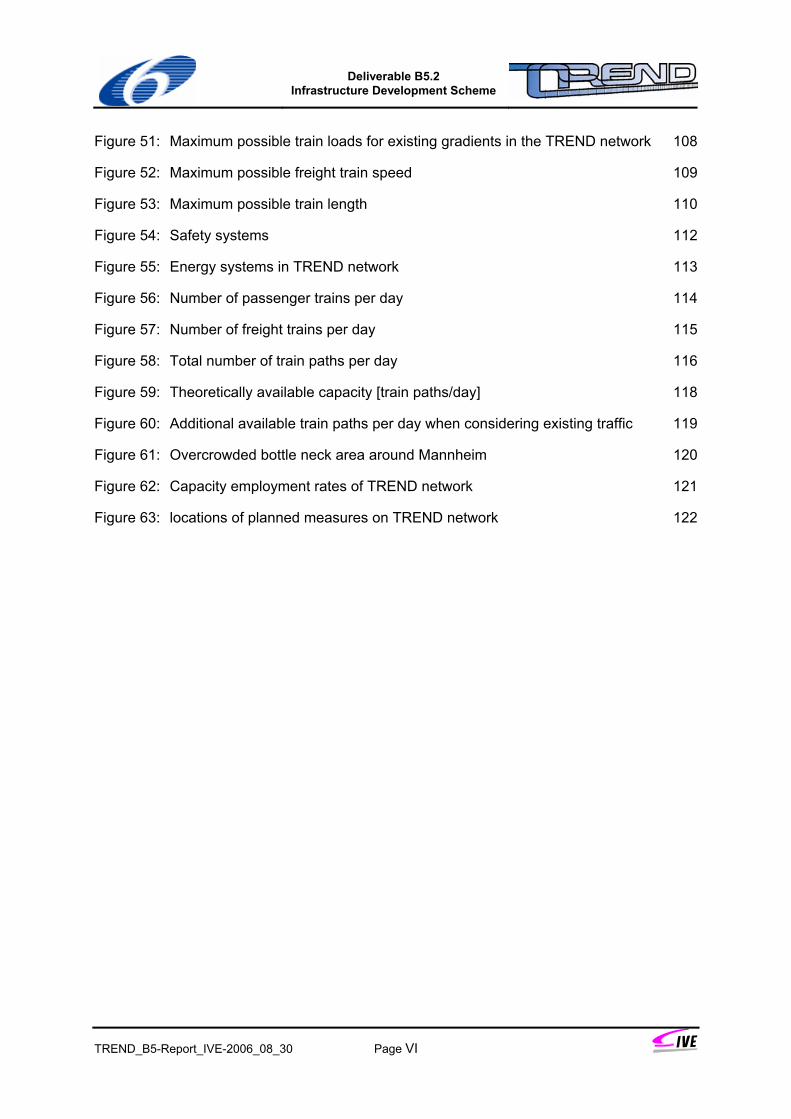
Figure 3: TREND corridors
TREND MapInfo Database Feb 2006
2.3 Organisational structure of WP B5
The B5 team consisted of one University institute, three (rail) transport consultancies, the UIC and several infrastructure managers as subcontractors. Institut für Verkehrswesen, Eisenbahnbau und –betrieb (Institute of Transport, Railway Construction and Operation, University of Hanover), Germany (IVE) was work package leader. HaCon Ingenieurgesellschaft mbH, Germany, co-ordinator of TREND, was involved as well as Centrum Dopravniho Vyzkumu, Czech Republic (CDV), and TRANSMAN Közlekedesi Rendszergazdalkodasi Tanacsado Kft, Hungary, both supportimg the team as experts for Eastern Europe. Union Internationale des Chemins de fer, France (UIC), provided valuable contributions regarding infrastructure planning at European level. The persons involved in the B5 team are listed in the following table.
Deliverable B5.2
Infrastructure Development Scheme
TREND_B5-Report_IVE-2006_08_30 Page 7
Table 1: Team WP B5 IVE, University of Hanover (WP Leader) Prof. Thomas Siefer
Silke Janßen Lars Monecke Dr. Bernd Seidel
HaCon Ingenieurgesellschaft mbH Dr. Marian Gaidzik Lars Deiterding Peter von Grumkow
CDV Tomas Sobota Loukas Soukup
Transman Dr. Janos Monigl Balazs Horvatth Zsolt Berki
UIC Gérard Dalton Paolo de Chicco Erika Nissi Alexandra Perkuszewska
Experts (subcontractors) DB Netz, RFF, SZDC, ZSR, PLK, Prorail, RFI, MAV, ADIF
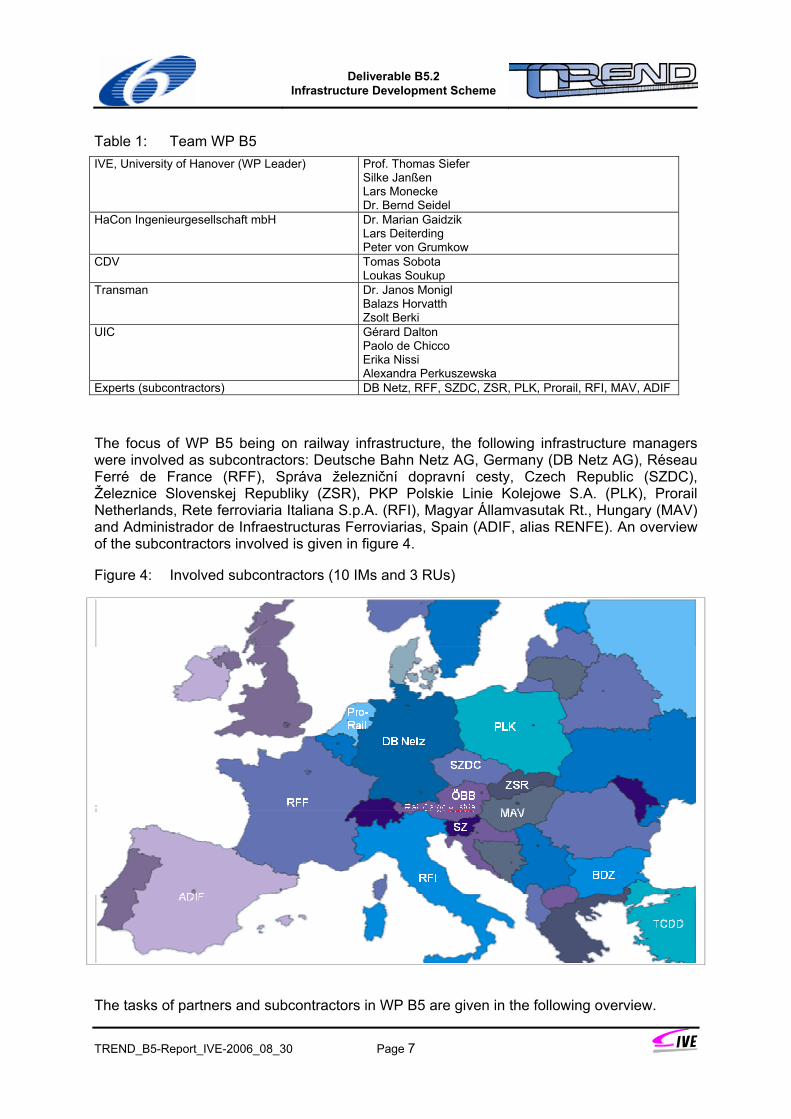
The focus of WP B5 being on railway infrastructure, the following infrastructure managers were involved as subcontractors: Deutsche Bahn Netz AG, Germany (DB Netz AG), Réseau Ferré de France (RFF), Správa železniční dopravní cesty, Czech Republic (SZDC), Železnice Slovenskej Republiky (ZSR), PKP Polskie Linie Kolejowe S.A. (PLK), Prorail Netherlands, Rete ferroviaria Italiana S.p.A. (RFI), Magyar Államvasutak Rt., Hungary (MAV) and Administrador de Infraestructuras Ferroviarias, Spain (ADIF, alias RENFE). An overview of the subcontractors involved is given in figure 4.
Figure 4: Involved subcontractors (10 IMs and 3 RUs)
The tasks of partners and subcontractors in WP B5 are given in the following overview.

Deliverable B5.2
Infrastructure Development Scheme
TREND_B5-Report_IVE-2006_08_30 Page 8
Figure 5: Functions of the partners in WP B5
IVE•co-ordination of WP B5•data processing•GIS based demonstrator•infrastructure development scheme•evaluation of work•documentation of work•reporting B5HaCon
•data collection (management)•corridor analyses in WP B2•infrastructural bottlenecks•operational bottlenecks•measures against impediments•implementation of GIS inTREND website
UIC•expertise of European railways•provision of infrastructure dataor/ and provision of contacts forcollection of infrastructure data
•operational data•co-ordination with ERIM
CDV and Transman•expertise of Eastern Europe•collection of infrastructure data•collection of operational data•data control Eastern Europe•support for corridor evaluation
Subcontractors(external experts)•expertise of IM•detailed information by corridor•checking of results•evaluation of infrastructure•evaluation of development ofinfrastructure
IVE•co-ordination of WP B5•data processing•GIS based demonstrator•infrastructure development scheme•evaluation of work•documentation of work•reporting B5HaCon
•data collection (management)•corridor analyses in WP B2•infrastructural bottlenecks•operational bottlenecks•measures against impediments•implementation of GIS inTREND website
HaCon•data collection (management)•corridor analyses in WP B2•infrastructural bottlenecks•operational bottlenecks•measures against impediments•implementation of GIS inTREND website
UIC•expertise of European railways•provision of infrastructure dataor/ and provision of contacts forcollection of infrastructure data
•operational data•co-ordination with ERIM
CDV and Transman•expertise of Eastern Europe•collection of infrastructure data•collection of operational data•data control Eastern Europe•support for corridor evaluation
CDV and Transman•expertise of Eastern Europe•collection of infrastructure data•collection of operational data•data control Eastern Europe•support for corridor evaluation
Subcontractors(external experts)•expertise of IM•detailed information by corridor•checking of results•evaluation of infrastructure•evaluation of development ofinfrastructure
Subcontractors(external experts)•expertise of IM•detailed information by corridor•checking of results•evaluation of infrastructure•evaluation of development ofinfrastructure
Time schedule
In WP B5 the following deliverables were elaborated:
• Deliverable B 5.1: Display of results by means of a GIS tool on the TREND web-site;
• Deliverable B 5.2: Infrastructure Development Scheme.
A milestone of WP B5 was the publication of the Geographic Information System (GIS) on the TREND website in December 2005. It was already available for internal use as from November 2005 for data integration and testing.
This final report covers the infrastructure Development Scheme as well as the GIS tool. For data acquisition proving to be a very time consuming process, the evaluation of infrastructure data could not start before January 2006, significantly delaying the final report.
Figure 6: Schedule of WP B5
Deliverable B5.2
Infrastructure Development Scheme
TREND_B5-Report_IVE-2006_08_30 Page 9
3 Framework for Infrastructure Development Schemes
3.1 Definition and objectives of the TREND Infrastructure Development Scheme
The development of railway infrastructure is usually supported by national infrastructure development schemes, such as general traffic plans or traffic master plans. Depending on national practice, a structured planning process is applied to evaluate projects and to recommend a ranking of projects according to the highest economic benefit to be expected and other criteria. Usually all transport modes are covered.
TREND addresses the development of an international railway network providing benefits to all the countries and regions interlinked. The development of an international railway network is an international task, funding still being primarily provided by the particular States. Co-ordinated investment and aligned implementation of (infrastructure) measures are therefore paramount to the overall success of the transport system as the weakest link of the network may define its overall performance. If particular measures, which are part of a broader infrastructure scheme, are not implemented this may devaluate other measures as they may not be fully deployed.
Hence, the TREND Infrastructure Development Scheme represents a set of procedures supporting the development of railway infrastructure at European level. All procedures aim at the enhancement or complementing of existing railway infrastructure to provide most favourable conditions for the operation of competitive rail freight services. Rail freight services may be competitive if they:
• respond to market demand. The customer requirements need to be fulfilled in terms of transport times, time windows, and reliability;
• are efficient. The effort required for the provision of particular services has to stand in a proper relation to the revenues generated.
Further technical requirements on railway infrastructure result from this approach as, for example, transport efficiency depends on the maximum allowable length and weight of trains. The appearance of a patchwork infrastructure, consisting of high-quality links but still featuring underdeveloped line sections not meeting market demand, has to be avoided.
A consistent and reproducible methodology has therefore to be found, to develop railway infrastructure to the benefit of the transport industry. Furthermore, implementation measures to be proposed and a schedule for their realisation need to find the approval of the European (Member) States. It is therefore indispensable to apply a common methodology which, at the same time:
• is applicable to all parts of the network alike (transferability);
• is based on comprehensible processes;
• produces traceable results; and
• is transparent to the effect that it may find the approval of the responsible decision makers.
Deliverable B5.2
Infrastructure Development Scheme
TREND_B5-Report_IVE-2006_08_30 Page 10
The overall TREND project therefore develops and applies a methodology for the investigation and evaluation of railway infrastructure which responds to a large extent to the above requirements. TREND has developed and applied these procedures (methodology), the Infrastructure Development Scheme, which consists of the following steps:
1. Identification of the legal framework for infrastructure development. This includes effective regulation and financing instruments basing on this legislation.
2. Identification of the parties involved in infrastructure development. Apart from policy makers, association, agencies, etc. are involved.
3. Description of the state-of-the art of infrastructure analysis and evaluation methodologies for large-scale infrastructure analysis. This will result in an overview of convenient methods for the evaluation of railway infrastructure, especially those supported by computer tools.
4. Definition of a priority infrastructure network which is intended for carrying major international freight flows, based on a corridor approach. This constitutes the innovative, characteristic element of the TREND approach.
5. Definition of standards for railway infrastructure by identifying rail infrastructure requirements. TREND as well as external standards are compared and evaluated.
6. Analysis of existing railway infrastructure. For TREND: a network of corridors.
7. Identification of demand for infrastructure measures. Overall transport demand has to match infrastructure capacities and quality requirements. Infrastructure deficits may be defined where this is not the case.
8. Identification of already decided measures, measures which have been politically agreed.
9. Development of recommendations for further developing railway infrastructure at European level, including procedures and framework conditions for infrastructure development.
No economical evaluation of measures was carried out in TREND for it is not intended to provide a detailed methodology for the development of an rail infrastructure master plan, which would also require the inclusion of a fully-fledged economic evaluation of projects. In fact, the TREND objectives are the following (TREND Description of work/work programme, page 6):
• to gather all necessary information to assess general progress in the establishment of an European Railway Area (TREND Part A);
• to analyse the prerequisites for innovative and new concepts for Trans-European rail freight services (TREND Part B);
• to lay herewith the foundations for a dedicated European rail freight network and pave the way for an Integrated Project (IP) “New Concepts for Trans-European Rail Freight Services” (remark: within the 6th Framework Research Programme) to demonstrate the impact of the proposed measure (not part of TREND).
Deliverable B5.2
Infrastructure Development Scheme
TREND_B5-Report_IVE-2006_08_30 Page 11
The focus of TREND is therefore clearly on the analysis and development of framework conditions for new rail freight services and improved rail freight quality responding to market conditions. The methodology is first fully applied including the demonstration of supporting tools. Passenger transport is not part of TREND.
3.2 Railway infrastructure: essential element for efficient rail services
The technical principles of railways involve a close relationship between railway infrastructure, rolling stock, and railway operations. Railway infrastructure may thus impose severe restrictions to vehicles and operations in terms of:
• physical dimensions of trains like specific weight (per axle, per metre), length, loading gauge, etc.;
• way-side and on-board technical equipment such as signalling systems, telecommunications systems, braking systems;
• further commercially relevant characteristics, for example train speed, overall weight of train (load hauled), (change of) rail gauge, (change of) type of current, capacity of railway infrastructure.
Railway infrastructure currently available across Europe is very heterogeneous and to a large extent not yet standardised. Railway infrastructure has therefore, to a much larger extent than for example road infrastructure, a significant impact on the market opportunities for railway undertakings and on overall rail transport cost. The historical roots for this development are well known and have been widely discussed. Many attempts were made to overcome the technical and organisational barriers, being geographically mostly identical with national borders.
The requirements of railway undertakings on railway infrastructure are primarily determined by the type of commercial activities as for example the specific weight of the load generally correlates with the specific transport price achievable on the market. Heavy loads, usually bulk freight, only achieve a low specific price but are little demanding regarding gentle transport operation (low risk of damage). High value freight tends to be more damageable at a low specific weight, furthermore often imposing a restricted time frame to transport operation. The following aspects shall highlight the areas of conflict in which an entrepreneur in the rail sector is acting regarding railway infrastructure.
• The quality of the substructure of railway routes limits the specific weight of trains and thus the payload factor of the service. Especially when transporting heavy goods this fact may restrict the efficiency of the service.
• The loading gauge to comply with may impede services from operating at all or from offering competitive transport conditions. In combined transport, for example, the transport of high-volume trailers often causes problems due to loading gauge problems in tunnels.
• The load hauled by a single locomotive may be limited by the topography of a rail route, by the characteristics of the signalling system (in conjunction with the braking system of a train), or the electric power supply system. A second locomotive, for
Deliverable B5.2
Infrastructure Development Scheme
TREND_B5-Report_IVE-2006_08_30 Page 12
example, imposes additional, step-change cost on the overall service even if the maximum load hauled by a single locomotive is only slightly exceeded.
• Making use of the maximum permissible train length of 700 m may permit a railway undertaking to operate a commercially viable service. On the other hand, the length of passing sidings or other shortcomings restrict the length of freight trains on certain routes to a lower length.
• Changing signalling/ train control systems, current systems, communications systems etc. especially at borders require time consuming and cost effective changes of locomotive and even wagons (rail gauge).
• Insufficient infrastructure standards on certain route sections such as the permissible loading gauge may restrict the choice of rail routes and may thus require detours or prevent a service from operating at all.
• Capacity problems in parts of the network may inflict quality problems of a train service or may prevent a service from operating within its optimum time window or from expanding.
The European legislators are aware of the railway industry’s problems. Therefore much has been done at European level to initiate significant change in the railway sector and to overcome the European technical and organisational patchwork approach. In the following chapters, both the political and the practical approaches to defining a new framework for the European railway sector are described.
3.3 European legislation and the Trans-European Transport Network
In 1993, transport infrastructure was first explicitly incorporated in European legislation when the Trans-European Networks were introduced to the European Treaty (Maastricht Treaty). Since then, Title XV defines the role of transport, telecommunications and energy infrastructures for European integration. The objective is to “to enable citizens of the Union, economic operators and regional and local communities to derive full benefit from the setting-up of an area without internal frontiers” according to Article 154 of the Treaty. And Article 155(1) requests that the Community “shall establish a series of guidelines covering the objectives, priorities and broad lines of measures envisaged in the sphere of trans-European networks; these guidelines shall identify projects of common interest …”
Already in 1994 the Heads of Government of the Member States agreed on the “Essen list”, including 14 projects to be given high priority for their implementation. The “Essen projects” were all intended to have a significant impact on the development of a European transport system.
Deliverable B5.2
Infrastructure Development Scheme
TREND_B5-Report_IVE-2006_08_30 Page 13
As requested by Article 155 of The Treaty, “guidelines covering the objectives, priorities and broad lines of measures” in the transport sector were first adopted in 19961 aiming at:
• integrating national networks and modes of transport;
• linking peripheral regions to central areas of the Union;
• improving safety and efficiency of the networks.
The guidelines for the first time defined a trans-European transport network (TEN-T), a reference network for the application of EU transport policies such as the realisation of interoperability (cf. section 3.5), the implementation of infrastructure charging, weekend bans, etc. The trans-European transport network includes all transport modes: roads, railway lines, airports, international sea ports, inland ports and inland waterway arteries, traffic management systems. Priority projects defined by the 1996 Decision fully incorporated the “Essen projects”.
In 2001, the guidelines were first amended2, primarily reshaping the framework for ports and intermodal terminals. At the same time the European Commission published its Transport White Paper3, giving its overall transport policy until 2010 a clear shape. The central objectives were defined to be
• the gradual decoupling of transport and GDP by re-balancing the modal split; and
• improving quality and safety of transport.
60 measures were listed in the White Paper, among them being an update of the TEN-T guidelines. Action seemed necessary as the implementation of the priority measures did not gain speed due to low investment of the Member States. The completion of the priority projects, to a significant part relieving infrastructure bottlenecks, was hence delayed. The Commission therefore initiated a first revision of the TEN-T guidelines later in 2001. The intention was to reduce “… the bottlenecks in the planned or existing network without adding new infrastructure routes, by concentrating investment on a few horizontal priorities and a limited number of new specific projects”4.
The revision was carried out by a High Level Group led by Mr Karel Van Miert and comprising representatives of 15 EU-Member States, the 12 Accession Countries and European Investment Bank (EIB). The discussion was based on a set of pre-agreed criteria
1 Decision No 1692/96/EC of the European Parliament and of the Council of 23 July 1996 on Community guidelines for the development of the trans-European transport network
2 Decision No 1346/2001/EC of the European Parliament and of the Council of 22 May 2001 amending Decision No 1692/96/EC as regards seaports, inland ports and intermodal terminals as well as project No 8 in Annex III
3 White Paper - European transport policy for 2010: time to decide, COM(2001) 370, Brussels, 12 September 2001
4 From http://europa.eu.int/comm, Transport and Energy, TEN-T; December 2005.
Deliverable B5.2
Infrastructure Development Scheme
TREND_B5-Report_IVE-2006_08_30 Page 14
for project selection. The infrastructure projects to be selected had to fulfil the following requirements:
• location on a major European axis;
• contribution to the removal of a major bottleneck;
• addressing sustainability;
• commitment of countries concerned.
More than 100 project proposals were analysed. The process included an Impact assessment and public consultation. The recommendations to the Commission were delivered in July 2003.
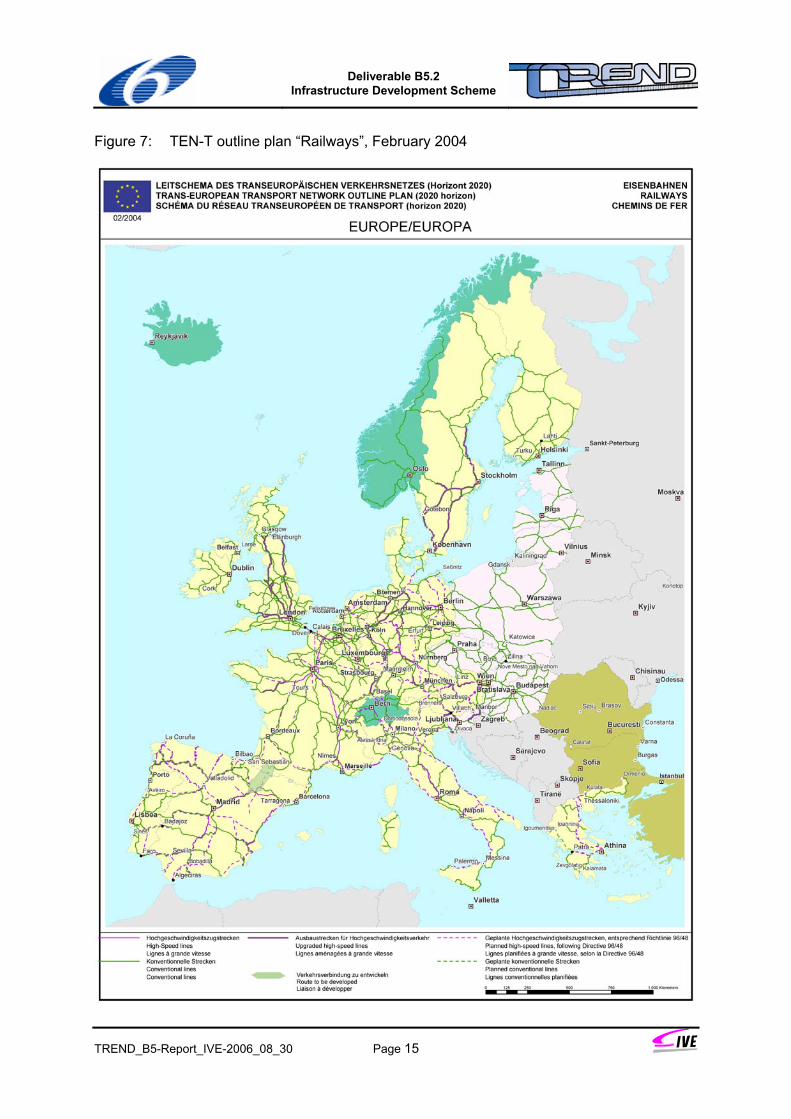
The 2004 amendments, Decision 884/2004/EC5, adopted on 29 April 2004, also paid attention to the enlargement of the European Union in 2004. The updated list defining 30 priority projects (cf. Annex 1) concentrates on cross-border projects and focuses on investment in rail, waterborne transport and intermodal infrastructure to ensure modal shift and more sustainable mobility patterns. The TEN-T network is defined in the TEN-T outline plan (2020 horizon) and attached to the 2004 Decision. The railway plan is displayed below.
Revised Article 10 of Decision 884/2004/EC emphasises the importance of interoperability to the railway sector, “…which shall be brought about in particular by technical harmonisation and the ERTMS harmonised command and control system recommended for the European railway network” (Article 10(6), for ERTMS also cf. section 3.5). As for the process of implementation, Article 10(6) also requests:
“To this end, a deployment plan, coordinated with national plans, shall be established by the Commission in consultation with the Member States.”
It has to be retained, that the realisation of projects still heavily depends on the activities of the Member States and that the Community will only provide financial contributions to infrastructure investment if national action is taken and complementary investment is guaranteed. The financial perspectives 2007-2013 of the European Union also reveals that the EU falls far behind its ambitious objectives as the TEN-T budget is intended to only add up to approximately one third of the budget of roughly 20 billion EUR originally earmarked.
5 Decision 884/2004/EC of the European Parliament and of the Council of 29 April 2004 amending Decision No 1692/96/EC on Community guidelines for the development of the trans-European transport network.
Deliverable B5.2
Infrastructure Development Scheme
TREND_B5-Report_IVE-2006_08_30 Page 15
Figure 7: TEN-T outline plan “Railways”, February 2004
Deliverable B5.2
Infrastructure Development Scheme
TREND_B5-Report_IVE-2006_08_30 Page 16
3.4 The evolution of a new framework for European railway infrastructure
Only in the recent half decade significant progress has been made to steer the nationally oriented railway networks towards a harmonised European one, intensifying co-operation of players across borders, harmonising technical standards and the legal base for approving railway undertakings, for example.
As from the beginning of the 1990s, this development has to a large extent been driven by European legislation, starting with the obligation to separate the accounts of infrastructure management (by infrastructure managers, IMs) and the operation of railway services (by railway undertakings, RUs)6. This obligation led to a restructuring of the railway sector, splitting up the formerly integrated state railways (the incumbent railways or monopolists), according to various models for a des-integrated railway industry.
Only a few countries, at those early times, acknowledged that only flexible and modern railways will have a chance to survive in a competitive transport market and took the early initiative to largely liberalise their national railway markets.
Competition among railway undertakings (on-rail competition) requires a free access to railway infrastructure and railway-related services, the latter of which can, until today, often only be provided by the (formerly) national railway companies. The development of a fully liberalised railway market is still a process of transition and very heterogeneous framework conditions exist across Europe.
As regards the development of railway infrastructure, the discussion is largely governed by the implementation of a trans-European railway network to form the backbone for international railway services. The infrastructure, still of fragmented character mainly due to national signalling and current systems, hampers the free operation of locomotives across Europe. The lack of interoperability in the railway sector therefore remains a severe competitive disadvantage compared to other modes, mainly the road sector.
A broad range of national and European players is involved in the process, shaping a European Railway Area as proclaimed by the European Commission. The Trans-European Railway Network (cf. also section 3.1) and interoperability issues (cf. section 3.5) play a paramount role in this respect.
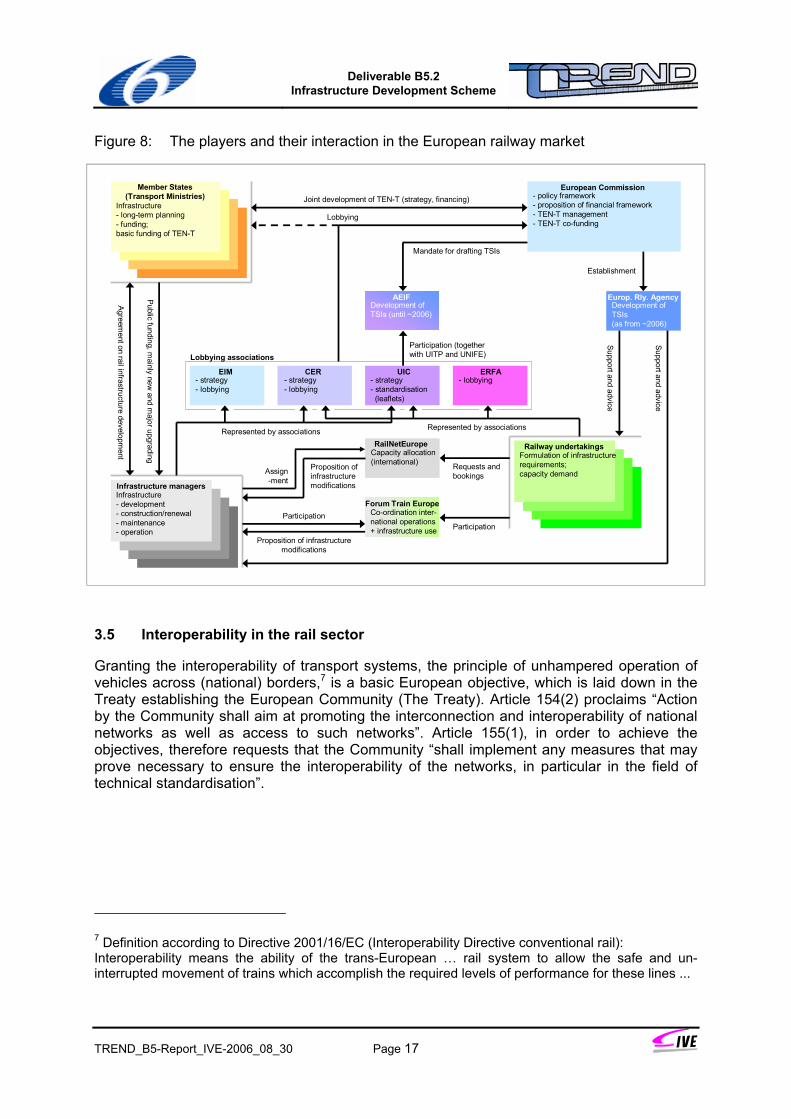
The following figure provides a general conspectus of the European players involved of shaping the European railway sector. The focus of this presentation is on the development of railway infrastructure and the roles and interaction the players perform. A more detailed presentation of the railway industry is provided in Annex 2.
6 Council Directive 91/440/EEC of 29 July 1991 on the development of the Community's railways amended by Directive 2001/12/EC of the European Parliament and of the Council of 26 February 2001
Deliverable B5.2
Infrastructure Development Scheme
TREND_B5-Report_IVE-2006_08_30 Page 17
Figure 8: The players and their interaction in the European railway market
European Commission
AEIF
Member States(Transport Ministries)
Europ. Rly. Agency
Infrastructure managers
Railway undertakings
ERFAUICEIM CER
RailNetEurope
Forum Train Europe
Lobbying
Mandate for drafting TSIs
Joint development of TEN-T (strategy, financing)
Represented by associations Represented by associations
- strategy- lobbying
- strategy- standardisation
(leaflets)
- strategy- lobbying
- lobbying
Capacity allocation(international)
Co-ordination inter-national operations+ infrastructure use
Formulation of infrastructurerequirements;capacity demand
Infrastructure- development- construction/renewal- maintenance- operation
Infrastructure- long-term planning- funding;basic funding of TEN-T
Agreement on rail infrastructure developm
ent
Public funding, mainly new
and major upgrading
Support and advice
Support and advice
Development ofTSIs (until ~2006)
Development ofTSIs(as from ~2006)
- policy framework- proposition of financial framework- TEN-T management- TEN-T co-funding
Proposition ofinfrastructuremodifications
Proposition of infrastructuremodifications
Establishment
Requests andbookings
ParticipationParticipation
Participation (togetherwith UITP and UNIFE)Lobbying associations
Assign-ment
3.5 Interoperability in the rail sector
Granting the interoperability of transport systems, the principle of unhampered operation of vehicles across (national) borders,7 is a basic European objective, which is laid down in the Treaty establishing the European Community (The Treaty). Article 154(2) proclaims “Action by the Community shall aim at promoting the interconnection and interoperability of national networks as well as access to such networks”. Article 155(1), in order to achieve the objectives, therefore requests that the Community “shall implement any measures that may prove necessary to ensure the interoperability of the networks, in particular in the field of technical standardisation”.
7 Definition according to Directive 2001/16/EC (Interoperability Directive conventional rail): Interoperability means the ability of the trans-European … rail system to allow the safe and un-interrupted movement of trains which accomplish the required levels of performance for these lines ...
Deliverable B5.2
Infrastructure Development Scheme
TREND_B5-Report_IVE-2006_08_30 Page 18
Technical standards for interoperability (TSIs)
Starting with the high-speed rail (HSR) sector, European legislation further refined the request for standardisation activities adopting Council Directive 96/48/EC8, defining the technical subsystems to be covered by Technical Standards for Interoperability. Consequently, the European Commission adopted the first six TSIs in Mai 2002 (Commission Decisions) covering the maintenance of rolling stock, control-command and signalling systems, railway infrastructure, energy supply systems, railway operation and rolling stock in the HSR sector. Requirements regarding the subsystems ‘users’ and ‘environment’ are set out in the TSIs concerned.
Further TSIs have been published since then, focussing on the standardisation of conventional rail systems as requested by Directive 2001/16/EC. They do not significantly affect the development of railway infrastructure but generally intend to harmonise the European environment for a more smooth operation of international trains9.
The existence of a multitude of national signalling, train/command control and radio telecommunications systems, however, have proven to be the major obstacles to efficiently operating international and interoperable train services. Standardisation therefore also has to address “command-control and signalling” being a significant subsystem from the operational point of view. A preliminary version addressing this subsystem has first been agreed by the Committee according to Article 21, Commission Decision 2001/16/EC, on 23 November 2004. This draft TSI emphasises that its scope is the trans-European conventional rail system as described in Annex I to Directive 2001/16/EC. The Directive points out that both rolling stock and railway infrastructure together form the rail system, on-board equipment of trains and way-side infrastructure of this subsystem interacting very intensively.
To further delimit the geographical scope of European action regarding improved rail interoperability, Annex I of Directive 2001/16/EC makes further reference to “Decision 1692/96/EC of the European Parliament and of the Council of 23 July 1996 on Community guidelines for the development of the trans-European transport network”, an update of which was decided on 29 April 200410 (read also section 3.1). Hence, the Trans-European Railway Network as a whole represents the geographical scope of the infrastructure covered by the standardisation processes initiated by the Interoperability Directives and being translated by the TSIs.
8 Council Directive 96/48/EC of 23 July 1996 on the interoperability of the trans-European high-speed rail system
9 Commission Decision 2006/66/EC of 23 December 2005 concerning the technical specification for interoperability relating to the subsystem ‘rolling stock — noise’ of the trans-European conventional rail system and Commission Regulation (EC) 62/2006 of 23 December 2005 concerning the technical specification for interoperability relating to the telematic applications for freight subsystem of the trans-European conventional rail system
10 Decision 884/2004/EC of the European Parliament and of the Council of 29 April 2004 amending Decision No 1692/96/EC on Community guidelines for the development of the trans-European transport network.
Deliverable B5.2
Infrastructure Development Scheme
TREND_B5-Report_IVE-2006_08_30 Page 19
European Rail Traffic Management System (ERTMS)
Until today, the large variety of control-command and signalling systems in Europe imposes the most important obstacle to international railway operation. Locomotives need to be equipped with several on-board equipment units so far if they are intended to operate in several countries. This is expensive and weakens the competitive position of the railways in an intermodal competition. Furthermore, changing conventional locomotives at the borders is also expensive and time consuming.
The urgent need for a technically harmonised railway network had also been recognised by the European Commission. In 1996, the so-called European Rail Traffic Management System ERTMS was first requested to be established on high speed railway lines by the High Speed Rail Interoperability Directive 96/48/EC. Interoperability Directive 2001/16/EC set out the requirement for a technical harmonisation also of the control-command and signalling subsystem of the conventional rail system (see above).
Therefore, the European Rail Traffic Management System (ERTMS) has been developed and standardised to gradually replace the existing systems. The signalling industry and the national railways have therefore in a long process standardised train control and radio telecommunications systems. Hence, ERTMS comprises the European Train Control System (ETCS) and the GMS-R system:
• ETCS is a European-wide train control standard allowing to operate locomotives/ trains throughout Europe with only one single on-board equipment. ETCS comprises the specification of three technological levels being downwards compatible. This allows to install a technology which is consistent with the requirements of a specific railway line.
• GSM-R stands for Global Standard for Mobile Telecommunication-Rail. The new technology is intended to integrate all radio telecommunication tasks in the railway sector in one single platform.
An implementation of ERTMS is cost-effective for railway infrastructure managers as well as for railway undertakings. Cost cover investment as well as the implementation of new processes and procedures. Investment levels very much differ for the implementation of ETCS and GSM-R mainly due to the lifetime of assets which is much longer for command-control equipment than for radio telecommunication equipment. The strategies for replacing legacy systems by ERTMS technology therefore can be different allowing the launch of GSM-R independently from ETCS11.
The implementation of ETCS needs to follow a very sophisticated methodology for the following reasons:
• Synergy effects: ETCS is only advantageous to railway undertakings if it contributes to seamless train operation and minimises on-board equipment requirements by providing a single technology on a transport route. ETCS implementation therefore needs to follow a corridor approach and has to avoid patchwork solutions.
11 ETCS Level 3 requires GWM-R technology. As level 3, encompassing radio-based train control, is technologically most advanced, level 3 technology is not planned for implementation yet.
Deliverable B5.2
Infrastructure Development Scheme
TREND_B5-Report_IVE-2006_08_30 Page 20
• Geographical coverage: Rail transport routes or corridors need to be carefully selected, following current trade lanes and anticipating future transport demand were ever possible.
• Stakeholder participation: Infrastructure managers and other parties involved in infrastructure development need to be closely involved and commit themselves to the results agreed. Corridors need to be approved by all parties to grant their broad support all through the implementation process.
• Schedule for implementation: The sequence of the implementation of measures should provide maximum benefit to the users. The installation of non-successional ETCS sections enclosing legacy command and signalling systems along a corridor is little beneficial.
• Financing: Funding decisions have to be taken in consideration of the maximum benefit to the transport industry and in respect of the schedule for implementation.
ETCS-Net
The working group elaborating the TSI on “command-control and signalling” (CCS TSI)12 was obviously aware of the aforementioned interrelations. The CCS TSI therefore proposes to focus ETCS implementation on a corridor-based core network to avoid a “fragmented approach” and to cope with “the perceived constraints on investment”. The objectives pursued with a core network, called the ETCS-Net corridor concept, are the following:
1. “To enable the creation of an interoperable rail backbone across Europe (coined hereafter as ETCS-Net) enabling the development of new and improved quality rail services that can ultimately heighten the competitive profile of rail transport notably in those market segments of major growth potential – viz. international freight transport;
2. To constitute a focus for trans-national co-ordination efforts and for concentration of financing instruments in view of an accelerated and wider-ranging deployment of ERTMS/ETCS across the main routes of the trans-European rail network;
3. To move towards the conditions of “critical mass” for ERTMS/ETCS to emerge as the natural market selection solution for new and upgrade signalling projects of the conventional rail network across Europe.”
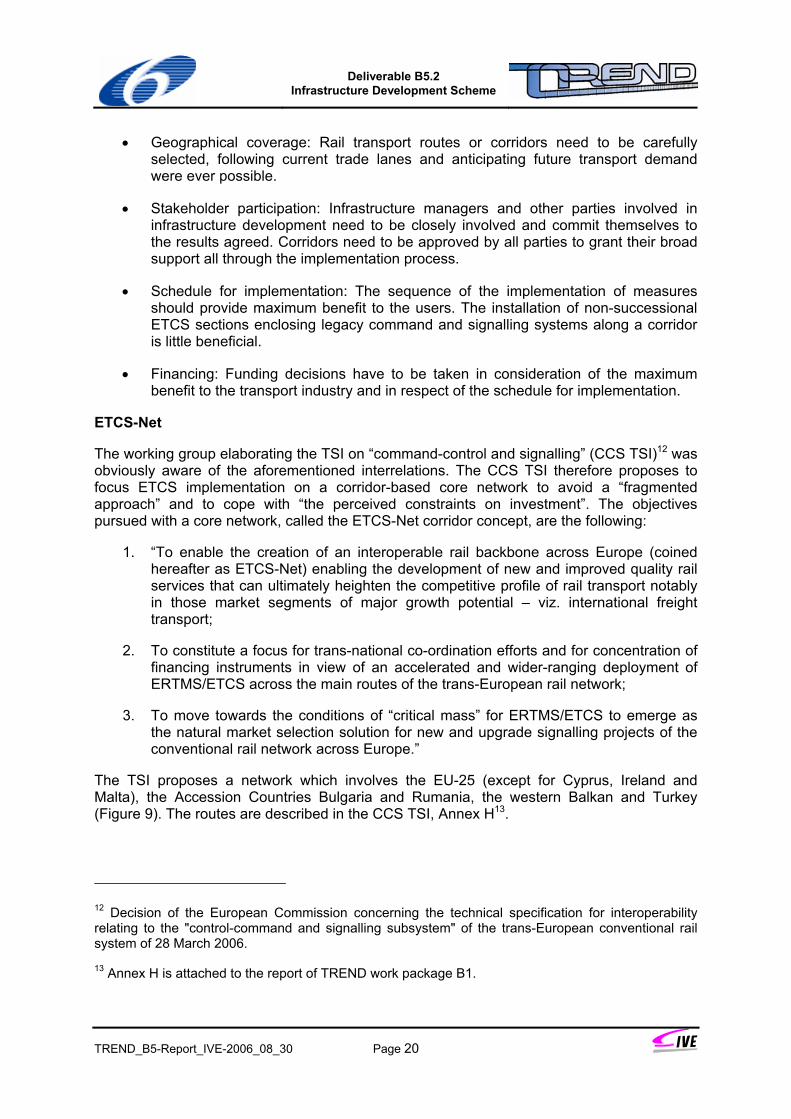
The TSI proposes a network which involves the EU-25 (except for Cyprus, Ireland and Malta), the Accession Countries Bulgaria and Rumania, the western Balkan and Turkey (Figure 9). The routes are described in the CCS TSI, Annex H13.
12 Decision of the European Commission concerning the technical specification for interoperability relating to the "control-command and signalling subsystem" of the trans-European conventional rail system of 28 March 2006.
13 Annex H is attached to the report of TREND work package B1.
Deliverable B5.2
Infrastructure Development Scheme
TREND_B5-Report_IVE-2006_08_30 Page 21
Figure 9: ETCS-Net CCS-TSI
The ETCS-Net includes high-speed lines as governed by Commission Decision 2002/731/EC, making further reference to Annex I of Directive 96/48/EC. The conventional rail system has been designed in view of a timeframe of 10 to 12 years and regarding the capabilities of the railways and the supply industry. This combination of network size and time horizon takes into account complicated cross-border co-ordination of activities.
Further to the ETCS-Net, the working group proposes to earmark a subset of projects referred to as the “inception kernel”. It is proposed that the deployment of ETCS shall be mandatory for this inception kernel to “kick-start” the deployment of ETCS in the overall ETCS-Net. This procedure is deemed necessary to boost the implementation of an interoperable railway network. The CCS TSI also calls for national ERTMS implementation plans to provide a clear timeframe for the inception kernel and for the availability of Community funding at levels well beyond common practice for signalling equipment.
Deliverable B5.2
Infrastructure Development Scheme
TREND_B5-Report_IVE-2006_08_30 Page 22
3.6 Joining forces at European level
3.6.1 The Memorandum of Understanding
After years of discussion, the European railway industry including the IMs, RUs, railway associations and the railway supply industry agreed that only a harmonisation of the European railway network will lead to the urgently required facilitation of cross-border rail transport and gains in efficiency in the rail sector as a whole. In technical terms, ERTMS is at the heart of such a harmonisation allowing easy international train operations, more competition in the signalling and command-control supply market and economies of scale.
The European Commission, politically motivated, and the railway supply industry, for various economical reasons, are since long much in favour of ERTMS. However, the cost of ERTMS implementation are a very pressing issue for the railways especially where existing technology has not yet reached the end of its life cycle. The railways are therefore calling for European support to cope with ERTMS implementation.
To promote the process, the European Commission and the European railway associations CER, UIC, UNIFE and EIM adopted in March 2005 a Memorandum of Understanding establishing the basic principles for the definition on an EU deployment strategy for ERTMS (for a full copy see Annex 4). The parties agreed that a European high quality railway should be developed along major European corridors “with the objective of ensuring an end-to-end continuity of signalling and information services in order to fully reap the benefits of such incisive technological change (herein referred to as ETCS-Net)”.
Further to the agreeing on “the vision of implementing a single European system of train control”, the signing parties define their respective contributions to the process. The railway industry inter alia commits herself to the following tasks:
1. “The elaboration of a generic methodology, terminology and set of assumptions for corridor analyses that will enable the aggregation of the results for individual corridors within a network-wide perspective …
2. The performance of corridor-by-corridor analyses on the basis of this generic methodology for the set of ETCS-Net corridors as defined in the Annex H of the TSI. This work is to be completed within 18 months from the date of signature of this MOU.”
The first task, development of a methodology, was completed in late summer 2005. The corridor-by-corridor analyses resulted in European Rail Infrastructure Master Plan (ERIM). Both tasks will be described in the following.
3.6.2 A methodology for corridor analysis
The “Methodology for corridor analysis” adopted on 12 September 2005 proposes a generic methodology setting out the objectives and the structure of the report of a corridor analysis (full version see Annex 5). Whereas the objectives are very briefly described, the proposed structure of the report describes the tasks to be undertaken in more detail.
Deliverable B5.2
Infrastructure Development Scheme
TREND_B5-Report_IVE-2006_08_30 Page 23
Business objective
Based on market research for each corridor a “target business scenario” shall be defined. It shall set out the desired performance and finally a set of technical and operational requirements such as journey times, system reliability, capacity parameter etc. Furthermore, operational and technical requirements regarding technology to be implemented need to be derived to design a picture of the infrastructure required, especially signalling and command-control.
ETCS deployment on the corridor
Section 1 of the proposed report structure defines the corridor approach of the methodology, including the analysis of all railway lines making up the particular corridor including parallel lines (by-passes) and other lines important to the ERTMS deployment.
Section 2 requires the analysis of infrastructure and mobile assets of the corridor as well as operational parameters.
Sections 3 to 5 deal with economic questions, costs and benefits, ending up with the net benefit of the migration to ETCS. Sections 6 to 8 address a SWOT analysis, the assessment and recommendations.
The methodology already refers to the European Rail Infrastructure Master Plan (ERIM), which was, given the tight schedule fixed in the MoU, already under preparation.
3.6.3 European Rail Infrastructure Master Plan
The development of the European Rail Infrastructure Master Plan” (ERIM) was launched in 2003 after a review process of previous works and in regular consultation with UIC Member railways and representative bodies, such as CER, EIM and RNE. It is based on the methodology for corridor analysis. The execution of the Project is divided between two work packages with distinctive objectives14:
• “To produce a comprehensive infrastructure inventory, capacity analysis and business perspective of European railway priority corridors, and to indicate areas where technical and operational harmonisation will be most efficient to meet future traffic demands so as to ensure revitalisation of the railways, rebalancing transport modes, and, in general, increasing the economic, social and environmental sustainability of the European Transport network” (Work Package 1).
• “To identify and describe innovative business models at corridor level that can reinforce the general idea that market demand must be met through the production of integrated, door-to-door, corridor-based transport services” (Work Package 2).
As carried out in the TREND Project (chapter 5), a reliable database was considered as indispensable for a qualified infrastructure analysis. The ERIM Project has updated the UIC
14 Quoted from the ERIM report, unpublished draft version of December 2005.
Deliverable B5.2
Infrastructure Development Scheme
TREND_B5-Report_IVE-2006_08_30 Page 24
database “EurailDataMap” from 1998 in relation to the so called ETCS-net with some additional line sections proposed by Member railways. The updated database covers about 44.000 km of route length which is about 31% of the initial EurailDataMap database (141.000 km). Contrary to TREND and other projects, ERIM includes business oriented infrastructure parameters for both rail freight and passenger services.
The ERTMS corridors (14.000 km), which are wholly integrated in the ERIM network, are reviewed as a sub-set of data. The current signalling systems, telecom infrastructure details and the ERTMS migrations intentions, as defined by the ERTMS Corridor Teams (set up under the ERTMS MoU Steering Group) are integrated in the ERIM database.
The first phase of the ERIM Work Packages 1 and 2 were both concluded in March 2006. The ERIM Work Package 1
• established an integrated Infrastructure Master Plan which includes an inventory of current infrastructure in 2005 and national upgrading plans along ERIM corridors with the vision towards 2020;
• highlighted the priority corridors (or sections of corridors) which will carry the highest levels of traffic flows by 2020;
• identified the route sections where overall capacity is most likely to be constraint and where investment needs to be especially targeted;
• raised specific issues on quality improvements and harmonisation needs which should be put in place to ensure that current infrastructure is utilised to the optimum extent.
The ERIM Work Package 2 tested an innovative business model on the Rotterdam/Antwerp – Milan/Genoa corridor. This work has been carried by PriceWaterhouseCoopers, under the management of RFI (Rete Ferrovie Italiane) and in consultation with UIC. The work involved an analysis of the target market, supply chain, rail market share and modal competition conditions. The final step consisted of the development of the business model, with the overall goal being to quantify the economic performance of the corridor.
3.7 Planning and evaluation of railway infrastructure
Until the beginning of the 1990s all European railway were organised in an integrated structure which meant that:
• the provision, operation and development of railway infrastructure and
• the operation of trains (commercial and non-commercial services)
were united in one single entity. Furthermore, the national railway companies had parastatal tasks such as the approval of technical systems and operational regulations. As the railways tended to be highly loss-making, they were largely depending on public funding. Infrastructure development was thus since ever subject to political debate and influence.
With the liberalisation of the railway markets, the formerly national and integrated railway companies were split up either in completely separated entities or divided into individual
Deliverable B5.2
Infrastructure Development Scheme
TREND_B5-Report_IVE-2006_08_30 Page 25
operational divisions under the umbrella of a common group: infrastructure managers and railway undertakings. Thus, vertical integration was at least formally removed, the responsibility for railway infrastructure pending with the infrastructure managers. In most European States the idea of operating rail infrastructure at full-cost coverage was abandoned at an early stage of railway reform. In 2005, only the three Baltic States Estonia, Latvia and Lithuania still strive for 100% cost to be covered by infrastructure (user) charges15. The State and other territorial authorities such as the regions will therefore continue to play a major role in rail infrastructure development as long as public funding is provided.
Furthermore, the regionalisation of regional rail passenger transport, as a part of the railway reform in some countries such as Germany and France, took place. As a result, the responsibility for scope, quality and financing of regional rail passenger transport was transferred to regional authorities. In most cases, the Regions have been provided with regionalisation funds in order to be able to finance regional rail passenger transport. In addition the Regions can invest funds of their own, for example in rail infrastructure.
Anyway, the responsibility for the railway infrastructure to a large extent remains with the national governments. Decisions on major investment in railway infrastructure are usually backed by national transport plans incorporating also the expertise and requirements of the infrastructure managers. But also the customers, railway undertakings and public entities agreeing on public service contracts with railway undertakings for the provision of regional rail services, voice their concerns regarding rail infrastructure development.
As international traffic constantly gains in relevance and represents the fastest growing transport segment at least in the freight sector, a European approach to developing railway infrastructure is urgently required. This TREND work package therefore analyses methodologies and chances to overcome the impediments of national borders to infrastructure development.
3.7.1 Processes and tools
In a guided transport system, scope and characteristics of infrastructure significantly influence operational processes such as railway operation, boarding and alighting of passengers and freight trans-shipment. Infrastructure planning therefore inheres a very high importance. Furthermore, due to long planning and implementation periods and high investment cost new and modified infrastructure need to optimally respond to future framework conditions and requirements. This is especially true for the following sectors:
• infrastructure performance with regard to transport demand such as train load curves, boardings, trans-shipment volumes etc.;
• new vehicle and command-control technologies;
• service patterns / level of service steered by transport requirements and technical parameters.
15 United Nations Economic Commission for Europe, Inland transport Committee, Working party on rail transport: Determination of railway infrastructure capacity including aspects related to the fee for the use of the infrastructure; Informal Document 2005/No.2, 23 August 2005
Deliverable B5.2
Infrastructure Development Scheme
TREND_B5-Report_IVE-2006_08_30 Page 26
Service patterns and thus the level of service again influence transport demand, calling for an iterative planning process. The objective of this planning process has to be a railway infrastructure optimally responding to transport demand and operational requirements at least cost.
Since the 1990s, European States introduce national transport planning schemes, more or less integrating all transport modes. In this context, the dominant railways, today usually the dominant national infrastructure managers, play a paramount role as they contribute expertise to a high degree. As pointed out previously, liberalisation of the railway market brought about a significant number of further parties, needing to be respected in the processes. Furthermore, planning and evaluation methodologies have undergone a significant change over the years. This is due to two different developments:
• New political priorities such as the relevance of environmental concern were implemented;
• The evolution of electronic data gathering and data processing create options for large-scale evaluation and simulation. Both technical and economical processes are concerned.
Railway infrastructure planning in this complex environment demands for well structured procedures and the application of suitable tools to grant an objective decision making process. The management of technical processes and questions (not primarily economical ones) demands for tools that can be characterised as such:
• mapping of current and future railway infrastructure: railway lines, links between lines, installations for shunting and making up trains, stations etc.;
• description of operational processes relevant for the tasks to be performed: train runs, shunting, trans-shipment etc.;
• mapping of transport demand if required;
• monetary weighting of singular processes for the economical evaluation of scenarios, for example: cost per train- or locomotive-kilometre, costs per trans-shipment, revenues per tonne-kilometre moved etc.
Planning tools are today usually represented by computer programmes which enable the user to collect and edit data and to map processes according to predefined rules, based on a model approach. The mapping of processes close to reality, for example train operations or economical developments, is called simulation.
According to the particular application, planning will proceed at different levels:
• network-wide, i.e. large-scale general planning with a time horizon of about 10 to 20 years (strategic planning, for example national transport plans);
• investigation and evaluation of small- to medium-scale railway infrastructure with a time horizon of several months up to several years.
According to the availability of data and the required level of detail of planning the following models are distinguished in rail infrastructure planning:
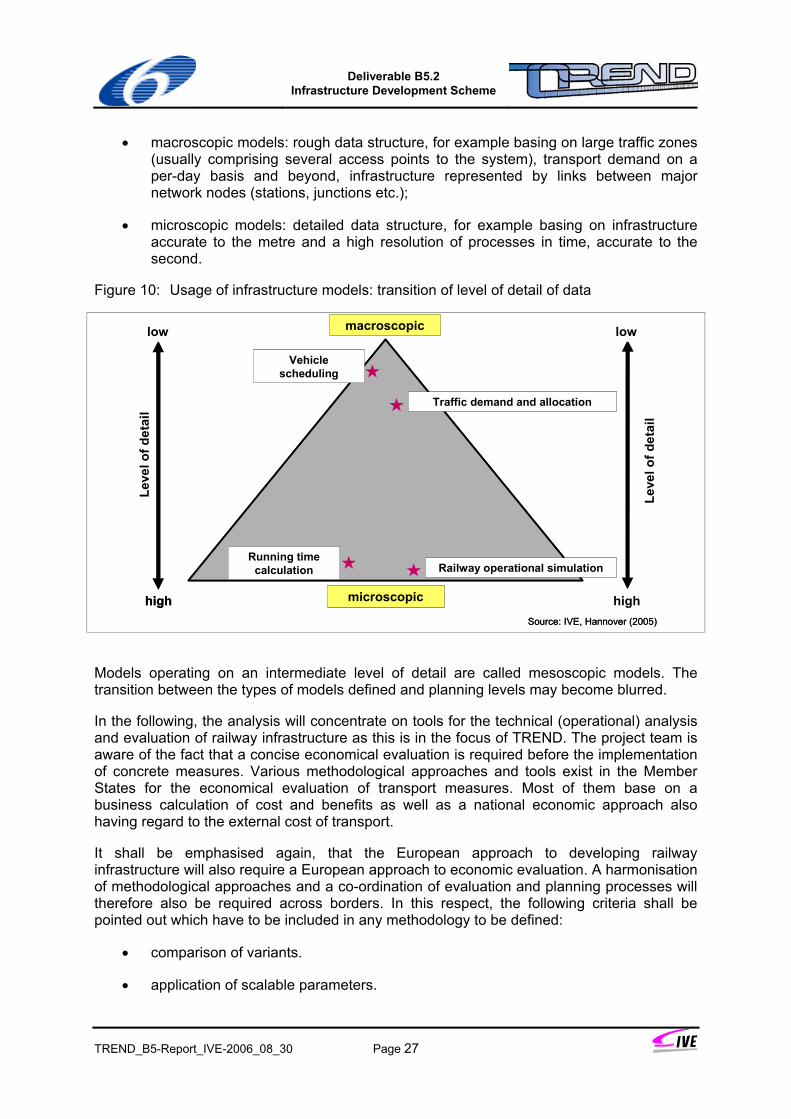
Deliverable B5.2
Infrastructure Development Scheme
TREND_B5-Report_IVE-2006_08_30 Page 27
• macroscopic models: rough data structure, for example basing on large traffic zones (usually comprising several access points to the system), transport demand on a per-day basis and beyond, infrastructure represented by links between major network nodes (stations, junctions etc.);
• microscopic models: detailed data structure, for example basing on infrastructure accurate to the metre and a high resolution of processes in time, accurate to the second.
Figure 10: Usage of infrastructure models: transition of level of detail of data
Running time calculation Railway operational simulation
Vehicle scheduling
Traffic demand and allocation
macroscopic
microscopic
Leve
l of d
etai
l
low low
highhigh
Leve
l of d
etai
l
Source: IVE, Hannover (2005)
Running time calculation Railway operational simulation
Vehicle scheduling
Traffic demand and allocation
macroscopic
microscopic
Leve
l of d
etai
l
low low
highhigh
Leve
l of d
etai
l
Source: IVE, Hannover (2005)
Models operating on an intermediate level of detail are called mesoscopic models. The transition between the types of models defined and planning levels may become blurred.
In the following, the analysis will concentrate on tools for the technical (operational) analysis and evaluation of railway infrastructure as this is in the focus of TREND. The project team is aware of the fact that a concise economical evaluation is required before the implementation of concrete measures. Various methodological approaches and tools exist in the Member States for the economical evaluation of transport measures. Most of them base on a business calculation of cost and benefits as well as a national economic approach also having regard to the external cost of transport.
It shall be emphasised again, that the European approach to developing railway infrastructure will also require a European approach to economic evaluation. A harmonisation of methodological approaches and a co-ordination of evaluation and planning processes will therefore also be required across borders. In this respect, the following criteria shall be pointed out which have to be included in any methodology to be defined:
• comparison of variants.
• application of scalable parameters.
Deliverable B5.2
Infrastructure Development Scheme
TREND_B5-Report_IVE-2006_08_30 Page 28
• comprehensible processes.
• transparent processes.
Comparative evaluation of methods
The following table provides an overview over various methods applied for the evaluation of railway infrastructure and operations. For each method the objectives, the database required and the expected results are listed. According to the scope of TREND, the suitability of each method for the investigation of large-scale networks is discussed.
Methods and tools for the analysis of economical implications are not included in this context. However, some tools according to the methods 4 to 7, all EDP-based solutions, may link the operational analysis to cost-related information, thus supporting the economical evaluation of scenarios.
The operational analysis and the analysis of timetables (no. 1 and 2) may contribute little to large-scale network evaluations. As they may be described as “traditional” methods, they still have a role to play when analysing local problems in railway operations. Supporting the analysis by electronic tools may speed up the process but expert knowledge still plays a paramount role.
The capacity analysis according to UIC leaflet 406 has only been introduced recently (September 2004). This may serve as an indication that capacity was, for a long time, only a very vague term and subject to regional interpretation that needed clarification at European level. With the introduction of the UIC method, a standard is now available to deliver comparable indicators for the capacity of railway infrastructure.
As the method is focussed on railway lines (sections between relevant nodes), railway nodes are generally out of scope of an evaluation based on this method. Furthermore, operational interferences between adjacent routes and partial networks cannot be respected and no indication is available regarding timetable quality. However, the method is suitable to also characterise large networks, providing evidence regarding bottlenecks and free capacity (see Annex 6 for an example).
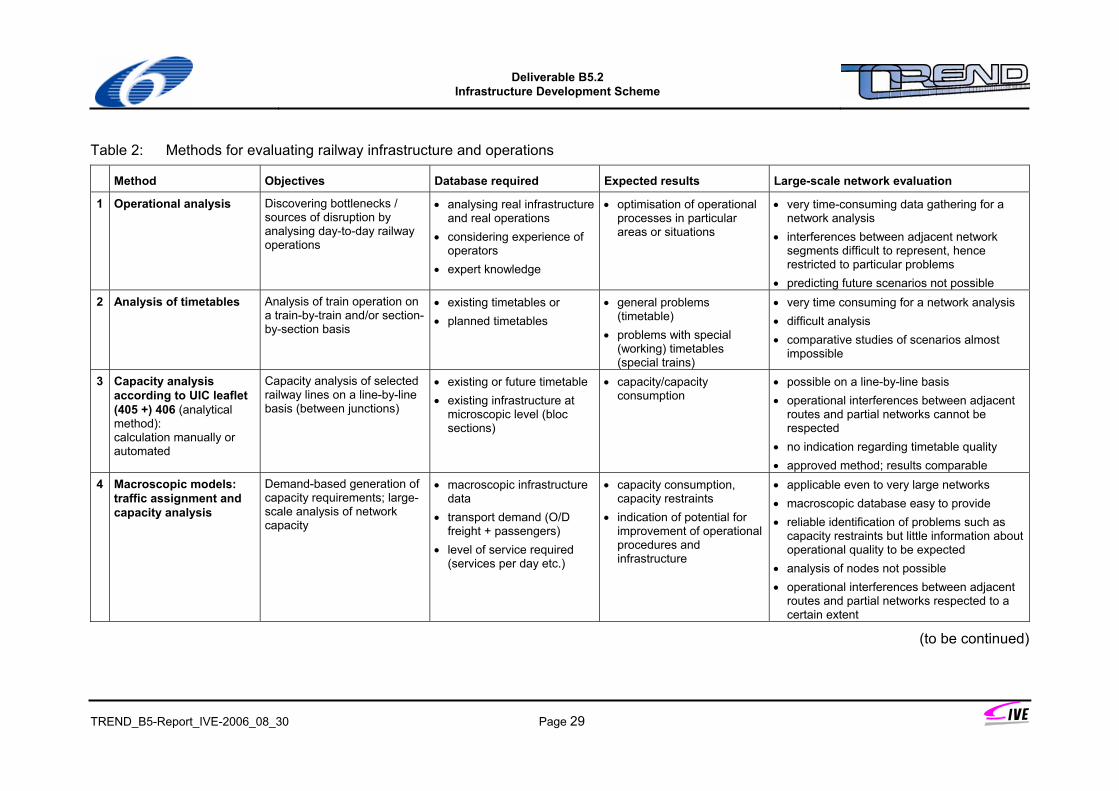
Deliverable B5.2
Infrastructure Development Scheme
TREND_B5-Report_IVE-2006_08_30 Page 29
Table 2: Methods for evaluating railway infrastructure and operations
Method Objectives Database required Expected results Large-scale network evaluation
1 Operational analysis Discovering bottlenecks / sources of disruption by analysing day-to-day railway operations
• analysing real infrastructure and real operations
• considering experience of operators
• expert knowledge
• optimisation of operational processes in particular areas or situations
• very time-consuming data gathering for a network analysis
• interferences between adjacent network segments difficult to represent, hence restricted to particular problems
• predicting future scenarios not possible 2 Analysis of timetables Analysis of train operation on
a train-by-train and/or section-by-section basis
• existing timetables or • planned timetables
• general problems (timetable)
• problems with special (working) timetables (special trains)
• very time consuming for a network analysis • difficult analysis • comparative studies of scenarios almost
impossible
3 Capacity analysis according to UIC leaflet (405 +) 406 (analytical method): calculation manually or automated
Capacity analysis of selected railway lines on a line-by-line basis (between junctions)
• existing or future timetable • existing infrastructure at
microscopic level (bloc sections)
• capacity/capacity consumption
• possible on a line-by-line basis • operational interferences between adjacent
routes and partial networks cannot be respected
• no indication regarding timetable quality • approved method; results comparable
4 Macroscopic models: traffic assignment and capacity analysis
Demand-based generation of capacity requirements; large-scale analysis of network capacity
• macroscopic infrastructure data
• transport demand (O/D freight + passengers)
• level of service required (services per day etc.)
• capacity consumption, capacity restraints
• indication of potential for improvement of operational procedures and infrastructure
• applicable even to very large networks • macroscopic database easy to provide • reliable identification of problems such as
capacity restraints but little information about operational quality to be expected
• analysis of nodes not possible • operational interferences between adjacent
routes and partial networks respected to a certain extent
(to be continued)
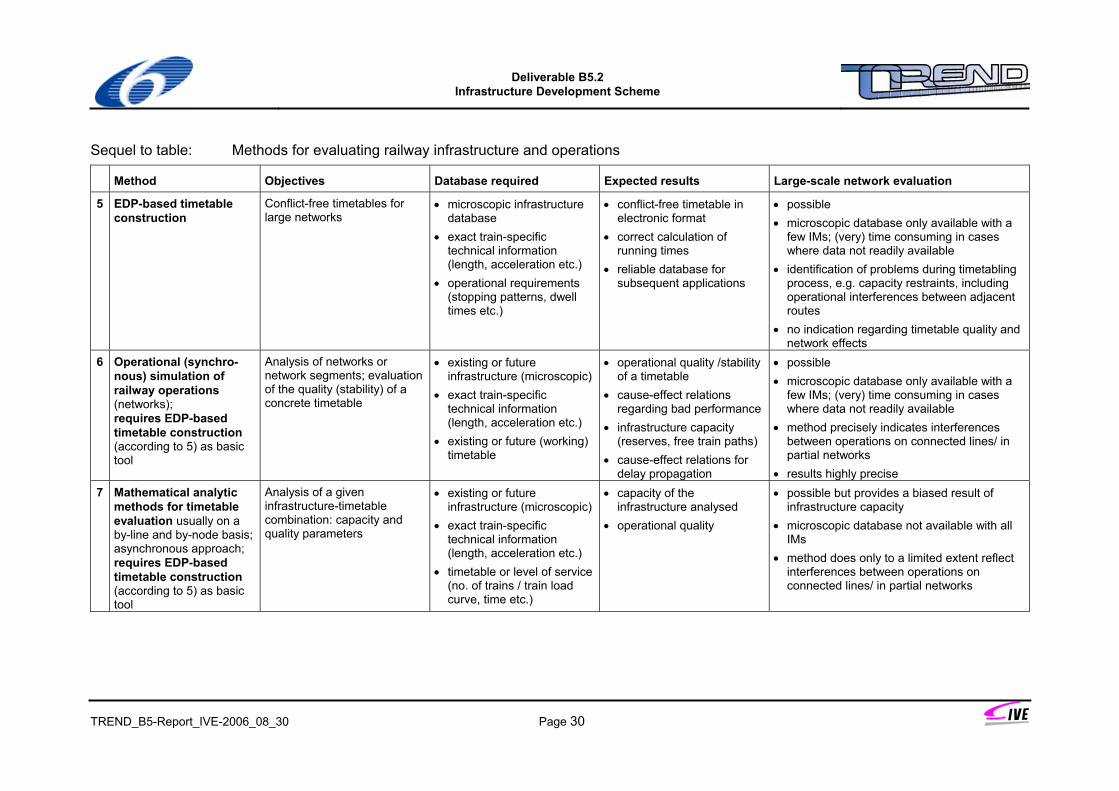
Deliverable B5.2
Infrastructure Development Scheme
TREND_B5-Report_IVE-2006_08_30 Page 30
Sequel to table: Methods for evaluating railway infrastructure and operations
Method Objectives Database required Expected results Large-scale network evaluation
5 EDP-based timetable construction
Conflict-free timetables for large networks
• microscopic infrastructure database
• exact train-specific technical information (length, acceleration etc.)
• operational requirements (stopping patterns, dwell times etc.)
• conflict-free timetable in electronic format
• correct calculation of running times
• reliable database for subsequent applications
• possible • microscopic database only available with a
few IMs; (very) time consuming in cases where data not readily available
• identification of problems during timetabling process, e.g. capacity restraints, including operational interferences between adjacent routes
• no indication regarding timetable quality and network effects
6 Operational (synchro-nous) simulation of railway operations (networks); requires EDP-based timetable construction (according to 5) as basic tool
Analysis of networks or network segments; evaluation of the quality (stability) of a concrete timetable
• existing or future infrastructure (microscopic)
• exact train-specific technical information (length, acceleration etc.)
• existing or future (working) timetable
• operational quality /stability of a timetable
• cause-effect relations regarding bad performance
• infrastructure capacity (reserves, free train paths)
• cause-effect relations for delay propagation
• possible • microscopic database only available with a
few IMs; (very) time consuming in cases where data not readily available
• method precisely indicates interferences between operations on connected lines/ in partial networks
• results highly precise 7 Mathematical analytic
methods for timetable evaluation usually on a by-line and by-node basis; asynchronous approach; requires EDP-based timetable construction (according to 5) as basic tool
Analysis of a given infrastructure-timetable combination: capacity and quality parameters
• existing or future infrastructure (microscopic)
• exact train-specific technical information (length, acceleration etc.)
• timetable or level of service (no. of trains / train load curve, time etc.)
• capacity of the infrastructure analysed
• operational quality
• possible but provides a biased result of infrastructure capacity
• microscopic database not available with all IMs
• method does only to a limited extent reflect interferences between operations on connected lines/ in partial networks
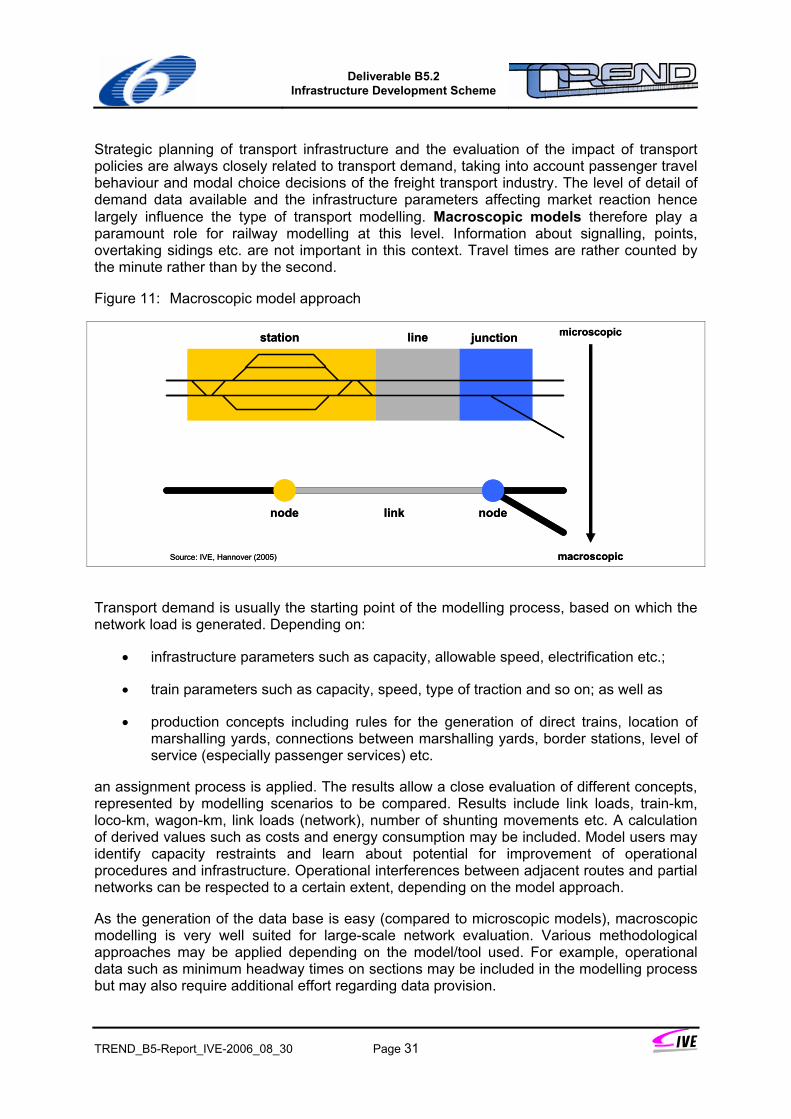
Deliverable B5.2
Infrastructure Development Scheme
TREND_B5-Report_IVE-2006_08_30 Page 31
Strategic planning of transport infrastructure and the evaluation of the impact of transport policies are always closely related to transport demand, taking into account passenger travel behaviour and modal choice decisions of the freight transport industry. The level of detail of demand data available and the infrastructure parameters affecting market reaction hence largely influence the type of transport modelling. Macroscopic models therefore play a paramount role for railway modelling at this level. Information about signalling, points, overtaking sidings etc. are not important in this context. Travel times are rather counted by the minute rather than by the second.
Figure 11: Macroscopic model approach
microscopic
macroscopic
station junctionline
node link node
Source: IVE, Hannover (2005)
microscopic
macroscopic
station junctionline
node link node
Source: IVE, Hannover (2005)
Transport demand is usually the starting point of the modelling process, based on which the network load is generated. Depending on:
• infrastructure parameters such as capacity, allowable speed, electrification etc.;
• train parameters such as capacity, speed, type of traction and so on; as well as
• production concepts including rules for the generation of direct trains, location of marshalling yards, connections between marshalling yards, border stations, level of service (especially passenger services) etc.
an assignment process is applied. The results allow a close evaluation of different concepts, represented by modelling scenarios to be compared. Results include link loads, train-km, loco-km, wagon-km, link loads (network), number of shunting movements etc. A calculation of derived values such as costs and energy consumption may be included. Model users may identify capacity restraints and learn about potential for improvement of operational procedures and infrastructure. Operational interferences between adjacent routes and partial networks can be respected to a certain extent, depending on the model approach.
As the generation of the data base is easy (compared to microscopic models), macroscopic modelling is very well suited for large-scale network evaluation. Various methodological approaches may be applied depending on the model/tool used. For example, operational data such as minimum headway times on sections may be included in the modelling process but may also require additional effort regarding data provision.
Deliverable B5.2
Infrastructure Development Scheme
TREND_B5-Report_IVE-2006_08_30 Page 32
The weaknesses of macroscopic modelling usually lies in the low level of detail not properly representing railway operations in junctions and nodes. Conflicts arising in this respect may usually not be identified at this modelling level. Annex 11 provides some impressions of a macroscopic modelling tool to exemplify data quality and applications.
Compared to macroscopic modelling as just described, microscopic railway models focus on operational issues and do so far not involve transport demand as a primary input. Microscopic modelling is applied in two different ways:
• EDP-based timetable construction. The objective is to generate (construct) timetables supported by electronic data processing. Various tools are available on the market today, largely replacing manual processes as applied in the past. A microscopic infrastructure data model is required including a precise calculation of operational processes such as running times.
• Analysis of railway operations. The analysis of timetables by means of operational simulation or mathematical analytic methods are also based on a microscopic infrastructure data model and also require a precise calculation of operational processes. Insofar, both methodological approaches always include EDP-based timetable construction as a precondition but provide the possibility of analysing the behaviour (stability) of a timetable under realistic operational conditions.
Mathematical analytic methods also allow the evaluation of timetable quality basing on a particular timetable or on a predefined operational programme including the number of trains, train characteristics, quality parameters etc. The evaluation is usually based on a line-by-line and node-by-node calculation, feeding back delays arising in one segment into adjacent network segments. Analytical methods tend to provide biased results regarding infrastructure capacity as train operations are not simultaneously mapped in a simulation, neglecting real interferences between train runs to some extent.
The capacity analysis according to UIC leaflet 406 may be regarded as being the only method having standardised character in terms of rail infrastructure analysis. None of the other methods (or tools) is applied European-wide yet as the national railways or infrastructure managers tend to apply nationally developed methods and tools. For the time being there is no common method for railway infrastructure planning and evaluation.
It is known to the authors that at least most western European infrastructure managers have either chosen EDP tools for timetable planning or are undergoing a selection process. A lesser number of parties seem to consistently apply railway simulation or mathematical analytic methods for the evaluation of timetables before their implementation. A larger number of IMs apply such methods for the appraisal of local or regional measures such as infrastructure upgrading or new constructions.
3.7.2 TREND data sources and data quality
Introducing remarks
Analogous to lacking standards in evaluation methodology, there is no European standard for data collection and administration. Having discussed a wide range of different methods
Deliverable B5.2
Infrastructure Development Scheme
TREND_B5-Report_IVE-2006_08_30 Page 33
for timetabling and evaluation with an even wider range of possible applications (section 3.7.1), it has to be pointed out that a standardisation of data would have to take into account:
• the various levels of detail (micro-/ macroscopic) of evaluations as regards, in particular, infrastructure data;
• the various existing signalling systems still in place that have to be implemented in microscopic modelling applications;
• country and/or railway specific operational rules and regulations often closely related to signalling technology in place;
• existing timetable formats being in use with the national railways. The integration of various standards in EDP applications seems to be the more practical approach rather than standardising national timetabling standards.
With the standard according to UIC leaflet 406 at least capacity and capacity utilisation have been defined to a certain extent. But with regard to microscopic evaluation methods, this approach would require further refinement to achieve comparable results also under more complex circumstances.
Experience with a wide range of infrastructure managers in Europe have shown that the quality of railway infrastructure data available with the companies widely vary in content and quality. Electronic storage of data does not seem to be the standard especially among railways in the new Member States and the European Accession countries.
The TREND case
Reliable infrastructure data were needed for the evaluation and display of the TREND corridors. Due to the scope of the project, the size of the analysis area and the heterogeneity of corridors in terms of countries/IMs involved, only a macroscopic model approach could have been be applied. Furthermore, data at a detailed level are not available for the time being with all infrastructure mangers involved. For some regions, some parameters were not available at all.
Data structures were agreed among Work Packages 2 and 5 prior to data collection, which was provided by Work Package B2. For visualising the network for the analysis and for displaying it on the internet, geo-referenced data and a GIS computer programme were needed (see chapter 5). Data had to fulfil the following requirements:
• a clear data structure;
• clear definitions of data content to avoid misunderstandings due to, for example, linguistic barriers or different technical backgrounds;
• consistency in data formats;
• actuality of data;
• completeness of data base.
Deliverable B5.2
Infrastructure Development Scheme
TREND_B5-Report_IVE-2006_08_30 Page 34
The TREND infrastructure is represented by nodes and links at a macroscopic modelling level. In a first approach, important railway nodes, marshalling yards, intermodal terminals, and border crossing were chosen to be represented by nodes in the model. The nodes were attributed the specific information. They were then linked according to the course of the railway routes.
Data were refined in a second step by splitting links and inserting new nodes wherever an attribute of a link changed its value. Link attributes include route specific characteristics such as length of a link, track gauge, loading gauge, electrification, signalling system, etc. Within a link, none of the attributes covered by a set of data may change.
All results presented are based on the input of the TREND B2 experts (both infrastructure managers and representatives of railway undertakings), who contributed their specific knowledge to the analysis. This contribution comprises the discussion and fine-tuning of the extent and routing of the TREND corridors, based on current transport volumes and growth potential, and the provision of railway infrastructure data.
The database was populated in WP B5, data being submitted by WP B2. Were no qualified data could be submitted by consortium partners, further sources were used to provide maximum data quality. The following list provides an overview over alternative sources, mainly consisting of previous projects involved in rail infrastructure development, but also other sources:
• EUFRANET project
• Eurailinfra project
• EurailDataMap
• ERIM project
• ERTMS network
• INTERUNIT intermodal loading gauges
• network statements of European infrastructure managers (via RNE website)
IVE was able to provide a database from the EUropean Freight RAilway NETwork project -EUFRANET where IVE was involved. The main objectives of this 4th Framework Programme project were the evaluation of different strategies for the development and operation of an efficient and competitive Trans-European railway network mainly dedicated to freight.
UIC was involved in the Eurailinfra project which dealt with a uniform methodology for capacity evaluation and bottleneck detecting on international corridors. The objective was to achieve a consistency in infrastructure evaluation being essential for comparing investments and drawing up a priority list for investments. As a result UIC leaflet 406 was published.
Both data sources were not up to date at all and did not cover Eastern Europe. Hence, the available databases could only be used for completing missing data in the chosen corridors if data were not delivered by subcontractors or partners at all. The data could only be used as fallback solution which had to be checked with regard to validity.
On a European scale, an overall survey was already carried out by UIC in 1998 resulting in the European rail network database EurailDataMap. It consists of important railway
Deliverable B5.2
Infrastructure Development Scheme
TREND_B5-Report_IVE-2006_08_30 Page 35
infrastructure data, including e.g. type of line, line length, number of tracks etc. The EurailDataMap database covers about 141.000 km of route length which corresponds to about 221.000 km of equivalent single track divided into 2 620 line sections with an average route length of about 54 km.
The ERIM Project used the UIC infrastructure database, EurailDataMap, as a basis to upgrade those line sections which were related to the ETCS-net. Consequently, 31 % of EurailDataMap database were updated to establish the ERIM database. New data were made available by the ERTMS Corridor Teams. UIC provided data in alignment with UIC’s statistical data and general key knowledge which assured the coherence and overall quality of the EurailDataMap and subsequently of the ERIM database.
The Memorandum of Understanding (MoU) between European Commission and the European Railways Associations (CER, EIM, UNIFE, UIC) was the basis for the definition of the ERTMS deployment strategy for six corridors within the larger area defined by the ETCS net in the TSI for control/command for conventional rail.
The International Union of combined Road-Rail transport (UIRR) has 20 members being combined road-rail transport companies located in 14 countries. They link the biggest states in Europe. Because of the specific technical and commercial nature of combined road-rail transport, the UIRR companies and the railway undertakings created a Committee called INTERUNIT with a view to studying and co-ordinating the combined transport activities of its members. The Committee is a kind of advisory body where its members share experiences, debate problems of general policy and try to reconcile any problems. Within their activities, a map was elaborated, displaying loading gauges for intermodal rail traffic. This map served as an additional source for the TREND project where loading gauge data were missing.
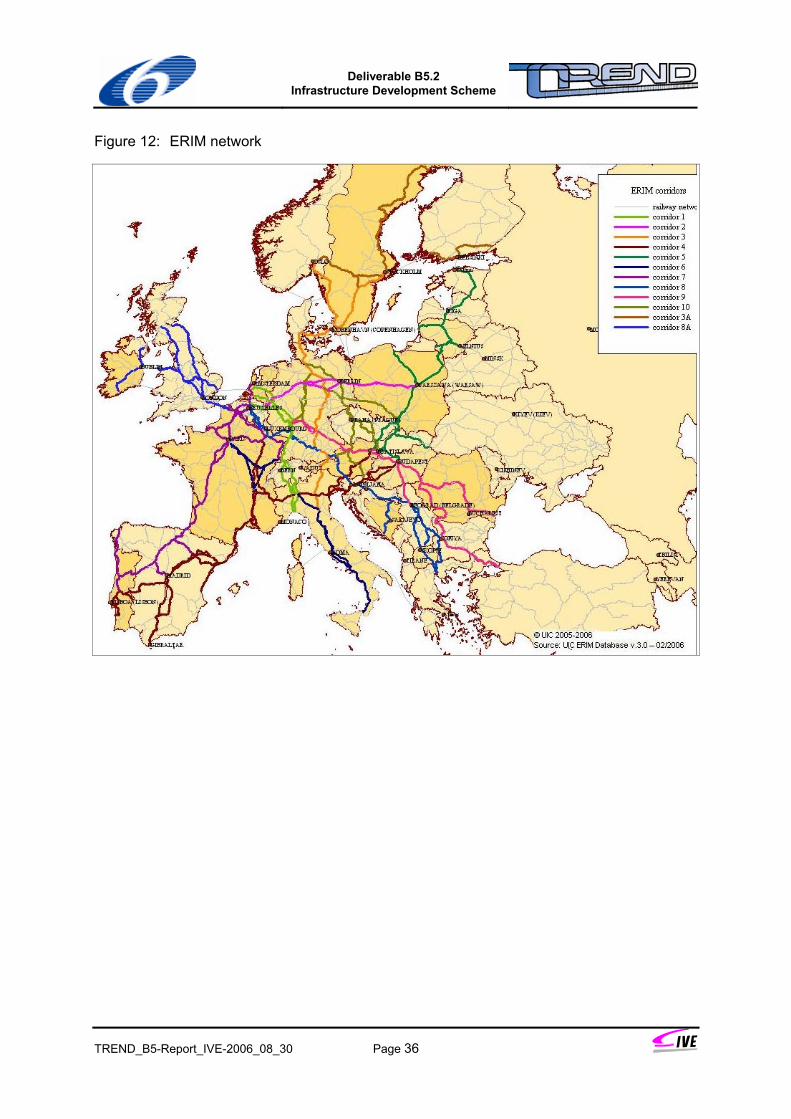
Deliverable B5.2
Infrastructure Development Scheme
TREND_B5-Report_IVE-2006_08_30 Page 36
Figure 12: ERIM network
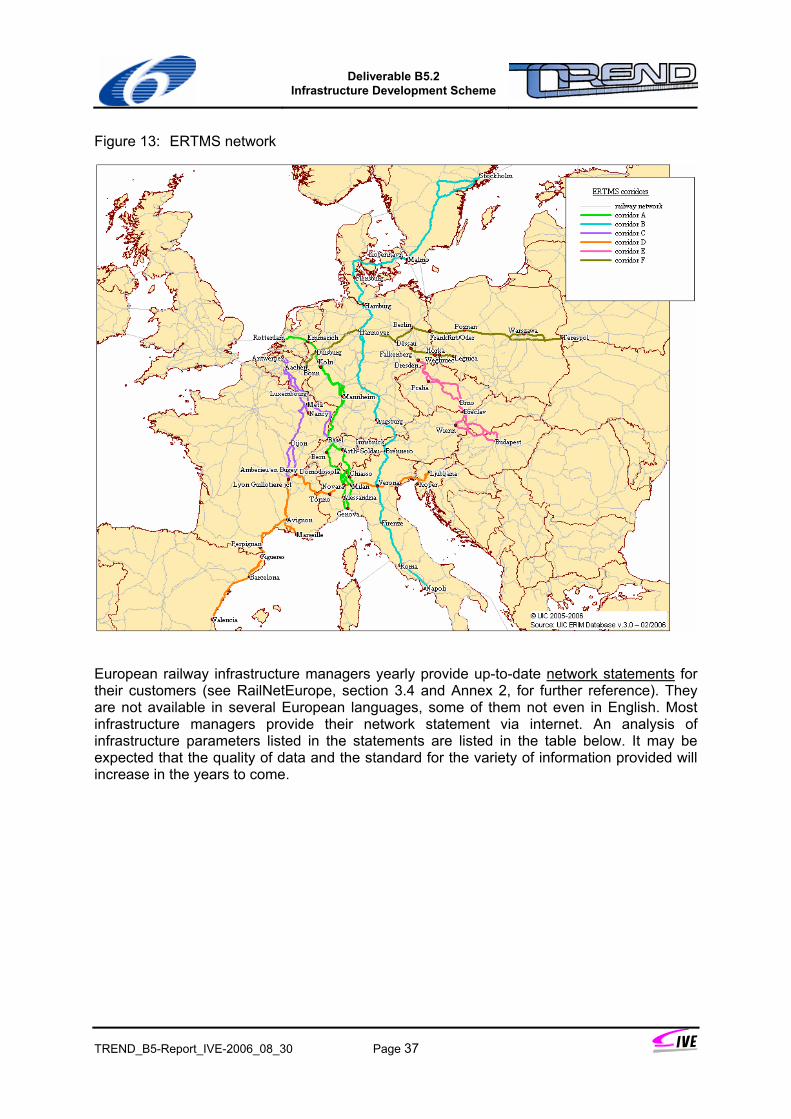
Deliverable B5.2
Infrastructure Development Scheme
TREND_B5-Report_IVE-2006_08_30 Page 37
Figure 13: ERTMS network
European railway infrastructure managers yearly provide up-to-date network statements for their customers (see RailNetEurope, section 3.4 and Annex 2, for further reference). They are not available in several European languages, some of them not even in English. Most infrastructure managers provide their network statement via internet. An analysis of infrastructure parameters listed in the statements are listed in the table below. It may be expected that the quality of data and the standard for the variety of information provided will increase in the years to come.
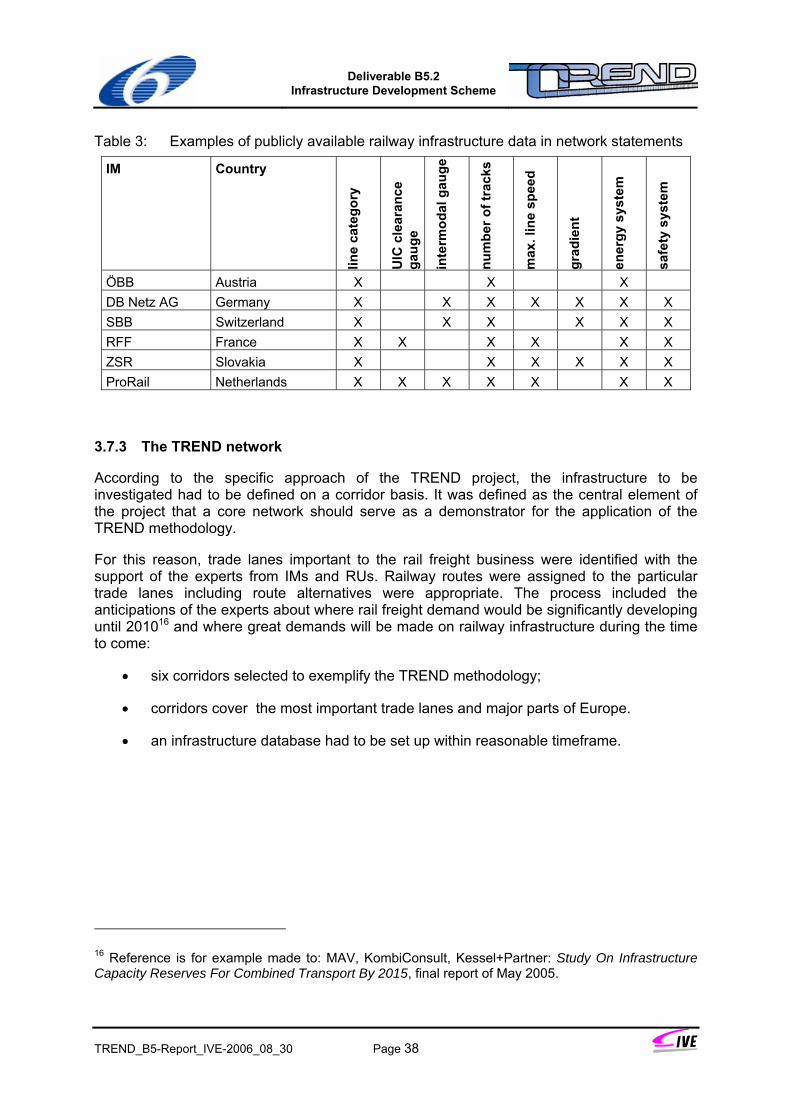
Deliverable B5.2
Infrastructure Development Scheme
TREND_B5-Report_IVE-2006_08_30 Page 38
Table 3: Examples of publicly available railway infrastructure data in network statements
IM Country
line
cate
gory
UIC
cle
aran
ce
gaug
e
inte
rmod
al g
auge
num
ber o
f tra
cks
max
. lin
e sp
eed
grad
ient
ener
gy s
yste
m
safe
ty s
yste
m
ÖBB Austria X X X DB Netz AG Germany X X X X X X X SBB Switzerland X X X X X X RFF France X X X X X X ZSR Slovakia X X X X X X ProRail Netherlands X X X X X X X
3.7.3 The TREND network
According to the specific approach of the TREND project, the infrastructure to be investigated had to be defined on a corridor basis. It was defined as the central element of the project that a core network should serve as a demonstrator for the application of the TREND methodology.
For this reason, trade lanes important to the rail freight business were identified with the support of the experts from IMs and RUs. Railway routes were assigned to the particular trade lanes including route alternatives were appropriate. The process included the anticipations of the experts about where rail freight demand would be significantly developing until 201016 and where great demands will be made on railway infrastructure during the time to come:
• six corridors selected to exemplify the TREND methodology;
• corridors cover the most important trade lanes and major parts of Europe.
• an infrastructure database had to be set up within reasonable timeframe.
16 Reference is for example made to: MAV, KombiConsult, Kessel+Partner: Study On Infrastructure Capacity Reserves For Combined Transport By 2015, final report of May 2005.
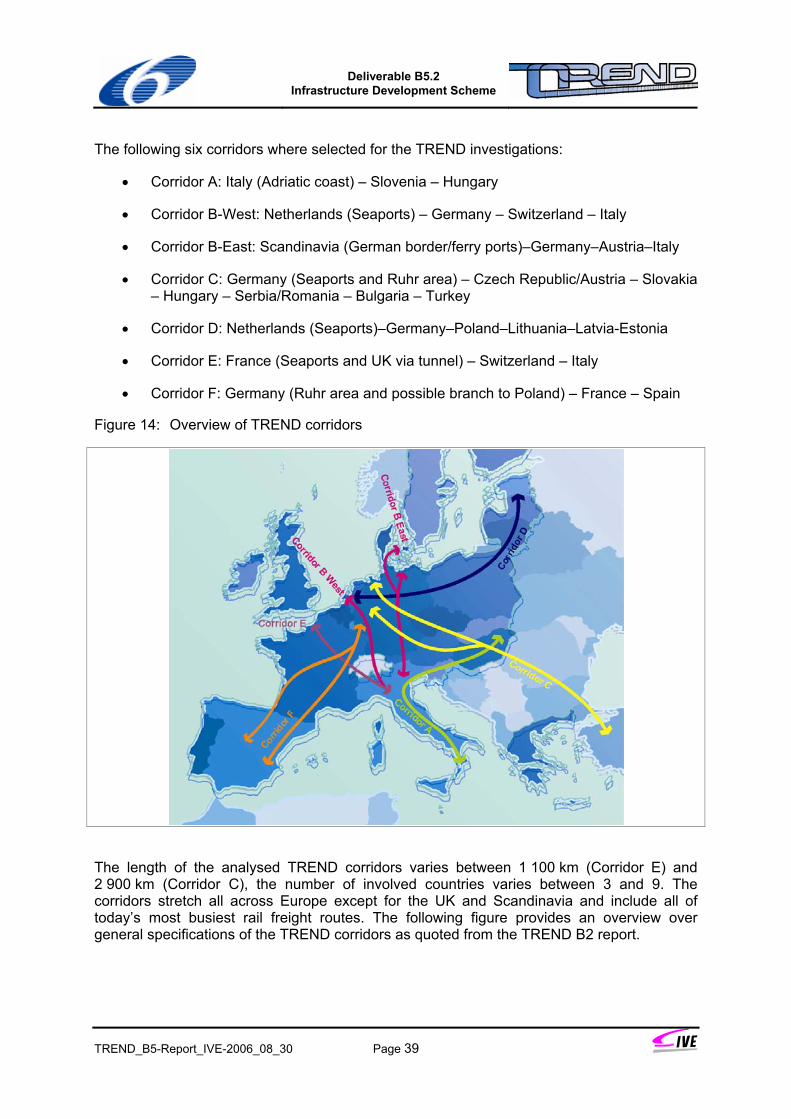
Deliverable B5.2
Infrastructure Development Scheme
TREND_B5-Report_IVE-2006_08_30 Page 39
The following six corridors where selected for the TREND investigations:
• Corridor A: Italy (Adriatic coast) – Slovenia – Hungary
• Corridor B-West: Netherlands (Seaports) – Germany – Switzerland – Italy
• Corridor B-East: Scandinavia (German border/ferry ports)–Germany–Austria–Italy
• Corridor C: Germany (Seaports and Ruhr area) – Czech Republic/Austria – Slovakia – Hungary – Serbia/Romania – Bulgaria – Turkey
• Corridor D: Netherlands (Seaports)–Germany–Poland–Lithuania–Latvia-Estonia
• Corridor E: France (Seaports and UK via tunnel) – Switzerland – Italy
• Corridor F: Germany (Ruhr area and possible branch to Poland) – France – Spain
Figure 14: Overview of TREND corridors
The length of the analysed TREND corridors varies between 1 100 km (Corridor E) and 2 900 km (Corridor C), the number of involved countries varies between 3 and 9. The corridors stretch all across Europe except for the UK and Scandinavia and include all of today’s most busiest rail freight routes. The following figure provides an overview over general specifications of the TREND corridors as quoted from the TREND B2 report.
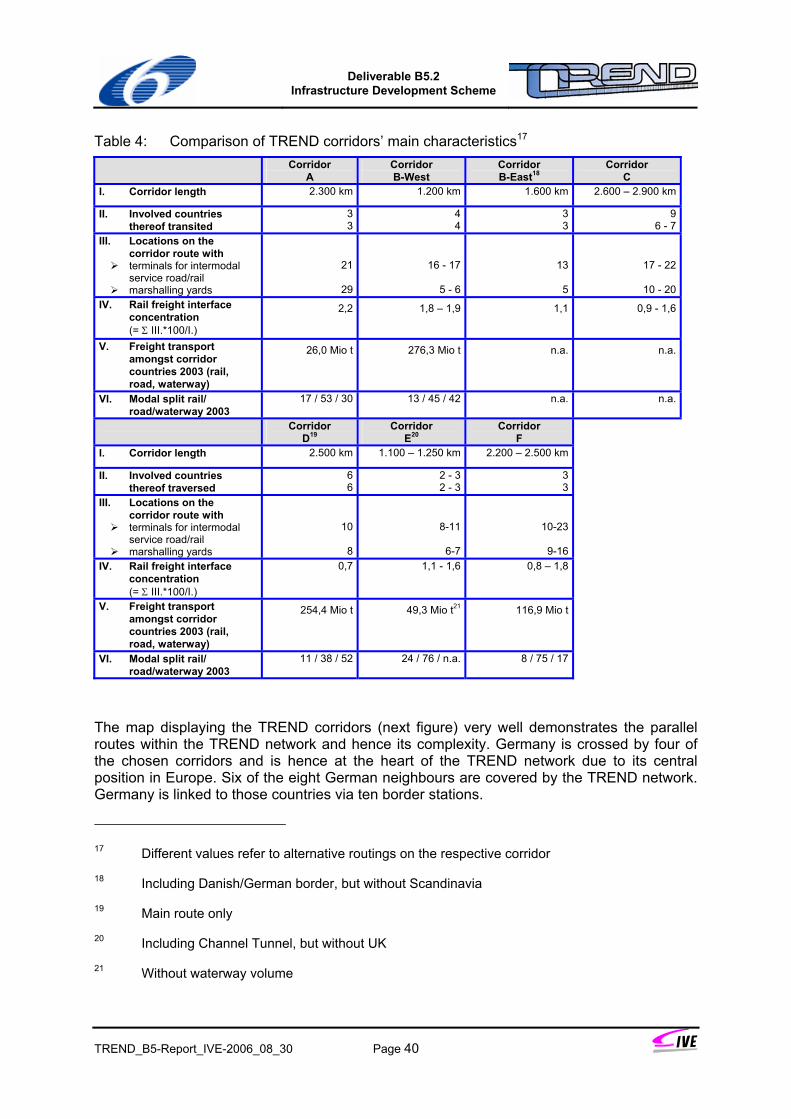
Deliverable B5.2
Infrastructure Development Scheme
TREND_B5-Report_IVE-2006_08_30 Page 40
Table 4: Comparison of TREND corridors’ main characteristics17 Corridor
A Corridor B-West
Corridor B-East18
Corridor C
I. Corridor length 2.300 km 1.200 km 1.600 km 2.600 – 2.900 km
II. Involved countries thereof transited
33
44
3 3
96 - 7
III. Locations on the corridor route with
terminals for intermodal service road/rail
marshalling yards
21
29
16 - 17
5 - 6
13
5
17 - 22
10 - 20IV. Rail freight interface
concentration (= Σ III.*100/I.)
2,2 1,8 – 1,9 1,1 0,9 - 1,6
V. Freight transport amongst corridor countries 2003 (rail, road, waterway)
26,0 Mio t 276,3 Mio t n.a. n.a.
VI. Modal split rail/ road/waterway 2003
17 / 53 / 30 13 / 45 / 42 n.a. n.a.
Corridor D19
Corridor E20
Corridor F
I. Corridor length 2.500 km 1.100 – 1.250 km 2.200 – 2.500 km
II. Involved countries thereof traversed
66
2 - 32 - 3
3 3
III. Locations on the corridor route with
terminals for intermodal service road/rail
marshalling yards
10
8
8-11
6-7
10-23
9-16 IV. Rail freight interface
concentration (= Σ III.*100/I.)
0,7 1,1 - 1,6 0,8 – 1,8
V. Freight transport amongst corridor countries 2003 (rail, road, waterway)
254,4 Mio t 49,3 Mio t21 116,9 Mio t
VI. Modal split rail/ road/waterway 2003
11 / 38 / 52 24 / 76 / n.a. 8 / 75 / 17
The map displaying the TREND corridors (next figure) very well demonstrates the parallel routes within the TREND network and hence its complexity. Germany is crossed by four of the chosen corridors and is hence at the heart of the TREND network due to its central position in Europe. Six of the eight German neighbours are covered by the TREND network. Germany is linked to those countries via ten border stations.
17 Different values refer to alternative routings on the respective corridor
18 Including Danish/German border, but without Scandinavia
19 Main route only
20 Including Channel Tunnel, but without UK
21 Without waterway volume
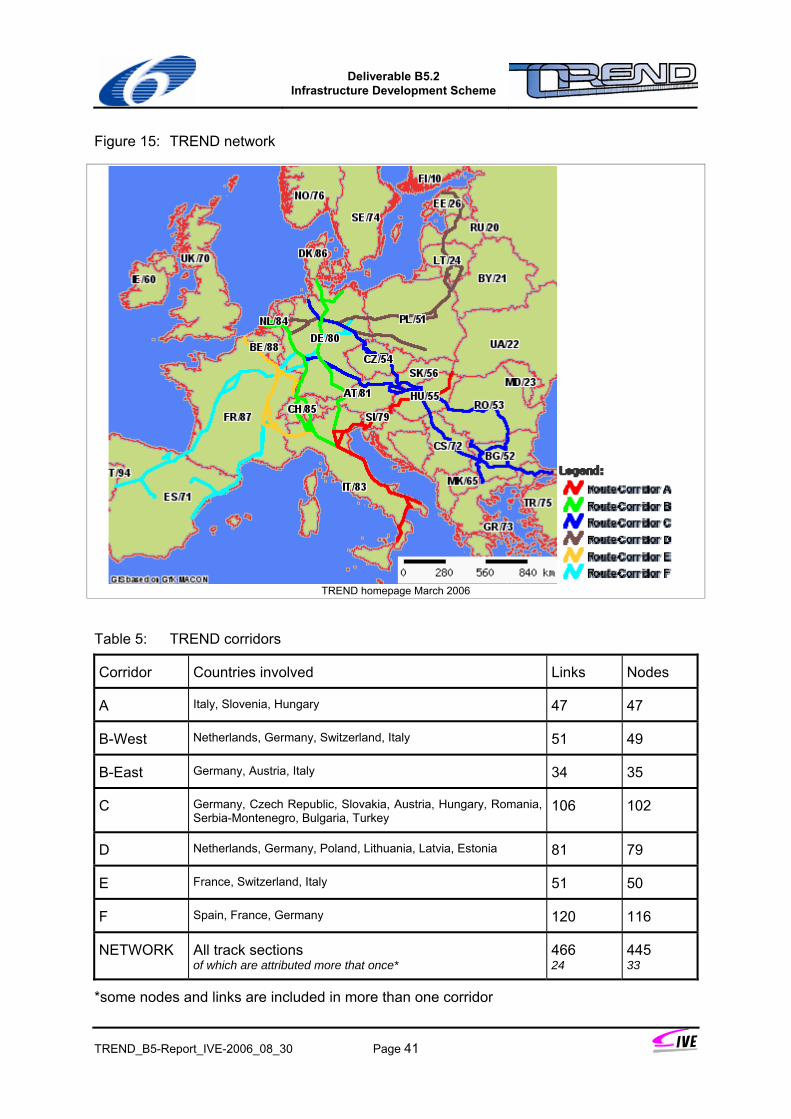
Deliverable B5.2
Infrastructure Development Scheme
TREND_B5-Report_IVE-2006_08_30 Page 41
Figure 15: TREND network
TREND homepage March 2006
Table 5: TREND corridors
Corridor Countries involved Links Nodes
A Italy, Slovenia, Hungary 47 47
B-West Netherlands, Germany, Switzerland, Italy 51 49
B-East Germany, Austria, Italy 34 35
C Germany, Czech Republic, Slovakia, Austria, Hungary, Romania, Serbia-Montenegro, Bulgaria, Turkey
106 102
D Netherlands, Germany, Poland, Lithuania, Latvia, Estonia 81 79
E France, Switzerland, Italy 51 50
F Spain, France, Germany 120 116
NETWORK All track sections of which are attributed more that once*
466 24
445 33
*some nodes and links are included in more than one corridor
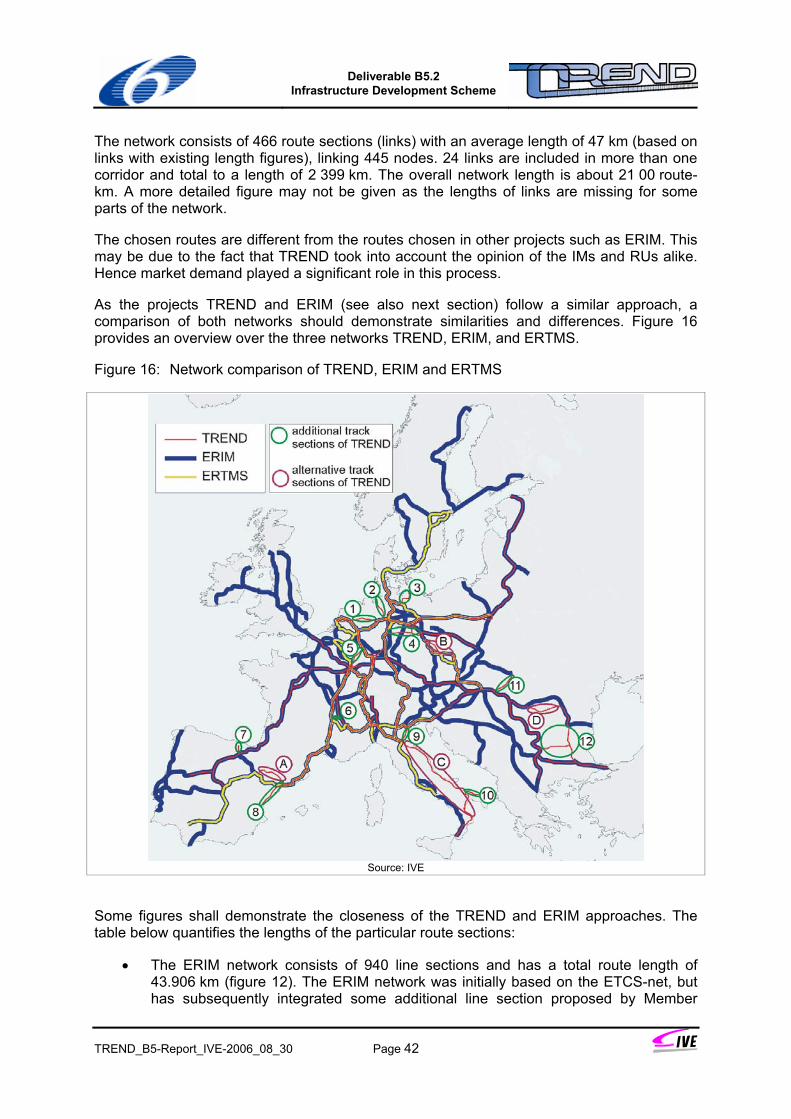
Deliverable B5.2
Infrastructure Development Scheme
TREND_B5-Report_IVE-2006_08_30 Page 42
The network consists of 466 route sections (links) with an average length of 47 km (based on links with existing length figures), linking 445 nodes. 24 links are included in more than one corridor and total to a length of 2 399 km. The overall network length is about 21 00 route-km. A more detailed figure may not be given as the lengths of links are missing for some parts of the network.
The chosen routes are different from the routes chosen in other projects such as ERIM. This may be due to the fact that TREND took into account the opinion of the IMs and RUs alike. Hence market demand played a significant role in this process.
As the projects TREND and ERIM (see also next section) follow a similar approach, a comparison of both networks should demonstrate similarities and differences. Figure 16 provides an overview over the three networks TREND, ERIM, and ERTMS.
Figure 16: Network comparison of TREND, ERIM and ERTMS
Source: IVE
Some figures shall demonstrate the closeness of the TREND and ERIM approaches. The table below quantifies the lengths of the particular route sections:
• The ERIM network consists of 940 line sections and has a total route length of 43.906 km (figure 12). The ERIM network was initially based on the ETCS-net, but has subsequently integrated some additional line section proposed by Member
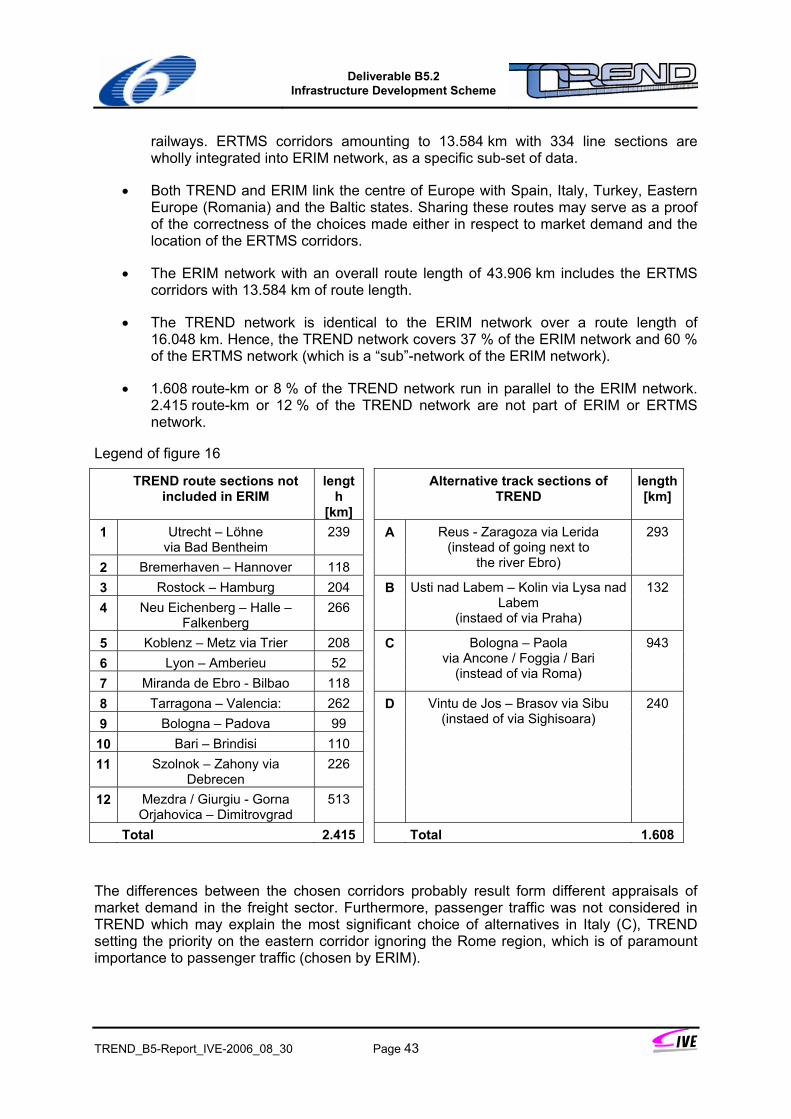
Deliverable B5.2
Infrastructure Development Scheme
TREND_B5-Report_IVE-2006_08_30 Page 43
railways. ERTMS corridors amounting to 13.584 km with 334 line sections are wholly integrated into ERIM network, as a specific sub-set of data.
• Both TREND and ERIM link the centre of Europe with Spain, Italy, Turkey, Eastern Europe (Romania) and the Baltic states. Sharing these routes may serve as a proof of the correctness of the choices made either in respect to market demand and the location of the ERTMS corridors.
• The ERIM network with an overall route length of 43.906 km includes the ERTMS corridors with 13.584 km of route length.
• The TREND network is identical to the ERIM network over a route length of 16.048 km. Hence, the TREND network covers 37 % of the ERIM network and 60 % of the ERTMS network (which is a “sub”-network of the ERIM network).
• 1.608 route-km or 8 % of the TREND network run in parallel to the ERIM network. 2.415 route-km or 12 % of the TREND network are not part of ERIM or ERTMS network.
Legend of figure 16
TREND route sections not included in ERIM
length
[km]
Alternative track sections of TREND
length [km]
1 Utrecht – Löhne via Bad Bentheim
239
2 Bremerhaven – Hannover 118
A Reus - Zaragoza via Lerida (instead of going next to
the river Ebro)
293
3 Rostock – Hamburg 204 4 Neu Eichenberg – Halle –
Falkenberg 266
B Usti nad Labem – Kolin via Lysa nad Labem
(instaed of via Praha)
132
5 Koblenz – Metz via Trier 208 6 Lyon – Amberieu 52 7 Miranda de Ebro - Bilbao 118
C Bologna – Paola via Ancone / Foggia / Bari
(instead of via Roma)
943
8 Tarragona – Valencia: 262 9 Bologna – Padova 99
10 Bari – Brindisi 110 11 Szolnok – Zahony via
Debrecen 226
12 Mezdra / Giurgiu - Gorna Orjahovica – Dimitrovgrad
513
D Vintu de Jos – Brasov via Sibu (instaed of via Sighisoara)
240
Total 2.415 Total 1.608
The differences between the chosen corridors probably result form different appraisals of market demand in the freight sector. Furthermore, passenger traffic was not considered in TREND which may explain the most significant choice of alternatives in Italy (C), TREND setting the priority on the eastern corridor ignoring the Rome region, which is of paramount importance to passenger traffic (chosen by ERIM).
Deliverable B5.2
Infrastructure Development Scheme
TREND_B5-Report_IVE-2006_08_30 Page 44
4 TREND Infrastructure Development Scheme
4.1 Problems of an international approach
The structured evaluation and planning approach is fundamental to a successful development of an international rail infrastructure network. Such an approach may be characterised as a novelty in European infrastructure development as it would overcome the hitherto national planning approaches. TREND as well as ERIM pursue such an approach defining a European core railway network to be developed prior to the remaining overall network. The common infrastructure standard to be achieved on the core network shall generate an outstanding benefit to the RUs using it and to the community benefiting from the low specific external cost incurring due to the efficient and successful operations of rail services.
However, as pointed out earlier in this report (see section 3.7), infrastructure development is a truly national responsibility until today and is closely related to budgetary power of control. Establishing planning and maybe even decision-making processes outside conventional schemes could therefore entail a loss of control over processes. Furthermore, decisions on infrastructure development have direct budgetary implications according to the particular national regulations and practices. A loss of budgetary sovereignty in the transport infrastructure sector might therefore also be feared by the affected national bodies, especially the transport Ministries and the infrastructure managers.
On the other hand does European infrastructure policy, as for example pursued with the trans-European transport network, contribute substantial funds to the development of infrastructure projects, especially in the railway sector. Future political discussion will therefore have to address the problem of better integrating European policy issues already at planning level to achieve a best possible allocation of European public funds.
Closely related to infrastructure planning procedures are the existence of infrastructure and transport and travel demand data and their availability. Today, especially the availability is more restricted than ever as RUs but also IMs tend to gain the status of private companies in a liberalised and competitive market, keeping data as company secrets. In fact, reliable data are the fundamental prerequisite for a qualified infrastructure planning.
The Memorandum of Understanding between the European Commission and the railway associations, the latter representing to a large extent the IMs, is a groundbreaking signal pointing in direction of jointly tackling the deployment of ETCS as a central element of a European railway system. It is also an indication that the parties involved have agreed that an integrated approach to infrastructure development needs to be given priority to further patchwork action. TREND as well as the ERIM project are the first projects developing a methodology and applying cross-boarder planning processes, revealing requirements, chances and hurdles to cross-border infrastructure development.
The TREND project was initiated in mid 2003 at a time, when the Memorandum of Understanding and the ERIM project were no matter of discussion yet. It is therefore a positive effect, that the corridor approach pursued both by TREND and ERIM has been largely adopted by the railway industry. Nonetheless, there are several differences between the approaches as will be shown in the next sections to some extent.
Deliverable B5.2
Infrastructure Development Scheme
TREND_B5-Report_IVE-2006_08_30 Page 45
4.2 Methodology
TREND Work Package B5 is integrated in the overall TREND methodology, both parts A and B. The overall methodology shall therefore briefly presented hereinafter. The TREND procedures can be briefly characterised by the following aspects:
• international team consisting of consultancies, academics, railway associations, representatives from RUs and IMs;
• a high transparency of processes and results including the public display of infrastructure data covering a huge range of technical parameters;
• elaboration of a broad rail transport knowledge base not being restricted to selected parameters or subjects but intended to cover a (close to) full range of subjects beneficial to the international rail freight sector;
• evaluation of the framework conditions of international rail freight markets;
• definition of rail freight requirements towards railway infrastructure;
• a close analysis and evaluation of selected relevant European rail freight corridors;
• proposition of solutions, taking a holistic view of the overall situation.
A guideline for corridor analysis and evaluation was submitted by TREND work package B1 in July 2005. An approach in six steps is proposed to be pursued for each selected corridor, work being spread over several TREND work packages.
• Identification of corridors. Work was undertaken in work package B2 with the involvement of the experts from the countries covered by TREND. The selection process and the corridors were presented in section 3.7.3.
• Building of team for corridor analysis. As in TREND a significant number of experts from various countries participated, national contact persons were directly involved in the project. If further national bodies had to be contacted, this was undertaken by TREND experts.
• Data collection and analysis of corridor. This task was undertaken in part A of TREND and in work package B2. Part A was responsible for the collection of country related background data for international rail freight services. WP B2 collected corridor-specific information. Infrastructure data were collected in WP B2 only and were passed on for further use to work package B5 (this WP).
Sub-steps “Operation procedures” were dealt with in work packages B3. The WP B3 results were used in this work package as an infrastructure analysis was performed on the basis of minimum requirements for efficient rail freight services.
• Diagnosis. This step was partly undertaken in the work packages B2 and B5. Whereas B2 provides a corridor-by-corridor perspective, B5 contributes an overall network analysis.
Deliverable B5.2
Infrastructure Development Scheme
TREND_B5-Report_IVE-2006_08_30 Page 46
• Development of solutions. Within the scope of TREND solutions for adapting railway infrastructure to market demand are proposed (action plans). However, for the submission of detailed infrastructure solutions a further planning step involving a higher level of detail as well as an economic evaluation will be necessary.
Best practices and innovative ideas to cope with restrictions to rail freight services are presented in WP B1 and WP B3. They cover infrastructure as well as operational measures.
• Development of action plans. A TREND action plan will be presented in work package B7 covering all aspects of improvement (market conditions, operations, infrastructure, technical measures etc.). Corridor-specific action plans have been defined in WP B2.
4.2.1 Sub tasks
The infrastructure development scheme is a subtask of the overall corridor analysis. The work steps were briefly introduced in section 3.1, encompassing ten steps. In the following, those will be further elaborated.
1. Identification of the legal framework for infrastructure development.
The legal framework, including effective regulation and financing instruments basing on this legislation, have already been looked at in sections 3.3 and 3.5. Both the funding of the TEN-T and the implementation of Technical Standards for Interoperability support the harmonisation of the European railway infrastructure. By the time of the conclusion of this report, the European Commission had voiced that substantial public financial support will be provided for the implementation of ETCS. However, the infrastructure managers are highly recommended to integrate the implementation of ETCS into an overall infrastructure strategy.
2. Identification of and overview over the parties involved in infrastructure development (current framework)
The overview was provided in section 3.4 taking account of public bodies, associations and partners in the railway industry. The role of each entity is described as it was perceived in 2005/2006. It is likely that the entities will adopt a new role to suit future processes. It is on the other hand conceivable that some of the entities described will evolve in their role and will in turn be modifying processes. No specs shall be voiced regarding the potential and likely impact of new European legislation as such a development is not expected to much likely.
3. Description of the state-of-the-art of infrastructure analysis and evaluation methodologies
Rather than only relying on expert advice, today’s RTD results have more on offer to support planning and evaluation of railway infrastructure and operations which always have to be jointly investigated and interpreted. Complicated structures regarding responsibilities and decision making require objective, impartial facts as a basis for wide-reaching decisions.
New evaluation procedures, evaluation criteria and tools are at hand. Section 3.7 provides an overview over current methods still largely unknown to the railway industry. For several reasons up-to-date methodologies are not applied, ignorance and non-availability of data
Deliverable B5.2
Infrastructure Development Scheme
TREND_B5-Report_IVE-2006_08_30 Page 47
being the most important ones. The application of enhanced methods is very much recommended for future use in infrastructure investigations either being large-scale or restricted to local problems.
Within TREND, a two-tier model approach will be applied with a focus on lacking market requirements. Both parts of the analysis undertake an investigation of the availability of infrastructure parameters along important railway corridors. A central element is the continuity of the availability of favourable conditions to the operation of competitive rail freight services.
The two analyses are presented later in this chapter. A large-scale operational and economical analysis of the TREND network will be required in future work steps of the evaluation.
4. Definition of a priority infrastructure network
The definition of the priority network was described in section 3.7.3. The network described has been identified to carry major international freight flows in the future. The corridor approach constitutes the innovative, characteristic element of the TREND approach.
5. Definition of standards for railway infrastructure
Rail infrastructure requirements are identified in the following section 4.3, based on a market demand approach. The TREND standard stemming from Work Package B3 as well as external standards are compared and evaluated.
6. Analysis of existing railway infrastructure
Overall transport demand has to match infrastructure capacities and quality requirements. In this respect, also deficits which hamper interoperable railway services play a very important role. Infrastructure and interoperability deficits on a corridor basis have therefore been elaborated in the corridor analyses in Work Package B2. An overall network perspective was chosen for Work Package B5, the methodological approach having already been addressed in section 3.7.
Both analysis methodologies will be further demonstrated in the following two sections 4.2.2, “Corridor analyses” and 4.2.3, “Network analysis“.
7. Identification of demand for infrastructure measures
The B2 analysis results are again presented in this report in section 4.4, “Corridor analysis - results”, followed in section 4.5, “Network analysis – results”, by the B5 analysis results.
8. Identification of already decided measures
Measures which have already been politically agreed or even under way are explicitly identified in the corridor analyses. The GIS tool also provides an overview over those measures, an application which is described in section 5.6.12.
9. Development of recommendations
The recommendations of WP B5 encompass the following domains:
• enhancing the methodology for infrastructure planning and evaluation;
Deliverable B5.2
Infrastructure Development Scheme
TREND_B5-Report_IVE-2006_08_30 Page 48
• data gathering and handling;
• further recommendations being closely related to the work processes at European level (framework conditions for infrastructure development).
Concrete measures for improving the quality of international rail freight services to a large extent include operational and organisational measures which may only be found in detail in the corridor action plans, B2 report, also providing further detailed background material.
4.2.2 Corridor analyses
On the basis of the analysis of the corridors a coherent conception of individual measures (“Action Plans”) was developed for each corridor aiming at improving the competitiveness of rail freight services. The methodology of work processes from TREND Work Package B1 and was further refined during the starting phase of TREND B2. The main working steps were:
1. Agreement upon geographical extent and routing of the corridors;
2. Analyses of the corridors, especially as concerns current freight volume (incl. modal split), analysis of the rail infrastructure, aspects of interoperability, and border crossing procedures;
3. Diagnosis of impediments and problems that are jeopardising the development of rail freight services on the corridors;
4. Analysis of alleviation projects already under way;
5. Deduction of action plans, sub-divided into priorities.
The analysis included route infrastructure and important access and freight handling points along the corridor. The latter include terminals for accompanied intermodal transport road/rail, terminals for unaccompanied intermodal transport road/rail, and marshalling yards for conventional single wagon load traffic.
The corridor analysis in Work Package B2, which is hence part of the IDS, produced a very detailed list of infrastructural impediments for each corridor as well as a list with interoperability deficits, operational problems and resource problems, not all of them being linked to infrastructure deficiencies:
• infrastructure problems: border crossing bottlenecks, other infrastructural impediments for rail freight quality;
• lack of interoperability;
• operational problems: cross border train path planning, time losses due to operations in marshalling yards, exchange of data and transport documents;
• resource problems: capacities in stationary infrastructure, rolling stock.
Necessary action to upgrade infrastructure to better respond to market requirements was identified.
Deliverable B5.2
Infrastructure Development Scheme
TREND_B5-Report_IVE-2006_08_30 Page 49
4.2.3 Network analysis
An overall infrastructure data analysis, supported by the GIS-based demonstrator (editing and displaying of infrastructure data), an evaluation of the infrastructure network was carried out. The analysis is presented in chapter 5, also clearly demonstrating the possibilities of the tool.
Central element of the analysis was an evaluation of the restrictions affecting a market-oriented intermodal freight train whishing to operate on the overall network. Based on the technical requirements of the trains as requested by the hypothetical train operators (see section 4.3.3), an analysis was carried out revealing to what extent the current TREND network fulfils the requirements of the market. Results are presented in section 4.5.
4.3 User requirements
4.3.1 The perspective of RUs and conclusions for infrastructure development
The provision of (at least) cost-covering railway services to a large extend depends on the infrastructure provided. It became evident, that the traditional basis for infrastructure development, the provision of sufficient “infrastructure capacity”, is short of respecting overall user requirements. For example, low average speeds reduce the attractiveness of commercial transport offers, restricted train lengths due to short passing loops may lead to a poor cost-benefit-ratio, disrupted technical standards along transport routes require cost and time consuming change of traction equipment. Further examples were already listed in section 3.1.
The operation of long-distance, especially international railway services, require a vast amount of information often in every detail to allow railway undertakings to cautiously plan operation and commercial services. The network statements are therefore a very important source of information to evaluate framework conditions and opportunities beyond their traditional area of operation.
Furthermore, the provision of rail-related services by (preferably) independent service providers, often only on a case-by-case basis, is often indispensable for railway undertakings. Especially smaller operators, traditionally operating regionally and cautiously expanding their business, rely on local services along their route far from their home base.
Regarding railway infrastructure the following correlations should therefore be retained as they are paramount to the successful development of rail freight services:
• The chances of rail freight, according to most of the available studies and prognoses, lie in long-distance services.
• The European railway infrastructure network is heterogeneous and fragmented in terms of technical and operational standards.
• These facts make rail interoperability a true European problem.
Deliverable B5.2
Infrastructure Development Scheme
TREND_B5-Report_IVE-2006_08_30 Page 50
This leads to the following two conclusions, which fully support the ETCS-Net approach to developing an ETCS priority network:
1. Interoperable railway infrastructure needs to be developed along important European trade lanes to provide maximum benefit to the railway undertakings. Only “barrier-free” railway corridors with a uniform infrastructure standard provide an optimum framework for efficient (through) services.
2. A corridor approach shall also govern the definition, analysis and evaluation of a trans-European railway infrastructure.
4.3.2 Setting standards for international rail freight services
It is evident that the overall European railway network may not be equipped according to highest standards to allow most flexible train operation. Economical efficiency would be opposing such a scheme. But to most favourably support the success of rail freight transport, railway infrastructure along the most important (European) transport axes needs to ensure
• a continuous provision of technical parameters in line with the market throughout a rail transport route; and
• as little changes in technical systems along a route as possible.
Market requirements vary by market segment and by transport route and therefore need to be defined according to the actual and forecasted use of transport routes.
A drop in standard of line-side technical parameters such as permissible train length, permissible axle load, or loading gauge over only a short section of the overall route may prevent the efficient operation of a freight service. Changing locomotives at borders not only imposes additional cost on train operation but is also time consuming and thus threatens the often unique selling point “high speed” of the rail service.
The initiatives described in the following agreed on different standards for railway infrastructure. They shall be presented and analysed in a comparative manner.
European agreement on main international railway lines (AGC)
At a time, when the influence of European policy on infrastructure development was still weak and keywords such as “harmonisation of infrastructure” and “interoperability” didn’t have a role to play yet, the United Nations-Economic Commission for Europe (UNECE) made a first attempt to initiate a harmonisation of European railway infrastructure. In 1985, the “European agreement on main international railway lines (AGC)” was adopted by a large
Deliverable B5.2
Infrastructure Development Scheme
TREND_B5-Report_IVE-2006_08_30 Page 51
number of Western and Eastern European countries22. The signatories agreed on an international railway network which should be developed according to standards also fixed in the agreement (refer to Annex 7). The standards were not restricted to a certain type of traffic.
European agreement on important international combined transport lines and related installations (AGTC)
After the fall of the Iron Curtain at the beginning of the 1990s, East-West passenger travel and freight transport were expected to play a very important role soon. Especially intermodal (or combined transport) rail freight services were assessed being restricted in their development by the standards agreed in the AGC agreement. Therefore, in 1991, the UNECE in Geneva agreed on the “European agreement on important international combined transport lines and related installations (AGTC)” including technical standards for railway lines and the technical parameters of trains operating combined transport services (Annexes III and IV of the document, Annex 8 of this report). These were considered being more favourable to intermodal freight transport, especially increasing the allowable axle load from 20 tonnes to 22,5 tonnes (at 100 km/h) and decreasing the nominal line speed to 100/120 km/h. A network suitable for efficient intermodal train services, comprising railway lines and other infrastructure concerned, was also defined23. The agreement is regularly amended and still provides the only international contractual basis in this sector, which is valid beyond the EU-25 territory.
Table 6 lists the AGTC minimum standards for international combined transport trains in comparison with further standards. ‘At present’ obviously relates to the year 1991. The footnote defines ‘Target values’ as to be “achieved approximately by the year 2000”.
Trans-European Railway (TER) Project
In 1987, eleven eastern and south-eastern European countries, among them the central-European States Germany and Austria, launched the “Trans-European Railway Project (TER)”. Again, the UNECE acts as an umbrella organisation, a Project Central Office being located in Budapest. The initiative goes also back to a time when the integration of many of the eastern European countries into the European Union could not even be thought of. The geographic coverage of TER still today goes beyond the activities of the European Union.
“The general objective of the TER Project is to develop a coherent efficient rail and combined transport system among Central and Eastern European countries and between those
22 United Nations-Economic Commission for Europe, Inland Transport Committee: European agreement on main international railway lines (AGC), done at Geneva on 31 May 1985; Document No. ECE/TRANS/63; Update of Annex I of 6 August 2004.
23 United Nations-Economic Commission for Europe, Inland transport Committee: European agreement on important international combined transport lines and related installations (AGTC); done at Geneva on 1 February 1991; Document No. ECE/TRANS/88/Rev.3; amended version of 2005.
Deliverable B5.2
Infrastructure Development Scheme
TREND_B5-Report_IVE-2006_08_30 Page 52
countries and other European countries.”24 Technical standards for the TER have been agreed (cf. Annex 9) which are intended to support the “more specific objectives” which include:
• the development of railway infrastructure to at least match the TER standards (see below);
• the modernisation and harmonisation of transport equipment and the improvement of the compatibility of the systems;
• the introduction of market-oriented management to the railways.
Apart from pure technical aspects deducible from the objectives, actions shall also include the fostering of combined transport, joint training, the establishment of a multimodal data bank, market analysis etc.
Today, sixteen countries work in the TER project, Germany having meanwhile left the group. Further members will be joining the TER project as will Armenia and Azerbaijan in 2006. The current members actively participated in the joint preparation of the “Trans-European Motorway (TEM)-Trans-European Railway (TER) Master Plan”25, which was published recently and also presented to the European Commission. According to the authors, the master plan for the first time provides a “consistent and realistic short-, medium- and long-term investment strategy on the road, rail and combined transport Backbone Networks in the wider TEM and TER region”, which documents the common intention of the partners but has no binding effect. However, the master plan shall support TER members in arranging loans for transport infrastructure investment from banks and other financial institutions.
ERIM standards
ERIM Project, carried out by UIC in close cooperation with its Member railways and representatives bodies (see details in section 3.6.3), presented a preliminary proposition for discussion on the harmonisation targets for certain technical and operational parameters in passenger and freight rail transport. In the ERIM project, a figure of 70 % network compliance by 2020 has been taken as the target threshold to set a benchmark of 100 % for the whole ERIM network for the period up to 2025. For totally new designs or major network upgrades, it is proposed that a more ambitious target be set for installations still in use in 2050.
24 Quoted from: Co-operation Trust Fund Agreement, Attachment - Part 3, Trans-European Railway (TER) Co-operation Agreement; Framework for 2001-2005.
25 United Nations Economic Commission for Europe (UNECE): Report on the Trans-European Motorway (TEM) and Trans-European Railway (TER), Projects’ Master Plan, Final Report, Advance Copy of January 2006.
Deliverable B5.2
Infrastructure Development Scheme
TREND_B5-Report_IVE-2006_08_30 Page 53
4.3.3 The TREND standard for international rail freight services
The standards described in the previous chapter were reviewed in TREND, work package B3. The minimum requirements for international trains in combined transport were then defined for the TREND project as such:
• Loading gauge: P/C 400 for semi-trailer and swap bodies
• Loading gauge: C45 for container on flat wagon
• Axle load: 22,5 tonnes
• Nominal speed: 120 km/h
• Train weight: 1 500 tonnes
• Train length: 700 m (as defined by available length of passing sidings)
The request of the above intermodal loading gauges require the implementation of UIC loading gauge C. Depending on the specific market requirements, for example port hinterland services, the type of cargo etc., the infrastructure parameters required can vary. This can also result in heavier and shorter trains (1 800 tons, 500 m) or lighter and faster trains (800 tonnes, 140 km/h). For the network-wide evaluation of the TREND infrastructure, a set of six different model trains are defined in chapter 4.3 to take account of different market requirements.
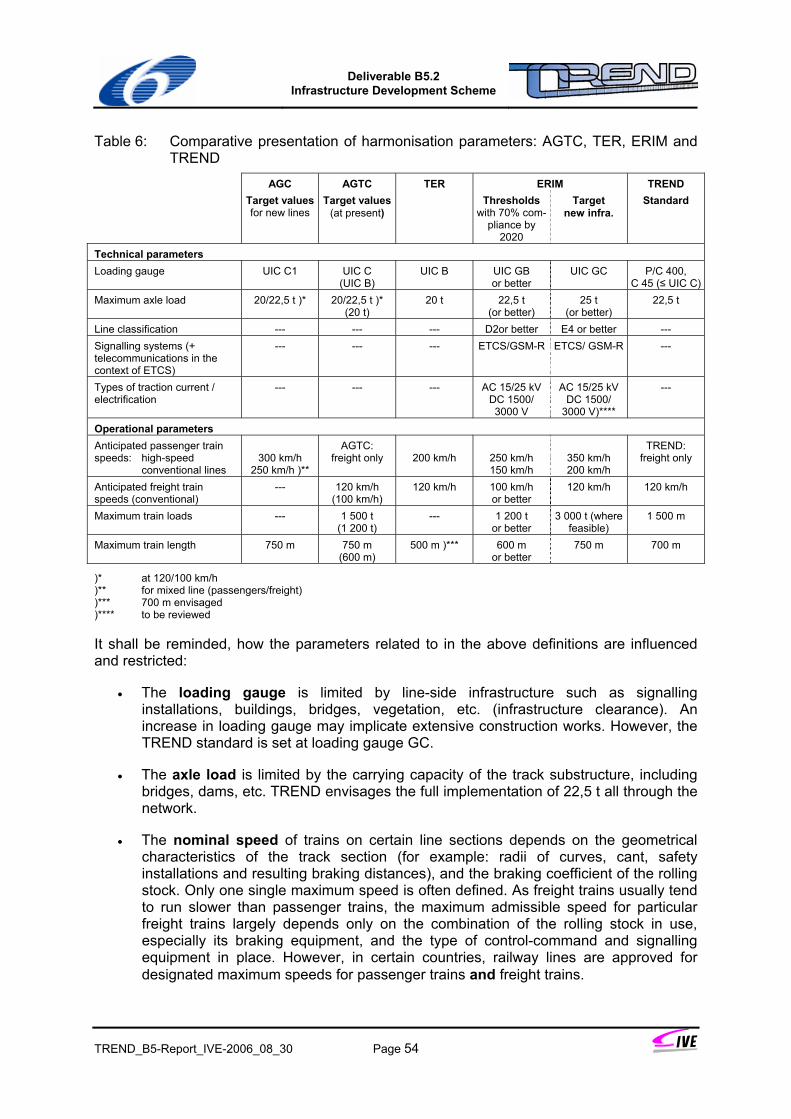
Deliverable B5.2
Infrastructure Development Scheme
TREND_B5-Report_IVE-2006_08_30 Page 54
Table 6: Comparative presentation of harmonisation parameters: AGTC, TER, ERIM and TREND
AGC AGTC TER ERIM TREND Target values
for new lines Target values
(at present) Thresholds
with 70% com-pliance by
2020
Target new infra.
Standard
Technical parameters Loading gauge UIC C1 UIC C
(UIC B) UIC B UIC GB
or better UIC GC P/C 400,
C 45 (≤ UIC C)Maximum axle load 20/22,5 t )* 20/22,5 t )*
(20 t) 20 t 22,5 t
(or better) 25 t
(or better) 22,5 t
Line classification --- --- --- D2or better E4 or better --- Signalling systems (+ telecommunications in the context of ETCS)
--- --- --- ETCS/GSM-R ETCS/ GSM-R ---
Types of traction current / electrification
--- --- --- AC 15/25 kVDC 1500/ 3000 V
AC 15/25 kV DC 1500/
3000 V)****
---
Operational parameters Anticipated passenger train speeds: high-speed conventional lines
300 km/h
250 km/h )**
AGTC: freight only
200 km/h
250 km/h 150 km/h
350 km/h 200 km/h
TREND: freight only
Anticipated freight train speeds (conventional)
--- 120 km/h (100 km/h)
120 km/h 100 km/h or better
120 km/h 120 km/h
Maximum train loads --- 1 500 t (1 200 t)
--- 1 200 t or better
3 000 t (where feasible)
1 500 m
Maximum train length 750 m 750 m (600 m)
500 m )*** 600 m or better
750 m 700 m
)* at 120/100 km/h )** for mixed line (passengers/freight) )*** 700 m envisaged )**** to be reviewed
It shall be reminded, how the parameters related to in the above definitions are influenced and restricted:
• The loading gauge is limited by line-side infrastructure such as signalling installations, buildings, bridges, vegetation, etc. (infrastructure clearance). An increase in loading gauge may implicate extensive construction works. However, the TREND standard is set at loading gauge GC.
• The axle load is limited by the carrying capacity of the track substructure, including bridges, dams, etc. TREND envisages the full implementation of 22,5 t all through the network.
• The nominal speed of trains on certain line sections depends on the geometrical characteristics of the track section (for example: radii of curves, cant, safety installations and resulting braking distances), and the braking coefficient of the rolling stock. Only one single maximum speed is often defined. As freight trains usually tend to run slower than passenger trains, the maximum admissible speed for particular freight trains largely depends only on the combination of the rolling stock in use, especially its braking equipment, and the type of control-command and signalling equipment in place. However, in certain countries, railway lines are approved for designated maximum speeds for passenger trains and freight trains.
Deliverable B5.2
Infrastructure Development Scheme
TREND_B5-Report_IVE-2006_08_30 Page 55
When collecting infrastructure data for the TREND project, no consistency of nominal freight speed data quality could be reached due to various approaches of the definition of maximum freight speeds. It may therefore happen that nominal freight speeds, where they have only indicative character, may be exceeded by freight trains being specially equipped. The nominal speed for TREND market-oriented infrastructure standards where set at 120 km/h and 140 kn/h.
• The weight of a train includes the weight of the train consist. It is often limited by the ability of locomotives to pulling heavy trains uphill. The TREND benchmarks where set to 500 t, 1 500 t, and 1 800 t.
• The length of a train is usually limited by the length of passing siding available along the transport route. For TREND analysis purposes standards where set at 700 m or 500 m.
Conclusions
Like in the AGC and the AGTC agreements, the TER partners agreed on a railway network and on a common standard (comparative table see Annex 10) according to which the railway infrastructure shall be further developed. AGC agreement and TER standard cover infrastructure for freight and passenger services. Only in one important respect, the TER standard falls behind the AGC standard for existing lines, which is the usable length of passing sidings of only 500 m. According to the Project Central Office, this old standard is likely to be raised in the future to prevent a west-east incline in standard from being made permanent.
In general, TREND standards are in line with the AGTC agreement. The maximum train length of 700 m required by TREND falls slightly behind the 750 m requested by the AGTC agreement. Furthermore, there seems to be no major disagreement with any other source about which infrastructure standard shall be requested in the future. Aspects of interoperability may add effective train-control and telecommunications technologies to the list of parameters to be respected with regard to infrastructure development. These are only covered by ERIM so far.
The TREND requirements are insofar TREND-setting as they shall not only be valid for new lines but for the overall core network, also comprising existing lines. This is based on the assumption that future traffic will heavily rely on existing infrastructure, also having to respond to market requirements. An exclusion of network segments from these standards would heavily disadvantage rail freight compared to competing modes, especially road.
Definition of trains
The network analysis in chapter 4.5 shall mirror the TREND infrastructure standards against the railway infrastructure in place for the time being. Therefore, the overall TREND network is analysed with regard to its suitability to the operation of TREND model trains. The train parameters are summarised in table 7 and are differentiated according to market requirements, for example port hinterland services or continental services. The following parameters were varied, keeping the axle load as an absolute term at 22,5 t: train length, train weight, nominal train speed, and intermodal loading gauge.
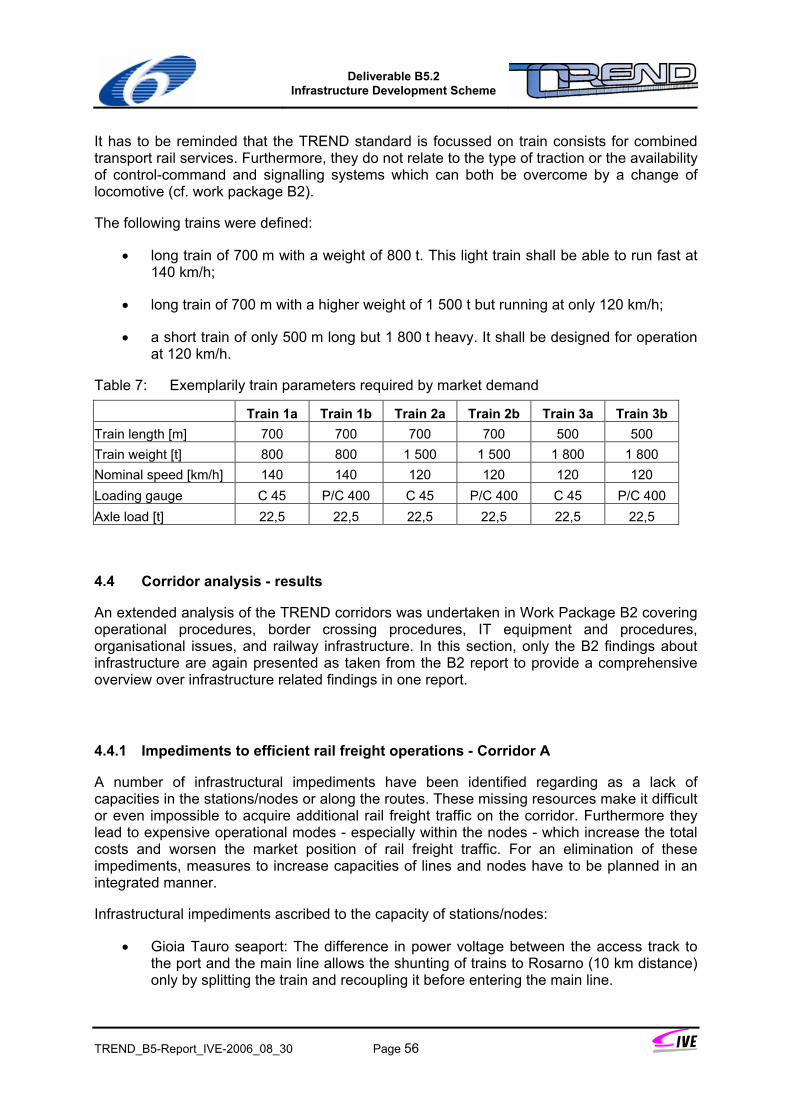
Deliverable B5.2
Infrastructure Development Scheme
TREND_B5-Report_IVE-2006_08_30 Page 56
It has to be reminded that the TREND standard is focussed on train consists for combined transport rail services. Furthermore, they do not relate to the type of traction or the availability of control-command and signalling systems which can both be overcome by a change of locomotive (cf. work package B2).
The following trains were defined:
• long train of 700 m with a weight of 800 t. This light train shall be able to run fast at 140 km/h;
• long train of 700 m with a higher weight of 1 500 t but running at only 120 km/h;
• a short train of only 500 m long but 1 800 t heavy. It shall be designed for operation at 120 km/h.
Table 7: Exemplarily train parameters required by market demand
Train 1a Train 1b Train 2a Train 2b Train 3a Train 3b Train length [m] 700 700 700 700 500 500 Train weight [t] 800 800 1 500 1 500 1 800 1 800 Nominal speed [km/h] 140 140 120 120 120 120 Loading gauge C 45 P/C 400 C 45 P/C 400 C 45 P/C 400 Axle load [t] 22,5 22,5 22,5 22,5 22,5 22,5
4.4 Corridor analysis - results
An extended analysis of the TREND corridors was undertaken in Work Package B2 covering operational procedures, border crossing procedures, IT equipment and procedures, organisational issues, and railway infrastructure. In this section, only the B2 findings about infrastructure are again presented as taken from the B2 report to provide a comprehensive overview over infrastructure related findings in one report.
4.4.1 Impediments to efficient rail freight operations - Corridor A
A number of infrastructural impediments have been identified regarding as a lack of capacities in the stations/nodes or along the routes. These missing resources make it difficult or even impossible to acquire additional rail freight traffic on the corridor. Furthermore they lead to expensive operational modes - especially within the nodes - which increase the total costs and worsen the market position of rail freight traffic. For an elimination of these impediments, measures to increase capacities of lines and nodes have to be planned in an integrated manner.
Infrastructural impediments ascribed to the capacity of stations/nodes:
• Gioia Tauro seaport: The difference in power voltage between the access track to the port and the main line allows the shunting of trains to Rosarno (10 km distance) only by splitting the train and recoupling it before entering the main line.
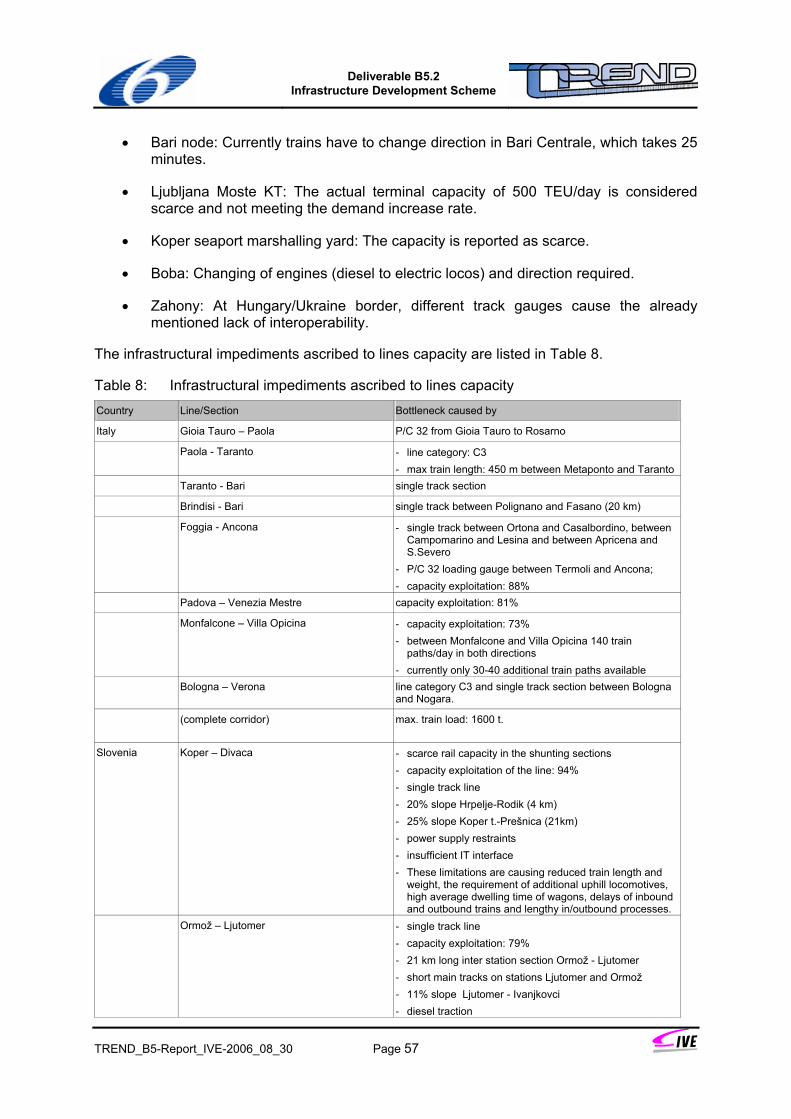
Deliverable B5.2
Infrastructure Development Scheme
TREND_B5-Report_IVE-2006_08_30 Page 57
• Bari node: Currently trains have to change direction in Bari Centrale, which takes 25 minutes.
• Ljubljana Moste KT: The actual terminal capacity of 500 TEU/day is considered scarce and not meeting the demand increase rate.
• Koper seaport marshalling yard: The capacity is reported as scarce.
• Boba: Changing of engines (diesel to electric locos) and direction required.
• Zahony: At Hungary/Ukraine border, different track gauges cause the already mentioned lack of interoperability.
The infrastructural impediments ascribed to lines capacity are listed in Table 8.
Table 8: Infrastructural impediments ascribed to lines capacity Country Line/Section Bottleneck caused by
Italy Gioia Tauro – Paola P/C 32 from Gioia Tauro to Rosarno
Paola - Taranto - line category: C3 - max train length: 450 m between Metaponto and Taranto
Taranto - Bari single track section
Brindisi - Bari single track between Polignano and Fasano (20 km)
Foggia - Ancona - single track between Ortona and Casalbordino, between Campomarino and Lesina and between Apricena and S.Severo
- P/C 32 loading gauge between Termoli and Ancona; - capacity exploitation: 88%
Padova – Venezia Mestre capacity exploitation: 81%
Monfalcone – Villa Opicina - capacity exploitation: 73% - between Monfalcone and Villa Opicina 140 train
paths/day in both directions - currently only 30-40 additional train paths available
Bologna – Verona line category C3 and single track section between Bologna and Nogara.
(complete corridor) max. train load: 1600 t.
Slovenia Koper – Divaca - scarce rail capacity in the shunting sections - capacity exploitation of the line: 94% - single track line - 20% slope Hrpelje-Rodik (4 km) - 25% slope Koper t.-Prešnica (21km) - power supply restraints - insufficient IT interface - These limitations are causing reduced train length and
weight, the requirement of additional uphill locomotives, high average dwelling time of wagons, delays of inbound and outbound trains and lengthy in/outbound processes.
Ormož – Ljutomer - single track line - capacity exploitation: 79% - 21 km long inter station section Ormož - Ljutomer - short main tracks on stations Ljutomer and Ormož - 11% slope Ljutomer - Ivanjkovci - diesel traction
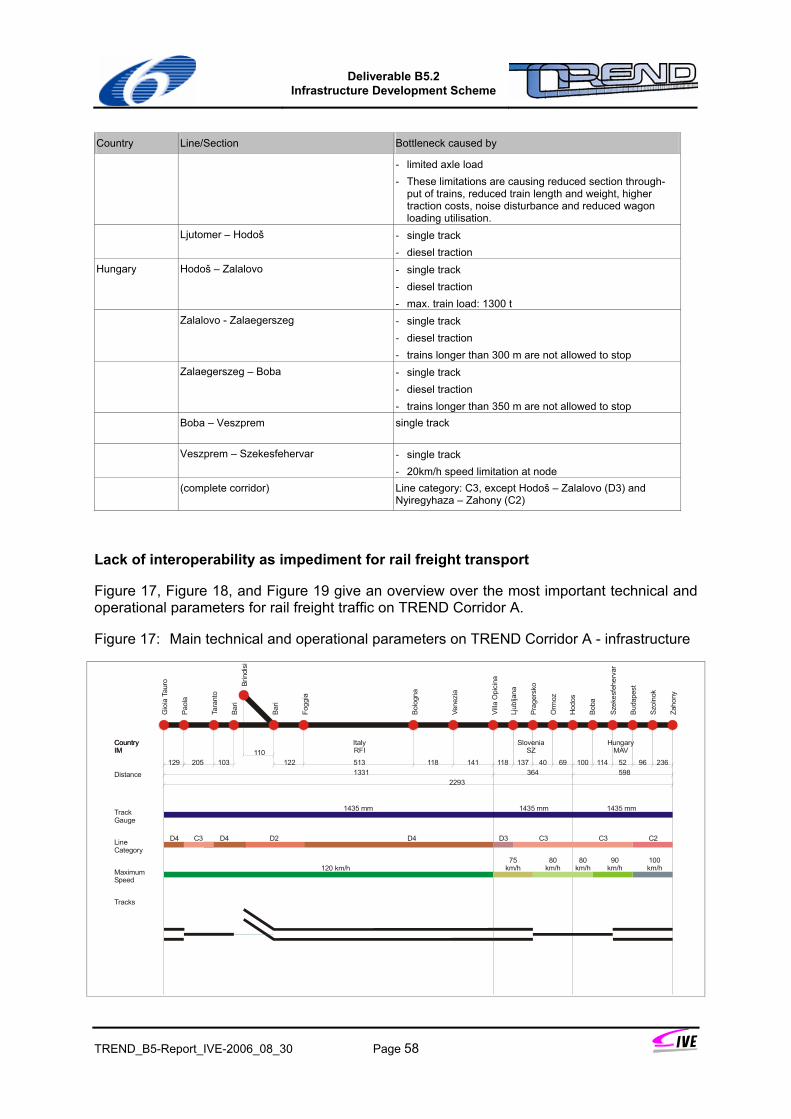
Deliverable B5.2
Infrastructure Development Scheme
TREND_B5-Report_IVE-2006_08_30 Page 58
Country Line/Section Bottleneck caused by
- limited axle load - These limitations are causing reduced section through-
put of trains, reduced train length and weight, higher traction costs, noise disturbance and reduced wagon loading utilisation.
Ljutomer – Hodoš - single track - diesel traction
Hungary Hodoš – Zalalovo - single track - diesel traction - max. train load: 1300 t
Zalalovo - Zalaegerszeg - single track - diesel traction - trains longer than 300 m are not allowed to stop
Zalaegerszeg – Boba - single track - diesel traction - trains longer than 350 m are not allowed to stop
Boba – Veszprem single track
Veszprem – Szekesfehervar - single track - 20km/h speed limitation at node
(complete corridor) Line category: C3, except Hodoš – Zalalovo (D3) and Nyiregyhaza – Zahony (C2)
Lack of interoperability as impediment for rail freight transport
Figure 17, Figure 18, and Figure 19 give an overview over the most important technical and operational parameters for rail freight traffic on TREND Corridor A.
Figure 17: Main technical and operational parameters on TREND Corridor A - infrastructure
Tracks
MaximumSpeed
D4D4 D4 D2C3 C3LineCategory
1435 mm 1435 mmTrackGauge
1435 mm
Distance
CountryIM
Gio
ia T
auro
Paol
a
Tara
nto
Bari
Brin
disi
Bari
Fogg
ia
Bolo
gna
Hod
os
Boba
Zaho
ny
Buda
pest
ItalyRFI
CountryIM
SloveniaSZ
HungaryMAV
Villa
Opi
cina
Ljub
ljana
Orm
oz
Prag
ersk
o
129 205 103110
122 513 118 141
120 km/h
1331
Vene
zia
Szek
esfe
herv
ar
100 114 52 23696598
100 km/h
90km/h
C2
80km/h
80km/h
75km/h
Szol
nok
69118 137 40364
D3 C3
2293
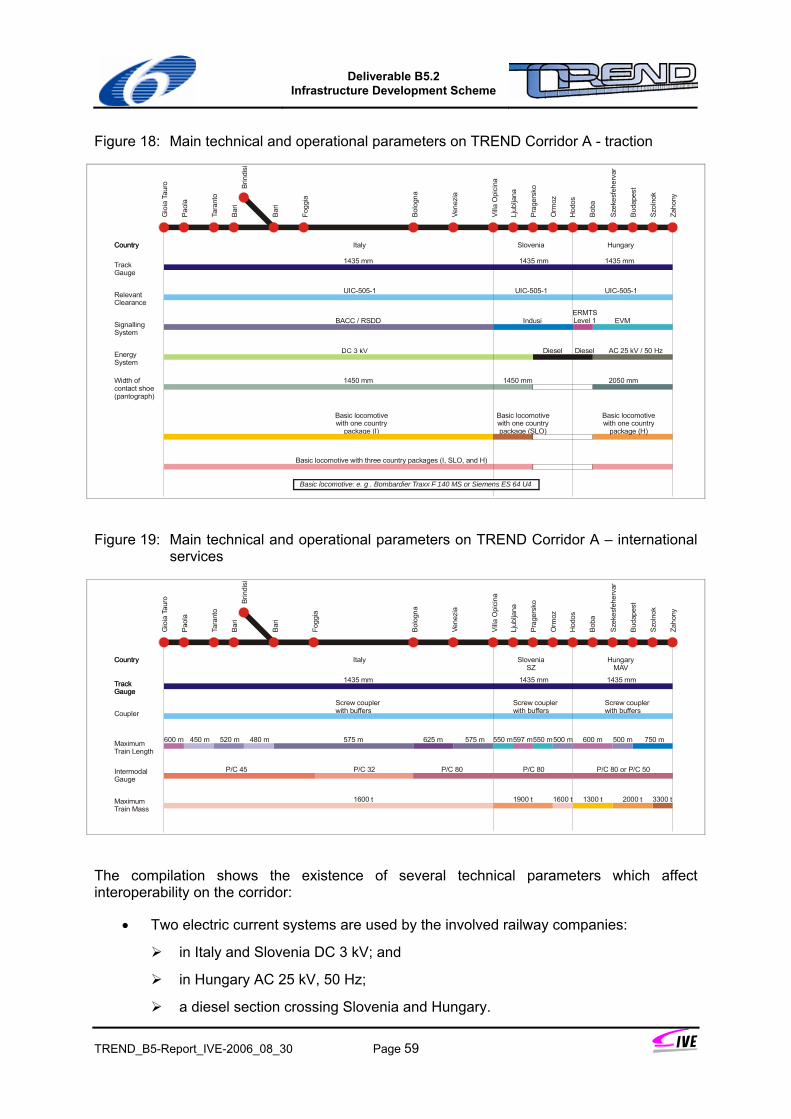
Deliverable B5.2
Infrastructure Development Scheme
TREND_B5-Report_IVE-2006_08_30 Page 59
Figure 18: Main technical and operational parameters on TREND Corridor A - traction
Basic locomotive with one country package (SLO)
Basic locomotive with one country
package (I)
Basic locomotive with one country
package (H)
Basic locomotive with three country packages (I, SLO, and H)
1450 mm 1450 mm 2050 mmWidth ofcontact shoe(pantograph)
Diesel DieselEnergySystem
IndusiBACC / RSDD EVMSignallingSystem
UIC-505-1 UIC-505-1UIC-505-1RelevantClearance
1435 mm1435 mm1435 mmTrackGauge
Country
Hod
os
Zaho
ny
Buda
pest
Ljub
ljana
ItalyCountry Slovenia Hungary
Villa
Opi
cina
Basic locomotive: e. g . Bombardier Traxx F 140 MS or Siemens ES 64 U4
Boba
Gio
ia T
auro
Paol
a
Tara
nto
Bari
Brin
disi
Bari
Fogg
ia
Bolo
gna
Vene
zia
AC 25 kV / 50 Hz
Szek
esfe
herv
ar
Szol
nok
ERMTSLevel 1
Orm
oz
Prag
ersk
o
Figure 19: Main technical and operational parameters on TREND Corridor A – international services
MaximumTrain Mass
Intermodal Gauge
P/C 80 P/C 80 or P/C 50P/C 80P/C 32P/C 45
MaximumTrain Length
CouplerScrew couplerwith buffers
Screw couplerwith buffers
Screw couplerwith buffers
TrackGaugeTrackGauge
1435 mm 1435 mm1435 mm
Country
Hod
os
Zaho
ny
Buda
pest
Szol
nok
Szek
esfe
herv
ar
ItalyCountry SloveniaSZ
HungaryMAV
Villa
Opi
cina
Ljub
ljana
Boba
Gio
ia T
auro
Paol
a
Tara
nto
Bari
Brin
disi
Bari
Fogg
ia
Bolo
gna
Vene
zia
1600 t 1600 t1900 t
575 m 575 m625 m600 m 600 m450 m 480 m520 m 500 m500 m 750 m
3300 t2000 t1300 t
Orm
oz
Prag
ersk
o
550 m 550 m597 m
The compilation shows the existence of several technical parameters which affect interoperability on the corridor:
• Two electric current systems are used by the involved railway companies:
in Italy and Slovenia DC 3 kV; and
in Hungary AC 25 kV, 50 Hz;
a diesel section crossing Slovenia and Hungary.
Deliverable B5.2
Infrastructure Development Scheme
TREND_B5-Report_IVE-2006_08_30 Page 60
• The width of the pantograph is 2050 mm in Hungary and 1450 mm in Slovenia and Italy.
• In each country a dedicated national signalling system is used. The ERTMS level 1 is established in Hungary, on a section between the Slovenian border and Boba. In Italy, the complete Adriatic line is going to be converted. Further lines will not be converted to SCMT (Sistema Controllo Marcia Treno), which is ERTMS-compatible.
This means that a locomotive generally applicable on the corridor would have to be compatible with
• Two current systems, plus diesel;
• Two widths of pantograph;
• Four different signalling systems:
BACC/RSDD/SCMT in Italy,
Indusi in Slovenia,
ERTMS level 1 on selected Hungary lines,
EVM in Hungary.
The SCMT signalling system that is going to be implemented on the most part of Italian network is reported to be fully compatible to the ERTMS system. Thus, it seems sensible that this implementation will not lead to a further system.
The maximum permitted parameters for a freight train to operate along the whole corridor are listed in Table 9.
Table 9: Permitted train parameters for non-stop operating on Corridor A From Gioia Tauro to Zahony
Intermodal gauge P/C 32
Train length 450 m
Train gross load 1300 t
The main limitations, affecting the organisation of a whole corridor service, are:
• profile limitation to P/C 32 between Foggia and Bologna,
• train length limitation to 450 m on Paola – Taranto section. However, trains longer than 300 m are not allowed to stop in a short section in Hungary,
• train weight limitation to 1300 t in Hungary.
On the other hand, there are NO interoperability problems on the corridor line concerning:
• the track width (1435 mm),
• the wagon coupling mode (screw coupler and buffers).
Deliverable B5.2
Infrastructure Development Scheme
TREND_B5-Report_IVE-2006_08_30 Page 61
4.4.2 Impediments to efficient rail freight operations - Corridor B-West
Infrastructural impediments mainly concern the lack of capacities in the stations/nodes or along the lines. These missing resources make it difficult or even impossible to acquire additional rail freight traffic on the corridor. Furthermore they lead to expensive operational modes - especially within the nodes - which increase total costs and worsen the market position of rail freight traffic. For an elimination of these impediments, measures to increase capacities of lines and nodes have to be planned in an integrated manner.
Infrastructural impediments ascribed to stations/nodes capacity:
• Node Chiasso: The freight relay yard has only few tracks and does not operate during 24 h/d. Consequence: Many transit trains have to be moved in other nodes areas causing a longer transit time.
• Node Chiasso: The actual position of the Italian engine shed is not appropriate to the freight trains' operation modes. Consequence: Interference between trains to/from the south and freight locomotives going/coming to/from the engine shed.
• Node Luino: Only three freight tracks are more than 600 m long. Consequences: Some freight trains from/to north must be shunted in other station’s areas.
Infrastructural impediments ascribed to lines capacity are listed in Table 10.
Table 10: Infrastructural impediments ascribed to lines capacity Country Line/Section Bottleneck caused by
Netherlands/
Germany
Zevenaar - Emmerich junction of BETUWE line
Germany Freiburg - Basel profile P/C 70 - 400
Germany/
Switzerland
Basel Bad - Basel SBB insufficient capacity due to high traffic volume
Switzerland Basel - Chiasso profile P/C 60 - 384
Pratteln - Brugg insufficient capacity due to high traffic volume
Rotkreuz - Erstfeld insufficient capacity due to high traffic volume
Giubiasco - Luino profile P/C 60 - 384
Giubiasco - Luino - single track - insufficient capacity due to high traffic volume
Basel - Olten insufficient capacity due to high traffic volume
Bern - Thun insufficient capacity due to high traffic volume
Thun - Brig only single track with P/C 80 - 405 profile
Lötschberg Base-Tunnel - single track - high traffic volume
Switzerland/
Italy
Brig - Domodossola insufficient capacity due to high traffic volume
Italy Domodossola – Novara
(via Borgomanero)
- single track - max. train length: 575 m - profile P/C 80 - 410
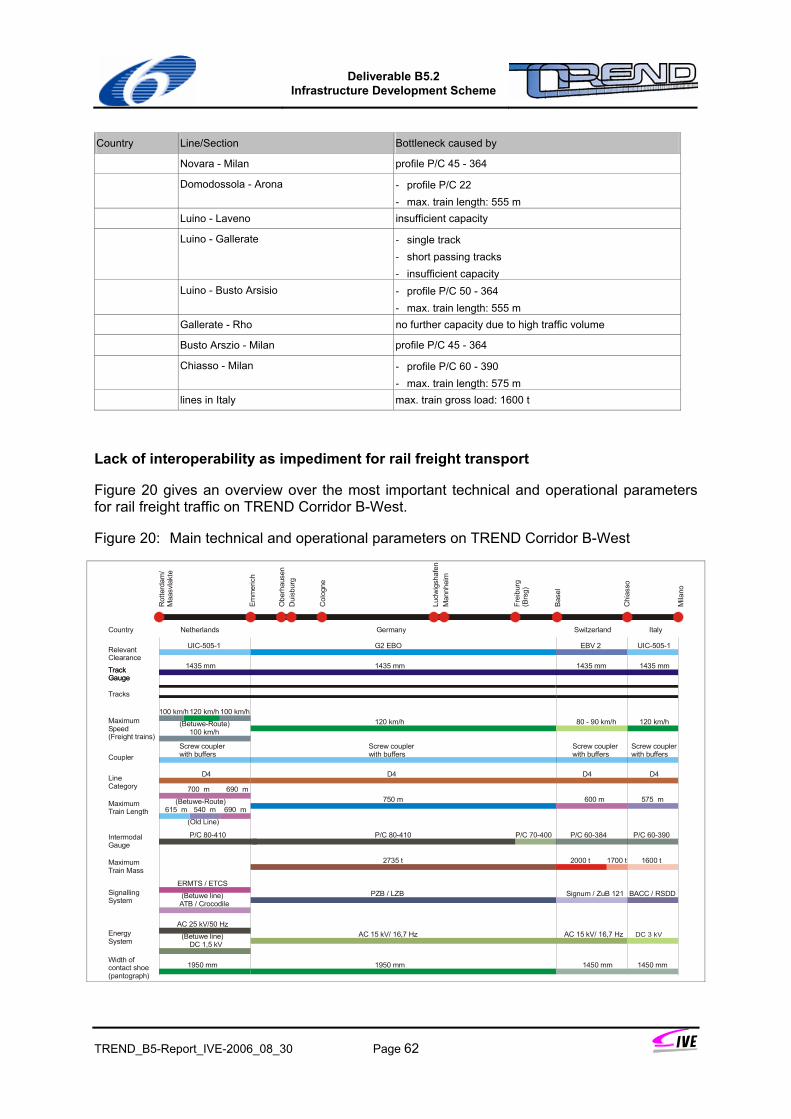
Deliverable B5.2
Infrastructure Development Scheme
TREND_B5-Report_IVE-2006_08_30 Page 62
Country Line/Section Bottleneck caused by
Novara - Milan profile P/C 45 - 364
Domodossola - Arona - profile P/C 22 - max. train length: 555 m
Luino - Laveno insufficient capacity
Luino - Gallerate - single track - short passing tracks - insufficient capacity
Luino - Busto Arsisio - profile P/C 50 - 364 - max. train length: 555 m
Gallerate - Rho no further capacity due to high traffic volume
Busto Arszio - Milan profile P/C 45 - 364
Chiasso - Milan - profile P/C 60 - 390 - max. train length: 575 m
lines in Italy max. train gross load: 1600 t
Lack of interoperability as impediment for rail freight transport
Figure 20 gives an overview over the most important technical and operational parameters for rail freight traffic on TREND Corridor B-West.
Figure 20: Main technical and operational parameters on TREND Corridor B-West
Maximum Train Length
575 m540 m
(Old Line)
750 m
Intermodal Gauge
P/C 60-384P/C 70-400 P/C 60-390P/C 80-410P/C 80-410
MaximumTrain Mass
2735 t 1600 t
CouplerScrew couplerwith buffers
Screw couplerwith buffers
Screw couplerwith buffers
Screw couplerwith buffers
TrackGaugeTrackGauge
1435 mm 1435 mm1435 mm1435 mm
Country
Rot
terd
am/
Maa
svla
kte
Em
mer
ich
Obe
rhau
sen
Dui
sbur
g
Col
ogne
Ludw
igsh
afen
Frei
burg
(Brs
g)
Bas
el
Chi
asso
Mila
no
Netherlands Germany Switzerland Italy
Man
nhei
m
600 m
2000 t 1700 t
700 m 690 m
(Betuwe-Route)615 m 690 m
Tracks
120 km/hMaximumSpeed(Freight trains)
120 km/h(Betuwe-Route)
100 km/h120 km/h100 km/h80 - 90 km/h
100 km/h
UIC-505-1 UIC-505-1G2 EBO EBV 2RelevantClearance
D4 D4D4LineCategory
D4
1950 mm 1950 mm 1450 mm1450 mm
AC 25 kV/50 Hz
(Betuwe line)DC 1,5 kV
AC 15 kV/ 16,7 Hz AC 15 kV/ 16,7 Hz
(Betuwe line)ATB / Crocodile
ERMTS / ETCSSignum / ZuB 121PZB / LZB BACC / RSDD
Width ofcontact shoe(pantograph)
EnergySystem
SignallingSystem
Deliverable B5.2
Infrastructure Development Scheme
TREND_B5-Report_IVE-2006_08_30 Page 63
The figure shows a large variety of operating and technical parameters which affect interoperability on the corridor:
• All European current systems are provided by the involved infrastructure managers:
in Germany and Switzerland AC 15 kV, 16,7 Hz;
in Italy DC 3 kV; and
in the Netherlands on old lines, in Kijfhoek (marshalling yard of Rotterdam) and in Zevenaar (German border) DC 1.5 kV; on the main part of BETUWE line AC 25 kV, 50 Hz.
• The required width of the pantograph is 1950 mm in the Netherlands and Germany and to 1450 mm in Switzerland and Italy.
• In each country a dedicated national signalling system is used. The new European ETCS level 2 will be only established on Betuwe line, Bern - Thun line and the Lötschberg base-tunnel. Further lines will not be converted to ETCS in the foreseeable future however.
This means that a locomotive generally operated on the corridor would have to be compatible with:
• four electric current systems. A use of diesel locomotives is prohibited south of Basel due to long alpine tunnels;
• two widths of pantographs;
• five different signalling systems:
ETCS level 2 in the Netherlands and Switzerland (Lötschberg route);
ATB/Crocodile in the Netherlands;
PZB 90/LZB in Germany;
Signum/ZuB 121 in Switzerland (Gotthard route); and
BACC/RSDD in Italy.
The maximum permitted parameters for a freight train to operate along the whole corridor are listed in Table 11 (see also Figure 21, Figure 22, and Figure 23).
Table 11: Permitted train parameters for non-stop operating on Corridor B-West via Gotthard route via Lötschberg route
Intermodal gauge P/C 60-384 P/C 45-364
Train length 575 m 575 m
Train gross load 1600 t 1300 t
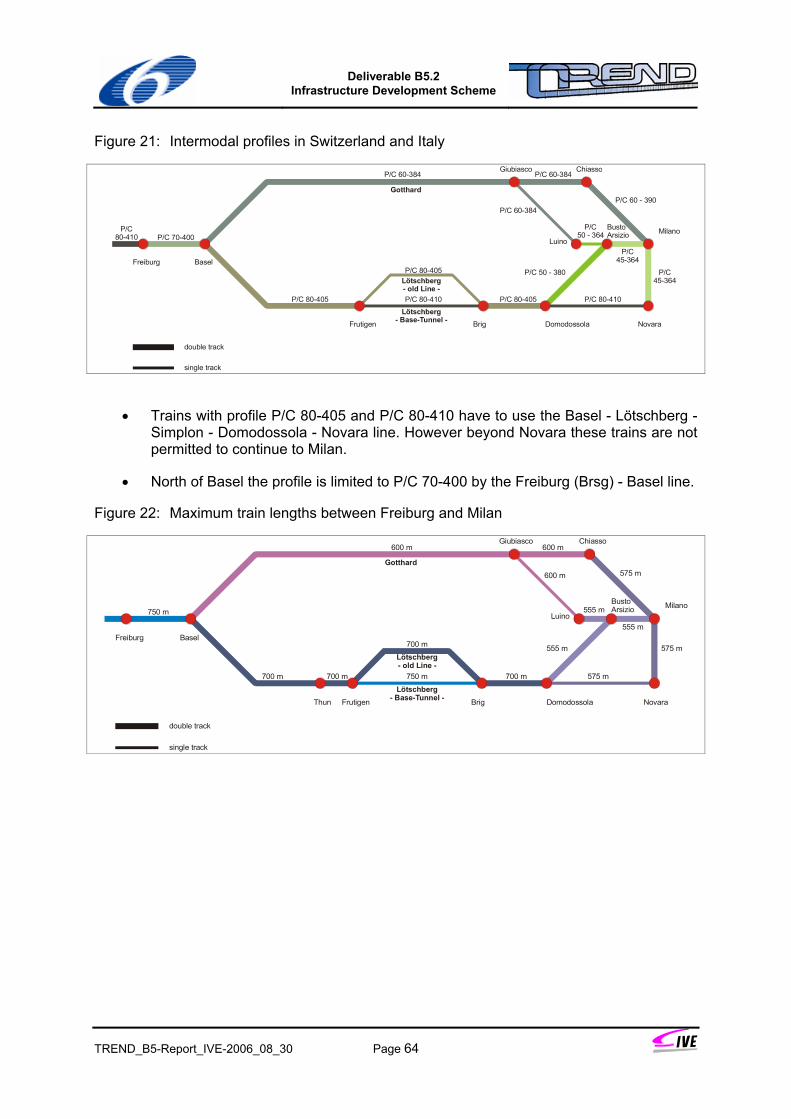
Deliverable B5.2
Infrastructure Development Scheme
TREND_B5-Report_IVE-2006_08_30 Page 64
Figure 21: Intermodal profiles in Switzerland and Italy
P/C 70-400P/C
80-410
P/C 60-384 P/C 60-384
P/C 60-384P/C 60 - 390
P/C 50 - 364
P/C 80-410P/C 80-410 P/C 80-405P/C 80-405
P/C 80-405
P/C 45-364
P/C 45-364
Freiburg Basel
Frutigen Brig Domodossola Novara
MilanoBustoArsizio
Luino
Giubiasco Chiasso
Gotthard
Lötschberg- old Line -
Lötschberg- Base-Tunnel -
P/C 50 - 380
double track
single track
• Trains with profile P/C 80-405 and P/C 80-410 have to use the Basel - Lötschberg - Simplon - Domodossola - Novara line. However beyond Novara these trains are not permitted to continue to Milan.
• North of Basel the profile is limited to P/C 70-400 by the Freiburg (Brsg) - Basel line.
Figure 22: Maximum train lengths between Freiburg and Milan
750 m
575 m
555 m
575 m750 m
700 m
555 m
575 mFreiburg Basel
Frutigen Brig Domodossola Novara
MilanoBustoArsizio
Luino
Giubiasco Chiasso
Gotthard
Lötschberg- old Line -
Lötschberg- Base-Tunnel -
555 m
double track
single track
Thun
700 m700 m 700 m
600 m 600 m
600 m
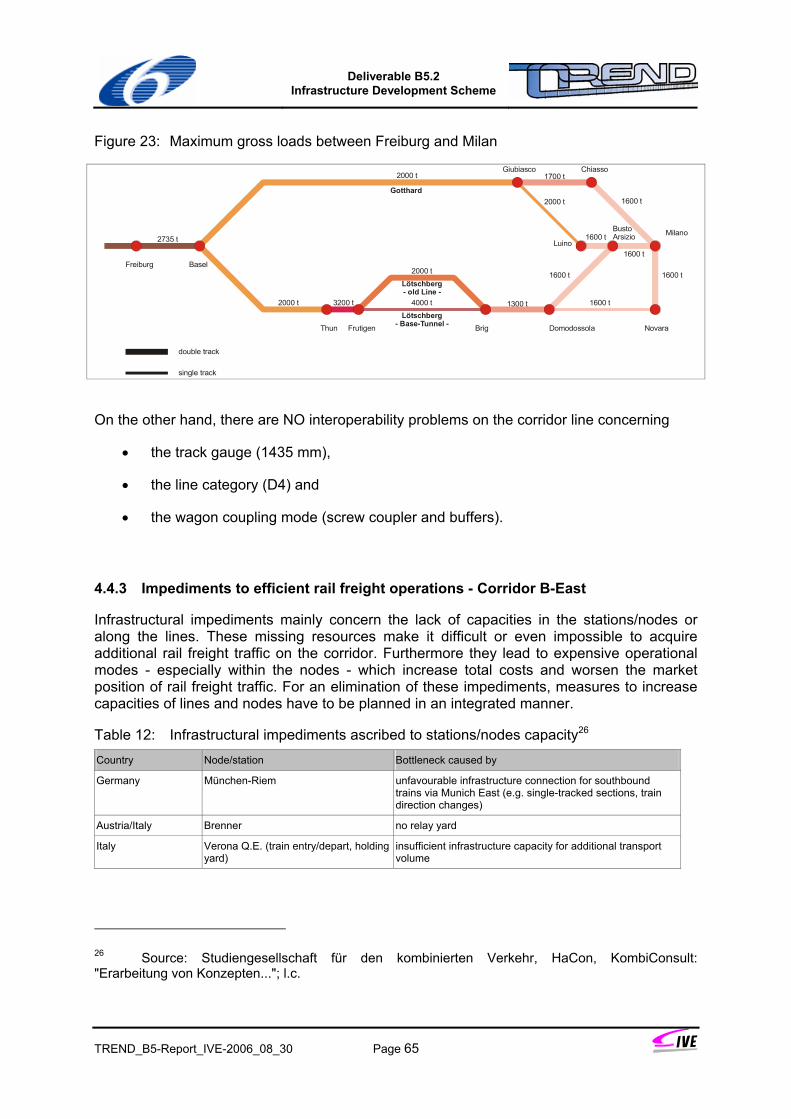
Deliverable B5.2
Infrastructure Development Scheme
TREND_B5-Report_IVE-2006_08_30 Page 65
Figure 23: Maximum gross loads between Freiburg and Milan
2735 t
1600 t
1600 t
1600 t4000 t3200 t2000 t
2000 t
1600 t
1600 tFreiburg Basel
FrutigenThun Brig Domodossola Novara
MilanoBustoArsizio
Luino
Giubiasco Chiasso
Gotthard
Lötschberg- old Line -
Lötschberg- Base-Tunnel -
1600 t
double track
single track
1700 t
2000 t
2000 t
1300 t
On the other hand, there are NO interoperability problems on the corridor line concerning
• the track gauge (1435 mm),
• the line category (D4) and
• the wagon coupling mode (screw coupler and buffers).
4.4.3 Impediments to efficient rail freight operations - Corridor B-East
Infrastructural impediments mainly concern the lack of capacities in the stations/nodes or along the lines. These missing resources make it difficult or even impossible to acquire additional rail freight traffic on the corridor. Furthermore they lead to expensive operational modes - especially within the nodes - which increase total costs and worsen the market position of rail freight traffic. For an elimination of these impediments, measures to increase capacities of lines and nodes have to be planned in an integrated manner.
Table 12: Infrastructural impediments ascribed to stations/nodes capacity26 Country Node/station Bottleneck caused by
Germany München-Riem unfavourable infrastructure connection for southbound trains via Munich East (e.g. single-tracked sections, train direction changes)
Austria/Italy Brenner no relay yard
Italy Verona Q.E. (train entry/depart, holding yard)
insufficient infrastructure capacity for additional transport volume
26 Source: Studiengesellschaft für den kombinierten Verkehr, HaCon, KombiConsult: "Erarbeitung von Konzepten..."; l.c.
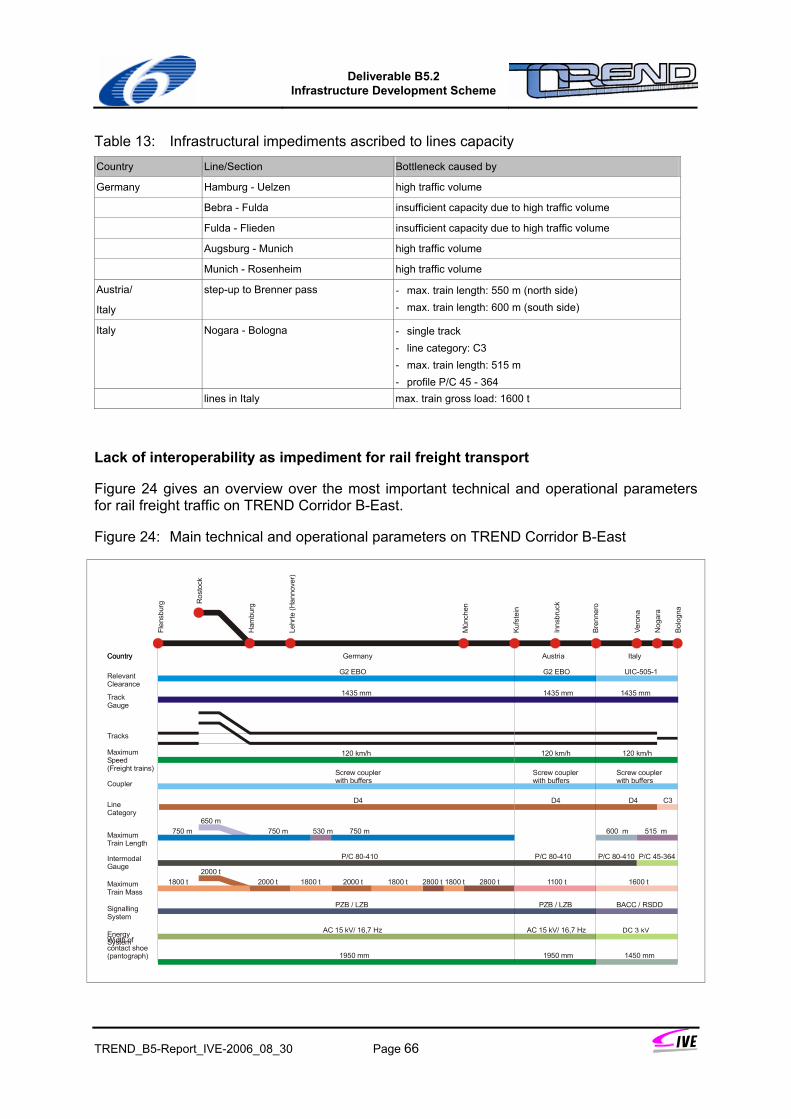
Deliverable B5.2
Infrastructure Development Scheme
TREND_B5-Report_IVE-2006_08_30 Page 66
Table 13: Infrastructural impediments ascribed to lines capacity Country Line/Section Bottleneck caused by
Germany Hamburg - Uelzen high traffic volume
Bebra - Fulda insufficient capacity due to high traffic volume
Fulda - Flieden insufficient capacity due to high traffic volume
Augsburg - Munich high traffic volume
Munich - Rosenheim high traffic volume
Austria/
Italy
step-up to Brenner pass - max. train length: 550 m (north side) - max. train length: 600 m (south side)
Italy Nogara - Bologna - single track - line category: C3 - max. train length: 515 m - profile P/C 45 - 364
lines in Italy max. train gross load: 1600 t
Lack of interoperability as impediment for rail freight transport
Figure 24 gives an overview over the most important technical and operational parameters for rail freight traffic on TREND Corridor B-East.
Figure 24: Main technical and operational parameters on TREND Corridor B-East
Width ofcontact shoe(pantograph) 1950 mm 1950 mm 1450 mm
EnergySystem
AC 15 kV/ 16,7 Hz AC 15 kV/ 16,7 Hz
SignallingSystem
PZB / LZB PZB / LZB BACC / RSDD
RelevantClearance
G2 EBO G2 EBO UIC-505-1
1435 mm1435 mm1435 mmTrackGauge
Country GermanyCountry Austria Italy
Flen
sbur
g
Ham
burg
Mün
chen
Kufs
tein
Inns
bruc
k
Bren
nero
Bolo
gna
Vero
na
Nog
ara
Ros
tock
Lehr
te (H
anno
ver)
Tracks
MaximumSpeed(Freight trains)
120 km/h120 km/h120 km/h
CouplerScrew couplerwith buffers
Screw couplerwith buffers
Screw couplerwith buffers
D4D4LineCategory
C3D4
Maximum Train Length
750 m530 m750 m750 m650 m
600 m 515 m
Intermodal Gauge
P/C 80-410 P/C 45-364P/C 80-410P/C 80-410
MaximumTrain Mass
1800 t2000 t1800 t2000 t
1600 t1100 t2800 t1800 t2800 t1800 t2000 t
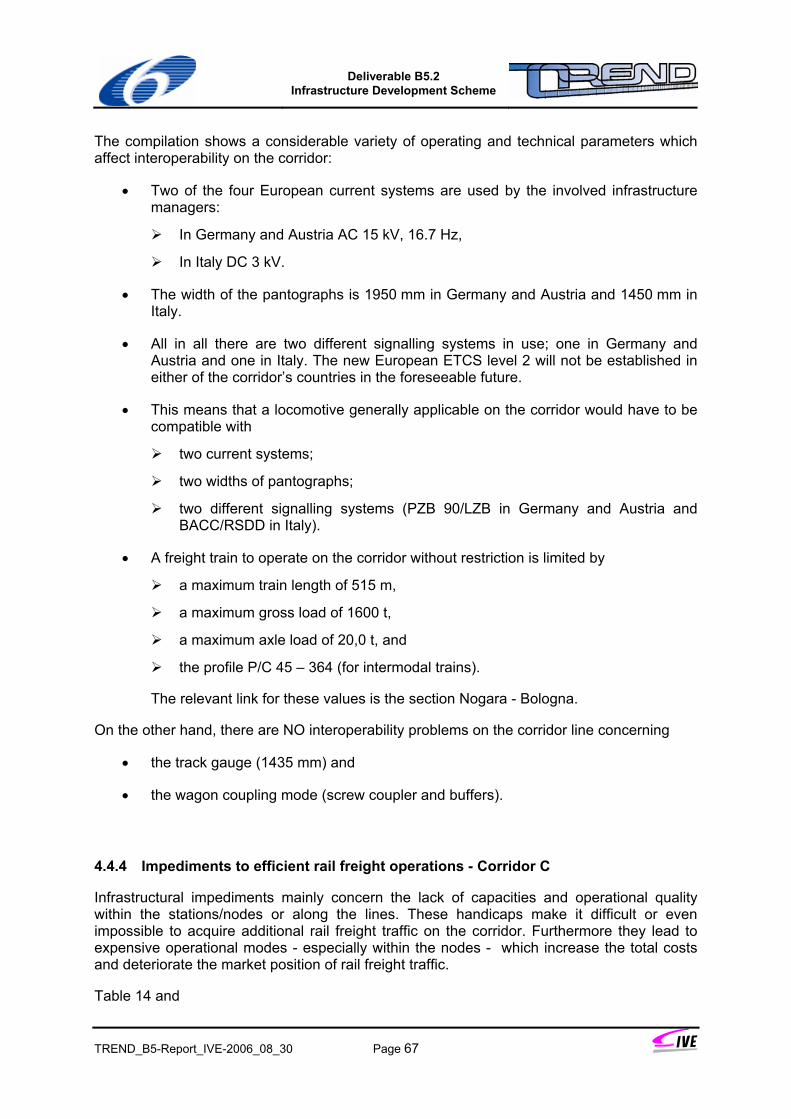
Deliverable B5.2
Infrastructure Development Scheme
TREND_B5-Report_IVE-2006_08_30 Page 67
The compilation shows a considerable variety of operating and technical parameters which affect interoperability on the corridor:
• Two of the four European current systems are used by the involved infrastructure managers:
In Germany and Austria AC 15 kV, 16.7 Hz,
In Italy DC 3 kV.
• The width of the pantographs is 1950 mm in Germany and Austria and 1450 mm in Italy.
• All in all there are two different signalling systems in use; one in Germany and Austria and one in Italy. The new European ETCS level 2 will not be established in either of the corridor’s countries in the foreseeable future.
• This means that a locomotive generally applicable on the corridor would have to be compatible with
two current systems;
two widths of pantographs;
two different signalling systems (PZB 90/LZB in Germany and Austria and BACC/RSDD in Italy).
• A freight train to operate on the corridor without restriction is limited by
a maximum train length of 515 m,
a maximum gross load of 1600 t,
a maximum axle load of 20,0 t, and
the profile P/C 45 – 364 (for intermodal trains).
The relevant link for these values is the section Nogara - Bologna.
On the other hand, there are NO interoperability problems on the corridor line concerning
• the track gauge (1435 mm) and
• the wagon coupling mode (screw coupler and buffers).
4.4.4 Impediments to efficient rail freight operations - Corridor C
Infrastructural impediments mainly concern the lack of capacities and operational quality within the stations/nodes or along the lines. These handicaps make it difficult or even impossible to acquire additional rail freight traffic on the corridor. Furthermore they lead to expensive operational modes - especially within the nodes - which increase the total costs and deteriorate the market position of rail freight traffic.
Table 14 and
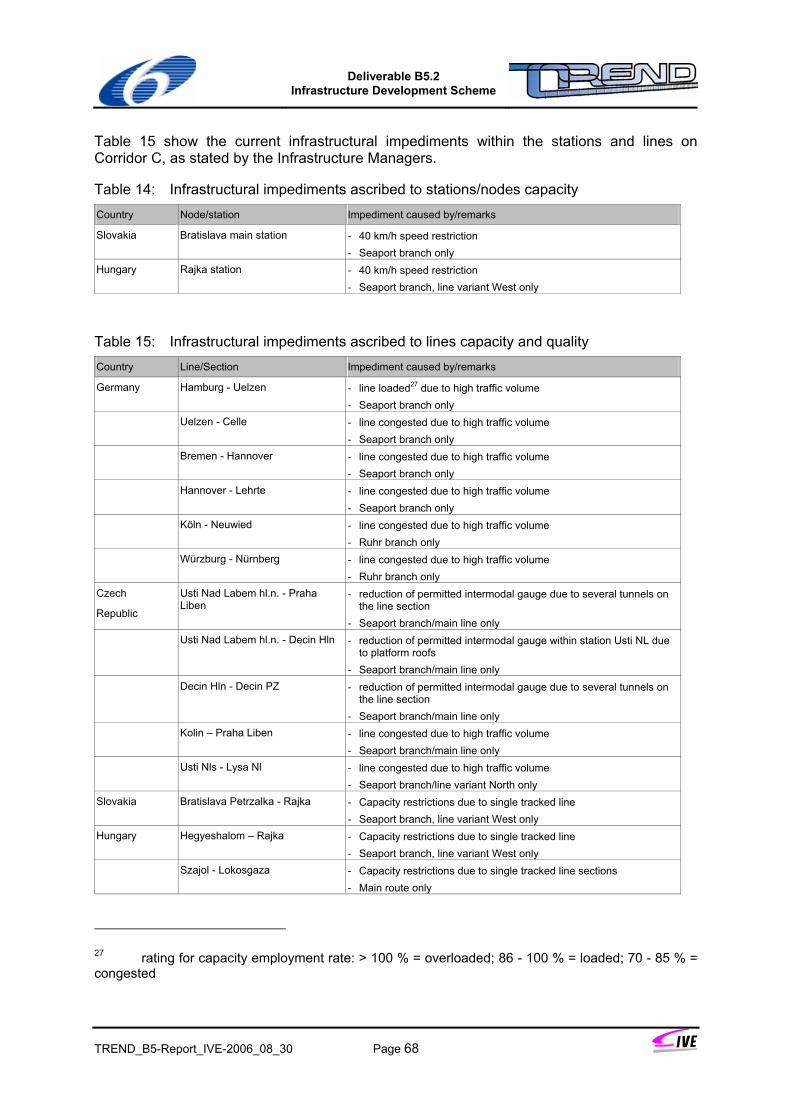
Deliverable B5.2
Infrastructure Development Scheme
TREND_B5-Report_IVE-2006_08_30 Page 68
Table 15 show the current infrastructural impediments within the stations and lines on Corridor C, as stated by the Infrastructure Managers.
Table 14: Infrastructural impediments ascribed to stations/nodes capacity Country Node/station Impediment caused by/remarks
Slovakia Bratislava main station - 40 km/h speed restriction - Seaport branch only
Hungary Rajka station - 40 km/h speed restriction - Seaport branch, line variant West only
Table 15: Infrastructural impediments ascribed to lines capacity and quality Country Line/Section Impediment caused by/remarks
Germany Hamburg - Uelzen - line loaded27 due to high traffic volume - Seaport branch only
Uelzen - Celle - line congested due to high traffic volume - Seaport branch only
Bremen - Hannover - line congested due to high traffic volume - Seaport branch only
Hannover - Lehrte - line congested due to high traffic volume - Seaport branch only
Köln - Neuwied - line congested due to high traffic volume - Ruhr branch only
Würzburg - Nürnberg - line congested due to high traffic volume - Ruhr branch only
Czech
Republic
Usti Nad Labem hl.n. - Praha Liben
- reduction of permitted intermodal gauge due to several tunnels on the line section
- Seaport branch/main line only Usti Nad Labem hl.n. - Decin Hln - reduction of permitted intermodal gauge within station Usti NL due
to platform roofs - Seaport branch/main line only
Decin Hln - Decin PZ - reduction of permitted intermodal gauge due to several tunnels on the line section
- Seaport branch/main line only Kolin – Praha Liben - line congested due to high traffic volume
- Seaport branch/main line only Usti Nls - Lysa Nl - line congested due to high traffic volume
- Seaport branch/line variant North only Slovakia Bratislava Petrzalka - Rajka - Capacity restrictions due to single tracked line
- Seaport branch, line variant West only Hungary Hegyeshalom – Rajka - Capacity restrictions due to single tracked line
- Seaport branch, line variant West only Szajol - Lokosgaza - Capacity restrictions due to single tracked line sections
- Main route only
27 rating for capacity employment rate: > 100 % = overloaded; 86 - 100 % = loaded; 70 - 85 % = congested
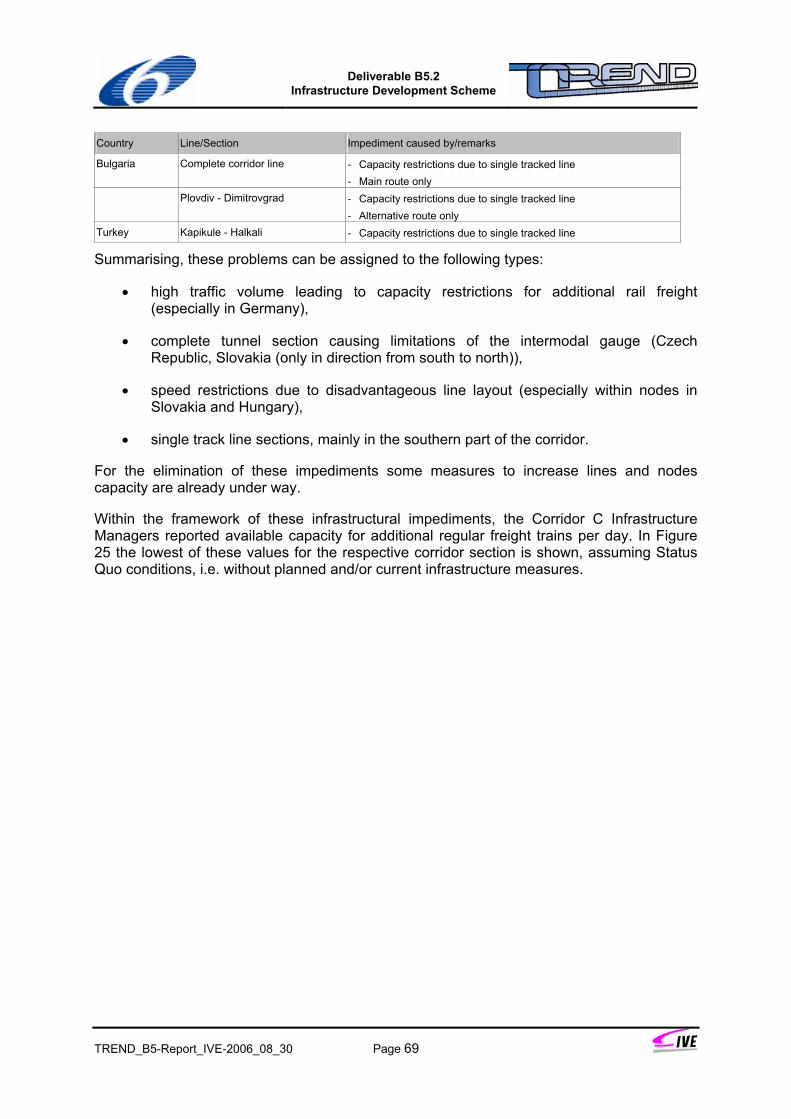
Deliverable B5.2
Infrastructure Development Scheme
TREND_B5-Report_IVE-2006_08_30 Page 69
Country Line/Section Impediment caused by/remarks
Bulgaria Complete corridor line - Capacity restrictions due to single tracked line - Main route only
Plovdiv - Dimitrovgrad - Capacity restrictions due to single tracked line - Alternative route only
Turkey Kapikule - Halkali - Capacity restrictions due to single tracked line
Summarising, these problems can be assigned to the following types:
• high traffic volume leading to capacity restrictions for additional rail freight (especially in Germany),
• complete tunnel section causing limitations of the intermodal gauge (Czech Republic, Slovakia (only in direction from south to north)),
• speed restrictions due to disadvantageous line layout (especially within nodes in Slovakia and Hungary),
• single track line sections, mainly in the southern part of the corridor.
For the elimination of these impediments some measures to increase lines and nodes capacity are already under way.
Within the framework of these infrastructural impediments, the Corridor C Infrastructure Managers reported available capacity for additional regular freight trains per day. In Figure 25 the lowest of these values for the respective corridor section is shown, assuming Status Quo conditions, i.e. without planned and/or current infrastructure measures.
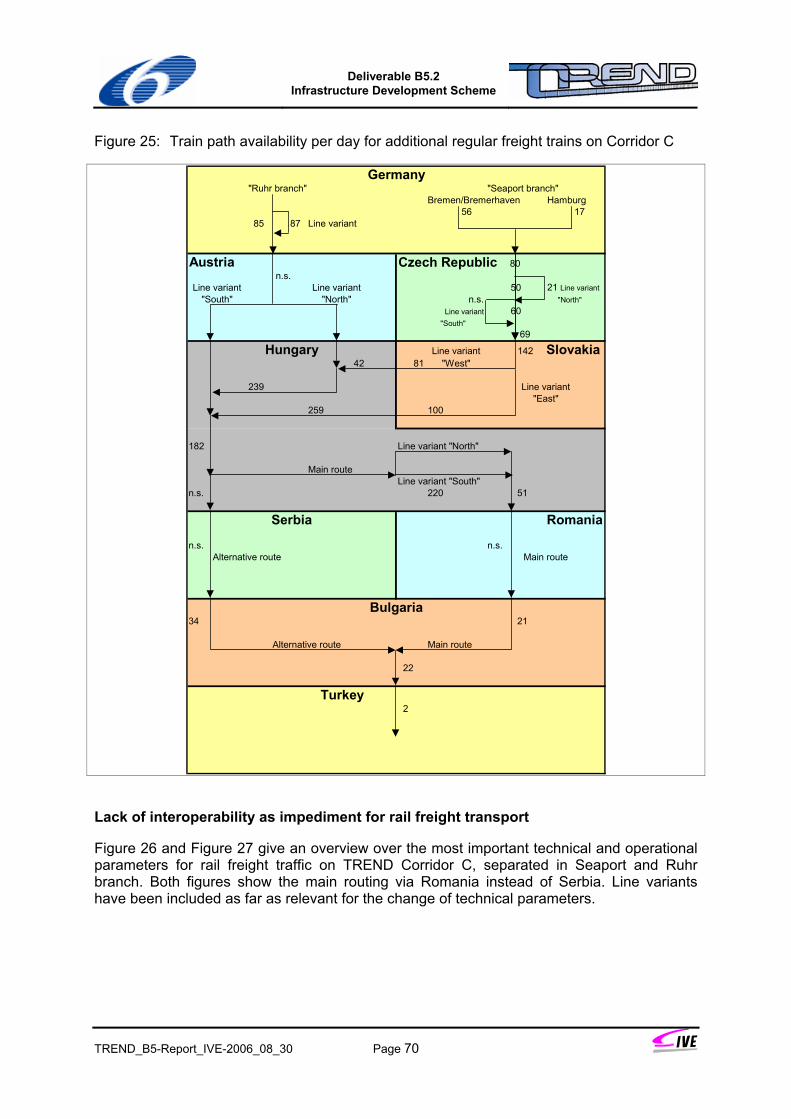
Deliverable B5.2
Infrastructure Development Scheme
TREND_B5-Report_IVE-2006_08_30 Page 70
Figure 25: Train path availability per day for additional regular freight trains on Corridor C
"Ruhr branch" "Seaport branch"Bremen/Bremerhaven Hamburg
56 17 85 87 Line variant
n.s.Line variant Line variant 50 21 Line variant
"South" "North" n.s. "North"Line variant 60
"South" 69
Line variant42 81 "West"
239
259 100
182
Main route
220 51
n.s. n.s.
34 21
22
Turkey 2
n.s.
Romania
Alternative route Main route
Bulgaria
Alternative route Main route
Serbia
Line variant "North"
Line variant "South"
Germany
Austria Czech Republic 80
142 SlovakiaHungary
Line variant"East"
Lack of interoperability as impediment for rail freight transport
Figure 26 and Figure 27 give an overview over the most important technical and operational parameters for rail freight traffic on TREND Corridor C, separated in Seaport and Ruhr branch. Both figures show the main routing via Romania instead of Serbia. Line variants have been included as far as relevant for the change of technical parameters.
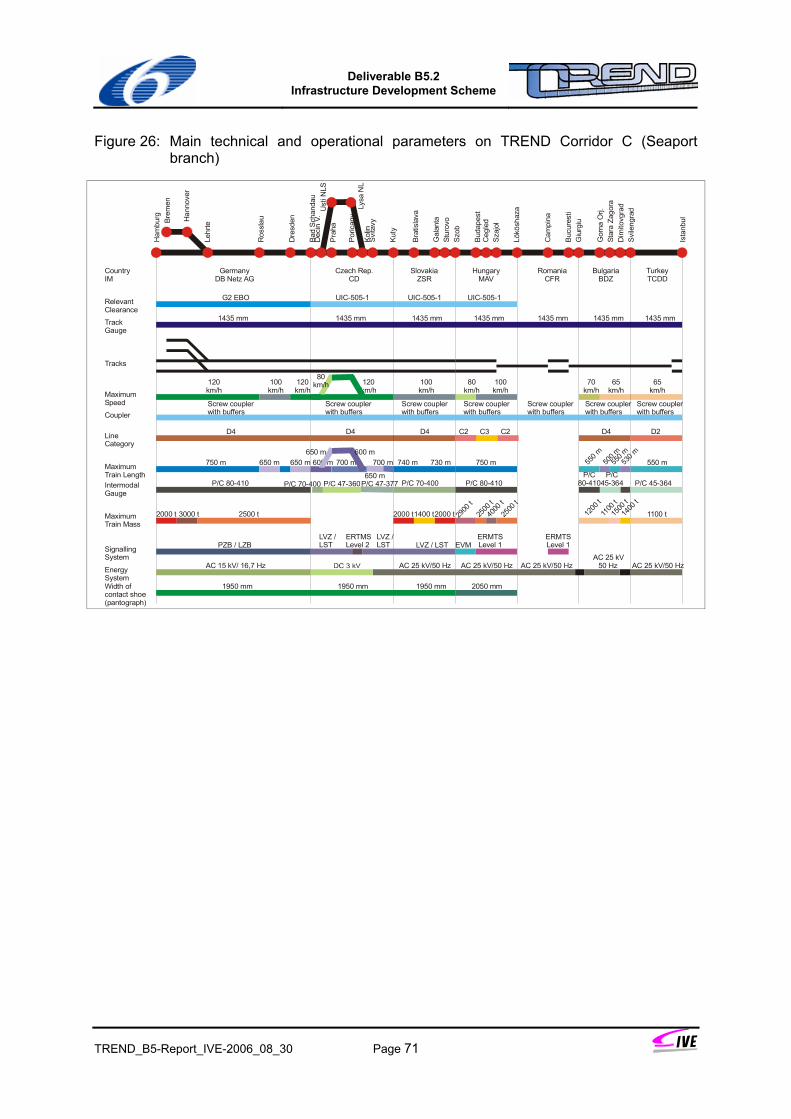
Deliverable B5.2
Infrastructure Development Scheme
TREND_B5-Report_IVE-2006_08_30 Page 71
Figure 26: Main technical and operational parameters on TREND Corridor C (Seaport branch)
Tracks
120km/h
120km/h
120km/h
100km/h
100km/h
100 km/h
70km/h
65km/h
65km/h
80km/h
80km/h
MaximumSpeed
D4 D4D4 D4 C2LineCategory
TrackGauge
1435 mm 1435 mm 1435 mm 1435 mm 1435 mm1435 mm 1435 mm
CountryIM
Ham
burg
Lehr
te
Dre
sden
Ros
slau
Bad
Scha
ndau
Dec
in V
.
Prah
a
Kuty
Svita
vy
Szob
Buda
pest
Stur
ovo
Gal
anta
Brat
isla
va
Lökö
shaz
a
Szaj
ol
Giu
rgiu
Bucu
rest
i
Cam
pina
Ista
nbul
Svile
ngra
d
GermanyDB Netz AG
Czech Rep.CD
SlovakiaZSR
HungaryMAV
RomaniaCFR
TurkeyTCDD
BulgariaBDZ
Bre
men
Han
nove
r
Dim
itovg
rad
D2
G2 EBO UIC-505-1 UIC-505-1UIC-505-1RelevantClearance
CouplerScrew couplerwith buffers
Screw couplerwith buffers
Screw couplerwith buffers
Screw couplerwith buffers
Screw couplerwith buffers
Screw couplerwith buffers
Screw couplerwith buffers
MaximumTrain Length
750 m 750 m
650 m
700 m650 m650 m 600 m 740 m 730 m 550 m
MaximumTrain Mass
2500 t2000 t 3000 t 2500
t
2500
t2000 t 2000 t 29
00 t
1100 t4000
t
PZB / LZB EVMSignallingSystem
ERMTSLevel 1
AC 25 kV/50 Hz AC 25 kV/50 Hz AC 25 kV/50 Hz AC 25 kV
50 Hz AC 25 kV/50 HzAC 15 kV/ 16,7 HzEnergySystem
1950 mm 1950 mm 2050 mm1950 mmWidth ofcontact shoe(pantograph)
Intermodal Gauge
P/C 47-360P/C 80-410 P/C 80-410P/C
80-410P/C
45-364 P/C 45-364P/C 70-400
ERMTSLevel 1LVZ / LST
LVZ / LST
LVZ / LST
ERTMSLevel 2
Kolin
Poric
any
1400 t
Ceg
led
Gor
na O
rj.St
ara
Zago
ra
1400
t
1500
t
1200
t
1100
t
530 m
550 m
500 m
550 m
Ust
i NLS
Lysa
NL
700 m650 m 600 m
P/C 70-400 P/C 47-377
C2C3
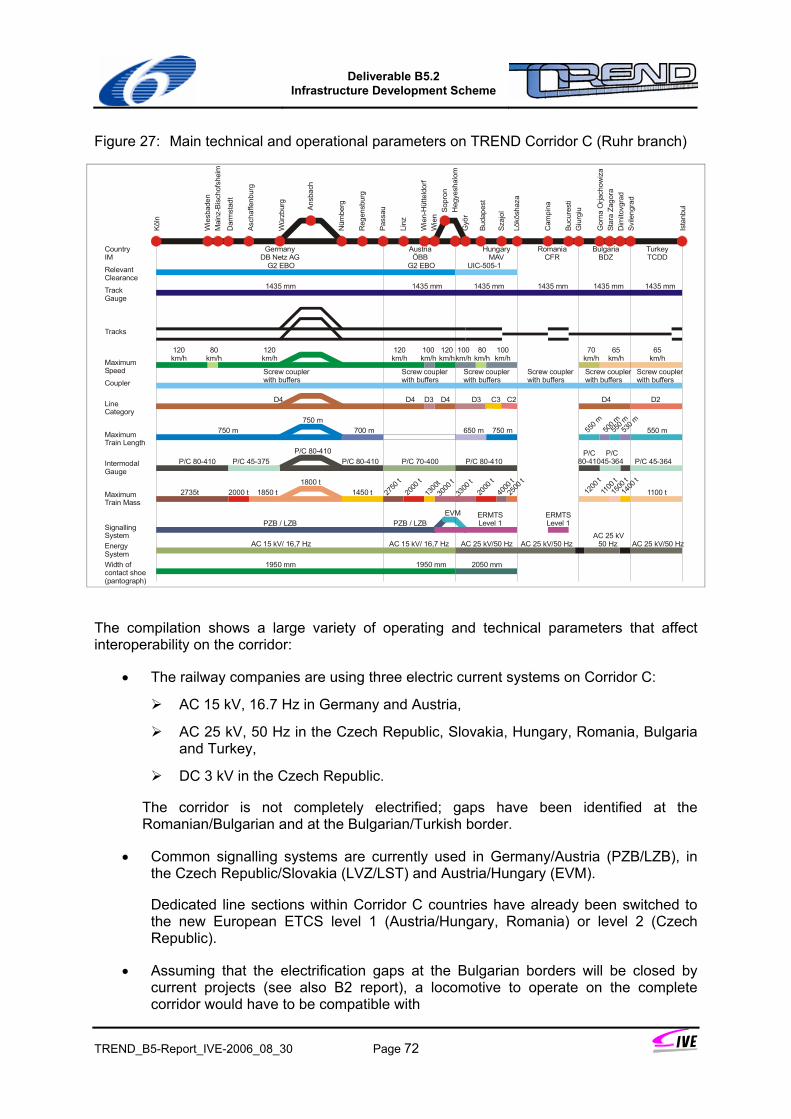
Deliverable B5.2
Infrastructure Development Scheme
TREND_B5-Report_IVE-2006_08_30 Page 72
Figure 27: Main technical and operational parameters on TREND Corridor C (Ruhr branch)
Tracks
120km/h
120km/h
100km/h
120km/h
120km/h
100 km/h
100 km/h
70km/h
65km/h
65km/h
80km/h
80km/hMaximum
Speed
D4 D4D4 D4 C2LineCategory
D3D3
TrackGauge
1435 mm 1435 mm 1435 mm 1435 mm 1435 mm1435 mm
Heg
yesh
alom
Sopr
on
Gyö
r
EVM
CountryIM
Köln
Wie
sbad
en
Wür
zbur
g
Asch
affe
nbur
g
Dar
mst
adt
Ansb
ach
Nür
nber
g
Reg
ensb
urg
Linz
Pass
au
Buda
pest
Wie
nW
ien-
Hüt
teld
orf
Lökö
shaz
a
Szaj
ol
Giu
rgiu
Bucu
rest
i
Cam
pina
Ista
nbul
Svile
ngra
d
GermanyDB Netz AG
AustriaÖBB
HungaryMAV
RomaniaCFR
TurkeyTCDD
BulgariaBDZ
Dim
itovg
rad
D2
Mai
nz-B
isch
ofsh
eim
G2 EBO G2 EBO UIC-505-1RelevantClearance
CouplerScrew couplerwith buffers
Screw couplerwith buffers
Screw couplerwith buffers
Screw couplerwith buffers
Screw couplerwith buffers
Screw couplerwith buffers
MaximumTrain Length
750 m750 m
750 m700 m 650 m 550 m
Intermodal Gauge
P/C 80-410 P/C 80-410P/C 80-410
P/C 80-410P/C
80-410P/C
45-364 P/C 45-364P/C 45-375 P/C 70-400
MaximumTrain Mass
2000 t 2500
t
3300
t
3000
t
1300
t20
00 t
2000
t
2750
t1100 t40
00 t
2735t 1850 t1800 t
1450 t
PZB / LZB PZB / LZBSignallingSystem
ERMTSLevel 1
ERMTSLevel 1
AC 25 kV/50 Hz AC 25 kV/50 Hz AC 25 kV
50 Hz AC 25 kV/50 HzAC 15 kV/ 16,7 Hz AC 15 kV/ 16,7 HzEnergySystem
1950 mm 2050 mm1950 mmWidth ofcontact shoe(pantograph)
1400
t
Gor
na O
rjach
owiz
aSt
ara
Zago
ra
1500
t
1200
t
1100
t
530 m
550 m
500 m
550 m
C3
The compilation shows a large variety of operating and technical parameters that affect interoperability on the corridor:
• The railway companies are using three electric current systems on Corridor C:
AC 15 kV, 16.7 Hz in Germany and Austria,
AC 25 kV, 50 Hz in the Czech Republic, Slovakia, Hungary, Romania, Bulgaria and Turkey,
DC 3 kV in the Czech Republic.
The corridor is not completely electrified; gaps have been identified at the Romanian/Bulgarian and at the Bulgarian/Turkish border.
• Common signalling systems are currently used in Germany/Austria (PZB/LZB), in the Czech Republic/Slovakia (LVZ/LST) and Austria/Hungary (EVM).
Dedicated line sections within Corridor C countries have already been switched to the new European ETCS level 1 (Austria/Hungary, Romania) or level 2 (Czech Republic).
• Assuming that the electrification gaps at the Bulgarian borders will be closed by current projects (see also B2 report), a locomotive to operate on the complete corridor would have to be compatible with
Deliverable B5.2
Infrastructure Development Scheme
TREND_B5-Report_IVE-2006_08_30 Page 73
two current systems on the Ruhr branch and with three systems on the Seaport branch;
at least five different signalling systems on the Seaport branch and at least three systems in case of taking the Ruhr branch. Since some of the involved railway provided no adequate data, the actual number of required signalling systems is likely to be even higher.
two pantograph widths.
• The maximum train capacity is limited by the southern part of the corridor:
Line category C2 (i.e. maximum wagon axle load = 21 t28, maximum wagon length load = 6,4 t/m) in Hungary,
maximum train length = 500 m in Bulgaria,
maximum train mass (single traction mode) = 1100 t (Bulgaria and Turkey), neglecting one rather short line section in Slovakia to be operated only by 900 t trains in single traction mode in direction from south to north; nevertheless regular operation is done with an additional pushing engine on this sector.
intermodal gauge = P/C 45-364 (Bulgaria, Turkey).
No interoperability problems on the corridor line concern
• the track gauge (1435 mm),
• wagon coupling mode (screw coupler and buffers).
4.4.5 Impediments to efficient rail freight operations - Corridor D
Infrastructural impediments mainly concern the lack of capacities in the stations/nodes or along the lines. These missing resources make it difficult or even impossible to acquire additional rail freight traffic on the corridor. Furthermore they lead to expensive operational modes - especially within the nodes - which increase total costs and worsen the market position of rail freight traffic. For an elimination of these impediments, measures to increase capacities of lines and nodes have to be planned in an integrated manner.
28 In Hungary line category C2 means permitted axle load = 21 t, differing from the UIC class (20 t)
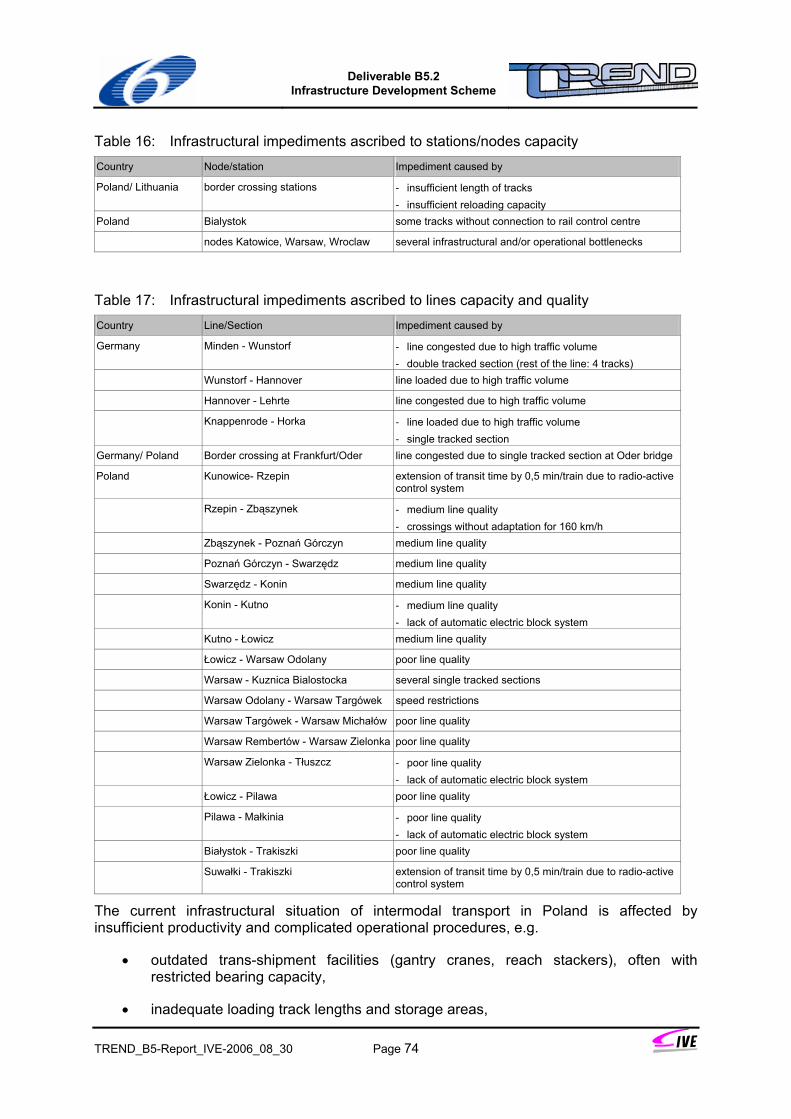
Deliverable B5.2
Infrastructure Development Scheme
TREND_B5-Report_IVE-2006_08_30 Page 74
Table 16: Infrastructural impediments ascribed to stations/nodes capacity Country Node/station Impediment caused by
Poland/ Lithuania border crossing stations - insufficient length of tracks - insufficient reloading capacity
Poland Bialystok some tracks without connection to rail control centre
nodes Katowice, Warsaw, Wroclaw several infrastructural and/or operational bottlenecks
Table 17: Infrastructural impediments ascribed to lines capacity and quality Country Line/Section Impediment caused by
Germany Minden - Wunstorf - line congested due to high traffic volume - double tracked section (rest of the line: 4 tracks)
Wunstorf - Hannover line loaded due to high traffic volume
Hannover - Lehrte line congested due to high traffic volume
Knappenrode - Horka - line loaded due to high traffic volume - single tracked section
Germany/ Poland Border crossing at Frankfurt/Oder line congested due to single tracked section at Oder bridge
Poland Kunowice- Rzepin extension of transit time by 0,5 min/train due to radio-active control system
Rzepin - Zbąszynek - medium line quality - crossings without adaptation for 160 km/h
Zbąszynek - Poznań Górczyn medium line quality
Poznań Górczyn - Swarzędz medium line quality
Swarzędz - Konin medium line quality
Konin - Kutno - medium line quality - lack of automatic electric block system
Kutno - Łowicz medium line quality
Łowicz - Warsaw Odolany poor line quality
Warsaw - Kuznica Bialostocka several single tracked sections
Warsaw Odolany - Warsaw Targówek speed restrictions
Warsaw Targówek - Warsaw Michałów poor line quality
Warsaw Rembertów - Warsaw Zielonka poor line quality
Warsaw Zielonka - Tłuszcz - poor line quality - lack of automatic electric block system
Łowicz - Pilawa poor line quality
Pilawa - Małkinia - poor line quality - lack of automatic electric block system
Białystok - Trakiszki poor line quality
Suwałki - Trakiszki extension of transit time by 0,5 min/train due to radio-active control system
The current infrastructural situation of intermodal transport in Poland is affected by insufficient productivity and complicated operational procedures, e.g.
• outdated trans-shipment facilities (gantry cranes, reach stackers), often with restricted bearing capacity,
• inadequate loading track lengths and storage areas,
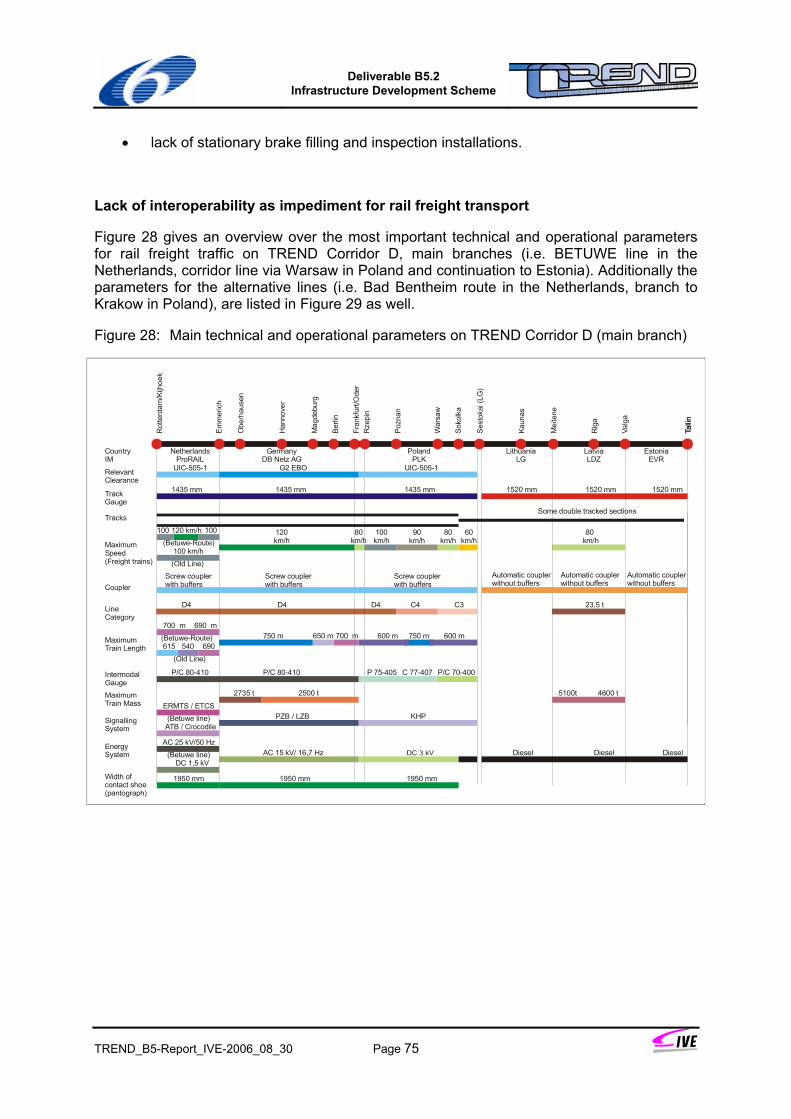
Deliverable B5.2
Infrastructure Development Scheme
TREND_B5-Report_IVE-2006_08_30 Page 75
• lack of stationary brake filling and inspection installations.
Lack of interoperability as impediment for rail freight transport
Figure 28 gives an overview over the most important technical and operational parameters for rail freight traffic on TREND Corridor D, main branches (i.e. BETUWE line in the Netherlands, corridor line via Warsaw in Poland and continuation to Estonia). Additionally the parameters for the alternative lines (i.e. Bad Bentheim route in the Netherlands, branch to Krakow in Poland), are listed in Figure 29 as well.
Figure 28: Main technical and operational parameters on TREND Corridor D (main branch)
Tracks
120km/h
80km/h
80km/h
60km/h
80 km/hMaximum
Speed(Freight trains)
D4 D4 23,5 tD4LineCategory
Rot
terd
am/K
ijhoe
k
Em
mer
ich
Han
nove
r
Ber
lin
Fran
kfur
t/Ode
rR
zepi
n
War
saw
Talli
n
Kaun
as
NetherlandsProRAIL
GermanyDB Netz AG
LatviaLDZ
LithuaniaLG
PolandPLK
CountryIM
Obe
rhau
sen
Sok
olka
Mei
tene
Valg
a
Talli
n
Rig
a
EstoniaEVR
Pozn
an
Mag
debu
rg
Ses
toka
i (LG
)
C3C4
100km/h
90km/h(Betuwe-Route)
(Old Line)
100120 km/h100
100 km/h
UIC-505-1G2 EBORelevantClearance
UIC-505-1
1435 mm 1520 mm 1520 mm1520 mm1435 mm 1435 mmTrackGauge
Some double tracked sections
CouplerScrew couplerwith buffers
Screw couplerwith buffers
Screw couplerwith buffers
Automatic couplerwithout buffers
Automatic couplerwithout buffers
Automatic couplerwithout buffers
MaximumTrain Length
750 m 650 m 700 m 600 m 750 m 600 m540
(Old Line)
700 m 690 m
(Betuwe-Route)615 690
Intermodal Gauge
P/C 80-410 P 75-405 C 77-407 P/C 70-400P/C 80-410
MaximumTrain Mass
2500 t2735 t 5100t 4600 t
KHPPZB / LZBSignallingSystem
(Betuwe line)ATB / Crocodile
ERMTS / ETCS
Diesel DieselDieselAC 15 kV/ 16,7 HzEnergySystem
AC 25 kV/50 Hz
(Betuwe line)DC 1,5 kV
1950 mm1950 mmWidth ofcontact shoe(pantograph)
1950 mm
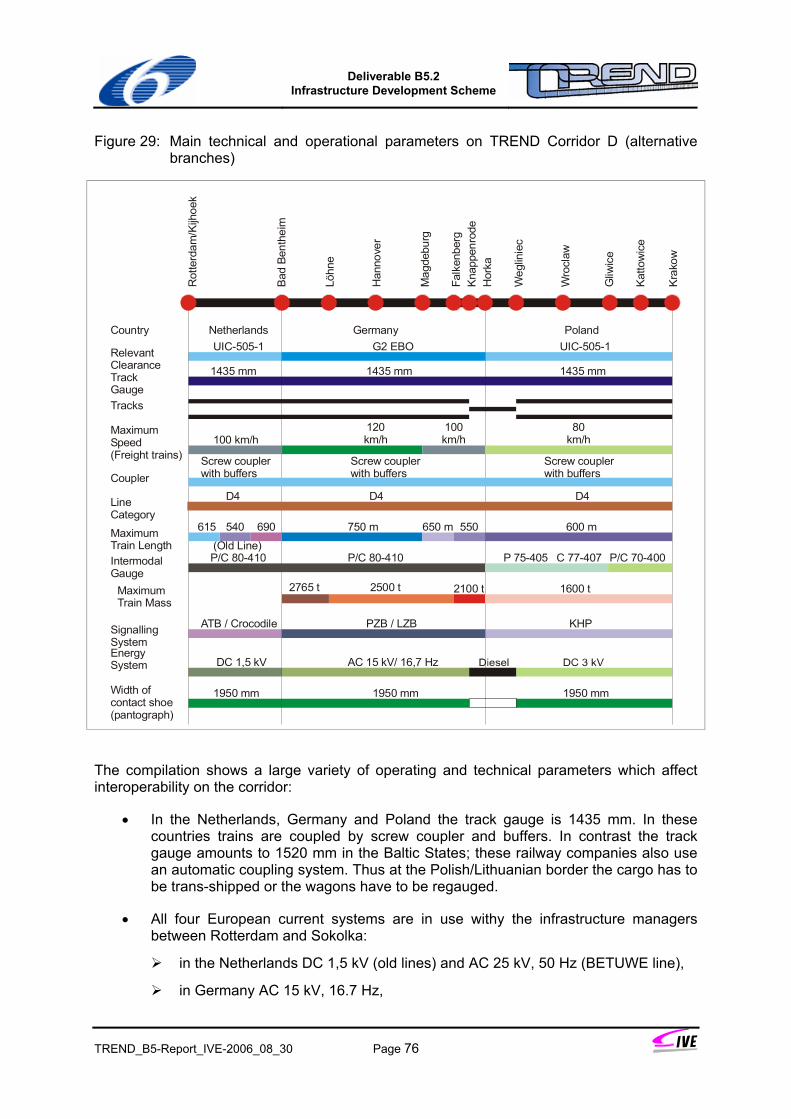
Deliverable B5.2
Infrastructure Development Scheme
TREND_B5-Report_IVE-2006_08_30 Page 76
Figure 29: Main technical and operational parameters on TREND Corridor D (alternative branches)
The compilation shows a large variety of operating and technical parameters which affect interoperability on the corridor:
• In the Netherlands, Germany and Poland the track gauge is 1435 mm. In these countries trains are coupled by screw coupler and buffers. In contrast the track gauge amounts to 1520 mm in the Baltic States; these railway companies also use an automatic coupling system. Thus at the Polish/Lithuanian border the cargo has to be trans-shipped or the wagons have to be regauged.
• All four European current systems are in use withy the infrastructure managers between Rotterdam and Sokolka:
in the Netherlands DC 1,5 kV (old lines) and AC 25 kV, 50 Hz (BETUWE line),
in Germany AC 15 kV, 16.7 Hz,
1950 mm1950 mmWidth ofcontact shoe(pantograph)
1950 mm
AC 15 kV/ 16,7 HzEnergySystem DC 1,5 kV
KHPPZB / LZBSignallingSystem
ATB / Crocodile
UIC-505-1G2 EBORelevantClearance
UIC-505-1
1435 mm1435 mm 1435 mmTrackGauge
Netherlands PolandCountry Germany
Rot
terd
am/K
ijhoe
k
Bad
Ben
thei
m
Han
nove
r
Falk
enbe
rgK
napp
enro
deH
orka
Weg
linie
c
Gliw
ice
Löhn
e
Kat
tow
ice
Wro
claw
Mag
debu
rg
Kra
kow
Tracks
120km/h
MaximumSpeed(Freight trains)
100km/h
80km/h100 km/h
CouplerScrew couplerwith buffers
Screw couplerwith buffers
Screw couplerwith buffers
D4 D4D4LineCategory
MaximumTrain Length
750 m 650 m 600 m540 550
(Old Line)
615 690
Intermodal Gauge
P/C 80-410 P 75-405 C 77-407 P/C 70-400P/C 80-410
MaximumTrain Mass
2500 t2765 t 1600 t2100 t
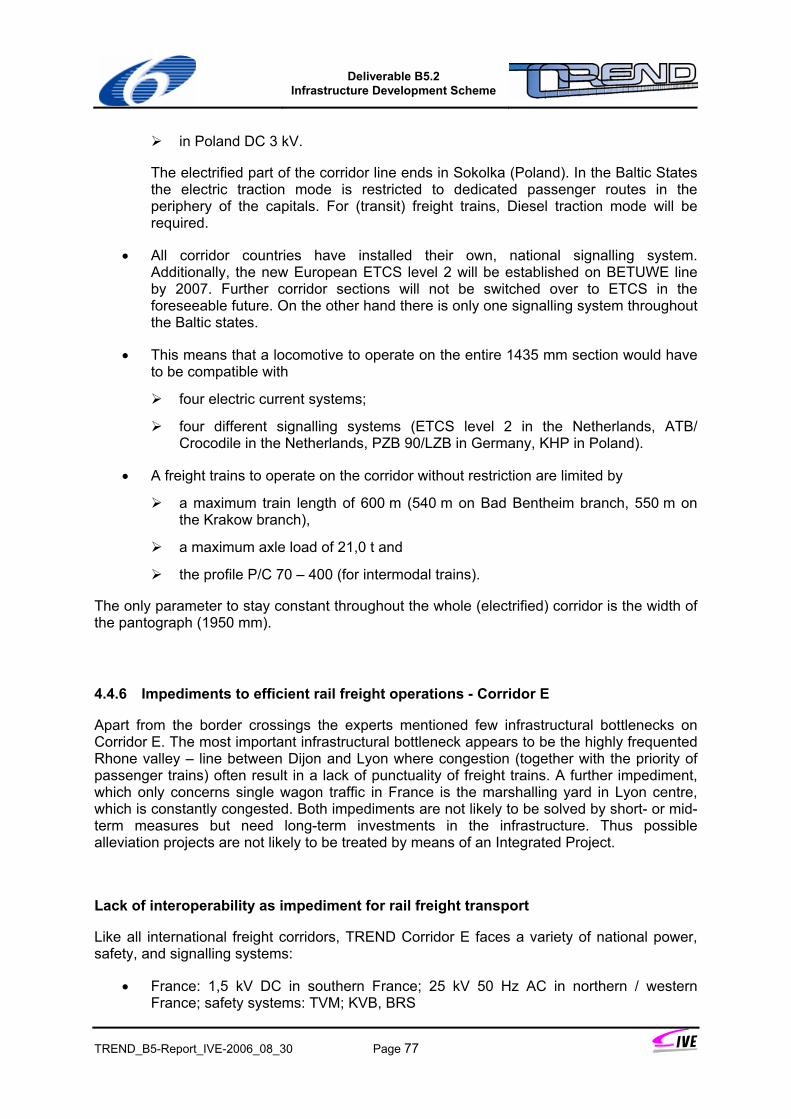
Deliverable B5.2
Infrastructure Development Scheme
TREND_B5-Report_IVE-2006_08_30 Page 77
in Poland DC 3 kV.
The electrified part of the corridor line ends in Sokolka (Poland). In the Baltic States the electric traction mode is restricted to dedicated passenger routes in the periphery of the capitals. For (transit) freight trains, Diesel traction mode will be required.
• All corridor countries have installed their own, national signalling system. Additionally, the new European ETCS level 2 will be established on BETUWE line by 2007. Further corridor sections will not be switched over to ETCS in the foreseeable future. On the other hand there is only one signalling system throughout the Baltic states.
• This means that a locomotive to operate on the entire 1435 mm section would have to be compatible with
four electric current systems;
four different signalling systems (ETCS level 2 in the Netherlands, ATB/ Crocodile in the Netherlands, PZB 90/LZB in Germany, KHP in Poland).
• A freight trains to operate on the corridor without restriction are limited by
a maximum train length of 600 m (540 m on Bad Bentheim branch, 550 m on the Krakow branch),
a maximum axle load of 21,0 t and
the profile P/C 70 – 400 (for intermodal trains).
The only parameter to stay constant throughout the whole (electrified) corridor is the width of the pantograph (1950 mm).
4.4.6 Impediments to efficient rail freight operations - Corridor E
Apart from the border crossings the experts mentioned few infrastructural bottlenecks on Corridor E. The most important infrastructural bottleneck appears to be the highly frequented Rhone valley – line between Dijon and Lyon where congestion (together with the priority of passenger trains) often result in a lack of punctuality of freight trains. A further impediment, which only concerns single wagon traffic in France is the marshalling yard in Lyon centre, which is constantly congested. Both impediments are not likely to be solved by short- or mid-term measures but need long-term investments in the infrastructure. Thus possible alleviation projects are not likely to be treated by means of an Integrated Project.
Lack of interoperability as impediment for rail freight transport
Like all international freight corridors, TREND Corridor E faces a variety of national power, safety, and signalling systems:
• France: 1,5 kV DC in southern France; 25 kV 50 Hz AC in northern / western France; safety systems: TVM; KVB, BRS
Deliverable B5.2
Infrastructure Development Scheme
TREND_B5-Report_IVE-2006_08_30 Page 78
• Italy: 3 kV DC; safety systems: BACC, RSDD
• Switzerland: 15 kV 16 2/3 Hz; safety systems: SIGNUM, ZUB 121
Figure 30: Main technical and operational parameters on TREND Corridor E
Like for other international rail freight corridors this variety results in the need of multi-system locomotives and/or locomotive changes (in case of conventional single system locomotives) in order to overcome these interfaces. Nevertheless, the involved Railway Undertakings affirmed a satisfactory situation concerning cross border operations between France / Switzerland / Italy. The level of interoperability on the corridor has been increased in selected areas. For example the French 437000 SNCF locomotives are authorised to enter Switzerland until Basel. As a next step Trenitalia plans to purchase 20 interoperable locomotives for French-Italian border crossing operations. For the Swiss-Italian services, 20 interoperable TI E412 are already homologated, another 40 will be purchased.
Another focus of the interoperable improvement measures is the training of locomotive drivers. Up to now, only some drivers are accepted bilaterally for interoperable employment, for a few particular trains and limited sections of the network. A lot of activities are in progress aiming at defining agreements on mutual acceptance of locomotives and loco-drivers. However, the current situation still shows a very limited level of interoperable operations across borders of TREND Corridor E. Despite of this the Railway Undertakings are satisfied with the current situation.
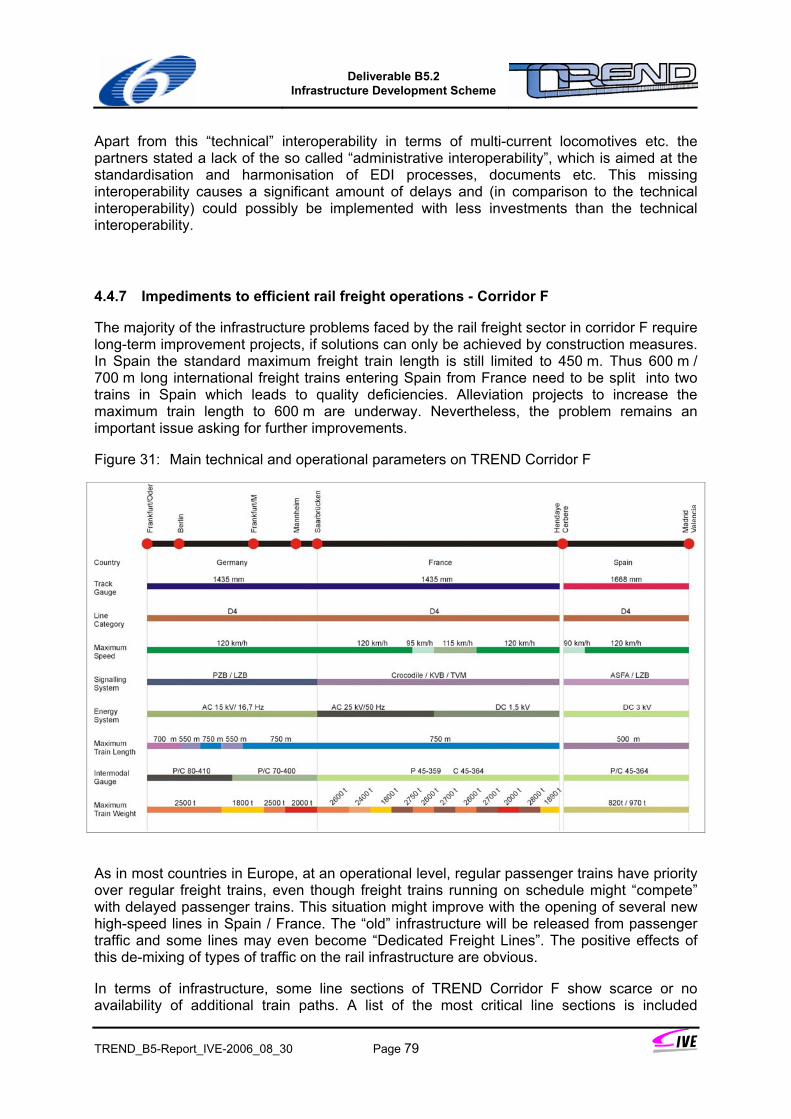
Deliverable B5.2
Infrastructure Development Scheme
TREND_B5-Report_IVE-2006_08_30 Page 79
Apart from this “technical” interoperability in terms of multi-current locomotives etc. the partners stated a lack of the so called “administrative interoperability”, which is aimed at the standardisation and harmonisation of EDI processes, documents etc. This missing interoperability causes a significant amount of delays and (in comparison to the technical interoperability) could possibly be implemented with less investments than the technical interoperability.
4.4.7 Impediments to efficient rail freight operations - Corridor F
The majority of the infrastructure problems faced by the rail freight sector in corridor F require long-term improvement projects, if solutions can only be achieved by construction measures. In Spain the standard maximum freight train length is still limited to 450 m. Thus 600 m / 700 m long international freight trains entering Spain from France need to be split into two trains in Spain which leads to quality deficiencies. Alleviation projects to increase the maximum train length to 600 m are underway. Nevertheless, the problem remains an important issue asking for further improvements.
Figure 31: Main technical and operational parameters on TREND Corridor F
As in most countries in Europe, at an operational level, regular passenger trains have priority over regular freight trains, even though freight trains running on schedule might “compete” with delayed passenger trains. This situation might improve with the opening of several new high-speed lines in Spain / France. The “old” infrastructure will be released from passenger traffic and some lines may even become “Dedicated Freight Lines”. The positive effects of this de-mixing of types of traffic on the rail infrastructure are obvious.
In terms of infrastructure, some line sections of TREND Corridor F show scarce or no availability of additional train paths. A list of the most critical line sections is included
Deliverable B5.2
Infrastructure Development Scheme
TREND_B5-Report_IVE-2006_08_30 Page 80
hereunder. Against the background of the expected growth of international freight traffic, capacity increasing measures in terms of optimised production concepts or infrastructure upgrading are urgently required here:
• Spain:
Connection of Port of Bilbao to main line Irún – Madrid,
Line Madrid – Irún: Villafría – Venta de Baños; Villalba-Pitis,
Line Port Bou – Valencia: Valencia – Castellón; Vandellos – Tarragona,
Line Zaragoza – Port Bou: Zaragoza – Reus.
• France:
Total section between German border and Dijon – lack of line capacity due to high traffic volume of passenger and freight trains,
Section Montpellier to Cerbères (Spanish border); congested due to insufficient border crossing infrastructure,
Nodes Paris, Perpignan, Montpellier.
• Germany:
Mannheim region: Poor state of Mannheim marshalling yards affects punctuality of freight trains processed there,
Line Horka (Polish border) – Halle: Section Horka – Knappenrode congested,
Node Frankfurt / Fulda: Section Hanau – Bebra congested,
Section Saarbücken – Forbach is highly saturated but improvement measures are under construction.
Lack of interoperability as impediment for rail freight transport
TREND Corridor F is characterised by a diversity of current and safety and signalling systems (see Figure 31). Currently, the three participating countries use four different systems:
• Spain: 3 kV DC
• France: 1,5 kV DC in southern France; 25 kV 50 Hz AC in northern / western France
• Germany: 15 kV 16 2/3 Hz AC
Apart from the different systems currently in use, each country employs at least one unique safety and signalling system. Thus, locomotives operating on the infrastructure of more than one country of the corridor are to be equipped with at least two safety-packages. This circumstance leads to a significant increase in the loco-price. The only alternative to the employment of multi-system locos is a loco and driver change at the border leading to a processing time of at least 20 minutes, but usually more.
Deliverable B5.2
Infrastructure Development Scheme
TREND_B5-Report_IVE-2006_08_30 Page 81
During the information gathering of TREND B2, the experts made clear that the employment of interoperable locos is only viable if an extra stop at the border is eliminated. If the dispatching procedures require a stop at the border anyway, the additional costs caused by the employment of multi-current locomotives cannot be compensated by a cut of the transport time. In this case, the interchange procedures at the border are to be optimised in order to minimise the processing time.
SNCF and Railion have opted for thru-traction between the two countries and have increased their stocks of multi-system locomotives. A considerable number of Railion´s type 189 locomotives have been assigned to a common multi-system-locomotive pool. This pool is managed under the exclusive responsibility of CIFFA between the marshalling yards Mannheim / Köln (Gremberg) and Metz (Woippy). SNCF plans to allocate the same number of interoperable 437000 locos to the common pool but is still waiting for homologation by German authorities.
4.5 Network analysis – results
4.5.1 Transport demand
In this section a summary of the corridor-related demand figures will be presented. The visualisation of demand figures in a network-related context highlight the relative importance of action in particular parts of the network. Figure 32 visualises the freight flows between adjacent countries, including transit volumes not originating from or being bound for one of those countries. Freight transported by all modes is included (road, rail, water-borne traffic).
Grey arrows are use in cases where the route taken and borders crossed are not definitely known, for example freight from Italy bound for Germany could go via Switzerland or Austria. Where uncertainty about the completeness of data occurs and volumes may expected to be bigger, figures are presented in the “>123” format. No figures are known where none are presented with a double arrow.
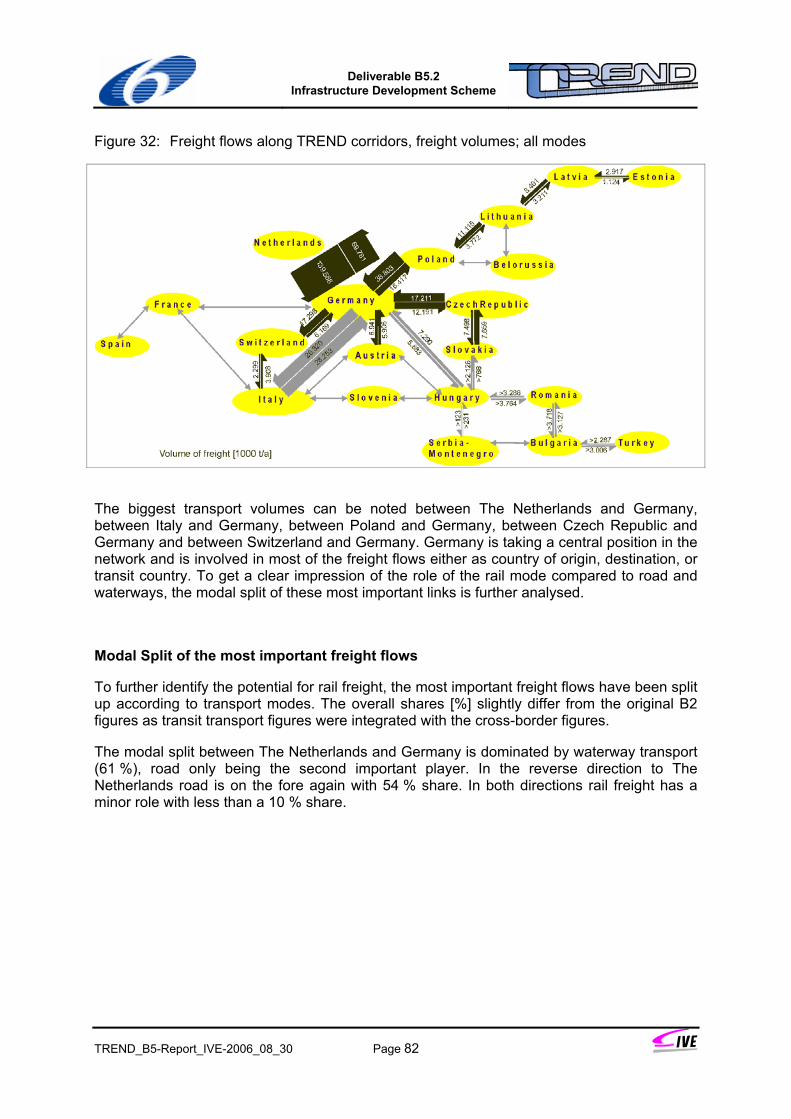
Deliverable B5.2
Infrastructure Development Scheme
TREND_B5-Report_IVE-2006_08_30 Page 82
Figure 32: Freight flows along TREND corridors, freight volumes; all modes
The biggest transport volumes can be noted between The Netherlands and Germany, between Italy and Germany, between Poland and Germany, between Czech Republic and Germany and between Switzerland and Germany. Germany is taking a central position in the network and is involved in most of the freight flows either as country of origin, destination, or transit country. To get a clear impression of the role of the rail mode compared to road and waterways, the modal split of these most important links is further analysed.
Modal Split of the most important freight flows
To further identify the potential for rail freight, the most important freight flows have been split up according to transport modes. The overall shares [%] slightly differ from the original B2 figures as transit transport figures were integrated with the cross-border figures.
The modal split between The Netherlands and Germany is dominated by waterway transport (61 %), road only being the second important player. In the reverse direction to The Netherlands road is on the fore again with 54 % share. In both directions rail freight has a minor role with less than a 10 % share.
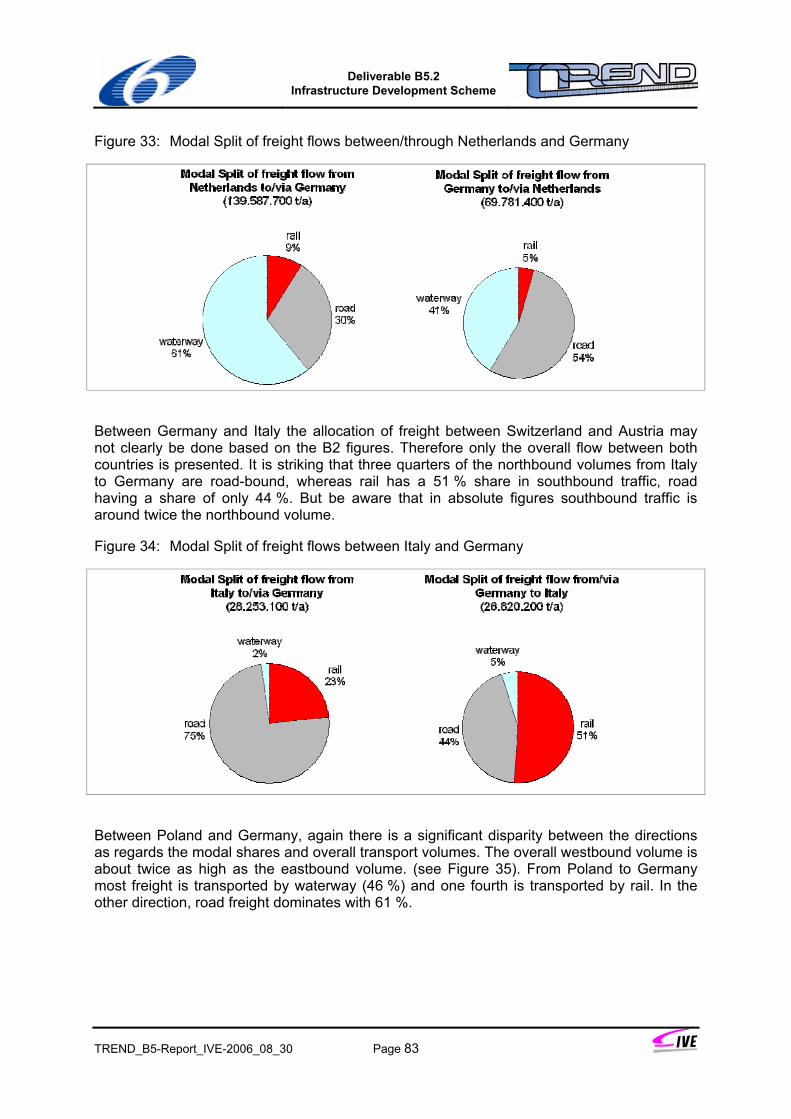
Deliverable B5.2
Infrastructure Development Scheme
TREND_B5-Report_IVE-2006_08_30 Page 83
Figure 33: Modal Split of freight flows between/through Netherlands and Germany
Between Germany and Italy the allocation of freight between Switzerland and Austria may not clearly be done based on the B2 figures. Therefore only the overall flow between both countries is presented. It is striking that three quarters of the northbound volumes from Italy to Germany are road-bound, whereas rail has a 51 % share in southbound traffic, road having a share of only 44 %. But be aware that in absolute figures southbound traffic is around twice the northbound volume.
Figure 34: Modal Split of freight flows between Italy and Germany
Between Poland and Germany, again there is a significant disparity between the directions as regards the modal shares and overall transport volumes. The overall westbound volume is about twice as high as the eastbound volume. (see Figure 35). From Poland to Germany most freight is transported by waterway (46 %) and one fourth is transported by rail. In the other direction, road freight dominates with 61 %.
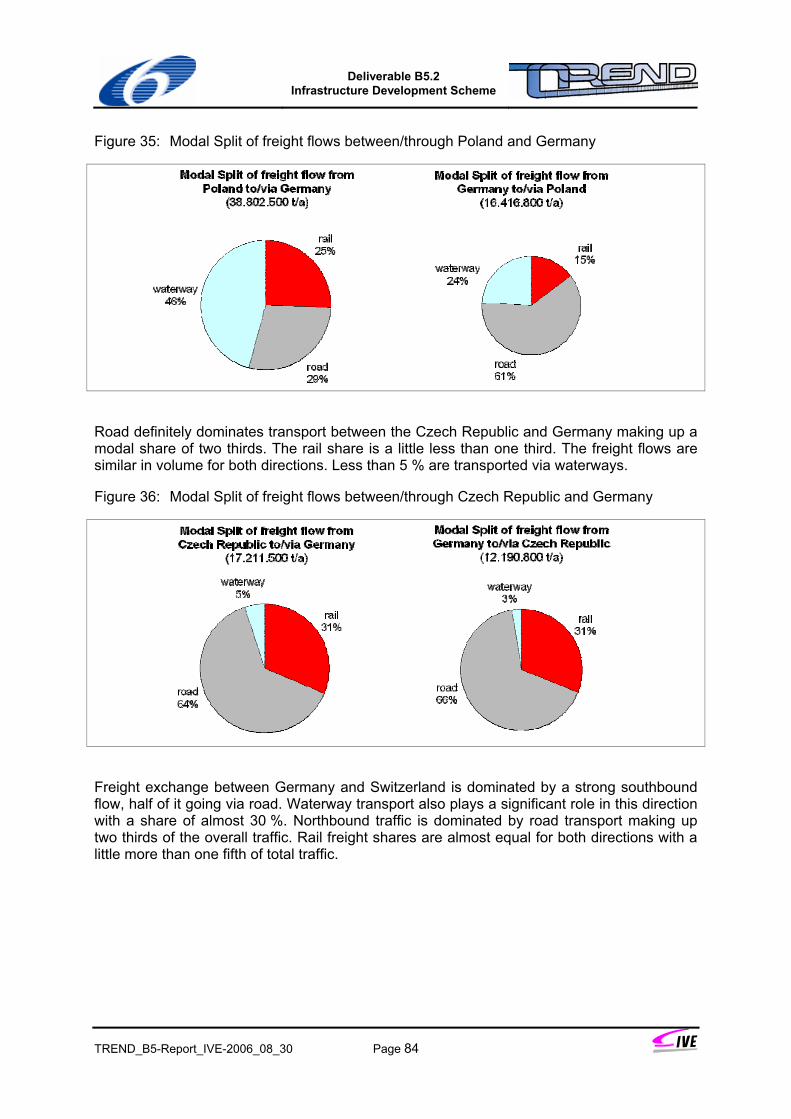
Deliverable B5.2
Infrastructure Development Scheme
TREND_B5-Report_IVE-2006_08_30 Page 84
Figure 35: Modal Split of freight flows between/through Poland and Germany
Road definitely dominates transport between the Czech Republic and Germany making up a modal share of two thirds. The rail share is a little less than one third. The freight flows are similar in volume for both directions. Less than 5 % are transported via waterways.
Figure 36: Modal Split of freight flows between/through Czech Republic and Germany
Freight exchange between Germany and Switzerland is dominated by a strong southbound flow, half of it going via road. Waterway transport also plays a significant role in this direction with a share of almost 30 %. Northbound traffic is dominated by road transport making up two thirds of the overall traffic. Rail freight shares are almost equal for both directions with a little more than one fifth of total traffic.
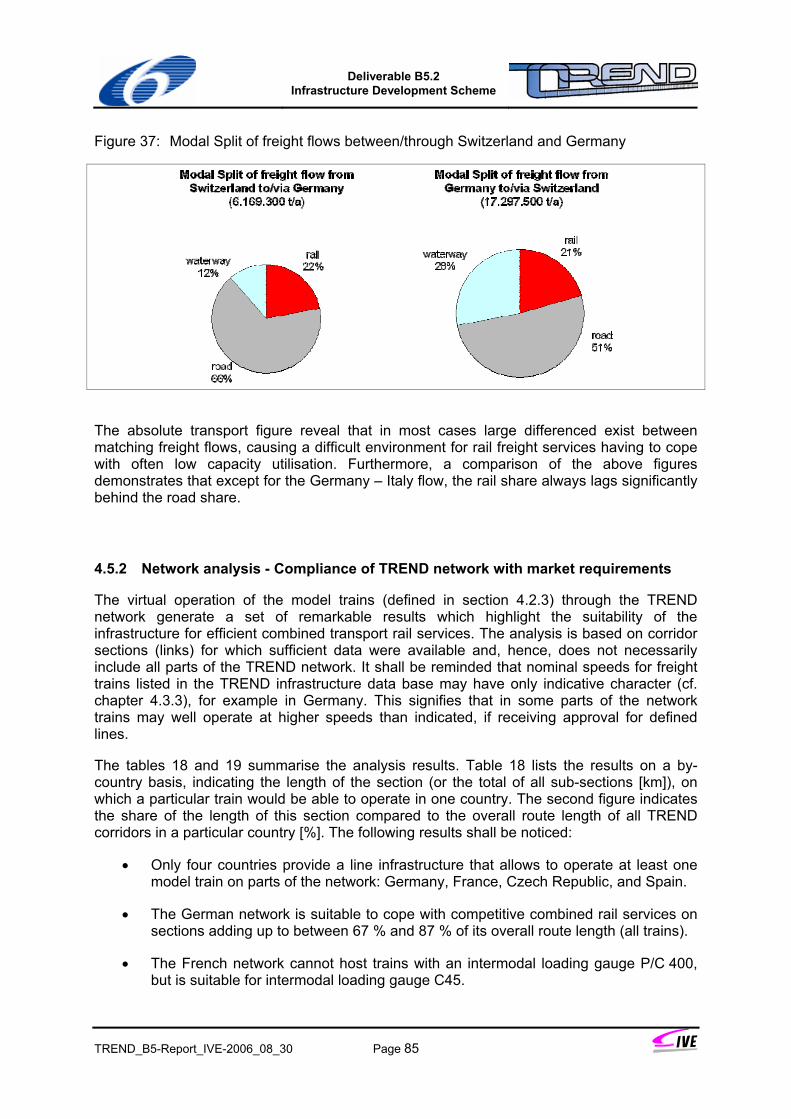
Deliverable B5.2
Infrastructure Development Scheme
TREND_B5-Report_IVE-2006_08_30 Page 85
Figure 37: Modal Split of freight flows between/through Switzerland and Germany
The absolute transport figure reveal that in most cases large differenced exist between matching freight flows, causing a difficult environment for rail freight services having to cope with often low capacity utilisation. Furthermore, a comparison of the above figures demonstrates that except for the Germany – Italy flow, the rail share always lags significantly behind the road share.
4.5.2 Network analysis - Compliance of TREND network with market requirements
The virtual operation of the model trains (defined in section 4.2.3) through the TREND network generate a set of remarkable results which highlight the suitability of the infrastructure for efficient combined transport rail services. The analysis is based on corridor sections (links) for which sufficient data were available and, hence, does not necessarily include all parts of the TREND network. It shall be reminded that nominal speeds for freight trains listed in the TREND infrastructure data base may have only indicative character (cf. chapter 4.3.3), for example in Germany. This signifies that in some parts of the network trains may well operate at higher speeds than indicated, if receiving approval for defined lines.
The tables 18 and 19 summarise the analysis results. Table 18 lists the results on a by-country basis, indicating the length of the section (or the total of all sub-sections [km]), on which a particular train would be able to operate in one country. The second figure indicates the share of the length of this section compared to the overall route length of all TREND corridors in a particular country [%]. The following results shall be noticed:
• Only four countries provide a line infrastructure that allows to operate at least one model train on parts of the network: Germany, France, Czech Republic, and Spain.
• The German network is suitable to cope with competitive combined rail services on sections adding up to between 67 % and 87 % of its overall route length (all trains).
• The French network cannot host trains with an intermodal loading gauge P/C 400, but is suitable for intermodal loading gauge C45.
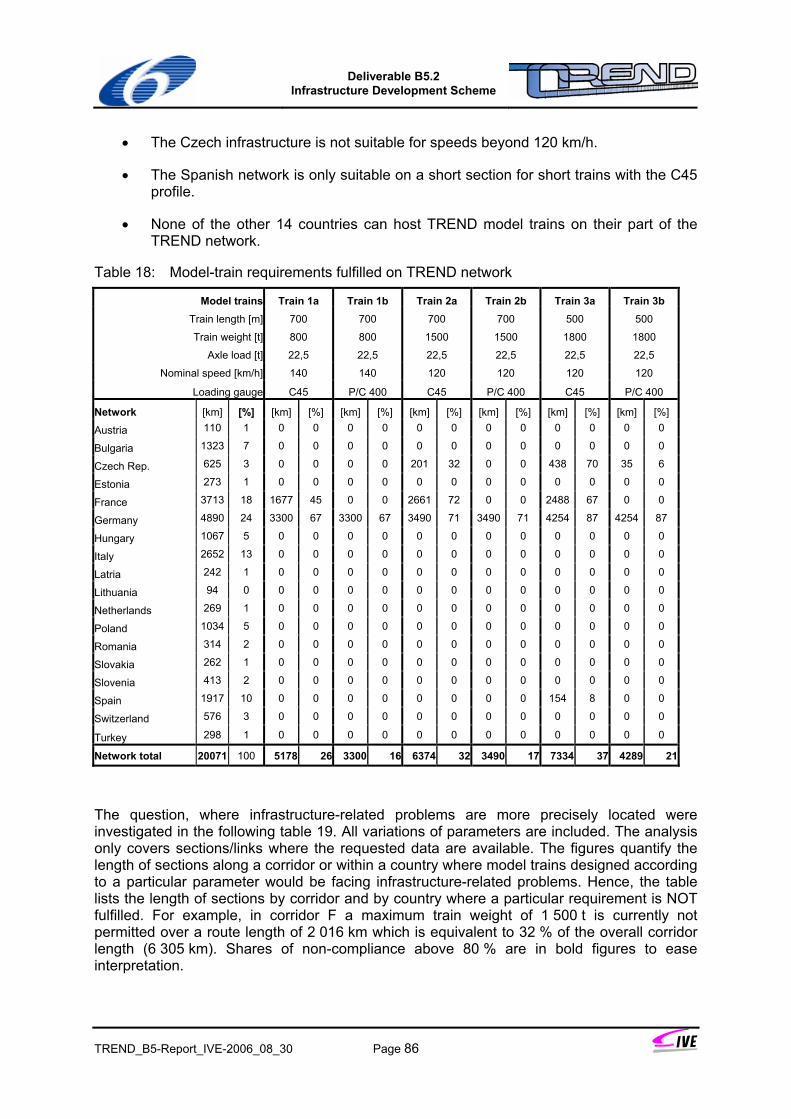
Deliverable B5.2
Infrastructure Development Scheme
TREND_B5-Report_IVE-2006_08_30 Page 86
• The Czech infrastructure is not suitable for speeds beyond 120 km/h.
• The Spanish network is only suitable on a short section for short trains with the C45 profile.
• None of the other 14 countries can host TREND model trains on their part of the TREND network.
Table 18: Model-train requirements fulfilled on TREND network
Model trains Train 1a Train 1b Train 2a Train 2b Train 3a Train 3b Train length [m] 700 700 700 700 500 500
Train weight [t] 800 800 1500 1500 1800 1800
Axle load [t] 22,5 22,5 22,5 22,5 22,5 22,5
Nominal speed [km/h] 140 140 120 120 120 120
Loading gauge C45 P/C 400 C45 P/C 400 C45 P/C 400
Network [km] [%] [km] [%] [km] [%] [km] [%] [km] [%] [km] [%] [km] [%]
Austria 110 1 0 0 0 0 0 0 0 0 0 0 0 0
Bulgaria 1323 7 0 0 0 0 0 0 0 0 0 0 0 0
Czech Rep. 625 3 0 0 0 0 201 32 0 0 438 70 35 6
Estonia 273 1 0 0 0 0 0 0 0 0 0 0 0 0
France 3713 18 1677 45 0 0 2661 72 0 0 2488 67 0 0
Germany 4890 24 3300 67 3300 67 3490 71 3490 71 4254 87 4254 87
Hungary 1067 5 0 0 0 0 0 0 0 0 0 0 0 0
Italy 2652 13 0 0 0 0 0 0 0 0 0 0 0 0
Latria 242 1 0 0 0 0 0 0 0 0 0 0 0 0
Lithuania 94 0 0 0 0 0 0 0 0 0 0 0 0 0
Netherlands 269 1 0 0 0 0 0 0 0 0 0 0 0 0
Poland 1034 5 0 0 0 0 0 0 0 0 0 0 0 0
Romania 314 2 0 0 0 0 0 0 0 0 0 0 0 0
Slovakia 262 1 0 0 0 0 0 0 0 0 0 0 0 0
Slovenia 413 2 0 0 0 0 0 0 0 0 0 0 0 0
Spain 1917 10 0 0 0 0 0 0 0 0 154 8 0 0
Switzerland 576 3 0 0 0 0 0 0 0 0 0 0 0 0
Turkey 298 1 0 0 0 0 0 0 0 0 0 0 0 0
Network total 20071 100 5178 26 3300 16 6374 32 3490 17 7334 37 4289 21
The question, where infrastructure-related problems are more precisely located were investigated in the following table 19. All variations of parameters are included. The analysis only covers sections/links where the requested data are available. The figures quantify the length of sections along a corridor or within a country where model trains designed according to a particular parameter would be facing infrastructure-related problems. Hence, the table lists the length of sections by corridor and by country where a particular requirement is NOT fulfilled. For example, in corridor F a maximum train weight of 1 500 t is currently not permitted over a route length of 2 016 km which is equivalent to 32 % of the overall corridor length (6 305 km). Shares of non-compliance above 80 % are in bold figures to ease interpretation.
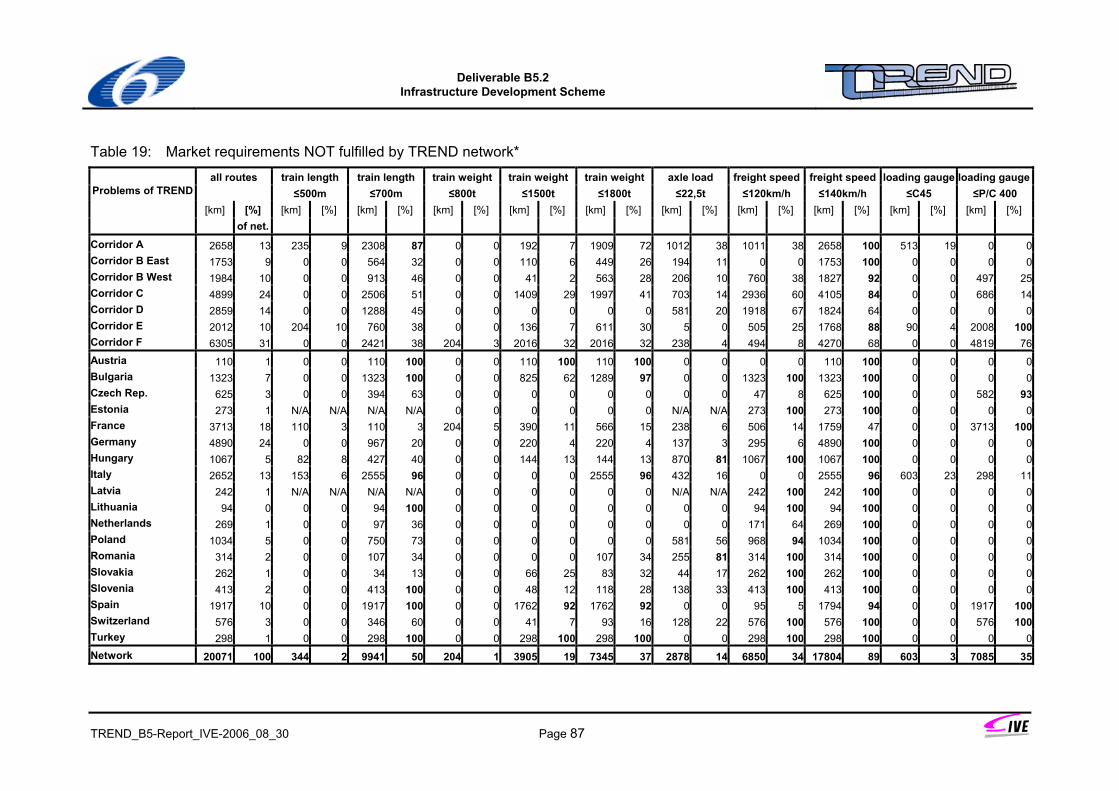
Deliverable B5.2
Infrastructure Development Scheme
TREND_B5-Report_IVE-2006_08_30 Page 87
Table 19: Market requirements NOT fulfilled by TREND network*
all routes train length train length train weight train weight train weight axle load freight speed freight speed loading gauge loading gauge Problems of TREND ≤500m ≤700m ≤800t ≤1500t ≤1800t ≤22,5t ≤120km/h ≤140km/h ≤C45 ≤P/C 400
[km] [%] [km] [%] [km] [%] [km] [%] [km] [%] [km] [%] [km] [%] [km] [%] [km] [%] [km] [%] [km] [%] of net.
Corridor A 2658 13 235 9 2308 87 0 0 192 7 1909 72 1012 38 1011 38 2658 100 513 19 0 0Corridor B East 1753 9 0 0 564 32 0 0 110 6 449 26 194 11 0 0 1753 100 0 0 0 0Corridor B West 1984 10 0 0 913 46 0 0 41 2 563 28 206 10 760 38 1827 92 0 0 497 25Corridor C 4899 24 0 0 2506 51 0 0 1409 29 1997 41 703 14 2936 60 4105 84 0 0 686 14Corridor D 2859 14 0 0 1288 45 0 0 0 0 0 0 581 20 1918 67 1824 64 0 0 0 0Corridor E 2012 10 204 10 760 38 0 0 136 7 611 30 5 0 505 25 1768 88 90 4 2008 100Corridor F 6305 31 0 0 2421 38 204 3 2016 32 2016 32 238 4 494 8 4270 68 0 0 4819 76Austria 110 1 0 0 110 100 0 0 110 100 110 100 0 0 0 0 110 100 0 0 0 0Bulgaria 1323 7 0 0 1323 100 0 0 825 62 1289 97 0 0 1323 100 1323 100 0 0 0 0Czech Rep. 625 3 0 0 394 63 0 0 0 0 0 0 0 0 47 8 625 100 0 0 582 93Estonia 273 1 N/A N/A N/A N/A 0 0 0 0 0 0 N/A N/A 273 100 273 100 0 0 0 0France 3713 18 110 3 110 3 204 5 390 11 566 15 238 6 506 14 1759 47 0 0 3713 100Germany 4890 24 0 0 967 20 0 0 220 4 220 4 137 3 295 6 4890 100 0 0 0 0Hungary 1067 5 82 8 427 40 0 0 144 13 144 13 870 81 1067 100 1067 100 0 0 0 0Italy 2652 13 153 6 2555 96 0 0 0 0 2555 96 432 16 0 0 2555 96 603 23 298 11Latvia 242 1 N/A N/A N/A N/A 0 0 0 0 0 0 N/A N/A 242 100 242 100 0 0 0 0Lithuania 94 0 0 0 94 100 0 0 0 0 0 0 0 0 94 100 94 100 0 0 0 0Netherlands 269 1 0 0 97 36 0 0 0 0 0 0 0 0 171 64 269 100 0 0 0 0Poland 1034 5 0 0 750 73 0 0 0 0 0 0 581 56 968 94 1034 100 0 0 0 0Romania 314 2 0 0 107 34 0 0 0 0 107 34 255 81 314 100 314 100 0 0 0 0Slovakia 262 1 0 0 34 13 0 0 66 25 83 32 44 17 262 100 262 100 0 0 0 0Slovenia 413 2 0 0 413 100 0 0 48 12 118 28 138 33 413 100 413 100 0 0 0 0Spain 1917 10 0 0 1917 100 0 0 1762 92 1762 92 0 0 95 5 1794 94 0 0 1917 100Switzerland 576 3 0 0 346 60 0 0 41 7 93 16 128 22 576 100 576 100 0 0 576 100Turkey 298 1 0 0 298 100 0 0 298 100 298 100 0 0 298 100 298 100 0 0 0 0Network 20071 100 344 2 9941 50 204 1 3905 19 7345 37 2878 14 6850 34 17804 89 603 3 7085 35
Deliverable B5.2
Infrastructure Development Scheme
TREND_B5-Report_IVE-2006_08_30 Page 88
It has to be mentioned, that for Austria and the Baltic states infrastructure data are (largely) missing. An interpretation of the above tables therefore has to be done very carefully. A data update is urgently required before using the TREND data base for further projects.
The train length of up to 500 m, usually restricted by the length of sidings, causes little problems within the TREND network. Only 2 % of the routes do not comply with this requirement. However, a required train length of 700 m denies the TREND model trains 1 and 2 access to half of the TREND network for operational reasons (no overtaking possible). The most restrictive countries with regard to train length are Austria (where data available), Bulgaria, Latvia, Lithuania, Slovenia, Spain, and Turkey. Most countries lie on the outer branches of the corridors of which corridor A is most limiting. For Latvia and Estonia data are missing in this respect.
Like short trains, light trains with a train weight of up to 800 t cause little restrictions to train operations. The TREND network denies access to only 1 % of the overall network, caused by French infrastructure. An increase of the train weight up to 1 500 t restricts trains to operate on roughly one fifth of the TREND network. Problems are largely to be found in Bulgaria, Spain, and Turkey. A further increase of the train weight to 1 800 t adds especially Italy to the list of the bottleneck countries. The links denying access to heavy trains add up to a share of 37 % of the overall route length. Especially the corridors A and C are affected.
An axle load of 22,5 t required by all model trains calls for one of the line categories D2, D3, or D4. Only 14 % of the TREND infrastructure provide for smaller allowable axle loads. When adding the non-specified links (figure 49), no more than one fifth of TREND network does not fulfil the 22,5 t requirement. Countries most heavily affected by restrictions are Hungary and Romania (81 % of the route length each).
The allowable speed of freight trains causes heavy problems in countries outside central Europe (data missing for Lithuania). In most Eastern European countries a speed of 120 km/h is not possible at all or only on very short route sections (Poland). The Czech Republic forms the only exception. In Western Europe only two countries provide a high degree of non-compliance with this requirement: the Netherlands (64 %) and Switzerland (100 %), probably due to mountainous terrain. The overall network causes restriction only over a route length of 34 %, mainly due to high standard of the German an French networks.
A much more uniform network exists with regard to admitting 140 km/h fast trains which are denied access to 89 % of the network. The only exception is France, providing on roughly half of their TREND network for fast freight trains. This rather weak result may also have been caused by infrastructure data gathering methodology. TREND experts seem to have provided indicative line speed figures. A clear identification of maximum freight speeds was hence not possible. It is therefore likely that faster trains may operate on some parts of the network after receiving approval.
The required intermodal loading gauge C45 obviously causes no problems within the TREND network. One exception is to be found in Italy on a link to France. The loading gauge P/C400 is not available in corridor E and causes heavy problems in corridor F (76 %). Deficiencies are caused by infrastructure located in the Czech Republic, in France, Spain, and Switzerland.
Deliverable B5.2
Infrastructure Development Scheme
TREND_B5-Report_IVE-2006_08_30 Page 89
5 GIS-Tool
5.1 Definitions and objectives
The TREND railway network comprises more than 20 000 km of railway lines with about 30 characteristic bits of information for each railway link stored in the TREND database. The information is attributed to the links of the network. The location of any link is determined by two nodes at either end of the link. The nodes may be linked to an electronic map via the attributed co-ordinates.
Hence, the objective of the GIS tool is to visualise the selected TREND network to:
• provide a descriptive demonstration of the selected rail infrastructure network;
• facilitate data evaluation;
• provide a user-friendly information basis for railway undertakings whishing to operate international rail services;
• demonstrate the feasibility of publishing rail related infrastructure data via the internet.
To provide a good user orientation, infrastructure data should be embedded in a geographical map which should comprise all over Europe in the case of TREND. This visualisation approach is also most valuable for the verification of data as missing data can be easily spotted on a map as well as faulty data, which can be more easily detected by an experienced viewer. The GIS-based demonstrator is able to create a European picture of railway infrastructure, its attributes, and capacity. The status of the TREND network can be visualised including capacity bottlenecks and the related infrastructural framework.
The system is running online on the TREND website since December 2005. Being only accessible for internal use at that time, TREND partners and experts were able to easily control and approve the TREND database content and the tool functionalities. After the final approval of data by the external experts, the GIS is publicly accessible since March 2006.
As work undertaken in work package B5 is intended to support the development of an integrated project aiming at implementing innovative rail freight services, the tool is regarded being valuable to railway undertakings intending to develop services in the corridors being on display on the TREND website.
The GIS model, basing on a largely populated database, was tested and applied in the network analysis phase. The tool has the status of a demonstrator, supporting the planning and evaluation of railway infrastructure development. It was especially created according to the TREND requirements, but it could be extended and modified for more complex applications. It has to be assumed that this database will not be maintained after the end of the TREND project.
Deliverable B5.2
Infrastructure Development Scheme
TREND_B5-Report_IVE-2006_08_30 Page 90
5.2 GIS data availability
“A geographic information or geographical information system (GIS) is a system for creating, storing, analyzing and managing spatial data and associated attributes. In the strictest sense, it is a computer system capable of integrating, storing, editing, analyzing, sharing, and displaying geographically-referenced information. In a more generic sense, GIS is a tool that allows users to create interactive queries (user created searches), analyze the spatial information, and edit data.”29
TREND information consists of railway infrastructure with project-specific attributes. It was the aim to display this information in a GIS environment (selective views) and therefore the nodes of the links, which were not geo-referenced (co-ordinates attributed) from the very beginning, needed to be linked to the GIS environment. The GIS environment needed to be obtained from an external supplier and had to include the following components:
• maps. Maps provide the background for displaying specific information in an overall referenced environment. They may consist of several layers providing different specific information such as political borders and entities, land use, etc.
• specific GIS-referenced infrastructure data. As TREND provides only the project-specific information about railway infrastructure, geo-referenced transport infrastructure networks were needed to complement the background maps. In this context, especially road networks and railway lines were of interest.
Data requirements
It is not required to provide an electronic map for EDP applications not intending to display any information on a map. For example, a route search program may operate on the basis of an electronic road network with attributes such as road category, lengths of sections and the like. This is clearly not the case for the TREND demonstrator as one of the objectives is the display of rail-specific information.
However, background information for the TREND demonstrator could be restricted to a range of basic information such as “significant” villages and towns (10 000 inhabitants and more), rivers, motorways and trunk roads, etc. The data basis has to cover all over Europe and had to be made available for timely unlimited use (display on the TREND website for non-commercial use).
The following table provides an overview over required background and specific data. This list was the basis for negotiations with several data providers.
29 from Wikipedia, English site, search for: “Geographic Information System”, March 2006.
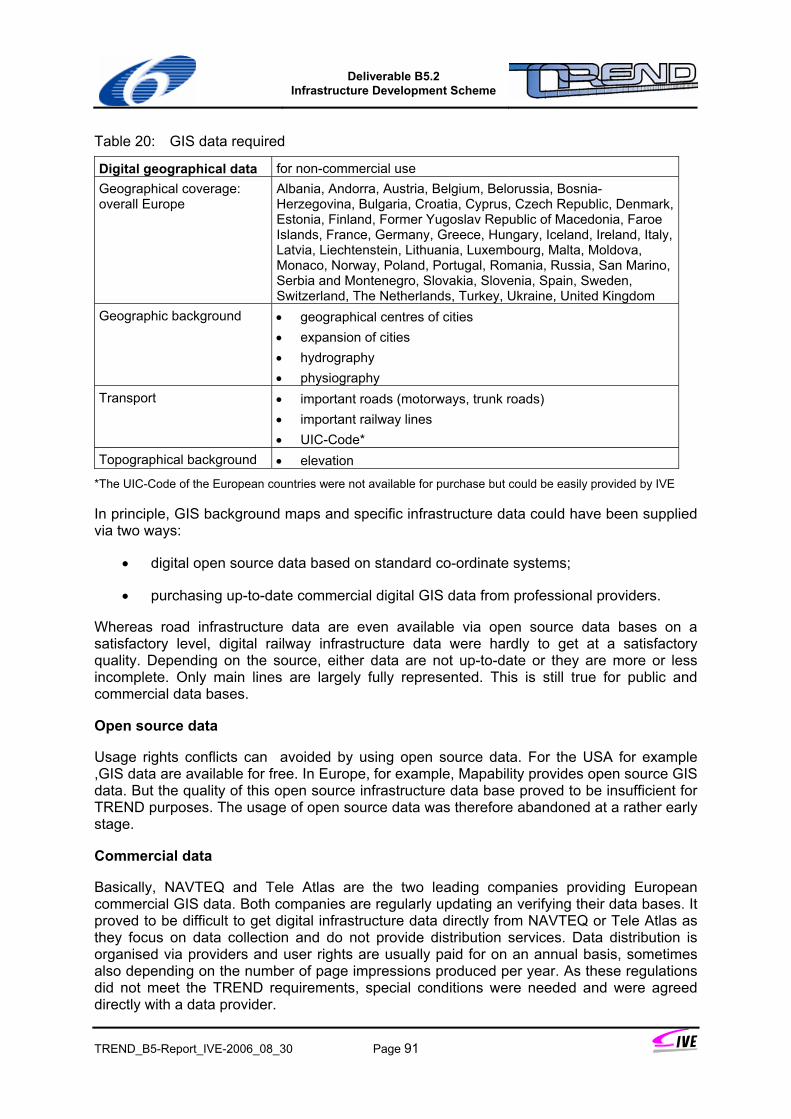
Deliverable B5.2
Infrastructure Development Scheme
TREND_B5-Report_IVE-2006_08_30 Page 91
Table 20: GIS data required
Digital geographical data for non-commercial use Geographical coverage: overall Europe
Albania, Andorra, Austria, Belgium, Belorussia, Bosnia-Herzegovina, Bulgaria, Croatia, Cyprus, Czech Republic, Denmark, Estonia, Finland, Former Yugoslav Republic of Macedonia, Faroe Islands, France, Germany, Greece, Hungary, Iceland, Ireland, Italy, Latvia, Liechtenstein, Lithuania, Luxembourg, Malta, Moldova, Monaco, Norway, Poland, Portugal, Romania, Russia, San Marino, Serbia and Montenegro, Slovakia, Slovenia, Spain, Sweden, Switzerland, The Netherlands, Turkey, Ukraine, United Kingdom
Geographic background • geographical centres of cities • expansion of cities • hydrography • physiography
Transport • important roads (motorways, trunk roads) • important railway lines • UIC-Code*
Topographical background • elevation
*The UIC-Code of the European countries were not available for purchase but could be easily provided by IVE
In principle, GIS background maps and specific infrastructure data could have been supplied via two ways:
• digital open source data based on standard co-ordinate systems;
• purchasing up-to-date commercial digital GIS data from professional providers.
Whereas road infrastructure data are even available via open source data bases on a satisfactory level, digital railway infrastructure data were hardly to get at a satisfactory quality. Depending on the source, either data are not up-to-date or they are more or less incomplete. Only main lines are largely fully represented. This is still true for public and commercial data bases.
Open source data
Usage rights conflicts can avoided by using open source data. For the USA for example ,GIS data are available for free. In Europe, for example, Mapability provides open source GIS data. But the quality of this open source infrastructure data base proved to be insufficient for TREND purposes. The usage of open source data was therefore abandoned at a rather early stage.
Commercial data
Basically, NAVTEQ and Tele Atlas are the two leading companies providing European commercial GIS data. Both companies are regularly updating an verifying their data bases. It proved to be difficult to get digital infrastructure data directly from NAVTEQ or Tele Atlas as they focus on data collection and do not provide distribution services. Data distribution is organised via providers and user rights are usually paid for on an annual basis, sometimes also depending on the number of page impressions produced per year. As these regulations did not meet the TREND requirements, special conditions were needed and were agreed directly with a data provider.
Deliverable B5.2
Infrastructure Development Scheme
TREND_B5-Report_IVE-2006_08_30 Page 92
Data providers and negotiations
Several data providers were contacted in the course of negotiations. They shall be briefly presented.
• JERID spol. s. .r. o. from Czech Republic is promoting the first electronic rail map of Europe. A MAP&GUIDE data basis (based on NAVTEQ data) is complemented by railway data. Using the JERID data set requires a MAP&GUIDE license. At the beginning of TREND, the railway data basis was not completed (e.g. Spain not included yet).
• Further GIS data providers are digital data services gmbh (dds), WIGeoGIS or MACON. They all use data from Tele Atlas and/or NAVTEQ which are focused on road data collection. All three providers pointed out that their data for railway infrastructure were not complete and up to date. However, negotiation with all three providers were done.
It was decided that railway lines in form of background animation were sufficient in the TREND context as further specific information would be provided by the TREND consortium and experts. A fixed-price contract was finally agreed with MACON for the unlimited use of a digital data background information for display on the TREND homepage. The standard co-ordinate system applied is WGS84. This standard co-ordinate system offers vast data import and export opportunities between several standard GIS-software-systems.
5.3 Data compatibility and software evaluation
Considering that the TREND database might be used for further projects, the database has to be compatible with standard co-ordinate systems as well as with standard GIS-software. An evaluation of suitable software tools was therefore required.
The most important evaluation objective was the suitability for the TREND project. Assuming that TREND shall supply reliable internet services over a considerable period of time, the following selection criteria were applied:
• reliability: stable computer program to handle large databases;
• suitability for the provision of internet applications: provision of a map server or a geo-data server software;
• import and export functions for handling most standard data formats;
• user friendliness to facilitate the training of new users.
In the evaluation, also freely available software was considered. Table 21 shows the evaluation summary.
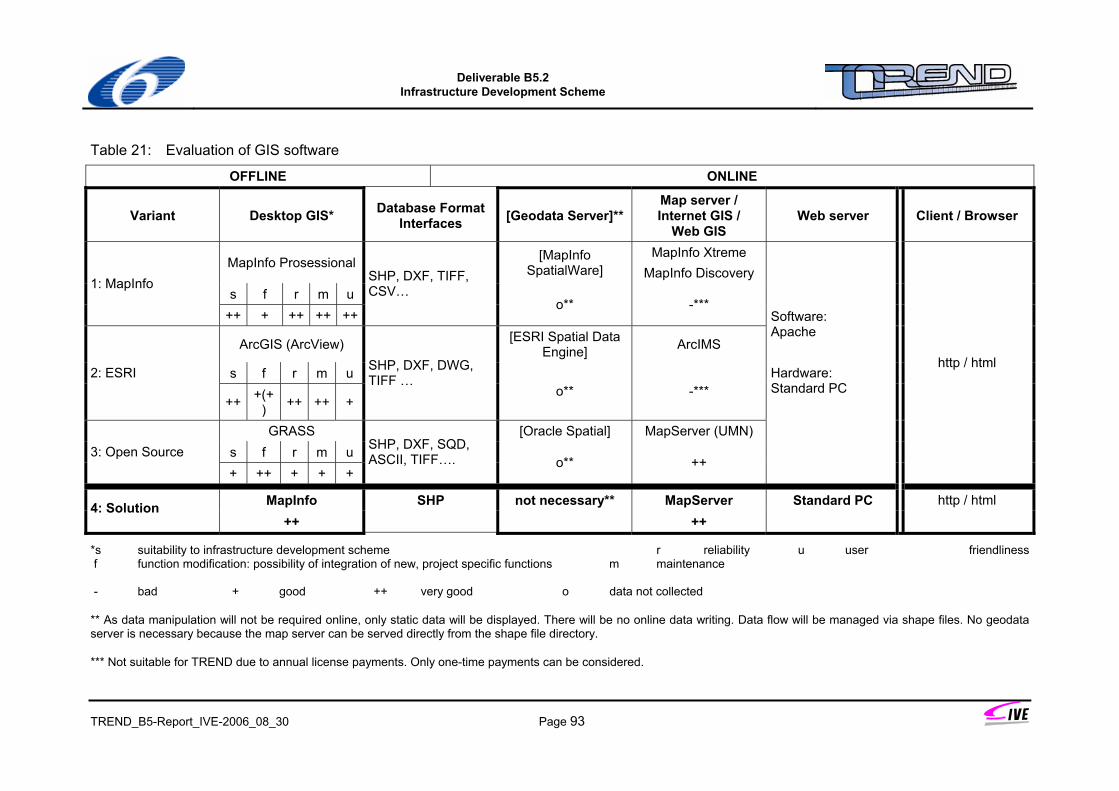
Deliverable B5.2
Infrastructure Development Scheme
TREND_B5-Report_IVE-2006_08_30 Page 93
Table 21: Evaluation of GIS software
OFFLINE ONLINE
Variant Desktop GIS* Database Format Interfaces [Geodata Server]**
Map server / Internet GIS /
Web GIS Web server Client / Browser
MapInfo Prosessional [MapInfo SpatialWare]
MapInfo Xtreme MapInfo Discovery
s f r m u 1: MapInfo
++ + ++ ++ ++
SHP, DXF, TIFF, CSV…
o** -***
ArcGIS (ArcView) [ESRI Spatial Data Engine] ArcIMS
s f r m u 2: ESRI
++ +(+) ++ ++ +
SHP, DXF, DWG, TIFF …
o** -***
GRASS [Oracle Spatial] MapServer (UMN) s f r m u 3: Open Source + ++ + + +
SHP, DXF, SQD, ASCII, TIFF…. o** ++
Software: Apache Hardware: Standard PC
http / html
MapInfo SHP not necessary** MapServer Standard PC http / html 4: Solution ++ ++
*s suitability to infrastructure development scheme r reliability u user friendliness f function modification: possibility of integration of new, project specific functions m maintenance - bad + good ++ very good o data not collected
** As data manipulation will not be required online, only static data will be displayed. There will be no online data writing. Data flow will be managed via shape files. No geodata server is necessary because the map server can be served directly from the shape file directory.
*** Not suitable for TREND due to annual license payments. Only one-time payments can be considered.
Deliverable B5.2
Infrastructure Development Scheme
TREND_B5-Report_IVE-2006_08_30 Page 94
MapInfo was chosen as a suitable desktop GIS to edit the database offline before publicly releasing the tool. The software also handles all standard co-ordinate systems and provides data exchange facilities regarding several standard formats, for example: shape (SHP) (typical for ESRI-software and compatible to several open source software) or CSV (compatible to Microsoft Excel/Access).
As for the web server, a commercial version would have caused annual user charges which was not compatible with TREND funding conditions. Therefore an open source web server was used which is called MapServer. The web server is required to display requested information (dynamic map content) on the TREND website. MapServer is an open source development environment for building spatially-enabled internet applications..
Developed by the University of Minnesota (UMN), this map server could easily be used with shape files which can be exported by MapInfo. It provides all necessary functions to visualise TREND database queries (modifications required prior to implementation in TREND website). As only standard software components are used for the GIS-based demonstrator, a standard PC can be used as an internet server, providing the necessary good performance for hosting the TREND internet application.
5.4 Collection and processing of infrastructure database
Corridor and infrastructure related data were collected in Work Package B2. They were delivered by the external experts in Excel® sheet format. Automatic import of data proved to be impossible due to the inconsistent handling of data formats by the experts. All data had therefore to be manually checked and transferred into a consistent set of data.
Several data checks and amendments (cf. also section 3.7.2) were conducted before launching the public website in March 2006. At several levels, the TREND experts were involved. External data sources were investigated to provide lacking information or to countercheck TREND expert information. Most data is missing for Romania, Lithuania, and Estonia because no infrastructure managers were involved in TREND. Missing data could mostly not be provided by other partners.
IVE implemented all data with the desktop GIS software MapInfo. For each corridor, separate layers were created for displaying railway nodes and links. All railway link-related information, e.g. “length”, “max. speed”, “line category”, etc., was written on link layers. All node-related information, e.g. “marshalling yard”, “border crossing”, etc., was written on node layers.
The transformation of the delivered non-geo-referenced information (location names) to WGS84 co-ordinates was undertaken with the support of the purchased background map. MapInfo software was used to attribute geographical WGS 84 co-ordinates to the TREND network nodes on the basis of the geographical names of the nodes. The attributed co-ordinates hence do not exactly reflect the location of railway nodes. In the framework of TREND this fault may be neglected due to the large scale of the internet presentation. Distances are explicitly attributed to the links anyway and are in no way derived from or calculated on the basis of the background map.
Railway links are displayed as straight lines between two nodes. Where appropriate, links were adapted (kinked) to better follow the course of the real-world railway lines on the map. For the sake of easy perception, data were clustered before displaying them. For example, “max freight speed” information was clustered like “< 80 km/h”, “≥ 80 km/h”, “≥ 120 km/h”,
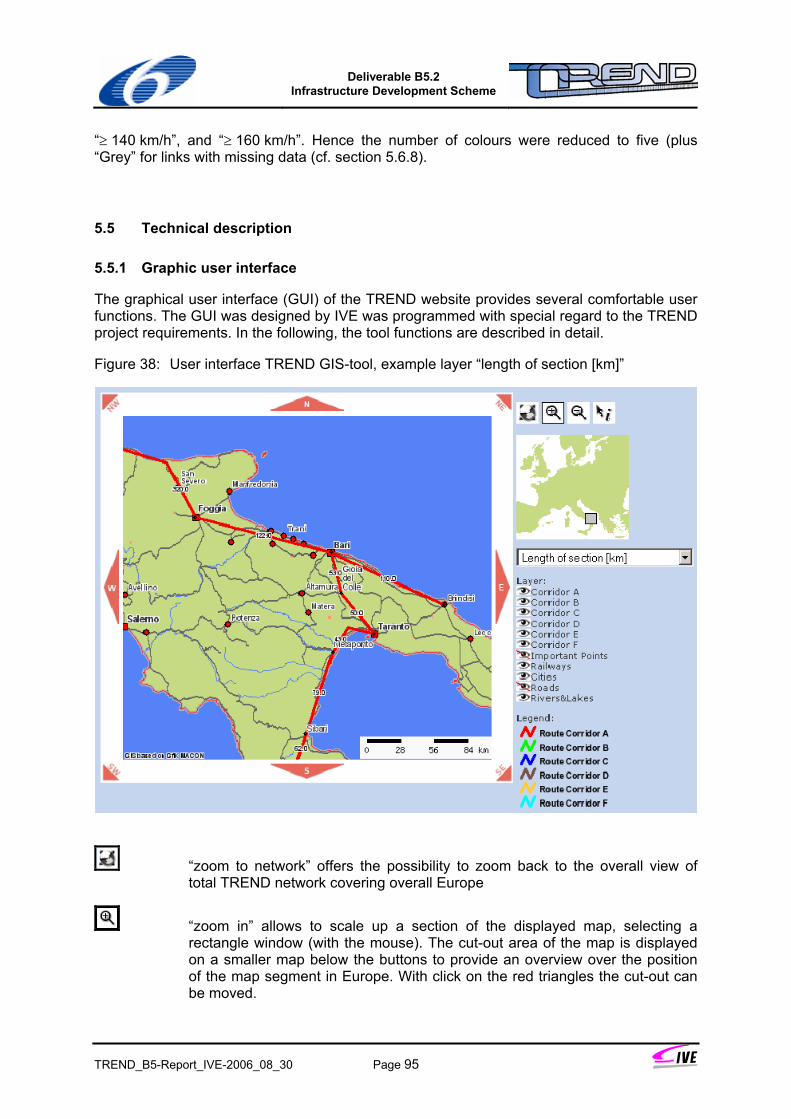
Deliverable B5.2
Infrastructure Development Scheme
TREND_B5-Report_IVE-2006_08_30 Page 95
“≥ 140 km/h”, and “≥ 160 km/h”. Hence the number of colours were reduced to five (plus “Grey” for links with missing data (cf. section 5.6.8).
5.5 Technical description
5.5.1 Graphic user interface
The graphical user interface (GUI) of the TREND website provides several comfortable user functions. The GUI was designed by IVE was programmed with special regard to the TREND project requirements. In the following, the tool functions are described in detail.
Figure 38: User interface TREND GIS-tool, example layer “length of section [km]”
“zoom to network” offers the possibility to zoom back to the overall view of total TREND network covering overall Europe
“zoom in” allows to scale up a section of the displayed map, selecting a rectangle window (with the mouse). The cut-out area of the map is displayed on a smaller map below the buttons to provide an overview over the position of the map segment in Europe. With click on the red triangles the cut-out can be moved.
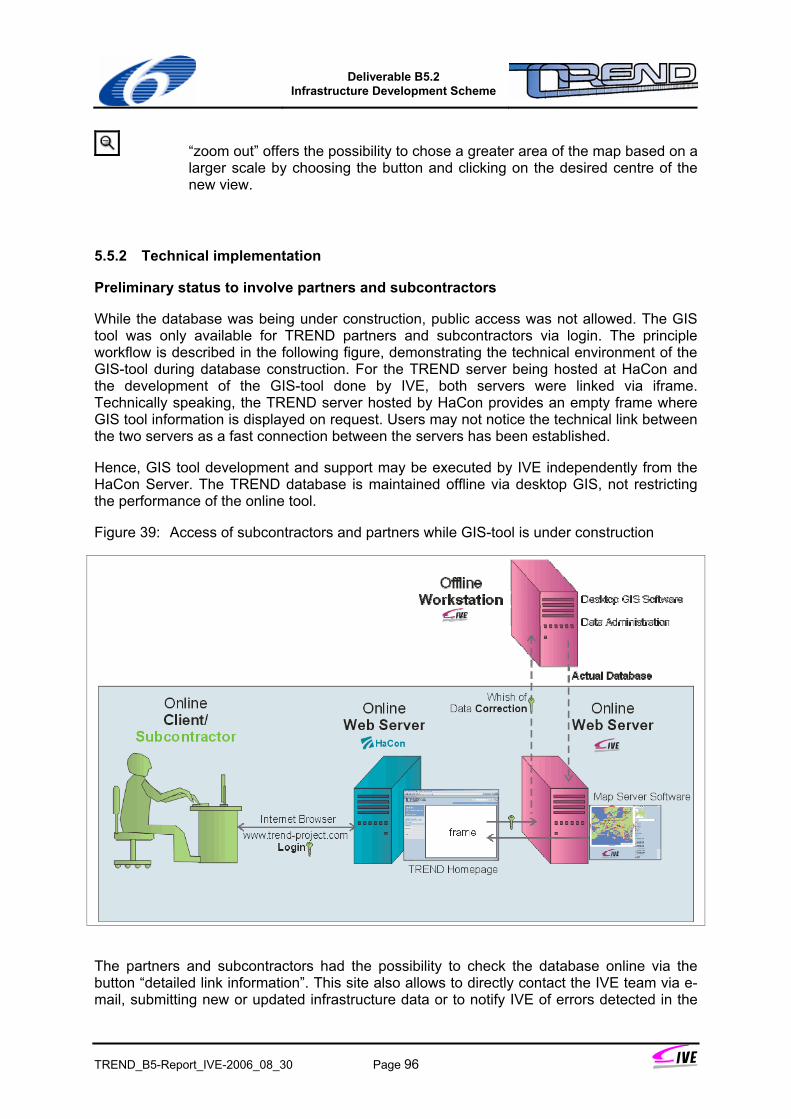
Deliverable B5.2
Infrastructure Development Scheme
TREND_B5-Report_IVE-2006_08_30 Page 96
“zoom out” offers the possibility to chose a greater area of the map based on a larger scale by choosing the button and clicking on the desired centre of the new view.
5.5.2 Technical implementation
Preliminary status to involve partners and subcontractors
While the database was being under construction, public access was not allowed. The GIS tool was only available for TREND partners and subcontractors via login. The principle workflow is described in the following figure, demonstrating the technical environment of the GIS-tool during database construction. For the TREND server being hosted at HaCon and the development of the GIS-tool done by IVE, both servers were linked via iframe. Technically speaking, the TREND server hosted by HaCon provides an empty frame where GIS tool information is displayed on request. Users may not notice the technical link between the two servers as a fast connection between the servers has been established.
Hence, GIS tool development and support may be executed by IVE independently from the HaCon Server. The TREND database is maintained offline via desktop GIS, not restricting the performance of the online tool.
Figure 39: Access of subcontractors and partners while GIS-tool is under construction
The partners and subcontractors had the possibility to check the database online via the button “detailed link information”. This site also allows to directly contact the IVE team via e-mail, submitting new or updated infrastructure data or to notify IVE of errors detected in the
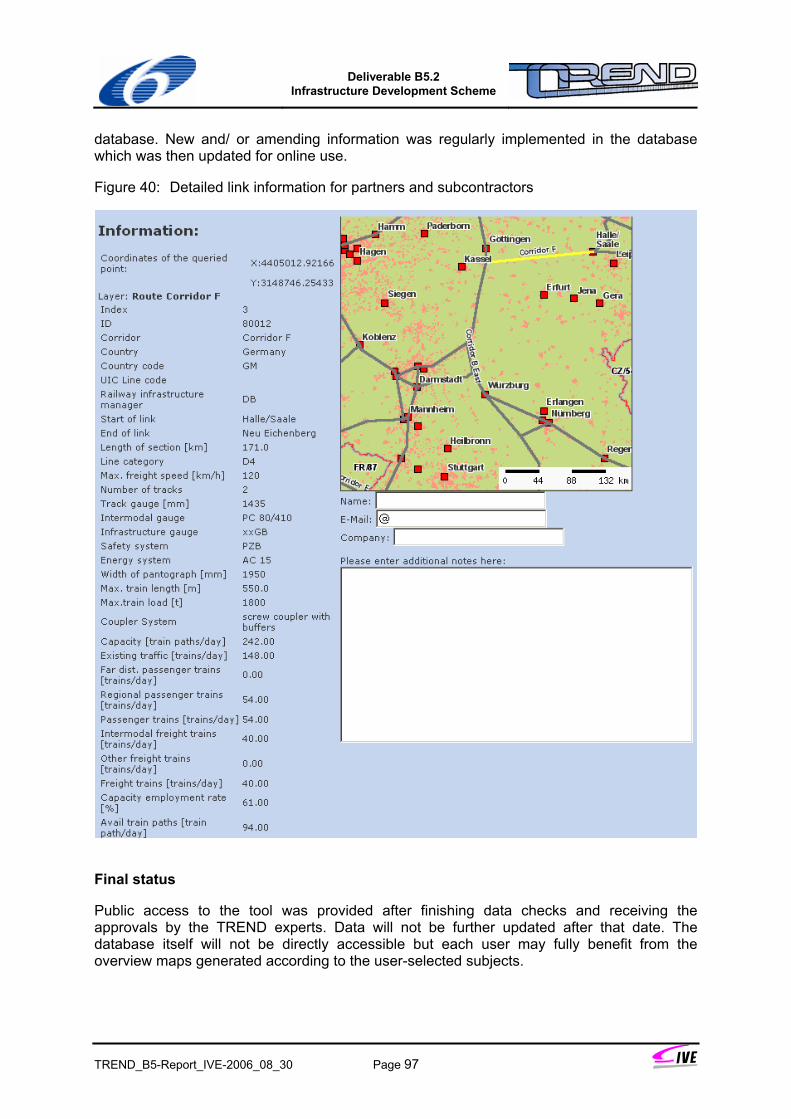
Deliverable B5.2
Infrastructure Development Scheme
TREND_B5-Report_IVE-2006_08_30 Page 97
database. New and/ or amending information was regularly implemented in the database which was then updated for online use.
Figure 40: Detailed link information for partners and subcontractors
Final status
Public access to the tool was provided after finishing data checks and receiving the approvals by the TREND experts. Data will not be further updated after that date. The database itself will not be directly accessible but each user may fully benefit from the overview maps generated according to the user-selected subjects.
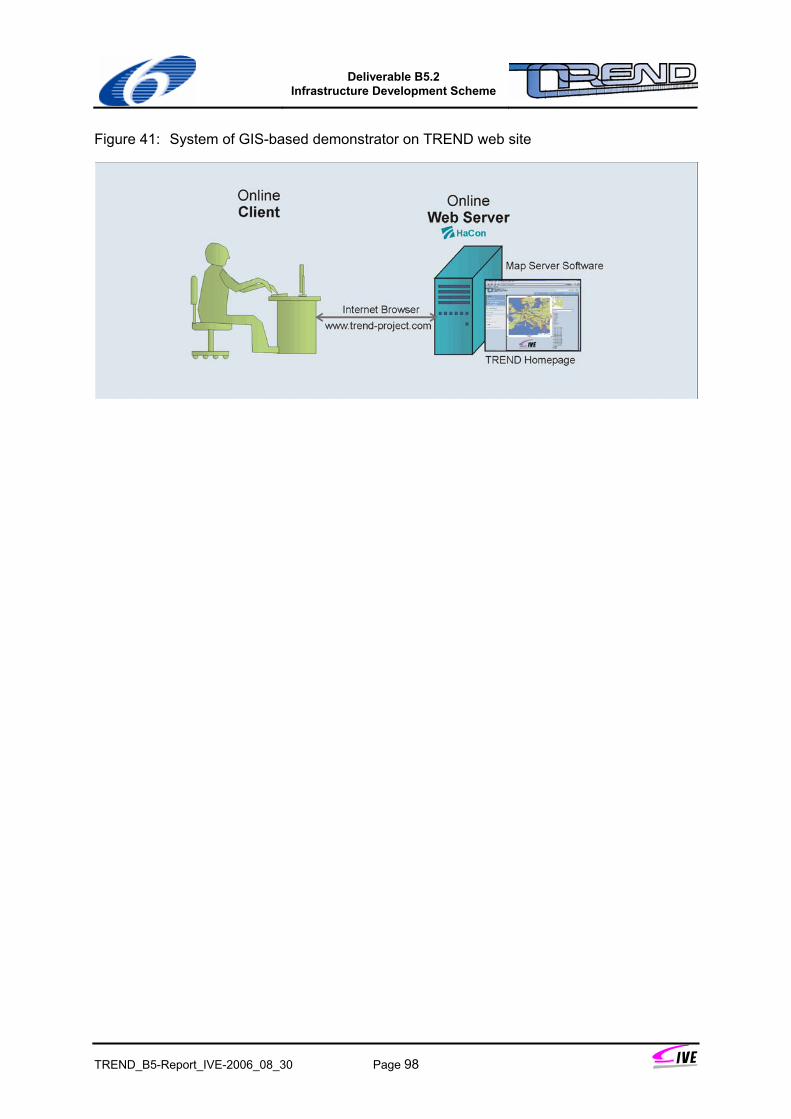
Deliverable B5.2
Infrastructure Development Scheme
TREND_B5-Report_IVE-2006_08_30 Page 98
Figure 41: System of GIS-based demonstrator on TREND web site
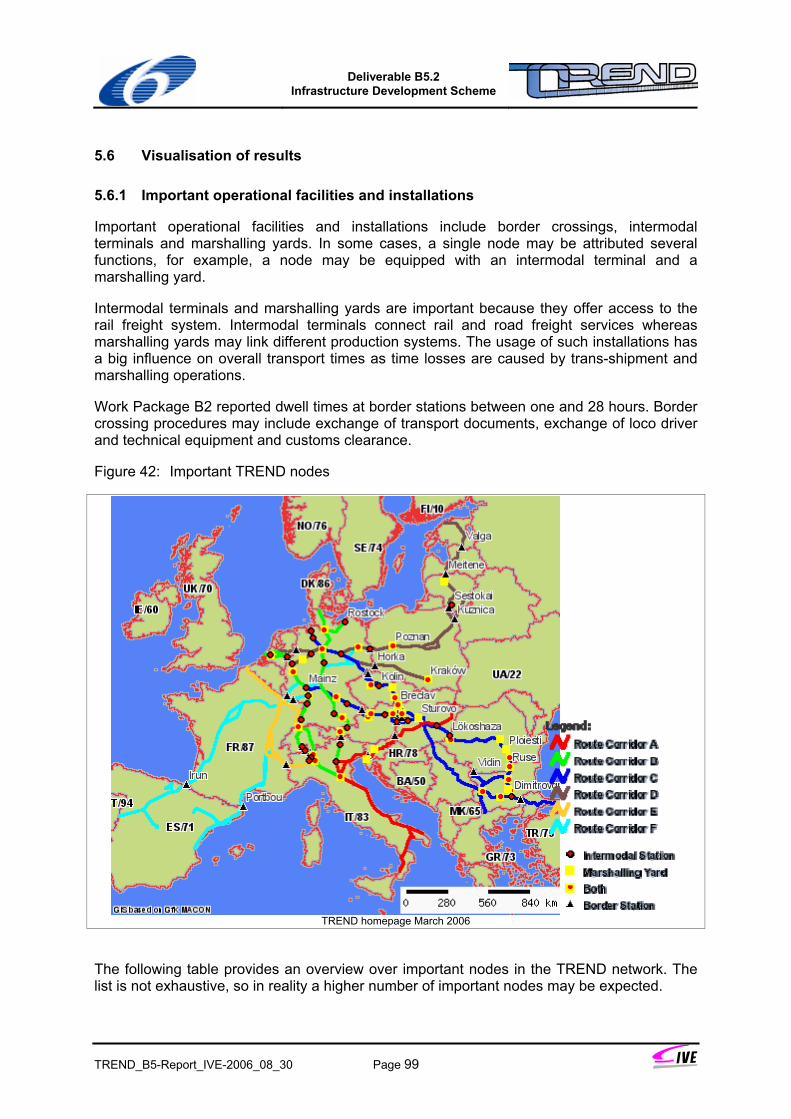
Deliverable B5.2
Infrastructure Development Scheme
TREND_B5-Report_IVE-2006_08_30 Page 99
5.6 Visualisation of results
5.6.1 Important operational facilities and installations
Important operational facilities and installations include border crossings, intermodal terminals and marshalling yards. In some cases, a single node may be attributed several functions, for example, a node may be equipped with an intermodal terminal and a marshalling yard.
Intermodal terminals and marshalling yards are important because they offer access to the rail freight system. Intermodal terminals connect rail and road freight services whereas marshalling yards may link different production systems. The usage of such installations has a big influence on overall transport times as time losses are caused by trans-shipment and marshalling operations.
Work Package B2 reported dwell times at border stations between one and 28 hours. Border crossing procedures may include exchange of transport documents, exchange of loco driver and technical equipment and customs clearance.
Figure 42: Important TREND nodes
TREND homepage March 2006
The following table provides an overview over important nodes in the TREND network. The list is not exhaustive, so in reality a higher number of important nodes may be expected.
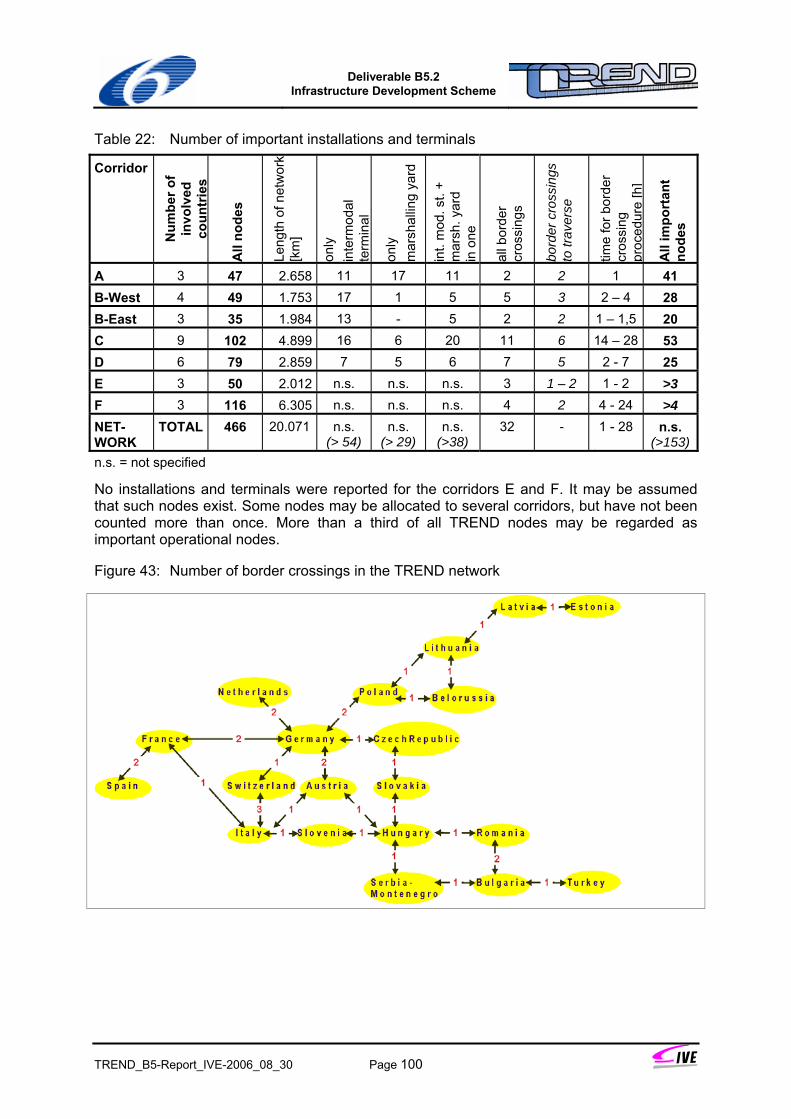
Deliverable B5.2
Infrastructure Development Scheme
TREND_B5-Report_IVE-2006_08_30 Page 100
Table 22: Number of important installations and terminals
Corridor N
umbe
r of
invo
lved
co
untr
ies
All
node
s
Leng
th o
f net
wor
k [k
m]
only
in
term
odal
te
rmin
al
only
m
arsh
allin
g ya
rd
int.
mod
. st.
+ m
arsh
. yar
d
in o
ne
all b
orde
r cr
ossi
ngs
bord
er c
ross
ings
to
trav
erse
time
for b
orde
r cr
ossi
ng
proc
edur
e [h
]
All
impo
rtan
t no
des
A 3 47 2.658 11 17 11 2 2 1 41 B-West 4 49 1.753 17 1 5 5 3 2 – 4 28 B-East 3 35 1.984 13 - 5 2 2 1 – 1,5 20 C 9 102 4.899 16 6 20 11 6 14 – 28 53 D 6 79 2.859 7 5 6 7 5 2 - 7 25 E 3 50 2.012 n.s. n.s. n.s. 3 1 – 2 1 - 2 >3 F 3 116 6.305 n.s. n.s. n.s. 4 2 4 - 24 >4 NET-WORK
TOTAL 466 20.071 n.s. (> 54)
n.s. (> 29)
n.s. (>38)
32 - 1 - 28 n.s. (>153)
n.s. = not specified
No installations and terminals were reported for the corridors E and F. It may be assumed that such nodes exist. Some nodes may be allocated to several corridors, but have not been counted more than once. More than a third of all TREND nodes may be regarded as important operational nodes.
Figure 43: Number of border crossings in the TREND network
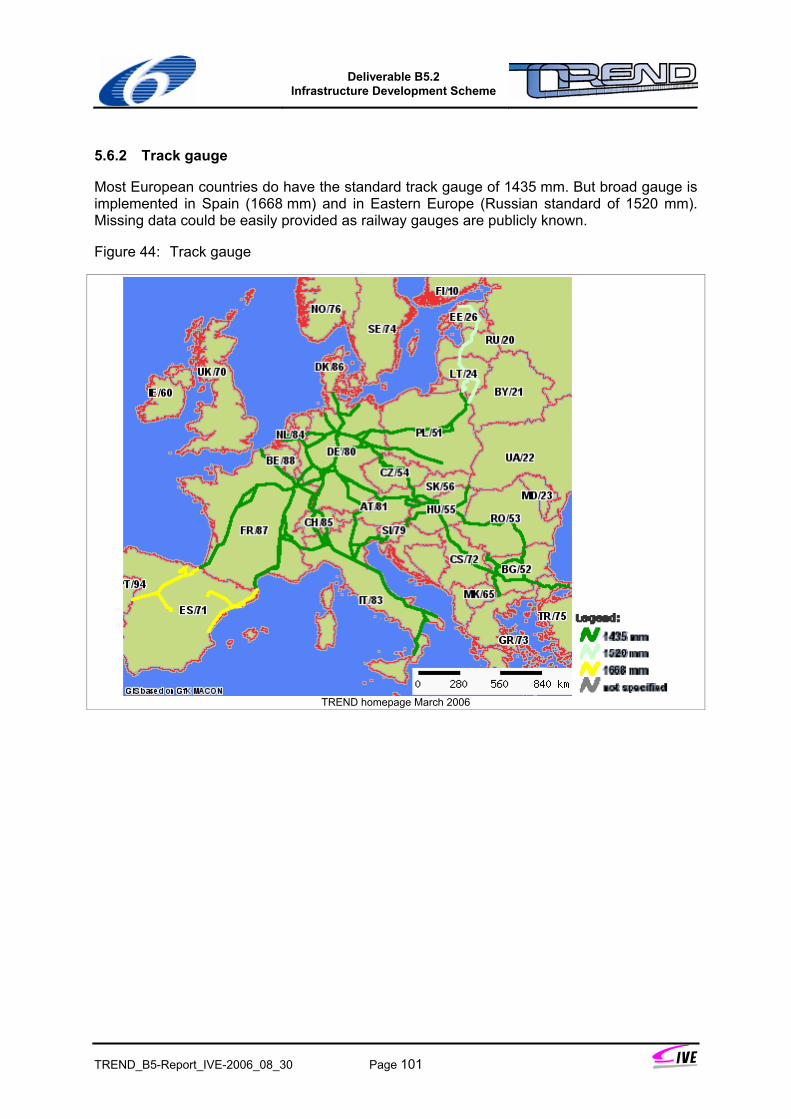
Deliverable B5.2
Infrastructure Development Scheme
TREND_B5-Report_IVE-2006_08_30 Page 101
5.6.2 Track gauge
Most European countries do have the standard track gauge of 1435 mm. But broad gauge is implemented in Spain (1668 mm) and in Eastern Europe (Russian standard of 1520 mm). Missing data could be easily provided as railway gauges are publicly known.
Figure 44: Track gauge
TREND homepage March 2006
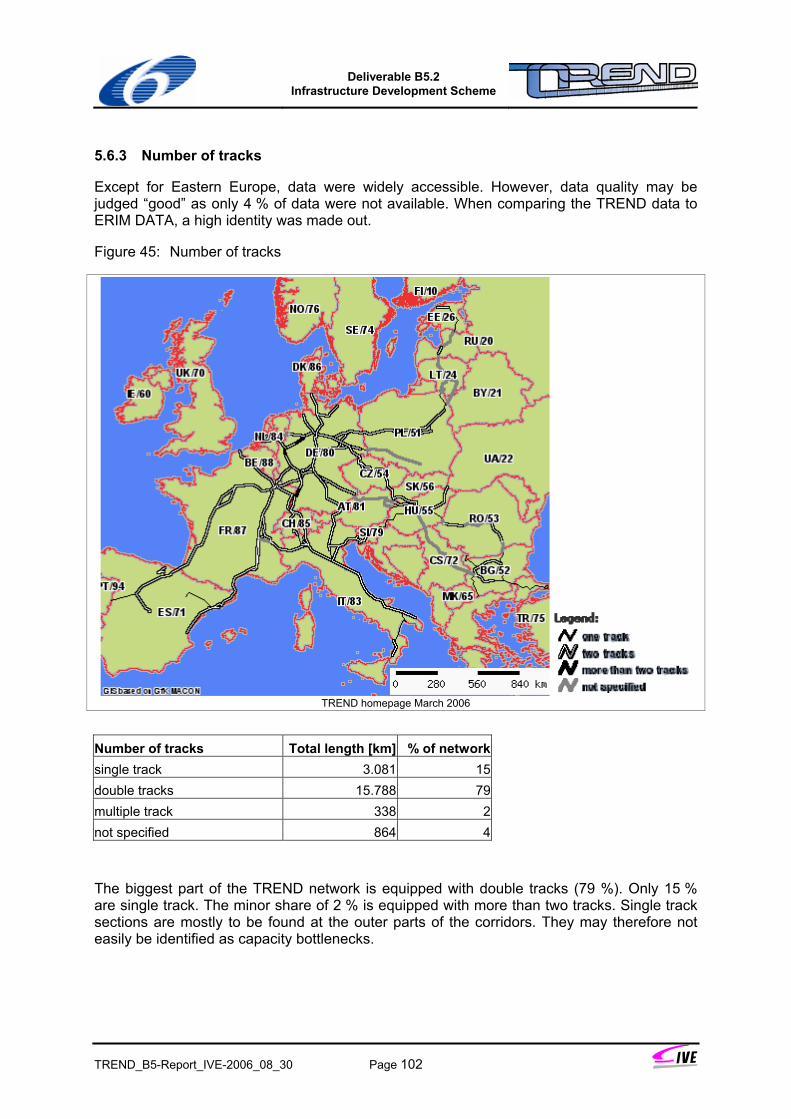
Deliverable B5.2
Infrastructure Development Scheme
TREND_B5-Report_IVE-2006_08_30 Page 102
5.6.3 Number of tracks
Except for Eastern Europe, data were widely accessible. However, data quality may be judged “good” as only 4 % of data were not available. When comparing the TREND data to ERIM DATA, a high identity was made out.
Figure 45: Number of tracks
TREND homepage March 2006
Number of tracks Total length [km] % of networksingle track 3.081 15double tracks 15.788 79multiple track 338 2not specified 864 4
The biggest part of the TREND network is equipped with double tracks (79 %). Only 15 % are single track. The minor share of 2 % is equipped with more than two tracks. Single track sections are mostly to be found at the outer parts of the corridors. They may therefore not easily be identified as capacity bottlenecks.
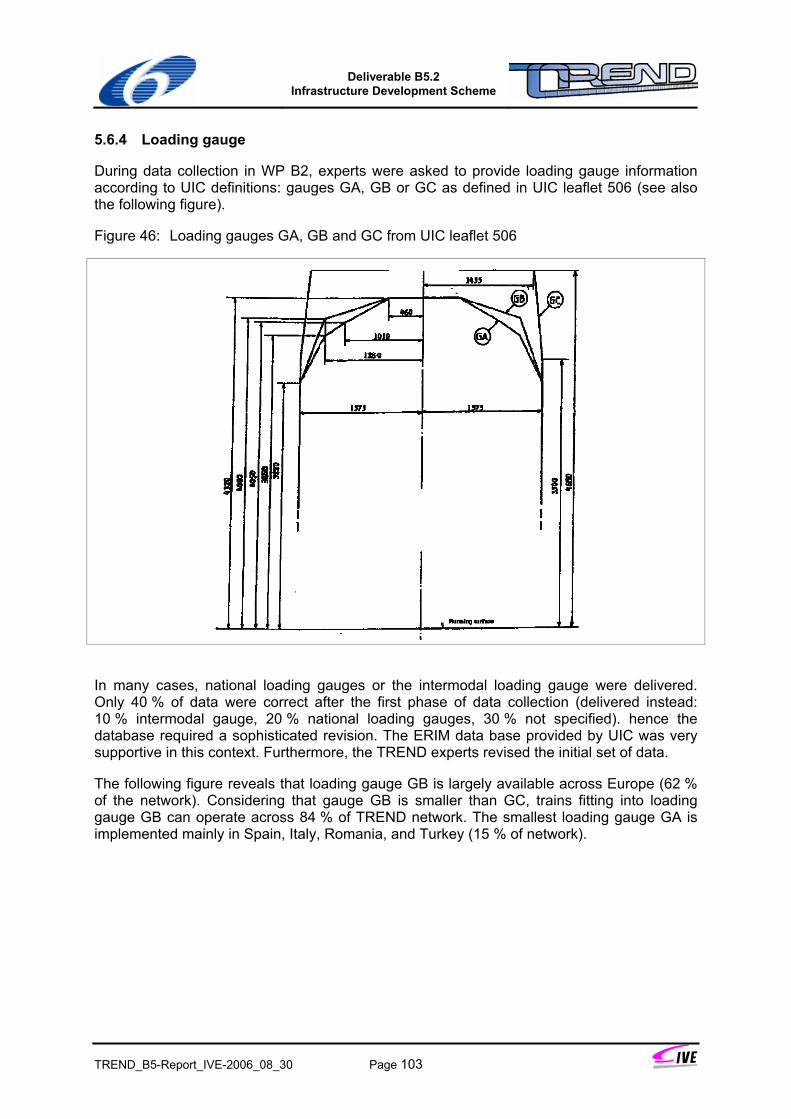
Deliverable B5.2
Infrastructure Development Scheme
TREND_B5-Report_IVE-2006_08_30 Page 103
5.6.4 Loading gauge
During data collection in WP B2, experts were asked to provide loading gauge information according to UIC definitions: gauges GA, GB or GC as defined in UIC leaflet 506 (see also the following figure).
Figure 46: Loading gauges GA, GB and GC from UIC leaflet 506
In many cases, national loading gauges or the intermodal loading gauge were delivered. Only 40 % of data were correct after the first phase of data collection (delivered instead: 10 % intermodal gauge, 20 % national loading gauges, 30 % not specified). hence the database required a sophisticated revision. The ERIM data base provided by UIC was very supportive in this context. Furthermore, the TREND experts revised the initial set of data.
The following figure reveals that loading gauge GB is largely available across Europe (62 % of the network). Considering that gauge GB is smaller than GC, trains fitting into loading gauge GB can operate across 84 % of TREND network. The smallest loading gauge GA is implemented mainly in Spain, Italy, Romania, and Turkey (15 % of network).
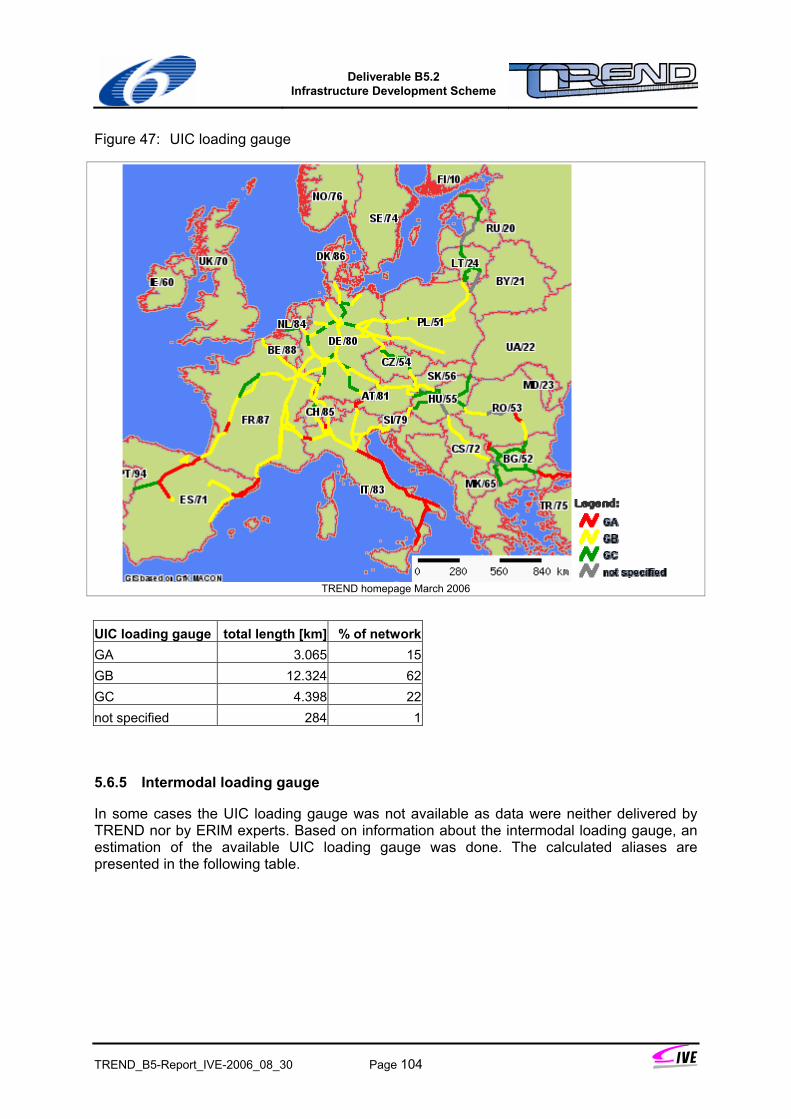
Deliverable B5.2
Infrastructure Development Scheme
TREND_B5-Report_IVE-2006_08_30 Page 104
Figure 47: UIC loading gauge
TREND homepage March 2006
UIC loading gauge total length [km] % of networkGA 3.065 15GB 12.324 62GC 4.398 22not specified 284 1
5.6.5 Intermodal loading gauge
In some cases the UIC loading gauge was not available as data were neither delivered by TREND nor by ERIM experts. Based on information about the intermodal loading gauge, an estimation of the available UIC loading gauge was done. The calculated aliases are presented in the following table.
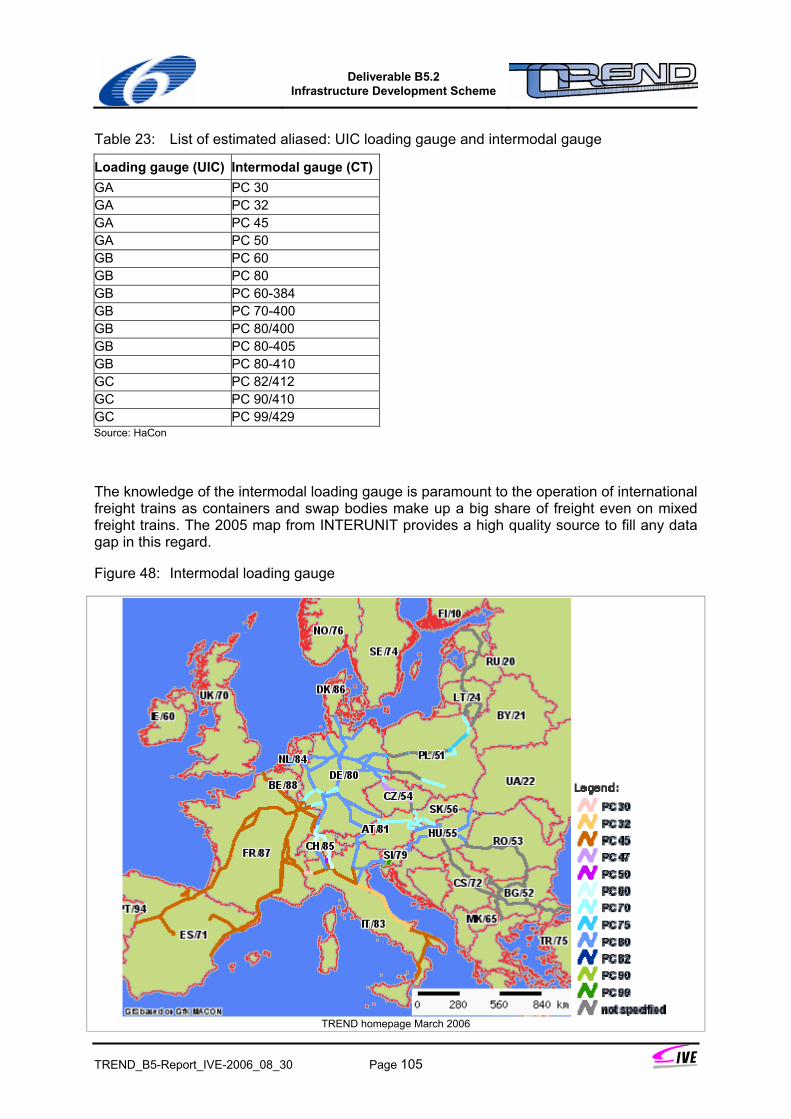
Deliverable B5.2
Infrastructure Development Scheme
TREND_B5-Report_IVE-2006_08_30 Page 105
Table 23: List of estimated aliased: UIC loading gauge and intermodal gauge
Loading gauge (UIC) Intermodal gauge (CT)GA PC 30 GA PC 32 GA PC 45 GA PC 50 GB PC 60 GB PC 80 GB PC 60-384 GB PC 70-400 GB PC 80/400 GB PC 80-405 GB PC 80-410 GC PC 82/412 GC PC 90/410 GC PC 99/429 Source: HaCon
The knowledge of the intermodal loading gauge is paramount to the operation of international freight trains as containers and swap bodies make up a big share of freight even on mixed freight trains. The 2005 map from INTERUNIT provides a high quality source to fill any data gap in this regard.
Figure 48: Intermodal loading gauge
TREND homepage March 2006
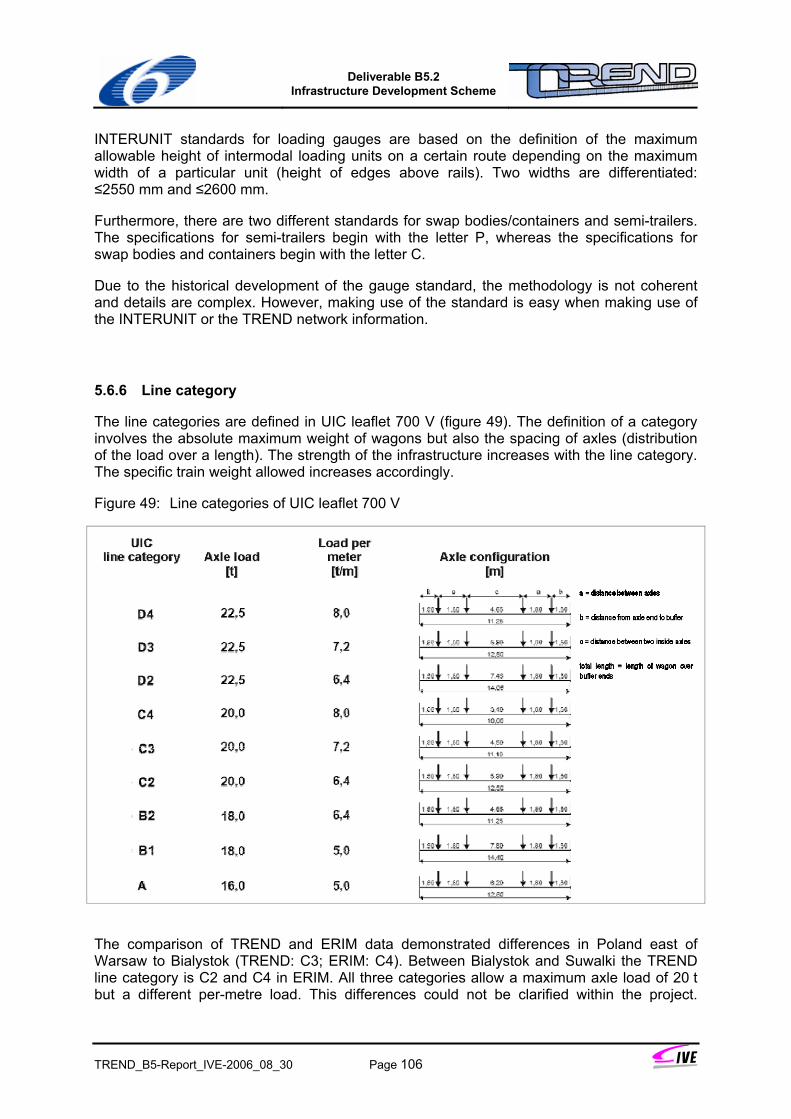
Deliverable B5.2
Infrastructure Development Scheme
TREND_B5-Report_IVE-2006_08_30 Page 106
INTERUNIT standards for loading gauges are based on the definition of the maximum allowable height of intermodal loading units on a certain route depending on the maximum width of a particular unit (height of edges above rails). Two widths are differentiated: ≤2550 mm and ≤2600 mm.
Furthermore, there are two different standards for swap bodies/containers and semi-trailers. The specifications for semi-trailers begin with the letter P, whereas the specifications for swap bodies and containers begin with the letter C.
Due to the historical development of the gauge standard, the methodology is not coherent and details are complex. However, making use of the standard is easy when making use of the INTERUNIT or the TREND network information.
5.6.6 Line category
The line categories are defined in UIC leaflet 700 V (figure 49). The definition of a category involves the absolute maximum weight of wagons but also the spacing of axles (distribution of the load over a length). The strength of the infrastructure increases with the line category. The specific train weight allowed increases accordingly.
Figure 49: Line categories of UIC leaflet 700 V
The comparison of TREND and ERIM data demonstrated differences in Poland east of Warsaw to Bialystok (TREND: C3; ERIM: C4). Between Bialystok and Suwalki the TREND line category is C2 and C4 in ERIM. All three categories allow a maximum axle load of 20 t but a different per-metre load. This differences could not be clarified within the project.
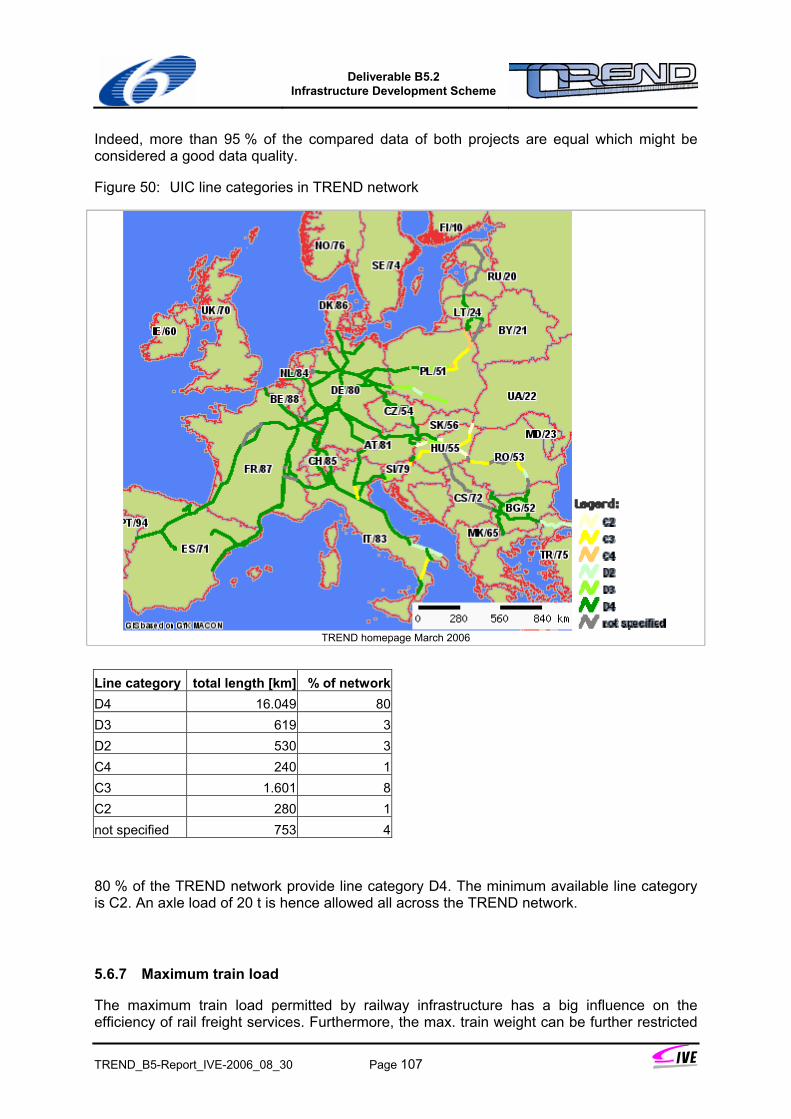
Deliverable B5.2
Infrastructure Development Scheme
TREND_B5-Report_IVE-2006_08_30 Page 107
Indeed, more than 95 % of the compared data of both projects are equal which might be considered a good data quality.
Figure 50: UIC line categories in TREND network
TREND homepage March 2006
Line category total length [km] % of networkD4 16.049 80D3 619 3D2 530 3C4 240 1C3 1.601 8C2 280 1not specified 753 4
80 % of the TREND network provide line category D4. The minimum available line category is C2. An axle load of 20 t is hence allowed all across the TREND network.
5.6.7 Maximum train load
The maximum train load permitted by railway infrastructure has a big influence on the efficiency of rail freight services. Furthermore, the max. train weight can be further restricted
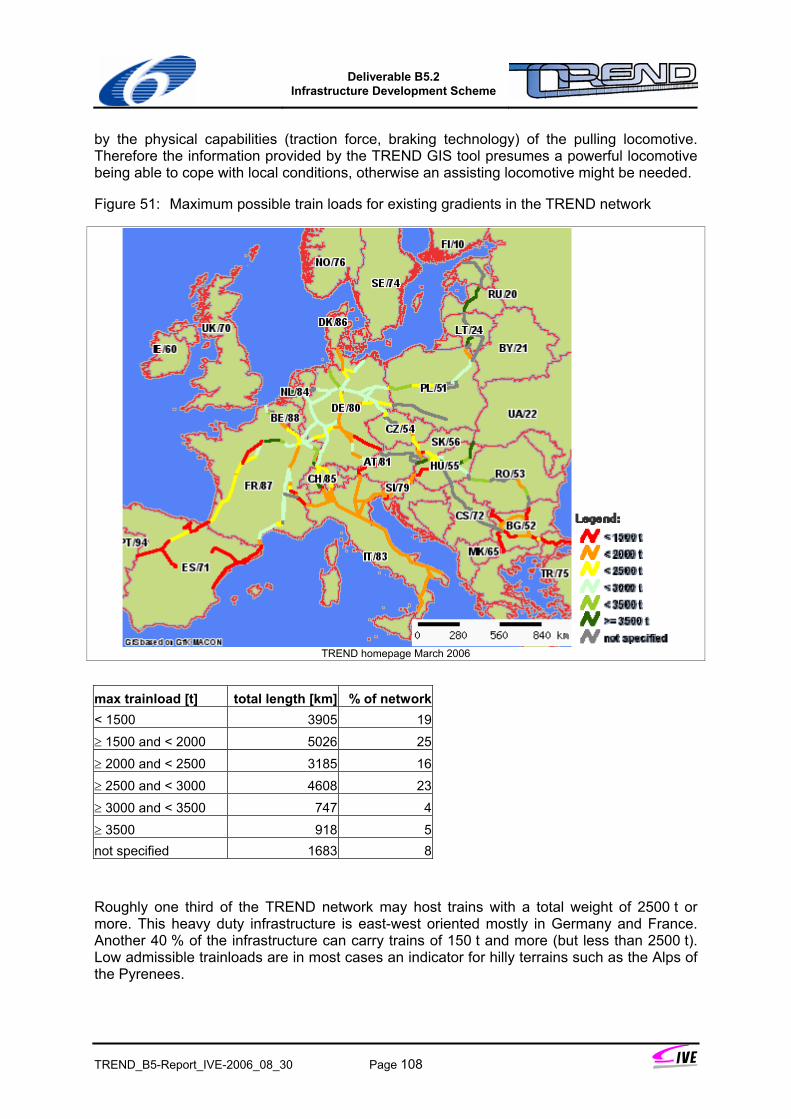
Deliverable B5.2
Infrastructure Development Scheme
TREND_B5-Report_IVE-2006_08_30 Page 108
by the physical capabilities (traction force, braking technology) of the pulling locomotive. Therefore the information provided by the TREND GIS tool presumes a powerful locomotive being able to cope with local conditions, otherwise an assisting locomotive might be needed.
Figure 51: Maximum possible train loads for existing gradients in the TREND network
TREND homepage March 2006
max trainload [t] total length [km] % of network< 1500 3905 19≥ 1500 and < 2000 5026 25≥ 2000 and < 2500 3185 16≥ 2500 and < 3000 4608 23≥ 3000 and < 3500 747 4≥ 3500 918 5not specified 1683 8
Roughly one third of the TREND network may host trains with a total weight of 2500 t or more. This heavy duty infrastructure is east-west oriented mostly in Germany and France. Another 40 % of the infrastructure can carry trains of 150 t and more (but less than 2500 t). Low admissible trainloads are in most cases an indicator for hilly terrains such as the Alps of the Pyrenees.
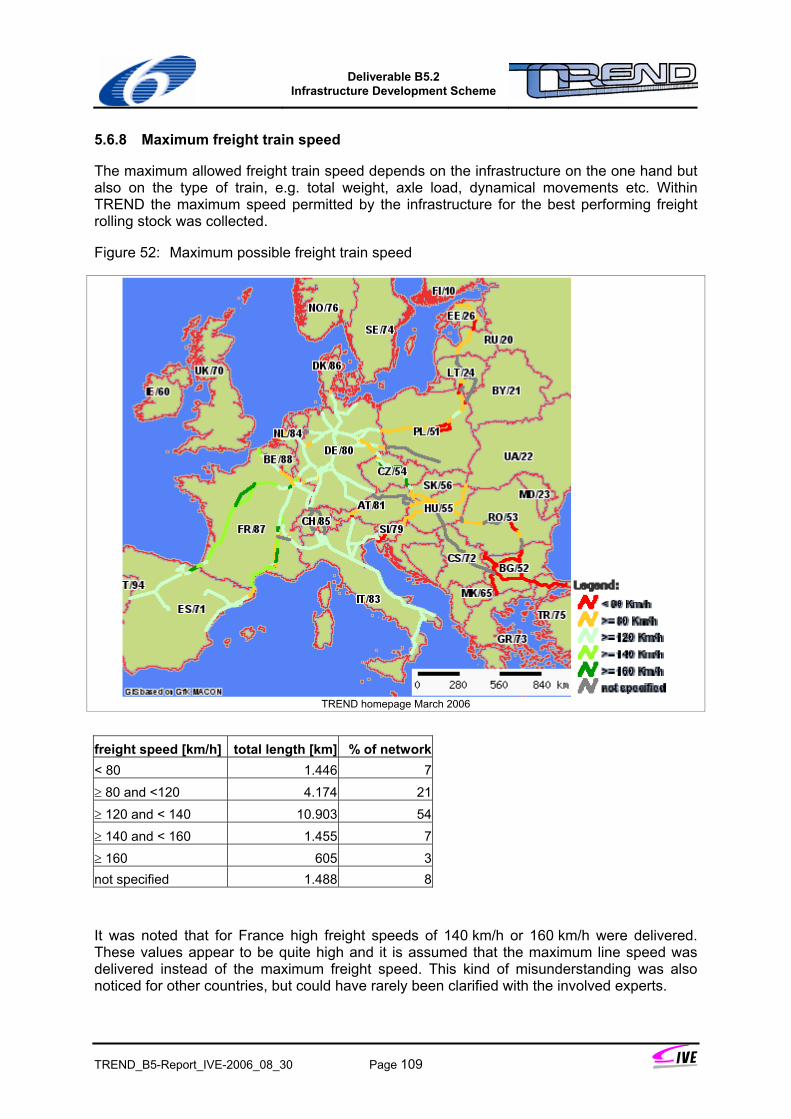
Deliverable B5.2
Infrastructure Development Scheme
TREND_B5-Report_IVE-2006_08_30 Page 109
5.6.8 Maximum freight train speed
The maximum allowed freight train speed depends on the infrastructure on the one hand but also on the type of train, e.g. total weight, axle load, dynamical movements etc. Within TREND the maximum speed permitted by the infrastructure for the best performing freight rolling stock was collected.
Figure 52: Maximum possible freight train speed
TREND homepage March 2006
freight speed [km/h] total length [km] % of network< 80 1.446 7≥ 80 and <120 4.174 21≥ 120 and < 140 10.903 54≥ 140 and < 160 1.455 7≥ 160 605 3not specified 1.488 8
It was noted that for France high freight speeds of 140 km/h or 160 km/h were delivered. These values appear to be quite high and it is assumed that the maximum line speed was delivered instead of the maximum freight speed. This kind of misunderstanding was also noticed for other countries, but could have rarely been clarified with the involved experts.
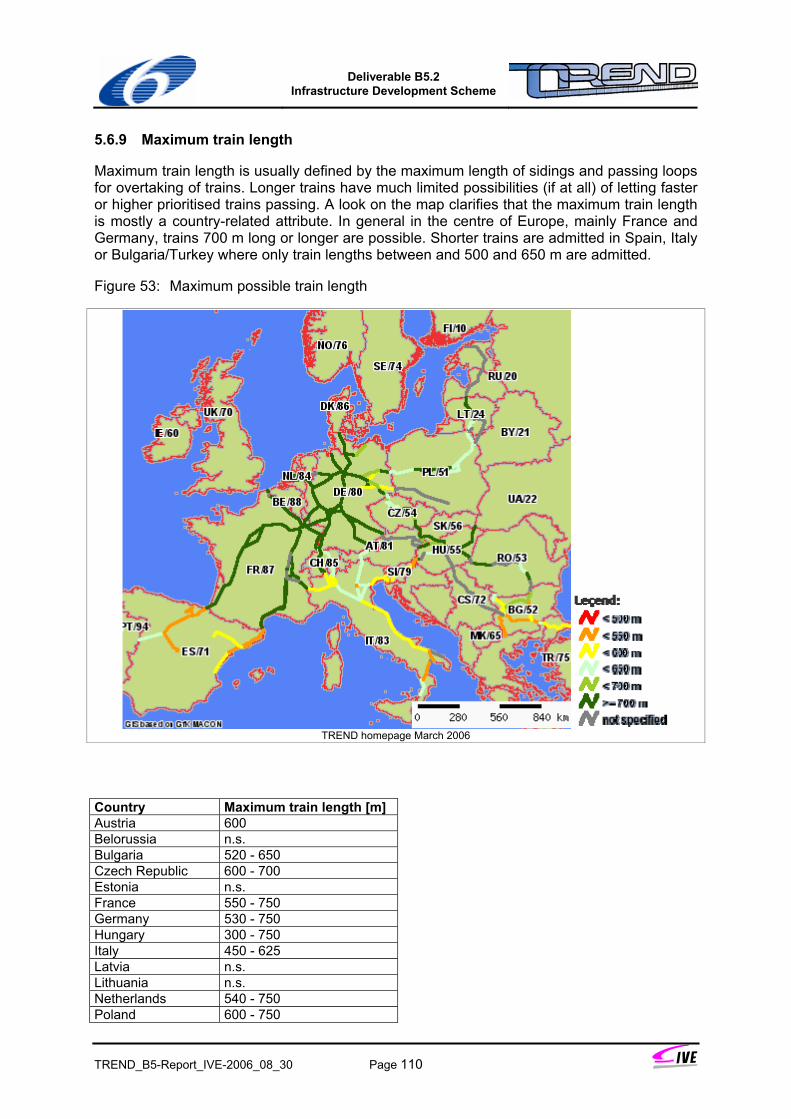
Deliverable B5.2
Infrastructure Development Scheme
TREND_B5-Report_IVE-2006_08_30 Page 110
5.6.9 Maximum train length
Maximum train length is usually defined by the maximum length of sidings and passing loops for overtaking of trains. Longer trains have much limited possibilities (if at all) of letting faster or higher prioritised trains passing. A look on the map clarifies that the maximum train length is mostly a country-related attribute. In general in the centre of Europe, mainly France and Germany, trains 700 m long or longer are possible. Shorter trains are admitted in Spain, Italy or Bulgaria/Turkey where only train lengths between and 500 and 650 m are admitted.
Figure 53: Maximum possible train length
TREND homepage March 2006
Country Maximum train length [m] Austria 600 Belorussia n.s. Bulgaria 520 - 650 Czech Republic 600 - 700 Estonia n.s. France 550 - 750 Germany 530 - 750 Hungary 300 - 750 Italy 450 - 625 Latvia n.s. Lithuania n.s. Netherlands 540 - 750 Poland 600 - 750
Deliverable B5.2
Infrastructure Development Scheme
TREND_B5-Report_IVE-2006_08_30 Page 111
Country Maximum train length [m] Romania* 600 – 700 Serbia-Montenegro* 500 - 600 Slovakia 645 - 750 Slovenia 500 - 597 Spain 500 - 600 Switzerland 600 - 750 Turkey 550 * ERIM data; n.s. = not specified
The table above lists general country specific values for train lengths. For Romania and Serbia-Montenegro, data were adopted from ERIM as they could not be produced in TREND. For Belorussia, Latvia and Lithuania all information concerning maximum train length is missing.
Regarding the overall TREND network, the operation of 500 m long trains causees no problems. None of the countries provides for the operation trains equal to or longer than 700 m all across their national networks. There are always restrictions.
5.6.10 Safety systems
A big variety of safety/signalling systems exists within the TREND network. Safety systems can be clustered into warning stop systems, discrete speed supervision, and continuous speed supervision as this was done within the ERIM project. This approach was not adopted for TREND because the problem of lacking interoperability also exists between different safety systems of one category.
More than 22 different safety systems exist in Europe. many of the are represented across the TREND network.
Deliverable B5.2
Infrastructure Development Scheme
TREND_B5-Report_IVE-2006_08_30 Page 112
Figure 54: Safety systems
TREND homepage March 2006
5.6.11 Energy systems
Six safety/signalling systems are represented across the TREND network. Furthermore diesel traction is widely practiced, providing the operator with a high independency from the electric current systems provided but restricting tractive power and train weights.
Deliverable B5.2
Infrastructure Development Scheme
TREND_B5-Report_IVE-2006_08_30 Page 113
Figure 55: Energy systems in TREND network
TREND homepage March 2006
energy system total length [km] % of networkDC 3,3 kV 4 >1DC 3,0 kV 8.171 41DC 1,5 kV 129 1AC 15 kV, 16,7 Hz 5.634 28AC 25 kV, 50 Hz 3.916 20AC 27,6 kV 298 1Diesel 1.082 5not specified 837 4
The most frequently used energy systems are:
• direct current DC 3,0 kV on 41 % of the TREND routes,
• alternating current AC 15 kV, 16,7 Hz on 28 % of the TREND routes, and
• alternating current AC 25 kV, 50 Hz on 20 %.
High AC voltages advantage powerful locomotives for heavy duty rail services.
Deliverable B5.2
Infrastructure Development Scheme
TREND_B5-Report_IVE-2006_08_30 Page 114
5.6.12 Network load and capacity
Existing railway traffic on TREND network
For the development of infrastructure it is important to know, how much traffic is operated over a particular infrastructure. The collected traffic data which were provided by WP B2 is based on the year 2003. Traffic load is measured in trains per day (per 24 hours) in both directions together. If only annual figures are available, the daily traffic load is calculated by dividing the annual number of trains by 365 day unless there are local limitations of operation.
However, a different clustering approach was pursued in ERIM and TREND. In TREND, train types are distinguished by long-distance and regional passenger trains and intermodal and other freight trains. ERIM displays national and international passenger and freight trains. Hence, only the total amounts of passenger and freight trains in both projects can be compared. The reason are different data sources.
The focus of TREND is rail freight traffic. However, to evaluate overall and free capacity of railway routes, passenger services have to be taken into consideration because they consume capacity which is not available for freight traffic.
Figure 56: Number of passenger trains per day
TREND homepage March 2006
Deliverable B5.2
Infrastructure Development Scheme
TREND_B5-Report_IVE-2006_08_30 Page 115
passenger train paths per day on track sections [km] % of network <50 5.986 30 ≥ 50; < 100 7.429 37 ≥ 100; < 150 1.809 9 ≥ 150; < 200 949 5 ≥ 200; < 250 576 3 ≥ 250; < 300 182 1 ≥ 300; < 350 26 0 ≥ 350 76 0 not specified 3.037 15
On less than one third of the network (30 %), less than 50 passenger trains operate per day. On more than one third of the network (37 %) between 50 and 100 passenger services were counted. More than a sixth of TREND network (17 %) carries between 100 and 250 passenger trains. For 15 % of the network no passenger traffic figures were provided.
The operational situation is very heterogeneous across the network. Therefore the figures presented here and further down the text may only serve as an indication for the utilisation of capacity. Especially interferences between passenger and freight services heavily influence operational quality and capacity issues.
Figure 57: Number of freight trains per day
TREND homepage March 2006
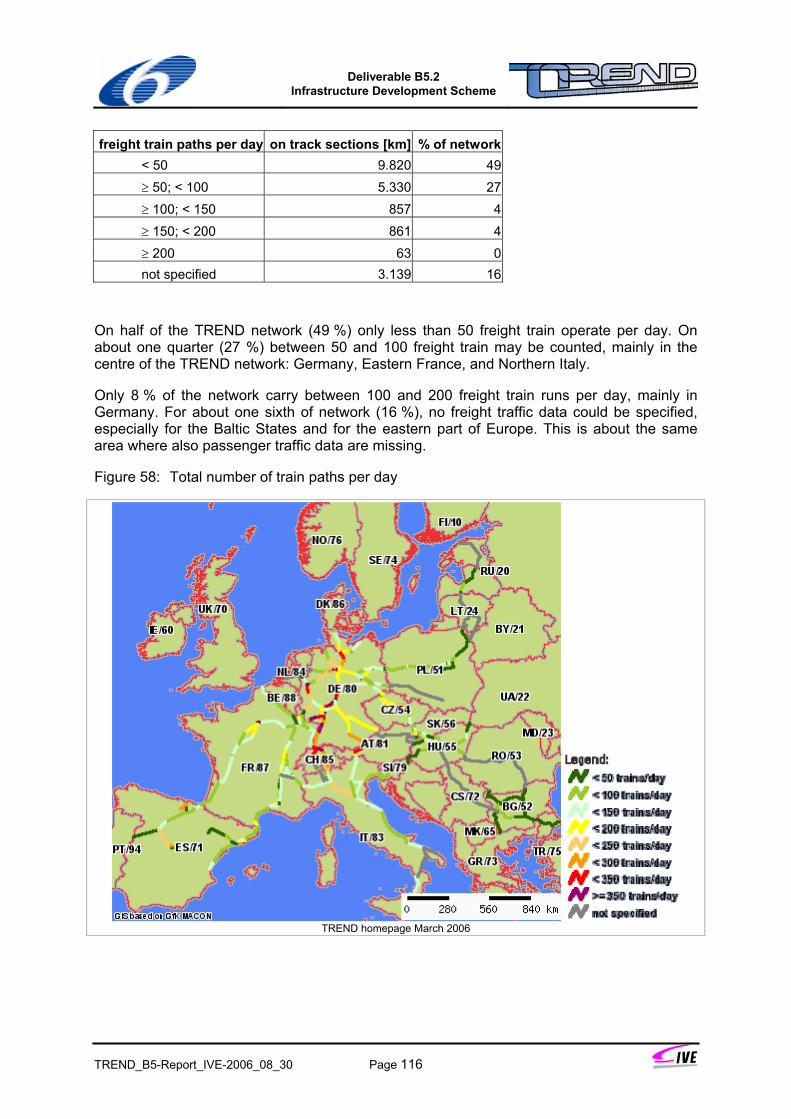
Deliverable B5.2
Infrastructure Development Scheme
TREND_B5-Report_IVE-2006_08_30 Page 116
freight train paths per day on track sections [km] % of network < 50 9.820 49 ≥ 50; < 100 5.330 27 ≥ 100; < 150 857 4 ≥ 150; < 200 861 4 ≥ 200 63 0 not specified 3.139 16
On half of the TREND network (49 %) only less than 50 freight train operate per day. On about one quarter (27 %) between 50 and 100 freight train may be counted, mainly in the centre of the TREND network: Germany, Eastern France, and Northern Italy.
Only 8 % of the network carry between 100 and 200 freight train runs per day, mainly in Germany. For about one sixth of network (16 %), no freight traffic data could be specified, especially for the Baltic States and for the eastern part of Europe. This is about the same area where also passenger traffic data are missing.
Figure 58: Total number of train paths per day
TREND homepage March 2006
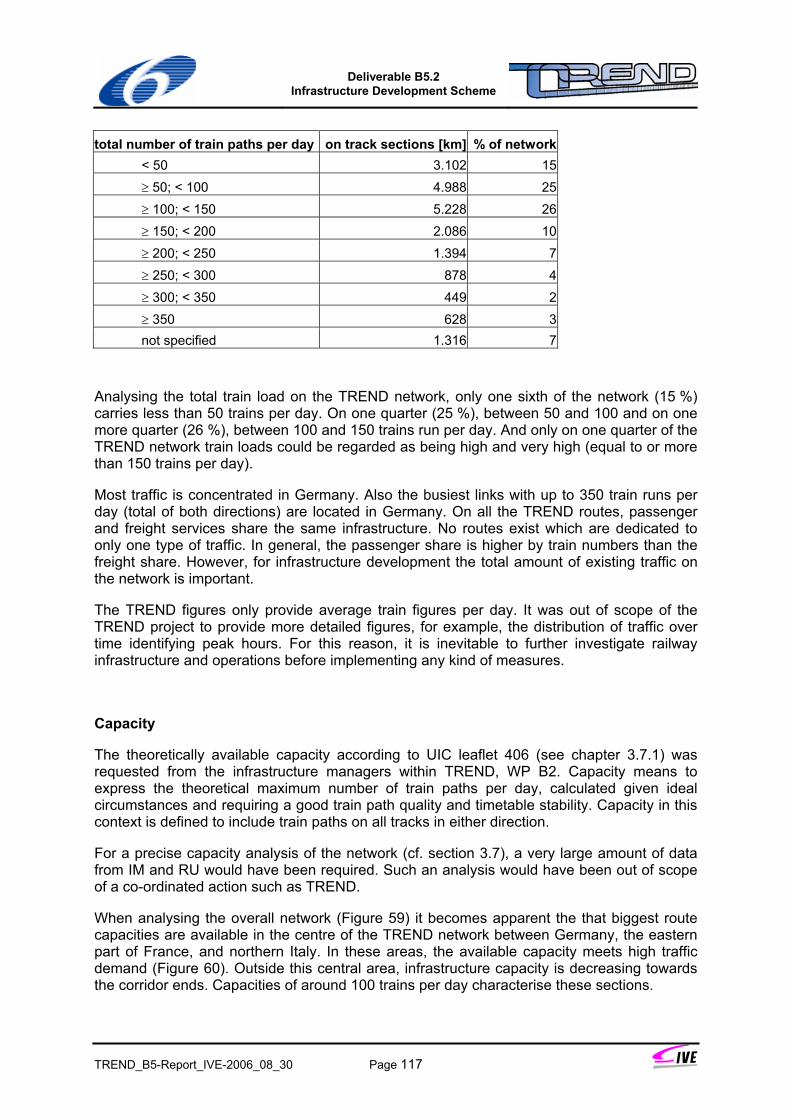
Deliverable B5.2
Infrastructure Development Scheme
TREND_B5-Report_IVE-2006_08_30 Page 117
total number of train paths per day on track sections [km] % of network < 50 3.102 15 ≥ 50; < 100 4.988 25 ≥ 100; < 150 5.228 26 ≥ 150; < 200 2.086 10 ≥ 200; < 250 1.394 7 ≥ 250; < 300 878 4 ≥ 300; < 350 449 2 ≥ 350 628 3 not specified 1.316 7
Analysing the total train load on the TREND network, only one sixth of the network (15 %) carries less than 50 trains per day. On one quarter (25 %), between 50 and 100 and on one more quarter (26 %), between 100 and 150 trains run per day. And only on one quarter of the TREND network train loads could be regarded as being high and very high (equal to or more than 150 trains per day).
Most traffic is concentrated in Germany. Also the busiest links with up to 350 train runs per day (total of both directions) are located in Germany. On all the TREND routes, passenger and freight services share the same infrastructure. No routes exist which are dedicated to only one type of traffic. In general, the passenger share is higher by train numbers than the freight share. However, for infrastructure development the total amount of existing traffic on the network is important.
The TREND figures only provide average train figures per day. It was out of scope of the TREND project to provide more detailed figures, for example, the distribution of traffic over time identifying peak hours. For this reason, it is inevitable to further investigate railway infrastructure and operations before implementing any kind of measures.
Capacity
The theoretically available capacity according to UIC leaflet 406 (see chapter 3.7.1) was requested from the infrastructure managers within TREND, WP B2. Capacity means to express the theoretical maximum number of train paths per day, calculated given ideal circumstances and requiring a good train path quality and timetable stability. Capacity in this context is defined to include train paths on all tracks in either direction.
For a precise capacity analysis of the network (cf. section 3.7), a very large amount of data from IM and RU would have been required. Such an analysis would have been out of scope of a co-ordinated action such as TREND.
When analysing the overall network (Figure 59) it becomes apparent the that biggest route capacities are available in the centre of the TREND network between Germany, the eastern part of France, and northern Italy. In these areas, the available capacity meets high traffic demand (Figure 60). Outside this central area, infrastructure capacity is decreasing towards the corridor ends. Capacities of around 100 trains per day characterise these sections.
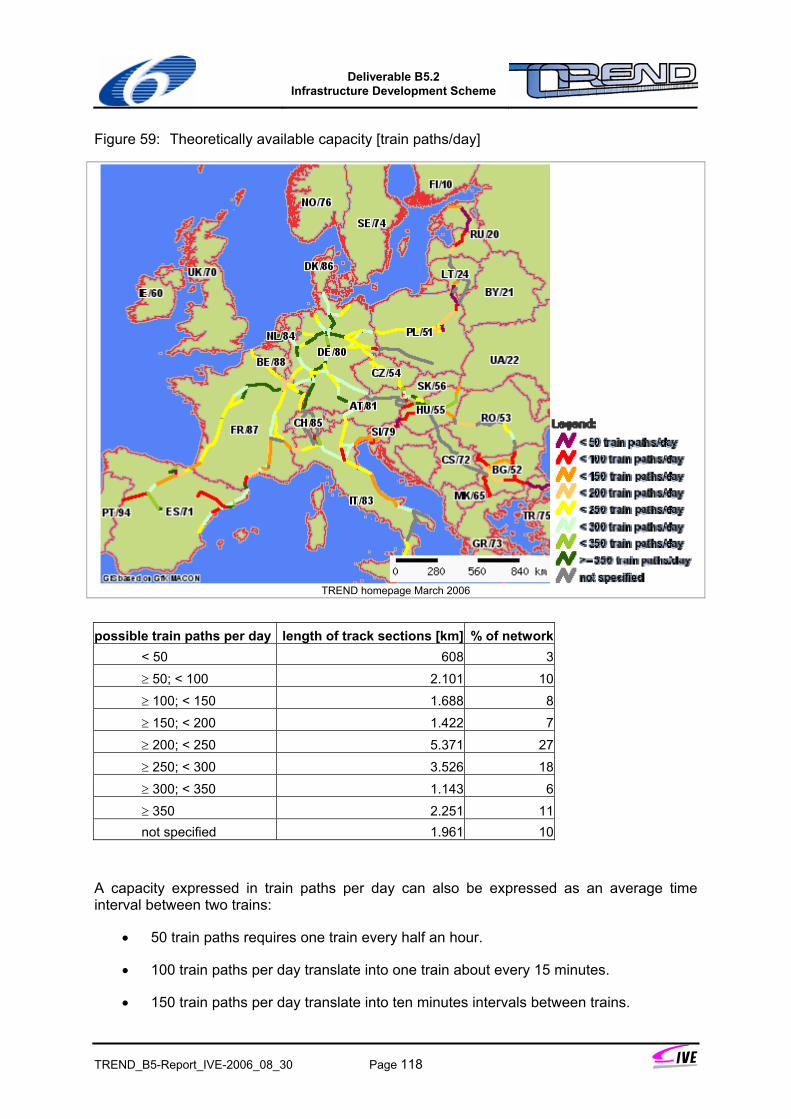
Deliverable B5.2
Infrastructure Development Scheme
TREND_B5-Report_IVE-2006_08_30 Page 118
Figure 59: Theoretically available capacity [train paths/day]
TREND homepage March 2006
possible train paths per day length of track sections [km] % of network < 50 608 3 ≥ 50; < 100 2.101 10 ≥ 100; < 150 1.688 8 ≥ 150; < 200 1.422 7 ≥ 200; < 250 5.371 27 ≥ 250; < 300 3.526 18 ≥ 300; < 350 1.143 6 ≥ 350 2.251 11 not specified 1.961 10
A capacity expressed in train paths per day can also be expressed as an average time interval between two trains:
• 50 train paths requires one train every half an hour.
• 100 train paths per day translate into one train about every 15 minutes.
• 150 train paths per day translate into ten minutes intervals between trains.
Deliverable B5.2
Infrastructure Development Scheme
TREND_B5-Report_IVE-2006_08_30 Page 119
• A capacity of 300 trains per day allow a train every five minutes in average. This is comparable to an urban passenger rail traffic system.
As traffic flows are not constant and peak traffic hours occur usually twice a day, the actual capacity might be less than the calculated average one to provide an appropriate timetable stability. Adjacent railway lines with an inappropriate capacity and railway nodes can also reduce the actual capacity of a line.
Figure 60: Additional available train paths per day when considering existing traffic
TREND homepage March 2006
Additional available train paths per day on total length of track sections [km] % of network < 0 685 3 < 50 3.966 20 ≥ 50; < 100 4.818 24 ≥ 100; < 150 4.172 21 ≥ 150; < 200 1.659 8 ≥ 200; < 250 904 5 ≥ 250; < 300 243 1 ≥ 300; < 350 209 1 ≥ 350 72 0 not specified 3.343 17
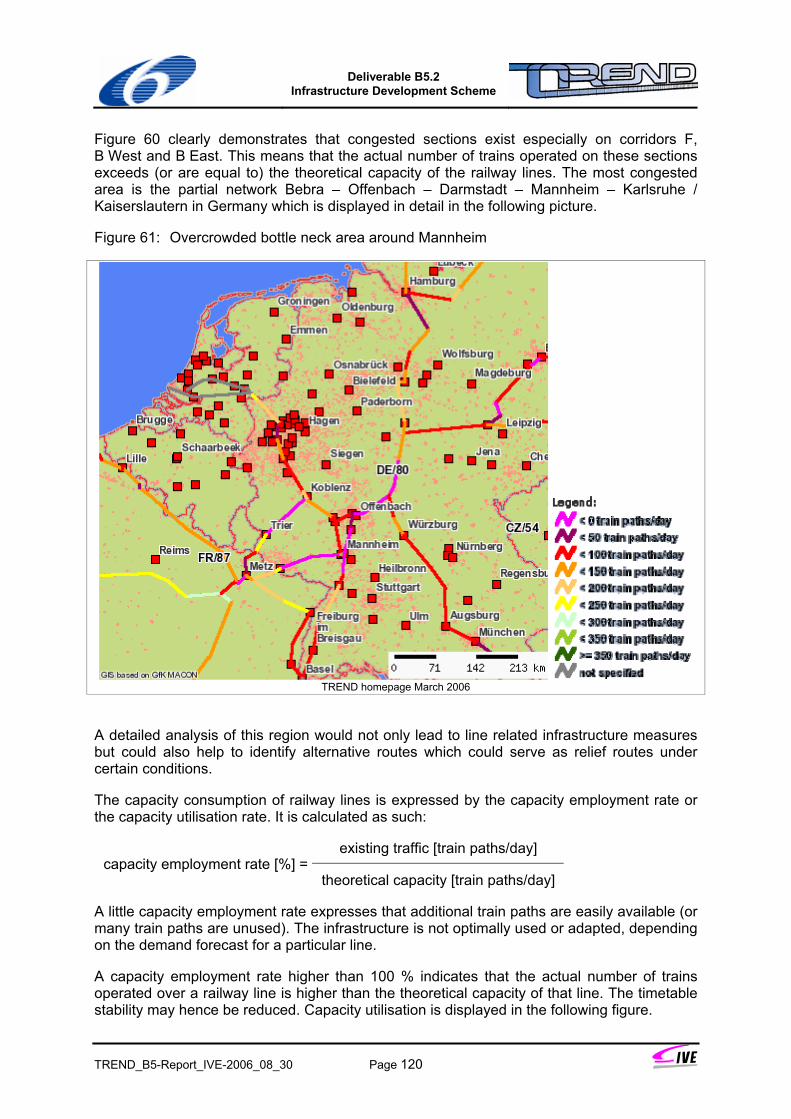
Deliverable B5.2
Infrastructure Development Scheme
TREND_B5-Report_IVE-2006_08_30 Page 120
Figure 60 clearly demonstrates that congested sections exist especially on corridors F, B West and B East. This means that the actual number of trains operated on these sections exceeds (or are equal to) the theoretical capacity of the railway lines. The most congested area is the partial network Bebra – Offenbach – Darmstadt – Mannheim – Karlsruhe / Kaiserslautern in Germany which is displayed in detail in the following picture.
Figure 61: Overcrowded bottle neck area around Mannheim
TREND homepage March 2006
A detailed analysis of this region would not only lead to line related infrastructure measures but could also help to identify alternative routes which could serve as relief routes under certain conditions.
The capacity consumption of railway lines is expressed by the capacity employment rate or the capacity utilisation rate. It is calculated as such:
existing traffic [train paths/day] capacity employment rate [%] =
theoretical capacity [train paths/day]
A little capacity employment rate expresses that additional train paths are easily available (or many train paths are unused). The infrastructure is not optimally used or adapted, depending on the demand forecast for a particular line.
A capacity employment rate higher than 100 % indicates that the actual number of trains operated over a railway line is higher than the theoretical capacity of that line. The timetable stability may hence be reduced. Capacity utilisation is displayed in the following figure.
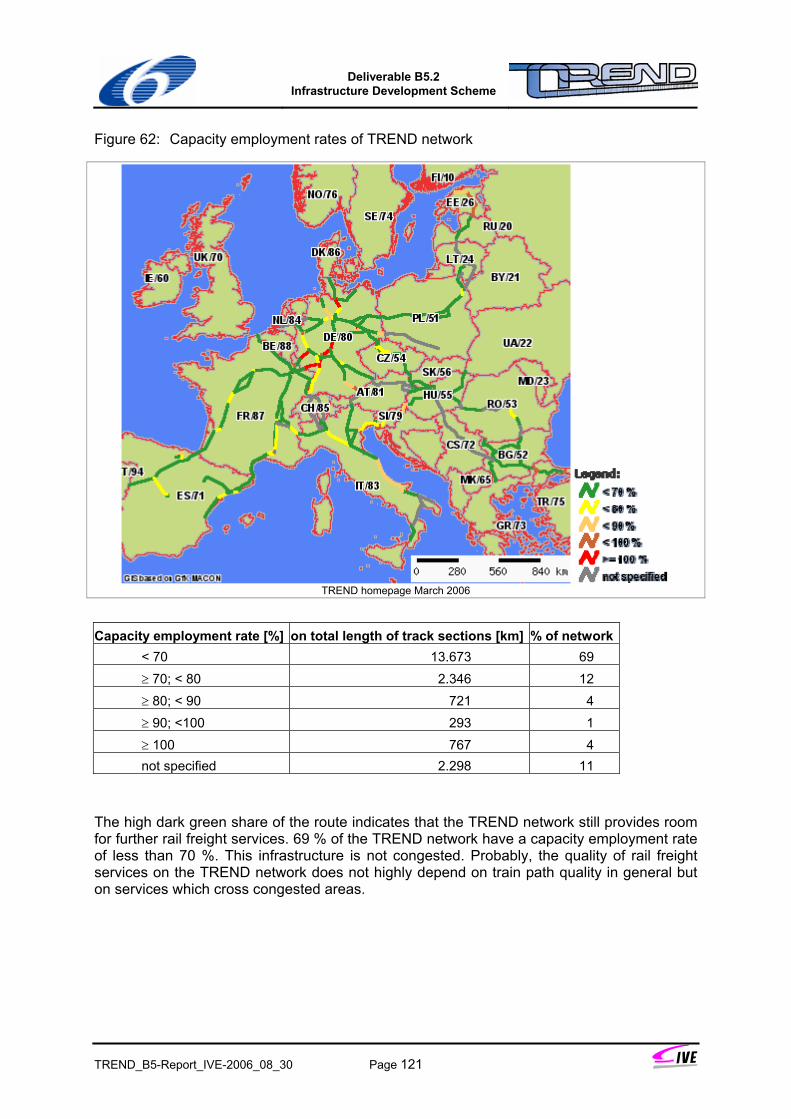
Deliverable B5.2
Infrastructure Development Scheme
TREND_B5-Report_IVE-2006_08_30 Page 121
Figure 62: Capacity employment rates of TREND network
TREND homepage March 2006
Capacity employment rate [%] on total length of track sections [km] % of network < 70 13.673 69 ≥ 70; < 80 2.346 12 ≥ 80; < 90 721 4 ≥ 90; <100 293 1 ≥ 100 767 4 not specified 2.298 11
The high dark green share of the route indicates that the TREND network still provides room for further rail freight services. 69 % of the TREND network have a capacity employment rate of less than 70 %. This infrastructure is not congested. Probably, the quality of rail freight services on the TREND network does not highly depend on train path quality in general but on services which cross congested areas.
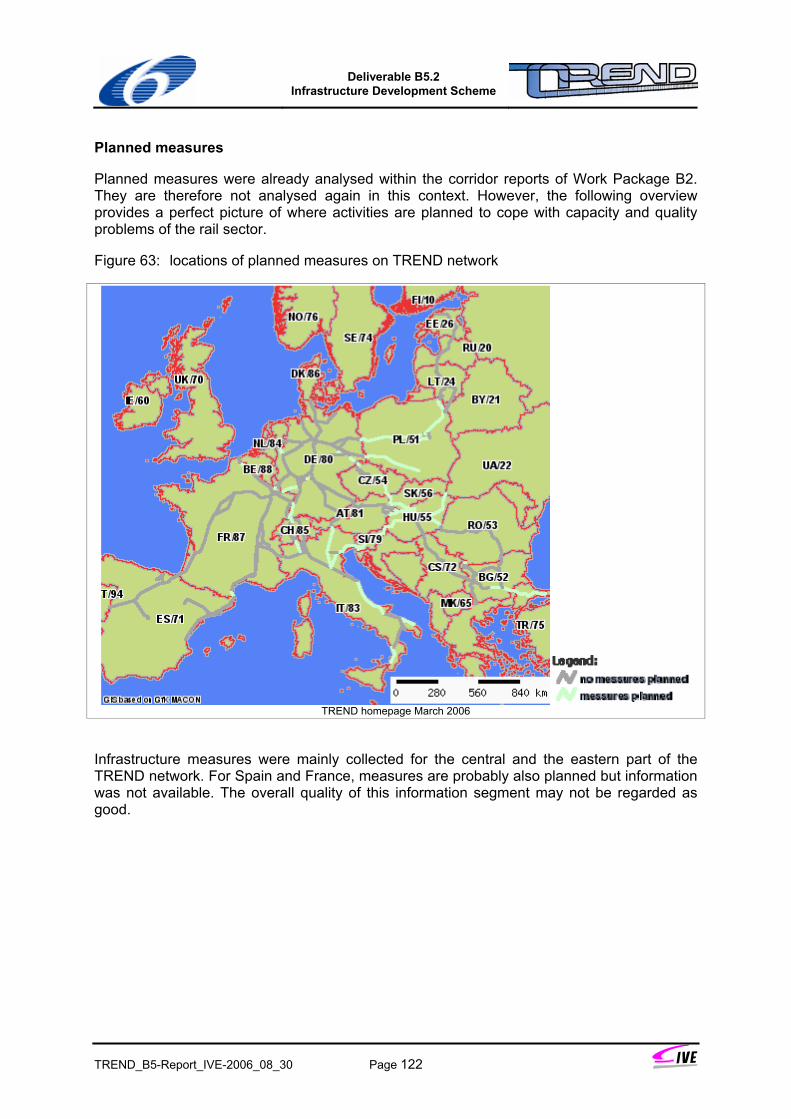
Deliverable B5.2
Infrastructure Development Scheme
TREND_B5-Report_IVE-2006_08_30 Page 122
Planned measures
Planned measures were already analysed within the corridor reports of Work Package B2. They are therefore not analysed again in this context. However, the following overview provides a perfect picture of where activities are planned to cope with capacity and quality problems of the rail sector.
Figure 63: locations of planned measures on TREND network
TREND homepage March 2006
Infrastructure measures were mainly collected for the central and the eastern part of the TREND network. For Spain and France, measures are probably also planned but information was not available. The overall quality of this information segment may not be regarded as good.
Deliverable B5.2
Infrastructure Development Scheme
TREND_B5-Report_IVE-2006_08_30 Page 123
6 Results
Work package B5 focuses on a methodology for the evaluation and development of European railway infrastructure, the Infrastructure Development Scheme (IDS). A technical instrument was required to perform the necessary evaluations of the infrastructure network and to test new forms of information provision for a particular group of railway market players. The GIS30-based information tool was therefore included in this work package. Both aspects of this work package are summarised in this chapter and the most important results are presented.
6.1 Infrastructure development scheme
Seamless travel of trains across borders face a huge number of organisational and technical obstacles, preventing this environmentally mode from prospering comparably to overall transport growth rates. The creation of a harmonised European Railway Area (ERA) is hence one of the European transport policy topics. The Community policy of the last fifteen years has initiated change in many organisational structures. Nevertheless, railway infrastructure, being a very slow-changing asset, still hampers cross-border services as signalling, electrification, gauges, and many more parameters vary significantly from country to country and sometimes even within countries.
The TREND project therefore proposed already in 2003 a new approach to rail infrastructure development, focussing on selected, most heavily used rail transport corridors. The technical infrastructure and the organisational structures were intended to be developed along these corridors to provide maximum benefit to international railway services at least investment cost. The results of this approach are described hereinafter.
In 2005, the railway industry and policy makers, namely the European Commission, have agreed on a similar strategy to bundle efforts and promote rail as a more efficient transport system. Almost in parallel, UIC, supported by the European railways and their representatives, namely CER and EIM, developed the European Rail Infrastructure Master Plan (ERIM). As UIC was involved in both TREND and ERIM, cross references are no coincidence.
Approach
Given the overthrow of the railway markets in the last decade, the report first closely examines the framework for rail infrastructure development in the European Union. The analysis addresses the legal framework, the relevant stakeholders, as well as current activities at European level in this respect. The last part focuses on the joint activities of the European Commission and the railway associations as from 2004 (‘Memorandum of understanding’). The European approach to rail interoperability is presented.
The methodologies for rail infrastructure evaluation are addressed in a further section of the report, focussing on the technical evaluation of railway infrastructure. This is to identify an appropriate approach for the evaluation of railway infrastructure at European level. As it was
30 GIS: geographic information system
Deliverable B5.2
Infrastructure Development Scheme
TREND_B5-Report_IVE-2006_08_30 Page 124
out of scope of the TREND project to elaborate an economical evaluation of railway infrastructure, the analysis was restricted to planning approaches.
The railway infrastructure to be analysed needed to be mirrored against a quality target. The benchmarks where hence set by defining the requirements of railway undertakings (users), whishing to operate cost efficient services to be successful on the market. As the efficiency of services is not only restricted by stops at border crossings due to changing infrastructure parameters, the requirements also include parameters influencing for example the maximum allowable length and weight of trains. Six model trains are defined, varying especially the maximum length and weight of consists.
Already in TREND work package 2 were defined the corridors to be respected in the overall TREND analysis. The definition is based on expert opinions from national infrastructure managers and to a smaller extent on the opinions of rail freight operators. The approach for the definition was a qualified estimation on which parts of the network international rail freight services will be mainly operated in 2010. The preconditions for the selection of the corridors were that they should cover the most frequented railway links including important deviations and important installations such as shunting yards and intermodal terminals.
The network analysis, applying the TREND GIS-tool, demonstrates in a first step the practicability of the tool and visualises the overall TREND network. The quality of railway infrastructure in place is demonstrated and quality slumps become easily evident. The second step applies the user requirements to the TREND network and elaborates to which extent the current infrastructure responds to the requirements.
Results network analysis
The TREND network analysis consists of three parts:
1. The corridor reports elaborated in work package B2. This detailed analysis is based on a corridor-by-corridor approach and includes an analysis of constraints and other deficits. The action plans developed in work package B2 are again part of this report.
2. A visualisation of the TREND network differs between the various parameters respected in the TREND evaluation and provides a concise mirror image of the current status of the infrastructure by parameter. For each parameter investigated a map is presented in the report and an analysis of the shares of quality levels is provided.
3. The compliance of the TREND network with market requirements was investigated by applying a set of parameters to the corridor network, corresponding to the parameters of intermodal trains performing competitive rail services.
The results from the corridor reports are not presented at this point again as they were discussed in the WP 2 report already. Readers are therefore requested to check the WP 2 report for further reference.
The most important results of the analysis applying the GIS tool (visualisation) shall be summarised in the following. For the maps and figures please refer to the full presentation in the report.
1. The weakest link, meaning the section of a train route with the most restricting parameter value, may be decisive for the successful operation of a train. It may prevent a train from operating at all or with maximum efficiency. Knowing the
Deliverable B5.2
Infrastructure Development Scheme
TREND_B5-Report_IVE-2006_08_30 Page 125
specific train parameter for a particular service, any train operator may easily analyse a route chosen for the service. The coloured presentation provides a concise overview. A detailed presentation is possible, down to a single link of the network.
2. Technical parameters such as type of electrification, control-command and signalling technology, and rail gauge are usually known to the railway undertakings. They are nevertheless displayed for completeness and consistency. The largest variety in network characteristics is found in the sector control-command and signalling systems.
3. Market related parameters include allowable train length, allowable speed and weight of freight trains, UIC line categories, the intermodal loading gauge and the UIC loading gauge. These parameters are much more important for the design and marketing of a new or expanded rail service. The route information is complemented by the location of shunting yards, intermodal terminals, and border stations.
4. The TREND tool also provides information about line capacity and line occupation. A comparison allows a rough capacity analysis which is also provided. Railway undertakings should be aware, that the information provided may only be regarded as an indication. Due to the complexity of timetabling and train path construction no guarantee may be given regarding the availability of capacity unless a train path request is confirmed by the infrastructure managers involved. The number of tracks provided on a particular route is probably of lesser importance to railway undertakings.
The analysis of the TREND network with regard to compliance of the TREND network with market requirements may be described as being rather disillusioning. The analysis is based on a virtual operation of a set of model trains through the TREND network. The infrastructure quality is substantiated by the following figures:
• Only Germany provides railway infrastructure to host all model trains defined by the TREND project. Apart from Germany, only France, the Czech Republic, and Spain provide railway infrastructure at all to operate some of the trains defined.
• Between 16 % and 37 % of the TREND network comply with the requirements of the trains defined.
• Very significant restrictions are imposed by the allowable train speed. A maximum speed of 120 km/h is only admitted on 66 % of the network, restrictions being significantly higher for trains 140 km/h fast. In Eastern Europe maximum line speeds of only 80 km/h can often be reached.
• The lack of 700 m sidings causes significant limitations to the operation of efficient train services as well. 700 m long trains are only admitted in the centre of the TREND network to roughly only half the network.
• Heavy trains of up to 1 800 t run are largely denied operation on some outer braches of the network.
• The intermodal loading gauge P/C 400 is not available on one third of the TREND network, especially causing problems in France and Switzerland which are transit countries.
Deliverable B5.2
Infrastructure Development Scheme
TREND_B5-Report_IVE-2006_08_30 Page 126
Results of the application of the TREND methodology
The following results shall be pointed out as a result of this work package:
1. The corridor approach pursued in the TREND project and agreed by the Commission and the railway associations (MoU, see section 3.6.1) is a suitable approach to analysing and further developing the interoperable European railway network. Starting from a core network of significant railway corridors the overall network can be gradually converted into an interoperable rail network were economically justified and required by the users.
2. In the European Union exist a significant number of stakeholders and numerable instruments and procedures to discuss and further develop railway infrastructure at European level. Among them is the European Rail Infrastructure Master Plan which is currently established for the first time. They stand vis-à-vis the national stakeholders and planning instruments easily loosing the European perspective, focussing only on truly national projects.
3. The methodology applied in the TREND project is similar to the one applied for the current elaboration of the European Rail Infrastructure Master Plan. A synthesis of both project methodologies and results may serve as a basis for the implementation of a sustainable and continuous planning process.
4. European rail infrastructure planning therefore requires a more formal framework and the full support of the major players, especially the infrastructure managers playing a double role both at national and European level.
5. In medium-term, a more sophisticated methodology is to be implemented to raise planning efficiency and to improve the quality of planning results. This calls for the provision of a European infrastructure database and the application of state-of-the-art planning tools (see below for decision support system / tool) also allowing for cross-border infrastructure evaluation.
6. Due to international (cross-border) processes, a practical application of the IDS furthermore requires:
early involvement of all relevant stakeholders;
clear commitment of the infrastructure managers;
clearly defined competences;
development of stringent, accepted processes.
The following two problems arising with data collection should be mentioned in this context: Firstly, infrastructure data available with the infrastructure managers have proven to vary widely in quality, a problem reported also earlier in this report. Secondly, a non-ambiguous identification of stations and other operational nodes such as junctions is difficult in a multilingual and international environment. Often several names, usually referring to the name of a town, exist for one location. This problem will have certainly been addressed in the context of timetable information systems. It is therefore recommended to come to a common international structure/standard including the definition of aliases.
Deliverable B5.2
Infrastructure Development Scheme
TREND_B5-Report_IVE-2006_08_30 Page 127
6.2 GIS tool
The second focus of WP B5 was the implementation of a GIS-based internet information tool31. Input is based on infrastructure data collected by TREND partners HaCon, KombiConsult, and Groupo Class (WP B2) and provided by the external experts. The selection of the underlying GIS basic software and the database was made basing on a TREND-internal evaluation process.
The tool, which is further described in chapter 5, demonstrates the following applications:
1. Also large infrastructure networks may be displayed with help of internet technology. A high level of detail is possible where required. The number of infrastructure parameters to be displayed is not restricted.
2. The display of network characteristics is possible by selecting particular infrastructure parameters. The identification of bottlenecks or restraints to certain services are only a mouse click away and can contribute valuable support to infrastructure planning processes.
3. The tool allows railway undertakings to easily identify and evaluate opportunities and restraints for the operation of new and modified services.
4. The performance of the tool is not fully exploited yet. Further functions for display and analysis may be added if reliable data would be provided.
The tool was widely tested by TREND developers and users as well as by external experts. The infrastructure corridor data were checked online via the internet tool by the particular experts. Furthermore, the network analysis was, as explained above, also supported by the GIS tool.
31 Access via www.trend-project.com
Deliverable B5.2
Infrastructure Development Scheme
TREND_B5-Report_IVE-2006_08_30 Page 128
7 Recommendations
Despite the vision of a European Railway Area (ERA), the European railway system is still a very heterogeneous one. This is not only true in technical terms but also as regards the support by national governments, related institutions and the infrastructure managers: national perspectives of infrastructure development still prevail the business. Financial support to railway infrastructure from the TEN-T budget has not generated a coherent infrastructure so far although progress becomes visible in some parts. Too many “construction sites” still need to be completed.
With the attempt of developing a European deployment plan for ERTMS there is also a chance of creating a framework for developing railway infrastructure and businesses beyond the implementation of ERTMS. Methodologies developed and applied in the TREND project as well as work undertaken in the ERIM project do not only provide a knowledge base for the evaluation of measures and strategies. They also brought together European actors jointly debating and contributing to the development of European railway infrastructure.
Research and discussion have revealed that a further integration of stakeholders might be required to make best use of expert knowledge. Too many circles and platforms exist today still not joining forces to achieve the vision of a European Railway Area, which clearly stretches far beyond the EU-25 borders.
In the following the recommendations therefore clearly target a better European integration in the railway sector and improved tools to proceed. Recommendations have to be cautious as regards existing communication structures inside the railway sector: such structures may exist already but have not been revealed by TREND investigations.
A European railway core network
The attempt of defining a European railway core network is driven by the plan of implementing an interoperable railway network, characterised by a uniform control-command and signalling system, ERTMS. The corridor approach is certainly correct, providing benefits to the railway undertakings as from the completion of the first ERTMS cross-border route, preventing the implementation of an ERTMS patchwork. The ERTMS core network is then to be extended gradually.
Prior to the ERTMS and ERIM networks, further “core” networks were defined (see section 4.3.2 on standards for international rail freight), addressing commercial factors of rail freight such as loading gauge, axle load, etc. These factors, also being addressed by the TREND and ERIM evaluations, play a paramount role for handling increasing trade volumes with the future European partners and the Far East.
It is therefore recommended
• to gradually integrate railways beyond the EU-25 borders into developing European railway infrastructure; and
• to make use of the preparatory work that has already been performed by other platforms such as those under the umbrella of UNECE (section 4.3.2).
Infrastructure development
Infrastructure development being an original national monopoly requires to adopt international traits in the case of railway infrastructure. This is due to the tight
Deliverable B5.2
Infrastructure Development Scheme
TREND_B5-Report_IVE-2006_08_30 Page 129
interdependencies between vehicles, thus train operations, and railway infrastructure management. Both sectors are marked by the historical national developments which need to be overcome when generating the European Railway Area.
The development initiated by European legislation, set in motion by the Memorandum of Understanding of April 2005 (section 3.6.1) and supported by actions and projects such as the TREND project, provide the opportunity to achieve a breakthrough in developing the European railways.
To ensure a sustainable development in developing the ERA, several conditions need to be fulfilled from the TREND point of view:
• In terms of infrastructure planning, the definition of the various levels of the European railway network and the co-ordination of the implementation of measures need to be lead over into a continuous process. It would not be acceptable if the development of a European Rail Infrastructure Master Plan remained a singular action without follow-up activities including a regular update of the master plan.
• A high transparency of processes and results may improve the perception of European railway problems and task by national stakeholders and politicians. A clear demonstration of the benefits of a European railway, broken down to particular projects, will also improve the acceptance of railway investment.
• Basing on the experiences gained in current activities and the availability of improved statistics and evaluation tools, a refinement of the methodology has to be arranged for. The improved methodology shall also further integrate existing stakeholders and the appraisal of best practices for example at national level or in other industries.
• Better integration of research at European and national level into market and transport processes will contribute to a higher efficiency of research funds. Furthermore, research results will meet the requirements of the industry in a better way.
There are tendencies in some European Member States to integrating more international (European) aspects into transport planning. For example, the new German Logistics Master Plan requests the discussion of international issues. It may be doubted, for the time being, that the Member States will soon agree on the integration of their national transport plans. Nevertheless, there is scope for improving the collaboration of national governments in terms of transport planning. A European transport infrastructure plan shall remain the vision.
Decision and management support
The ERIM project, funded by the UIC member railways, TREND and many other projects being mainly publicly funded, provide a profound knowledge base supporting the planning and evaluation of railway and other transport infrastructure. No attempt is known so far integrating and structuring the results, data and methodologies of all projects performed till date and providing a single platform supporting decision and management in the railway sector.
The results of railway research funded by the European framework research programmes are, for example, widely spread over the internet. The Transport Research Knowledge Centre (TRKC) on the DG TREN website of the European Commission provides a good initial approach providing access to research results. However, results from Commission
Deliverable B5.2
Infrastructure Development Scheme
TREND_B5-Report_IVE-2006_08_30 Page 130
service contracts may not be included. Transport statistics are only available separately if at all, for example for intermodal transport.
TREND therefore recommends the implementation of a decision support system covering railway infrastructure aspects, for example regarding the implementation of TSIs, and railway markets and operations to a certain extent. The system shall support the continuous monitoring of railway infrastructure as well as market development, especially of the rail freight market. It shall allow to identify market requirements, opportunities and restrictions. The tool shall support European as well as national policy making especially in the field of transport infrastructure development. A further prime objective of the proposed system will be the increase in transparency of processes and results.
The decision support system shall correspond to the following main characteristics or to a relevant subset, as the system may be gradually enhanced:
• GIS-based information system supporting display and analysis of data;
• Database and database management for (at least) the following data:
railway infrastructure (lines/routes) including parameters to be defined;
significant installations such as marshalling yards and terminals;
transport demand (trans-shipments, o/d-based, etc.).
Several moments in time shall be presentable;
• Integration of the knowledge base, for example country specific. Data may be linked to the GIS system or be accessible via a catalogue. Mind maps may support orientation;
• Access rights manager for assigning public and internal access to data and use of functions;
• Display of infrastructure and related data (example: TREND GIS tool). Enhanced selection functions such as by country, by region, core/complete network etc. Local and internet-based applications for display and analysis;
• Comparison of various variants (infrastructure scenario, moments in time) and further analysis tools such as route search functions or bottleneck identification for model trains: technical train data as input, allowable route or infrastructure restraints as output.
• Export functions for results (Excel® sheets, CSV tables etc.).
The system may be operated by or on behalf of the European Railway Agency. Tasks will encompass at least the following points:
• guaranteeing technical availability and functionality;
• timely update of data;
• management of user rights;
• co-ordination of enhancement of methodology and tool;
Deliverable B5.2
Infrastructure Development Scheme
TREND_B5-Report_IVE-2006_08_30 Page 131
• execution of tool updates and testing;
• public display of content and results. Non-public content and functions shall be agreed by the European Commission together with the relevant stakeholders.
The last point of the list shall promote a public and European-wide internet-based railway infrastructure database for railway undertakings seeking support for their business development. This aspect is further discussed in the next section.
Data collection and data handling
Traditionally, the (former) national railways and today the infrastructure managers descending from those organisations are in charge of planning and developing railway infrastructure. Depending on the (political) perspective, they more or less fulfil parastatal tasks with a significant impact on public welfare and budgets. In this context, IMs are also responsible for the collection, updating, and quality assurance of infrastructure data.
Practical applications have proven that data collection and storage of European railway infrastructure at microscopic level are easy to handle. Many central European railways (Austria, Germany and Denmark just to name a few) already provide a sophisticated infrastructure database to support planning of infrastructure, running time calculation, timetabling, and other relevant processes. In the UK for example, a microscopic infrastructure database is under preparation. However, most eastern European infrastructure managers do not yet have a reliable infrastructure database at their disposal which is due to a significant lack of information about infrastructure in place.
Data structures and formats in existing data storage and planning applications are varying. This should not result in significant problems as long as data are of a truly microscopic character. A conversion of data into a format to be used by a third-party system will be possible in most cases. A data structure may be defined being microscopic, if it allows the user to produce a reliable running time calculation and timetable construction.
It is therefore notably recommended:
• European railway infrastructure managers should build up a reliable (European) railway infrastructure database at microscopic level to facilitate national as well as European infrastructure planning, timetabling and other applications.
• Although railway infrastructure data will always be similarly structured at microscopic level, a specification for rail data storage should be developed, supported by the relevant associations and system providers. This process will also require a close co-operation of IMs.
• The decision support system has to be regularly provided with up-to-date electronic data by the infrastructure managers. The level of detail of data remains to be defined, however, data at microscopic level are certainly not required. Directive 2001/16/EC, calling for a register of infrastructure in Article 24, may serve as the legal base for the provision these data, although the Directive does not request the electronic format.
Data may also be retrieved from the constantly improving network statements. A co-operation with RailNetEurope, striving to standardise network statements among RNE members, should be considered although the application of the RNE standard is not mandatory.
Deliverable B5.2
Infrastructure Development Scheme
TREND_B5-Report_IVE-2006_08_30 Page 132
Demand data may result from public sources or from projects carried out on behalf of the European Commission or national public bodies, for example as a result of national transport master plans. For the time being, a request for a frequent update of demand data only for the purpose of the decision support system would go too far. It is therefore recommended to rather improve the methodology of European statistics or to revert to national statistics.
Linguistic barriers
As the procedures and interaction among partners play a paramount role at international level, the problem of linguistic barriers shall also be mentioned in this context. This is especially the case when it comes to technical definitions. English is the first “common” language that is usually spoken at most international events. Besides English, German is quite frequently spoken by representatives from the eastern European countries. But as in all languages, technical terms are often related to the country specific technical development as it is especially the case with signalling.
Only few multi-lingual sources are available providing support in technically driven discussions, often also encompassing other transport sectors or economics. Among these source is the UIC RailLexic encompassing mostly technical railway terms and which is available for sale in electronic format. At least an older version of the RailLexic was fed into the online dictionary Eurodicautom, which is currently not updated as a new tool is due for publication. Furthermore, the RailLexic is considered being sometimes misleading as regards the English translations. Meanwhile, new expressions are being generated, a development which is much driven by the development of the European Railway Area.
The definition of TSIs and their widespread application require the exact translation into a wide range of languages. This is also true for legal documents treating technical subject. As a translation of these documents is most likely accompanied or edited by technical experts to ensure compliance of the translations with the original, the experience gained in these procedures should be made available to the expert community. It is therefore recommended to provide a substantial linguistic support to the railway community, which is not only supportive at management and planning level, but also for training of internationally operating railway staff.
Geographical names
Due to the multitude of sources and the languages involved, the node names were not consistently attributed. Sometimes the English names and sometimes the country specific names were used. In other cases, the name of a town being closest to a certain railway node was chosen to specify a node. Alternatively, the exact name of the node or junction was applied. Accordingly, TREND had deficiencies as regards the clear definition of node names at the beginning of the project. It was later agreed to attribute the name of the town being closest to the node.
It would therefore be helpful for future applications to develop or include an alias list already available with the railways for timetable applications, to unambiguously identify nodes in a European macroscopic railway infrastructure model.