Embed Size (px)
Citation preview
- 1 -
Project NATURA MIÑO-MINHO “Valorización de los recursos
de la cuenca hidrográfica del MIÑO-MINHO”
Activity 1 report – part 2
Characterization of DIVA09 – a gravity core from
the Minho shelf
Mário Mil-Homens1, Filipa Naughton
1, Ana M. Costa
1, Dulce Oliveira
1,
Célia Santos1, Teresa Rodrigues
1, Fátima Abrantes
1
Sandra Fonseca2, Raquel Serrano
2
1 CIIMAR / Unidade de Geologia Marinha - Laboratório Nacional de Energia e Geologia 2 Núcleo Operacional de Química Inorgânica - Laboratório de Referência do Ambiente - Agência Portuguesa do Ambiente

Table of Contents Abstract ........................................................................................................................................................................... 1
Introduction .................................................................................................................................................................... 1
Environmental setting ................................................................................................................................................... 2
Materials and Methods .................................................................................................................................................. 5
Mechanical drills ............................................................................................................................................................ 5
Brief mechanical cores description ................................................................................................................................. 5
Gravity core sampling .................................................................................................................................................... 6
Brief gravity core description .......................................................................................................................................... 6
Type of analysis ............................................................................................................................................................ 7
Carbon-14 ................................................................................................................................................................ 7 Lead-210 .................................................................................................................................................................. 7 Grain size ................................................................................................................................................................. 7 Foraminifera ............................................................................................................................................................. 8 Diatoms.................................................................................................................................................................... 8 Geochemistry ........................................................................................................................................................... 9 Biomarkers ............................................................................................................................................................. 11 Pollens ................................................................................................................................................................... 11
Results...........................................................................................................................................................................12
Chronostratigraphy ...................................................................................................................................................... 12
Grain size .................................................................................................................................................................... 15
Foraminifera ................................................................................................................................................................ 17
Diatoms ....................................................................................................................................................................... 18
Geochemistry .............................................................................................................................................................. 20
Organic carbon, total nitrogen and calcium carbonate .............................................................................................. 20 Major and trace elements........................................................................................................................................ 21 Biomarkers ............................................................................................................................................................. 27
Pollens ........................................................................................................................................................................ 28
Discussion ....................................................................................................................................................................31
Temporal variability in organic matter composition ........................................................................................................ 31
Selection of the normalizer element.............................................................................................................................. 33
Temporal variability in supply of terrigenous materials .................................................................................................. 34
Climatic changes in the NW Portuguese Margin and the influence of human activities since the last 2500 years ............ 36
Sub-orbital climate variability during the late Holocene .................................................................................................. 37
Summary and final considerations ...........................................................................................................................42
Acknowledgments .......................................................................................................................................................43
References ....................................................................................................................................................................43

- 1 -
Abstract
The overall objective of the Natura Miño-Minho project is to contribute for a better understanding of the Minho
river ecosystem in order to assure a correct management and preservation of its natural resources. This report aims to
describe the actions that took place within Activity 1 of the Natura Miño-Minho project. This activity was divided in two
distinct parts; a first part involving the study of sediments as a tool for identifying possible areas specially marked by
anthropogenic impacts (considering a spatial perspective) in the estuary and a second part focused on the use of sediments
as a key for improving the knowledge associated with climatic variability and human activities (agriculture, (de)forestation,
…) through time. To reach this goal a set of mechanical drills were recovered from within the estuary. Additionally, a
gravity core (DIVA09) was collected on the continental shelf, in the Galicia Mud Patch, to allow a comparison of the
sedimentary records. A multi-parameter approach (pollen, diatoms, biomarkers, grain-size, organic carbon, determinations,
stable oxygen isotopes, major and trace elements) was initially proposed to apply in both the estuarine and the marine
cores, which were to be dated by 210Pb and 14C. Nevertheless, the difficulties in the establishment of geochronologies for
the estuarine cores, due to the occurrence of sedimentary disturbances and the need for further analyses not possible for
lack of funds, not allowed developing the temporal reconstruction of estuarine sedimentary sequences. Therefore, the
temporal reconstruction is confined uniquely to the DIVA09 core. Anyway, the multi-parameter analyses performed down-
core is indicative of an evolution of the hydrodynamic conditions (resulting from different oceanographic conditions
induced both by global climate variability and small sea-level oscillations) and the resulting regional climate conditions
through time as shown by Sea Surface Temperature gradually decreasing trend up to the present, but superimposed onto the
orbitally induced long-term cooling pattern.
On the shelf, the multi-parameter analyses included pollen, SST and planktonic δ18O and allowed the identification
of sub-orbital climatic variability during the last 2500 years. Additionally, despite the influence of hydrodynamic
conditions in the preservation of the sediment record, grain-size, pollen, n-alcohols and n-alkanes data suggest a gradual
increase of continental input during the Roman Warm Period and the Dark Ages.
Introduction
NATURA MIÑO-MINHO project – “Valorización de los recursos de la cuenca hidrográfica del
Miño-Minho” is a project developed between Portugal and Spain financed by European Union through
the Programa de Cooperação Transfronteiriça Espanha-Portugal (POCTEP/FEDER) in order to get
scientific knowledge related to environmental conditions existing in the Minho estuary and adjacent
shelf area. The main goals of the project are evaluating climatic changes in the NW Portuguese Margin
and the influence of human activities in local environments. Improvement of the knowledge’s level will
allow implementing management policies assuring preservation and integration of natural resources,
promotion of sustainable development and biodiversity conservation of the Natura 2000 network
habitats. The work developed in Activity 1 was only possible due to the intense and profit collaboration
with other research groups (Núcleo Operacional de Química Inorgânica - Laboratório de Referência do
Ambiente – Agência Portuguesa do Ambiente; Unidade de Sondagens; Laboratório Nacional de
- 2 -
Energia e Geologia; Universidad de Vigo; Royal Netherlands Institute for Sea Research - Department
of Marine Geology) although not partners of this project.
Through the study of sedimentary sequences and sediment components it is possible to
reconstruct environmental conditions existing on continents and oceans in the Past. Sediments
constitute sensitive temporal indicators that are useful for reconstructing the history of sediment
deposition (Valette-Silver, 1993) in terms of monitoring climatic evolution and recording evolution of
anthropogenic impacts over time. This potential for “memorizing” the past environmental conditions
makes sediments a powerful tool for predicting the environmental evolution of the planet Earth in the
future.
In order to attempt characterizing past environmental changes of the Minho estuary a set of
mechanical drills were collected in the Salcidos region and to comparing estuarine and shelf records, a
sediment core collected on the adjacent shelf area was also studied. This part of the continental shelf is
characterized as a favorable environmental setting for accumulation of fine-grained sediments, and
consequently formation of fine-grained shelf depocenters identified in previous studies (Araújo et al.,
2002; Dias et al., 2002a; Dias et al., 2002b; Lantzsch et al., 2009a; Lantzsch et al., 2009b; Lantzsch et
al., 2010). One of these deposits, named Galicia Mud Patch (GMP) by Dias et al. (2002a), is
characterized by a North-South orientation and formed in water depths around 100-120m. With the
main objective of reconstructing environmental conditions existing in this area in the recent past, 210
Pb
and 14
C determinations were used as a basis for age model definition. Furthermore, a set of inorganic
and organic sediment components (diatoms, pollens, biomarkers, organic carbon, grain size, major and
trace element concentrations) were studied on both sedimentary sequences.
Environmental setting
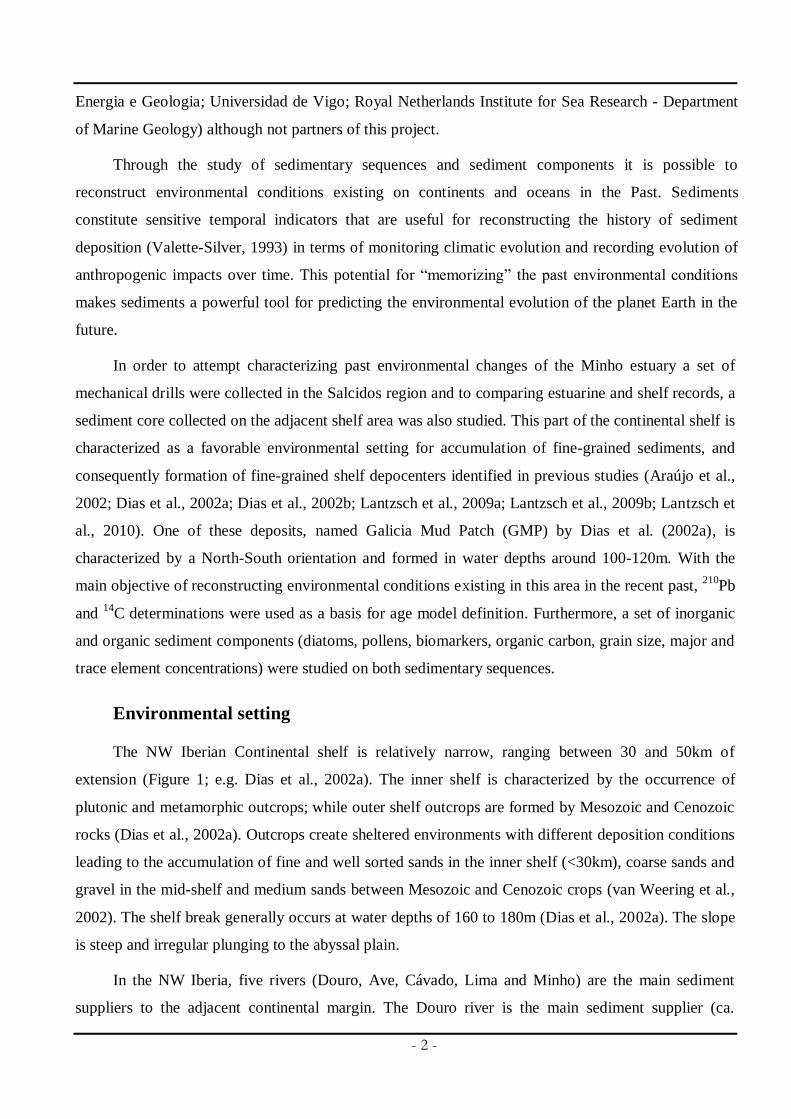
The NW Iberian Continental shelf is relatively narrow, ranging between 30 and 50km of
extension (Figure 1; e.g. Dias et al., 2002a). The inner shelf is characterized by the occurrence of
plutonic and metamorphic outcrops; while outer shelf outcrops are formed by Mesozoic and Cenozoic
rocks (Dias et al., 2002a). Outcrops create sheltered environments with different deposition conditions
leading to the accumulation of fine and well sorted sands in the inner shelf (<30km), coarse sands and
gravel in the mid-shelf and medium sands between Mesozoic and Cenozoic crops (van Weering et al.,
2002). The shelf break generally occurs at water depths of 160 to 180m (Dias et al., 2002a). The slope
is steep and irregular plunging to the abyssal plain.
In the NW Iberia, five rivers (Douro, Ave, Cávado, Lima and Minho) are the main sediment
suppliers to the adjacent continental margin. The Douro river is the main sediment supplier (ca.
- 3 -
8.2x10⁹m
3 annual discharge) corresponding to ca. 87% of all fluvial sediments in the area (Dias,
1987), followed by the Minho river (e.g. Dias et al., 2002b; Jouanneau et al., 2002; Oliveira et al.,
2002b). The Douro River have 927km length, draining a catchment area of 97682km2 (Loureiro et al.,
1986), mainly formed by granitic rocks and metamorphic rocks of Palaeozoic age (schists, gneisses,
micaschists and greywackes) (Oliveira et al., 2002a). The Minho River is located in the western
Iberian margin, in the border region between Minho (Portugal) and Galicia (Spain), and discharges to
the Atlantic Ocean with a mean annual freshwater discharge of 300m3s
-1. It is 300km long and has a
17081km2 watershed that extends mostly over Galicia, Spain, with less than 5% of its area in Northern
Portugal (Loureiro et al., 1986). The last 70km of the Minho River form the natural border between
Portugal and Spain, which includes the main estuarine axis of approximately 40km corresponding to
the area under the influence of the spring tides (Sousa et al., 2005). The Minho is classified as a
mesotidal estuary with a tidal range varying from about 2m at neap tides to about 4m at spring tides
(Bettencourt and Ramos, 2003). The sediments of Minho River are essentially composed by sand
(median contents of 80%) with the predominance of coarse sands (see grain-size data included in
Activity 1 report part 1). The river basin occupies an area dominated by rock formations of the pre-
Ordovician Schist-greywacke Complex and granites.
The sedimentation on the NW Iberian margin is complex and essentially sustained by episodic
flood events (Dias et al., 2002b) and/or during maximal episodes of river outflow (Araújo et al., 1994;
Drago et al., 1998). Fine-grained sediments, after being released by rivers mainly during the winter
seasons, are transported in nepheloid layers (Bottom – BNL, intermediate – INL and surface – SNL) to
the outer shelf. High hydrodynamic conditions during extreme storm events (downwelling conditions),
induce re-suspension of fine-grained fluviogenic sediments during winter and transport to north by
poleward-flowing current (Drago et al., 1998; Dias et al., 2002b; Jouanneau et al., 2002; van Weering
et al., 2002). The availability of fine-sediments, morphological barriers and hydrological conditions
leads to the formation of mud depocenters (Dias et al., 2002b) at around 100-120 meters water depth
(mwd), listed from south to north as: Douro Mud Patch, Galicia Mud Patch and Muros Mud Patch.
During upwelling conditions, fine sediment export is restricted to the shelf edge (McCave and Hall,
2002; van Weering et al., 2002).
The present-day climate and vegetation in the NW part of Spain, including the Minho basin, is
influenced by wet, relatively cool and weakly seasonal Atlantic climate (annual precipitation mean:
900-1400mm yr-1
and temperature range: -7 to 10ºC) and is dominated by deciduous Quercus forest
(Q. robur, Q. pyrenaica and Q. petraea), heath communities (Ericaceae and Calluna) and Ulex. There
are also locally birch (Betula pubescens subsp. celtiberica) and hazel (Corylus avellana) groves, and
- 4 -
brooms (Genista) (Alcara Ariza et al., 1987). The Douro River hydrographic basin is characterized by
high precipitation values (700 to 1000mm yr-1
) and winter temperatures between -4 and 4ºC. At high
altitudes, the wettest and coldest zones reach 1600mm yr-1
and -8ºC, respectively (Polunin and
Walters, 1985). The oceanic influence is particularly important in the northwest of the basin, where the
Q. robur and Q. suber association predominates (Braun-Blanquet et al., 1956). The spread of both
Pinus pinaster and Eucalyptus globulus has been favored by anthropic impact. The understory
vegetation is largely dominated by Ulex, in association with heaths. The river margins are colonized by
Alnus glutinosa, Fraxinus angustifolia, Ulmus spp., Salix spp., and Populus spp..
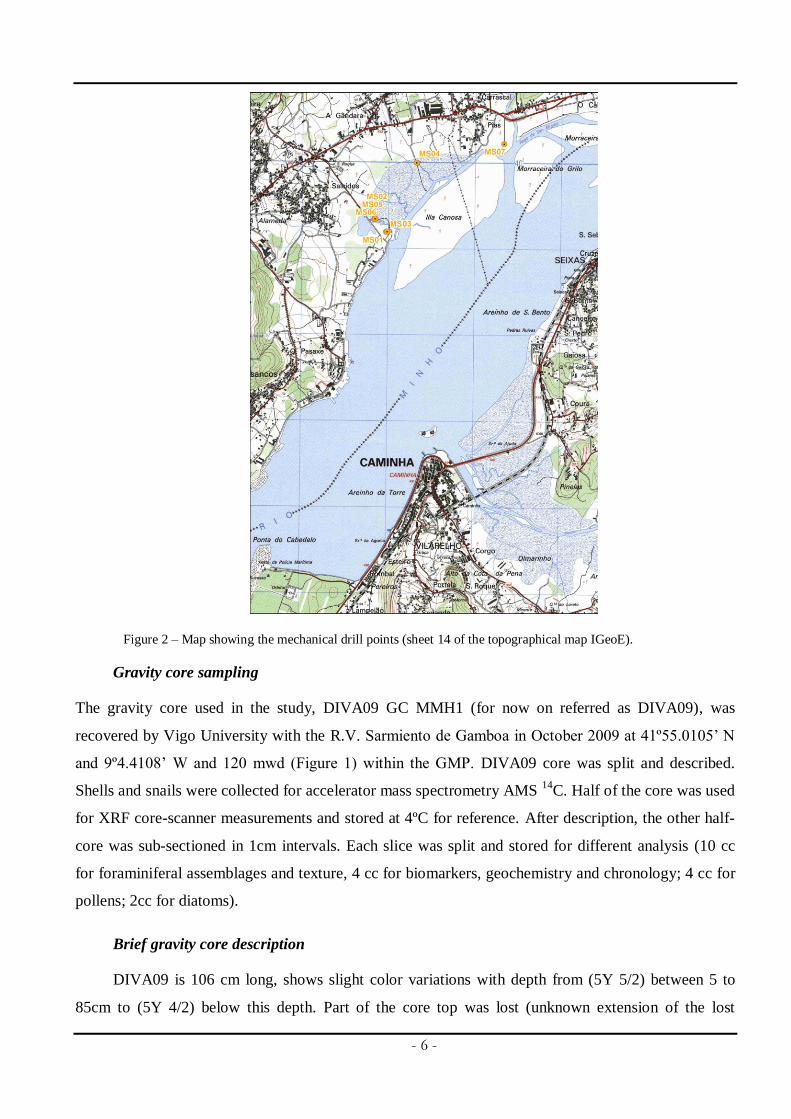
Figure 1 – Map of the study area and location of DIVA09 adapted from Dias et al., (2002a).
- 5 -
Materials and Methods
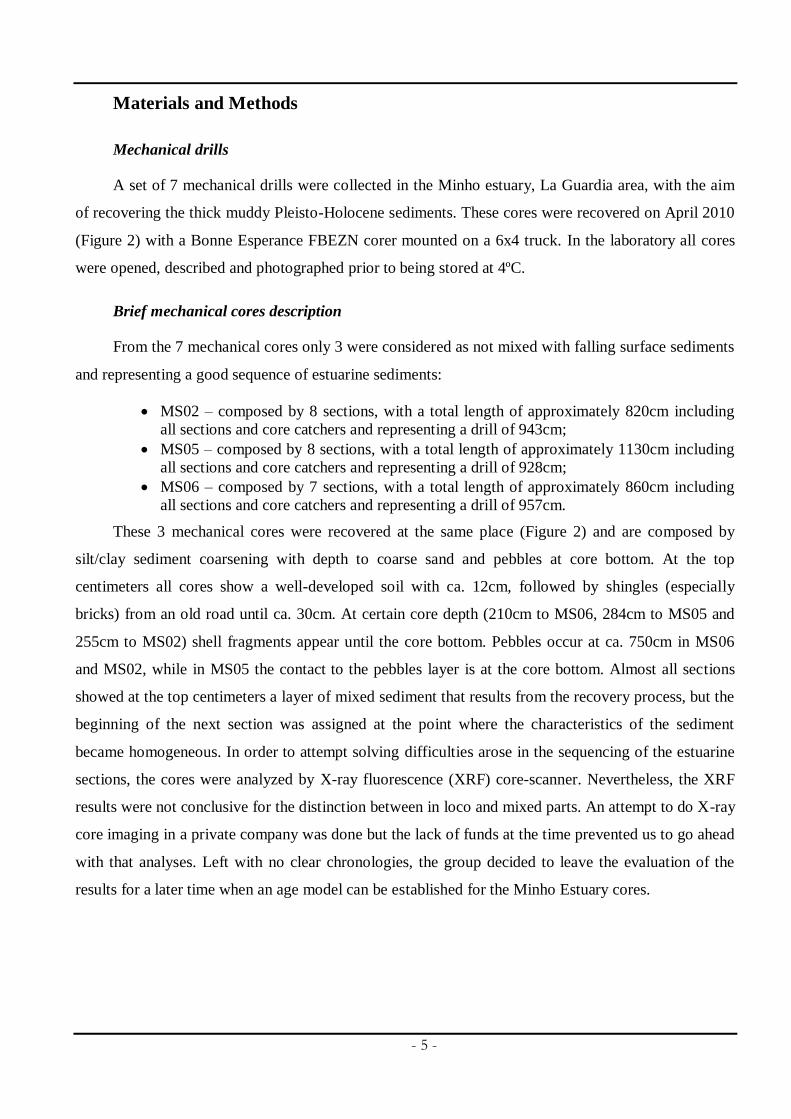
Mechanical drills
A set of 7 mechanical drills were collected in the Minho estuary, La Guardia area, with the aim
of recovering the thick muddy Pleisto-Holocene sediments. These cores were recovered on April 2010
(Figure 2) with a Bonne Esperance FBEZN corer mounted on a 6x4 truck. In the laboratory all cores
were opened, described and photographed prior to being stored at 4ºC.
Brief mechanical cores description
From the 7 mechanical cores only 3 were considered as not mixed with falling surface sediments
and representing a good sequence of estuarine sediments:
MS02 – composed by 8 sections, with a total length of approximately 820cm including
all sections and core catchers and representing a drill of 943cm;
MS05 – composed by 8 sections, with a total length of approximately 1130cm including
all sections and core catchers and representing a drill of 928cm;
MS06 – composed by 7 sections, with a total length of approximately 860cm including
all sections and core catchers and representing a drill of 957cm.
These 3 mechanical cores were recovered at the same place (Figure 2) and are composed by
silt/clay sediment coarsening with depth to coarse sand and pebbles at core bottom. At the top
centimeters all cores show a well-developed soil with ca. 12cm, followed by shingles (especially
bricks) from an old road until ca. 30cm. At certain core depth (210cm to MS06, 284cm to MS05 and
255cm to MS02) shell fragments appear until the core bottom. Pebbles occur at ca. 750cm in MS06
and MS02, while in MS05 the contact to the pebbles layer is at the core bottom. Almost all sections
showed at the top centimeters a layer of mixed sediment that results from the recovery process, but the
beginning of the next section was assigned at the point where the characteristics of the sediment
became homogeneous. In order to attempt solving difficulties arose in the sequencing of the estuarine
sections, the cores were analyzed by X-ray fluorescence (XRF) core-scanner. Nevertheless, the XRF
results were not conclusive for the distinction between in loco and mixed parts. An attempt to do X-ray
core imaging in a private company was done but the lack of funds at the time prevented us to go ahead
with that analyses. Left with no clear chronologies, the group decided to leave the evaluation of the
results for a later time when an age model can be established for the Minho Estuary cores.
- 6 -
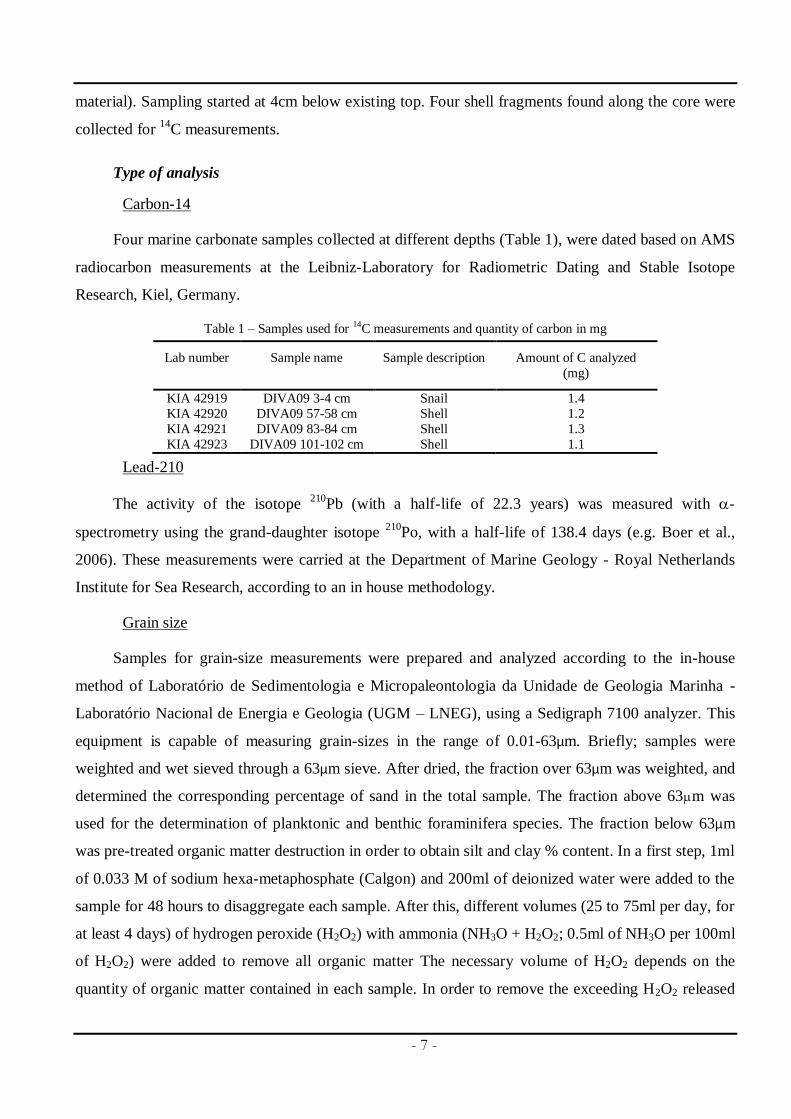
Figure 2 – Map showing the mechanical drill points (sheet 14 of the topographical map IGeoE).
Gravity core sampling
The gravity core used in the study, DIVA09 GC MMH1 (for now on referred as DIVA09), was
recovered by Vigo University with the R.V. Sarmiento de Gamboa in October 2009 at 41º55.0105’ N
and 9º4.4108’ W and 120 mwd (Figure 1) within the GMP. DIVA09 core was split and described.
Shells and snails were collected for accelerator mass spectrometry AMS 14
C. Half of the core was used
for XRF core-scanner measurements and stored at 4ºC for reference. After description, the other half-
core was sub-sectioned in 1cm intervals. Each slice was split and stored for different analysis (10 cc
for foraminiferal assemblages and texture, 4 cc for biomarkers, geochemistry and chronology; 4 cc for
pollens; 2cc for diatoms).
Brief gravity core description
DIVA09 is 106 cm long, shows slight color variations with depth from (5Y 5/2) between 5 to
85cm to (5Y 4/2) below this depth. Part of the core top was lost (unknown extension of the lost
- 7 -
material). Sampling started at 4cm below existing top. Four shell fragments found along the core were
collected for 14
C measurements.
Type of analysis
Carbon-14
Four marine carbonate samples collected at different depths (Table 1), were dated based on AMS
radiocarbon measurements at the Leibniz-Laboratory for Radiometric Dating and Stable Isotope
Research, Kiel, Germany.
Table 1 – Samples used for 14C measurements and quantity of carbon in mg
Lab number Sample name Sample description Amount of C analyzed
(mg)
KIA 42919 DIVA09 3-4 cm Snail 1.4
KIA 42920 DIVA09 57-58 cm Shell 1.2
KIA 42921 DIVA09 83-84 cm Shell 1.3
KIA 42923 DIVA09 101-102 cm Shell 1.1
Lead-210
The activity of the isotope 210
Pb (with a half-life of 22.3 years) was measured with -
spectrometry using the grand-daughter isotope 210
Po, with a half-life of 138.4 days (e.g. Boer et al.,
2006). These measurements were carried at the Department of Marine Geology - Royal Netherlands
Institute for Sea Research, according to an in house methodology.
Grain size
Samples for grain-size measurements were prepared and analyzed according to the in-house
method of Laboratório de Sedimentologia e Micropaleontologia da Unidade de Geologia Marinha -
Laboratório Nacional de Energia e Geologia (UGM – LNEG), using a Sedigraph 7100 analyzer. This
equipment is capable of measuring grain-sizes in the range of 0.01-63µm. Briefly; samples were
weighted and wet sieved through a 63µm sieve. After dried, the fraction over 63µm was weighted, and
determined the corresponding percentage of sand in the total sample. The fraction above 63m was
used for the determination of planktonic and benthic foraminifera species. The fraction below 63µm
was pre-treated organic matter destruction in order to obtain silt and clay % content. In a first step, 1ml
of 0.033 M of sodium hexa-metaphosphate (Calgon) and 200ml of deionized water were added to the
sample for 48 hours to disaggregate each sample. After this, different volumes (25 to 75ml per day, for
at least 4 days) of hydrogen peroxide (H2O2) with ammonia (NH3O + H2O2; 0.5ml of NH3O per 100ml
of H2O2) were added to remove all organic matter The necessary volume of H2O2 depends on the
quantity of organic matter contained in each sample. In order to remove the exceeding H2O2 released
- 8 -
during the previous chemical reaction, the solution was heated in a water bath at 60ºC during 24 hours.
For quickly eliminating the excess liquid, samples were washed approximately 6 times with 1000 ml
of deionized water, using candle ceramic filters. Samples were poured in a glass flask with 1ml of
Calgon to prevent flocculation and one drop of formaldehyde was added to avoid fungi development.
Before analysis in the Sedigraph equipment, samples were homogenized with a vertical stirrer with
700 rpm for, at least, 15 minutes. In this work three grain-size classes were used, defined as:
clay < 4µm;
4µm < silt < 63µm;
63µm < sand < 2000µm
The sample’s classification into those three classes was determined through the use of the
ternary diagram defined by (Shepard, 1954), with the support of the Visual Basic program developed
by (Poppe and Eliason, 2008). This routine allows classifying sediments based on grain-size
measurements. Clay and silt contents were measured with Sedigraph analyzer in the same samples
used for geochemistry analysis.
Foraminifera
Oxygen isotopic compositions were determined on three planktonic foraminifera species:
Globigerina bulloides, Globigerina inflata, and Neobloquadrina pachyderma (r) and the benthic genus
Uvigerina sp.. The foraminifera shells (5-21 specimens) were collected from the sand fraction with a
size larger than 150µm. Stable isotope ratios were analyzed on a Finnigan MAT 251 mass
spectrometer at Marum, Bremen University (Germany). The δ18
O ratios are reported in per mil (‰)
relative to the Vienna Peedee Belemnite standard (VPDB). Analytical standard deviation is ± 0.07‰
for δ18
O.
Diatoms
Siliceous microfossils analysis (diatoms and plant phytoliths) were carried out on surface
samples, following the procedure of Abrantes et al. (2005). Sediment samples (2 – 2.5 g of bulk
sediment) are placed in glass jars and are treated with Calgon in order to desegregate the clays. After
this, alternate treatments with H2O2 and hydrochloric acid (HCl), at room temperature and over hot
plates, were applied until all the organic matter and carbonate contents were removed. Distilled water
is then used to wash the samples through siphoning in order to remove the clay content (this process is
made with a minimum of 8 hour interval between siphoning). Calgon is then added as needed in order
to release any extra clay content. Diatom slides are then prepared using sedimentation trays (Battarbee,
1973), and mounted with Permount medium. Absolute abundance of diatoms valves (marine, brackish
and freshwater) and phytolith cells are determined after slide quantification with x 1000 magnification,
- 9 -
using the counting protocol of Schrader & Gersonde (1978) and Abrantes (1988). Absolute abundance
in any one level is based on the median value obtained from the counting of 100 random fields of view
on three replicate slides,, and expressed as number of valves/phytoliths per gram of sediment. Due to
the fact that diatoms have the hydrodynamic behavior of a silt particle, in cases where grain size is
very variable, such as in this case, the final absolute abundances have to be corrected for the fine
fraction w% content of each sample.
Geochemistry
For geochemistry analysis sediment samples were freeze-dried and grounded. Organic carbon
(Corg), and calcium carbonate (CaCO3) contents were measured on 2mg of sediment using a Leco
CHNS 932. The Corg and Norg contents (wt.%) were determined by the difference between total and
inorganic contents. Briefly, the combustion of organic carbon in the fraction < 2 mm for 3 hours at
400ºC allows the subsequent measurement of inorganic carbon content. Both raw and combusted
sample were analyzed two times. If the difference between 2 repeated sample measurements were
lower than 0.10 wt.%, the average of both measurements is accepted as the correct value. Organic
carbon content was obtained from the difference between total carbon and inorganic carbon contents.
Calcium carbonate (wt.%) is equal to 8.33 x Cinorg.
Major (Al, Fe, Mg, Ca, Na, K, Ti and Mn) and trace (Ba, Cr, Cu, Pb, Sc and Zn) elements were
determined by inductively coupled plasma optical emission spectrometry (ICP-OES) while Li, Rb and
Sr were measured by inductively coupled plasma mass spectrometry (ICP-MS). All these
determinations were obtained after total mineralization of 0.25 g of freeze-dried and ground sediment.
The samples were mineralized by a combination of 3 mL HCl (36%), 9 mL nitric acid (HNO3; 69%)
and 5mL hydrofluoric (HF; 48%) in a CEM microwave oven Mars Xpress. After microwave digestion,
remaining solutions were transferred to Teflon vessels and placed on the hotplate at 150ºC until near
dryness. Twenty mL of Milli-Q water and 2.5 mL HNO3 were added to the residue to bring the
solution to a final volume, the solution was heated at 80ºC during 3 hours, and after cooling
transferred to 50mL volumetric flask and finally poured in a labeled plastic bottle.
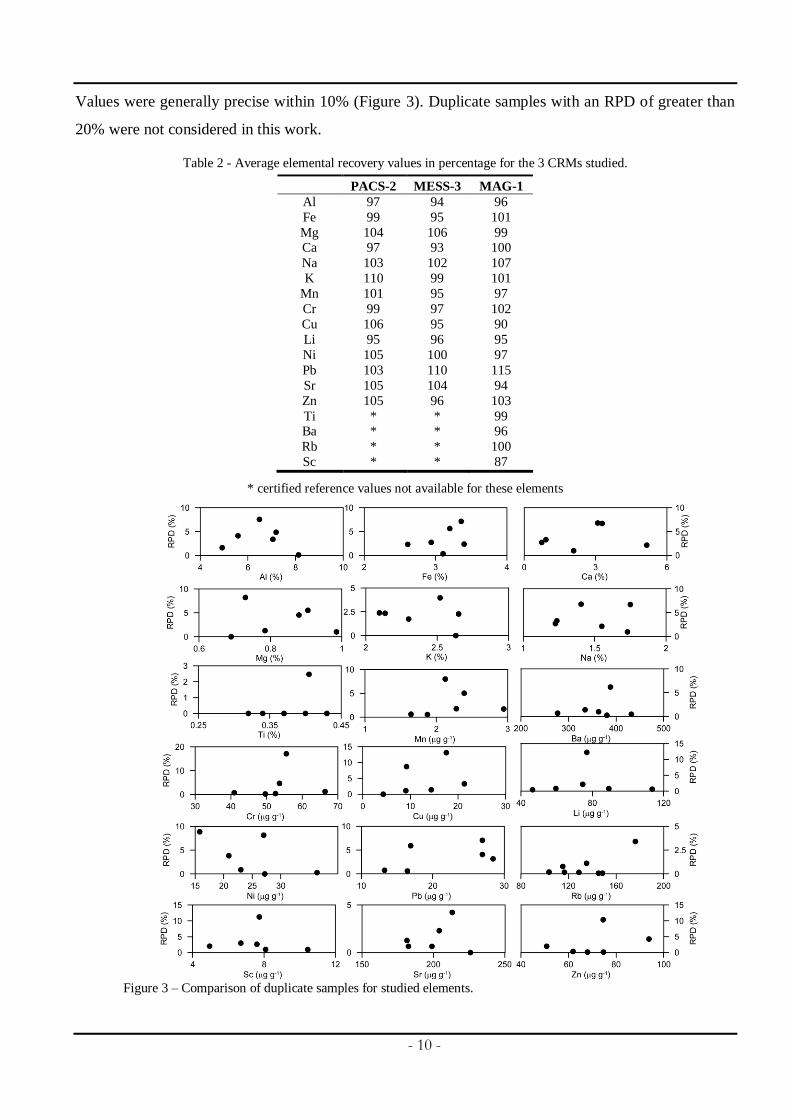
Quality assurance/quality control (QA/QC) concerns were addressed through the use of certified
reference materials (CRM), blank reagents and duplicate samples. The accuracy of the analytical
procedure was determined by measuring major and trace elements contents in three distinct CRMs
(MAG-1 (USGS), PACS-2 and MESS-3 (NRCC); Table 2). Certified reference measured values are in
general within the certified range of values, excepting Pb for MAG-1. The average recovery values for
three replicate samples are listed in Table 2. The relative percent difference (RPD) was determined for
duplicate samples of different studied samples to provide an indication of the analytical precision.
- 10 -
Values were generally precise within 10% (Figure 3). Duplicate samples with an RPD of greater than
20% were not considered in this work.
Table 2 - Average elemental recovery values in percentage for the 3 CRMs studied.
PACS-2 MESS-3 MAG-1
Al 97 94 96
Fe 99 95 101
Mg 104 106 99 Ca 97 93 100
Na 103 102 107
K 110 99 101
Mn 101 95 97
Cr 99 97 102
Cu 106 95 90
Li 95 96 95
Ni 105 100 97
Pb 103 110 115
Sr 105 104 94
Zn 105 96 103
Ti * * 99 Ba * * 96
Rb * * 100
Sc * * 87
* certified reference values not available for these elements
Figure 3 – Comparison of duplicate samples for studied elements.
- 11 -
Biomarkers
The analytical procedure started with sample preparation and lipids extraction. Sediment samples
are freeze-dried and manually ground for homogeneity. From an aliquot of the dried material, the
lipids are extracted by treating them three times with 8 mL of dichloromethane in an ultrasonic bath
(15 min) after adding 10 l of an internal standard containing n-nonadecan-1-ol, n-hexatriacontane and
n-tetracontane. The extracts are combined and evaporated to dryness under a nitrogen flow. The
evaporated extracts are hydrolyzed with 3 mL of 10% KOH in methanol and stored overnight for
elimination of wax ester interferences. Non-acid compounds are recovered by extraction with n-hexane
(3 x 3 mL). The resulting extracts are washed with extracted distilled water, evaporated under a
nitrogen stream, and derivatized with 40-60 l of N,O-Bis(trimethylsilyl)trifluoroacetamide (BSTFA)
and diluted in toluene. Samples are stored in darkness at 4°C before gas chromatographic analyses
(GC-FID, GC-MSD). An Varian gas chromatograph GC-8300 coupled with a flame ionization detector
(GC-FID) using a capillary column (50 m length, 0.32 mm internal diameter) and hydrogen as carrier
gas. Samples are injected on-column. After an initial period of 1 min at 90°C, the column is heated
rapidly to 170°C at 20°C/min, then to 280°C at 6°C/min, followed by an isothermal period of 70 min,
and a final temperature ramp of 10°C/min up to 310°C, and held for 5 min.
Quantification is performed by comparison of the peak areas with the area of the hexatriacontane
peak. Sea Surface Temperatures (SST) determinations are based on the alkenone unsaturation index,
UK’
37, which was calibrated to the temperature equation of (Muler et al., 1998). Replicate injections
and sample dilution tests allowed assessing measurement errors below 0.5ºC (Grimalt et al., 2001).
Pollens
Twenty seven (27) samples were analyzed from DIVA09. The treatment used for palynological
analysis followed the procedure described by de Vernal et al. (1996), slightly modified at the UMR
CNRS 5805 EPOC (Unité mixte de Recherche 5805, Centre National de la Recherche
Scientifique/Environnement et Paléoenvironnements Océaniques) according to Desprat (2005).
Chemical digestion using cold HCl (at 10%, 25% and 50%) and cold HF (at 40% and 70%) were
applied to eliminate carbonates and silicates. A Lycopodium spike of known concentration was added
to each sample to calculate pollen concentration. The residue was sieved through 10µm nylon mesh
screens (Heusser and Stock, 1984) and mounted in bidistillate glycerin. Pollen and cysts were
identified and counted using a Nikon microscope with x550 and x1250 (oil immersion) magnifications.
At least 100 pollen grains (excluding Pinus, aquatic plants and spores) and at least 20 pollen types
were counted. Pinus pollen is usually over-represented in marine deposits and therefore is often
- 12 -
excluded from the main sum (Heusser and Balsam, 1977; Turon, 1984). However, it is known that the
percentage of this taxa increase seaward in opposition to the decrease of total pollen contents (Muller,
1959; Bottema and Van Straaten, 1966; Groot and Groot, 1966; Koreneva, 1966; Van der Kaars and de
Deckker, 2003). Because the site location is close to the present-day coast line, we assume that Pinus
pollen percentages are not over-represented in this core and, therefore, Pinus pollen grains have not
been excluded from the main pollen sum. Pollen percentages of each taxa were calculated based on the
main pollen sum that excludes aquatic plants, pteridophyte spores and undetermined pollen.
Results
Chronostratigraphy
The age model for DIVA09 was defined based on 4 accelerator mass spectrometry (AMS) 14
C
measurements (Table 3), on 210
Pb analysis (Table 4; Figure 5a) and two historically dated botanical
events in western Iberian Peninsula (Table 5; Figure 4).
The AMS ages were calibrated using CALIB Rev 6.0 program and the "global" marine
calibration dataset (marine 09.14c) (Stuiver and Reimer, 1993; Hughen et al., 2004; Stuiver et al.,
2005) (Table 4). The marine dataset (marine 049.14c) uses the global marine age reservoir correction
(R) of 400 years for the Iberian margin as proposed by Bard et al. (2004) and a deltaR =-7 +/- -90
following (Reimer et al. 2004). We used 95.4% (2 sigma) confidence intervals and their relative areas
under the probability curve, as well as the median probability of the probability distribution (Telford et
al., 2004) as suggested by Stuiver et al. (2005). Two 14
C dates from DIVA09 record exhibit age
inversions, such as those obtained at 83 and 101cm core depth.
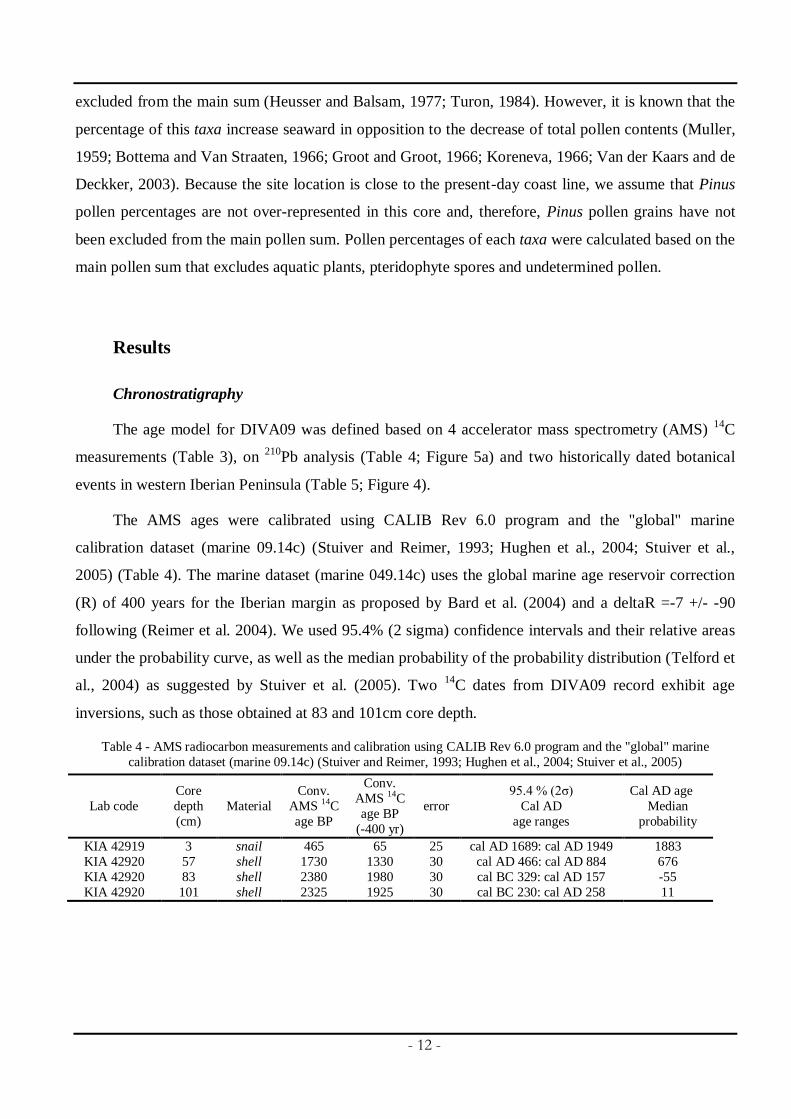
Table 4 - AMS radiocarbon measurements and calibration using CALIB Rev 6.0 program and the "global" marine
calibration dataset (marine 09.14c) (Stuiver and Reimer, 1993; Hughen et al., 2004; Stuiver et al., 2005)
Lab code
Core
depth
(cm)
Material
Conv.
AMS 14C
age BP
Conv.
AMS 14C
age BP
(-400 yr)
error
95.4 % (2σ)
Cal AD
age ranges
Cal AD age
Median
probability
KIA 42919 3 snail 465 65 25 cal AD 1689: cal AD 1949 1883
KIA 42920 57 shell 1730 1330 30 cal AD 466: cal AD 884 676
KIA 42920 83 shell 2380 1980 30 cal BC 329: cal AD 157 -55
KIA 42920 101 shell 2325 1925 30 cal BC 230: cal AD 258 11
- 13 -
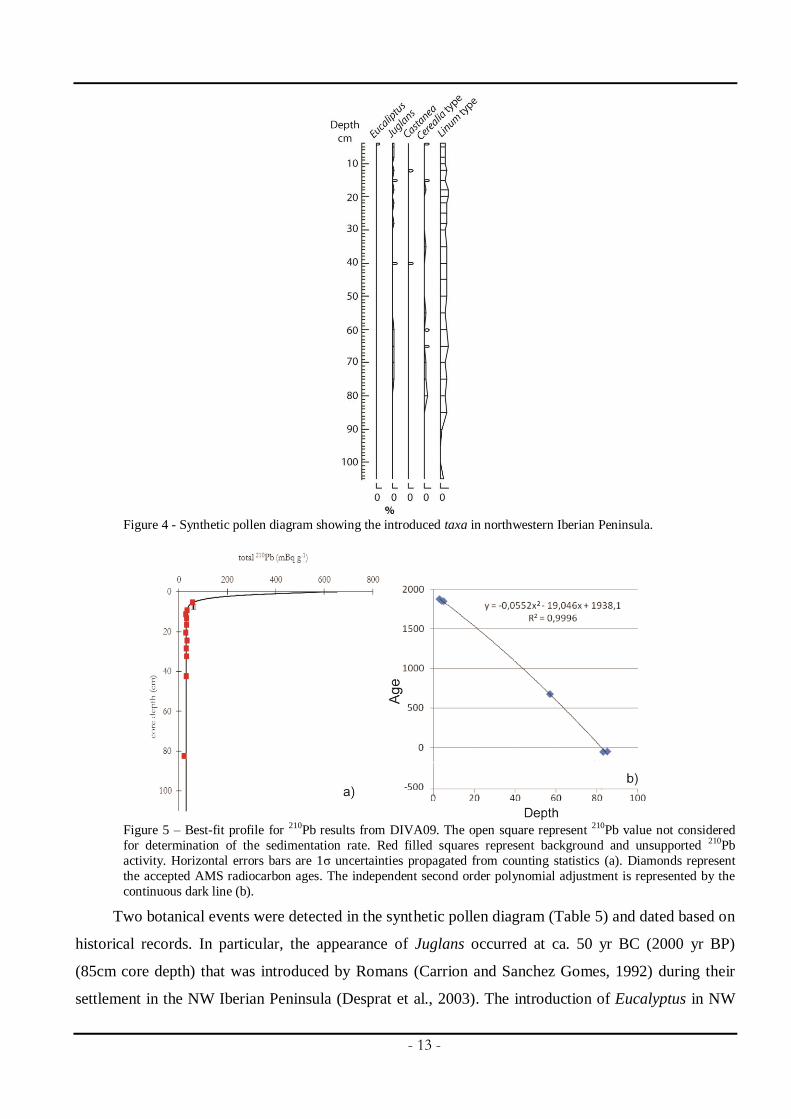
Figure 4 - Synthetic pollen diagram showing the introduced taxa in northwestern Iberian Peninsula.
Figure 5 – Best-fit profile for 210Pb results from DIVA09. The open square represent 210Pb value not considered
for determination of the sedimentation rate. Red filled squares represent background and unsupported 210Pb
activity. Horizontal errors bars are 1σ uncertainties propagated from counting statistics (a). Diamonds represent
the accepted AMS radiocarbon ages. The independent second order polynomial adjustment is represented by the
continuous dark line (b).
Two botanical events were detected in the synthetic pollen diagram (Table 5) and dated based on
historical records. In particular, the appearance of Juglans occurred at ca. 50 yr BC (2000 yr BP)
(85cm core depth) that was introduced by Romans (Carrion and Sanchez Gomes, 1992) during their
settlement in the NW Iberian Peninsula (Desprat et al., 2003). The introduction of Eucalyptus in NW
- 14 -
Iberian Peninsula occurred at 1846 AD (CIDEU, Centro de Investigacion y Documentacion del
Eucalypto; http://www.uhu.es/cideu/caracteristicas.htm#Origen ). However, we added 10 years to this
date because sexual maturity of Eucalyptus occurs around that age (Desprat et al. 2003). Therefore, the
date 1856 AD was used for the level recording the first appearance of Eucalyptus in the pollen diagram
(at 4cm). This hypothesis is in agreement with 210
Pb measurements.
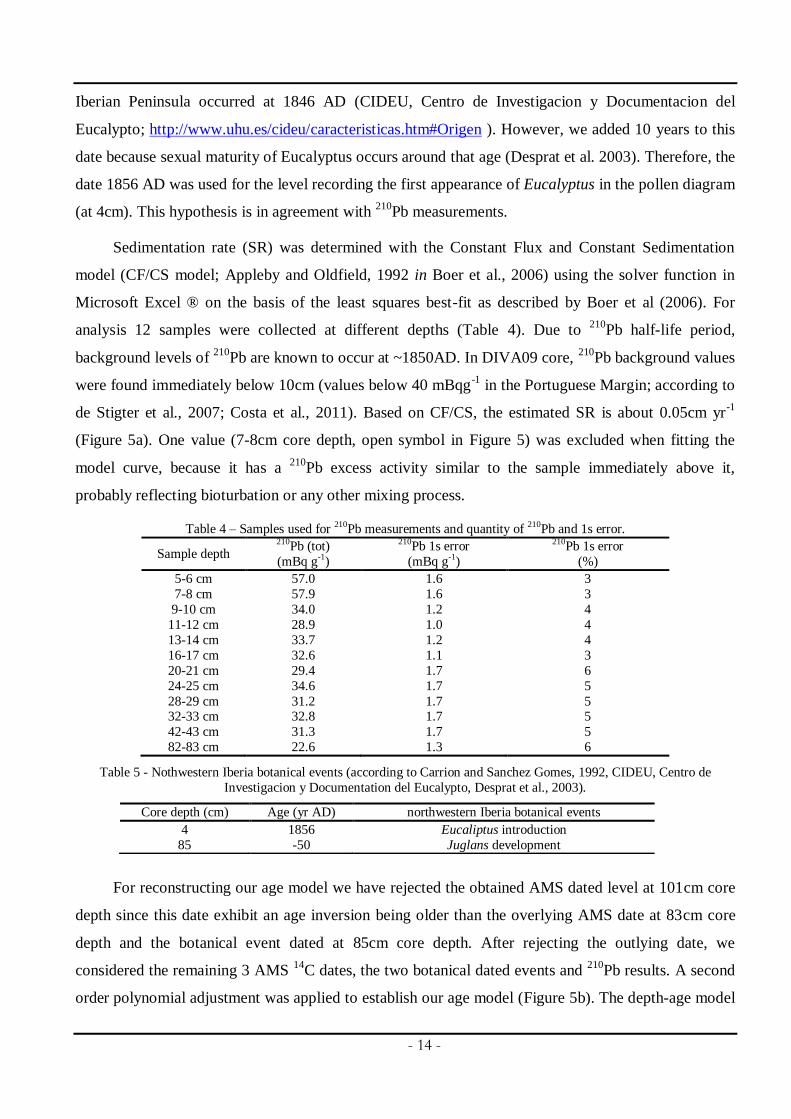
Sedimentation rate (SR) was determined with the Constant Flux and Constant Sedimentation
model (CF/CS model; Appleby and Oldfield, 1992 in Boer et al., 2006) using the solver function in
Microsoft Excel ® on the basis of the least squares best-fit as described by Boer et al (2006). For
analysis 12 samples were collected at different depths (Table 4). Due to 210
Pb half-life period,
background levels of 210
Pb are known to occur at ~1850AD. In DIVA09 core, 210
Pb background values
were found immediately below 10cm (values below 40 mBqg-1
in the Portuguese Margin; according to
de Stigter et al., 2007; Costa et al., 2011). Based on CF/CS, the estimated SR is about 0.05cm yr-1
(Figure 5a). One value (7-8cm core depth, open symbol in Figure 5) was excluded when fitting the
model curve, because it has a 210
Pb excess activity similar to the sample immediately above it,
probably reflecting bioturbation or any other mixing process.
Table 4 – Samples used for 210Pb measurements and quantity of 210Pb and 1s error.
Sample depth 210Pb (tot)
(mBq g-1)
210Pb 1s error
(mBq g-1)
210Pb 1s error
(%)
5-6 cm 57.0 1.6 3
7-8 cm 57.9 1.6 3
9-10 cm 34.0 1.2 4
11-12 cm 28.9 1.0 4
13-14 cm 33.7 1.2 4
16-17 cm 32.6 1.1 3
20-21 cm 29.4 1.7 6
24-25 cm 34.6 1.7 5
28-29 cm 31.2 1.7 5 32-33 cm 32.8 1.7 5
42-43 cm 31.3 1.7 5
82-83 cm 22.6 1.3 6
Table 5 - Nothwestern Iberia botanical events (according to Carrion and Sanchez Gomes, 1992, CIDEU, Centro de
Investigacion y Documentation del Eucalypto, Desprat et al., 2003).
For reconstructing our age model we have rejected the obtained AMS dated level at 101cm core
depth since this date exhibit an age inversion being older than the overlying AMS date at 83cm core
depth and the botanical event dated at 85cm core depth. After rejecting the outlying date, we
considered the remaining 3 AMS 14
C dates, the two botanical dated events and 210
Pb results. A second
order polynomial adjustment was applied to establish our age model (Figure 5b). The depth-age model
Core depth (cm) Age (yr AD) northwestern Iberia botanical events
4 1856 Eucaliptus introduction
85 -50 Juglans development
- 15 -
indicates that DIVA09 core covers the period from 670 cal BC to 1880 cal AD. During the 2500 yr
record, the SR varies between 0.037 and 0.051cm yr-1
(average: 0.042cm yr-1
). These SR allow high
resolution analyses, and the sampling interval ranges from 19 and 140 yr (average 75 yr). Such a
resolution is necessary to determine rapid climatic and environmental changes.
The age model determined based on 14
C radioisotope measurements, pollen data and 210
Pb
analysis provided a medium sedimentation rate of ca. 0.04 cm yr-1
which is also in agreement with
sedimentation rates known for the GMP (0.04 cm yr-1
- Martins et al. (2006); between 0.05 and 0.4 cm
yr-1
- Lantzsch et al.(2009b)).
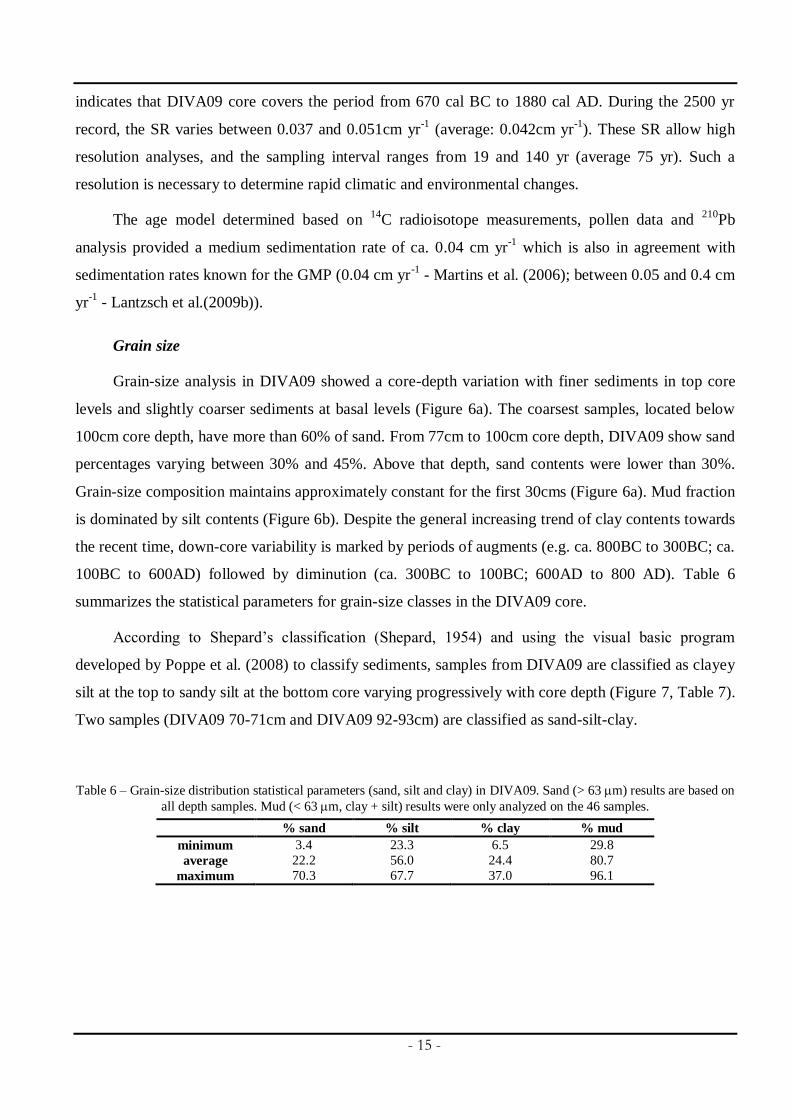
Grain size
Grain-size analysis in DIVA09 showed a core-depth variation with finer sediments in top core
levels and slightly coarser sediments at basal levels (Figure 6a). The coarsest samples, located below
100cm core depth, have more than 60% of sand. From 77cm to 100cm core depth, DIVA09 show sand
percentages varying between 30% and 45%. Above that depth, sand contents were lower than 30%.
Grain-size composition maintains approximately constant for the first 30cms (Figure 6a). Mud fraction
is dominated by silt contents (Figure 6b). Despite the general increasing trend of clay contents towards
the recent time, down-core variability is marked by periods of augments (e.g. ca. 800BC to 300BC; ca.
100BC to 600AD) followed by diminution (ca. 300BC to 100BC; 600AD to 800 AD). Table 6
summarizes the statistical parameters for grain-size classes in the DIVA09 core.
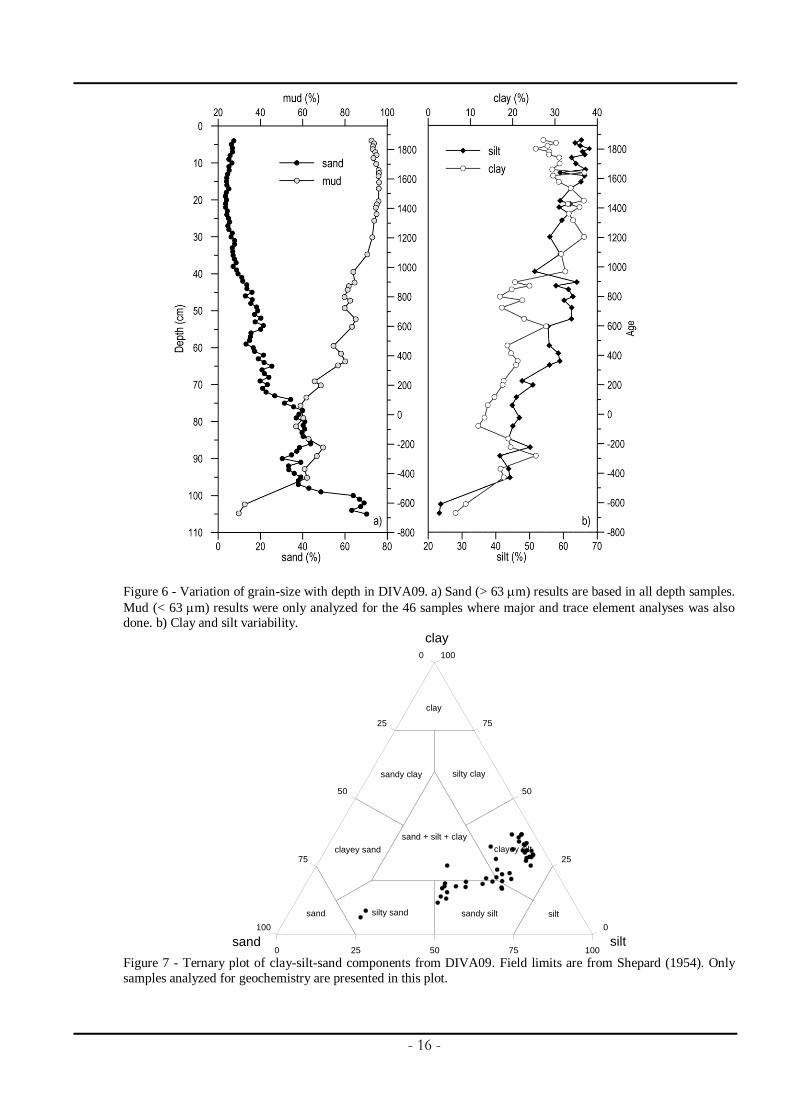
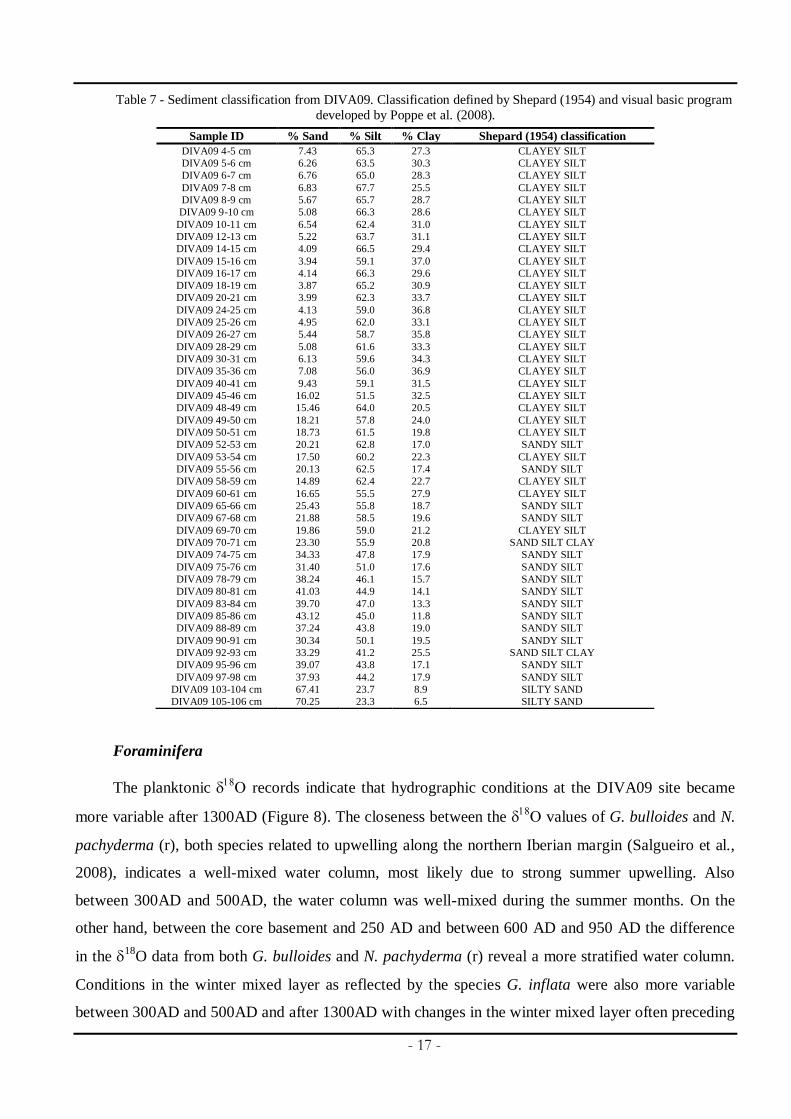
According to Shepard’s classification (Shepard, 1954) and using the visual basic program
developed by Poppe et al. (2008) to classify sediments, samples from DIVA09 are classified as clayey
silt at the top to sandy silt at the bottom core varying progressively with core depth (Figure 7, Table 7).
Two samples (DIVA09 70-71cm and DIVA09 92-93cm) are classified as sand-silt-clay.
Table 6 – Grain-size distribution statistical parameters (sand, silt and clay) in DIVA09. Sand (> 63 m) results are based on
all depth samples. Mud (< 63 m, clay + silt) results were only analyzed on the 46 samples.
% sand % silt % clay % mud
minimum 3.4 23.3 6.5 29.8
average 22.2 56.0 24.4 80.7
maximum 70.3 67.7 37.0 96.1
- 16 -
Figure 6 - Variation of grain-size with depth in DIVA09. a) Sand (> 63 m) results are based in all depth samples.
Mud (< 63 m) results were only analyzed for the 46 samples where major and trace element analyses was also done. b) Clay and silt variability.
0 25 50 75 100silt
100
75
50
25
0
clay
100
75
50
25
0
sand
clay
sandy clay silty clay
sand + silt + clay
clayey sand clayey silt
sand silty sand sandy silt silt
Figure 7 - Ternary plot of clay-silt-sand components from DIVA09. Field limits are from Shepard (1954). Only
samples analyzed for geochemistry are presented in this plot.
- 17 -
Table 7 - Sediment classification from DIVA09. Classification defined by Shepard (1954) and visual basic program
developed by Poppe et al. (2008).
Foraminifera
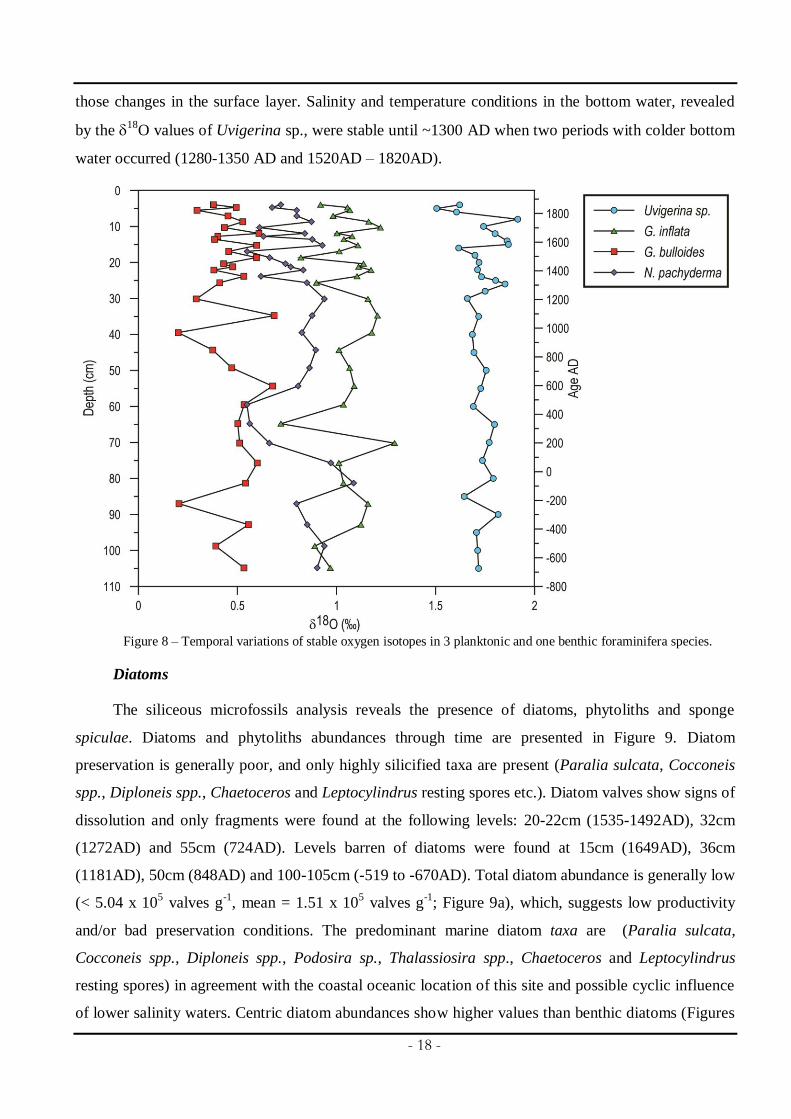
The planktonic records indicate that hydrographic conditions at the DIVA09 site became
more variable after 1300AD (Figure 8). The closeness between the values of G. bulloides and N.
pachyderma (r), both species related to upwelling along the northern Iberian margin (Salgueiro et al.,
2008), indicates a well-mixed water column, most likely due to strong summer upwelling. Also
between 300AD and 500AD, the water column was well-mixed during the summer months. On the
other hand, between the core basement and 250 AD and between 600 AD and 950 AD the difference
in the 18
O data from both G. bulloides and N. pachyderma (r) reveal a more stratified water column.
Conditions in the winter mixed layer as reflected by the species G. inflata were also more variable
between 300AD and 500AD and after 1300AD with changes in the winter mixed layer often preceding
Sample ID % Sand % Silt % Clay Shepard (1954) classification
DIVA09 4-5 cm 7.43 65.3 27.3 CLAYEY SILT
DIVA09 5-6 cm 6.26 63.5 30.3 CLAYEY SILT
DIVA09 6-7 cm 6.76 65.0 28.3 CLAYEY SILT
DIVA09 7-8 cm 6.83 67.7 25.5 CLAYEY SILT
DIVA09 8-9 cm 5.67 65.7 28.7 CLAYEY SILT
DIVA09 9-10 cm 5.08 66.3 28.6 CLAYEY SILT
DIVA09 10-11 cm 6.54 62.4 31.0 CLAYEY SILT
DIVA09 12-13 cm 5.22 63.7 31.1 CLAYEY SILT
DIVA09 14-15 cm 4.09 66.5 29.4 CLAYEY SILT
DIVA09 15-16 cm 3.94 59.1 37.0 CLAYEY SILT
DIVA09 16-17 cm 4.14 66.3 29.6 CLAYEY SILT
DIVA09 18-19 cm 3.87 65.2 30.9 CLAYEY SILT
DIVA09 20-21 cm 3.99 62.3 33.7 CLAYEY SILT
DIVA09 24-25 cm 4.13 59.0 36.8 CLAYEY SILT
DIVA09 25-26 cm 4.95 62.0 33.1 CLAYEY SILT
DIVA09 26-27 cm 5.44 58.7 35.8 CLAYEY SILT
DIVA09 28-29 cm 5.08 61.6 33.3 CLAYEY SILT
DIVA09 30-31 cm 6.13 59.6 34.3 CLAYEY SILT
DIVA09 35-36 cm 7.08 56.0 36.9 CLAYEY SILT
DIVA09 40-41 cm 9.43 59.1 31.5 CLAYEY SILT
DIVA09 45-46 cm 16.02 51.5 32.5 CLAYEY SILT
DIVA09 48-49 cm 15.46 64.0 20.5 CLAYEY SILT
DIVA09 49-50 cm 18.21 57.8 24.0 CLAYEY SILT
DIVA09 50-51 cm 18.73 61.5 19.8 CLAYEY SILT
DIVA09 52-53 cm 20.21 62.8 17.0 SANDY SILT
DIVA09 53-54 cm 17.50 60.2 22.3 CLAYEY SILT
DIVA09 55-56 cm 20.13 62.5 17.4 SANDY SILT
DIVA09 58-59 cm 14.89 62.4 22.7 CLAYEY SILT
DIVA09 60-61 cm 16.65 55.5 27.9 CLAYEY SILT
DIVA09 65-66 cm 25.43 55.8 18.7 SANDY SILT
DIVA09 67-68 cm 21.88 58.5 19.6 SANDY SILT
DIVA09 69-70 cm 19.86 59.0 21.2 CLAYEY SILT
DIVA09 70-71 cm 23.30 55.9 20.8 SAND SILT CLAY
DIVA09 74-75 cm 34.33 47.8 17.9 SANDY SILT
DIVA09 75-76 cm 31.40 51.0 17.6 SANDY SILT
DIVA09 78-79 cm 38.24 46.1 15.7 SANDY SILT
DIVA09 80-81 cm 41.03 44.9 14.1 SANDY SILT
DIVA09 83-84 cm 39.70 47.0 13.3 SANDY SILT
DIVA09 85-86 cm 43.12 45.0 11.8 SANDY SILT
DIVA09 88-89 cm 37.24 43.8 19.0 SANDY SILT
DIVA09 90-91 cm 30.34 50.1 19.5 SANDY SILT
DIVA09 92-93 cm 33.29 41.2 25.5 SAND SILT CLAY
DIVA09 95-96 cm 39.07 43.8 17.1 SANDY SILT
DIVA09 97-98 cm 37.93 44.2 17.9 SANDY SILT
DIVA09 103-104 cm 67.41 23.7 8.9 SILTY SAND
DIVA09 105-106 cm 70.25 23.3 6.5 SILTY SAND
- 18 -
those changes in the surface layer. Salinity and temperature conditions in the bottom water, revealed
by the 18
O values of Uvigerina sp., were stable until ~1300 AD when two periods with colder bottom
water occurred (1280-1350 AD and 1520AD – 1820AD).
Figure 8 – Temporal variations of stable oxygen isotopes in 3 planktonic and one benthic foraminifera species.
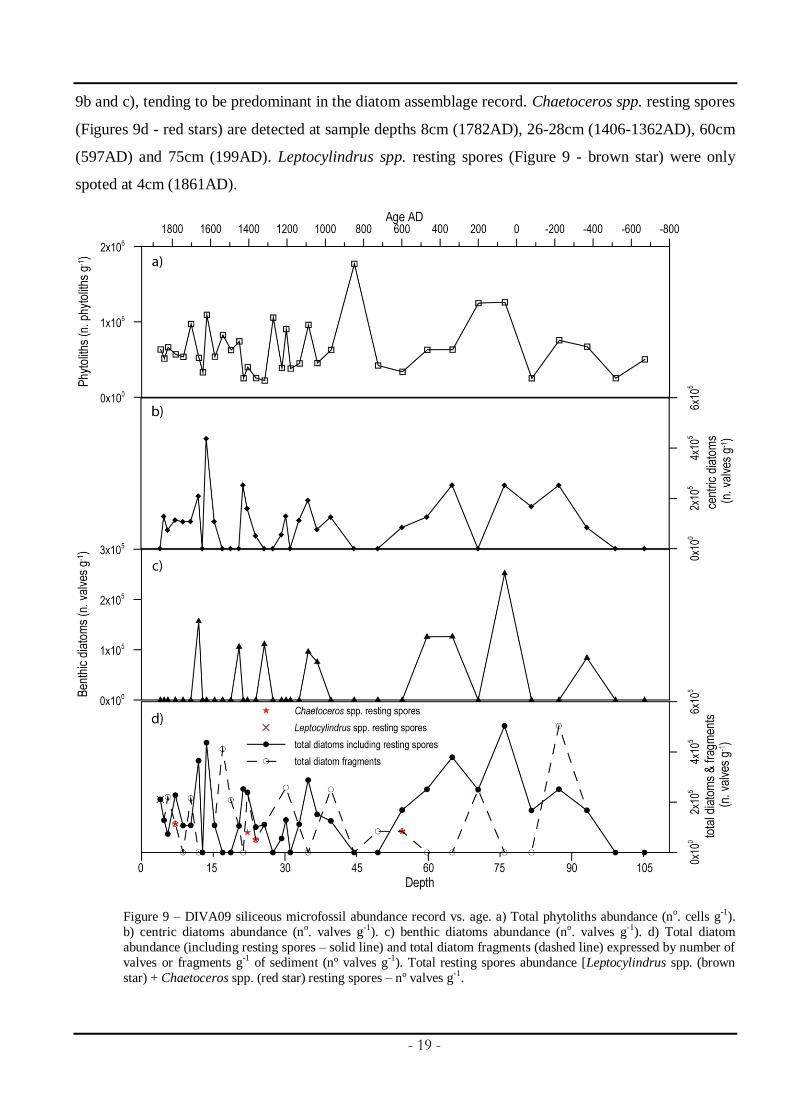
Diatoms
The siliceous microfossils analysis reveals the presence of diatoms, phytoliths and sponge
spiculae. Diatoms and phytoliths abundances through time are presented in Figure 9. Diatom
preservation is generally poor, and only highly silicified taxa are present (Paralia sulcata, Cocconeis
spp., Diploneis spp., Chaetoceros and Leptocylindrus resting spores etc.). Diatom valves show signs of
dissolution and only fragments were found at the following levels: 20-22cm (1535-1492AD), 32cm
(1272AD) and 55cm (724AD). Levels barren of diatoms were found at 15cm (1649AD), 36cm
(1181AD), 50cm (848AD) and 100-105cm (-519 to -670AD). Total diatom abundance is generally low
(< 5.04 x 10⁵ valves g
-1, mean = 1.51 x 10
5 valves g
-1; Figure 9a), which, suggests low productivity
and/or bad preservation conditions. The predominant marine diatom taxa are (Paralia sulcata,
Cocconeis spp., Diploneis spp., Podosira sp., Thalassiosira spp., Chaetoceros and Leptocylindrus
resting spores) in agreement with the coastal oceanic location of this site and possible cyclic influence
of lower salinity waters. Centric diatom abundances show higher values than benthic diatoms (Figures
- 19 -
9b and c), tending to be predominant in the diatom assemblage record. Chaetoceros spp. resting spores
(Figures 9d - red stars) are detected at sample depths 8cm (1782AD), 26-28cm (1406-1362AD), 60cm
(597AD) and 75cm (199AD). Leptocylindrus spp. resting spores (Figure 9 - brown star) were only
spoted at 4cm (1861AD).
Figure 9 – DIVA09 siliceous microfossil abundance record vs. age. a) Total phytoliths abundance (no. cells g-1).
b) centric diatoms abundance (no. valves g-1). c) benthic diatoms abundance (no. valves g-1). d) Total diatom
abundance (including resting spores – solid line) and total diatom fragments (dashed line) expressed by number of
valves or fragments g-1 of sediment (nº valves g-1). Total resting spores abundance [Leptocylindrus spp. (brown
star) + Chaetoceros spp. (red star) resting spores – nº valves g-1.
- 20 -
Phytoliths are observed all along this core, suggesting freshwater flux and transport of inland
sediments derived from the northern Portuguese rivers (e.g. Douro, Minho) to this site, although
freshwater diatoms were not detected. The total phytoliths abundance is generally higher than diatom
abundance but within the same order of magnitude, and vary from 2.22 to 17.70 x 10⁵ cells g
-1 (mean =
6.39 x 10⁵ cells g
-1; Figure 9e). The high values of phytoliths may be related to a high resistance to
dissolution of their silicate bodies.
Geochemistry
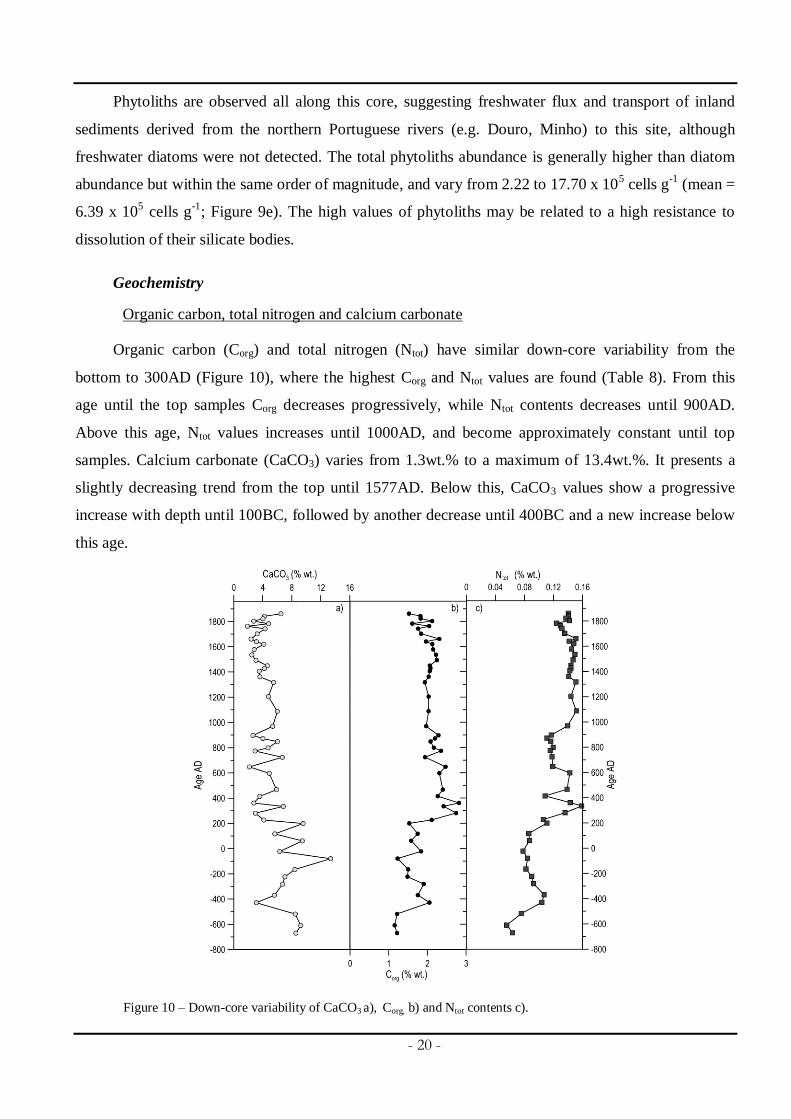
Organic carbon, total nitrogen and calcium carbonate
Organic carbon (Corg) and total nitrogen (Ntot) have similar down-core variability from the
bottom to 300AD (Figure 10), where the highest Corg and Ntot values are found (Table 8). From this
age until the top samples Corg decreases progressively, while Ntot contents decreases until 900AD.
Above this age, Ntot values increases until 1000AD, and become approximately constant until top
samples. Calcium carbonate (CaCO3) varies from 1.3wt.% to a maximum of 13.4wt.%. It presents a
slightly decreasing trend from the top until 1577AD. Below this, CaCO3 values show a progressive
increase with depth until 100BC, followed by another decrease until 400BC and a new increase below
this age.
Figure 10 – Down-core variability of CaCO3 a), Corg, b) and Ntot contents c).
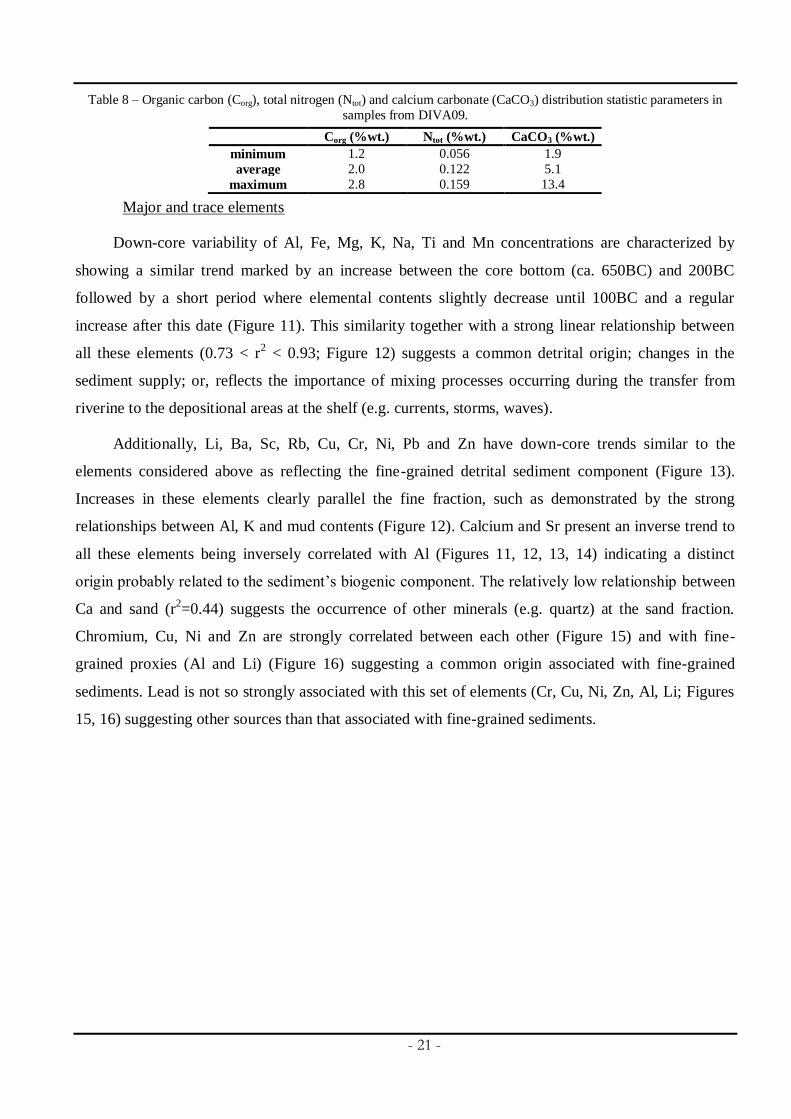
- 21 -
Table 8 – Organic carbon (Corg), total nitrogen (Ntot) and calcium carbonate (CaCO3) distribution statistic parameters in
samples from DIVA09.
Corg (%wt.) Ntot (%wt.) CaCO3 (%wt.)
minimum 1.2 0.056 1.9
average 2.0 0.122 5.1
maximum 2.8 0.159 13.4
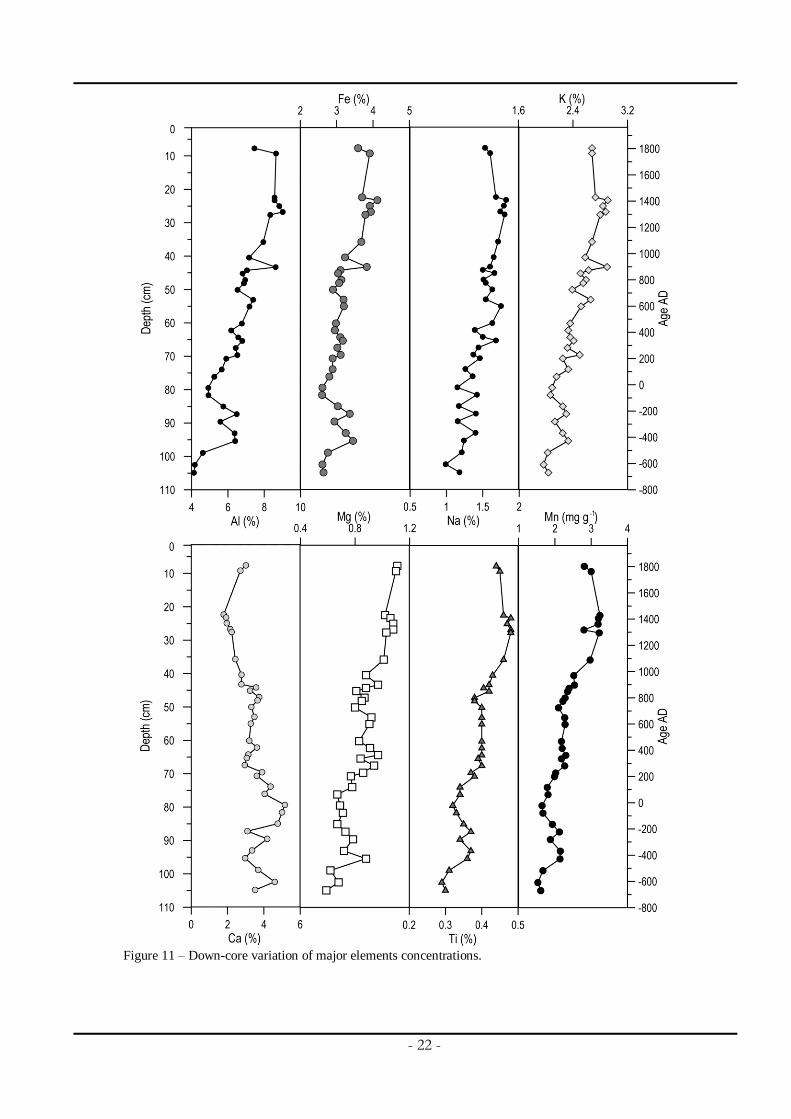
Major and trace elements
Down-core variability of Al, Fe, Mg, K, Na, Ti and Mn concentrations are characterized by
showing a similar trend marked by an increase between the core bottom (ca. 650BC) and 200BC
followed by a short period where elemental contents slightly decrease until 100BC and a regular
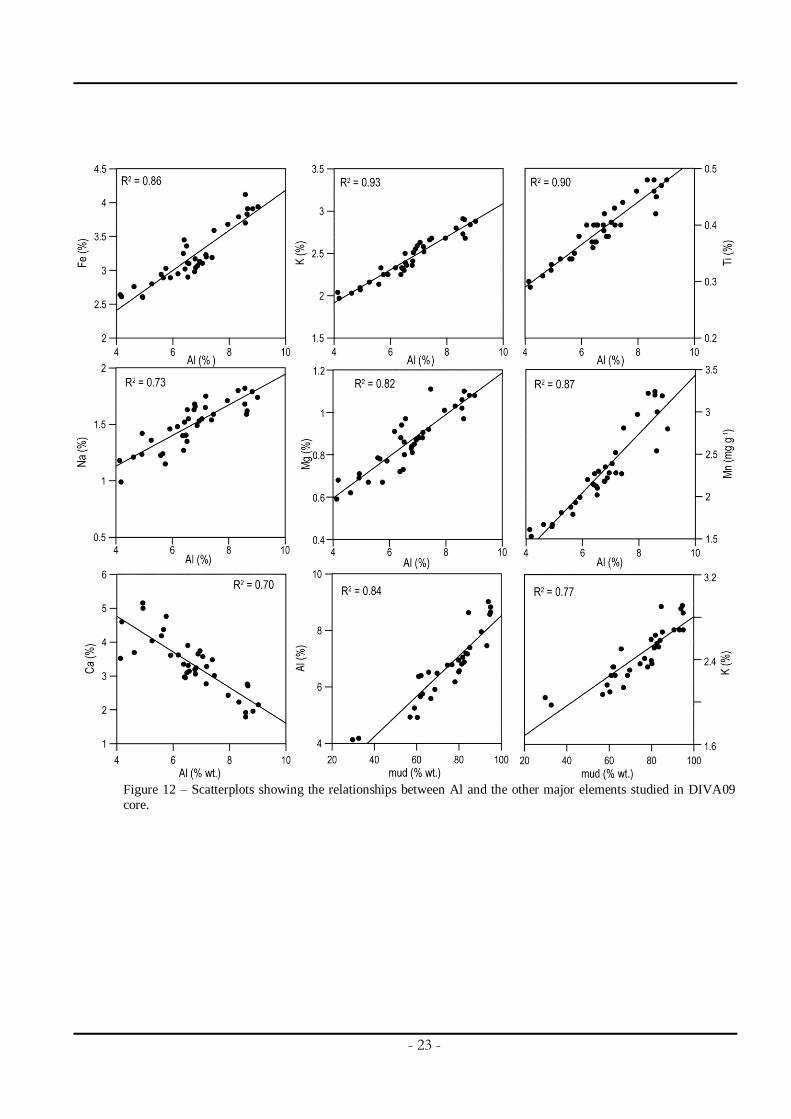
increase after this date (Figure 11). This similarity together with a strong linear relationship between
all these elements (0.73 < r2 < 0.93; Figure 12) suggests a common detrital origin; changes in the
sediment supply; or, reflects the importance of mixing processes occurring during the transfer from
riverine to the depositional areas at the shelf (e.g. currents, storms, waves).
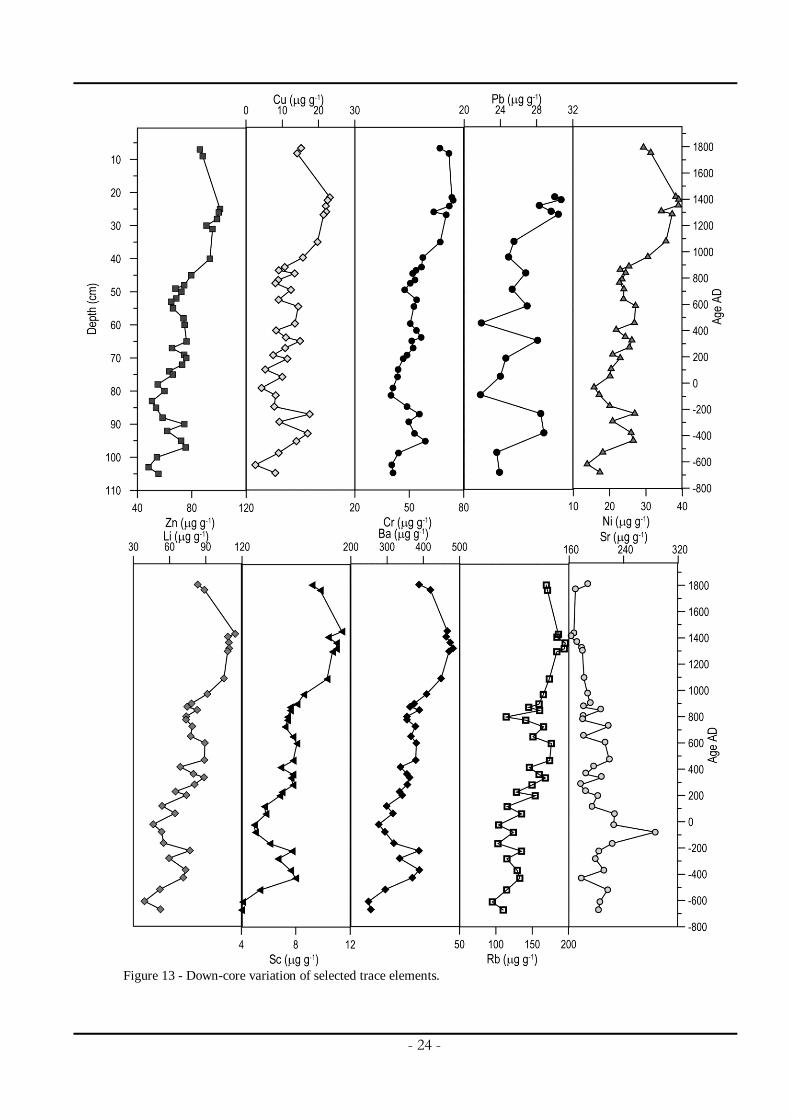
Additionally, Li, Ba, Sc, Rb, Cu, Cr, Ni, Pb and Zn have down-core trends similar to the
elements considered above as reflecting the fine-grained detrital sediment component (Figure 13).
Increases in these elements clearly parallel the fine fraction, such as demonstrated by the strong
relationships between Al, K and mud contents (Figure 12). Calcium and Sr present an inverse trend to
all these elements being inversely correlated with Al (Figures 11, 12, 13, 14) indicating a distinct
origin probably related to the sediment’s biogenic component. The relatively low relationship between
Ca and sand (r2=0.44) suggests the occurrence of other minerals (e.g. quartz) at the sand fraction.
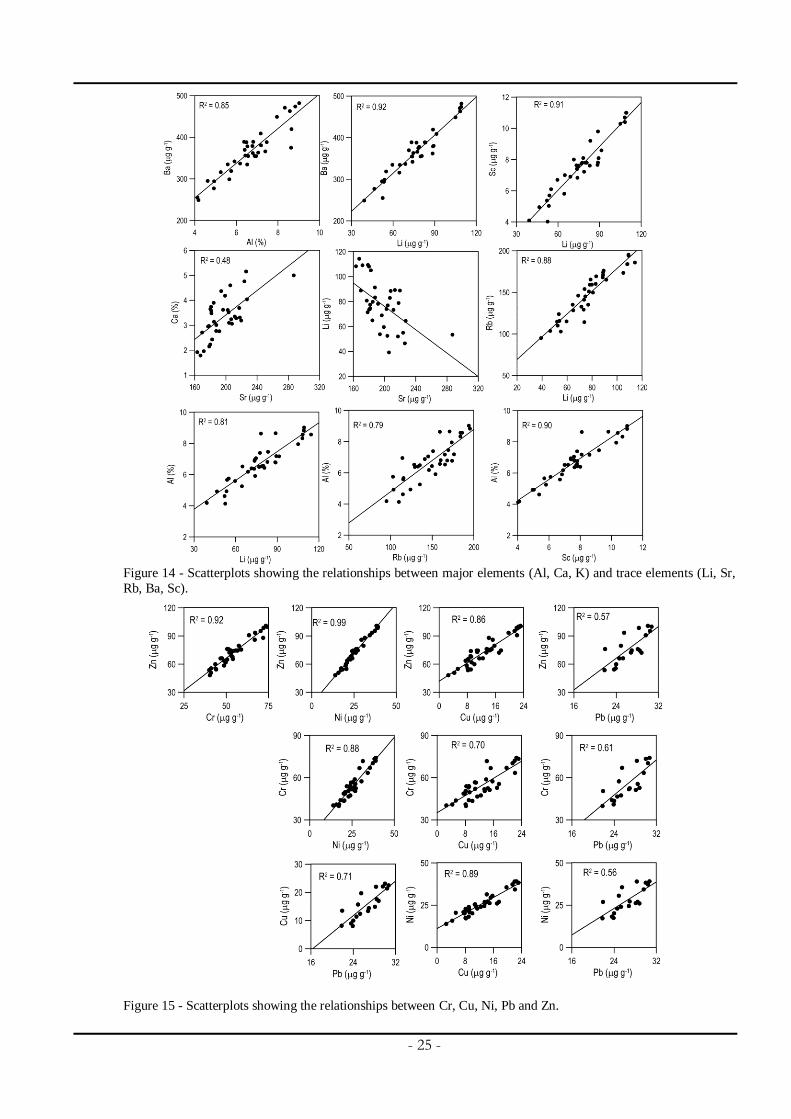
Chromium, Cu, Ni and Zn are strongly correlated between each other (Figure 15) and with fine-
grained proxies (Al and Li) (Figure 16) suggesting a common origin associated with fine-grained
sediments. Lead is not so strongly associated with this set of elements (Cr, Cu, Ni, Zn, Al, Li; Figures
15, 16) suggesting other sources than that associated with fine-grained sediments.
- 22 -
Figure 11 – Down-core variation of major elements concentrations.
- 23 -
Figure 12 – Scatterplots showing the relationships between Al and the other major elements studied in DIVA09
core.
- 24 -
Figure 13 - Down-core variation of selected trace elements.
- 25 -
Figure 14 - Scatterplots showing the relationships between major elements (Al, Ca, K) and trace elements (Li, Sr,
Rb, Ba, Sc).
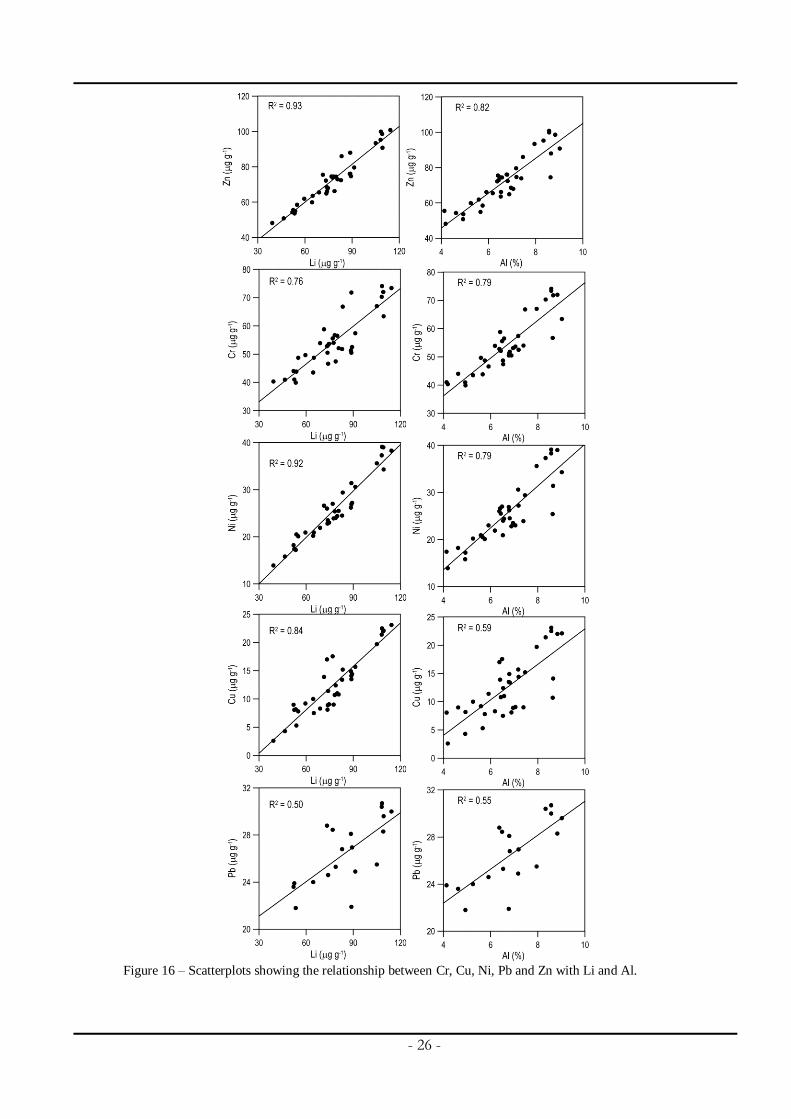
Figure 15 - Scatterplots showing the relationships between Cr, Cu, Ni, Pb and Zn.
- 26 -
Figure 16 – Scatterplots showing the relationship between Cr, Cu, Ni, Pb and Zn with Li and Al.
- 27 -
Biomarkers
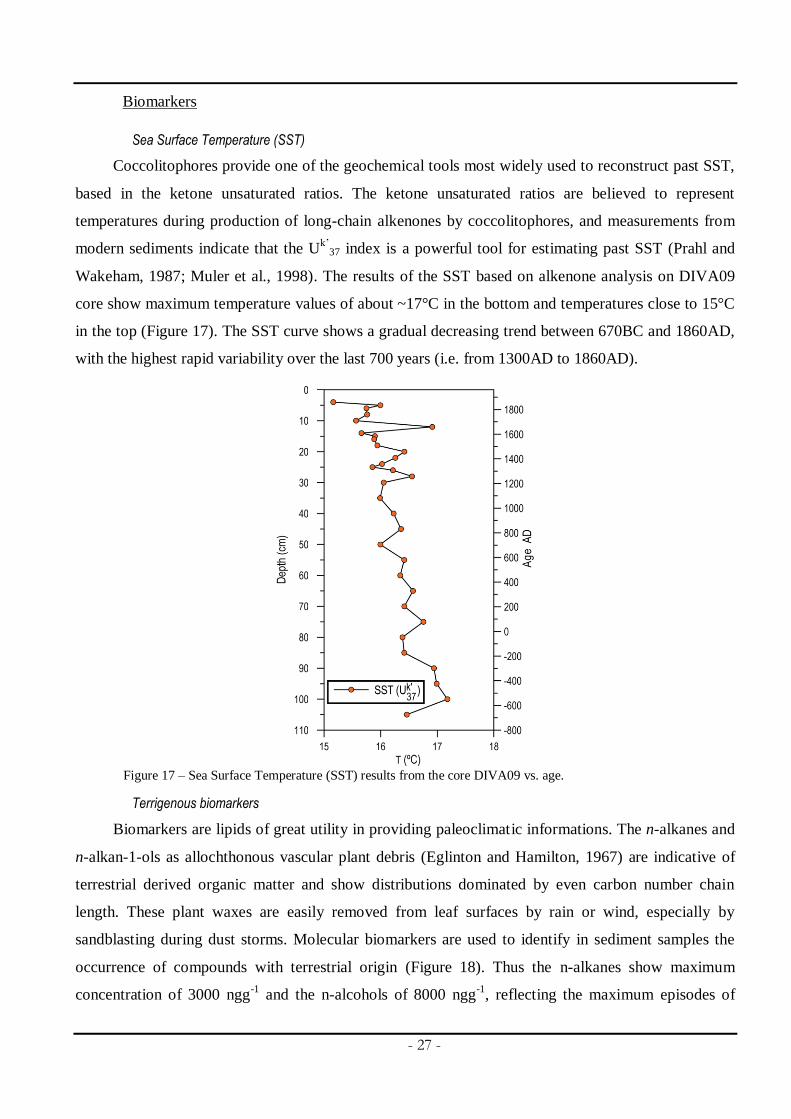
Sea Surface Temperature (SST)
Coccolitophores provide one of the geochemical tools most widely used to reconstruct past SST,
based in the ketone unsaturated ratios. The ketone unsaturated ratios are believed to represent
temperatures during production of long-chain alkenones by coccolitophores, and measurements from
modern sediments indicate that the Uk’
37 index is a powerful tool for estimating past SST (Prahl and
Wakeham, 1987; Muler et al., 1998). The results of the SST based on alkenone analysis on DIVA09
core show maximum temperature values of about ~17°C in the bottom and temperatures close to 15°C
in the top (Figure 17). The SST curve shows a gradual decreasing trend between 670BC and 1860AD,
with the highest rapid variability over the last 700 years (i.e. from 1300AD to 1860AD).
Figure 17 – Sea Surface Temperature (SST) results from the core DIVA09 vs. age.
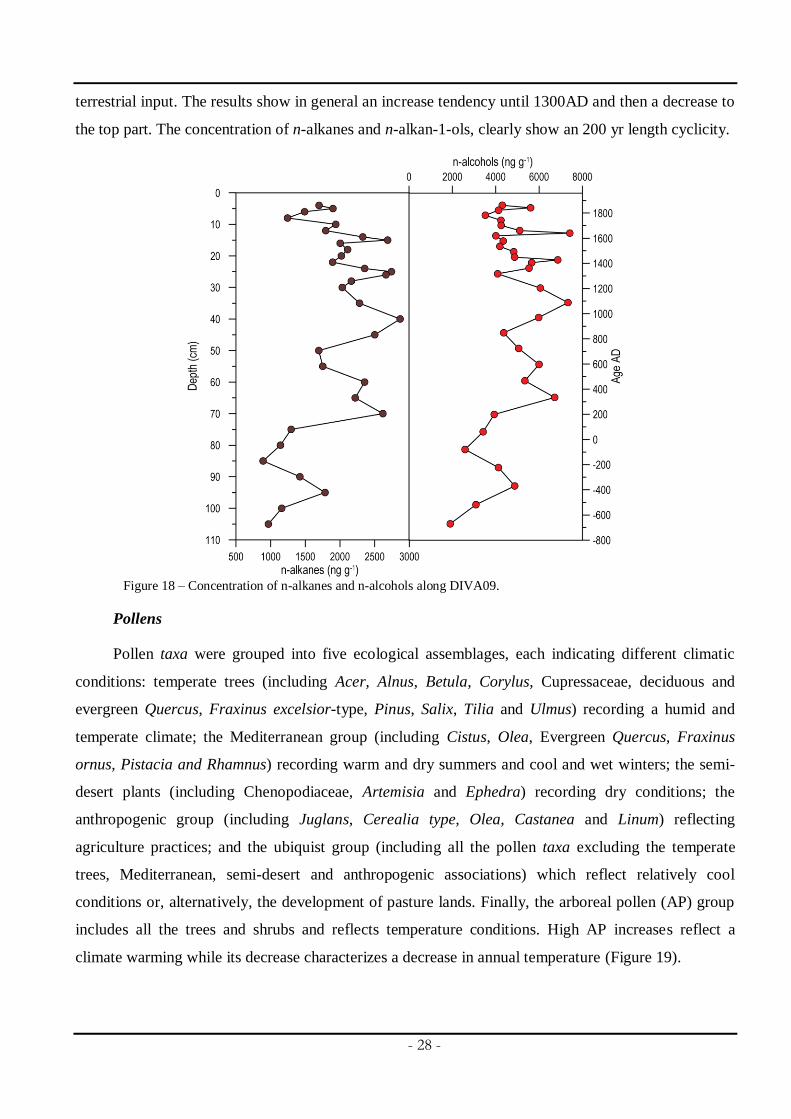
Terrigenous biomarkers
Biomarkers are lipids of great utility in providing paleoclimatic informations. The n-alkanes and
n-alkan-1-ols as allochthonous vascular plant debris (Eglinton and Hamilton, 1967) are indicative of
terrestrial derived organic matter and show distributions dominated by even carbon number chain
length. These plant waxes are easily removed from leaf surfaces by rain or wind, especially by
sandblasting during dust storms. Molecular biomarkers are used to identify in sediment samples the
occurrence of compounds with terrestrial origin (Figure 18). Thus the n-alkanes show maximum
concentration of 3000 ngg-1
and the n-alcohols of 8000 ngg-1
, reflecting the maximum episodes of
- 28 -
terrestrial input. The results show in general an increase tendency until 1300AD and then a decrease to
the top part. The concentration of n-alkanes and n-alkan-1-ols, clearly show an 200 yr length cyclicity.
Figure 18 – Concentration of n-alkanes and n-alcohols along DIVA09.
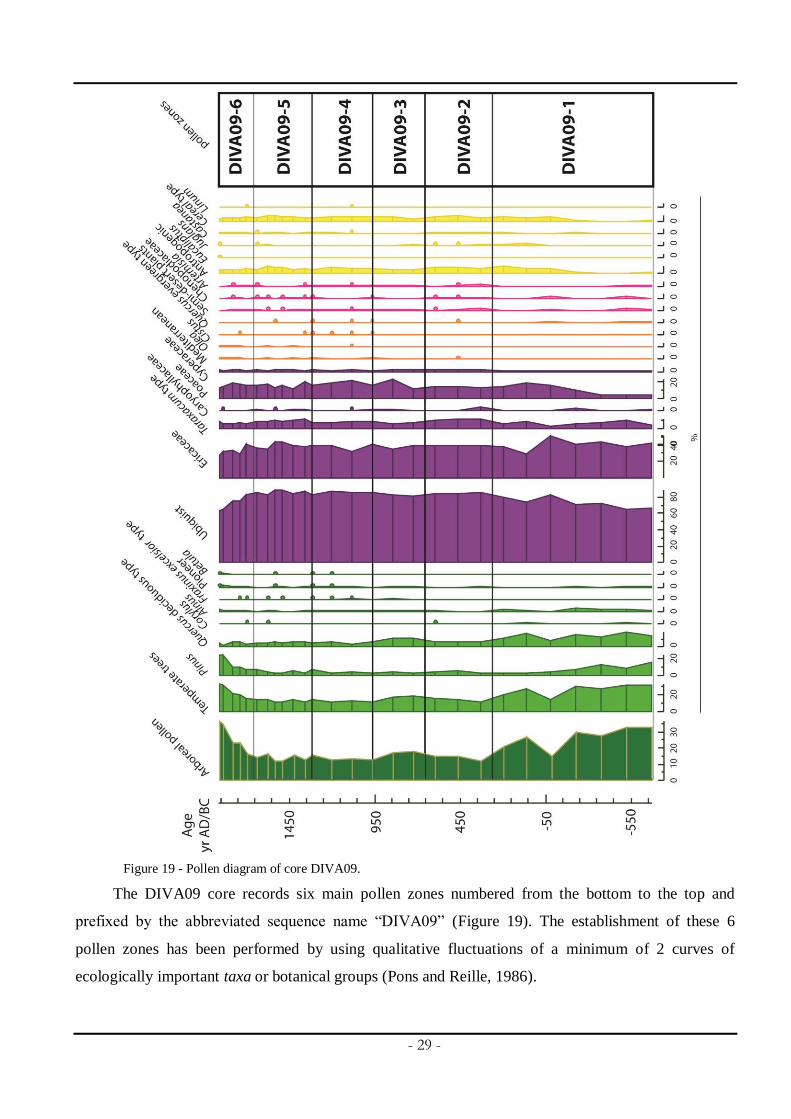
Pollens
Pollen taxa were grouped into five ecological assemblages, each indicating different climatic
conditions: temperate trees (including Acer, Alnus, Betula, Corylus, Cupressaceae, deciduous and
evergreen Quercus, Fraxinus excelsior-type, Pinus, Salix, Tilia and Ulmus) recording a humid and
temperate climate; the Mediterranean group (including Cistus, Olea, Evergreen Quercus, Fraxinus
ornus, Pistacia and Rhamnus) recording warm and dry summers and cool and wet winters; the semi-
desert plants (including Chenopodiaceae, Artemisia and Ephedra) recording dry conditions; the
anthropogenic group (including Juglans, Cerealia type, Olea, Castanea and Linum) reflecting
agriculture practices; and the ubiquist group (including all the pollen taxa excluding the temperate
trees, Mediterranean, semi-desert and anthropogenic associations) which reflect relatively cool
conditions or, alternatively, the development of pasture lands. Finally, the arboreal pollen (AP) group
includes all the trees and shrubs and reflects temperature conditions. High AP increases reflect a
climate warming while its decrease characterizes a decrease in annual temperature (Figure 19).
- 29 -
Figure 19 - Pollen diagram of core DIVA09.
The DIVA09 core records six main pollen zones numbered from the bottom to the top and
prefixed by the abbreviated sequence name “DIVA09” (Figure 19). The establishment of these 6
pollen zones has been performed by using qualitative fluctuations of a minimum of 2 curves of
ecologically important taxa or botanical groups (Pons and Reille, 1986).
- 30 -
The first pollen zone (DIVA09-1), 600BC-250AD, is marked by relative high percentages of
temperate forest and in particular by deciduous Quercus, Pinus and Alnus forest and arboreal pollen
which reflect warm and relatively wet conditions. The appearance of anthropogenic taxa is marked at
220BC reflecting the beginning of agriculture’s practices in this region by romans. In particular, we
note the beginning of the continuous presence of Cerealia since 220BC and also the appearance of
Juglans at ca. 50BC. Both were also observed in the Ría de Vigo by Desprat et al. (2003).
The second pollen zone (DIVA09-2), 250AD-650AD, is marked by a decrease of AP and
temperate trees and, in particular of deciduos Quercus and Alnus, and an increase of the ubiquist group
reflecting a relative climatic cooling. The slight increase in semi-desert plants suggest a relatively
dryness of the continental conditions. However, this cooling and relatively dryness was not strong
enough to perturb the agriculture practices that have started some centuries ago. This cooling has also
been recorded in the Ría de Vigo identified by Desprat et al. (2003).
The third pollen zone (DIVA09-3), 650AD-950AD, is marked by a slight increase of temperate
trees including deciduous Quercus, Fraxinus excelsior type and Alnus and a slight decrease of the
semi-desert plants reflecting a relatively warming and slight increase of moist conditions. Although the
climatic conditions were relatively better for agriculture practices there is a decrease in these taxa.
The fourth pollen zone (DIVA09-4), 950AD-1300AD, is marked by a slight decrease of
temperate forest, the beginning of the continuous curve of Mediterranean taxa and increase of semi-
desert plants. This suggests that there is a replacement of warm and wet conditions to a more
Mediterranean climate which is characterized by warm and dry summers and cool and wet winters.
The fifths pollen zone (DIVA09-5), 1300AD-1700AD, is characterized by a similar pollen
assemblage of the last pollen zone, but with relatively high percentages of ubiquists and episodes of
appearance and disappearance of semi-desert plants and of Mediterranean taxa. This suggests some
instability of the NW Iberian Peninsula climate with extremely rapid or minor climate changes. In
order to better understand what happened during this period we should study a higher resolution record
should be studied. There are also two small episodes of increasing Pinus at around 1300 and 1450AD.
The increase at 1300AD can be associated with two historical events, such as the plantation of a large
area in Leiria region of pine trees by the Portuguese king D. Dinis (ca. 1310AD) and in other regions
by the Cistercian monks for stabilizing sand dunes and soil protection, respectively (de Carvalho,
1960), and also for the use of pine wood for development of the naval industry (caravels and other
types of seafaring vessels) during the era of Portuguese maritime expansion (around the 15 and 16th
centuries).
- 31 -
Finally, the last pollen zone, (DIVA09-6), 1700AD-1880AD, is marked by an increase of Pinus
percentages and therefore by an increase of temperate trees and AP associated with human activity.
Indeed, it is known that the beginning of the continuous presence of Pinus forest has started 300 years
ago (Queiroz and Mateus, 1994) and that they reach their maximum abundances in the last century as
the result of successive deforestation policies (Valdès and Gil Sánchez, 2001).
Discussion
Temporal variability in organic matter composition
Organic matter constitutes (e.g. elemental C, N compositions, carbon and nitrogen stable isotope
ratios, biomarker compounds) have been used to reconstruct marine and continental
paleoenvironmental conditions (Meyers, 1997). The Corg/Ntot ratios have been used as a first approach
to distinguish between marine (4-10) and continental (>20) origins of sedimentary organic matter (e.g.
Meyers, 1994; Meyers, 1997). Intermediate values are usually found in marine systems close to land or
in lakes, where mixing between terrestrial and aquatic organic matter occurs. Nevertheless, this
elemental ratio can be affected by other sediment properties (e.g. grain size, proportion of inorganic
nitrogen associated with clay minerals) and diagenetic processes. All these interactions may lead to a
misunderstanding of organic matter sources (Cato, 1977). Also, in samples with low organic matter
contents (< 0.3%) the Corg/Ntot ratios can sometimes be artificially depressed by a relatively large
proportion of inorganic nitrogen (Meyers, 1997).
The regression between Corg and Ntot indicates that only 42% of Ntot is explained by Corg (Figure
20a), suggesting the presence of other nitrogen forms besides those associated with organic matter.
This fact, together with the relatively high regression coefficient between Ntot and clays indicates a
grain-size control of the nitrogen distribution (Figure 20b). The positive y-intercept in the Ntot and Corg
relationship is interpreted indicating the presence of an inorganic nitrogen (Ninorg) component in the
sediments (Schubert and Calvert, 2001). If the Corg and Norg linear regression is considered, the y-
intercept is (0.005%), corresponding to a negligible fraction of inorganic Ntot (Figure 20c). As so, we
used the total Norg fraction for the Corg/Ntot ratios calculations in order to avoid its overestimation
(Schubert and Calvert, 2001). The Ninorg is probably bounded as ammonium ions to clay particles,
especially illite (Stein and Rack, 1995) the dominant clay mineral in the northern shelf surface samples
(Oliveira et al., 2002a). Organic carbon to Ntot ratios ranged between 11 and 24 with an average of 16,
while Corg/Norg ratios lie between 16 and 29, with an average of 22 (Figure 21). The average ratios shift
the interpretation of the organic matter from a mixed marine/terrestrial to a terrestrial source, with
down-core trend revealing an increasing influence of terrestrial organic matter sources. Although this
- 32 -
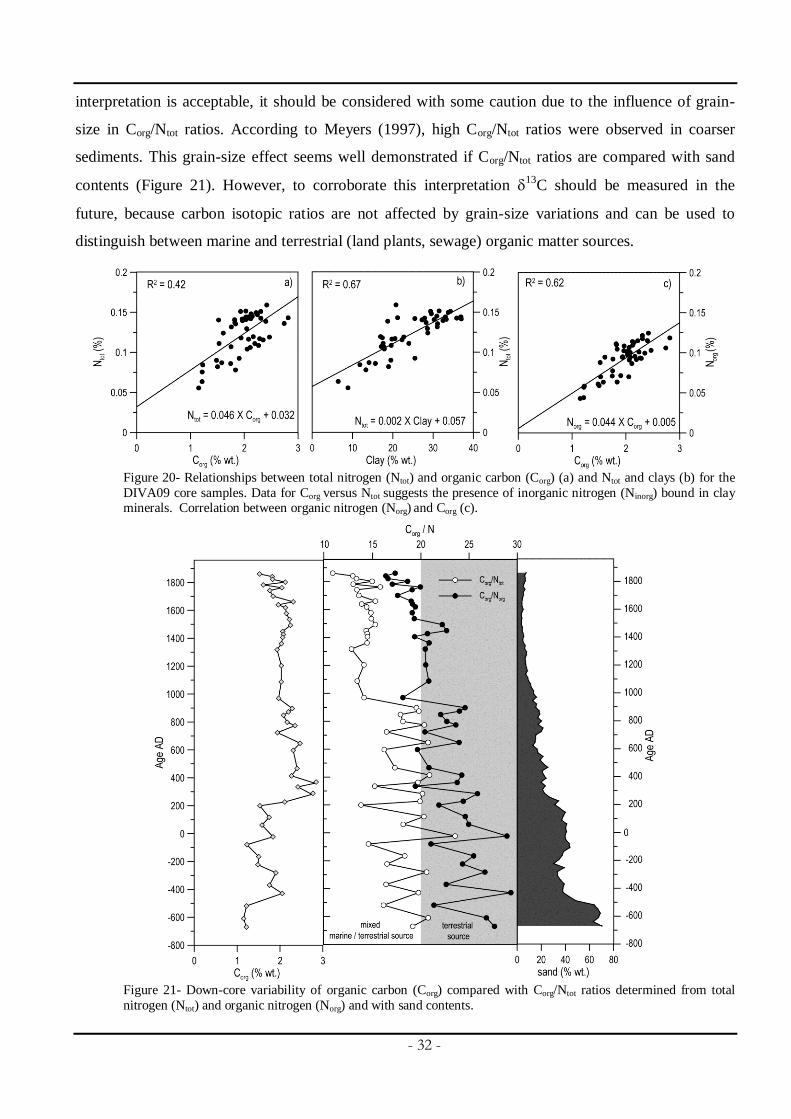
interpretation is acceptable, it should be considered with some caution due to the influence of grain-
size in Corg/Ntot ratios. According to Meyers (1997), high Corg/Ntot ratios were observed in coarser
sediments. This grain-size effect seems well demonstrated if Corg/Ntot ratios are compared with sand
contents (Figure 21). However, to corroborate this interpretation 13
C should be measured in the
future, because carbon isotopic ratios are not affected by grain-size variations and can be used to
distinguish between marine and terrestrial (land plants, sewage) organic matter sources.
Figure 20- Relationships between total nitrogen (Ntot) and organic carbon (Corg) (a) and Ntot and clays (b) for the
DIVA09 core samples. Data for Corg versus Ntot suggests the presence of inorganic nitrogen (Ninorg) bound in clay minerals. Correlation between organic nitrogen (Norg) and Corg (c).
Figure 21- Down-core variability of organic carbon (Corg) compared with Corg/Ntot ratios determined from total
nitrogen (Ntot) and organic nitrogen (Norg) and with sand contents.
- 33 -
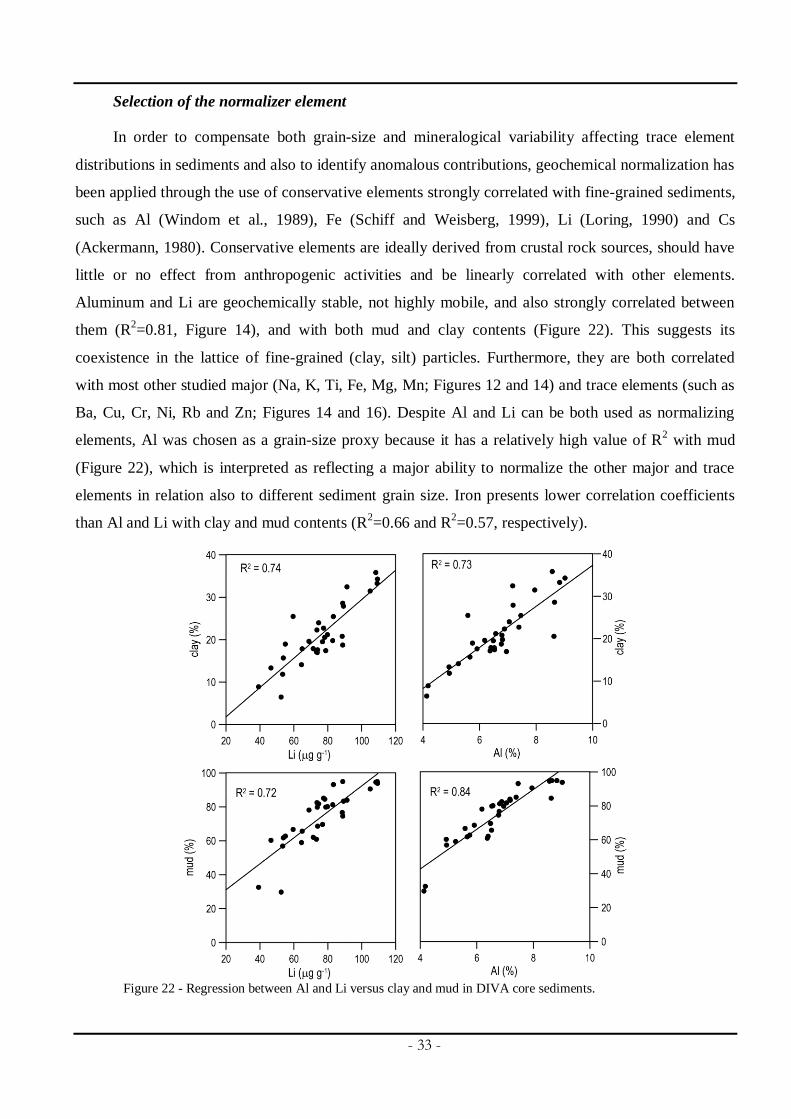
Selection of the normalizer element
In order to compensate both grain-size and mineralogical variability affecting trace element
distributions in sediments and also to identify anomalous contributions, geochemical normalization has
been applied through the use of conservative elements strongly correlated with fine-grained sediments,
such as Al (Windom et al., 1989), Fe (Schiff and Weisberg, 1999), Li (Loring, 1990) and Cs
(Ackermann, 1980). Conservative elements are ideally derived from crustal rock sources, should have
little or no effect from anthropogenic activities and be linearly correlated with other elements.
Aluminum and Li are geochemically stable, not highly mobile, and also strongly correlated between
them (R2=0.81, Figure 14), and with both mud and clay contents (Figure 22). This suggests its
coexistence in the lattice of fine-grained (clay, silt) particles. Furthermore, they are both correlated
with most other studied major (Na, K, Ti, Fe, Mg, Mn; Figures 12 and 14) and trace elements (such as
Ba, Cu, Cr, Ni, Rb and Zn; Figures 14 and 16). Despite Al and Li can be both used as normalizing
elements, Al was chosen as a grain-size proxy because it has a relatively high value of R2 with mud
(Figure 22), which is interpreted as reflecting a major ability to normalize the other major and trace
elements in relation also to different sediment grain size. Iron presents lower correlation coefficients
than Al and Li with clay and mud contents (R2=0.66 and R
2=0.57, respectively).
Figure 22 - Regression between Al and Li versus clay and mud in DIVA core sediments.

- 34 -
Temporal variability in supply of terrigenous materials
The variability of Fe/Al and Ti/Al ratios has been associated with changes in abundances of
heavy minerals (e.g. amphibole, pyroxene, olivine, rutile, anatase). They can be interpreted as
reflecting the strength of the sediment transport process (Zabel et al., 1999; 2001) and/or the energy of
river discharges. Potassium is mostly associated with potassium feldspar, illite (Yarincik et al., 2000)
and micas. K/Al ratios have been used as a proxy for intensity of chemical weathering (strongly
affected by climatic parameters, principally rainfall and temperature), with high ratios indicating the
dominance of physical weathering (Schneider et al., 1997).
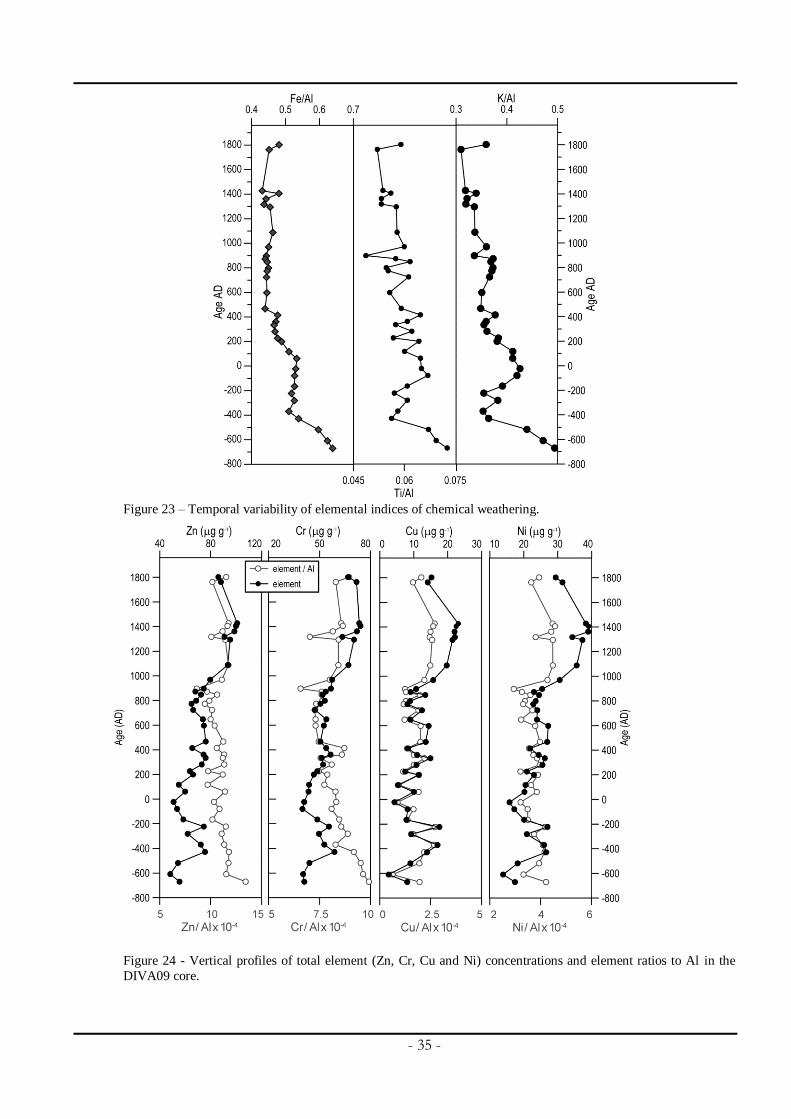
Temporal variability of K/Al, Fe/Al and Ti/Al ratios presents the same increasing trends with
depth characterized by high ratios on bottom levels (Figure 23), suggesting major abundance of heavy
minerals and potassium feldspar. This mineralogical association can result from high energetic
environmental shelf conditions (which should not allow the deposition of fine particles), and/ or
associated with an increased level of precipitation that may be responsible by high river discharges and
consequently a major efficiency on the transfer of large grain size terrigenous materials to the shelf, or
both hypothesis. The high abundances of pollens derived from temperate forest (Figure 19) and major
terrestrial source contributions derived from Corg/Ntot ratios (Figure 21) on these same levels seem to
imply the occurrence of precipitation. Nevertheless, it is important to emphasize that temperate
conditions evidenced by pollen data are not warm and wet enough to shift the prevailing physical
weathering conditions to chemical weathering conditions, such as found in tropical and humid areas, as
also indicated by the dominance of illite in surface sediments of the northern shelf area (Oliveira et al.,
2002a).
Other trace elements (e.g. Cr, Cu, Ni, Pb and Zn) are released to the environment by natural
processes and anthropogenic activities. These elements have been used by Man in their activities for
thousands of years in distinct applications (e.g. manufacturing of materials, health applications, fossil
fuel burning and mining) (Patterson, 1972; Nriagu, 1996). The anthropogenic impact started during the
Greek and Roman times, but is the Industrial Revolution that corresponds to the historical period
where considerable increments in the use of these elements resulted in a significant release into the
environment (Nriagu, 1996). The depth profiles for elemental normalized ratios to Al (open circles,
Figure 24) do not show any increasing trend towards the top sediments (normally interpreted as
reflecting anthropogenic contributions) suggesting that increasing trends on total elemental variations
(filled circles, Figure 24) are predominantly reflecting grain-size variations.
- 35 -
Figure 23 – Temporal variability of elemental indices of chemical weathering.
Figure 24 - Vertical profiles of total element (Zn, Cr, Cu and Ni) concentrations and element ratios to Al in the
DIVA09 core.

- 36 -
Climatic changes in the NW Portuguese Margin and the influence of human activities since
the last 2500 years
δ18
O-isotope composition of the NorthGRIP ice-core (Johnsen et al., 2001) and the decrease of
mid-latitude summer insolation (after Berger, 1978) during the late Holocene (Figure 25) are in
agreement with the previous suggestion that forest recession through the Holocene might be mainly the
result of natural processes (Magri, 1995).
Figure 25 - Vegetation changes and quantitative Sea Surface Temperature (SST) variability in northwestern
Iberian Peninsula and margin correlated with summer insolation at 30° N (after Berger, 1978) and δ18O-isotope
composition of the NorthGRIP ice-core (Johnsen et al., 2001) during the late Holocene.
Previous studies of sea-surface conditions of the North Atlantic and Mediterranean regions have
shown an apparent long-term cooling trend driven by northern high latitudes summer insolation
decreased during the Holocene (Marchal et al., 2002; Andersen et al., 2004; Moros et al., 2004,
Rodrigues et al 2009). Several climate models also suggested an orbitally-induced mechanism as the
main forcing factor for the long-term climatic trend over the Holocene (Kutzbach and Gallimore,
1988; Crucifix et al., 2002; Weber and Oerlemans, 2003; Renssen et al., 2005). Other authors (e.g.
- 37 -
Lorenz et al., 2006), have compared global alkenone-derived SST data with transient climate
simulations using a coupled atmosphere-ocean general circulation model (AOGMC) for the last 7000
yr cal BP (less instable climate period) suggesting that mid- to late Holocene long-term SST trends
were driven by insolation changes. Although SST gradually decreases up to nowadays, there is an
increase in arboreal pollen and temperate trees percentage resulting from the increase of Pinus induced
by successive reforestation policies (Valdès and Gil Sánchez, 2001).
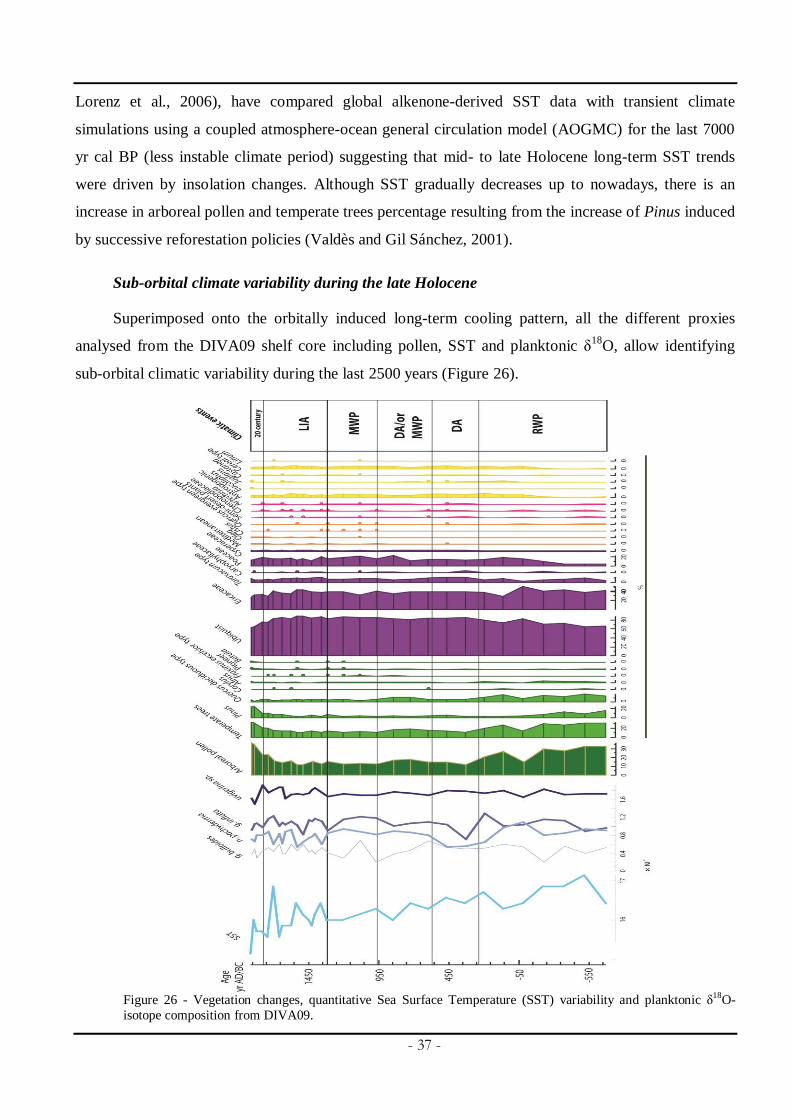
Sub-orbital climate variability during the late Holocene
Superimposed onto the orbitally induced long-term cooling pattern, all the different proxies
analysed from the DIVA09 shelf core including pollen, SST and planktonic δ18
O, allow identifying
sub-orbital climatic variability during the last 2500 years (Figure 26).
Figure 26 - Vegetation changes, quantitative Sea Surface Temperature (SST) variability and planktonic δ18O-
isotope composition from DIVA09.
- 38 -
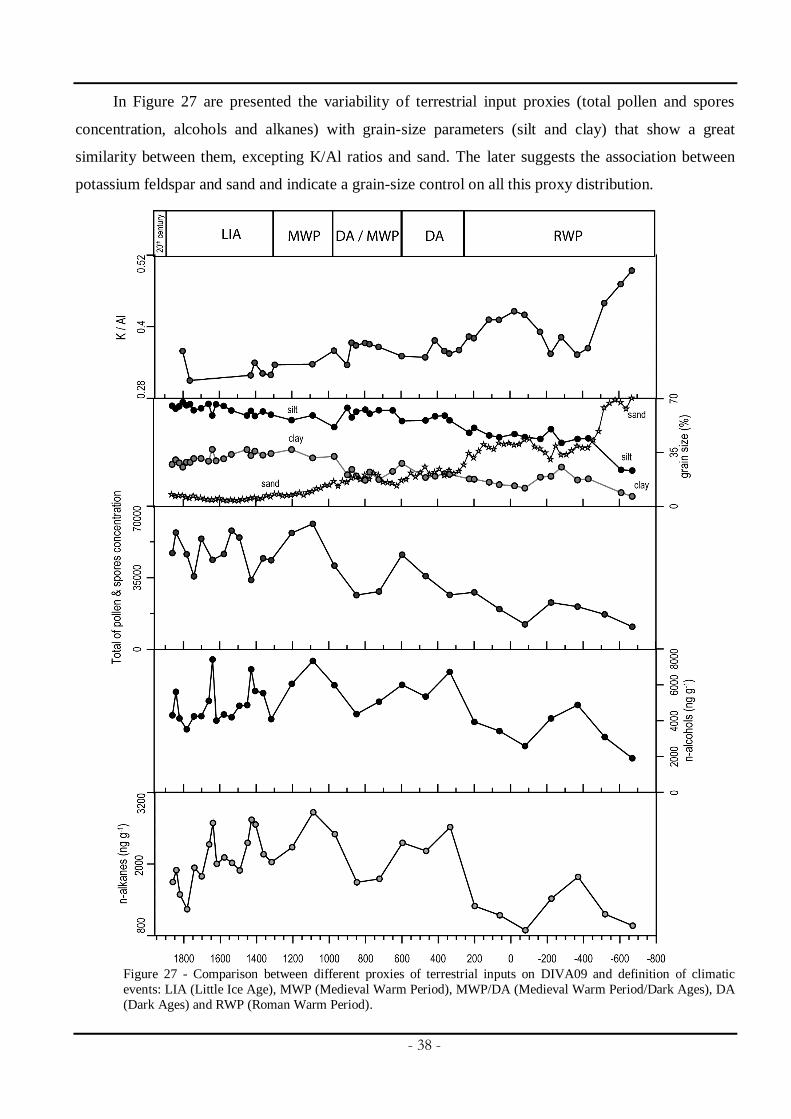
In Figure 27 are presented the variability of terrestrial input proxies (total pollen and spores
concentration, alcohols and alkanes) with grain-size parameters (silt and clay) that show a great
similarity between them, excepting K/Al ratios and sand. The later suggests the association between
potassium feldspar and sand and indicate a grain-size control on all this proxy distribution.
Figure 27 - Comparison between different proxies of terrestrial inputs on DIVA09 and definition of climatic
events: LIA (Little Ice Age), MWP (Medieval Warm Period), MWP/DA (Medieval Warm Period/Dark Ages), DA
(Dark Ages) and RWP (Roman Warm Period).
- 39 -
The first climatic event, occurring between the core basement (670BC) and 250AD, reflecting
warm and relatively wet conditions over the continent and the highest SST values (about 17° C) of the
last 2500 years, marked the Roman Warm Period (RWP) in NW Iberian Peninsula and margin.
Although there are some important evidences of human activities in the pollen diagram, as testified by
the beginning of the Roman agriculture’s practices (e.g. the appearance of continuous cereals curve,
Juglans and Castanea), they do not affect the stability of regional forest communities as revealed by
the constant presence of temperate trees, which were probably mainly controlled by climate (Figure
26). Nevertheless, the chronology of this warm event does not entirely coincide with the chronology
attributed to the RWP by other authors. In the Iberian Peninsula and adjacent margin several limits
have been proposed for this event: 0-500AD (Martinez-Cortizas et al., 1999; Diz et al., 2002); 0-
550AD (Abrantes et al., 2005b); 0-300AD (Lebreiro et al., 2006), 0-400AD (Eriksson et al., 2006); 50
BC-250AD (Bernárdez et al., 2008); 250BC-400AD (Desprat et al., 2003); 300BC-550AD (Martin-
Chivelet et al., 2011). Assuming the date limits for this event, the timing for the DIVA09 core is
overestimated (670BC) since we used an independent second order polynomial adjustment on the
accepted and well constrained dated levels below 85cm of core depth. Taking into account
palynological evidences of human impact in the DIVA09 core and results revealed by Desprat et al.
(2003) in the Ría de Vigo record, it is possible to delimitate ca. 200BC as the date for the continuous
presence of Cerealia in the Iberian Peninsula. Also, it is known that the appearance of Castanea in the
Iberian Peninsula occurred before the 1st century AD (ca. 150BC) (Desprat et al., 2003; Carrion et al.,
2010) as likely the result of Roman culture practices (Rodriguez et al. 1992; Conedera et al., 2004). In
the DIVA09 pollen diagram, the first appearance of chestnut was detected at ca. 219BC. Both
palynological evidences in this region are in agreement with the chronology proposed for Romans
settlement in the Iberian Peninsula (ca.219BC;
http://pt.wikipedia.org/wiki/Invasão_romana_da_peninsula_Ibérica ).
Thus, the climatic warming, defining the RWP, was characterized by a temperate forest present
probably before the Romans settled in the Iberian Peninsula, i.e. before 219BC. We propose the
beginning of this climate warming event for 300BC as revealed by stable carbon isotope records
obtained in three caves from N Spain by Martin-Chivelet et al. (2011). Additionally, there are some
evidences of the increase of near-bottom water speed flow in the south Iceland basin (Bianchi and
McCave, 1999), which started some centuries before the 0AD and peaked at around ca. 100AD, being
associated with a warming period ( most certainly the RWP).
During this event, the water column was well stratified suggesting poor to no upwelling episodes
while a gradual increase of continental input is revealed by the increase in pollen concentration, n-
- 40 -
alkanes and n-alcohols in the study area. These evidences are associated with the negative prevailing
mode of the North Atlantic Oscillation (NAO-) also recorded in other northern and southern sites as
the Ría de Vigo (Diz et al., 2002), the Ría de Muros (Lebreiro et al., 2006), and the Tagus prodelta
(Abrantes et al., 2005b; Lebreiro et al., 2006).
The second climatic event is known as the historical Dark Ages (DA). The DA interval has been
recognized in both terrestrial and marine environments of the western Iberia between: 400AD-800AD
(Eriksson et al., 2006); 400AD-700AD (Lebreiro et al., 2006; Andrade et al., 2011); 450AD-950AD
(Desprat et al., 2003); 300AD-600AD (Martin-Chivelet et al., 2011). In our record it occurs between
250AD and 600AD, and is characterized by continental and sea surface cooling as testified by the
forest reduction and a gradual sea surface cooling episode. The slight increase in semi-desert plants
suggests a relative dryness in the adjacent continent. These cold and relatively dry conditions have also
been detected in both Ría de Vigo (Desprat et al., 2003) and Ría de Muros (Andrade et al., 2011)
during the DA. However, these cooling and dryer conditions did not perturb agriculture practices that
started some centuries before. In the ocean, the water column was less stratified than in the previous
climatic event suggesting an increase of upwelling conditions during summer times, as also observed
in the Ría de Muros (Lebreiro et al., 2006) and in the Tagus Prodelta (Abrantes et al., 2005b; Lebreiro
et al., 2006) in association with prevailing positive NAO mode (NAO+). Although there is a cooling
and dry episode and enhanced upwelling regime in the DIVA09 shelf record, there is a continuous
increase of terrestrial input. This increase of terrestrial input does not agree with all other records from
both northern Rías and southern Tagus Prodelta. This can be probably due to the fact that the Minho
shelf is not directly receiving sediments from the Minho River, but from other sources such as the
Douro mud patch.
The third climatic event, occurring between 600AD and 950AD, is marked by a relatively
continental warming and still oceanic cool conditions as well as stratified water masses. Although
climatic conditions were relatively better for agriculture practices there is a decrease in these taxa in
the pollen diagram. Historical records suggest a decrease in the population between the 4th
to the 9th
century in Galicia resulting in a decrease of mine exploitations and a reduction of cultivate lands
(Valdez and Sanchez 2001), which could be the cause for these changes detected in the pollen
diagram. This decrease of cultivate lands are most likely associated with the DA period. However the
increase in temperate trees detected in the DIVA09 core were also recorded in the Ría de Vigo and
associated with the Medieval Warm Period (MWP), but during 950AD and 1400AD (Desprat et al.,
2003). Also, the DIVA09 record show that the water column was well stratified suggesting the almost
absence of the upwelling regime in this region during this period. As described for the previous
- 41 -
climatic event the DA were characterized by cold and a relatively dry climate and a vigorous
upwelling regime off NW Iberian Peninsula (this study, Desprat et al., 2003; Lebreiro et al., 2006;
Andrade et al., 2011). Therefore, both warming and relatively less dry continental conditions and
oceanic decrease on the upwelling intensity could probably be more likely associated with the MWP
event. Although the upwelling regime was reduced, there are no evidences for the increase of
terrestrial input as it should be expected. Once again, the Minho River is probably not the main source
for this continental input and other processes are compromising the signal at this site.
The fourth climatic event, occurring between 950AD-1300AD, is marked by a slight decrease of
temperate forest and an increase of Mediterranean taxa and semi-desert plants. This suggests a
replacement of warm and wet conditions by a more Mediterranean climate characterized by warm and
dry summers, and cool and wet winters. The Mediterranean climate is generated by the alternating
influence of the subtropical high in summer and westerlies during the winter. Thus, during the
summer, the subtropical high is expanded to its largest extent and most poleward position, exerting its
influence on subtropical west coasts between 30o and 40
oN and S latitude. Subsiding air from the
subtropical high creates stable atmospheric conditions when coupled with cold ocean currents along
these coasts. When the anticyclone moves equatorward in winter, it is replaced by travelling, frontal
cyclones with their attendant precipitation. Annual temperature ranges are generally smaller than those
found in marine west coast climates. Unfortunately, we cannot compare our data with that of Desprat
et al. (2003) since their pollen diagrams do not shown the Mediterranean taxa curve.
The water column was stratified and the upwelling regime was still reduced during summer
times and there is a substantial continental input, similar to that observed during the MWP in Ría de
Muros (Lebreiro et., 2006; Andrade et al., 2011) and in Ría de Vigo (Diz et al., 2002; Alvarez et al.,
2005) suggesting moisture conditions in the NW Iberian Peninsula. In contrast, enhanced upwelling
regime was detected in SW Iberian margin and associated with the positive prevailing mode of the
NAO (NAO+) during the MWP (Abrantes et al., 2005b; Lebreiro et al., 2006). This disparity of
moisture/dryness signals between the northwestern/southwestern Iberian margins under prevailing
positive NAO mode is also detected in the climate reconstruction performed by Trigo et al. (2004)
using several hydrological and climatological observational data sets.
The fifth pollen climatic event, 1300AD-1700AD, is characterized by a similar pollen
assemblage of pollen zone 4, but with relatively high percentages of ubiquists and episodes of
appearance and disappearance of semi-desert plants and of Mediterranean taxa. This suggests some
instability of the NW Iberian Peninsula climate with extremely rapid or instantaneous slight climate
changes. This complex signal was also observed in both SST and stable isotopic records of the
- 42 -
DIVA09 core. Therefore, within the “long term cooling” of this short climatic episode SST display a
complex pattern of increase and decrease temperatures. Also, there is an alternating situation between
stratified and non-stratified water column within a prevailing non-stratified situation. This complex
climatic signal can be correlated with the well-known Little Ice Age (LIA). Most records from NW
Iberia Peninsula and margin show a sea surface and terrestrial cooling, a general continental dryness
and enhanced upwelling regime during this period associated with a prevailing NAO+ mode (Diz et
al., 2002; Desprat et al., 2003; Alvarez et al., 2005; Lebreiro et al., 2006; Abrantes et al., 2011,
Andrade et al., 2011; Martin-Chivelet et al., 2011) while the Tagus Prodelta is characterized by
storminess and excess in precipitation and river discharges under the same prevailing NAO+ mode
conditions (Abrantes et al., 2005b; Eriksson et al., 2006; Lebreiro et al., 2006) as testified by the
present day reconstruction by Trigo et al. (2004).
Finally, the interval between 1700AD-1880AD, is marked by an increase of Pinus percentages
and therefore by an increase of temperate trees and arboreal pollen associated with human acitivities.
Indeed, it is known that the beginning of Pinus expansion in the Iberian Peninsula has started 300
years ago (Queiroz and Mateus, 1994) and that they reach their maximum abundances in the last
century as the result of successive afforestation policies (Valdès and Gil Sánchez, 2001). Although
there is an increase of Pinus, the rest of the pollen record is similar in their general trends to the
previous pollen zone. Marine proxy data also shows similarities with the previous climatic phase
suggesting that we are still in the LIA period.
Summary and final considerations
A multi-parameter approach using grain-size, geochronological (210
Pb and 14C), geochemical
(major and trace elements, organic carbon, biomarkers), microfaunal (diatoms and foraminifera) and
pollen data were applied on the DIVA09 gravity core collected on the Galicia Mud Patch. Down-core
variability of these parameters are probably indicative of the evolution of hydrodynamic conditions
(resulting from different oceanographic conditions induced by both climate variability and small sea-
level oscillations) in the area through time, instead of a reliable record of the terrestrial input. Despite
the influence of hydrodynamic conditions in the preservation of the sediment record, grain-size, pollen,
n-alcohols and n-alkanes data suggest a gradual increase of continental input during the Roman Warm
Period and the Dark Ages. Potassium to Al, Fe/Al and Ti/Al ratios temporal variability suggesting
higher physical weathering during the RWP during which warm and wet conditions prevailed,
reflecting an increase level of precipitation that may be responsible by high river discharges and
consequently a major efficiency on the transfer of continental materials to the shelf. However, higher
- 43 -
elemental-Al ratios at the bottom core can also be indicative of higher energetic conditions,
responsible by removing fine-grained sediment components. Pollen data were grouped into five
ecological assemblages indicating different climatic conditions through time and marking very well
certain periods of human activities (e.g. Roman settlement, increasing the use of Pinus).
Acknowledgments
This work was financially support by the Natura Miño-Minho Project (0234 NATURA
MIÑO_MINHO_1_E). We would like to express our gratitude to Bernardino Vilhena, José Vilhena
and Silva Lopes (Unidade de Sondagens - Laboratório Nacional de Energia e Geologia) for recovering
mechanical drill cores in the Minho estuary and to Guillermo Francés (Universidad de Vigo) for
collecting the DIVA09 gravity core. Special thanks for all UGM-LNEG collaborators (Cremilde
Monteiro, Daniel Ferreira, Sandra Lemos, Warley Soares and Rúben Borges) that help in laboratorial
work. We also thank to Carlos Antunes for Aquamuseu laboratory facilities support (storage and
mechanical drill core sections).
References
Abrantes, F., 1988. Diatoms assemblages as coastal upwelling indicators in surface sediments off Portugal. Marine
Geology, 85: 15-39.
Abrantes, F. 2003. A 340,000 year continental climate record from tropical Africa - news from opal phytoliths from the
equatorial Atlantic. Earth and Planetary Science Letters, 209: 165-179.
Abrantes, F., Gil, I., Lopes, C., Castro, M., 2005a. Quantitative diatom analyses – a faster cleaning procedure. Deep sea
Research I 52: 189-98. Abrantes, F., Lebreiro, S., Rodrigues, T., Gil, I., Bartels-Jonsdottir, H., Oliveira, P., Kissel, C., Grimalt, J.O., 2005b.
Shallow-marine sediment cores record climate variability and earthquake activity off Lisbon (Portugal) for the last 2000
years. Quaternary Science Reviews 24: 1123-1149.
Abrantes, F., Rodrigues, T., Montanari, B., Santos, C., Witt, L., Lopes, C., Voelker, A., 2011. Climate of the last
millennium at the southern pole of the North Atlantic Oscillation: an inner-shelf sediment record of flooding and upwelling.
Climate Research, 48(2-3): 261-280.
Ackermann, F., 1980. A procedure for correcting the grain-size effect in heavy metal analysis of estuarine and coastal
sediments. Environmental Technology Letters 1: 518-527.
Aira Rodriguez, M.J., Saa, P., Lopez, P., 1992. Cambios del paisaje durante el Holoceno: Analisis de polen en Turberas
(Galicia, España). Revue de Paléobiologie 11: 243-254.
Andersen, C., Koç, N, Jennings, A., Andrews, J.T., 2004. Nonuniform response of the major surface currents in the
Nordic Seas to insolation forcing: Implications for the Holocene climate variability. Paleoceanography 19: 1-16. Andrade, A., Rubio, B., Rey, D., Álvarez-Iglesias, P., Bernabeu, A.M., Vilas, F., 2011. Palaeoclimatic changes in the
NW Iberian Peninsula during the last 3000 years inferred from diagenetic proxies in the Ría de Muros sedimentary record.
Climate Research 48:247-259.
Appleby, P., Oldfield, F., 1992. Applications of lead-210 to sedimentation studies. In: Ivanovich, M., Harmon, R.S.
(Eds.), Uranium Series Disequilibrium. Applications to Earth, Marine and Environmental Sciences. Clarendon Press,
Oxford: 731-778 pp.
Araújo, F., Jouanneau, J.-M., Valério, P., Barbosa, T., Gouveia, A., Weber, O., Oliveira, A., Rodrigues, A., Dias, J.,
2002. Geochemical tracers of northern Portuguese estuarine sediments on the shelf. Progress in Oceanography 52: 277-297.
Araújo, M., Dias, J., Jouanneau, J.-M., 1994. Chemical characterisation of the main fine sedimentary deposit at the
northwestern Portuguese shelf. GAIA 9: 59-65.
Bard, E., Rostek, F., Menot-Combes, G., 2004. Radiocarbon calibration beyond 20.000 14C yr B.P. by means of planktonic foraminifera of the Iberian Margin. Quaternary Research 61: 204-214.
Battarbee, R.W., 1973. A new method for estimation of absolute microfossil numbers with reference especially to
diatoms. Limnology and Oceanography 18: 647-652.
- 44 -
Berger, A, 1978. Long-term variations of calorific insolation resulting from the earth’s orbital elements. Quaternary
Research 9: 139-167.
Bernárdez, P., González-Álvarez, R., Francés, G., Prego, R., Bárcena, M.A., Romero, O.E., 2008. Palaeoproductivity
changes and upwelling variability in the Galicia Mud Patch during the last 5000 years: geochemical and microfloral
evidence. Holocene 18: 1207-1218
Bettencourt, A., Ramos, L. (Eds.), 2003. Estuários Portugueses. Instituto da Água, Lisboa.
Bianchi, G. G., Mccave, I. N., 1999. Holocene Periodicity in North Atlantic Climate and Deep-Ocean Flow South of
Iceland. Nature 397: 515-17.
Boer, W., van den Bergh, G.D., de Haas, H., de Stigter, H.C., Gieles, R., van Weering, T.C.E., 2006. Validation of
accumulation rates in Teluk Banten (Indonesia) from commonly applied 210Pb models, using the 1883 Krakatau tephra as time marker. Marine Geology 227: 263-277.
Bottema, S, van Straaten, L.M.J.U., 1966. Malacology and palynology of two cores from the Adriatic sea floor. Marine
Geology 4: 553-564.
Braun-Blanquet, J., Pinto da Silva, A.R., Rozeira, A., 1956. Résultats de deux excursions géobotaniques à travers le
Portugal septentrional et moyen. II. Chenaies à feuilles caduques (Quercion occidentale) et chenaies à feuilles persistentes
(Quercion faginea) au Portugal. Agronomia Lusitana 18: 167-234.
Cato, I., 1977. Recent sedimentological and geochemical conditions and pollution problems in two marine areas in
Soutwestern Sweden. Striae 6: 150 pp.
Carrión, J.S., Sánchez-Gómez, P., 1992. Palynological data in support of the survival of Walnut (Juglans regia L.) in
the western Mediterranean area during last glacial times. Journal of Biogeogeography 19: 623-630.
Carrión, J.S., Fernández, S., Jiménez-Moreno, G., Fauquette, S., Gil-Romera, G., González-Sampériz, P., Finlayson C.,
2010. The historical origins of aridity and vegetation degradation in southeastern Spain. Journal of Arid Environments 74: 731–736.
Conedera, M., Krebs, P., Tinner, W., Pradella, M., Torrioni, D., 2004. The cultivation of Castanea sativa (Mill.) in
Europe: from its origin to its diffusion on a continental scale. Vegetation and Archaeobotany 13: 161-179.
Costa, A.M., Mil-Homens, M., Lebreiro, S.M., Richter, T.O., de Stigter, H., Boer, W., Trancoso, M.A., Melo, Z.,
Mouro, F., Mateus, M., Canário, J., Branco, V., Caetano, M., 2011. Origin and transport of trace metals deposited in the
canyons off Lisboa and adjacent slopes (Portuguese Margin) in the last century. Marine Geology 282: 169-177.
Crucifix, M., Loutre, M.F., Tulkens, P., Fichefet, T., Berger, A., 2002. Climate evolution during the Holocene: a study
with an Earth system model of intermediate complexity. Climate Dynamics 19: 43-60. de Stigter, H.C., Boer, W., de Jesus Mendes, P.A., Jesus, C.C., Thomsen, L., van den Bergh, G.D., van Weering,
T.C.E., 2007. Recent sediment transport and deposition in the Nazare Canyon, Portuguese continental margin. Marine
Geology 246: 144-164. de Vernal, A., Henry, M., Bilodeau, G., 1996. Techniques de préparation et d’analyse en micropaléontologie. Les
cahiers du GEOTOP. Departement des Sciences de la terre. Québec University, Montréal 3: 16-27.
Desprat, S., Sánchez-Goñi, M.F., Loutre, M.F., 2003. Revealing climatic variability of the last three millennia in
northwestern Iberia using pollen influx data. Earth and Planetary Science Letters 213: 63-78.
Desprat, S., 2005. Réponses climatiques marines et continentales du SW de L’Europe lors des derniers interglaciaires et
des entrée en glaciation. PhD Thesis, Bordeaux 1 University, Bordeaux (France): 282 pp.
Dias, J., 1987. Dinâmica sedimentar e evolução recente da plataforma continental Portuguesa setentrional. PhD Thesis,
Faculdade de Ciências da Universidade de Lisboa: 384 pp.
Dias, J., Gonzalez, R., Garcia, C., Dias-del-Rio, V., 2002a. Sediment distribution patterns on the Galicia-Minho
continental shelf. Progress in Oceanography 52: 215-231.
Dias, J., Jouanneau, J.-M., Gonzalez, R., Araújo, F., Drago, T., Garcia, C., Oliveira, A., Rodrigues, A., Vitorino, F.,
Weber, O., 2002b. Present day sedimentary processes in the northern Iberian shelf. Progress in Oceanography 52: 249-259. Drago, T., Oliveira, A., Dias, J., Magalhães, F., Cascalho, J., Jouanneau, J.-M., Vitorino, J., 1998. Some evidences of
northward fine sediment transport in the northern Portuguese continental shelf. Oceanologica Acta 21: 223-231.
Diz, P., Francés, G., Pelejero, C., Grimalt, J.O., Vilas, F., 2002. The last 3000 years in the Ría de Vigo (NW Iberian
Margin): climatic and hydrographic signals. Holocene 12: 459-468.
Eglinton, G., Hamilton, R.J., 1967. Leaf epicuticular waxes. Science 156: 1322-1335.
Grimalt, J.O., Calvo, E., Pelejero, C., 2001. Sea Surface pleotemperature errors in Uk'37 estimation due to alkenone
measurements near the limit of detection. Paleoceanography 16: 226-232.
Groot, J.J., Groot, C.R., 1966. Pollen spectra from deep-sea sediments as indicators of climatic changes in southern
South America. Marine Geology 4: 525-537. Heusser, L.E., Balsam, W.L., 1977. Pollen distribution in the N.E. Pacific Ocean. Quaternary Research 7: 45-62.
Heusser, L.E., Stock, C.E., 1984. Preparation techniques for concentrating pollen from marine sediments and other sediments with low pollen density. Palynology 8: 225-227.
Hughen, K.A., Baillie, M.G.L., Bard, E., Bayliss, A., Beck, J.W., Bertrand, C., Blackwell, P.G., Buck, C.E., Burr, G.,
Cutler, K.B., Damon, P.E., Edwards, R.L., Fairbanks, R.G., Friedrich, M., Guilderson, T.P., Kromer, B., McCormac, F.G.,
Manning, S., Bronk Ramsey, C., Reimer, P.J., Reimer, R.W., Remmele, S., Southon, J.R., Stuiver, M., Talamo, S., Taylor,
- 45 -
F.W., van der Plicht, J., Weyhenmeyer, C.E., 2004. Marine 04 Marine Radiocarbon Age Calibration, 0-26 Cal kyr BP.
Radiocarbon 46: 1059-1086. Jansen, J.H.F., Alderliesten, C., Houston, C.M. et al. 1989. Aridity in equatorial Africa during the last 225,000 years: a
record of opal phytoliths/freshwater diatoms from the Zaire (Congo) deep-sea fan (northeast Angola basin), Radiocarbon
31:557-569.
Johnsen, S.J., Dahl-Jensen, D., Gundestrup, N., Steffensen, J.P., Clausen, H.B., Miller, H., Masson-Delmotte, V.,
Sveinbjörnsdottir, A.E., White, J., 2001. Oxygen isotope and palaeotemperature records from six Greenland ice-core
stations: Camp Century, Dye-3, GRIP, GISP2, Renland and NorthGRIP. Journal of Quaternary Science 16, 299-307
Jouanneau, J.-M., Weber, O., Drago, T., Rodrigues, A., Oliveira, A., Dias, J., Garcia, C., Schmidt, S., Reyss, J., 2002.
Recent sedimentation and sedimentary budgets on the western Iberian shelf. Progress in Oceanography 52: 261-275. Koreneva, E.V., 1966. Marine palynological researches in the U.R.S.S.. Marine Geology 4: 565-574.
Kutzbach, J.E. and Gallimore, R.G. (1988). Sensitivity of a coupled atmosphere/mixed layer ocean model to changes in
orbital forcing at 9000 years B.P.. Journal of Geophysical Research 93: 803-821.
Lantzsch, H., Hanebuth, T.J.J., Bender, V.B., 2009a. Holocene evolution of mud depocentres on a high-energy, low-
accumulation shelf (NW Iberia). Quaternary Research 72: 325-336.
Lantzsch, H., Hanebuth, T.J.J., Bender, V.B., Krastel, S., 2009b. Sedimentary architecture of a low-accumulation shelf
since the Late Pleistocene (NW Iberia). Marine Geology 259: 47-58.
Lantzsch, H., Hanebuth, T.J.J., Henrich, R., 2010. Sediment recycling and adjustment of deposition during deglacial
drowning of a low-accumulation shelf (NW Iberia). Continental Shelf Research 30: 1665-1679. Loring, D., 1990. Lithium - A new approach for the granulometric normalization of trace metal data. Marine Chemistry
29: 155-168.
Loureiro, J., Machado, M., Macedo, M., Nunes, M., Botelho, O., Sousa, M., Almeida, M., Martins, J., 1986. Monografias hidrológicas dos principais cursos de água de Portugal continental. Direcção-Geral dos Recursos e
Aproveitamentos Hidráulicos, Lisboa, 569 pp. Lorenz, S. J., Kim, J.-H., Rimbu, N., Schneider, R.R., Lohmann, G., 2006. Orbitally driven insolation forcing on
Holocene climate trends: Evidence from alkenone data and climate modeling. Paleoceanography 21: 1-14.
Magri, D., 1995. Some questions on the Late-Holocene vegetation of Europe. The Holocene 5: 354-360.
Marlowe, I.T., Brassell, S.C., Eglinton, G., Green, J.C., 1984. Long chain unsatured Ketones and esters in living algae
and marine sediments. Org. Geochemistry 6: 135-141.
Marshall, J., Jones, H., Karsten, R., Wardle, R., 2002. Can eddies set ocean stratification? Journal of Physical
Oceanography 32: 26-39.
Martín-Chivelet, J., Muñoz-García, M.B., Edwards, R.L., Turrero, M.J., Ortega, A.I., 2011. Land surface temperature
changes in Northern Iberia since 4000 yr BP, based on d13C of speleothems. Global and Planetary Change 77: 1-12. Martínez-Cortizas, A., Pontevedra-Pombal, X., García-Rodeja, E., Nóvoa-Muñoz, J.C., Shotyk, W., 1999. Mercury in a
Spanish peat bog: archive of climate change and atmospheric metal deposition. Science 284: 939-942.
Martins, V., Jouanneau, J.-M., Weber, O., Rocha, F., 2006. Tracing the late Holocene evolution of the NW Iberian
upwelling system. Marine micropaleontology 59: 35-55.
McCave, I.N., Hall, I.R., 2002. Turbidity of waters over the Northwest Iberian continental margin. Progress in
Oceanography 52: 299-313.
Meyers, P., 1994. Preservation of elemental and isotopic source identification of sedimentary organic matter. Chemical
Geology 114: 289-302.
Meyers, P., 1997. Organic geochemical proxies of paleoceanographic, paleolimnologic, and paleoclimatic processes.
Organic Geochemistry 27: 213-250.
Moros, M., Emeis, K., Risebrobakken, B., Snowball, I., Kuijpers, A., McManus, J., Jansen, E., 2004. Sea surface
temperatures and ice rafting in the Holocene North Atlantic: climate influences on northern Europe and Greenland. Quaternary Science Reviews 23, 2113-2126.
Muler, P., Kirst, G., Ruhland, G., Storch, I.v., Rosell-Melé, A., 1998. Calibration of the alkenone index Uk'37 based on
core-tops the eastern South Atlantic and global ocean (60ºN-60ºS). Geochimica et Cosmochimica Acta 62: 1757-1772.
Muller, J., 1959. Palynology of recent Orinoco delta and shelf sediments. Micropaleontology 5: 1-32.
Nriagu, J.O., 1996. A history of global metal pollution. Science 272: 223.
Oliveira, A., Rocha, F., Rodrigues, A., Jouanneau, J.-M., Dias, J., Weber, O., Gomes, C., 2002a. Clay minerals from the
sedimentary cover from the Northwest Iberian shelf. Progress in Oceanography 52: 233-247.
Oliveira, A., Vitorino, J., Rodrigues, A., Jouanneau, J.-M., Dias, J., Weber, O., 2002b. Nepheloid layer dynamics in the
northern Portuguese shelf. Progress in Oceanography 52: 195–213.
Patterson, C.C., 1972. Silver stocks and losses in ancient and Medieval times. . The Economic History Review 25
(Second Series): 205-235. Polunin, O., Walters, M., 1985. A guide to the vegetation of Britain and Europe. Oxford University Press, New York:
238 pp.
- 46 -
Pons A., Reille, M., 1986. Nouvelles recherches pollenanalytiques à Padul (Granada) : La fin du dernier glaciaire et
l’Holocene. E. López-Vera (Ed.). Quaternary climate in Western Mediterranean, University Autónoma de Madrid, 405-
420.
Poppe, L.J., Eliason, A.H., 2008. A Visual Basic program to plot sediment grain-size data on ternary diagrams.
Computers & Geosciences 34: 561-565.
Prahl, F., Wakeham, S.G., 1987. Calibration of unsaturation patterns in long-chain ketones compositions for
palaeotemperature assessment. Nature 330: 367-369. Queiroz, P.F., Mateus, J.E., 1994. Preliminary palynological studies at Lagoa de Albufeira and Lagoa de Melides,
Portugal. Revista de Biologia 15, 1527.
Reimer, P.J., Baillie, M.G.L., Bard, E., Bayliss, A., Beck, J.W., Blackwell, P.G., Buck, C.E., Burr, G.S., Cutler, K.B., Damon, P.E., Edwards, R.L., Fairbanks, R.G., Friedrich, M., Guilderson, T.P., Hughen, K.A., Kromer, B., McCormac,
F.G., Manning, S.W., Ramsey, C.B., Reimer, RW, Remmele, S, Southon, JR, Stuiver, M, Talamo, S, Taylor, FW, van der
Plicht, J, and Weyhenmeyer, CE. 2004. IntCal04 Terrestrial radiocarbon age calibration, 0-26 cal kyr BP. Radiocarbon 46:
1029-1058.
Renssen, H., Goosse, H., Fichefet, T., Brovkin, V., Driesschaert, E., Wolk, F., 2005. Simulating the Holocene climate
evolution at northern high latitudes using a coupled atmosphere-sea ice-ocean-vegetation model. Climate Dynamics 24: 23-
43.
Rodrigues, T., Grimalt, J.O., Abrantes, F.G., Flores, J.A., Lebreiro, S.M., 2009. Holocene interdependences of changes
in sea surface temperature, productivity, and fluvial inputs in the Iberian continental shelf (Tagus mud patch).
Geochemistry, Geophysics Geosystems 10: Q07U06.
Salgueiro, E., Voelker, A., Abrantes, F., Meggers, H., Pflaumann, U., Lončarić, N., González-Álvarez, R., Oliveira, P.,
Bartels-Jónsdóttir, H.B., Moreno, J., Wefer, G., 2008. Planktonic foraminifera from modern sediments reflect upwelling patterns off Iberia: Insights from a regional transfer function. Marine Micropaleontology 66: 135-164.
Schiff, K., Weisberg, S., 1999. Iron as a reference element for determining trace metal enrichment in Southern
California coastal shelf sediments. Marine Environmental Research 48: 161-176.
Schneider, R. R., Price, B., Müller, P. J., Kroon, D., Alexander, I. 1997. Monsoon related variations in Zaire (Congo)
sediment load and influence of fluvial silicate supply on marine productivity in the east equatorial Atlantic during the last
200,000 years. Paleoceanography 12: 463-481.
Schrader, H.J., Gersonde, R. 1978. Diatoms and silicoflagelates. Ultrecht Micropaleontology Bulletin 17: 125-132.
Schubert, C., Calvert, S., 2001. Nitrogen and carbon isotopic composition of marine and terrestrial organic matter in
Arctic Ocean sediments: Implications for nutrient utilization and organic matter composition. Deep Sea Research Part I:
Oceanographic Research Papers 48: 789-810.
Shepard, F., 1954. Nomenclature based on sand-silt-clay ratios, Journal of Sedimentary Petrology: 151-158. Sousa, R., Guilhermino, L., Antunes, C., 2005. Molluscan fauna in the freshwater tidal area of the River Minho estuary,
NW of Iberian Peninsula. Annales de Limnologie - International Journal of Limnology 41: 141-147.
Stein, R., Rack, F., 1995. A 160,000 year high-resolution record of quantity and composition of organic carbon in the
Santa Barbara Basin (site 893). In: Kennett, J., Baldauf, J., Lyle, M. (Eds.), Proceedings of Ocean Drilling Program: 125-
138.
Stuiver, M., Reimer, P.J., 1993. Extended 14C database and revised CALIB radiocarbon calibration program.
Radiocarbon 35: 215-230.
Stuiver, M., Reimer, P.J., Reimer, R.W., 2005. CALIB 5.0. Telford, R.J., Heegaard, E., Birks, H.J.B., 2004. The intercept is a poor estimate of a calibrated radiocarbon age. The
Holocene 14: 296-298.
Trigo, R., Pozo-Vazquez, D., Osborn, T., Castro-Diez, Y., Gamis-Fortis, S., Esteban-Parra, M., 2004. North Atlantic
oscillation influence on precipitation, river flow and water resources in the Iberian Peninsula. Internataional Journal of Climatology 24:925−944
Turon, J.-L., 1984. Le palynoplancton dans l’environnement actuel de l’Atlantique nord-oriental. Evolution climatique
et hydrologique depuis le dernier maximum glaciaire. Mémoires de l’Institut de Géologie du basin d’Aquitaine, 17.
Université de Bordeaux I, Bordeaux, 313 pp. Valdès, C.M., Gil Sanchez, L., 2001. La transformación histórica del paisaje forestal en Galicia, Ministerio de Medio
Ambiente, 159 pp..
Valette-Silver, N., 1993. The use of sediment cores to reconstruct historical trends in contamination of estuarine and
coastal sediments. Estuaries 16: 577-588.
van der Kaars, S., de Deckker, P., 2003. Pollen distribution in marine surface sediments offshore Western Australia.
Reviews in Palaeobototany and Palynolology 124: 113-129.
van Weering, T., de Stigter, H., Boer, W., de Haas, H., 2002. Recent sediment transport and accumulation on the NW Iberian margin. Progress in Oceanography 52: 349-371.
Villanueva, J., 1996. Estudi de les variaciones climàtiques i oceanogràfiques a l`atlantic Nord Durant els últims 300.000
anys mitjançant l`análisi de marcadores moleculars., Ramon Llull, Barcelona, 186 pp.
- 47 -
Villanueva, J., Calvo, E., C.Pelejero, Grimalt, J.O., Boelaert, A., Labeyrie, L., 2001. A latitudinal productivity band in
the central North Atlantic over the last 270 Kyr: An alkenone perspective. Paleoceanography 16: 1-10.
Volkman, J.K., Eglinton, G., Corner, E.D.S., Forsberg, T.E.V., 1980. Long-chain Alkenes and Alkenones in the Marine
Coccolithpphorid Emiiania Huxleyi. Phytochemistry 19: 2619-2622.
Weber, S.L., Oerlemans, J., 2003. Holocene glacier variability: three case studies using an intermediate-complexity
climate model. The Holocene 13, 353-363.
Windom, H., Schropp, S., Calder, F., Ryan, J., Smith, R., Burney, L., Lewis, F., Rawlinson, C., 1989. Natural trace
metal concentrations in estuarine and coastal marine sediments of the southeastern United States. Environmental Science
and Technology 23: 314-320.
Yarincik, K.M., Murray, R.W., Peterson, L.C., 2000. Climatically Sensitive Eolian and Hemipelagic Deposition in the Cariaco Basin, Venezuela, Over the Past 578,000 Years: Results From Al/Ti and K/Al. Paleoceanography 15: 210-228.
Zabel, M., Bickert, T., Dittert, L., Haese, R.R., 1999. Significance of the Sedimentary Al : Ti Ratio as an Indicator for
Variations in the Circulation Patterns of the Equatorial North Atlantic. Paleoceanography 14: 789-799.
Zabel, M., Schneider, R.R., Wagner, T., Adegbie, A.T., de Vries, U., Kolonic, S., 2001. Late Quaternary Climate
Changes in Central Africa as Inferred from Terrigenous Input to the Niger Fan. Quaternary Research 56: 207-217.


![[página intencionalmente deixada em branco] · Natura Empreendimentos Natura Empreendimentos S.A. Natura Indústria Indústria e Comércio de Cosméticos Natura Ltda.. Natura Inovação](https://img.pdfslide.net/doc/110x75/5c40cce593f3c338be2eee63/pagina-intencionalmente-deixada-em-branco-natura-empreendimentos-natura-empreendimentos.jpg)