Embed Size (px)
Citation preview
i
Project No. _________ COPY NO._________
HAZARDOUS MATERIALS COMMODITY FLOW DATA AND ANALYSIS
FINAL PROJECT REPORT
Prepared for Hazardous Materials Cooperative Research Program
Transportation Research Board of
The National Academies
Hazard Reduction and Recovery Center Department of Landscape Architecture and Urban Planning
Texas A&M University
Multimodal Freight Programs Texas Transportation Institute
and
Transportation Operations Group
Texas Transportation Institute
Texas A&M University System College Station, Texas
December 2010
TRANSPORTATION RESEARCH BOARD OF THE NATIONAL ACADEMIES
PRIVILEGED DOCUMENT This report, not released for publication, is furnished only for review to members of or
participants in the work of the CRP. This report is to be regarded as fully privileged, and
dissemination of the information included herein must be approved by the CRP.
ii
ACKNOWLEDGMENT OF SPONSORSHIP This work was sponsored by the U.S. Department of Transportation, Pipeline and Hazardous Materials Safety Administration and was conducted in the Hazardous Materials Cooperative Research Program, which is administered by the Transportation Research Board of the National Academies.
DISCLAIMER This is an uncorrected draft as submitted by the research agency. The opinions and conclusions expressed or implied in the report are those of the research agency. They are not necessarily those of the Transportation Research Board, the National Academies, the Federal Highway Administration, the American Association of State Highway and Transportation Officials, or the individual states participating in the National Cooperative Highway Research Program.
iii
HAZARDOUS MATERIALS COMMODITY FLOW DATA AND ANALYSIS
FINAL PROJECT REPORT
Prepared for Hazardous Materials Cooperative Research Program
Transportation Research Board of
The National Academies
George O. Rogers, Ph.D.
Professor and Senior Fellow Hazard Reduction and Recovery Center
Department of Landscape Architecture and Urban Planning Texas A&M University
David H. Bierling
Associate Research Scientist Texas Transportation Institute
Annie Protopapas, Ph.D.
Associate Research Scientist Texas Transportation Institute
Deborah Jasek
Associate Research Specialist Texas Transportation Institute
Jeffrey E. Warner
Associate Transportation Researcher Texas Transportation Institute
and
Leslie E. Olson
Associate Research Scientist Texas Transportation Institute
Texas A&M University System
College Station, Texas
December 2010

iv
v
TABLE OF CONTENTS
Page LIST OF FIGURES AND TABLES .......................................................................................... xii ACKNOWLEDGMENTS .......................................................................................................... xv ABSTRACT ........................................................................................................................ xvi EXECUTIVE SUMMARY .......................................................................................................... 1
ES.1 PURPOSE .......................................................................................................................... 1 ES.2 THE HCMFS PROCESS ....................................................................................................... 1 ES.3 SELECT HMCFS LEADERSHIP, SET OBJECTIVES, AND DEFINE DATA REQUIREMENTS ...... 4 ES.5 COLLECT AND REVIEW BASELINE INFORMATION AND SCOPE HMCFS PROJECT ............ 4 ES.6 COLLECT AND REVIEW EXISTING HMCFS DATA ............................................................... 4 ES.7 COLLECT AND VALIDATE NEW HMCFS DATA ................................................................... 5 ES.8 ANALYZE AND DOCUMENT HMCFS DATA ....................................................................... 5 ES.9 IMPLEMENT HMCFS INFORMATION ................................................................................ 6 ES.10 SUPPORTING RESEARCH .................................................................................................. 7
ES.10.1 Literature Review ..................................................................................................... 7 ES.10.2 National Survey of LEPCs about HMCFS Practices ................................................... 7 ES.10.3 Case Studies .............................................................................................................. 9
ES.11 PROMISING PRACTICES .................................................................................................... 9 ES.12 SUMMARY ...................................................................................................................... 10 ES.13 IMPLEMENTATION ......................................................................................................... 11
CHAPTER 1: BACKGROUND AND CONTEXT ............................................................. 12 1.1 LOCAL EMERGENCY PLANNING COMMITTEES .............................................................. 12 1.2 EMERGENCY RESPONSE PLANNING ............................................................................... 13 1.3 HAZARDOUS MATERIALS TRANSPORTATION OVERVIEW ............................................. 13 1.4 HAZARDOUS MATERIALS EMERGENCY PLANNING AND TRANSPORTATION GUIDANCE ................................................................................................................................. 17 1.5 PROJECT HM-01 HAZARDOUS MATERIALS COMMODITY FLOW DATA AND ANALYSIS 18
1.5.1 Hazardous Materials Commodity Flow Study Overview ........................................ 19 1.5.2 The HMCFS Process ................................................................................................ 20 1.5.3 Report Structure ..................................................................................................... 23
CHAPTER 2: STATE OF HAZMAT CFS PRACTICES: SURVEY ............................... 24 2.1 SURVEY TOPICS .............................................................................................................. 24 2.2 SURVEY SAMPLE ............................................................................................................. 26 2.3 FINDINGS AND APPLICATIONS – SURVEY RESULTS ....................................................... 27
2.3.1 LEPC Descriptive Characteristics ............................................................................ 27 2.3.1.1 Jurisdiction Population .................................................................................... 27 2.3.1.2 HazMat Transport Characteristics ................................................................... 27 2.3.1.3 Jurisdiction Business Sectors ........................................................................... 27 2.3.1.4 LEPC Participation ............................................................................................ 28 2.3.1.5 LEPC Activity .................................................................................................... 28
vi
2.3.2 Hazardous Materials Commodity Flow Surveys ..................................................... 32 2.3.2.1 HMCFS Activity ................................................................................................ 32 2.3.2.2 HazMat Transport Risk Perception .................................................................. 35 2.3.2.3 CFS Understanding .......................................................................................... 35 2.3.2.4 CFS Participants ............................................................................................... 35 2.3.2.5 CFS Guidance ................................................................................................... 35
2.3.3 CFS Data Sources: Existing Data ............................................................................. 41 2.3.3.1 HazMat CFS Exchange ...................................................................................... 41
2.3.4 CFS Data Sources: New Data .................................................................................. 43 2.3.4.1 Vehicle/Placard Counts ................................................................................... 43 2.3.4.2 Shipping Manifests .......................................................................................... 46
2.3.5 HazMat CFS Data Characteristics ........................................................................... 50 2.3.5.1 HazMat Quantity Data ..................................................................................... 50 2.3.5.2 HazMat Classification Data .............................................................................. 50 2.3.5.3 Data Value and Usefulness .............................................................................. 50
2.3.6 Data Challenges ...................................................................................................... 56 2.3.7 Data Analysis .......................................................................................................... 56 2.3.8 Outcomes, Implementation, and Tech Transfer .................................................... 60 2.3.9 CFS Funding Sources ............................................................................................... 65 2.3.10 Interaction with SERCs ........................................................................................... 69 2.3.11 HazMat CFS Funding ............................................................................................... 69 2.3.12 HMCFS Barriers ....................................................................................................... 73 2.3.13 HazMat CFS Incentives ........................................................................................... 73 2.3.14 ‘Bang-For-Your-Buck’ Practices .............................................................................. 73
2.4 LEPC SURVEY CONCLUSIONS ......................................................................................... 78 2.4.1 HazMat CFS Activity ................................................................................................ 78 2.4.2 Expediency of Conducting HazMat CFS .................................................................. 78 2.4.3 Nature of HazMat CFS Data .................................................................................... 79 2.4.4 Validity of HazMat CFS Data ................................................................................... 79 2.4.5 Implementation of HazMat CFS Data ..................................................................... 80 2.4.6 Focus of HazMat CFS Efforts .................................................................................. 80
CHAPTER 3: HMCFS CASE STUDIES ............................................................................. 81 3.1 CASE STUDY 1 ................................................................................................................. 81
3.1.1 Overview ................................................................................................................. 81 3.1.2 Commodity Flow Survey ......................................................................................... 81
3.2 CASE STUDY 2 ................................................................................................................. 83 3.2.1 Overview ................................................................................................................. 83 3.2.2 Commodity Flow Study .......................................................................................... 83
3.3. CASE STUDY 3 ................................................................................................................. 84 3.3.1 Overview ................................................................................................................. 84 3.3.2 Commodity Flow Study .......................................................................................... 84
3.4 CASE STUDY 4 ................................................................................................................. 86
vii
3.4.1 Overview ................................................................................................................. 86 3.4.2 Commodity Flow Survey ......................................................................................... 86
3.5 CASE STUDY 5 ................................................................................................................. 88 3.5.1 Overview ................................................................................................................. 88 3.5.2 Commodity Flow Survey ......................................................................................... 88
3.6 CASE STUDY 6 ................................................................................................................. 90 3.6.1 Overview ................................................................................................................. 90 3.6.2 Commodity Flow Survey ......................................................................................... 90
3.7 CASE STUDY 7 ................................................................................................................. 92 3.7.1 Overview ................................................................................................................. 92 3.7.2 Commodity Flow Survey ......................................................................................... 92
3.8 CASE STUDY RECOMMENDATIONS ................................................................................ 94 CHAPTER 4: HMCFS OBJECTIVES ................................................................................ 97
4.1 AWARENESS ................................................................................................................... 97 4.2 MINIMUM TRAINING SCENARIO DEFINITION ................................................................ 97 4.3 MAXIMUM TRAINING SCENARIO DEFINITION ............................................................... 97 4.4 EMERGENCY PLANNING ................................................................................................. 98 4.5 COMPREHENSIVE PLANNING ......................................................................................... 98 4.6 EQUIPMENT NEEDS ........................................................................................................ 98 4.7 RESOURCE SCHEDULING ................................................................................................ 99 4.8 ROUTE DESIGNATION .................................................................................................... 99 4.9 LEGAL TAKINGS ............................................................................................................ 100
CHAPTER 5: EXISTING HAZMAT TRANSPORT DATA SOURCES ....................... 101 5.1 EXISTING DATA OVERVIEW .......................................................................................... 101 5.2 LOCALLY OR INSTITUTIONALLY AVAILABLE DATA SOURCES ....................................... 101
5.2.1 Prior HMCFS.......................................................................................................... 101 5.2.2 Adjacent Jurisdiction/Common Corridor HMCFS ................................................. 102 5.2.3 Local and State Agency Data ................................................................................ 102 5.2.4 Information Maintained By Shippers, Receivers, And Facilities .......................... 102 5.2.5 Information Maintained by Carriers .......................................................................... 104
5.3.1.1 Roadway Carriers ........................................................................................... 104 5.3.1.2 Railroad Carriers ............................................................................................ 104 5.3.1.3 Pipeline Operators ......................................................................................... 105 5.3.1.4 Waterway Operators ..................................................................................... 105 5.3.1.5 Airlines ........................................................................................................... 106
5.2.6 Proprietary Information ....................................................................................... 106 5.2.7 TRADE ORGANIZATIONS, ENVIROMENTAL AND SOCIAL ORGANIZATIONS, AND ACADEMIC JOURNALS ............................................................................................................. 107
5.2.7.1 Trade Organizations ....................................................................................... 107 5.2.7.2 Environmental and Social Organizations ....................................................... 107
5.2.8 Academic Journals ................................................................................................ 107 5.6 PRINT AND OTHER DATA SOURCES ............................................................................. 108 5.4 ELECTRONIC DATA SOURCES ....................................................................................... 108
viii
5.4.1 Transportation Networks ..................................................................................... 112 5.4.1.1 Roadways ....................................................................................................... 112 5.4.1.2 Railways ......................................................................................................... 112 5.4.1.3 Pipelines ......................................................................................................... 113 5.4.1.4 Waterways ..................................................................................................... 113 5.4.1.5 Airways .......................................................................................................... 113
5.4.2 Commodity Movements ....................................................................................... 113 5.4.3 System Information (Traffic) ................................................................................ 114 5.4.4 Critical Facility and Population Locations ............................................................. 114 5.4.5 Geographic and Environmental Characteristics ................................................... 115 5.4.6 Incidents and Accidents ........................................................................................ 116
5.4.6.1 Large Truck Incidents and Accidents ............................................................. 116 5.4.7 Contact Information ............................................................................................. 118
5.7 KNOWLEDGE GAPS ...................................................................................................... 118 5.7.1 Existing Roadway Data Gaps ................................................................................ 118 5.7.2 Existing Railway Data Gaps ................................................................................... 118 5.7.3 Existing Pipeline Data Gaps .................................................................................. 121 5.7.4 Existing Waterway Data Gaps .............................................................................. 121 5.7.5 Existing Airway Data Gaps .................................................................................... 122
CHAPTER 6: NEW HAZARDOUS MATERIALS TRANSPORT DATA SOURCES ....................................................................................................................... 123 6.1 THE NATURE OF NEW DATA ........................................................................................ 123 6.2 INTERVIEWS ................................................................................................................. 123
6.2.1 Interviews with HazMat Shippers, Receivers, and Carriers ................................. 124 6.2.2 Interviews with Emergency Responders and Managers, and Other Key Informants ........................................................................................................................... 124
6.3 FIELD DATA COLLECTION ............................................................................................. 125 6.3.1 Data Collection Background ................................................................................. 125 6.3.2 Selecting Count Locations .................................................................................... 127 6.3.3 Determining Count Intervals ................................................................................ 128 6.3.4 Scheduling Data Collection (Sampling) ................................................................ 128
6.3.4.1 Convenience Sample Scheduling ................................................................... 131 6.3.4.2 Representative Sample Scheduling ............................................................... 131 6.3.4.3 Cluster Sample Scheduling ............................................................................ 132 6.3.4.4 Stratified and Proportional Sample Scheduling ............................................ 133 6.3.4.5 Random Samples ........................................................................................... 133 6.3.4.6 Census ............................................................................................................ 134
6.3.5 Determining Type of Traffic and HazMat Data to be Collected (Precision) ......... 134 6.4 VEHICLE COUNTS ......................................................................................................... 136
6.4.1 Commercial Vehicle Counts .................................................................................. 136 6.4.2 Vehicle Types ........................................................................................................ 136
6.4.2.1 Vehicle Types ................................................................................................. 136 6.4.2.2 Vehicle Sizes................................................................................................... 137
ix
6.4.3 Vehicle Data Collection ........................................................................................ 137 6.5 UN/NA PLACARD ID COUNTS ....................................................................................... 138
6.5.1 Overview of UN/NA Placard ID Counts ................................................................ 138 6.5.2 UN/NA Placard ID Information ............................................................................. 138 6.5.3 UN/NA Placard ID Data Collection ....................................................................... 138
6.6 COMBINED VEHICLE AND PLACARD COUNTS .............................................................. 139 6.7 COMMODITY OR SHIPMENT ORIGIN/DESTINATION INFORMATION .......................... 140 6.8 VALIDATE DATA ............................................................................................................ 140
CHAPTER 7: ANALYZING DATA .................................................................................. 142 7.1 HAZMAT COMMODITY FLOW ANALYSIS OVERVIEW ................................................... 142 7.2 HAZMAT COMMODITY FLOW ANALYSIS FOR RAILWAYS, PIPELINES, WATERWAYS, AND AIRWAYS ................................................................................................................................. 143 7.3 HAZMAT COMMODITY FLOW ANALYSIS FOR TRUCKS/ROADWAYS ............................ 146
7.3.1 Existing Data from FAF Database or BTS Commodity Flow Survey ...................... 151 7.3.2 Existing Data from HPMS Combined with Existing Data from VIUS or CFS .......... 152 7.3.3 Total Truck Counts ................................................................................................ 153 7.3.4 Truck Type Counts ................................................................................................ 154 7.3.5 Placard Counts Combined with Total Truck Counts ............................................. 155 7.3.6 UN/NA Placard ID Counts ..................................................................................... 156 7.3.7 UN/NA Placard ID Counts Combined with Total Truck Counts ............................ 157 7.3.8 Placard ID Counts Combined with Truck Type Counts ......................................... 159 7.3.9 A Note on Statistical Analysis ............................................................................... 163 7.3.10 Interviews with HazMat Shippers, Receivers, and Carriers ................................. 163 7.3.11 Shipping Manifests (Origin/Destination) .............................................................. 163
7.4 DOCUMENTING HMCFS DATA ..................................................................................... 164 7.4.1 Identifying HazMat Flows ..................................................................................... 164 7.4.2 Risk Estimation ..................................................................................................... 167 7.4.3 Spatial Elements of Risk Estimation ..................................................................... 168 7.4.4 Temporal Elements of Risk Estimation ................................................................. 168 7.4.5 HazMat Incident/Accident Likelihoods ................................................................ 168 7.4.6 Properties of HazMat Commodities ..................................................................... 171 7.4.7 Potential Consequences of HazMat Releases ...................................................... 172 7.4.8 Hotspots Analysis ....................................................................................................... 172
CHAPTER 8 IMPLEMENTATION OF HMCFS INFORMATION ............................ 173 8.1 REVIEW OBJECTIVES AND LIMITATIONS ...................................................................... 173 8.2 DISSEMINATING AND COMMUNICATING HMCFS INFORMATION .............................. 175
8.2.1 Dissemination ....................................................................................................... 175 8.2.2 Communication .................................................................................................... 175
8.3 APPLY HMCFS RESULTS TO OBJECTIVES ...................................................................... 176 8.4 ARCHIVING THE HMCFS ............................................................................................... 178
8.4.1 Local Archiving ...................................................................................................... 178 8.4.2 Proposed Approach for a Centralized Directory .................................................. 178
8.4.2.1. Directory of Hazmat CFS Information ........................................................... 179 8.4.2.2. Repository of HazMat CFS Information ......................................................... 185
x
8.4.3 Management and Maintenance ........................................................................... 185 8.4.3.1 Federal Management and Maintenance ....................................................... 185 8.4.3.2 State Management and Maintenance ........................................................... 187 8.4.3.3 Free Access (Independent; Local Posting) Management and Maintenance . 188
8.5 REVISIONS AND UPDATES ............................................................................................ 189 CHAPTER 9 DEVELOPING PROMISING PRACTICES ............................................ 191
9.1 IDENTIFYING HMCFS OBJECTIVES ................................................................................ 192 9.2 DEFINE LEVEL OF PROTECTION .................................................................................... 194
9.2.1 Complete Protection ............................................................................................ 194 9.2.2 Maximum Protection ............................................................................................ 194 9.2.3 Reasonable Protection ......................................................................................... 194 9.2.4 General Protection ............................................................................................... 195
9.3 DEFINE SAMPLING AND PRECISION REQUIREMENTS .................................................. 197 9.4 FUNDING AND SCHEDULING HMCFS EFFORTS ............................................................ 203 9.5 DEFINE HMCFS PERSONNEL ROLES ............................................................................. 207 9.6 UTILIZE EXISTING DATA SOURCES ................................................................................ 211 9.7 EVALUATE POTENTIAL CONSEQUENCES OF HAZMAT RELEASES ................................ 214 9.8 COMMUNICATION WITH CRITICAL STAKE HOLDERS ................................................... 219 9.9 DEMONSTRATING LOCAL RISK ..................................................................................... 221
CHAPTER 10 UPDATING THE GUIDANCE FOR CONDUCTING HAZARDOUS MATERIALS FLOW SURVEYS ....................................................................................... 223 10.1 HMCFS PRACTICE RECOMMENDATIONS ..................................................................... 224 10.2 THE HMCFS PROCESS ................................................................................................... 225 10.3 HMCFS LEADERSHIP, OBJECTIVES, AND DATA REQUIREMENTS ................................. 228 10.4 BASELINE INFORMATION AND SCOPE ......................................................................... 230 10.5 COLLECT AND REVIEW EXISTING DATA ....................................................................... 232 10.6 COLLECT AND VALIDATE NEW DATA ........................................................................... 234 10.7 ANALYSIS AND DOCUMENTATION ............................................................................... 236 10.8 IMPLEMENTATION ....................................................................................................... 238 10.9 CASE STUDIES ............................................................................................................... 238 10.10 COMMODITY FLOW APPLICATION MODEL.................................................................. 238
CHAPTER 11 HAZARDOUS MATERIALS COMMODITY FLOW RESEARCH NEEDS ....................................................................................................................... 240 11.1 TEMPORAL VARIABILITY OF HAZARDOUS MATERIAL TRANSPORT ............................. 240 11.2 PARTICIPATION IN LOCAL PROCESSES ......................................................................... 240 11.3 VULNERABILITIES ASSOCIATED WITH DIFFERENT MODES OF HAZMAT TRANSPORT . 241 11.4 VALIDATION OF EXISTING ACCIDENT DATA ................................................................. 241 11.5 TRACKING LEPC MEMBERS, EXECUTIVE COMMITTEES AND LEADERSHIPS ................ 241 11.6 MULTILEVEL COMMUNICATION, DATA COLLECTION AND ARCHIVING ...................... 242 11.7 INTEGRATING THE HMCFS INTO COMMUNITY COMPREHENSIVE EMERGENCY PLANS ..................................................................................................................................... 242
xi
REFERENCES ....................................................................................................................... 243 APPENDIX A HAZARDOUS MATERIALS PLACARDS ................................................. A-1 APPENDIX B SHIPPING DOCUMENTS AND PLACARD NUMBERS .......................... B-1 APPENDIX C LEPC SURVEY ON HMCFS PRACTICES ................................................ C-1 APPENDIX D ELECTRONIC DATA SOURCE DESCRIPTIONS ................................... D-1
D.1 EXISTING ELECTRONIC DATABASE AND MAP SOURCE DESCRIPTIONS ........................ D-2 D.2 EXISTING ELECTRONIC REPORT SOURCE DESCRIPTIONS ............................................ D-13
APPENDIX E 2002 VEHICLE INVENTORY AND USE SURVEY DATA ...................... E-1 E.1 VEHICLE TYPES .............................................................................................................. E-1 E.2 VEHICLE CONFIGURATIONS .......................................................................................... E-1
APPENDIX F SAMPLE RAILROAD DATA REQUEST FORM ....................................... F-1 APPENDIX G WATERWAY DATA ANALYSIS USING USACE COMMODITY AND
HAZMAT CODES ............................................................................................................... G-1 APPENDIX H CDPS TRUCK/HAZMAT COUNT TABULATION SHEETS .................. H-1 APPENDIX I TRUCK/HAZMAT COUNT TABULATION SHEET FOR VIUS CARGO
BODY TYPE, SIZE AND WEIGHT CLASSIFICATIONS ............................................. I-1
xii
LIST OF FIGURES AND TABLES
Page Figure 1: The HMCFS Process. ......................................................................................................... 3 Figure 2: The HMCFS Process. ....................................................................................................... 22 Figure 3: HM-01 Survey Flow Chart. ............................................................................................. 25 Figure 4: Active Participant Groups for LEPC Survey Respondents. ............................................. 30 Figure 5: Number of HMCFS Conducted by LEPC Survey Respondents. ...................................... 33 Figure 6: Years that HMCFS Was Conducted by LEPC Survey Respondents. ............................... 34 Figure 7: Reasons for Conducting HMCFS. ................................................................................... 36 Figure 8: Level of Understanding about HMCFS Process as Indicated by LEPC Survey
Respondents. .................................................................................................................... 38 Figure 9: HMCFS Participants. ....................................................................................................... 39 Figure 10: Guidance Used by LEPCs for Conducting HMCFS. ....................................................... 40 Figure 11: Existing Data Sources Used for Conducting HMCFS. ................................................... 42 Figure 12: New Data Sources Used for Conducting HMCFS. ........................................................ 44 Figure 13: ‘Most Important’ Factors Guiding Selection of Vehicle/Placard Count
Locations. .......................................................................................................................... 45 Figure 14: Timing Used by LEPCs for Conducting HazMat Vehicle/Placard Counts. .................... 48 Figure 15: ‘Most Important’ Factors Guiding Selection of Locations for Examining
Shipping Manifests. ........................................................................................................... 49 Figure 16: HazMat Quantity Data Collected for HMCFS. .............................................................. 51 Figure 17: HazMat Classification Data Collected for HazMat CFS. ............................................... 52 Figure 18: Perceived HazMat Data Usefulness by Level of Quantity Data Collected. .................. 54 Figure 19: Perceived HazMat Data Usefulness by Level of Classification Data Collected ............ 55 Figure 20: Challenges with HMCFS Data Collection. .................................................................... 57 Figure 21: Methods Used to Determine/Validate Meaning of HMCFS Data to LEPC
Jurisdiction. ....................................................................................................................... 59 Figure 22: HMCFS Applications – Short Answer Responses. ........................................................ 61 Figure 23: HMCFS Applications – From Provided Response Options. .......................................... 62 Figure 24: Most Useful Reported HMCFS Results. ....................................................................... 63 Figure 25: Top LEPC Priorities for Next HMCFS. ........................................................................... 64 Figure 26: HMCFS Distribution. ..................................................................................................... 66 Figure 27: Improvement to Understanding of Transport Risks by Different Groups. .................. 67 Figure 28: Sources of HMCFS Funding Used by LEPCs. ................................................................. 68 Figure 29: Information Provided by SERCs to LEPCs about HMCFS.............................................. 70 Figure 30: HMCFS Grant Funds Matching Mechanisms Suggested by LEPCs. .............................. 71 Figure 31: Perceived Barriers to Conducting HMCFS. .................................................................. 75
xiii
Figure 32: Perceived Incentives for Conducting HMCFS. ............................................................. 76 Figure 33: ‘Bang-for-Your-Buck’ HMCFS Practices Recommended by LEPCs. .............................. 77 Figure 37: Hourly Frequencies of ‘HMIS Serious’-Classified Highway In-Transit Incidents. ....... 170 Figure 38: The HMCFS Process.................................................................................................... 227 Figure 39: The HMCFS Goals and Objectives Identification Process. ......................................... 229 Figure 40: The HMCFS Baseline Information Compilation and Review Process. ....................... 231 Figure 41: The HMCFS Existing Data Collection and Evaluation Process.................................... 233 Figure 42: The HMCFS New Data Collection and Validation Process. ........................................ 235 Figure 43: The HMCFS Data Analysis and Documentation Process. ........................................... 237 Figure 44: The HMCFS Implementation Process. ....................................................................... 239 Table 1: The Hazardous Materials Classification System .............................................................. 15 Table 2: LEPC HazMat Transport Characteristics. ......................................................................... 29 Table 3: Major Local Business Sectors by LEPC Jurisdiction Population ....................................... 29 Table 4: LEPC Meeting Attendance and Frequency. ..................................................................... 31 Table 5: Number of HazMat CFS Conducted by LEPCs. ................................................................ 33 Table 6: LEPC Conduct of HMCFS by Population Category. .......................................................... 34 Table 7: Perceived HazMat Transport Risk Levels of LEPC Survey Respondents. ........................ 36 Table 8: LEPC Understanding of HMCFS Process. ......................................................................... 37 Table 9: LEPC Exchange of HMCFS Information. .......................................................................... 42 Table 10: LEPC Reasons for Selecting Vehicle/Placard Counts Locations. ................................... 44 Table 11: Locations Used for Conducting Vehicle/Placard Counts. .............................................. 47 Table 12: LEPC Reasons for Selecting Locations to Examine Shipping Manifests. ....................... 47 Table 13: Locations Used for Examining Shipping Manifests. ...................................................... 49 Table 14: Perceived Data Usefulness by Use of Information Sources to Guide Conduct of
HMCFS. .............................................................................................................................. 53 Table 15: Data Usefulness for Different Modes by Collected HazMat Quantity
Information. ...................................................................................................................... 54 Table 16: Data Usefulness for Different Modes by Collected HazMat Classification
Information. ...................................................................................................................... 55 Table 17: Perceived Confidence in Data Analysis by Use of Information Sources to Guide
Conduct of HMCFS. ........................................................................................................... 58 Table 18: LEPC Agreement about Needed Resources. ................................................................. 72 Table 19: LEPC Agreement about Burden of HMCFS Process. ..................................................... 74 Table 20: HMCFS Electronic Database and Mapping Sources .................................................... 109 Table 21: HMCFS Electronic Reports and Other Data Sources ................................................... 111 Table 19: Sampling Frameworks, Examples, Advantages, and Disadvantages. ......................... 130 Table 20: Traffic and HazMat Placard Survey Methods.............................................................. 135
xiv
Table 21: HazMat Flow Data Characteristics, by Source, for Railway, Pipeline, and Waterway Transport Modes. .......................................................................................... 144
Table 22: HazMat Flow Data Output, Applicability, Relevance, and Analysis Effort Required, by Source, for Railway, Pipeline, and Waterway Transport Modes. ............. 145
Table 23: HazMat Flow Data Characteristics, by Source, for Truck/Roadway Transport Mode. .............................................................................................................................. 147
Table 24: HazMat Flow Data Output, Applicability, Relevance, and Analysis Effort Required, by Source, for Truck/Roadway Transport Mode. ........................................... 149
Table 25: Example Summary of Truck Size, Type, and UN/NA Placard Information. ................. 160 Table 26: Example Summary of Percentage Trucks with UN/NA Placards, by Truck Size
and Type. ......................................................................................................................... 162 Table 27: Example Summary of Percentage Trucks with UN/NA Placards, including
Confidence Intervals. ...................................................................................................... 162 Table 28: Example Table of Objectives, Results, Basis and Recommendations. ........................ 174 Table 29: Potential Listing of Fields for Hazmat HMCFS Directory. ............................................ 181
xv
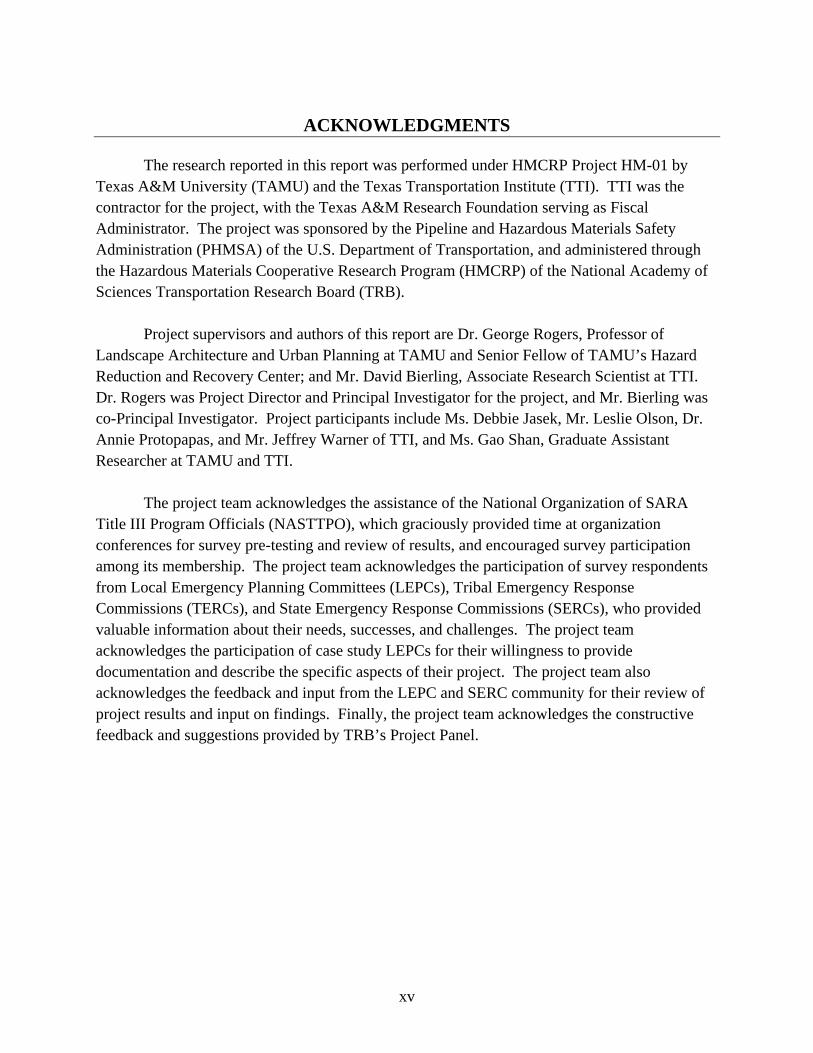
ACKNOWLEDGMENTS
The research reported in this report was performed under HMCRP Project HM-01 by
Texas A&M University (TAMU) and the Texas Transportation Institute (TTI). TTI was the contractor for the project, with the Texas A&M Research Foundation serving as Fiscal Administrator. The project was sponsored by the Pipeline and Hazardous Materials Safety Administration (PHMSA) of the U.S. Department of Transportation, and administered through the Hazardous Materials Cooperative Research Program (HMCRP) of the National Academy of Sciences Transportation Research Board (TRB).
Project supervisors and authors of this report are Dr. George Rogers, Professor of Landscape Architecture and Urban Planning at TAMU and Senior Fellow of TAMU’s Hazard Reduction and Recovery Center; and Mr. David Bierling, Associate Research Scientist at TTI. Dr. Rogers was Project Director and Principal Investigator for the project, and Mr. Bierling was co-Principal Investigator. Project participants include Ms. Debbie Jasek, Mr. Leslie Olson, Dr. Annie Protopapas, and Mr. Jeffrey Warner of TTI, and Ms. Gao Shan, Graduate Assistant Researcher at TAMU and TTI.
The project team acknowledges the assistance of the National Organization of SARA Title III Program Officials (NASTTPO), which graciously provided time at organization conferences for survey pre-testing and review of results, and encouraged survey participation among its membership. The project team acknowledges the participation of survey respondents from Local Emergency Planning Committees (LEPCs), Tribal Emergency Response Commissions (TERCs), and State Emergency Response Commissions (SERCs), who provided valuable information about their needs, successes, and challenges. The project team acknowledges the participation of case study LEPCs for their willingness to provide documentation and describe the specific aspects of their project. The project team also acknowledges the feedback and input from the LEPC and SERC community for their review of project results and input on findings. Finally, the project team acknowledges the constructive feedback and suggestions provided by TRB’s Project Panel.
xvi
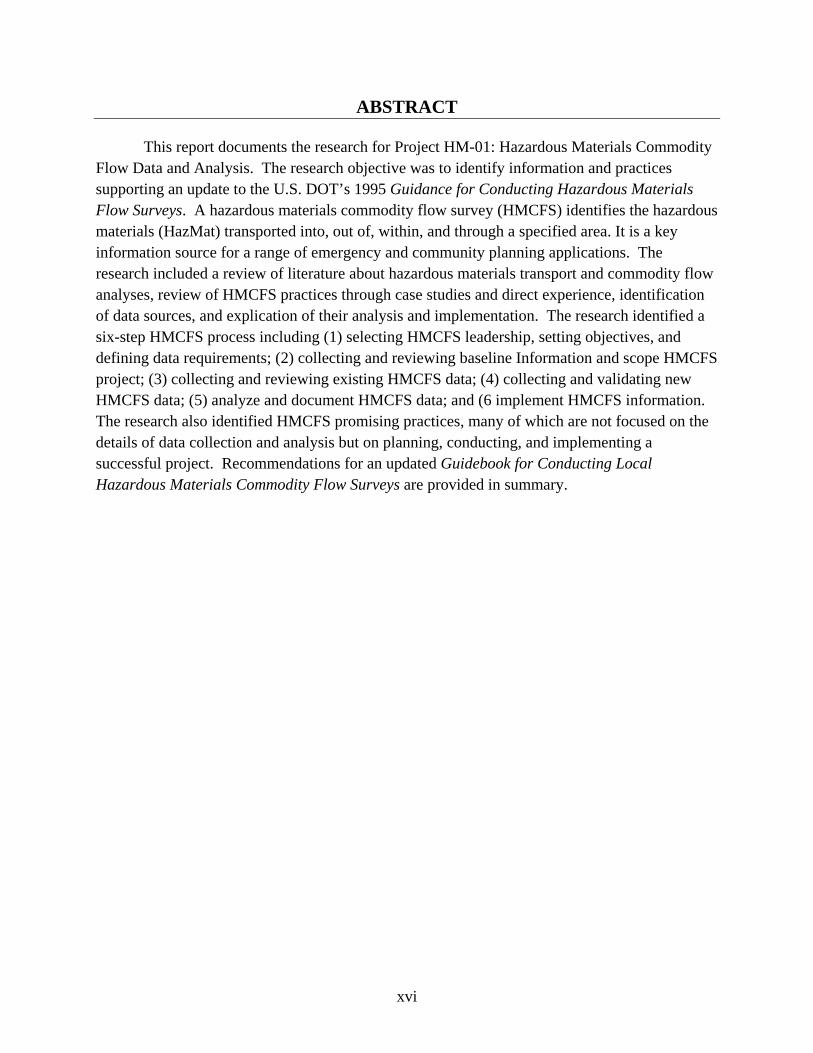
ABSTRACT
This report documents the research for Project HM-01: Hazardous Materials Commodity Flow Data and Analysis. The research objective was to identify information and practices supporting an update to the U.S. DOT’s 1995 Guidance for Conducting Hazardous Materials Flow Surveys. A hazardous materials commodity flow survey (HMCFS) identifies the hazardous materials (HazMat) transported into, out of, within, and through a specified area. It is a key information source for a range of emergency and community planning applications. The research included a review of literature about hazardous materials transport and commodity flow analyses, review of HMCFS practices through case studies and direct experience, identification of data sources, and explication of their analysis and implementation. The research identified a six-step HMCFS process including (1) selecting HMCFS leadership, setting objectives, and defining data requirements; (2) collecting and reviewing baseline Information and scope HMCFS project; (3) collecting and reviewing existing HMCFS data; (4) collecting and validating new HMCFS data; (5) analyze and document HMCFS data; and (6 implement HMCFS information. The research also identified HMCFS promising practices, many of which are not focused on the details of data collection and analysis but on planning, conducting, and implementing a successful project. Recommendations for an updated Guidebook for Conducting Local Hazardous Materials Commodity Flow Surveys are provided in summary.
1
EXECUTIVE SUMMARY
ES.1 PURPOSE
This report documents the research for Project HM-01: Hazardous Materials Commodity Flow Data and Analysis. The research objective was to identify information and practices supporting an update to the U.S. DOT’s 1995 Guidance for Conducting Hazardous Materials Flow Surveys. A commodity flow survey identifies the amount and type of commodities transported through a specific geographic area. A hazardous materials commodity flow survey (HMCFS, used in both singular and plural) identifies the types and amounts of hazardous materials (HazMat) transported into, out of, within, and through a specified geographic area, such as a community, city, county, state, metropolitan area, as well as the routes utilized to transport these commodities.
Under the Emergency Planning and Community Right-to-Know Act (EPCRA), Local Emergency Planning Committees (LEPCs) have responsibility for local emergency planning. The LEPC develops hazardous substances emergency response plans, either as stand-alone plans or as an important part of the Comprehensive Emergency Management Plan. Under 49 CFR Part 110, LEPCs that conduct an HMCFS are eligible for HazMat risk assessment grant funding.
ES.2 THE HCMFS PROCESS
Figure 1 illustrates the HMCFS process. The process includes six major steps:
1) Identify HMCFS Leadership, Set Objectives, and Define Data Requirements—Identifying the primary objectives for conducting the HMCFS determines the kinds of data that will be required. Objectives should be identified by key stakeholders who provide guidance and oversight of the project.
2) Collect and Review Baseline Information and Scope HMCFS Project—The baseline review involves readily-available local information about HazMat transportation, including previous studies, transport modes and routes, incidents and accidents, and population locations. The review helps identify the extent of additional information needed for the HMCFS, and information gaps. The information gaps inform about the additional data collection efforts that will be required.
3) Collect and Review Existing HMCFS Data—Collecting and reviewing existing data involves searching prior HMCFS documents, local, state, and federal agency data, electronic databases and reports, trade, environmental and social advocacy, and academic sources, and other print sources of information about HazMat transport. The extent to which new HMCFS data are needed is identified.
4) Collect and Validate New HMCFS Data—Collecting and validating new HMCFS data involves gathering data from key informants and collecting field data, including
2
vehicle, placard, or shipping manifest surveys, along various HazMat routes and route segments.
5) Analyze and Document HMCFS Data—Analyzing HMCFS data involves using collected existing and/or new data to estimate HazMat flows. Spatial and temporal analysis may be conducted.
6) Apply HMCFS Information—Applying HMCFS results involves understanding limitations of results, disseminating and communicating information, applying results toward objectives, and planning for future activities.

3
Figure 1: The HMCFS Process.
4
ES.3 SELECT HMCFS LEADERSHIP, SET OBJECTIVES, AND DEFINE DATA REQUIREMENTS
Setting goals and outcomes is one of the most important steps while conducting an HMCFS. Local entities are often overwhelmed with trying to provide the best possible protection for the public with extremely limited resources. Nine categories of desired HMCFS outcomes are identified and discussed: awareness, minimum training scenario, maximum training scenario, emergency planning, equipment needs, comprehensive planning, resource scheduling, route adjustment, and legal takings. Each category of objectives has different levels of complexity and data and resource requirements. The project team is responsible for coordinating and managing the project. The project team determines how specific the HMCFS data should be based on the objectives set by the core team.
ES.5 COLLECT AND REVIEW BASELINE INFORMATION AND SCOPE HMCFS PROJECT
Reviewing current baseline information about hazardous materials transport in the area identifies data needs and guides data collection efforts. This includes:
· the modes by which HazMat is transported and the relevant transportation network for each mode;
· prior HMCFS for the jurisdiction or jurisdictions on connecting corridors; · information about fixed facilities, shippers, receivers, and carriers that produce, store
use, or transport hazardous materials, population centers, critical infrastructures, and future developments relative to HazMat transport corridors; and
· information from local and state agencies about the transportation network, commodity movements, population demographics, traffic levels, or incidents.
The study area’s baseline, current “in-house” knowledge is reviewed to assess their current state of knowledge about HazMat transport and gaps. The preliminary inventory of HazMat flows, resulting from the baseline review, allows planners to focus on routes where:
· there is reason to believe risks are high; · knowledge is limited or undocumented; · potential exposures are extreme; or · some combination of these is present.
ES.6 COLLECT AND REVIEW EXISTING HMCFS DATA
Existing data are information that have been previously collected and assembled. Collecting and validating existing data requires effort to obtain, compile, evaluate, and determine whether it is sufficient to meet the HMCFS objectives. Existing data represent a considerable
5
resource-saving source of information. However, their disadvantage is that they were not collected directly for the purpose of the local HMCFS, and the extent to which they are applicable to current community needs depends on the source. Review of existing data includes a more in-depth evaluation of information covered in the baseline assessment as well as other existing electronic databases and reports about:
· transportation networks; · commodity movements; · system performance (traffic levels); · population, environmentally sensitive areas, and critical facility locations; · historical incident and accident occurrences and locations; and · contact information.
ES.7 COLLECT AND VALIDATE NEW HMCFS DATA
New data are collected specifically for the HMCFS. These data have a disadvantage in that they require more effort to collect than most existing data sources, but new data are directly applicable and require less manipulation, and may also be used for other local applications. New data collection includes interviews with key informants (HazMat shippers, receivers, and carriers), traffic surveys, and examining shipping manifests to identify local patterns.
Collection of field data will be driven by the precision of the information needed to meet HMCFS objectives and needs to be known about HazMat flows in a community. Traffic survey information can include the number of vehicles, units, type of vehicles, and sometimes the packages in a shipment. The content of the shipment can be observed for the presence of HazMat, the class or division of HazMat, the placard or UN ID, or the specific material/chemical. Origin-destination data are the most comprehensive information about HazMat transport and can be obtained with a review of shipping manifest information. Unfortunately, it is also the most labor intensive data to collect with enough precision to estimate HazMat traffic flows over a network; it is also the most mathematically intensive to interpret. The validation of the data is an important step in the appropriate interpretation and implementation of the HMCFS. The extent to which the precision of the collected data match that needed for the desired outcomes is one important criterion for how the HMCFS is applied.
ES.8 ANALYZE AND DOCUMENT HMCFS DATA
Using the HMCFS data to describe HazMat flows depends on the precision and character of the collected data. The ability to characterize of HazMat flows depends on local relevance of existing data and sampling and specificity of new data. Analyzing HMCFS information for railways, pipelines, waterways, and airways is generally straightforward because the existing flow information is based on a census of all HazMat transport or represents the extent of
6
available information. Hence, sampling limitations are rarely associated with these data. Conversely analysis of HMCFS commodity flow data for trucks/roadways can be complex.
The HMCFS data are summarized and presented in lists, tables, charts, and maps. Existing and new data can be collected at various levels, allowing alternative approaches for analysis that evaluate each type of source individually or combine information from different sources to generate estimates. The simplest analyses of HMCFS commodity flow data involve reviewing existing estimates for commodity flows and applying those estimates to HazMat flows in a community. The most complex analyses use locally-relevant data to identify differences in commodity flows spatially, temporally, or spatially and temporally.
Increasing knowledge of risks involves quantifying the frequency and magnitude of risk along a given route-segment, route, or corridor. When detailed HazMat commodity flow data are available, they can be used to characterize commodity movements on a spatial and temporal basis. Procedures for conducting the risk assessment calculations are well established and can depend on specific characteristics of the local setting, commodities that are transported, modes of transport, and information about the likelihood of incidents and accidents.
ES.9 IMPLEMENT HMCFS INFORMATION
Using the HMCFS to implement desired outcomes is critical in making it worthwhile. HMCFS implementation must recognize and appreciate of the limitations of the study. This helps decision-makers recognize how the kinds of actions required to implement study are impacted and what additional information is needed to make higher-level decisions.
Disseminating the HMCFS is a one-way communication of the results of the study to various audiences. Dissemination involves deciding what critical results to communicate, to whom they should be delivered, and delivering the results to these people. Communicating the HMCFS involves two-way communication of the study results with selected audiences through discussion and interpretation of results, sharing more subtle information and higher-order interpretations, and receiving feedback about the results that draw on collective experience and expertise as well of direct observation.
The HMCFS can contribute to several different types of ongoing planning processes, and merely putting the document on-the-shelf fails to stimulate discussion, decision-making, or proactive response to impending situations. Implementation involves actively engaging various groups of interested parties, stakeholders, community leaders, industry, and other end users. It is important for the HMCFS documents and supporting data be archived locally in different locations to assure continuity.
An HMCFS is a static picture of an ongoing process. Hence, there is a need to consider when it should be revised or updated. Communities with complex flows may find it necessary to
7
revise the HMCFS frequently, while those with less complex flows may find that a well-done HMCFS can last for years.
ES.10 SUPPORTING RESEARCH
The research for this project includes a review of the literature, a survey of LEPC HMCFS practices, and review of HMCFS practices through case studies.
ES.10.1 Literature Review
The literature review included previous guidance about hazardous materials risk assessment and transportation, commodity flow studies, existing data sources, new data collection, analysis and implementation, and project administration. Rather than be included in a specific section, reviewed literature is cited throughout the report.
ES.10.2 National Survey of LEPCs about HMCFS Practices
An electronic survey was administered to LEPCs from across the U.S. about HMCFS practices, and 550 responses were received. Conducting an HMCFS appears to be an area that has received little attention by many LEPCs and shows great potential for improving understanding of local transportation risks. Most of the LEPC respondents indicated using the CFS information for general learning about HazMat transport, guiding training needs, planning, and equipment needs identification. Some LEPCs reported conducting an HMCFS in response to external advocates or not knowing why the CFS was conducted, which implies some level of “satisficing.”
Current HMCFS practices are generally less sophisticated than traditional commodity flow or shipment origin-destination studies. Placard counts and vehicle counts were the most commonly used “new” data sources, used by around half of respondents while only a small minority used shipping manifest data. Data collection locations were selected because of convenience, specialized knowledge, logistics issues, collection accuracy, and participant safety.
The large majority of respondents indicated that their most recent HMCFS only obtained information up to the level of HazMat presence only and up to the HazMat class/division characterization, if applicable. However LEPCs that collected more specific HazMat transport data, up to ‘relative’ HazMat quantity (e.g., small, medium, large) and specific UN/NA placard ID, reported significantly higher CFS data usefulness than for other quantity and classification levels, respectively.
Most LEPCs validate the meaning of HMCFS data to their jurisdiction through active review and discussion, while a small minority actively “compare” or “analyze or evaluate” the data collected. Passive validation through distribution of results, implementation of plans,
8
response, and training are also used. While LEPCs report seldom taking action to validate CFS data beyond face-validity, they report using these data for a range of uses, which suggest active validation would improve those higher complexity decisions that are based on these data.
Getting a handle or idea about HazMat commodity flows and availability of funds were the two most frequently indicated reasons that LEPCs conducted their most recent HMCFS. Training, planning, equipment needs identification, and response needs identification were the most frequently cited most useful specific applications from the LEPCs’ most-recent HMCFS. These patterns suggest that HMCFS data tend to be less (rather than more) detailed, are validated in terms of face-validity, and used for hazardous materials concerns across a wide range of applications—from planning and training to equipment purchases. Most LEPCs seem to focus on attaining data, with far-more-limited attention to understanding what data are sufficient to meet local needs, or how to maximize the utility of available data.
While there is a high degree of HMCFS dissemination to local emergency response agencies, it is progressively lower for public health officials, school officials, most public administrators and the general public. Communication across LEPC jurisdictions about HazMat commodity flows is lacking: roughly a third or less of LEPCs indicate sharing HMCFS information with other LEPCs.
It becomes readily apparent that groups to whom HMCFS dissemination and information is communicated corresponds with improvements to understanding of transport risks. However, this pattern of response indicates that while LEPCs recognize the utility of the HMCFS to educate their constituents, including local officials, emergency responders, school officials, and the public at large, they frequently do not report actively distributing the HMCFS data to these audiences. This pattern reflects missed opportunities to improve understanding among critical stakeholders.
Information sharing by transportation carriers and facilities was the most frequently cited data challenge faced by LEPCs. LEPCs also indicated resource limitations of time, personnel, and costs limited their ability to access data, suggesting that the LEPCs feel that they could obtain the information if they had the ability to dedicated resources. LEPC resource needs were by far the most frequently indicated barriers to conducting an HMCFS, especially funding but also available personnel and time to conduct the study. CFS project process and management, political and organizational issues, flow information, and applications barriers were mentioned much less frequently.
LEPC HMCFS incentives are very similar to identified barriers, as might be expected. The overwhelming majority of LEPCs indicated more funding as an incentive for conducting HMCFS. LEPCs most frequently indicated a priority for increasing knowledge about HazMat commodity flows, particularly for material types, flow routes, and transport modes. LEPCs also
9
indicated a desire to improve overall study quality and risk communication. Application and resources priorities were mentioned less frequently.
LEPCs suggested a range of project participants and partnering opportunities. Taking advantage of these will not only will increase an LEPC’s ability to meet match requirements but also increase the ability to obtain CFS information and achieve objectives. Most frequently mentioned was using or applying the data that were collected, rather than simply conducting the study and forgetting about it. Project preparation and data sources practices suggestions were also listed to a lesser degree.
ES.10.3 Case Studies
Seven case studies were included to illustrate how HMCFSs have been conducted in local jurisdictions. The case studies represent a range of U.S. regions, geographic areas covered, community sizes, community types (rural and urban), transportation modes, transportation network components, traffic levels, data sources, project participants, and practices used. Eighteen recommendations were identified from the case studies for conducting an HMCFS. Recommendations are for HMCFS funding and staffing, project planning and execution, using existing data sources, data collection, validation, presentation, and implementation.
ES.11 PROMISING PRACTICES
The practices reported by LEPCs in surveys and the case studies were overlaid on some of the most important concerns expressed by LEPCs conducting HMCFSs. Promising practices were compiled directly from best practices reported by LEPCs, as well as logical progressions to fill identified gaps in the process. Eleven promising practices are described:
1) HMCFS Objectives Checklist—Is comprised of an initial checklist of some of the objectives that local entities have reported for their HMCFS.
2) Match Protection Level with Desired Outcomes—Evaluates the extent of match between desired community risk levels (goals) and desired objective(s) to ensure consistency of project results with their ultimate purpose: ensuring public protection.
3) Let Objectives Guide Sampling—Identifies the appropriate balance between the desire for exhaustive data of the utmost precision, HMCFS objectives(s), and the realities of limited resources.
4) Let Objectives Guide Precision—Matches the HMCFS objectives with the level of HMCFS data collection precision maximizes resource utility.
5) Stretch Limited Time and Resources—Most LEPCs are voluntary in nature, and funding tends to be sparse and difficult to come by; hence, making the most of in-kind funding, volunteer participants, industry contributions, and sequencing HMCFS activities is often critical to a successful project.
10
6) Consider Consecutive Year Studies—Phasing HMCFS projects can result in a more comprehensive and complete HMCFS over several years and help dealing with time constraints associated with funding cycles.
7) Use the Active Participation Checklist—Active participation by LEPC members in the HMCFS is important to achieving success regardless of whether the HMCFS is done by the LEPC or a contractor. The participation checklist identifies key activities often associated with LEPC members.
8) Use Existing Data Source Checklist—There are many sources of data; the existing data source checklist provides a list of potential sources can help those engaging in the conduct of an HMCFS (especially first-timers) to start the process.
9) Hot Spots Analysis—Determining specific areas of concern can done by a hot spots analysis that examines collocation of hazardous materials and human populations in time and space.
10) Use Risk Communication Checklist—The risk communication checklist includes locations, people, or offices to consider for the communication of HMCFS information.
11) Demonstrate Local Risk—Communicating the risk associated with HazMat transportation through an area can help local leaders understand the importance of taking preemptive actions to reduce risk and mitigate consequences.
ES.12 SUMMARY
This research documents a wide variety of HMCFS objectives, existing and new data sources, methods for evaluating data, and ways of implementing outcomes and communicating results to a range of project participants and stakeholders. There is no clear-cut way of describing what an HMCFS project requires based on community size, economic base, transportation network characteristics. The research shows that the complexity of conducting an HMCFS project generally increases as:
· size of community increases, resulting in more diverse goods consumption; · proximity to major HazMat producers, processors, and consumers increases; · complexity of the local and regional economy increases, resulting in greater seasonal
variations in HazMat transport for different sectors; · precision required to support HMCFS objectives increases, increasing the need for
locally-relevant, specific HazMat transport data; · number of different modes included in the HMCFS increases; · number of major roadway transport corridors included in the HMCFS increases; and · availability of locally-relevant existing data decreases, increasing the requirement for
collection of new data.
Two general HMCFS practices can be recommended for all LEPCs:
11
1) Follow the HMCFS process. The HMCFS process identified in this report based on the previous U.S. DOT Guidance, which incorporates previous practice and literature and is validated in experience.
2) Use the Promising Practices. The Promising Practices are based on feedback from LEPCs and direct experience with conducting HMCFS about what works and does not work for an HMCFS project. Many of these practices are not focused on the details of HMCFS data collection and analysis but rather are keys to successfully planning, conducting, evaluating, and implementing an HMCFS project.
ES.13 IMPLEMENTATION
The results of the research should be used to develop an updated Guidebook for Conducting Local-Level Hazardous Commodity Flow Studies. The document should retain a similar structure with the 1995 Guidance¸ while updating the data sources and recommended analysis procedures, adding information for rail, pipeline, water, and air modes, and presenting additional information about the context of HazMat planning and implementing project results.
The guidebook should cover the life cycle of an HMCFS and outline project steps along the way. The mechanisms to achieve objectives should be described and explained along each step of the process. How-to guidance for conducting a simple and sound HMCFS should be provided in conformance with the wide range in capabilities and resources found among local jurisdictions in the U.S.
Typical issues faced by LEPCs and other local entities around the country for conducting commodity flow studies should be described. Promising practices should be presented as options to address many challenges faced in conducting an HMCFS. Detailed information about the HMCFS process, including promising practices, can be presented as appendices in the updated Guidebook to retain a more streamlined approach to the main document.

12
CHAPTER 1: BACKGROUND AND CONTEXT Emergency planning, prevention, response, and mitigation is a complex process. This
process includes identifying hazards, analyzing risks, determining how to reduce potential problems, developing response procedures and plans, training personnel, and finally testing the plans, procedures, and personnel. A significant portion of this process is driven by regulations.
In 1986, the Superfund Amendments and Reauthorization Act of 1986 (SARA) was signed into Federal Law. One of the provisions of SARA is Title III, “The Emergency Planning and Community Right to Know Act of 1986,” which establishes requirements for federal, state, local governments, and industry regarding emergency response planning and community right-to-know about hazardous chemicals (1). This provision requires every community in the United States to have an emergency plan for dealing with chemical hazards. EPCRA also requires the establishment two entities to facilitate this plan. The first entity is the State Emergency Response Commission (SERC), which is required to designate Emergency Planning Districts for that state. Each Emergency Planning District forms a Local Emergency Planning Committee (LEPC), which is comprised of representatives of local government, emergency response officials, industry, environmental groups, and citizens.
In addition, federal, state, and local entities have a joint responsibility for emergency planning under the Robert T. Stafford Disaster Relief and Emergency Assistance Act (the Stafford Act). Through the Stafford Act, the Federal Emergency Management Agency (FEMA) requires that local and state entities develop hazard mitigation plans as a condition of receiving mitigation grant funding.
1.1 LOCAL EMERGENCY PLANNING COMMITTEES
There are more than 3,000 Emergency Planning Districts and LEPCs in the United States. The purpose of the LEPC as defined by the Environmental Protection Agency is to:
• develop emergency response plans in case of accidental release of chemical hazards in the community;
• develop procedures for regulated facilities to provide informational and emergency notification to the LEPC;
• develop procedures for receiving and processing requests from the public under EPCRA;
• provide for public notification of LEPC activities; and • work with industry and the interested public to encourage continuous attention to
chemical safety, risk reduction, and accident prevention by each local stakeholder (2).
The LEPC includes representatives selected by the local governmental entity and approved by the SERC. The LEPC membership must include, representation from the following
13
groups: elected State and local officials; law enforcement, civil defense, firefighting, first aid, health, local environmental, hospital, and transportation personnel; broadcast and print media; community groups; and owners and operators of facilities subject to EPCRA (3). The LEPC is (and must be) the link between citizens, industry, and government. Because members of the LEPCs are most familiar with the hazards in their community, and because local citizens tend to be the first responders for chemical emergencies, LEPCs are in the best position to assist local governments in developing plans to respond to hazardous material emergencies (4).
1.2 EMERGENCY RESPONSE PLANNING
LEPCs are required to develop an emergency response plan, review it at least annually, and provide information about chemicals in the community to citizens. These plans are developed by the LEPCs with stakeholder participation. These plans may stand alone or be part of the local jurisdiction’s Comprehensive Emergency Management Plan (CEMP). In either case the plan must include the following elements:
• identification of facilities and transportation routes of extremely hazardous substances,
• description of emergency response procedures, on and off site, • designation of a community coordinator and facility emergency coordinator(s) to
implement the plan, • outline of emergency notification procedures, • description of how to determine the probable affected area and population by
releases, • description of local emergency equipment and facilities and the individuals
responsible for them, • outline of evacuation plans, • a training program for emergency responders (including schedules), and • methods and schedules for exercising emergency response plans (5).
Once a plan is drafted by an LEPC, the SERC is required to review the plan. Plans must be updated and reviewed annually by the LEPC.
1.3 HAZARDOUS MATERIALS TRANSPORTATION OVERVIEW
Hazardous materials transportation falls under the purview of the U.S. Department of Transportation (DOT), Pipeline and Hazardous Materials Safety Administration (PHMSA). Under 49 CFR, Part 105 (6), hazardous materials are defined as:
[A] substance or material that the Secretary of Transportation has determined is capable of posing an unreasonable risk to health, safety, and property when transported in commerce, and has designated as hazardous under section 5103 of Federal hazardous
14
materials transportation law (49 U.S.C. 5103). The term includes hazardous substances, hazardous wastes, marine pollutants, elevated temperature materials, materials designated as hazardous in the Hazardous Materials Table (see 49 CFR 172.101), and materials that meet the defining criteria for hazard classes and divisions in part 173 of subchapter C of this chapter.
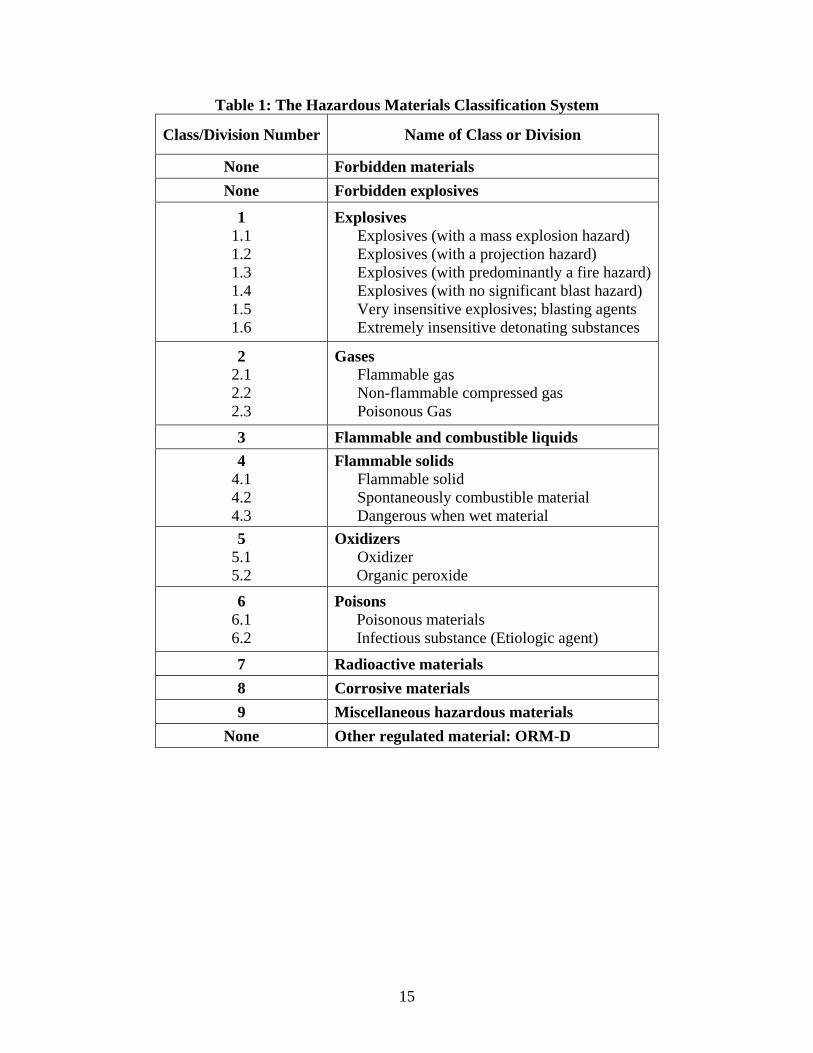
The National Response Team identifies hazardous materials as “generally referring to hazardous substances, petroleum, natural gas, synthetic gas, acutely toxic chemicals, and other toxic chemicals” (7). Under 49 CFR, Part 173 (8), hazardous materials are grouped into nine major classes, several of which are further subclassified into divisions, as shown in Table 1. Warning placards and labels of each class/division for materials shipments are characterized by distinct graphic schemes. Appendix A shows examples of placards from the 2008 Emergency Response Guidebook (ERG) associated with the different HazMat classes and divisions (9). Appendix B shows shipping document (manifest) information and an illustration of placard numbering from the 2008 ERG.
15
Table 1: The Hazardous Materials Classification System
Class/Division Number Name of Class or Division
None Forbidden materials None Forbidden explosives
1 1.1 1.2 1.3 1.4 1.5 1.6
Explosives Explosives (with a mass explosion hazard) Explosives (with a projection hazard) Explosives (with predominantly a fire hazard) Explosives (with no significant blast hazard) Very insensitive explosives; blasting agents Extremely insensitive detonating substances
2 2.1 2.2 2.3
Gases Flammable gas Non-flammable compressed gas Poisonous Gas
3 Flammable and combustible liquids 4
4.1 4.2 4.3
Flammable solids Flammable solid Spontaneously combustible material Dangerous when wet material
5 5.1 5.2
Oxidizers Oxidizer Organic peroxide
6 6.1 6.2
Poisons Poisonous materials Infectious substance (Etiologic agent)
7 Radioactive materials 8 Corrosive materials 9 Miscellaneous hazardous materials
None Other regulated material: ORM-D
16
According to the U.S. Bureau of Transportation Statistics (BTS)/U.S. Census Bureau's
2007 Commodity Flow Survey, or CFS (10), 2.2 billion tons corresponding to 323 billion ton-miles of hazardous materials are shipped in the U.S. annually. Roadways (trucks) transport the majority—roughly 1.2 billion tons (about 54 percent of total tonnage) and 104 billion ton-miles (about 32 percent of total ton-miles) shipped. Rail is associated with 6 percent, waterway with 7 percent, and pipeline with 28 percent of total shipment tonnage. Although 2007 numbers were not published in the 2007 CFS, the transport of HazMat by air comprised 0.02 percent of total HazMat shipment tonnage in 2002.
The majority of shipment tonnage represents a subset of the nine hazardous materials classes. Flammable-Combustible Liquids (Class 3) represent 78 percent of the total tons, over 56 percent of the total ton-miles, and almost 81 percent of the total value. Gases (Class 2) represent over 11 percent of the tons, 17 percent of the ton-miles, and 9 percent of the value. The remaining seven HazMat classes total around 11 percent of total tons, 27 percent of total ton-miles, and 10 percent of total shipment value.
Incident statistics based on empirical data from PHMSA’s Hazardous Materials Information System (HMIS) Incident Reporting Database (11) show that 19,265 incidents were self-reported nationally by carriers in 2007 over highway, rail, air, and water modes of transportation. Of these, 50 percent involved Flammable-Combustible Liquids, and 26 percent involved Corrosive Materials, with the remaining 24 percent involving HazMat in other classes. Additionally, 88 percent of all incidents occurred on highways (trucks) and 4 percent on rail. Highway incidents were associated with 71 percent of the 227 injuries associated with HazMat transport, 100 percent of the 10 fatalities, and 62 percent of the $72.1 million in damages. Rail incidents were associated with 24 percent of injuries and 38 percent of damages. Water and air HazMat transportation modes are associated with any remainders in totals. Nationally, over half of all incidents (54 percent) occurred while the HazMat shipment was being unloaded, 19 percent while being loaded, 20 percent while in transit, and the remaining 7 percent while stored in-transit.
The vast majority of hazardous materials shipments move safely and securely along the nation’s transportation system. Only a small fraction of total shipments interrupt their planned journey due to an incident that threatens public and environmental safety. The chance of a HazMat incident in terms of cargo ton-miles transported is very small (i.e., 19,265 incidents/327 billion ton-miles = about 60 incidents per 100 million ton-miles transported, or less than one incident per million ton-miles transported). Although rare in terms of overall performance, the threat of incident is still significant with about two incidents per hour on average, or more than 50 per day (i.e., 19,265 incidents/365 days = 52 incidents per day or 52/24 > 2 per hour). Even though this threat is well below the one-in-a-million standard or reasonable protection, it can be
17
severe, even catastrophic; these consequences elevate the concern over transportation of hazardous materials through population centers or environmentally sensitive areas.
1.4 HAZARDOUS MATERIALS EMERGENCY PLANNING AND TRANSPORTATION GUIDANCE
Planning for hazardous materials transportation emergencies is an important component of the CEMP. Shortly after the passage of EPCRA, a number of guidance documents on hazardous materials planning were released that are applicable to transportation. These include the Hazardous Materials Emergency Planning Guide issued by the National Response Team. The guide discusses the formation of hazardous materials planning teams, hazards analysis content including hazard, vulnerability, and risk assessments, development of plans, and plan evaluation and continuation. The Guide focuses on general planning for hazardous materials emergencies, including transportation planning (7).
The Technical Guidance for Hazards Analysis was issued by the U.S. Environmental Protection Agency (U.S. EPA), Federal Emergency Management Agency (FEMA), and U.S. Department of Transportation (U.S. DOT) in December 1987. As the title indicates, this document focuses on hazards analysis. It includes evaluation of vulnerability zones, hazards analysis procedures, and using analysis results. The guidance also includes transportation incidents as part of the overall hazardous materials hazards analysis (12).
The Transportation Research Board published Special Report 239 on Hazardous Materials Shipment Information for Emergency Response (13) in 1993. The report describes background information on hazardous materials transport, including characteristics, regulation and responder information, needs and problems encountered with HazMat information, and options for improving information. The U.S. Fire Administration’s Hazardous Materials Guide for First Responders (14) includes specific information about hazardous materials, placards, vehicle and vessel silhouettes that may be used to identify containers, descriptions of hazmat incident approaches, and strategies for incident response using placard information. The Emergency Response Guidebook, updated every four years, is a tool that every first responder should be familiar with. It lists hazardous materials by United Nations/North American (UN/NA) code, and provides initial response guidelines for categories of hazardous materials incidents as well as isolation guidelines for spills of extremely toxic chemicals.
The U.S. EPA released Hazards Analysis on the Move in October 1993. The document is a 12-page introduction to conducting a hazardous materials commodity flow study (HMCFS, used in both singular and plural for this report). It presents lessons learned from case studies, examples of HMCFS objectives, steps for organizing the study, considerations for gathering data, some advantages and disadvantages of different survey methods, additional information sources, ideas for addressing data needs, and suggestions for implementing results (15).
18
Following on U.S. EPA’s 1993 document, the Research and Special Programs Administration (RSPA) of the U.S. DOT prepared a detailed handbook for the Office of Hazardous Materials Safety (OHMS), titled Guidance for Conducting Hazardous Materials Flow Surveys (16), hereafter referred to as the Guidance. The function of the 1995 Guidance is to assist regional or state officials in understanding the purpose and uses of hazardous materials commodity flow studies and to assist in planning and conducting one. The document focuses on truck traffic commodity flow methodology, information sources, data collection, and data analysis. The document also included descriptions of state and local level commodity flow studies and presented a gravity-type model example of a commodity flow allocation model for three chemicals.
The U.S. Department of Homeland Security, Federal Emergency Management Agency (FEMA) released the Comprehensive Preparedness Guide (CPG) 101: Developing and Maintaining State, Territorial, Tribal, and Local Government Emergency Plans in March 2009 (17). CPG 101 lays out guidelines for developing emergency plans at local, state, and federal levels. A HMCFS informs three key elements of the emergency planning process identified in CPG 101—Understanding the Situation, Determining Goals and Objectives, and Plan Development. A HMCFS can inform not only an Emergency Plan’s hazard-specific annexes that are focused on HazMat, but also the Basic Plan and Emergency Support Functions/Functional Annexes as well.
In 2005, the Transportation Research Board (TRB) published Special Report 283 on Cooperative Research for Hazardous Materials Transportation (18) that described recent issues and potential research needs for a cooperative research program focused on hazardous materials transportation. The report identified that:
[M]any localities do not have access to reliable statistics on hazardous materials flows….Existing statistical information sources are too broad. They cover flows at the national, regional, and state levels. For local planners, this ‘macro’ level is far too coarse—in both amount and types of materials moving through their jurisdictions—to make meaningful estimates of commodity flows to support decisions about requisite training and preparation for incidents (p. 90).
The report identified a need for a project that collects and reviews existing local-level hazardous materials commodity flow data, compares methods of estimating flows and identifies best practices, and produces a detailed commodity flow survey methodology handbook.
1.5 PROJECT HM-01 HAZARDOUS MATERIALS COMMODITY FLOW DATA AND ANALYSIS
Project HM-01 of TRB’s Hazardous Materials Cooperative Research Program (HMCRP) is titled Hazardous Materials Commodity Flow Data and Analysis. The project updates the 1995
19
Guidance and will produce a guidebook for local planners and emergency managers to use for conducting HMCFS. An understanding the state of current practices—what works and does not work—for LEPCs that have experience with conducting HMCFS, as well as barriers and incentives for all LEPCs, can help provide real world, grounded guidance for other LEPCs and entities with an interest in hazardous materials commodity flows. The project covered multiple aspects of the HMCFS topic area:
• A literature review was conducted focusing on LEPC organizations and HazMat transportation. Literature references are incorporated throughout this report.
• Interviews and site visits were conducted with LEPCs about HazMat transportation and how their CFS was conducted.
• The project team’s personal experience with conducting HMCFS was included. • A survey instrument was developed to collect information from LEPCs about
methods used in, barriers and incentives for, and recommended practices for conducting an HMCFS. The survey instrument was administered over three months via the Internet to the national population of LEPCs for which valid email addresses were available to the project team. Survey responses were coded and analyzed.
• Case studies were conducted on the HMCFS process for seven different LEPCs across the U.S.
• Existing HMCFS data sources were reviewed and summarized. • New HMCFS data sources were described. • Methodologies for HMCFS data analysis were reviewed. • Suggestions for HMCFS implementation were developed. • Promising practices for local entities were identified and described. • Recommendations for an updated Guidebook for Conduct of Local Hazardous
Materials Commodity Flow Studies, hereafter referred to as the Guidebook, are listed. • The literature, survey, case studies, research, and recommendations were synthesized
for this report.
1.5.1 Hazardous Materials Commodity Flow Study Overview
An HMCFS is intended to “identify the types and amounts of commodities transported through a specified geographic area, such as a single community, a state, or large urban area, and the routes used for transporting these commodities.” An HMCFS “identifies the chemicals transported, either specifically or by hazard class, as well as the routes on which they are transported” (16, p. 9). Upon completion of the hazardous materials commodity flow study, planners for the jurisdiction have a better understanding of hazardous materials transportation patterns and can use the data to conduct planning and to estimate the risks facing the jurisdiction.
20
An HMCFS can be used for multiple purposes, both in emergency management as well as broader community planning and risk assessment. A jurisdiction often has specific objectives for conducting a hazardous material commodity flow study based on the particular needs of the area. Conducting an HMCFS can support enhancement of awareness about HazMat transport in a community, identification of HazMat incident response training scenarios, or assessment of the need for emergency response equipment or regional hazardous materials emergency response teams. Some of these activities are also eligible for grant funding under federal programs, and an HMCFS can provide a key component of needs justification for associated funding requests, although the HMCFS should not be conducted as a reason to justify new equipment. In addition, formal designation of HazMat transport routes requires a risk analysis, for which an HMCFS is an important part. These specific objectives may shape the scope and detail of the study.
The HMCFS is an important part of local emergency plans. Under 49 CFR Part 110, HMCFSs are eligible for HazMat risk assessment grant funding (19). Today this funding is administered through the PHMSA’s Hazardous Materials Emergency Preparedness (HMEP) Grants Program (20). Other grants may be available from other local, state, or federal agencies, and an HMCFS may be funded by a local entity without any additional grant funds.
1.5.2 The HMCFS Process
The 1995 Guidance structures the HMCFS process in six major conceptual steps. This process is followed in this report and should be continued in the updated Guidebook. The six HMCFS process steps are illustrated in Figure 2, and include:
1) Select HMCFS Leadership, Set Objectives, and Define Data Requirements —Identifying the objectives associated with the HMCFS requires a forward look to determine the kinds of data that will be required to make the desired decisions. This corresponds to Section 2.1 (Identify Specific Purpose of Study) from the 1995 Guidance.
2) Collect and Review Baseline Information and Scope HMCFS Project —Reviewing existing baseline information involves assembly of readily available data and making a preliminary determination of the HMCFS data needs (e.g., updates required, gaps in existing data). The extent to which more data are needed to address the desired outcome(s) is determined. This corresponds to information contained in Section 2.2 (Review Baseline Information) from the 1995 Guidance.
3) Collect and Review Existing HMCFS Data —Collecting and evaluating existing data involves searching prior HMCFS documents, government data, and industry data. The extent to which additional HMCFS data are needed is identified. This corresponds to information contained in Section 2.2 (Review Baseline Information) from the 1995 Guidance.

21
4) Collect and Validate New HMCFS Data —Collecting and evaluating new HMCFS data involves gathering data from key informants and observing commodity transport activities along various HazMat routes and route segments. This corresponds to Section 2.3 (Design the Study) and Section 2.4 (Collect Original Data – Field Surveys) from the 1995 Guidance.
5) Analyze and Document HMCFS Data —Analyzing HMCFS data identifies HazMat flows over routes and route segments of concern. Spatial and temporal analysis may be conducted. This corresponds to Section 2.5 (Analyze Results) from the 1995 Guidance.
6) Implement HMCFS Information —Applying HMCFS results involves reviewing results in terms of the goals and objectives they are capable of addressing, and then applying results toward these objectives. This corresponds to Section 2.6 (Apply Results to Purposes) from the 1995 Guidance.
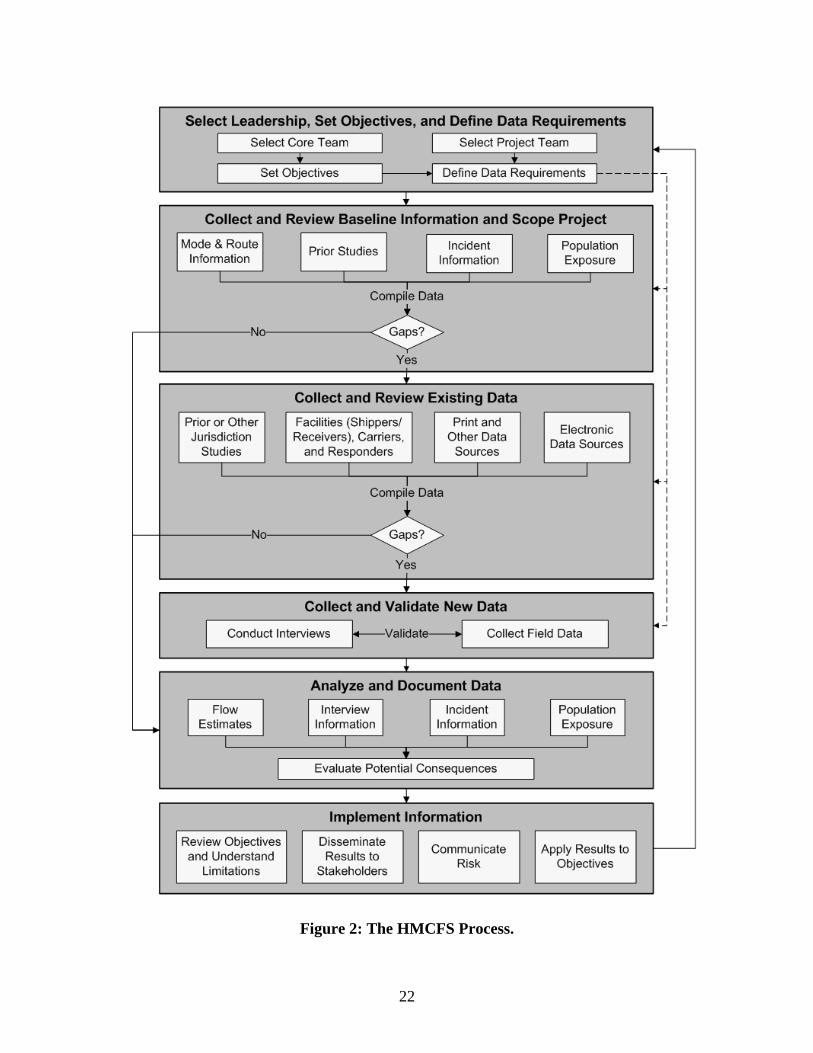
22
Figure 2: The HMCFS Process.
23
1.5.3 Report Structure
This report documents the research conducted for Project HM-01. The survey results are presented in Chapter 2. Chapter 3 provides case study results. Chapter 4 covers HMCFS objectives. Chapter 5 identifies sources of existing data that are used in the HMCFS baseline analysis and existing data collection steps. Chapter 6 identifies potential new data sources including interviews with key informants and field data collection of through vehicle counts, UN/NA placard ID counts, and shipping manifest surveys. Chapter 7 presents options for analysis of existing data, new data, and combinations of existing data and new data. Precision of analyzed data is presented in light of HMCFS objectives. Chapter 8 discusses implementation of HMCFS project results. Chapter 9 identifies 11 promising practices that can be used by LEPCs and other local entities to enhance the conduct of an HMCFS. Chapter 10 presents general recommendations for an updated HMCFS Guidebook for use by LEPCs and other local entities.
24
CHAPTER 2: STATE OF HAZMAT CFS PRACTICES: SURVEY The first step toward updating the 1995 Guidance for Conducting Hazardous Materials
Flow Surveys was obtaining information about current LEPC practices for conducting HMCFS. The research team developed a survey to elicit feedback from LEPCs about conduct of, barriers to, and incentives for an HMCFS. This included on-site visits to and discussion with LEPCs, development of a draft survey instrument, identification of population and survey sample, pre-testing of draft survey instrument, implementation of survey instrument, collection of survey responses, and analysis of survey responses.
2.1 SURVEY TOPICS
Appendix C includes a copy of the survey instrument. The survey was administered via the Internet using a platform provided by Qualtrics, Inc. Survey question topic areas included:
For all LEPCs: • LEPC understanding about HMCFS, • HMCFS activity, • LEPC activity and membership, • LEPC communication practices, • LEPC administration, • Barriers and incentives for conducting an HMCFS, and • LEPC descriptive information.
For only those LEPCs that have conducted an HMCFS:
• HMCFS specifics for placard/truck counts and shipping manifests, • Data access and quality issues affecting conduct their HMCFS, • Resources and support for conducting an HMCFS, • Data analysis, and • Data implementation, outcomes, and tech transfer.
To avoid unnecessary response burden and increase response rate, the survey was
designed so that respondents would view only those questions applicable to their LEPC. This minimized response times and focused on data most likely to be of highest value. Figure 3 shows an outline of the survey flow process.
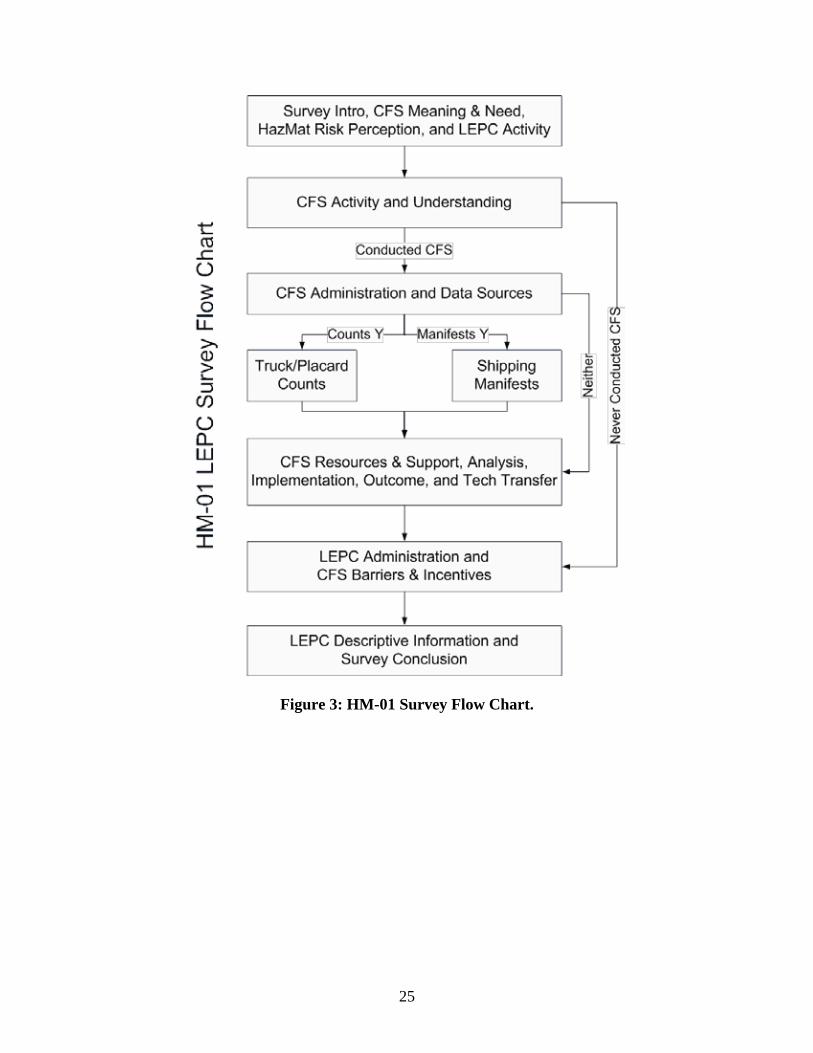
25
Figure 3: HM-01 Survey Flow Chart.
26
2.2 SURVEY SAMPLE
Email addresses were collected in April and May 2008 from U.S. EPA’s listing of LEPC contacts, SERC websites, and contacts with individual SERCs. Email addresses were compared and compiled to identify duplicate, incorrect, or incomplete email addresses. In total, the request for participation was sent by the project team to valid email addresses for 1,856 LEPCs and TERCs in 36 continental U.S. states for which LEPC email contacts were mostly or totally complete. These states include: Alabama, Arkansas, Arizona, California, Delaware, Florida, Georgia, Iowa, Idaho, Indiana, Kansas, Louisiana, Maryland, Maine, Minnesota, Missouri, Montana, North Carolina, North Dakota, Nebraska, New Mexico, Nevada, New York, Ohio, Oklahoma, Oregon, Pennsylvania, South Carolina, South Dakota, Texas, Utah, Virginia, Washington, Wisconsin, West Virginia, and Wyoming.
Requests for LEPC participation in the survey were sent three times, on May 30, June 9, and July 29, 2008. The survey was closed on August 14, 2009. Four hundred and ninety-five surveys were received from LEPCs in these states.
For LEPCs in the remaining 12 continental U.S. states with no or limited LEPC email contact information, a request for participation with a link to the survey was forwarded to corresponding SERCs for distribution in June and July 2008. Telephone contacts to SERCs were attempted to clarify the nature and purpose of the requests. Fifty-one survey responses were received from LEPCs in six of the states, including Colorado, Illinois, Kentucky, Michigan, Rhode Island, and Vermont. There are 484 LEPCs total in these states, but it is not known whether this is the total number of LEPCs that were forwarded the requests for participation from their SERCs.
No survey responses were received from LEPCs in the remaining six states from which requests for participation were forwarded to the SERCs. These states are Connecticut, Massachusetts, Mississippi, Hew Hampshire, New Jersey, and Tennessee. Since these six states failed to generate responses, the nature of the universe of LEPCs therein remains uncertain. These six states notwithstanding, the maximum response rate is 550 valid responses from unique LEPCs divided by 1,856 listed LEPCs plus the 51 response received through distribution by the SERCs, or 550/(1,856+51) = 28.8 percent. The minimum response rate is the same 550 valid responses divided by the same 1,856 listed LEPCs plus 484 LEPCs represented by the responding SERCs, or 550/(1,856+484) = 23.5 percent. Hence the actual survey response rate is between 23.5 and 28.8 percent.
27
2.3 FINDINGS AND APPLICATIONS – SURVEY RESULTS
2.3.1 LEPC Descriptive Characteristics
2.3.1.1 Jurisdiction Population
Five-hundred-and fifty unique LEPC/TERC survey responses were received, of which 430 respondents provided jurisdiction population information. The sample has a median jurisdiction population of 37,000 people, a lower quartile of up to 14,400 people and an upper quartile of 112,000 people or more. Ten percent of the responding LEPCs have a population of 385,000 or more. For this project analysis, the research team categorized LEPCs with populations of less than 25,000 people as “low” population jurisdictions; from 25,000 up to 99,999 people as “medium” population jurisdictions; and 100,000 people or greater as “large” population jurisdictions.
2.3.1.2 HazMat Transport Characteristics
Survey respondents provided information about HazMat transport characteristics of their LEPCs, listed in Table 2 by jurisdiction population. Respondents were able to select all HazMat transport descriptions that apply (responses are not mutually exclusive). The proportion of LEPCs indicating their jurisdiction was a HazMat origin, HazMat destination, or that HazMat was transported within the jurisdiction generally increased as population size category increased. A high percentage of LEPCs indicated HazMat transport through their jurisdictions across population categories.
2.3.1.3 Jurisdiction Business Sectors
Survey respondents also provided information about major business sectors characterizing their communities, listed in Table 3. In general, agriculture as a major business sector decreased as jurisdiction population increased. The percentage of LEPCs with professional/medical services, educational institutions, government agencies, retail trade, banking and insurance, transportation industry or agencies, warehousing and distribution, tourism and hospitality, non-petrochemical manufacturing, and petrochemical industry as major business sectors generally increased as jurisdiction population increased. Forestry and forest products and mining or raw materials as major business sectors were lowest across population groups and did not show general tendency for increasing or decreasing across jurisdiction population groups.
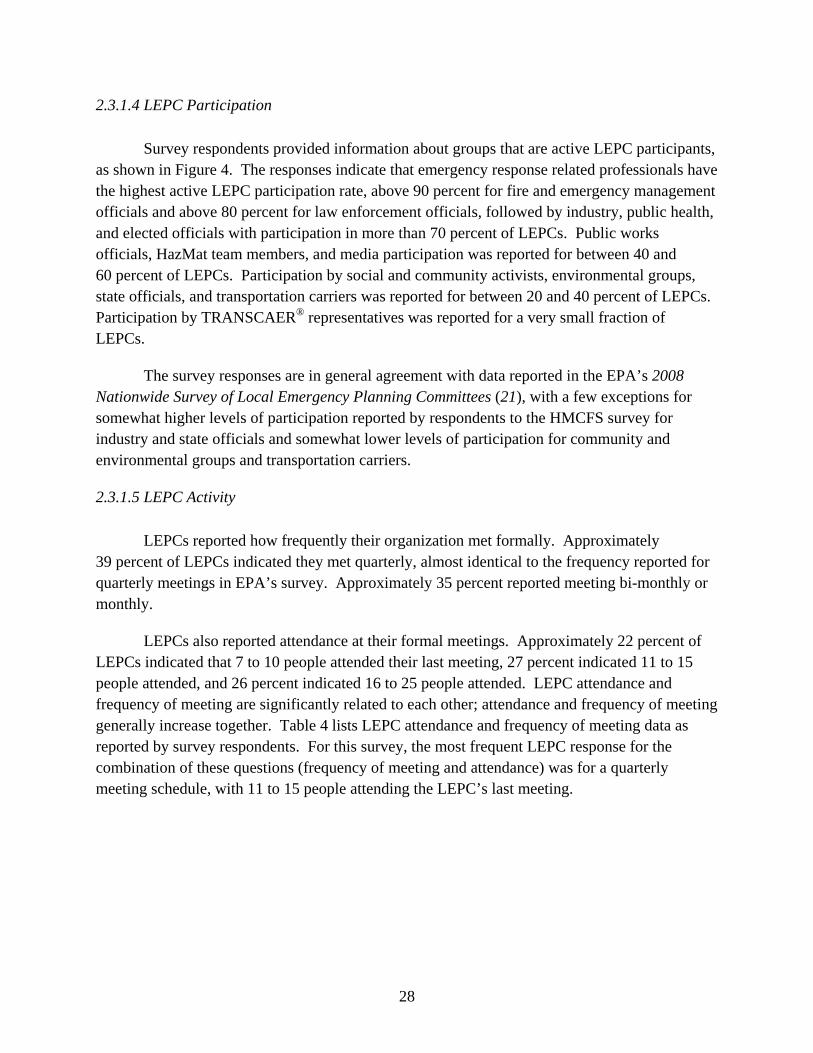
28
2.3.1.4 LEPC Participation
Survey respondents provided information about groups that are active LEPC participants, as shown in Figure 4. The responses indicate that emergency response related professionals have the highest active LEPC participation rate, above 90 percent for fire and emergency management officials and above 80 percent for law enforcement officials, followed by industry, public health, and elected officials with participation in more than 70 percent of LEPCs. Public works officials, HazMat team members, and media participation was reported for between 40 and 60 percent of LEPCs. Participation by social and community activists, environmental groups, state officials, and transportation carriers was reported for between 20 and 40 percent of LEPCs. Participation by TRANSCAER® representatives was reported for a very small fraction of LEPCs.
The survey responses are in general agreement with data reported in the EPA’s 2008 Nationwide Survey of Local Emergency Planning Committees (21), with a few exceptions for somewhat higher levels of participation reported by respondents to the HMCFS survey for industry and state officials and somewhat lower levels of participation for community and environmental groups and transportation carriers.
2.3.1.5 LEPC Activity
LEPCs reported how frequently their organization met formally. Approximately 39 percent of LEPCs indicated they met quarterly, almost identical to the frequency reported for quarterly meetings in EPA’s survey. Approximately 35 percent reported meeting bi-monthly or monthly.
LEPCs also reported attendance at their formal meetings. Approximately 22 percent of LEPCs indicated that 7 to 10 people attended their last meeting, 27 percent indicated 11 to 15 people attended, and 26 percent indicated 16 to 25 people attended. LEPC attendance and frequency of meeting are significantly related to each other; attendance and frequency of meeting generally increase together. Table 4 lists LEPC attendance and frequency of meeting data as reported by survey respondents. For this survey, the most frequent LEPC response for the combination of these questions (frequency of meeting and attendance) was for a quarterly meeting schedule, with 11 to 15 people attending the LEPC’s last meeting.
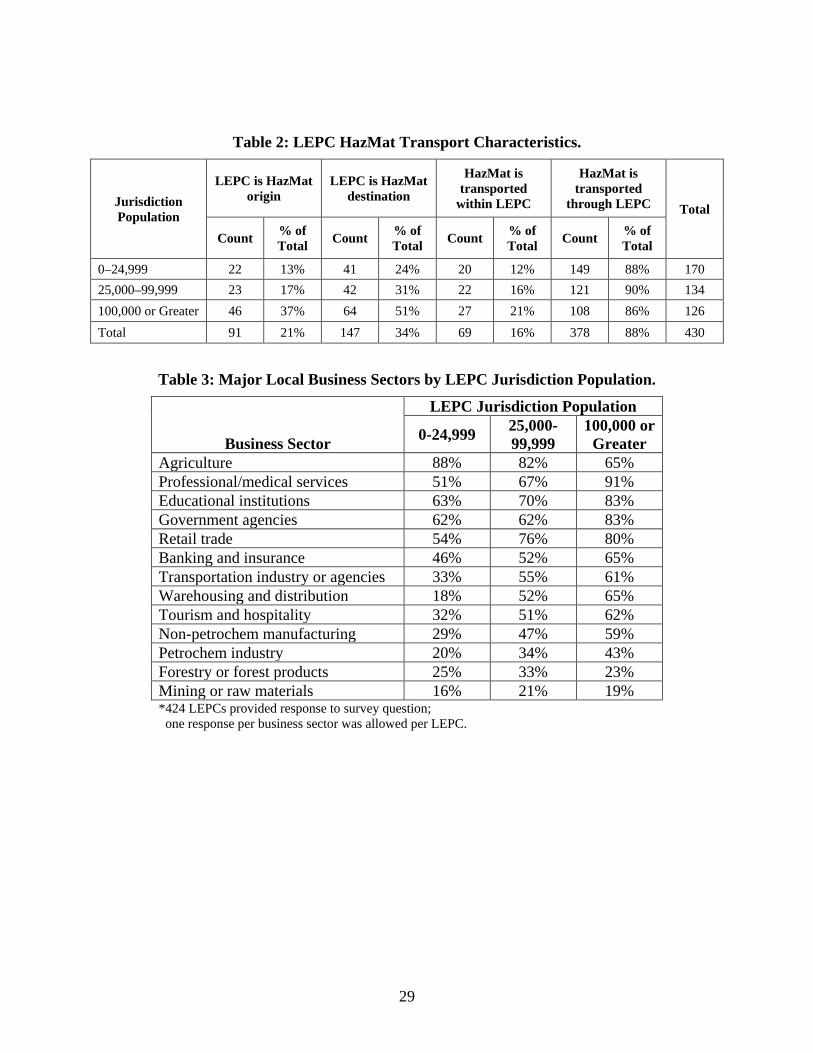
29
Table 2: LEPC HazMat Transport Characteristics.
Jurisdiction Population
LEPC is HazMat origin
LEPC is HazMat destination
HazMat is transported
within LEPC
HazMat is transported
through LEPC Total
Count % of Total Count % of
Total Count % of Total Count % of
Total
0–24,999 22 13% 41 24% 20 12% 149 88% 170 25,000–99,999 23 17% 42 31% 22 16% 121 90% 134 100,000 or Greater 46 37% 64 51% 27 21% 108 86% 126 Total 91 21% 147 34% 69 16% 378 88% 430
Table 3: Major Local Business Sectors by LEPC Jurisdiction Population.
Business Sector
LEPC Jurisdiction Population
0-24,999 25,000-99,999
100,000 or Greater
Agriculture 88% 82% 65% Professional/medical services 51% 67% 91% Educational institutions 63% 70% 83% Government agencies 62% 62% 83% Retail trade 54% 76% 80% Banking and insurance 46% 52% 65% Transportation industry or agencies 33% 55% 61% Warehousing and distribution 18% 52% 65% Tourism and hospitality 32% 51% 62% Non-petrochem manufacturing 29% 47% 59% Petrochem industry 20% 34% 43% Forestry or forest products 25% 33% 23% Mining or raw materials 16% 21% 19% *424 LEPCs provided response to survey question; one response per business sector was allowed per LEPC.
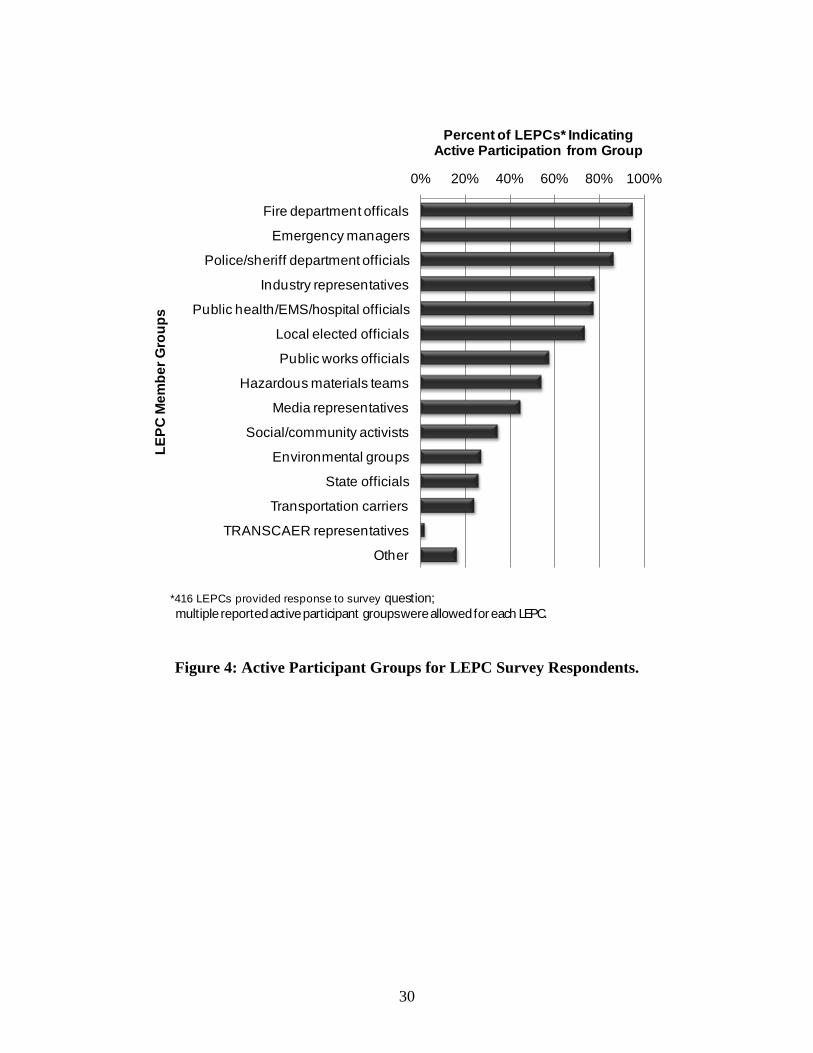
30
0% 20% 40% 60% 80% 100%
Fire department officals
Emergency managers
Police/sheriff department officials
Industry representatives
Public health/EMS/hospital officials
Local elected officials
Public works officials
Hazardous materials teams
Media representatives
Social/community activists
Environmental groups
State officials
Transportation carriers
TRANSCAER representatives
Other
Percent of LEPCs* Indicating Active Participation from Group
LEPC
Mem
ber G
roup
s
*416 LEPCs provided response to survey question; multiple reported active participant groups were allowed for each LEPC.
Figure 4: Active Participant Groups for LEPC Survey Respondents.
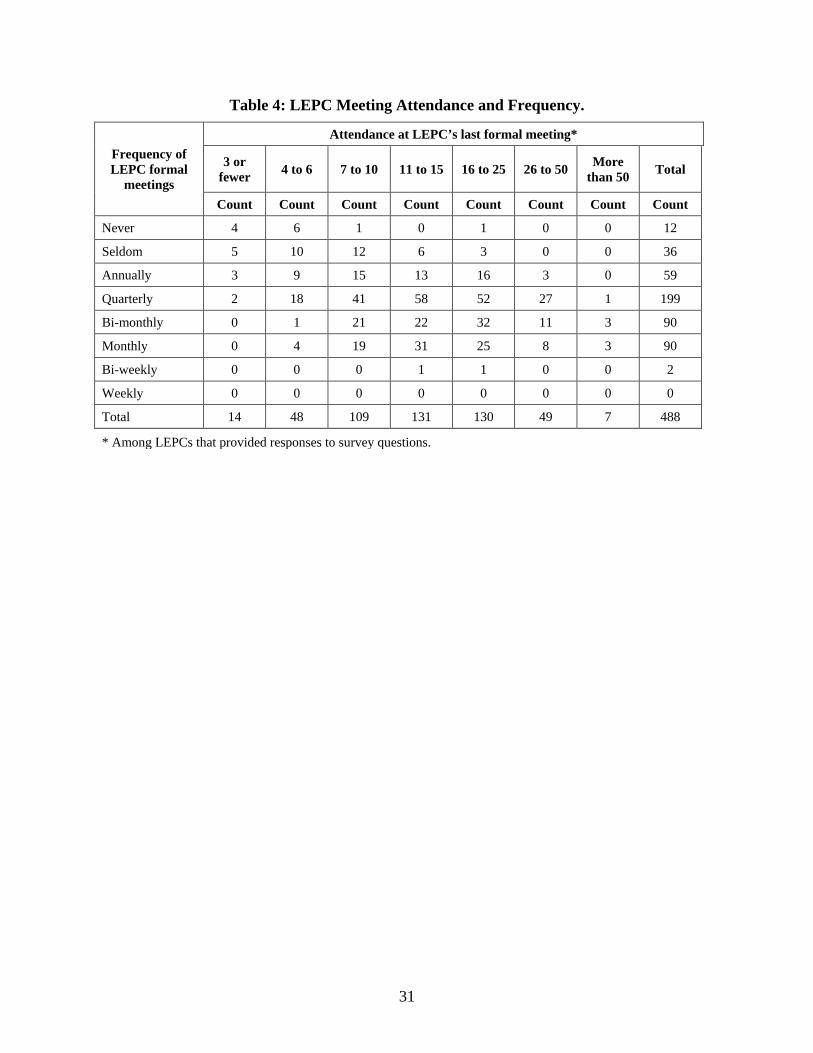
31
Table 4: LEPC Meeting Attendance and Frequency.
Frequency of LEPC formal
meetings
Attendance at LEPC’s last formal meeting*
3 or fewer 4 to 6 7 to 10 11 to 15 16 to 25 26 to 50 More
than 50 Total
Count Count Count Count Count Count Count Count
Never 4 6 1 0 1 0 0 12
Seldom 5 10 12 6 3 0 0 36
Annually 3 9 15 13 16 3 0 59
Quarterly 2 18 41 58 52 27 1 199
Bi-monthly 0 1 21 22 32 11 3 90
Monthly 0 4 19 31 25 8 3 90
Bi-weekly 0 0 0 1 1 0 0 2
Weekly 0 0 0 0 0 0 0 0
Total 14 48 109 131 130 49 7 488
* Among LEPCs that provided responses to survey questions.
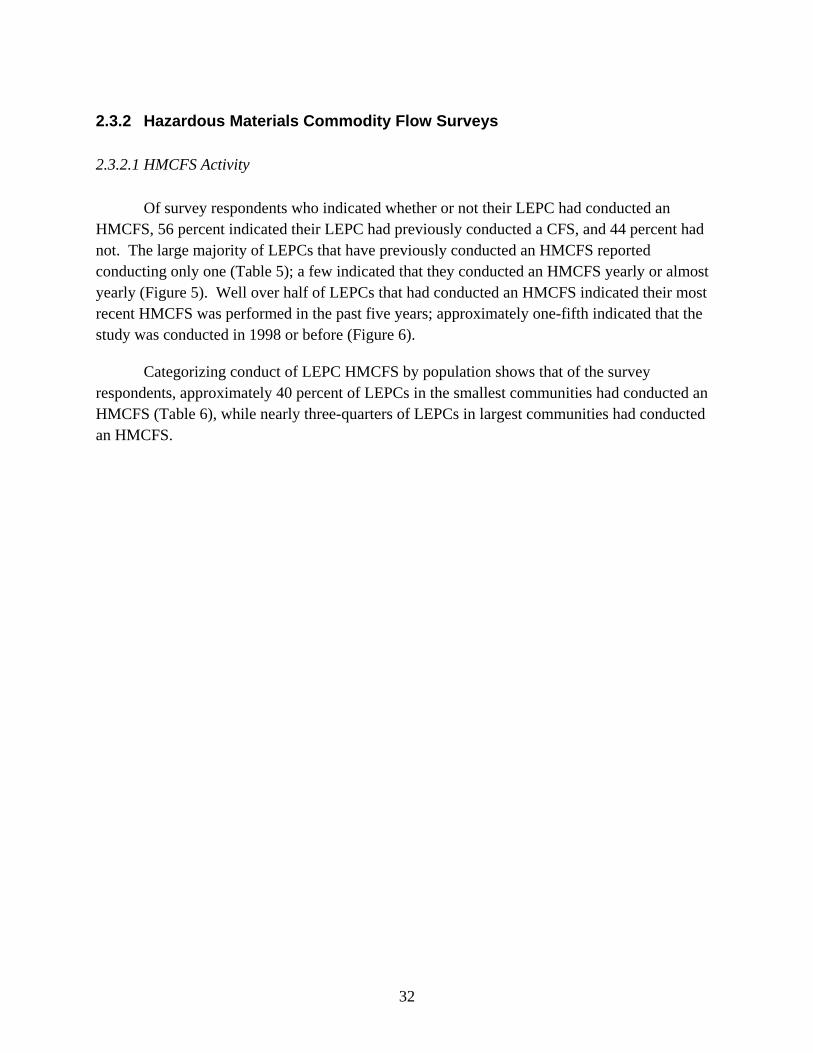
32
2.3.2 Hazardous Materials Commodity Flow Surveys
2.3.2.1 HMCFS Activity
Of survey respondents who indicated whether or not their LEPC had conducted an HMCFS, 56 percent indicated their LEPC had previously conducted a CFS, and 44 percent had not. The large majority of LEPCs that have previously conducted an HMCFS reported conducting only one (Table 5); a few indicated that they conducted an HMCFS yearly or almost yearly (Figure 5). Well over half of LEPCs that had conducted an HMCFS indicated their most recent HMCFS was performed in the past five years; approximately one-fifth indicated that the study was conducted in 1998 or before (Figure 6).
Categorizing conduct of LEPC HMCFS by population shows that of the survey respondents, approximately 40 percent of LEPCs in the smallest communities had conducted an HMCFS (Table 6), while nearly three-quarters of LEPCs in largest communities had conducted an HMCFS.
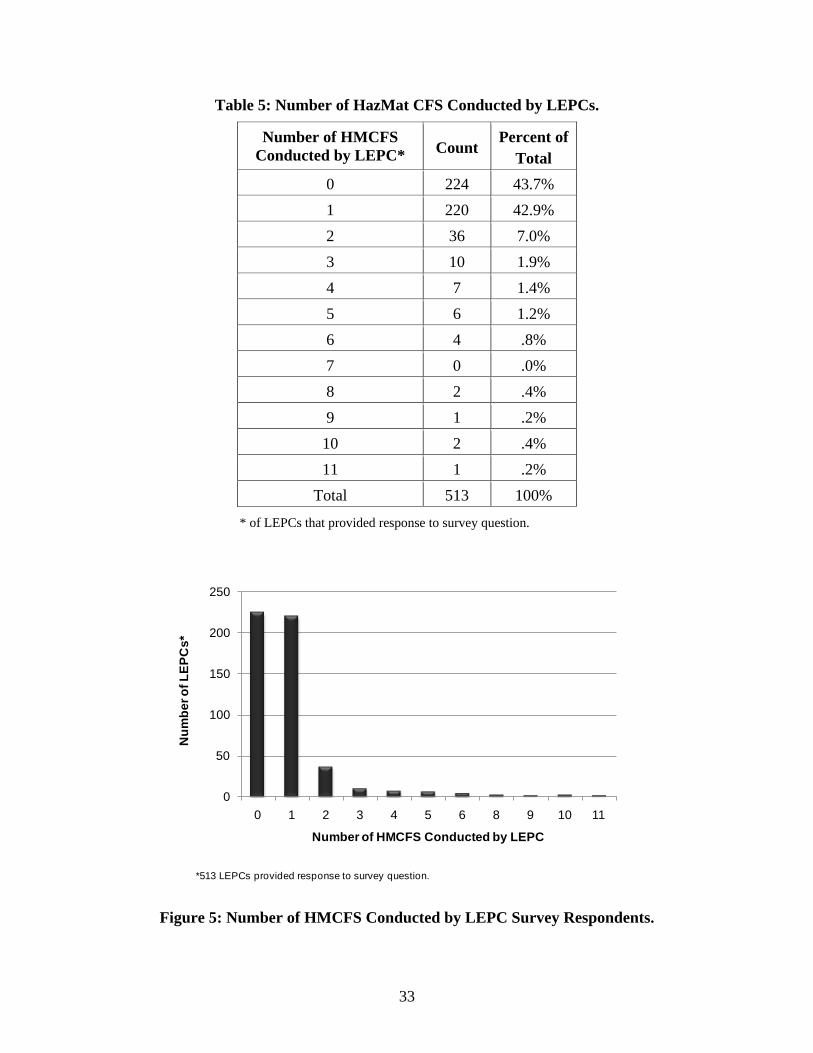
33
Table 5: Number of HazMat CFS Conducted by LEPCs.
Number of HMCFS Conducted by LEPC* Count
Percent of Total
0 224 43.7% 1 220 42.9% 2 36 7.0% 3 10 1.9% 4 7 1.4% 5 6 1.2% 6 4 .8% 7 0 .0% 8 2 .4% 9 1 .2% 10 2 .4% 11 1 .2%
Total 513 100%
* of LEPCs that provided response to survey question.
0
50
100
150
200
250
0 1 2 3 4 5 6 8 9 10 11
Num
ber o
f LEP
Cs*
Number of HMCFS Conducted by LEPC
*513 LEPCs provided response to survey question.
Figure 5: Number of HMCFS Conducted by LEPC Survey Respondents.
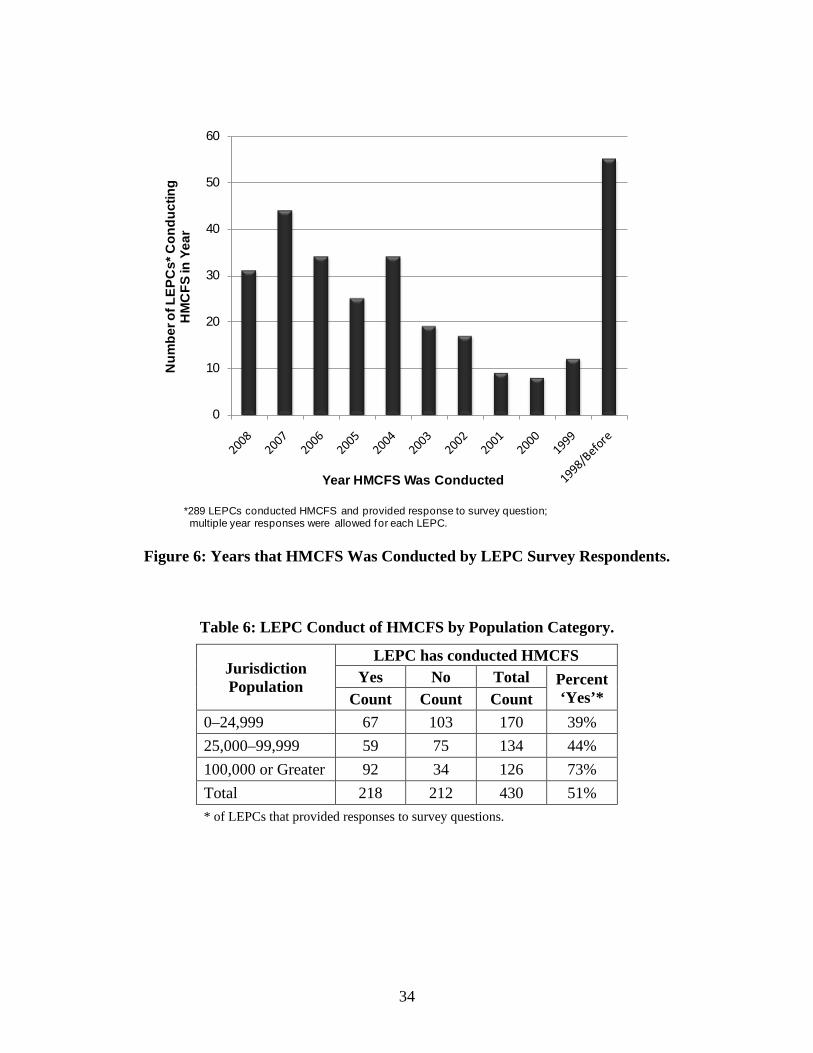
34
0
10
20
30
40
50
60
Num
ber o
f LEP
Cs*
Con
duct
ing
HM
CFS
in Y
ear
Year HMCFS Was Conducted
*289 LEPCs conducted HMCFS and provided response to survey question;multiple year responses were allowed for each LEPC.
Figure 6: Years that HMCFS Was Conducted by LEPC Survey Respondents.
Table 6: LEPC Conduct of HMCFS by Population Category.
Jurisdiction Population
LEPC has conducted HMCFS Yes No Total Percent
‘Yes’* Count Count Count 0–24,999 67 103 170 39% 25,000–99,999 59 75 134 44% 100,000 or Greater 92 34 126 73% Total 218 212 430 51% * of LEPCs that provided responses to survey questions.
35
2.3.2.2 HazMat Transport Risk Perception
Survey respondents provided information about perceived HazMat transport risks for their jurisdictions for the four surface transport modes, on a scale of 0 to 10 (0 being no risk, 10 being extreme risk). In general, perceived risk increases as jurisdiction population increases and is greatest for road transport and rail transport, while it is lowest on average for waterway transport. Table 7 lists mean perceived risk level for HazMat transport by jurisdiction population. Conducting an HMCFS does not appear to affect perceived level of risk due to HazMat transport in an LEPC’s jurisdiction.
Getting a handle or idea about HazMat commodity flows and availability of funds were the two most frequently indicated reasons that LEPCs conducted their most recent HMCFS. Responses for this question listed in Figure 7 include both standard selections provided in the survey instrument as well as self-reported written text provided by individual respondents that were then categorized by the project team.
2.3.2.3 CFS Understanding
LEPCs that have not previously conducted an HMCFS reported a significantly lower level of understanding of the CFS process (Table 8). LEPCs that had not conducted an HMCFS average 2.9 on a scale of 0 (no understanding of process) to 10 (complete detailed understanding of process), while LEPCs that have previously conducted an HMCFS indicate a higher level of understanding of the CFS process, averaging 5.7 on the same scale (Figure 8).
2.3.2.4 CFS Participants
Over half of the LEPC respondents that have conducted an HMCFS indicated that LEPC members participated in conducting their most recent HMCFS (Figure 9). The next tier of HMCFS participants is county employees, volunteers, and the HazMat response team.
2.3.2.5 CFS Guidance
Over half of the LEPC respondents that have conducted an HMCFS indicated using some form of U.S. DOT guidance for their most recent study, including the both HMEP Program and the U.S. DOT Guidance. Contractor knowledge and LEPC knowledge were also used by around a quarter of respondents, each; one-fifth of respondents used other HMCFS (their own or another jurisdiction’s) as examples (Figure 10).
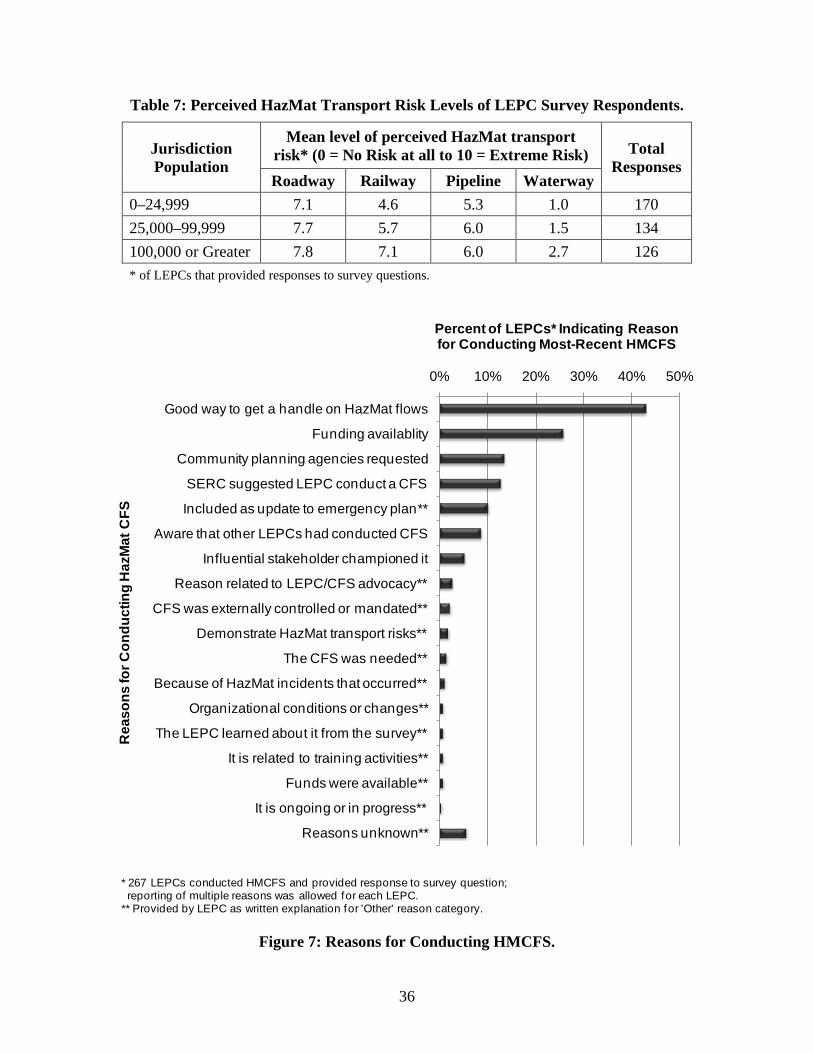
36
Table 7: Perceived HazMat Transport Risk Levels of LEPC Survey Respondents.
Jurisdiction Population
Mean level of perceived HazMat transport risk* (0 = No Risk at all to 10 = Extreme Risk) Total
Responses Roadway Railway Pipeline Waterway
0–24,999 7.1 4.6 5.3 1.0 170 25,000–99,999 7.7 5.7 6.0 1.5 134 100,000 or Greater 7.8 7.1 6.0 2.7 126 * of LEPCs that provided responses to survey questions.
0% 10% 20% 30% 40% 50%
Good way to get a handle on HazMat flows
Funding availablity
Community planning agencies requested
SERC suggested LEPC conduct a CFS
Included as update to emergency plan**
Aware that other LEPCs had conducted CFS
Influential stakeholder championed it
Reason related to LEPC/CFS advocacy**
CFS was externally controlled or mandated**
Demonstrate HazMat transport risks**
The CFS was needed**
Because of HazMat incidents that occurred**
Organizational conditions or changes**
The LEPC learned about it from the survey**
It is related to training activities**
Funds were available**
It is ongoing or in progress**
Reasons unknown**
Percent of LEPCs* Indicating Reasonfor Conducting Most-Recent HMCFS
Rea
sons
for C
ondu
ctin
g H
azM
at C
FS
* 267 LEPCs conducted HMCFS and provided response to survey question; reporting of multiple reasons was allowed for each LEPC.
** Provided by LEPC as written explanation for 'Other' reason category.
Figure 7: Reasons for Conducting HMCFS.
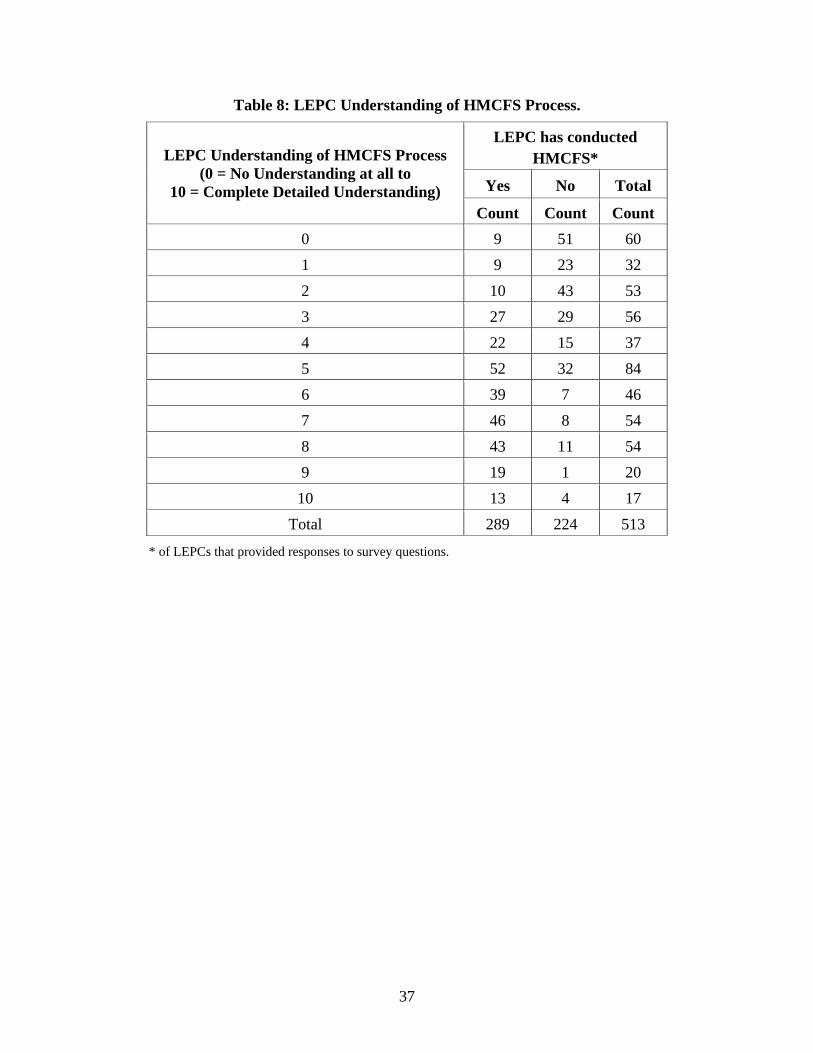
37
Table 8: LEPC Understanding of HMCFS Process.
LEPC Understanding of HMCFS Process (0 = No Understanding at all to
10 = Complete Detailed Understanding)
LEPC has conducted HMCFS*
Yes No Total
Count Count Count 0 9 51 60 1 9 23 32 2 10 43 53 3 27 29 56 4 22 15 37 5 52 32 84 6 39 7 46 7 46 8 54 8 43 11 54 9 19 1 20 10 13 4 17
Total 289 224 513
* of LEPCs that provided responses to survey questions.
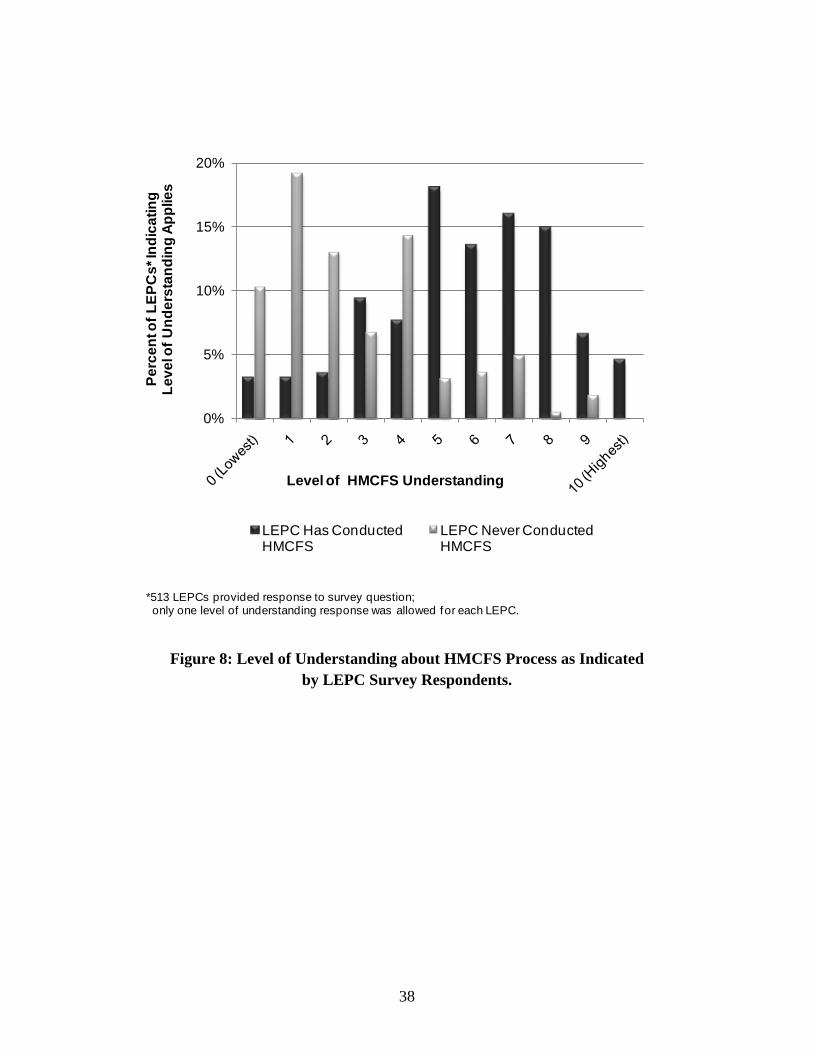
38
0%
5%
10%
15%
20%Pe
rcen
t of L
EPC
s* In
dica
ting
Leve
l of U
nder
stan
ding
App
lies
Level of HMCFS Understanding
LEPC Has ConductedHMCFS
LEPC Never ConductedHMCFS
*513 LEPCs provided response to survey question;only one level of understanding response was allowed for each LEPC.
Figure 8: Level of Understanding about HMCFS Process as Indicated
by LEPC Survey Respondents.
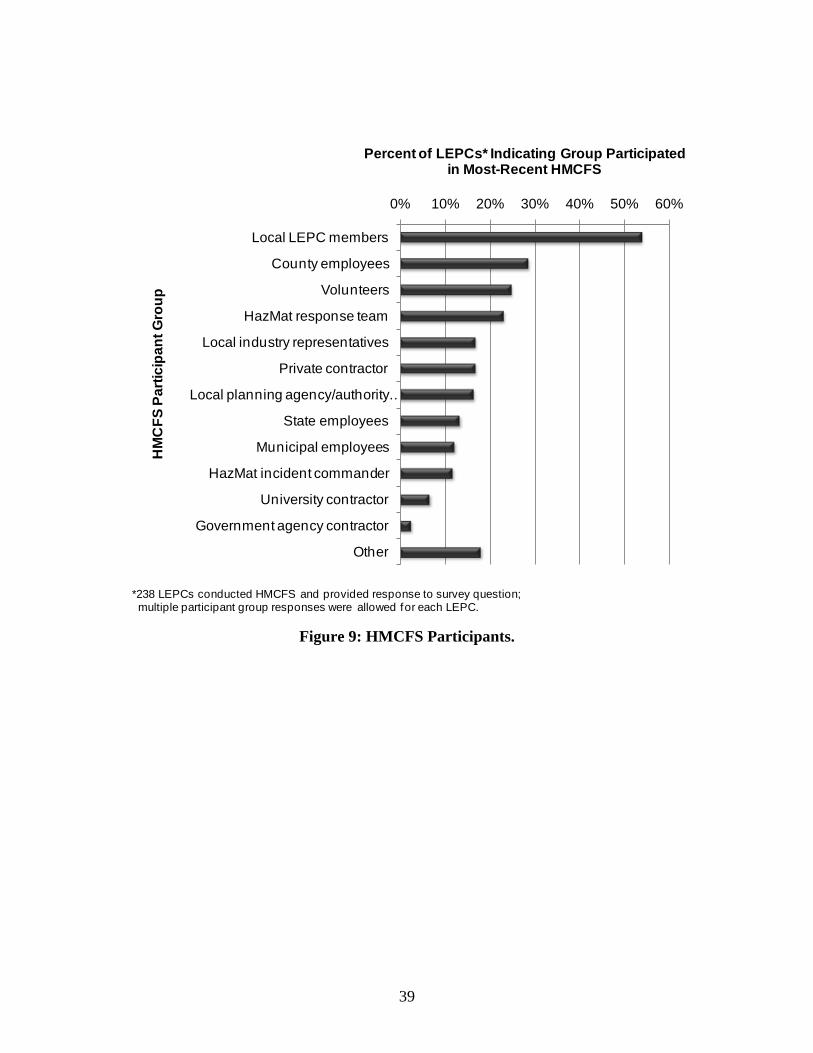
39
0% 10% 20% 30% 40% 50% 60%
Local LEPC members
County employees
Volunteers
HazMat response team
Local industry representatives
Private contractor
Local planning agency/authority …
State employees
Municipal employees
HazMat incident commander
University contractor
Government agency contractor
Other
Percent of LEPCs* Indicating Group Participated in Most-Recent HMCFS
HM
CFS
Par
ticip
ant G
roup
*238 LEPCs conducted HMCFS and provided response to survey question;multiple participant group responses were allowed for each LEPC.
Figure 9: HMCFS Participants.
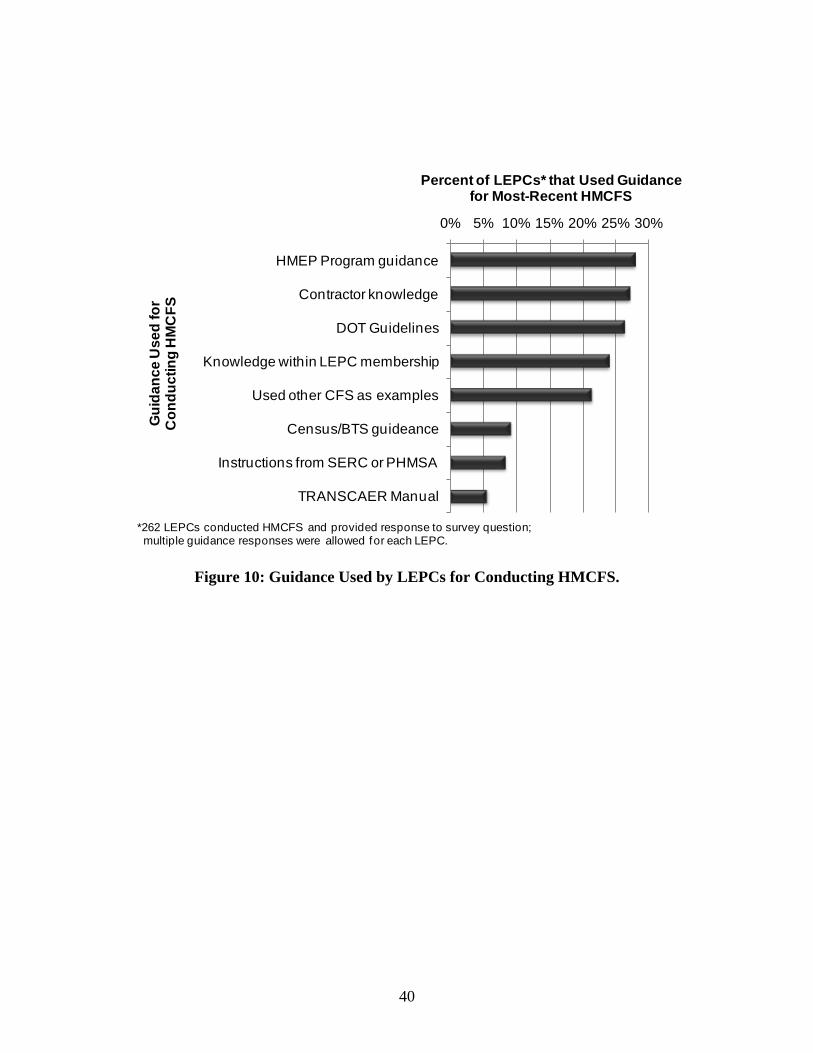
40
0% 5% 10% 15% 20% 25% 30%
HMEP Program guidance
Contractor knowledge
DOT Guidelines
Knowledge within LEPC membership
Used other CFS as examples
Census/BTS guideance
Instructions from SERC or PHMSA
TRANSCAER Manual
Percent of LEPCs* that Used Guidancefor Most-Recent HMCFS
Gui
danc
e U
sed
for
Con
duct
ing
HM
CFS
*262 LEPCs conducted HMCFS and provided response to survey question; multiple guidance responses were allowed for each LEPC.
Figure 10: Guidance Used by LEPCs for Conducting HMCFS.
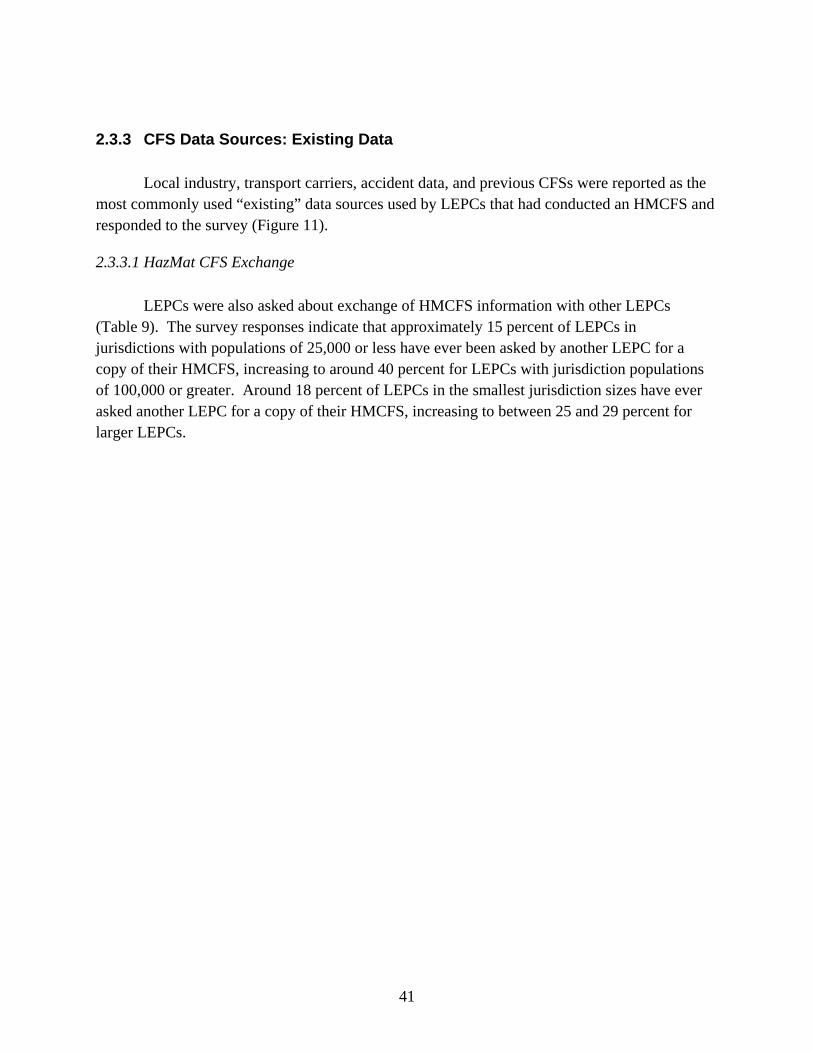
41
2.3.3 CFS Data Sources: Existing Data
Local industry, transport carriers, accident data, and previous CFSs were reported as the most commonly used “existing” data sources used by LEPCs that had conducted an HMCFS and responded to the survey (Figure 11).
2.3.3.1 HazMat CFS Exchange
LEPCs were also asked about exchange of HMCFS information with other LEPCs (Table 9). The survey responses indicate that approximately 15 percent of LEPCs in jurisdictions with populations of 25,000 or less have ever been asked by another LEPC for a copy of their HMCFS, increasing to around 40 percent for LEPCs with jurisdiction populations of 100,000 or greater. Around 18 percent of LEPCs in the smallest jurisdiction sizes have ever asked another LEPC for a copy of their HMCFS, increasing to between 25 and 29 percent for larger LEPCs.
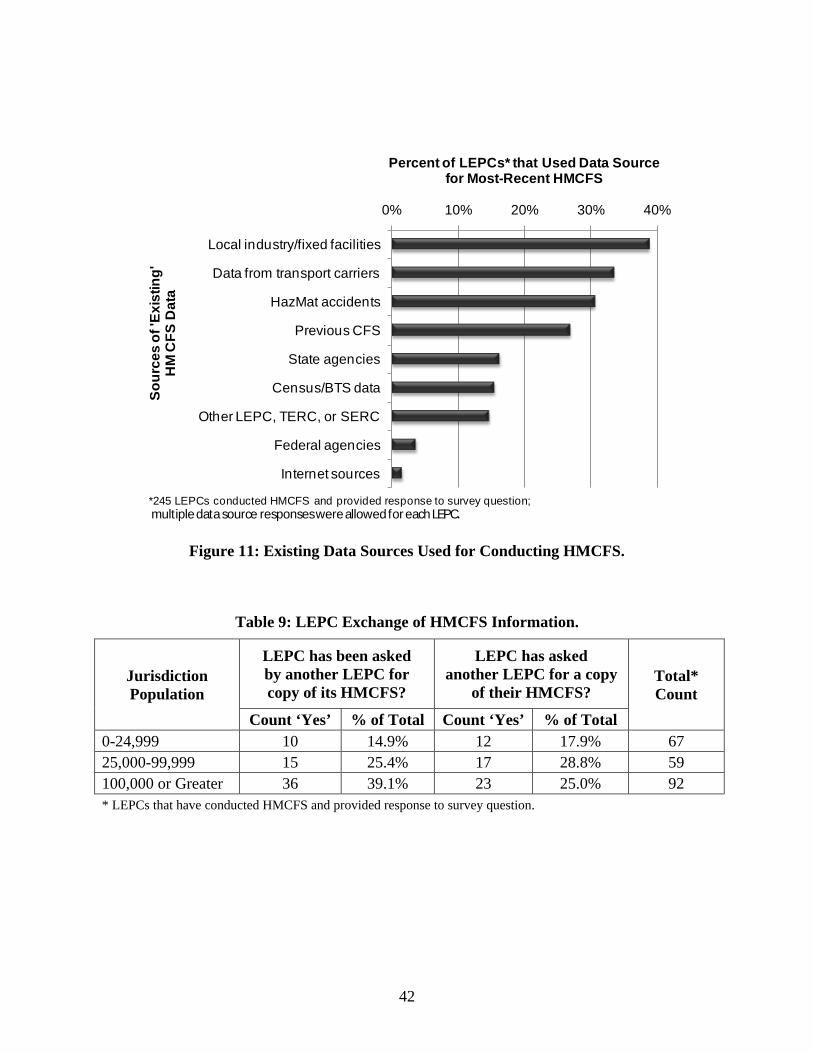
42
0% 10% 20% 30% 40%
Local industry/fixed facilities
Data from transport carriers
HazMat accidents
Previous CFS
State agencies
Census/BTS data
Other LEPC, TERC, or SERC
Federal agencies
Internet sources
Percent of LEPCs* that Used Data Sourcefor Most-Recent HMCFS
Sour
ces
of 'E
xist
ing'
H
M C
FS D
ata
*245 LEPCs conducted HMCFS and provided response to survey question; multiple data source responses were allowed for each LEPC.
Figure 11: Existing Data Sources Used for Conducting HMCFS.
Table 9: LEPC Exchange of HMCFS Information.
Jurisdiction Population
LEPC has been asked by another LEPC for copy of its HMCFS?
LEPC has asked another LEPC for a copy
of their HMCFS? Total* Count
Count ‘Yes’ % of Total Count ‘Yes’ % of Total 0-24,999 10 14.9% 12 17.9% 67 25,000-99,999 15 25.4% 17 28.8% 59 100,000 or Greater 36 39.1% 23 25.0% 92 * LEPCs that have conducted HMCFS and provided response to survey question.
43
2.3.4 CFS Data Sources: New Data
Placard counts and vehicle counts were the most commonly used “new” data sources. Around one-fifth of respondent LEPCs reported interviewing local responders, industry, and carriers for new HMCFS data, and only one-eighth used shipping manifest data (Figure 12).
2.3.4.1 Vehicle/Placard Counts
Survey respondents provided information about the reasons vehicle and placard count locations were selected, as listed in Table 10. Around 80 percent of respondents indicated that high traffic corridors were the reason for selecting these locations. The next two most-frequently mentioned reasons were because of anticipated high traffic volumes and ease of data collection for participants/industry/carriers.
Survey respondents provided information about the most important factors guiding the selection of vehicle and placard count locations, as shown in Figure 13. More than half of respondents indicated that convenience was the most important factor guiding the selection of count locations. The next two most frequently mentioned factors were specialized local knowledge and logistical issues.
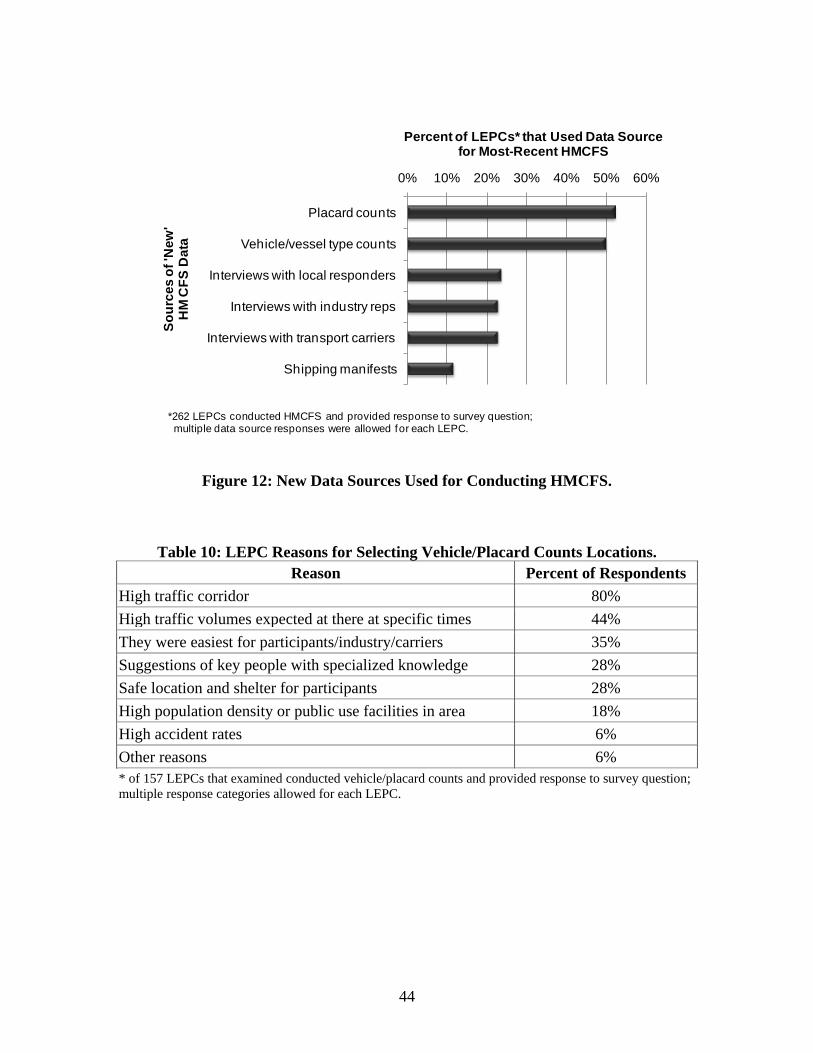
44
0% 10% 20% 30% 40% 50% 60%
Placard counts
Vehicle/vessel type counts
Interviews with local responders
Interviews with industry reps
Interviews with transport carriers
Shipping manifests
Percent of LEPCs* that Used Data Sourcefor Most-Recent HMCFS
Sour
ces
of 'N
ew'
HM
CFS
Dat
a
*262 LEPCs conducted HMCFS and provided response to survey question; multiple data source responses were allowed for each LEPC.
Figure 12: New Data Sources Used for Conducting HMCFS.
Table 10: LEPC Reasons for Selecting Vehicle/Placard Counts Locations. Reason Percent of Respondents
High traffic corridor 80% High traffic volumes expected at there at specific times 44% They were easiest for participants/industry/carriers 35% Suggestions of key people with specialized knowledge 28% Safe location and shelter for participants 28% High population density or public use facilities in area 18% High accident rates 6% Other reasons 6% * of 157 LEPCs that examined conducted vehicle/placard counts and provided response to survey question; multiple response categories allowed for each LEPC.
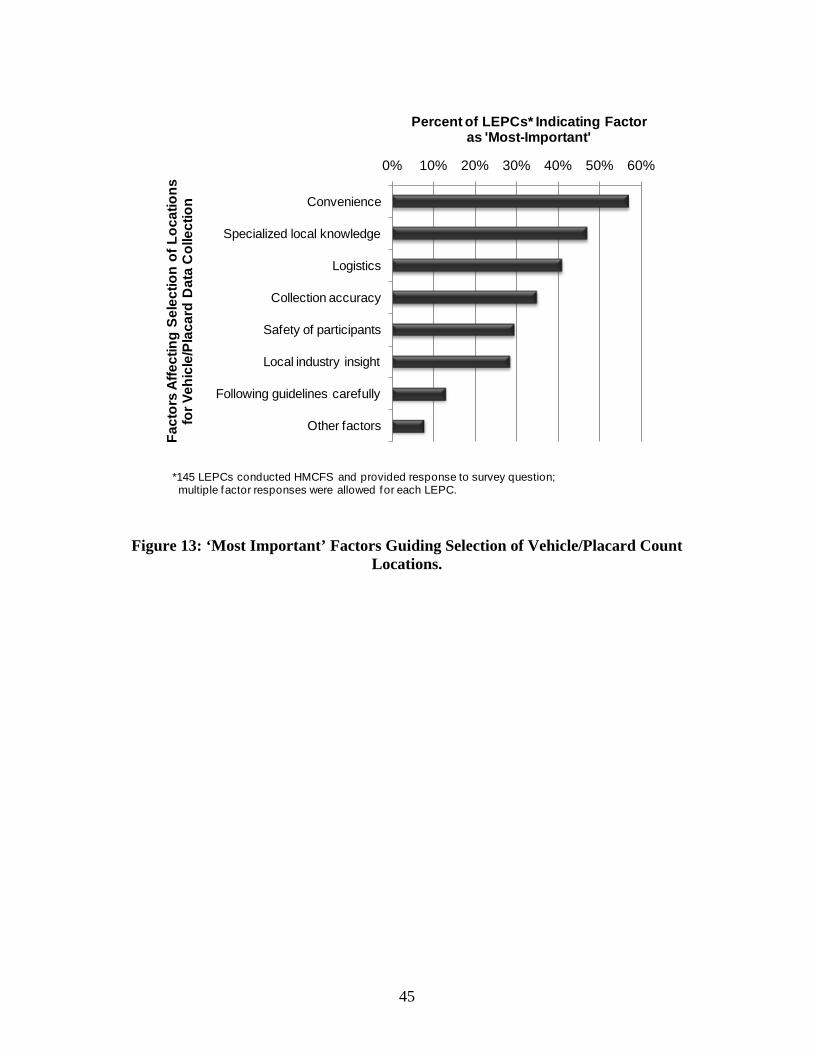
45
0% 10% 20% 30% 40% 50% 60%
Convenience
Specialized local knowledge
Logistics
Collection accuracy
Safety of participants
Local industry insight
Following guidelines carefully
Other factors
Percent of LEPCs* Indicating Factoras 'Most-Important'
Fact
ors
Affe
ctin
g Se
lect
ion
of L
ocat
ions
fo
r Veh
icle
/Pla
card
Dat
a C
olle
ctio
n
*145 LEPCs conducted HMCFS and provided response to survey question; multiple factor responses were allowed for each LEPC.
Figure 13: ‘Most Important’ Factors Guiding Selection of Vehicle/Placard Count Locations.
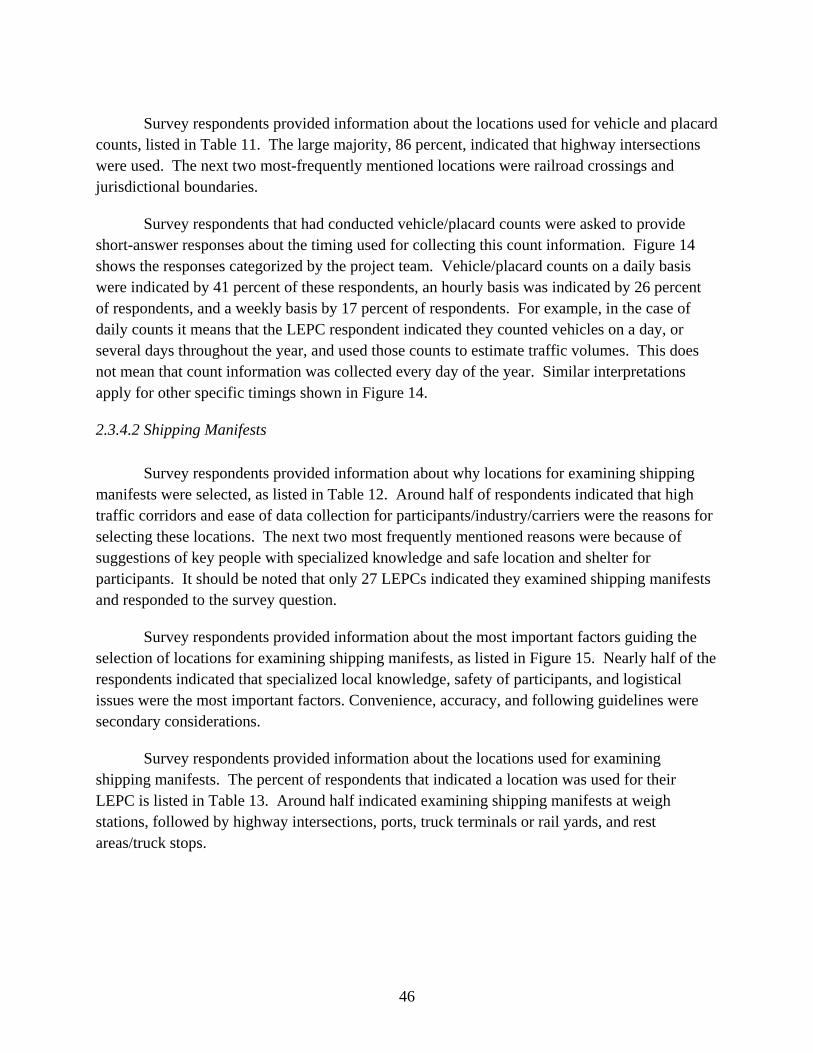
46
Survey respondents provided information about the locations used for vehicle and placard
counts, listed in Table 11. The large majority, 86 percent, indicated that highway intersections were used. The next two most-frequently mentioned locations were railroad crossings and jurisdictional boundaries.
Survey respondents that had conducted vehicle/placard counts were asked to provide short-answer responses about the timing used for collecting this count information. Figure 14 shows the responses categorized by the project team. Vehicle/placard counts on a daily basis were indicated by 41 percent of these respondents, an hourly basis was indicated by 26 percent of respondents, and a weekly basis by 17 percent of respondents. For example, in the case of daily counts it means that the LEPC respondent indicated they counted vehicles on a day, or several days throughout the year, and used those counts to estimate traffic volumes. This does not mean that count information was collected every day of the year. Similar interpretations apply for other specific timings shown in Figure 14.
2.3.4.2 Shipping Manifests
Survey respondents provided information about why locations for examining shipping manifests were selected, as listed in Table 12. Around half of respondents indicated that high traffic corridors and ease of data collection for participants/industry/carriers were the reasons for selecting these locations. The next two most frequently mentioned reasons were because of suggestions of key people with specialized knowledge and safe location and shelter for participants. It should be noted that only 27 LEPCs indicated they examined shipping manifests and responded to the survey question.
Survey respondents provided information about the most important factors guiding the selection of locations for examining shipping manifests, as listed in Figure 15. Nearly half of the respondents indicated that specialized local knowledge, safety of participants, and logistical issues were the most important factors. Convenience, accuracy, and following guidelines were secondary considerations.
Survey respondents provided information about the locations used for examining shipping manifests. The percent of respondents that indicated a location was used for their LEPC is listed in Table 13. Around half indicated examining shipping manifests at weigh stations, followed by highway intersections, ports, truck terminals or rail yards, and rest areas/truck stops.
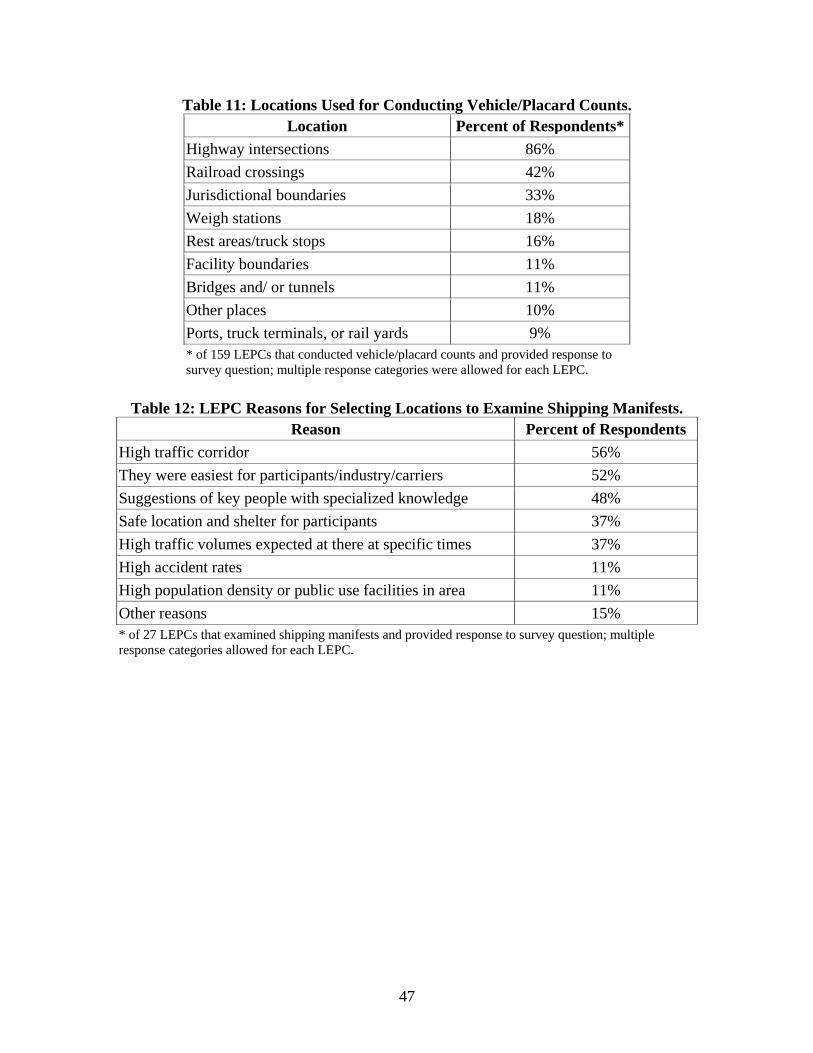
47
Table 11: Locations Used for Conducting Vehicle/Placard Counts. Location Percent of Respondents*
Highway intersections 86% Railroad crossings 42% Jurisdictional boundaries 33% Weigh stations 18% Rest areas/truck stops 16% Facility boundaries 11% Bridges and/ or tunnels 11% Other places 10% Ports, truck terminals, or rail yards 9% * of 159 LEPCs that conducted vehicle/placard counts and provided response to survey question; multiple response categories were allowed for each LEPC.
Table 12: LEPC Reasons for Selecting Locations to Examine Shipping Manifests.
Reason Percent of Respondents High traffic corridor 56% They were easiest for participants/industry/carriers 52% Suggestions of key people with specialized knowledge 48% Safe location and shelter for participants 37% High traffic volumes expected at there at specific times 37% High accident rates 11% High population density or public use facilities in area 11% Other reasons 15% * of 27 LEPCs that examined shipping manifests and provided response to survey question; multiple response categories allowed for each LEPC.
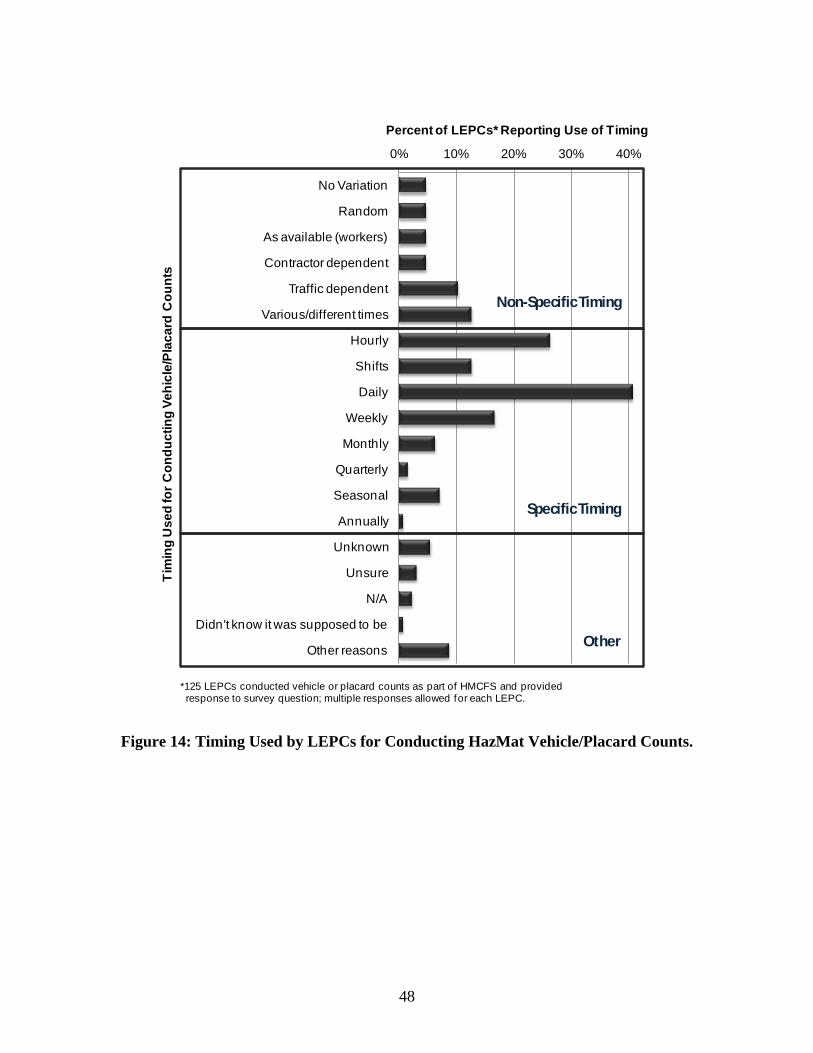
48
0% 10% 20% 30% 40%
No Variation
Random
As available (workers)
Contractor dependent
Traffic dependent
Various/different times
Hourly
Shifts
Daily
Weekly
Monthly
Quarterly
Seasonal
Annually
Unknown
Unsure
N/A
Didn't know it was supposed to be
Other reasons
Percent of LEPCs* Reporting Use of Timing
Tim
ing
Use
d fo
r Con
duct
ing
Vehi
cle/
Plac
ard
Cou
nts
Non-Specific Timing
Specific Timing
Other
*125 LEPCs conducted vehicle or placard counts as part of HMCFS and provided response to survey question; multiple responses allowed for each LEPC.
Figure 14: Timing Used by LEPCs for Conducting HazMat Vehicle/Placard Counts.
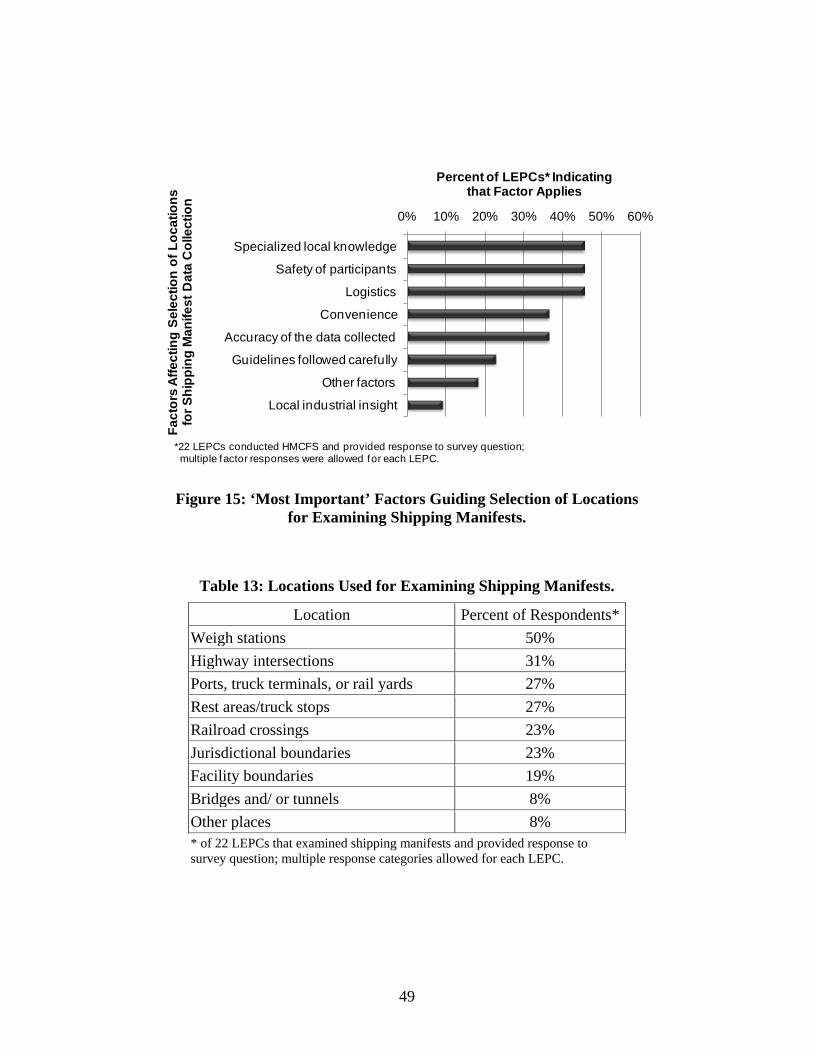
49
0% 10% 20% 30% 40% 50% 60%
Specialized local knowledge
Safety of participants
Logistics
Convenience
Accuracy of the data collected
Guidelines followed carefully
Other factors
Local industrial insight
Percent of LEPCs* Indicating that Factor Applies
Fact
ors
Affe
ctin
g Se
lect
ion
of L
ocat
ions
fo
r Shi
ppin
g M
anife
st D
ata
Col
lect
ion
*22 LEPCs conducted HMCFS and provided response to survey question; multiple factor responses were allowed for each LEPC.
Figure 15: ‘Most Important’ Factors Guiding Selection of Locations
for Examining Shipping Manifests.
Table 13: Locations Used for Examining Shipping Manifests.
Location Percent of Respondents* Weigh stations 50% Highway intersections 31% Ports, truck terminals, or rail yards 27% Rest areas/truck stops 27% Railroad crossings 23% Jurisdictional boundaries 23% Facility boundaries 19% Bridges and/ or tunnels 8% Other places 8% * of 22 LEPCs that examined shipping manifests and provided response to survey question; multiple response categories allowed for each LEPC.
50
2.3.5 HazMat CFS Data Characteristics
2.3.5.1 HazMat Quantity Data
LEPC respondents that had conducted an HMCFS were asked to indicate the level of quantity detail that was obtained for their most-recent study. As shown in Figure 16, the large majority of respondents indicated that their most recent HMCFS only obtained information up to the level of HazMat presence only, if applicable, across all modes.
2.3.5.2 HazMat Classification Data
LEPC respondents that had conducted an HMCFS were asked to indicate the level of classification detail that was obtained for their most recent study. As shown in Figure 17, the majority of respondents indicated that their most recent HMCFS only obtained information up to the level of HazMat division for roadway transport. Some LEPCs did collect more specific HazMat classification data (e.g., placard number, chemical/material name) for roadway, railway, and pipeline modes. Classification of waterway data was generally reported as not applicable for both HazMat quantity and classification data reflecting the limited transport corridors for this mode.
2.3.5.3 Data Value and Usefulness
Survey respondents were asked to indicate their perceived usefulness of the HazMat data collected for their CFS. This information was then evaluated according to the different information sources indicated by the LEPC for guiding the conduct of their HMCFS. Four information sources resulted in significantly higher mean perceived usefulness: the TRANSCAER® manual, U.S. DOT Guidance, knowledge within the LEPC’s membership, and contractor knowledge (Table 14). Use of other sources (not included in the provided categories) resulted in significantly lower perceived data usefulness. Comparison of perceived data usefulness with the level of collected HazMat data, in terms of quantity and in terms of classification revealed some interesting results. As shown in Figure 18 and Figure 19, the majority of LEPCs that responded to the survey reported collecting information up to HazMat presence and up to chemical/material division. However, when this information is compared with rated data usefulness as shown in Table 15 and Table 16, LEPCs that collected data up to relative HazMat quantity (e.g., small, medium, large) and placard/ID number reported the significantly higher perceived CFS data usefulness for roadway, railway, and pipeline modes.
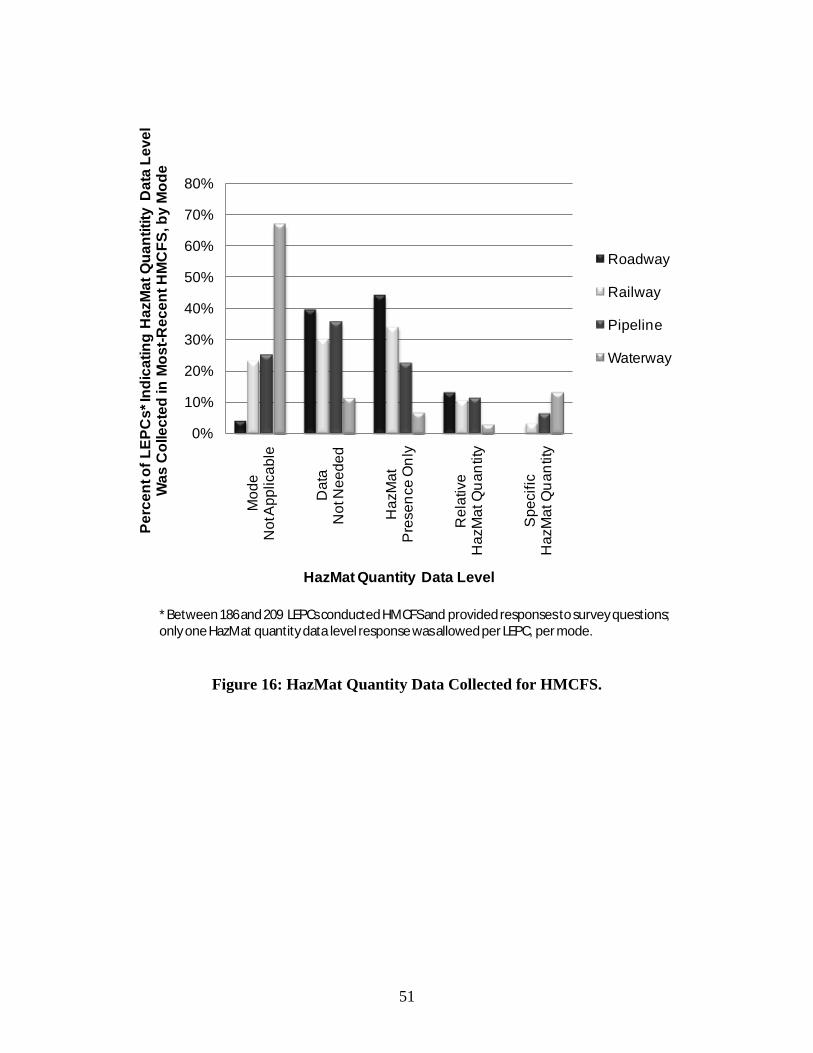
51
0%
10%
20%
30%
40%
50%
60%
70%
80%
Mod
e N
ot A
pplic
able
Dat
a N
ot N
eede
d
Haz
Mat
P
rese
nce
Onl
y
Rel
ativ
e H
azM
at Q
uant
ity
Spe
cific
H
azM
at Q
uant
ity
Perc
ent o
f LEP
Cs*
Indi
catin
g H
azM
at Q
uant
itity
Dat
a Le
vel
Was
Col
lect
ed in
Mos
t-Rec
ent H
MC
FS, b
y M
ode
HazMat Quantity Data Level
Roadway
Railway
Pipeline
Waterway
*Between 186 and 209 LEPCs conducted HMCFS and provided responses to survey questions; only one HazMat quantity data level response was allowed per LEPC, per mode.
Figure 16: HazMat Quantity Data Collected for HMCFS.
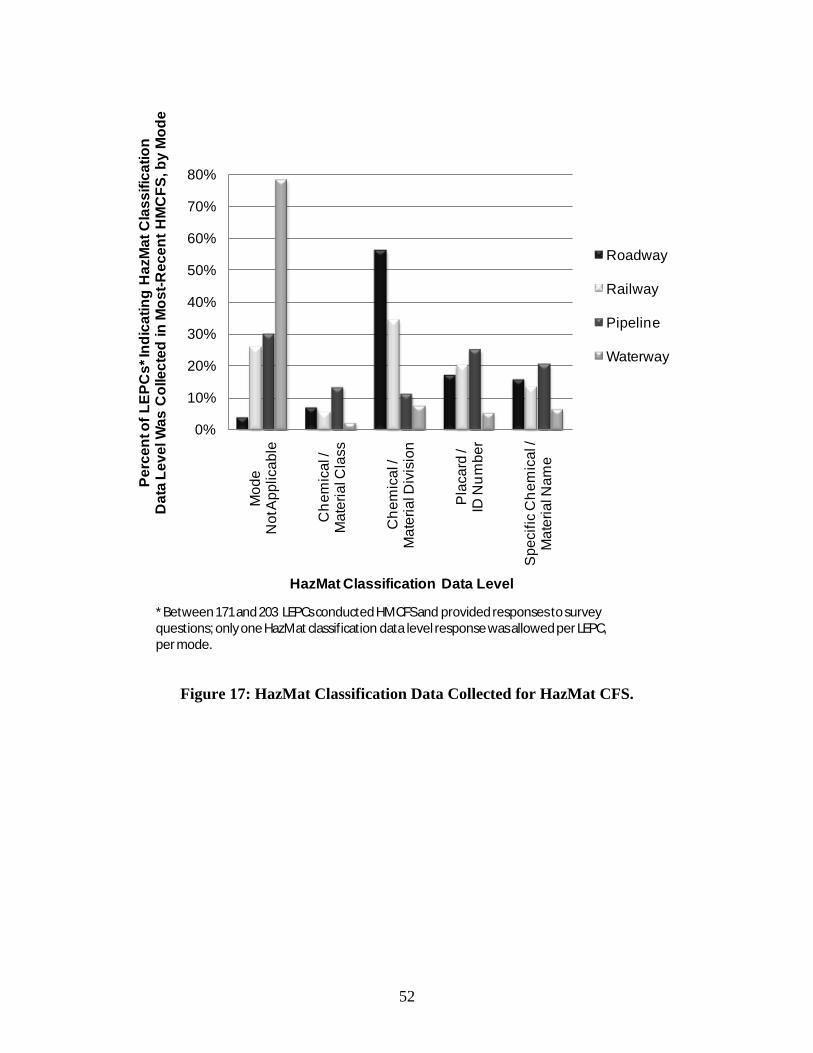
52
0%
10%
20%
30%
40%
50%
60%
70%
80%
Mod
e N
ot A
pplic
able
Che
mic
al /
Mat
eria
l Cla
ss
Che
mic
al /
Mat
eria
l Div
isio
n
Pla
card
/ ID
Num
ber
Spe
cific
Che
mic
al /
Mat
eria
l Nam
e
Perc
ent o
f LEP
Cs*
Indi
catin
g H
azM
at C
lass
ifica
tion
Dat
a Le
vel W
as C
olle
cted
in M
ost-R
ecen
t HM
CFS
, by
Mod
e
HazMat Classification Data Level
Roadway
Railway
Pipeline
Waterway
*Between 171 and 203 LEPCs conducted HMCFS and provided responses to survey questions; only one HazMat classification data level response was allowed per LEPC, per mode.
Figure 17: HazMat Classification Data Collected for HazMat CFS.
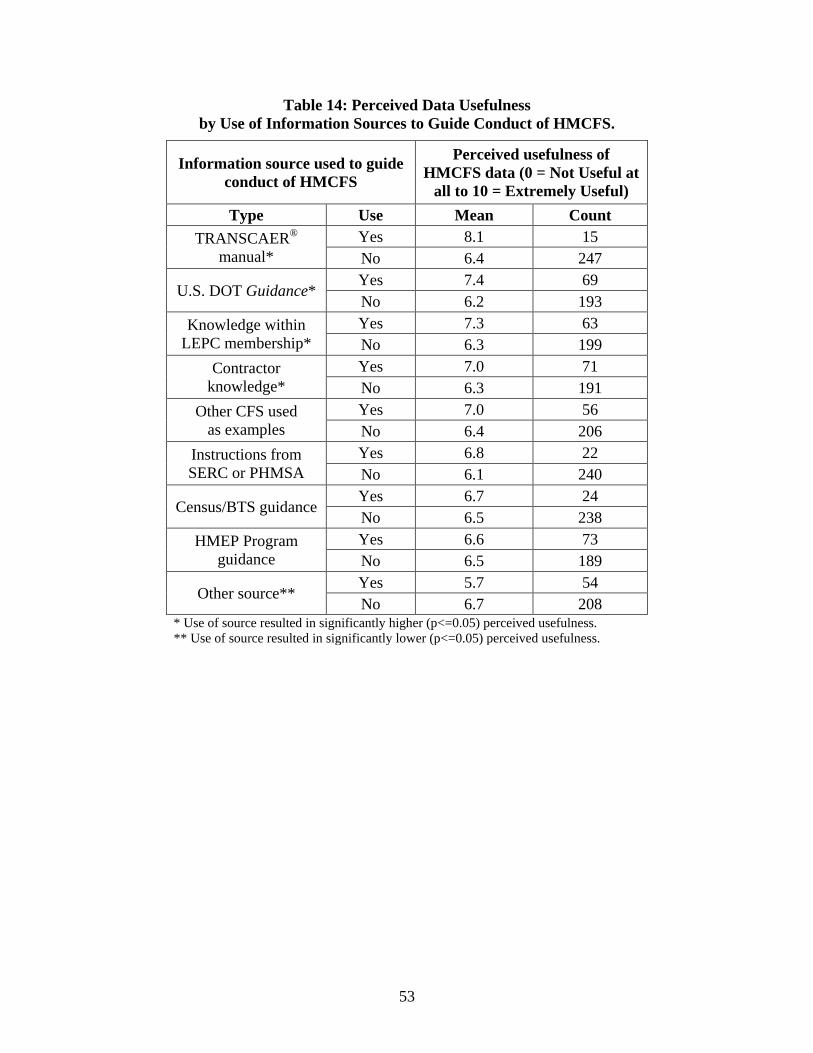
53
Table 14: Perceived Data Usefulness by Use of Information Sources to Guide Conduct of HMCFS.
Information source used to guide conduct of HMCFS
Perceived usefulness of HMCFS data (0 = Not Useful at
all to 10 = Extremely Useful) Type Use Mean Count
TRANSCAER® manual*
Yes 8.1 15 No 6.4 247
U.S. DOT Guidance* Yes 7.4 69 No 6.2 193
Knowledge within LEPC membership*
Yes 7.3 63 No 6.3 199
Contractor knowledge*
Yes 7.0 71 No 6.3 191
Other CFS used as examples
Yes 7.0 56 No 6.4 206
Instructions from SERC or PHMSA
Yes 6.8 22 No 6.1 240
Census/BTS guidance Yes 6.7 24 No 6.5 238
HMEP Program guidance
Yes 6.6 73 No 6.5 189
Other source** Yes 5.7 54 No 6.7 208
* Use of source resulted in significantly higher (p<=0.05) perceived usefulness. ** Use of source resulted in significantly lower (p<=0.05) perceived usefulness.
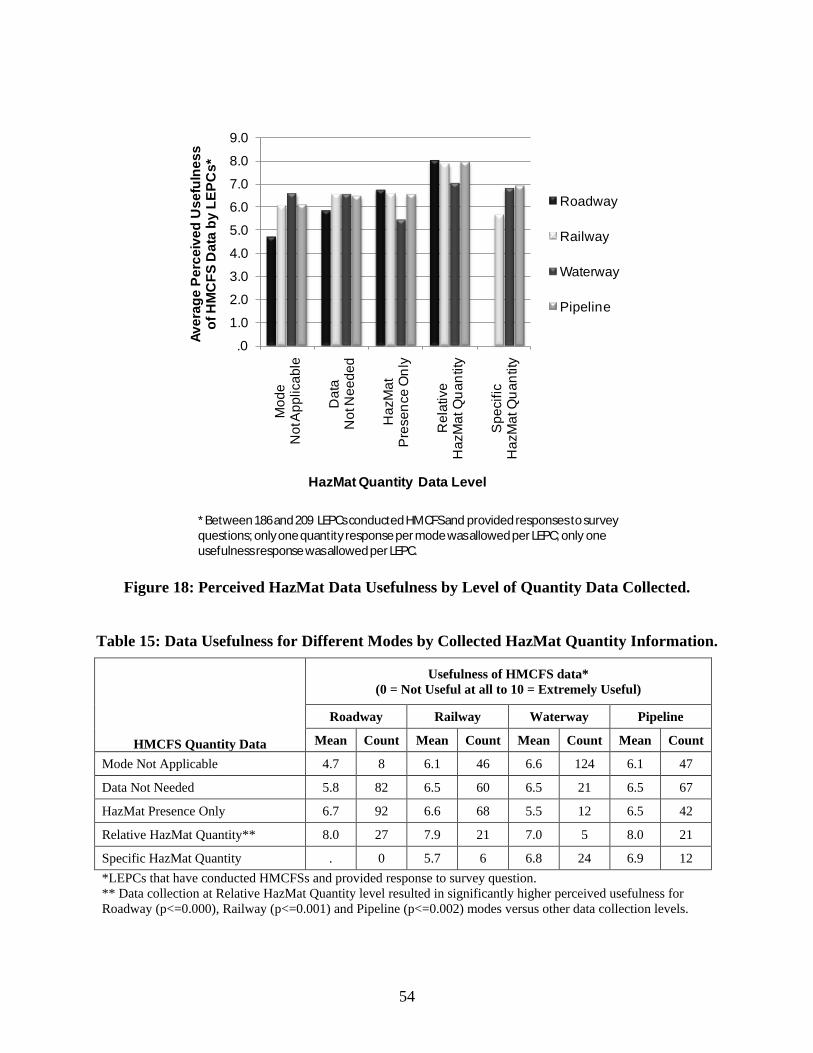
54
.0
1.0
2.0
3.0
4.0
5.0
6.0
7.0
8.0
9.0
Mod
e N
ot A
pplic
able
Dat
a N
ot N
eede
d
Haz
Mat
P
rese
nce
Onl
y
Rel
ativ
e H
azM
at Q
uant
ity
Spe
cific
H
azM
at Q
uant
ity
Aver
age
Perc
eive
d U
sefu
lnes
s of
HM
CFS
Dat
a by
LEP
Cs*
HazMat Quantity Data Level
Roadway
Railway
Waterway
Pipeline
*Between 186 and 209 LEPCs conducted HMCFS and provided responses to survey questions; only one quantity response per mode was allowed per LEPC; only one usefulness response was allowed per LEPC.
Figure 18: Perceived HazMat Data Usefulness by Level of Quantity Data Collected.
Table 15: Data Usefulness for Different Modes by Collected HazMat Quantity Information.
HMCFS Quantity Data
Usefulness of HMCFS data* (0 = Not Useful at all to 10 = Extremely Useful)
Roadway Railway Waterway Pipeline
Mean Count Mean Count Mean Count Mean Count
Mode Not Applicable 4.7 8 6.1 46 6.6 124 6.1 47
Data Not Needed 5.8 82 6.5 60 6.5 21 6.5 67
HazMat Presence Only 6.7 92 6.6 68 5.5 12 6.5 42
Relative HazMat Quantity** 8.0 27 7.9 21 7.0 5 8.0 21
Specific HazMat Quantity . 0 5.7 6 6.8 24 6.9 12 *LEPCs that have conducted HMCFSs and provided response to survey question. ** Data collection at Relative HazMat Quantity level resulted in significantly higher perceived usefulness for Roadway (p<=0.000), Railway (p<=0.001) and Pipeline (p<=0.002) modes versus other data collection levels.
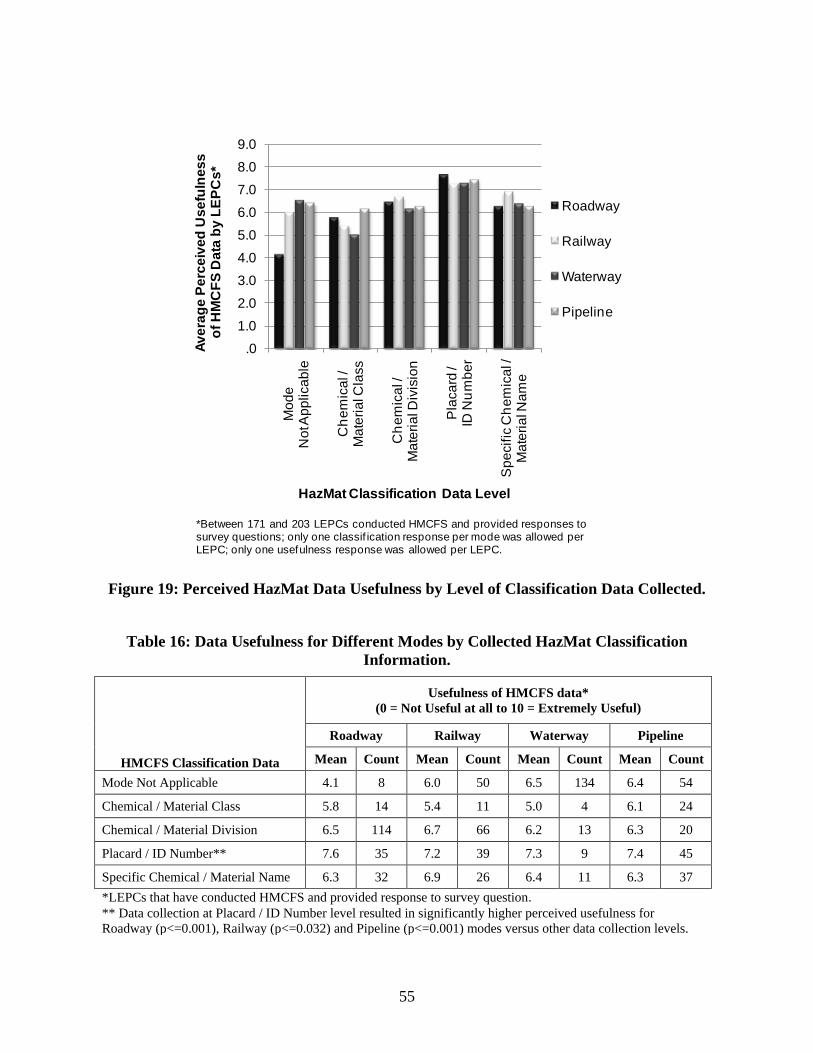
55
.01.02.03.04.05.06.07.08.09.0
Mod
e N
ot A
pplic
able
Che
mic
al /
Mat
eria
l Cla
ss
Che
mic
al /
Mat
eria
l Div
isio
n
Pla
card
/ ID
Num
ber
Spe
cific
Che
mic
al /
Mat
eria
l Nam
e
Aver
age
Perc
eive
d U
sefu
lnes
s of
HM
CFS
Dat
a by
LEP
Cs*
HazMat Classification Data Level
Roadway
Railway
Waterway
Pipeline
*Between 171 and 203 LEPCs conducted HMCFS and provided responses to survey questions; only one classif ication response per mode was allowed per LEPC; only one usefulness response was allowed per LEPC.
Figure 19: Perceived HazMat Data Usefulness by Level of Classification Data Collected.
Table 16: Data Usefulness for Different Modes by Collected HazMat Classification
Information.
HMCFS Classification Data
Usefulness of HMCFS data* (0 = Not Useful at all to 10 = Extremely Useful)
Roadway Railway Waterway Pipeline
Mean Count Mean Count Mean Count Mean Count
Mode Not Applicable 4.1 8 6.0 50 6.5 134 6.4 54
Chemical / Material Class 5.8 14 5.4 11 5.0 4 6.1 24
Chemical / Material Division 6.5 114 6.7 66 6.2 13 6.3 20
Placard / ID Number** 7.6 35 7.2 39 7.3 9 7.4 45
Specific Chemical / Material Name 6.3 32 6.9 26 6.4 11 6.3 37 *LEPCs that have conducted HMCFS and provided response to survey question. ** Data collection at Placard / ID Number level resulted in significantly higher perceived usefulness for Roadway (p<=0.001), Railway (p<=0.032) and Pipeline (p<=0.001) modes versus other data collection levels.
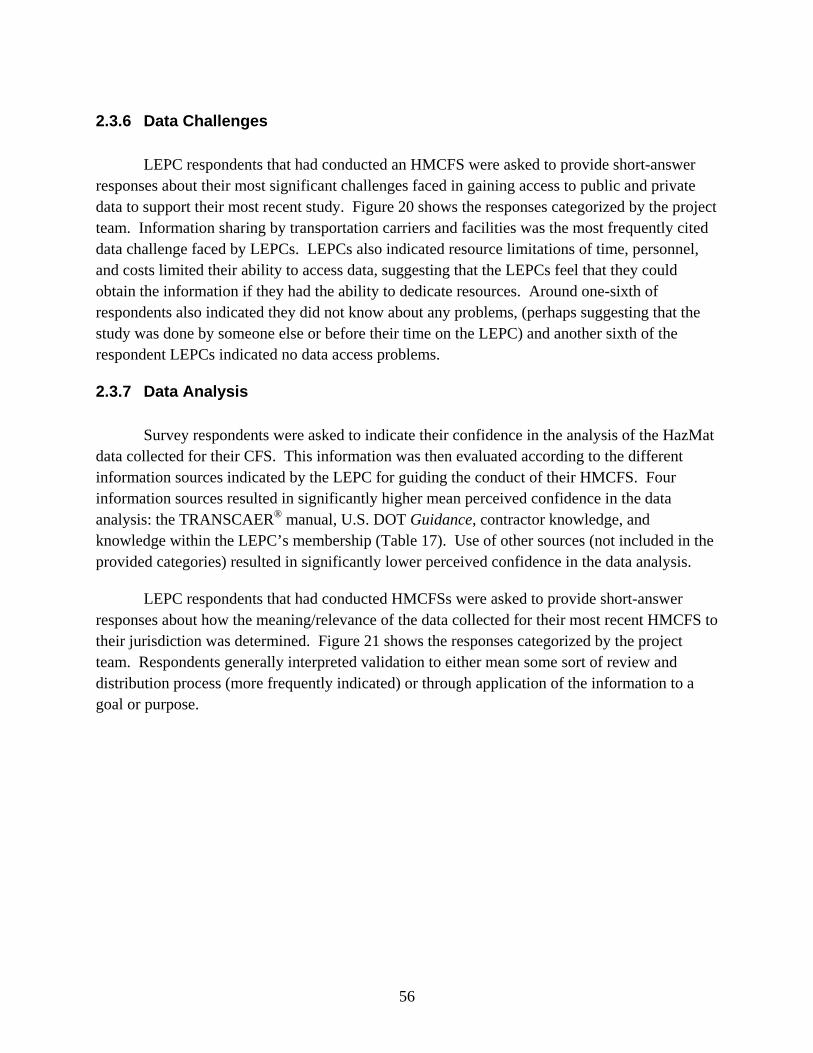
56
2.3.6 Data Challenges
LEPC respondents that had conducted an HMCFS were asked to provide short-answer responses about their most significant challenges faced in gaining access to public and private data to support their most recent study. Figure 20 shows the responses categorized by the project team. Information sharing by transportation carriers and facilities was the most frequently cited data challenge faced by LEPCs. LEPCs also indicated resource limitations of time, personnel, and costs limited their ability to access data, suggesting that the LEPCs feel that they could obtain the information if they had the ability to dedicate resources. Around one-sixth of respondents also indicated they did not know about any problems, (perhaps suggesting that the study was done by someone else or before their time on the LEPC) and another sixth of the respondent LEPCs indicated no data access problems.
2.3.7 Data Analysis
Survey respondents were asked to indicate their confidence in the analysis of the HazMat data collected for their CFS. This information was then evaluated according to the different information sources indicated by the LEPC for guiding the conduct of their HMCFS. Four information sources resulted in significantly higher mean perceived confidence in the data analysis: the TRANSCAER® manual, U.S. DOT Guidance, contractor knowledge, and knowledge within the LEPC’s membership (Table 17). Use of other sources (not included in the provided categories) resulted in significantly lower perceived confidence in the data analysis.
LEPC respondents that had conducted HMCFSs were asked to provide short-answer responses about how the meaning/relevance of the data collected for their most recent HMCFS to their jurisdiction was determined. Figure 21 shows the responses categorized by the project team. Respondents generally interpreted validation to either mean some sort of review and distribution process (more frequently indicated) or through application of the information to a goal or purpose.
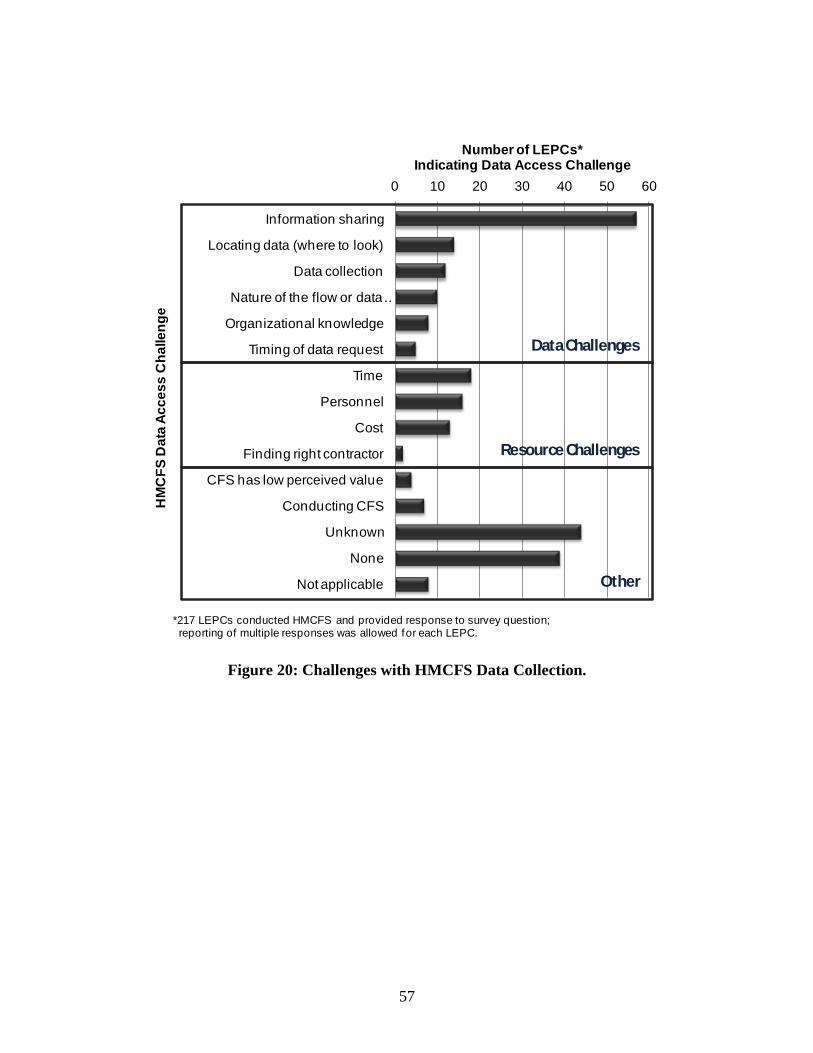
57
0 10 20 30 40 50 60
Information sharing
Locating data (where to look)
Data collection
Nature of the flow or data …
Organizational knowledge
Timing of data request
Time
Personnel
Cost
Finding right contractor
CFS has low perceived value
Conducting CFS
Unknown
None
Not applicable
Number of LEPCs* Indicating Data Access Challenge
HM
CFS
Dat
a Ac
cess
Cha
lleng
e
Data Challenges
Resource Challenges
Other
*217 LEPCs conducted HMCFS and provided response to survey question; reporting of multiple responses was allowed for each LEPC.
Figure 20: Challenges with HMCFS Data Collection.
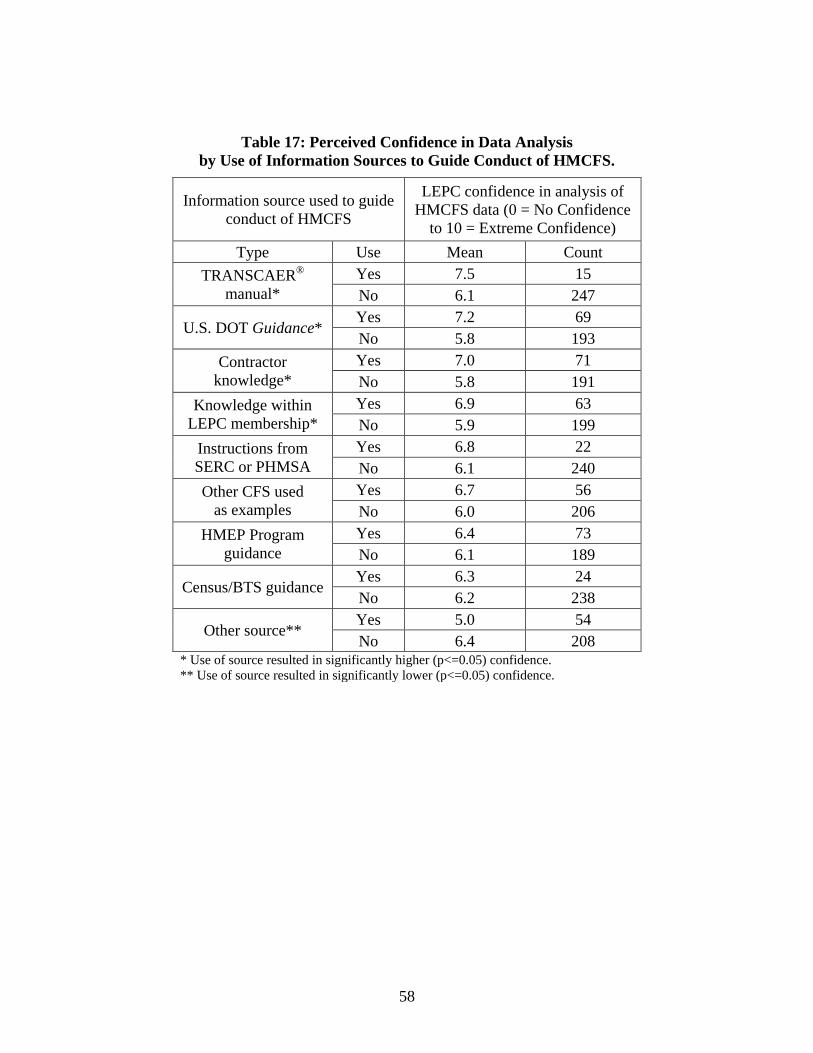
58
Table 17: Perceived Confidence in Data Analysis by Use of Information Sources to Guide Conduct of HMCFS.
Information source used to guide conduct of HMCFS
LEPC confidence in analysis of HMCFS data (0 = No Confidence
to 10 = Extreme Confidence) Type Use Mean Count
TRANSCAER® manual*
Yes 7.5 15 No 6.1 247
U.S. DOT Guidance* Yes 7.2 69 No 5.8 193
Contractor knowledge*
Yes 7.0 71 No 5.8 191
Knowledge within LEPC membership*
Yes 6.9 63 No 5.9 199
Instructions from SERC or PHMSA
Yes 6.8 22 No 6.1 240
Other CFS used as examples
Yes 6.7 56 No 6.0 206
HMEP Program guidance
Yes 6.4 73 No 6.1 189
Census/BTS guidance Yes 6.3 24 No 6.2 238
Other source** Yes 5.0 54 No 6.4 208
* Use of source resulted in significantly higher (p<=0.05) confidence. ** Use of source resulted in significantly lower (p<=0.05) confidence.
59
0 10 20 30 40 50
Reviewed or discussed
Analyzed or evaluated
Compared with other CFS info
Distributed to stakeholders
Stakeholders made aware of results
Filed
Topic at meeting(s)
Submitted or presented to LEPC
Through implementation in plan
Through implentation in response
Through implementation in training
Through identifying equipment needs
Through applying to route desigation
Validated by contractor
Validated by trust in data source/analysis
LEPC participated or study performed
Little done to validate
Nothing done to validate
Unknown
Not applicable
Number of LEPCs* Reporting Method Used
Met
hods
of H
MC
FS D
ata
Rev
iew
and
Val
idat
ion
Passive Review (Dissemination)
Trust
Other
Active Review
Application and Implementation
*196 LEPCs conducted HMCFS and provided response to survey question; reporting multiple mechanisms was allowed for each LEPC.
Figure 21: Methods Used to Determine/Validate Meaning of HMCFS Data to LEPC
Jurisdiction.
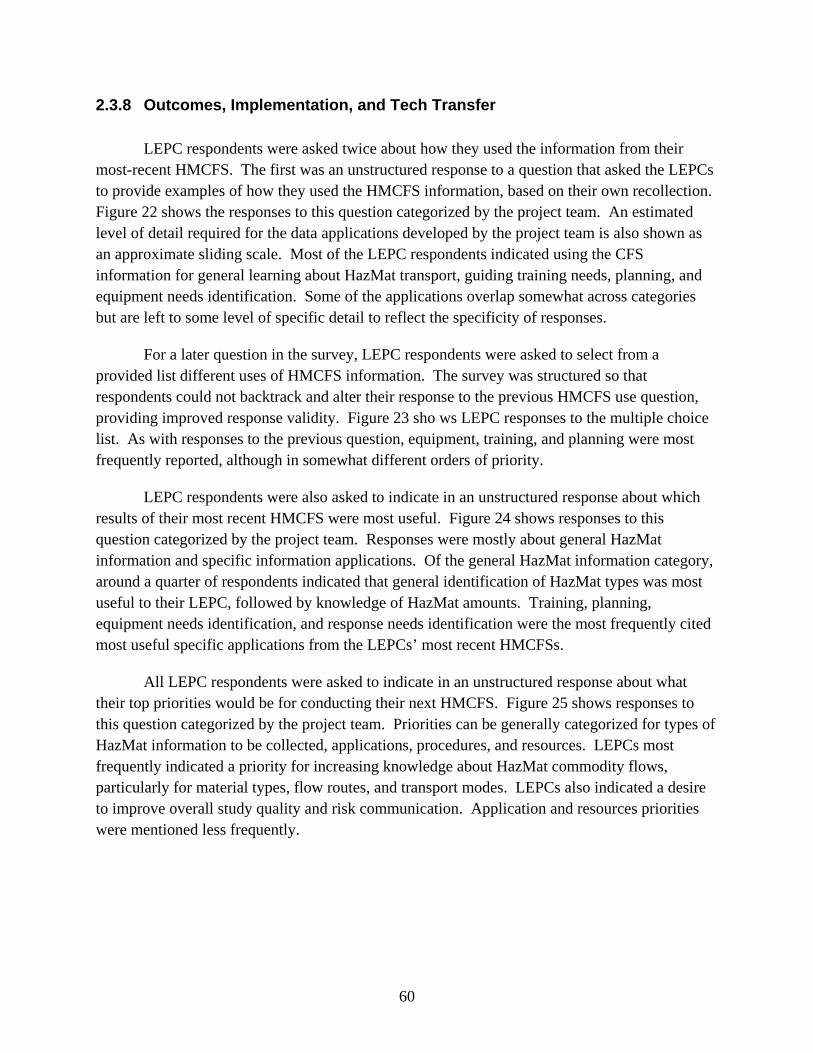
60
2.3.8 Outcomes, Implementation, and Tech Transfer
LEPC respondents were asked twice about how they used the information from their most-recent HMCFS. The first was an unstructured response to a question that asked the LEPCs to provide examples of how they used the HMCFS information, based on their own recollection. Figure 22 shows the responses to this question categorized by the project team. An estimated level of detail required for the data applications developed by the project team is also shown as an approximate sliding scale. Most of the LEPC respondents indicated using the CFS information for general learning about HazMat transport, guiding training needs, planning, and equipment needs identification. Some of the applications overlap somewhat across categories but are left to some level of specific detail to reflect the specificity of responses.
For a later question in the survey, LEPC respondents were asked to select from a provided list different uses of HMCFS information. The survey was structured so that respondents could not backtrack and alter their response to the previous HMCFS use question, providing improved response validity. Figure 23 sho ws LEPC responses to the multiple choice list. As with responses to the previous question, equipment, training, and planning were most frequently reported, although in somewhat different orders of priority.
LEPC respondents were also asked to indicate in an unstructured response about which results of their most recent HMCFS were most useful. Figure 24 shows responses to this question categorized by the project team. Responses were mostly about general HazMat information and specific information applications. Of the general HazMat information category, around a quarter of respondents indicated that general identification of HazMat types was most useful to their LEPC, followed by knowledge of HazMat amounts. Training, planning, equipment needs identification, and response needs identification were the most frequently cited most useful specific applications from the LEPCs’ most recent HMCFSs.
All LEPC respondents were asked to indicate in an unstructured response about what their top priorities would be for conducting their next HMCFS. Figure 25 shows responses to this question categorized by the project team. Priorities can be generally categorized for types of HazMat information to be collected, applications, procedures, and resources. LEPCs most frequently indicated a priority for increasing knowledge about HazMat commodity flows, particularly for material types, flow routes, and transport modes. LEPCs also indicated a desire to improve overall study quality and risk communication. Application and resources priorities were mentioned less frequently.
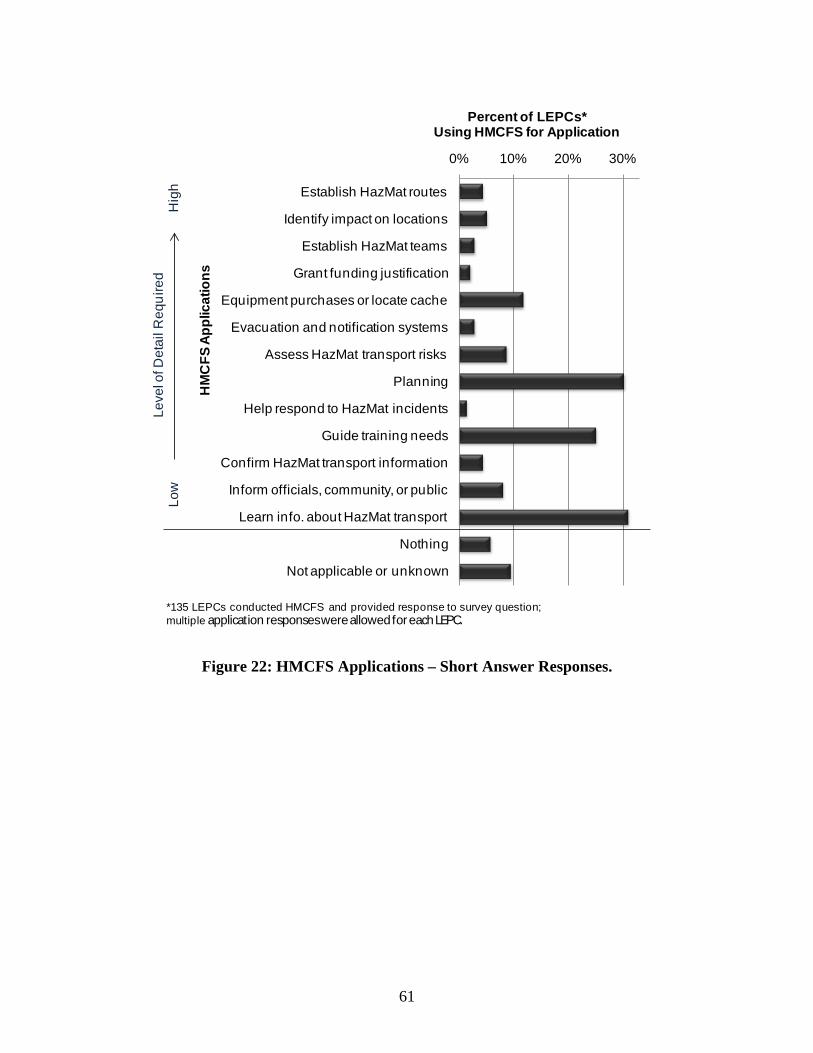
61
0% 10% 20% 30%
Establish HazMat routes
Identify impact on locations
Establish HazMat teams
Grant funding justification
Equipment purchases or locate cache
Evacuation and notification systems
Assess HazMat transport risks
Planning
Help respond to HazMat incidents
Guide training needs
Confirm HazMat transport information
Inform officials, community, or public
Learn info. about HazMat transport
Nothing
Not applicable or unknown
Percent of LEPCs* Using HMCFS for Application
HM
CFS
App
licat
ions
Leve
l of D
etai
l Req
uire
dLo
wH
igh
*135 LEPCs conducted HMCFS and provided response to survey question;multiple application responses were allowed for each LEPC.
Figure 22: HMCFS Applications – Short Answer Responses.
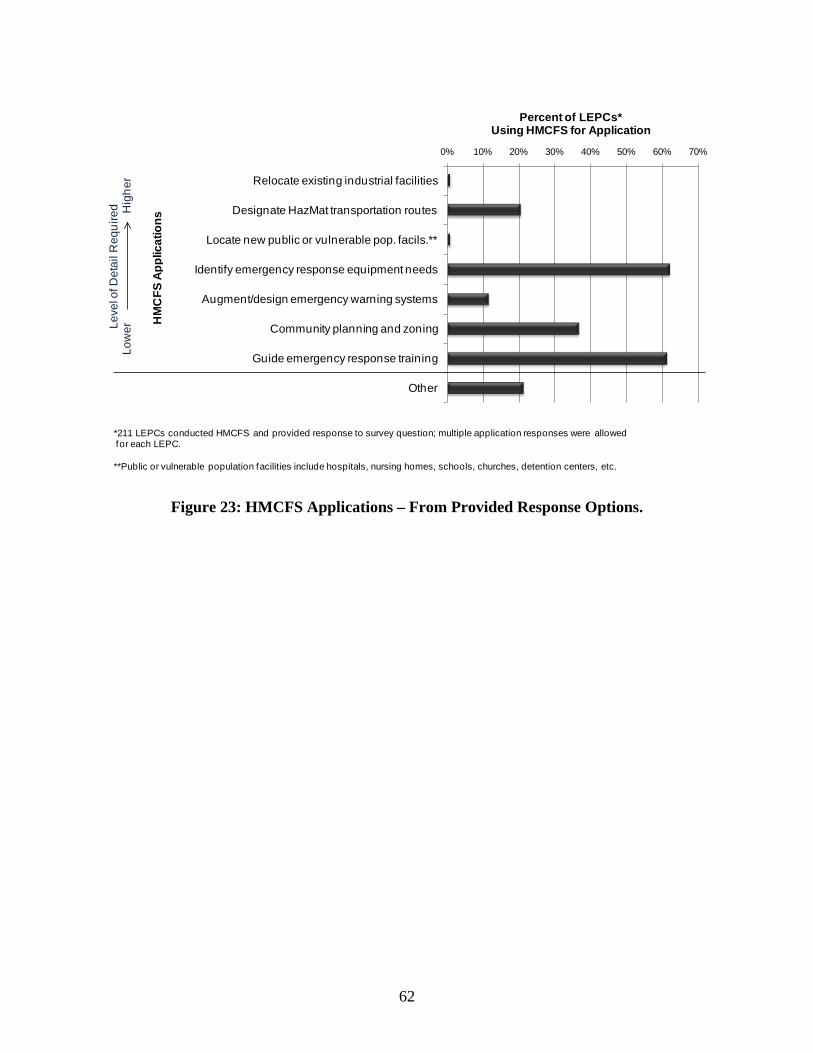
62
0% 10% 20% 30% 40% 50% 60% 70%
Relocate existing industrial facilities
Designate HazMat transportation routes
Locate new public or vulnerable pop. facils.**
Identify emergency response equipment needs
Augment/design emergency warning systems
Community planning and zoning
Guide emergency response training
Other
Percent of LEPCs*Using HMCFS for Application
*211 LEPCs conducted HMCFS and provided response to survey question; multiple application responses were allowed for each LEPC.
**Public or vulnerable population facilities include hospitals, nursing homes, schools, churches, detention centers, etc.
Leve
l of D
etai
l Req
uire
dLo
wer
Hig
her
HM
CFS
Appl
icat
ions
Figure 23: HMCFS Applications – From Provided Response Options.
63
0% 5% 10% 15% 20% 25% 30%
All
ID HazMat presence
ID HazMat locations and routes
ID HazMat types
ID HazMat amounts
ID traffic levels
Training
Planning
Warning systems
ID equipment needs
ID response needs
Help locate resources
Help in response activities
Communicate HazMat risks
Enhance stakeholder relationships
None
N/A
Other
Percent of LEPCs* Reporting HMCFSResults and Outcomes as 'Most-Useful'
Res
ults
and
Out
com
es o
f Con
duct
ing
HM
CFS
Specific Applications
HazMat Information
Communications
Other
*135 LEPCs conducted HMCFS and provided response to survey question; multiple reported results and outcomes were allowed for each LEPC.
Figure 24: Most Useful Reported HMCFS Results.
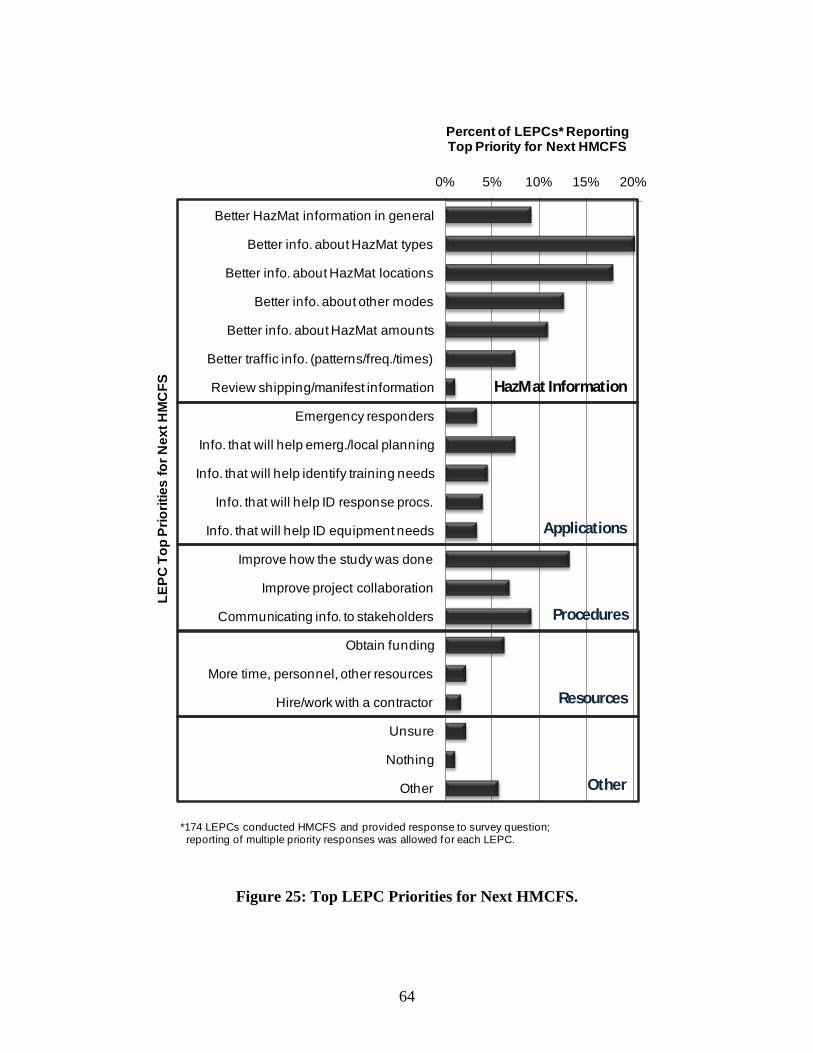
64
0% 5% 10% 15% 20%
Better HazMat information in general
Better info. about HazMat types
Better info. about HazMat locations
Better info. about other modes
Better info. about HazMat amounts
Better traffic info. (patterns/freq./times)
Review shipping/manifest information
Emergency responders
Info. that will help emerg./local planning
Info. that will help identify training needs
Info. that will help ID response procs.
Info. that will help ID equipment needs
Improve how the study was done
Improve project collaboration
Communicating info. to stakeholders
Obtain funding
More time, personnel, other resources
Hire/work with a contractor
Unsure
Nothing
Other
Percent of LEPCs* Reporting Top Priority for Next HMCFSLE
PC T
op P
riorit
ies
for N
ext H
MC
FS
Applications
Resources
Other
Procedures
*174 LEPCs conducted HMCFS and provided response to survey question; reporting of multiple priority responses was allowed for each LEPC.
HazMat Information
Figure 25: Top LEPC Priorities for Next HMCFS.
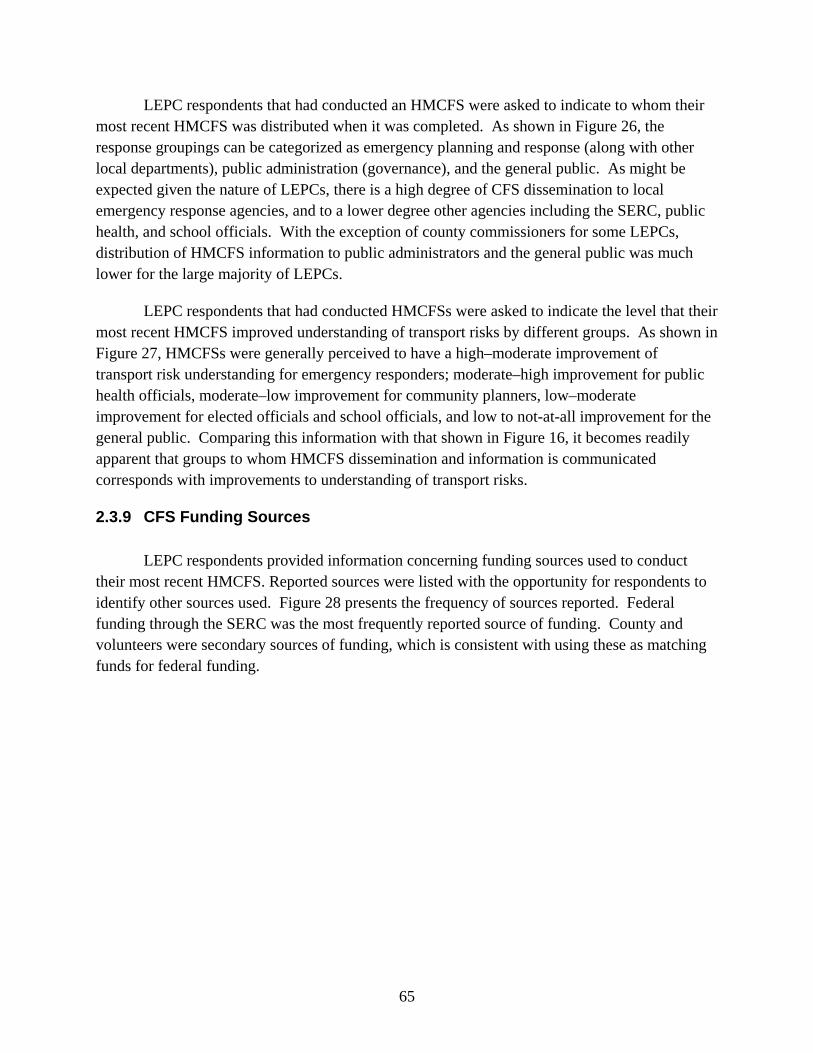
65
LEPC respondents that had conducted an HMCFS were asked to indicate to whom their most recent HMCFS was distributed when it was completed. As shown in Figure 26, the response groupings can be categorized as emergency planning and response (along with other local departments), public administration (governance), and the general public. As might be expected given the nature of LEPCs, there is a high degree of CFS dissemination to local emergency response agencies, and to a lower degree other agencies including the SERC, public health, and school officials. With the exception of county commissioners for some LEPCs, distribution of HMCFS information to public administrators and the general public was much lower for the large majority of LEPCs.
LEPC respondents that had conducted HMCFSs were asked to indicate the level that their most recent HMCFS improved understanding of transport risks by different groups. As shown in Figure 27, HMCFSs were generally perceived to have a high–moderate improvement of transport risk understanding for emergency responders; moderate–high improvement for public health officials, moderate–low improvement for community planners, low–moderate improvement for elected officials and school officials, and low to not-at-all improvement for the general public. Comparing this information with that shown in Figure 16, it becomes readily apparent that groups to whom HMCFS dissemination and information is communicated corresponds with improvements to understanding of transport risks.
2.3.9 CFS Funding Sources
LEPC respondents provided information concerning funding sources used to conduct their most recent HMCFS. Reported sources were listed with the opportunity for respondents to identify other sources used. Figure 28 presents the frequency of sources reported. Federal funding through the SERC was the most frequently reported source of funding. County and volunteers were secondary sources of funding, which is consistent with using these as matching funds for federal funding.
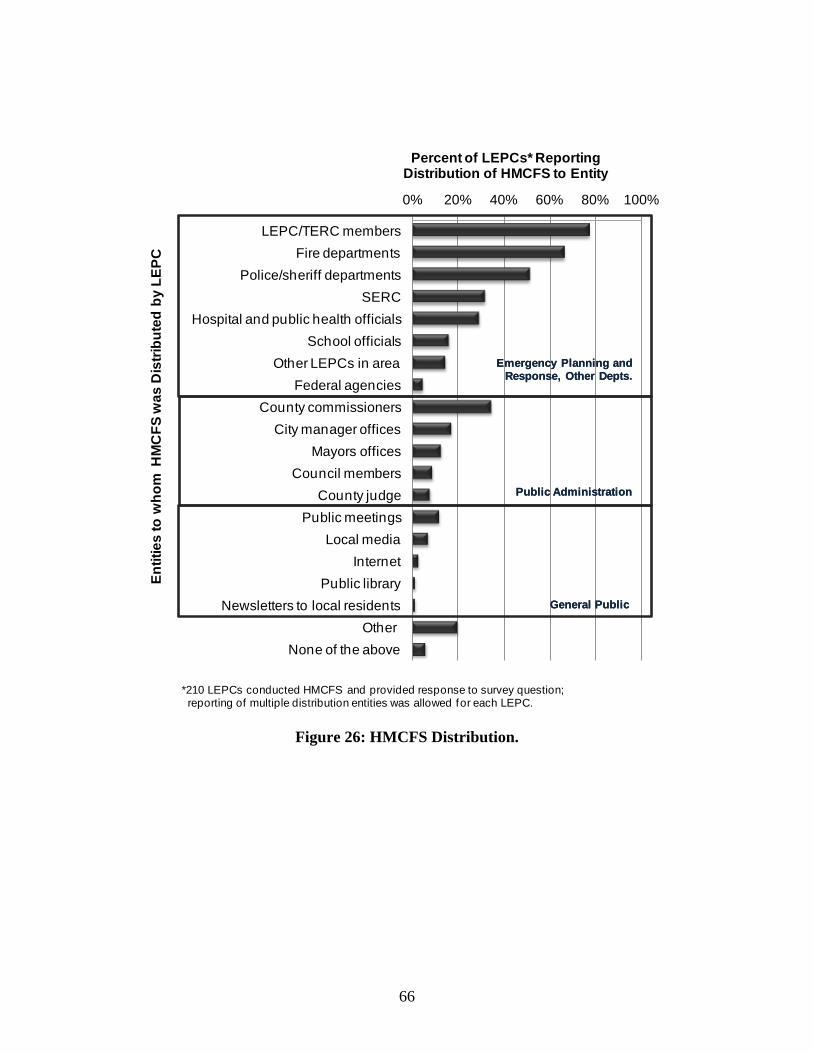
66
0% 20% 40% 60% 80% 100%
LEPC/TERC membersFire departments
Police/sheriff departmentsSERC
Hospital and public health officialsSchool officials
Other LEPCs in areaFederal agencies
County commissionersCity manager offices
Mayors officesCouncil members
County judgePublic meetings
Local mediaInternet
Public libraryNewsletters to local residents
Other None of the above
Percent of LEPCs* Reporting Distribution of HMCFS to Entity
Entit
ies
to w
hom
HM
CFS
was
Dis
tribu
ted
by L
EPC
Emergency Planning and Response, Other Depts.
Public Administration
General Public
*210 LEPCs conducted HMCFS and provided response to survey question;reporting of multiple distribution entities was allowed for each LEPC.
Emergency Planning and Response, Other Depts.
Public Administration
General Public
Figure 26: HMCFS Distribution.
67
0.0%
5.0%
10.0%
15.0%
20.0%
25.0%
30.0%
35.0%
40.0%
45.0%
50.0%
Not
at a
ll
Low
Mod
erat
e
Hig
h
Very
hig
h
Perc
ent o
f LEP
Cs*
Rep
ortin
g Le
vel o
f Im
prov
ed U
nder
stan
ding
Level of that HMCFS Improved Understanding of Transport Risk for Different Groups
Emergency responders
Public health officials
Community planners
Elected officials
School officials
General public
*Between 201 and 207 LEPCs conducted HMCFS and provided responses to survey questions;only one response per group category was allowed per LEPC.
Figure 27: Improvement to Understanding of Transport Risks by Different Groups.
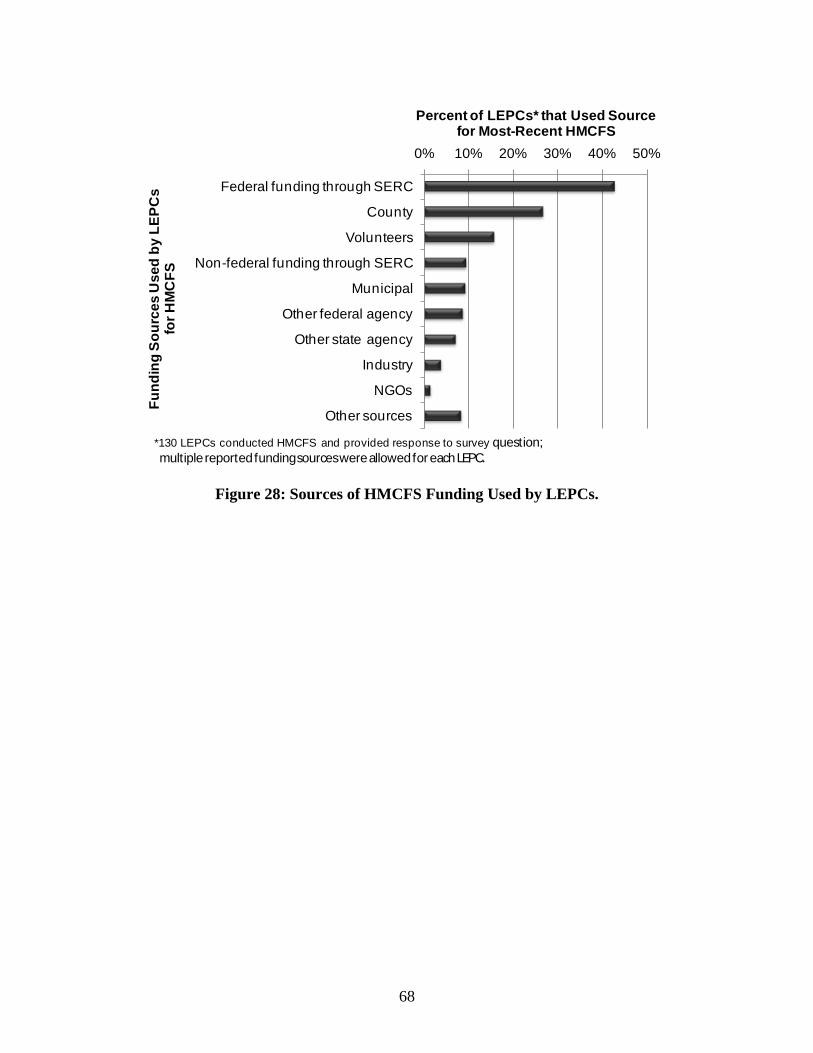
68
0% 10% 20% 30% 40% 50%
Federal funding through SERC
County
Volunteers
Non-federal funding through SERC
Municipal
Other federal agency
Other state agency
Industry
NGOs
Other sources
Percent of LEPCs* that Used Source for Most-Recent HMCFS
Fund
ing
Sour
ces
Use
d by
LEP
Cs
for H
MC
FS
*130 LEPCs conducted HMCFS and provided response to survey question; multiple reported funding sources were allowed for each LEPC.
Figure 28: Sources of HMCFS Funding Used by LEPCs.
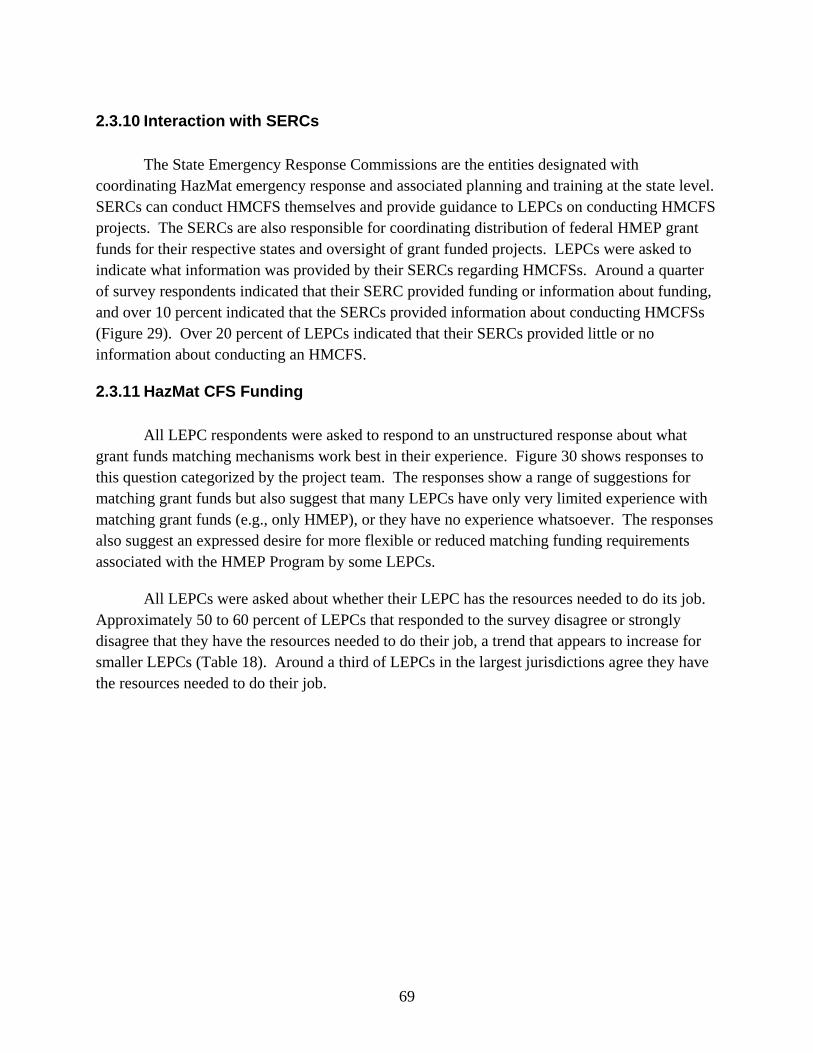
69
2.3.10 Interaction with SERCs
The State Emergency Response Commissions are the entities designated with coordinating HazMat emergency response and associated planning and training at the state level. SERCs can conduct HMCFS themselves and provide guidance to LEPCs on conducting HMCFS projects. The SERCs are also responsible for coordinating distribution of federal HMEP grant funds for their respective states and oversight of grant funded projects. LEPCs were asked to indicate what information was provided by their SERCs regarding HMCFSs. Around a quarter of survey respondents indicated that their SERC provided funding or information about funding, and over 10 percent indicated that the SERCs provided information about conducting HMCFSs (Figure 29). Over 20 percent of LEPCs indicated that their SERCs provided little or no information about conducting an HMCFS.
2.3.11 HazMat CFS Funding
All LEPC respondents were asked to respond to an unstructured response about what grant funds matching mechanisms work best in their experience. Figure 30 shows responses to this question categorized by the project team. The responses show a range of suggestions for matching grant funds but also suggest that many LEPCs have only very limited experience with matching grant funds (e.g., only HMEP), or they have no experience whatsoever. The responses also suggest an expressed desire for more flexible or reduced matching funding requirements associated with the HMEP Program by some LEPCs.
All LEPCs were asked about whether their LEPC has the resources needed to do its job. Approximately 50 to 60 percent of LEPCs that responded to the survey disagree or strongly disagree that they have the resources needed to do their job, a trend that appears to increase for smaller LEPCs (Table 18). Around a third of LEPCs in the largest jurisdictions agree they have the resources needed to do their job.
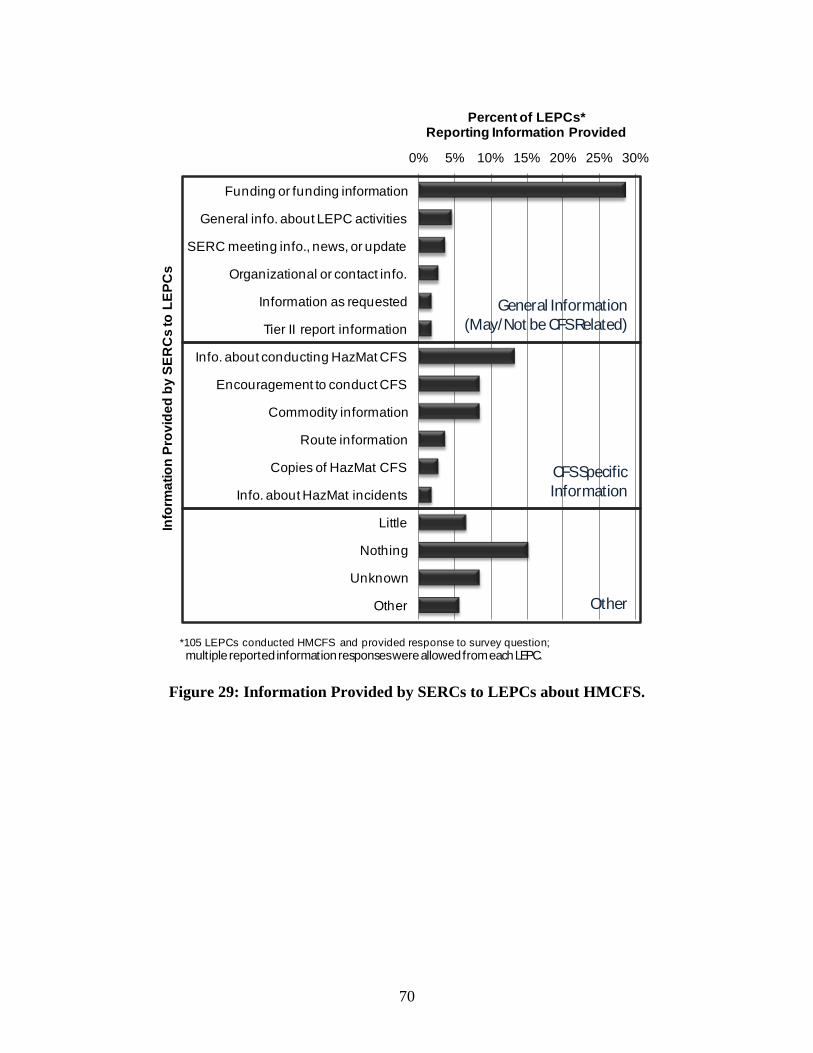
70
0% 5% 10% 15% 20% 25% 30%
Funding or funding information
General info. about LEPC activities
SERC meeting info., news, or update
Organizational or contact info.
Information as requested
Tier II report information
Info. about conducting HazMat CFS
Encouragement to conduct CFS
Commodity information
Route information
Copies of HazMat CFS
Info. about HazMat incidents
Little
Nothing
Unknown
Other
Percent of LEPCs*Reporting Information Provided
Info
rmat
ion
Prov
ided
by
SER
Cs
to L
EPC
s
CFS Specific Information
General Information (May/Not be CFS Related)
Other
*105 LEPCs conducted HMCFS and provided response to survey question;multiple reported information responses were allowed from each LEPC.
Figure 29: Information Provided by SERCs to LEPCs about HMCFS.
71
0% 5% 10% 15% 20%
In-kind matching
Use state funding
Use local funding, including admin.
Using EPCRA/facility/Tier II funds
Volunteer matching
Industry matching
Regional use or application of funds
Using a grant manager
Cash
Modify HMEP restrictions or reqs.
No or reduced match requirements
Have only received HMEP grants
HMEP grant mechanism was used
Have not received grant funding
LEPC has no funds
Unknown/not sure/not applicable
Other
None
Percent of LEPCs* Recommending Mechanism
Mec
hani
sms
Rec
omm
ende
d by
LEP
Cs
for M
atch
ing
Gra
nt F
unds
FundingModifications
Funding Sources or Administration
Other
*233 LEPCs provided response to survey question; multiple recommended match mechanism responses were allowed from each LEPC.
Figure 30: HMCFS Grant Funds Matching Mechanisms Suggested by LEPCs.
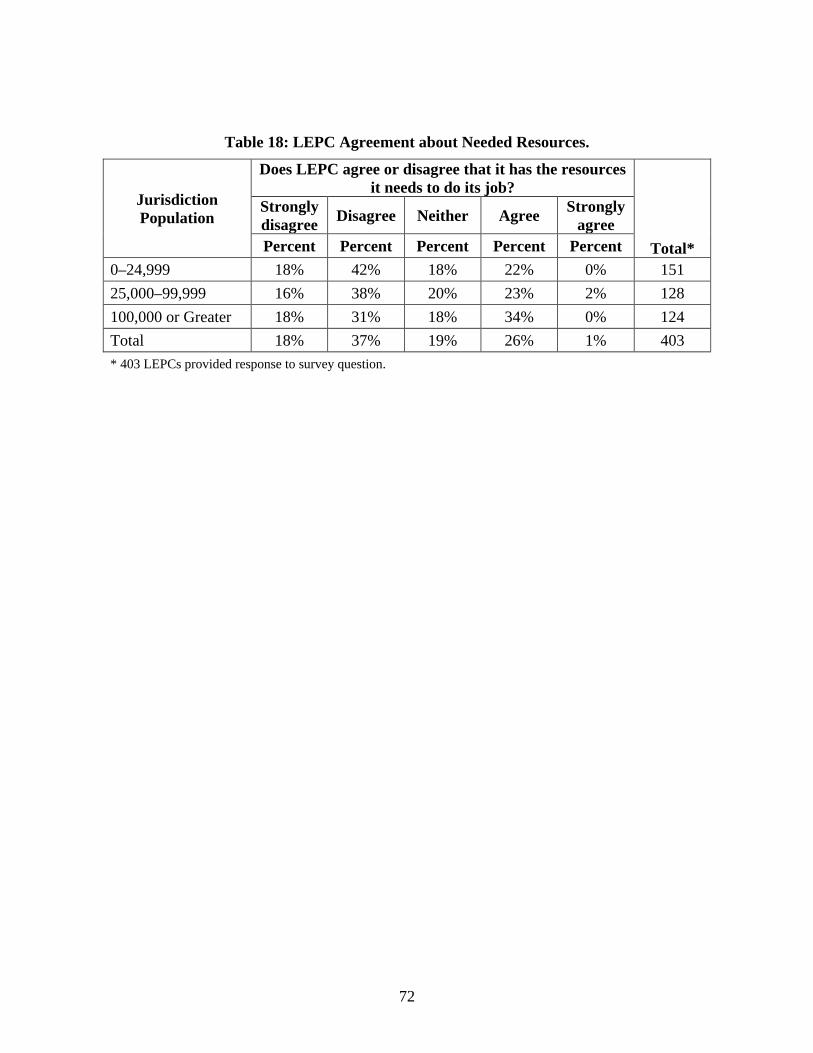
72
Table 18: LEPC Agreement about Needed Resources.
Jurisdiction Population
Does LEPC agree or disagree that it has the resources it needs to do its job?
Total*
Strongly disagree Disagree Neither Agree Strongly
agree Percent Percent Percent Percent Percent
0–24,999 18% 42% 18% 22% 0% 151 25,000–99,999 16% 38% 20% 23% 2% 128 100,000 or Greater 18% 31% 18% 34% 0% 124 Total 18% 37% 19% 26% 1% 403 * 403 LEPCs provided response to survey question.
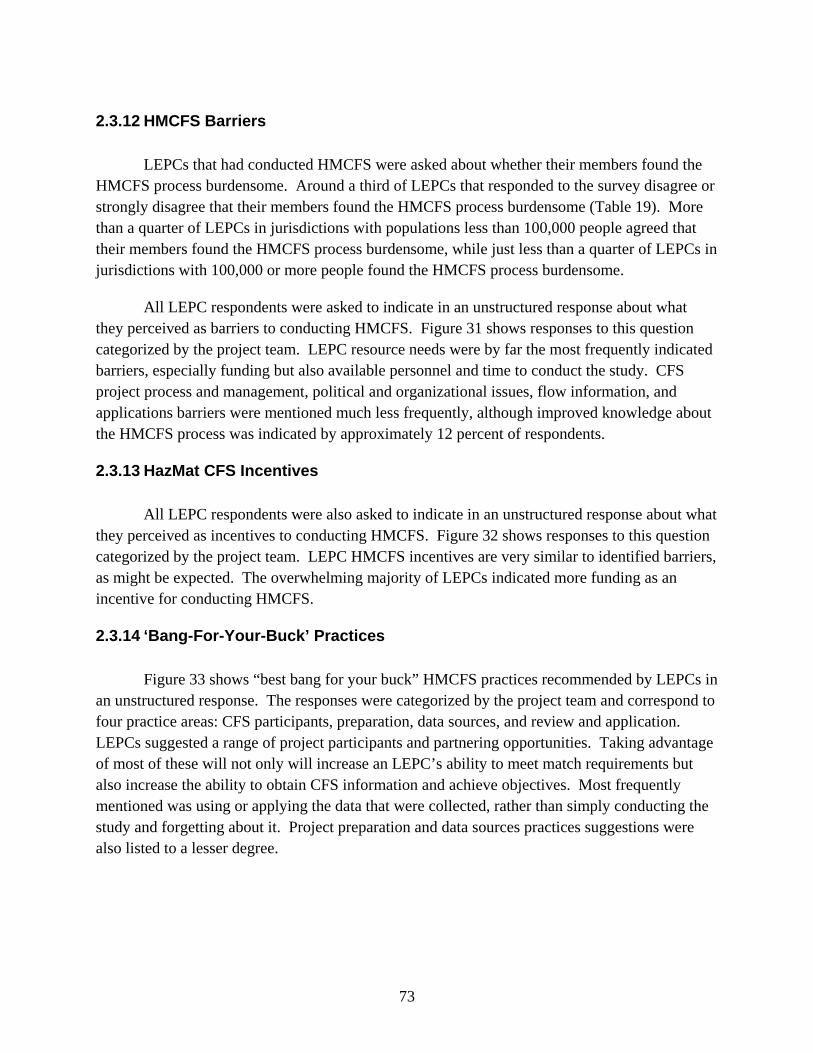
73
2.3.12 HMCFS Barriers
LEPCs that had conducted HMCFS were asked about whether their members found the HMCFS process burdensome. Around a third of LEPCs that responded to the survey disagree or strongly disagree that their members found the HMCFS process burdensome (Table 19). More than a quarter of LEPCs in jurisdictions with populations less than 100,000 people agreed that their members found the HMCFS process burdensome, while just less than a quarter of LEPCs in jurisdictions with 100,000 or more people found the HMCFS process burdensome.
All LEPC respondents were asked to indicate in an unstructured response about what they perceived as barriers to conducting HMCFS. Figure 31 shows responses to this question categorized by the project team. LEPC resource needs were by far the most frequently indicated barriers, especially funding but also available personnel and time to conduct the study. CFS project process and management, political and organizational issues, flow information, and applications barriers were mentioned much less frequently, although improved knowledge about the HMCFS process was indicated by approximately 12 percent of respondents.
2.3.13 HazMat CFS Incentives
All LEPC respondents were also asked to indicate in an unstructured response about what they perceived as incentives to conducting HMCFS. Figure 32 shows responses to this question categorized by the project team. LEPC HMCFS incentives are very similar to identified barriers, as might be expected. The overwhelming majority of LEPCs indicated more funding as an incentive for conducting HMCFS.
2.3.14 ‘Bang-For-Your-Buck’ Practices
Figure 33 shows “best bang for your buck” HMCFS practices recommended by LEPCs in an unstructured response. The responses were categorized by the project team and correspond to four practice areas: CFS participants, preparation, data sources, and review and application. LEPCs suggested a range of project participants and partnering opportunities. Taking advantage of most of these will not only will increase an LEPC’s ability to meet match requirements but also increase the ability to obtain CFS information and achieve objectives. Most frequently mentioned was using or applying the data that were collected, rather than simply conducting the study and forgetting about it. Project preparation and data sources practices suggestions were also listed to a lesser degree.
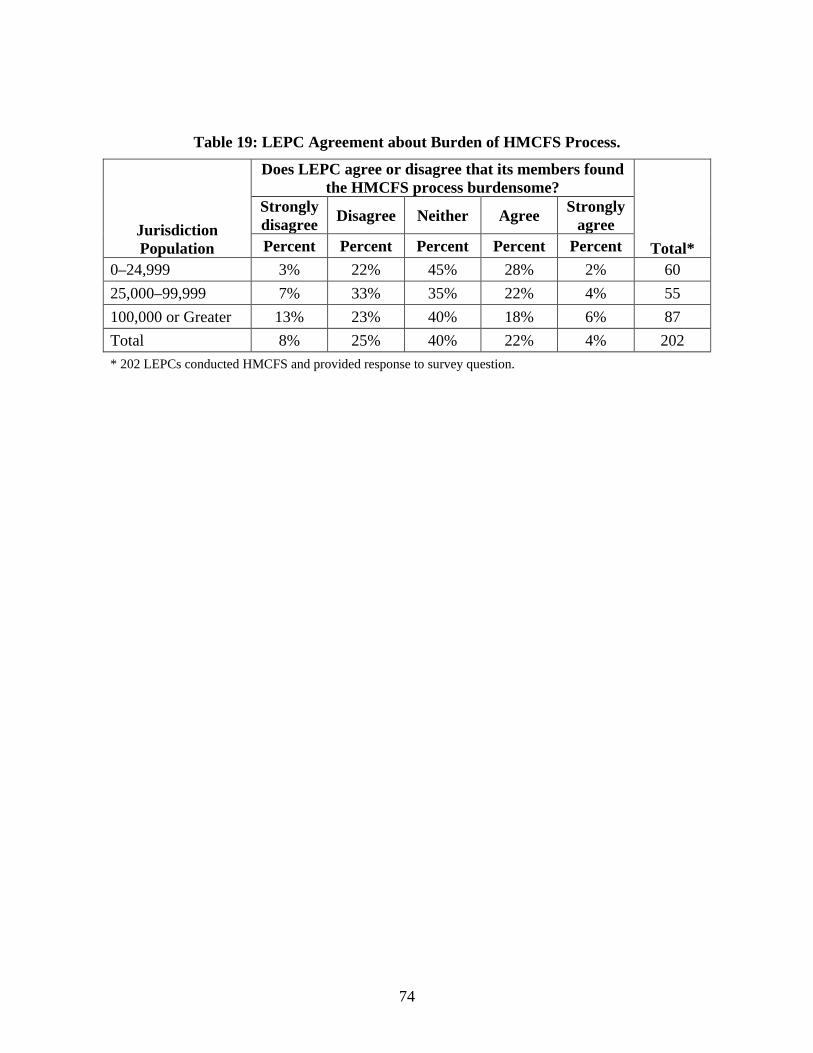
74
Table 19: LEPC Agreement about Burden of HMCFS Process.
Jurisdiction Population
Does LEPC agree or disagree that its members found the HMCFS process burdensome?
Total*
Strongly disagree Disagree Neither Agree Strongly
agree Percent Percent Percent Percent Percent
0–24,999 3% 22% 45% 28% 2% 60 25,000–99,999 7% 33% 35% 22% 4% 55 100,000 or Greater 13% 23% 40% 18% 6% 87 Total 8% 25% 40% 22% 4% 202 * 202 LEPCs conducted HMCFS and provided response to survey question.
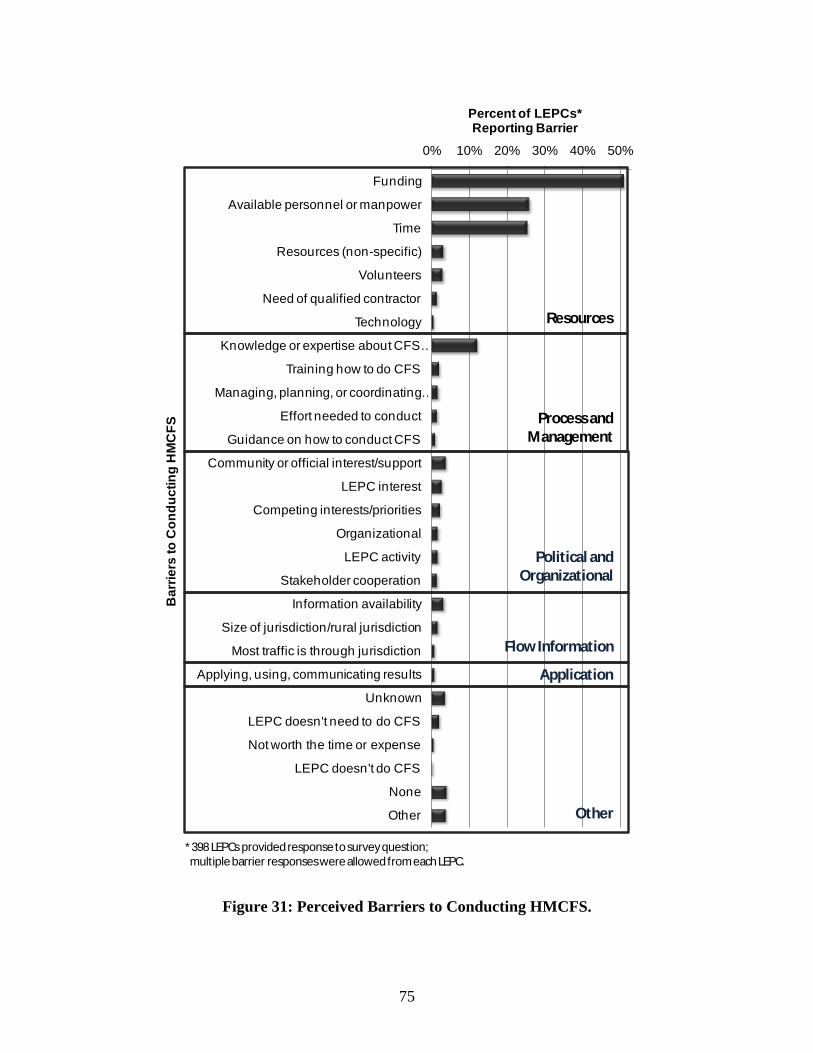
75
0% 10% 20% 30% 40% 50%
Funding
Available personnel or manpower
Time
Resources (non-specific)
Volunteers
Need of qualified contractor
Technology
Knowledge or expertise about CFS …
Training how to do CFS
Managing, planning, or coordinating …
Effort needed to conduct
Guidance on how to conduct CFS
Community or official interest/support
LEPC interest
Competing interests/priorities
Organizational
LEPC activity
Stakeholder cooperation
Information availability
Size of jurisdiction/rural jurisdiction
Most traffic is through jurisdiction
Applying, using, communicating results
Unknown
LEPC doesn't need to do CFS
Not worth the time or expense
LEPC doesn't do CFS
None
Other
Percent of LEPCs*Reporting Barrier
Bar
riers
to C
ondu
ctin
g H
MC
FS
Political and Organizational
Application
Other
Flow Information
Resources
Process and Management
*398 LEPCs provided response to survey question;multiple barrier responses were allowed from each LEPC.
Figure 31: Perceived Barriers to Conducting HMCFS.
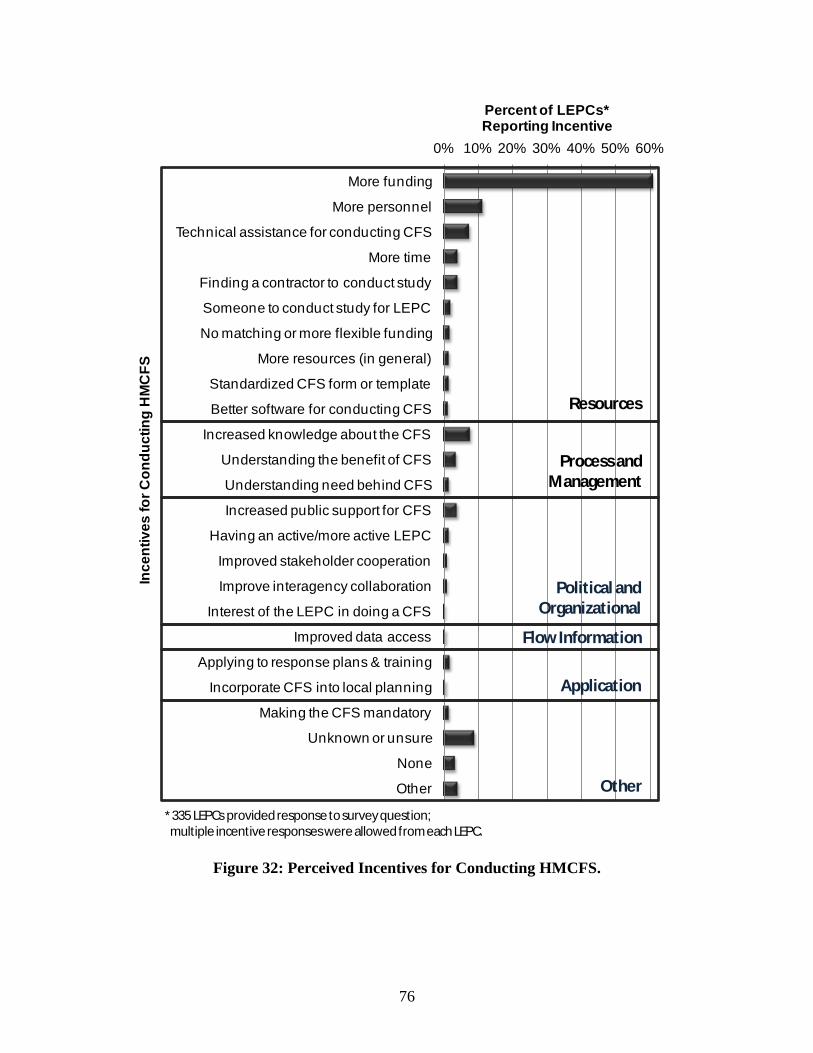
76
0% 10% 20% 30% 40% 50% 60%
More funding
More personnel
Technical assistance for conducting CFS
More time
Finding a contractor to conduct study
Someone to conduct study for LEPC
No matching or more flexible funding
More resources (in general)
Standardized CFS form or template
Better software for conducting CFS
Increased knowledge about the CFS
Understanding the benefit of CFS
Understanding need behind CFS
Increased public support for CFS
Having an active/more active LEPC
Improved stakeholder cooperation
Improve interagency collaboration
Interest of the LEPC in doing a CFS
Improved data access
Applying to response plans & training
Incorporate CFS into local planning
Making the CFS mandatory
Unknown or unsure
None
Other
Percent of LEPCs* Reporting Incentive
Ince
ntiv
es fo
r Con
duct
ing
HM
CFS
Political and Organizational
Application
Other
Flow Information
*335 LEPCs provided response to survey question;multiple incentive responses were allowed from each LEPC.
Resources
Process and Management
Figure 32: Perceived Incentives for Conducting HMCFS.
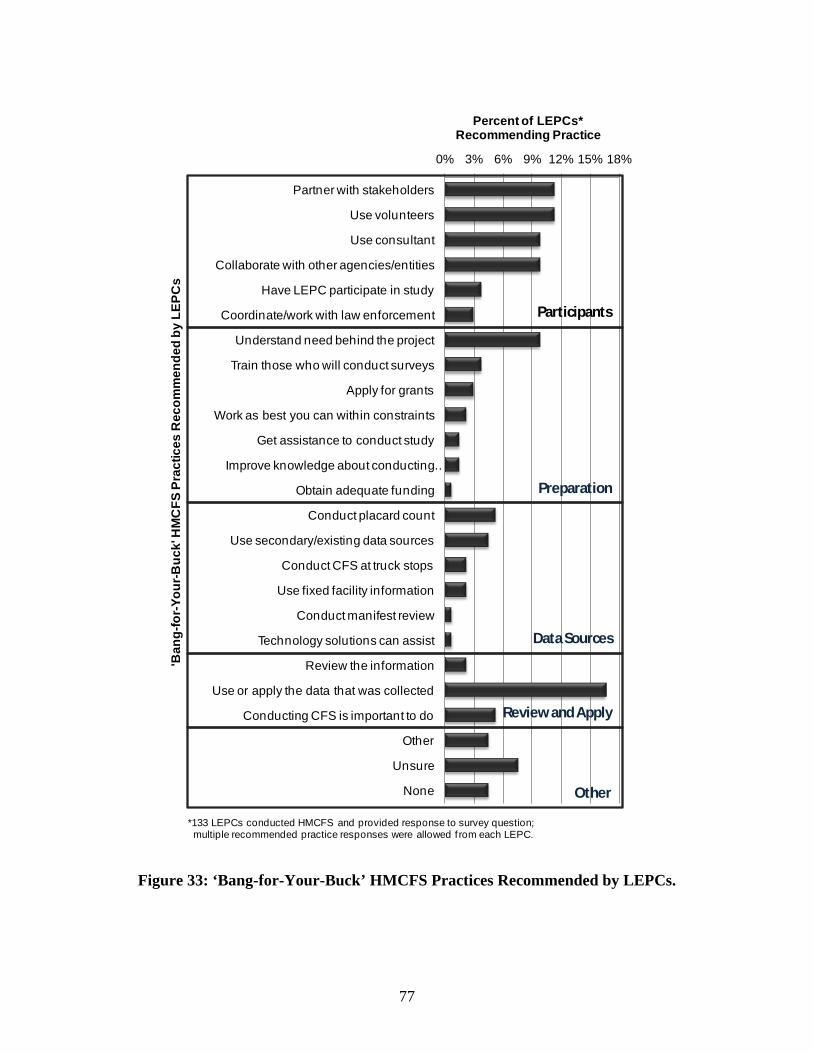
77
0% 3% 6% 9% 12% 15% 18%
Partner with stakeholders
Use volunteers
Use consultant
Collaborate with other agencies/entities
Have LEPC participate in study
Coordinate/work with law enforcement
Understand need behind the project
Train those who will conduct surveys
Apply for grants
Work as best you can within constraints
Get assistance to conduct study
Improve knowledge about conducting …
Obtain adequate funding
Conduct placard count
Use secondary/existing data sources
Conduct CFS at truck stops
Use fixed facility information
Conduct manifest review
Technology solutions can assist
Review the information
Use or apply the data that was collected
Conducting CFS is important to do
Other
Unsure
None
Percent of LEPCs*Recommending Practice
'Ban
g-fo
r-You
r-Buc
k' H
MC
FS P
ract
ices
Rec
omm
ende
d by
LEP
Cs
Preparation
Review and Apply
Other
Data Sources
*133 LEPCs conducted HMCFS and provided response to survey question;multiple recommended practice responses were allowed f rom each LEPC.
Participants
Figure 33: ‘Bang-for-Your-Buck’ HMCFS Practices Recommended by LEPCs.
78
2.4 LEPC SURVEY CONCLUSIONS
These conclusions interpret the data at a somewhat higher level of abstraction than presented above. They attempt to provide insight into the underlying meaning when taken as a whole. Six overall conclusions are presented.
2.4.1 HazMat CFS Activity
Local commitment to conducting an HMCFS is limited. While two-fifths of local officials that conducted an HMCFS reported doing so to “...get a handle on HazMat flows,” two-fifths reported not conducting an HMCFS at all. The vast majority of responding LEPCs who reported conducting an HMCFS have only conducted one, and one-fourth report doing so because there was funding available. Around half of the HMCFS were conducted prior to 2004. This implies that many of the HMCFS that have been conducted are unlikely to have been updated and are more than five years old.
Two-fifths of those conducting an HMCFS reported that external advocates (e.g., community planning agencies, SERCs, LEPC from other areas, influential stakeholders) played a key role in motivating the conduct of the CFS, and more than 1-in-20 reported not knowing why the HMCFS was conducted. This pattern of response implies some level of “satisficing” and that some local officials are conducting an HMCFS to meet their needs, but some are also satisfying the perceived requirement of external advocates. This pattern is also consistent with challenges in facing organizational and administrative continuity.
2.4.2 Expediency of Conducting HazMat CFS
Communities often rely on unique data sources available to local participants. Communities conducting HMCFSs report often relying on local industry (nearly two-fifths), transport carriers (one-third) as the leading sources of existing data, and hazardous materials accidents (three-tenths). Local participants on the HMCFS team are prevalent, with half coming from the LEPC, a fourth of the participants (each) coming from county employees, volunteers, and HazMat response teams, and local industry representative comprising a fifth. As the amount of detail required for updating and validating HMCFS data increase, the use of that type of data in HMCFS decreases; LEPCs report using the least detailed data most frequently.
Among communities that conduct an HMCFS, more than half update and validate existing data with vehicle/vessel/tanker counts and half engaged in placard counts. Interviews with local knowledge sources (industry representatives, emergency responders, and other key knowledge sources) were reported by a fifth of survey respondents. The most detailed data involving shipping manifests were collected for only one-tenth of the HMCFS. This pattern of response indicates the use of highly localized data, with little updating or validation with detailed data. This may mean only that the local sources of data are sufficiently detailed to render further
79
validation unnecessary, or it may mean that detailed CFS data are not needed for most local jurisdictions. These results also suggest an important difference between what is needed by the large majority of LEPCs for an HMCFS and other entities that might have more traditional CFS applications, which require a much higher level of detail such as commodity or shipment origin and destination data.
2.4.3 Nature of HazMat CFS Data
Most HMCFS classify hazardous materials in broad categories and have limited data on HazMat quantity. Most LEPCs report that quantity of material is either “not needed” or that “presence only” data resulted from their most recent CFS for non-roadway transport modes, with approximately four-tenths reporting collection up to HazMat “presence only” for HazMat transport by roadway. While around three-fifths of the railway or pipeline transport reported quantities were not needed or presence only data were collected; the level of not applicable rises for railway and pipeline modes underscoring the presence only focus of the HMCFS landscape. Detail with respect to the classification of hazardous materials is limited to the division level for more than half the roadway cases, and more than three-fifths of the HMCFSs for railroad transport; a third of the HMCFSs have more detailed data (i.e., at the placard number or specific hazard material name level). It is important to note that LEPCs that collected data at “relative quantity” levels and “placard/ID number” levels for HazMat quantity and classification data, respectively, reported significantly higher data usability versus other levels for roadway, railway, and pipeline modes.
2.4.4 Validity of HazMat CFS Data
More than half the HMCFSs are validated by active review and discussion, while a fifth are actively “compared” or “analyze or evaluate” the data collected. Passive validation through distribution of results, implementation of plans, response, and training comprise a third of the CFS each. In responses to an open-ended question, a third of the LEPCs report that they use the HMCFS data primarily to “learn about HazMat,” and “planning,” and to a lesser extent (a fourth) to “guide training needs,” with only one-twentieth using the data for HazMat route designation. In a question about HazMat data applications where LEPCs had limited response options to those provided, over six-tenths reported using HMCFS data to “identify equipment needs” and “guide emergency response training,” while one-fifth reported using the data for “designating HazMat transportation routes.” This pattern suggests that HMCFSs are validated in terms of face-validity and used for hazardous materials concerns across the a wide range of applications—from planning and training to equipment purchases but to a lesser degree for HazMat route designations.
80
2.4.5 Implementation of HazMat CFS Data
While HMCFSs are reportedly vital for improving understanding of the hazardous material problem in the community, the distribution of documentation is mostly internal. Half of the LEPCs reported that their HMCFS improved emergency responder and school officials’ understanding of HazMat transport issues, and more than two-thirds of them report that the HMCFS improved public officials understanding of the hazardous materials issues in the area. However, only one-third of LEPCs report distributing it to county officials directly, and one-fifth report sending it to city officials. Moreover, less than one-tenth distributed their HMCFS to the public. This pattern of response indicates that while LEPCs recognize the utility of the HMCFS to educate their constituents, including local officials, emergency responders, school officials, and the public at large, they frequently do not report actively distributing the HMCFS data to these audiences. This pattern reflects missed opportunities to improve understanding among critical stakeholders.
2.4.6 Focus of HazMat CFS Efforts
Most LEPC responses mirror a focus in the existing HMCFS Guidance on attaining data, with a far more limited attention to understanding what data are sufficient to meet local needs, or how maximum information may be gleaned from current data. LEPCs’ HMCFS efforts are most often focused on what was done to collect the data, and specific findings for sites observed directly. It appears that far fewer LEPCs emphasize the selection of data to be attained, the validation and analysis of that data once attained, or the distillation of the data into actionable information for local officials. The distribution of the information or knowledge gained to the broader community of interest or even future generations of their own organization reportedly receive far less attention. This deeper understanding of the HMCFS data is critical for organizational continuity and community resilience.
81
CHAPTER 3: HMCFS CASE STUDIES Following the survey, seven case studies were selected to describe how HMCFS have
been conducted for local jurisdictions. The case studies cover a range of jurisdiction sizes (very small to very large) and regions (East Coast to West Coast).
The case study identification process followed multiple avenues. First, an Internet search was conducted for HMCFS postings by LEPCs. In addition, survey results were evaluated to identify around 50 LEPC who indicated higher levels of HMCFS usage and confidence in data across jurisdiction sizes. Copies of these LEPCs’ HMCFS were requested for review. Although most LEPCs indicated a willingness to provide copies of their HMCFS documents, only a small number from this set, around a dozen, actually provided the HMCFS documents. Reasons for this lack of response were generally not provided, and the research team believes this may have occurred because of concerns for document scrutiny, inability to obtain LEPC approval for document release, or competing priorities for providing the information. Overall, approximately 25 HMCFS from different sources were reviewed. The HMCFS case studies are presented here by year conducted (oldest to newest) and represent better practices among those HMCFS that were reviewed.
3.1 CASE STUDY 1
LEPC Location: Midwestern U.S.
LEPC Population: Less than 100,000 people
HMCFS Year: 2000
3.1.1 Overview
This LEPC is located in southern Indiana on the banks of the Ohio River. It is traversed by an Interstate highway and several U.S. and state roadway routes. Several railroads pass through the study area including Class I railroads.
3.1.2 Commodity Flow Survey
This LEPC worked jointly with another LEPC to initiate research into HazMat transport within its jurisdiction as part of a continuing effort to update and improve the understanding and emergency planning activities as well as developing a relative risk assessment for the major county highways. Resources for the study consisted of USEPA grant money through the Indiana Department of Environmental Management. A consultant was hired to help conduct the project.
82
The HMCFS was based on similar prior studies conducted in five neighboring Indiana counties. Their results, along with the results of the CFS conducted in 1994 in Tulsa County, Oklahoma, were included and presented in the same format in the project report in order to compare findings. The Tulsa County CFS had compared findings with prior HMCFS from Oregon, Nevada, Utah, and Florida. It had also utilized TRANSCAER®’s guide and the U.S. DOT’s Guidance for conducting HMCFS.
For highway, HazMat trucks were counted by consultant staff at 11 sites on major highways in the county, one of which was at a weigh station because high traffic volume inhibited clear view and reading of placards from the roadside. Data collection was conducted by one person, in two periods of 2-hour shifts, over two days, and both traffic directions, except at the weigh station where two 8-hour shifts, one at the Northbound and one at the Southbound scale took place. The process was similar to the one followed by the five neighboring counties and Tulsa County. All their results were included in the same format for purposes of clear comparison.
Data collected included the number of total and HazMat trucks, placard numbers, and UN numbers. A listing of railroad HazMat data was requested and supplied by CSXT and other railroad companies (included in the HMCFS appendix). Marine data consisted of commodity tonnage, number of barges, and description through the two Ohio River locks in the area by direction. Even though they were no major concerns to the DOT they were also included in the HMCFS appendix.
It was found that roughly five percent of all commercial truck traffic carried HazMat. Almost 60 percent of the placards involved Class 3 Flammable Liquids and almost 13 percent were Class 8 Corrosives, with the remaining classes complementing the total. The results are displayed in tables and bar graphs showing the total number and percent of both total trucks and placarded trucks by site; and number and percent of HazMat placards observed by class and UN numbers within each.
The Tulsa HMCFS is included in the HMCFS report, apparently in its entirety, to point out that trends are likely to be similar between the two. A sophisticated risk assessment was performed in the Tulsa HMCFS. Census tract maps were overlaid on highway maps and the at-risk population within a 1-mile radius from a 1-mile segment of each highway, i.e., people per sq.mi. was estimated (hotspots analysis). PHMSA HMIS incident data were examined and enabled calculation of the probability of an incident per million miles. The two were multiplied and a relative risk index for each highway segment was calculated. Additional data consisted of HazMat and EHS rail shipments, as well as PHMSA HMIS incidents for rail.
83
3.2 CASE STUDY 2
Peninsula LEPC (York County and Cities of James City, Hampton, Newport News, and Poquoson), Virginia
LEPC Population: More than 100,000 people
HMCFS Year: 2002
3.2.1 Overview
The Peninsula LEPC region comprises a largely urban area, nearly 400,000 people, with two major highway routes traversing it, I-64 and US 17, and one main rail line, owned by the CSX Railroad.
3.2.2 Commodity Flow Study
The purpose for conducting the HMCFS was to identify which hazardous materials (focusing on EHSs) were frequently shipped in large quantities to, through, and within the four jurisdictions by air, rail, road, waterway, and pipeline, and the main routes used, where applicable. The ultimate purpose was planning for emergency preparedness by the four local governments. Funding for the HMCFS was provided by a U.S. DOT Research and Special Programs Administration (RSPA) grant, coordinated by the Virginia Department of Emergency Management, and managed by the Peninsula LEPC. A university was hired to help conduct the project.
A questionnaire was developed in an attempt to collect data on the amounts and frequency of HazMat shipped, as well as the routes used, and sent to authorities, e.g., Virginia DOT, Department of Environmental Quality (DEQ), and fixed facilities/HazMat shippers. The method worked better for obtaining information from pipeline companies, but not for other modes because of data unavailability (inexistence) or inaccessibility (proprietary). New data were not physically collected, rather already existing data were obtained, compiled, and analyzed.
For highway, HazMat truck inspection data for two tunnels, and a total of four inspection stations (two for each tunnel by direction) were obtained from the Virginia DOT. Distributions were developed to show HazMat classes by site, and by week and weekday. For railroad, HazMat info was requested from CSXT but it only consisted of HazMat names, and no quantities, frequencies, or origins-destinations. The potential risks associated with each HazMat transported by rail are elaborated upon in the text. For marine, the only available data were a list of HazMat stored in the terminal on a single day, provided by terminal management, as HazMat data were deemed either proprietary or unavailable by the Virginia Port Authority and Coast
84
Guard. Distributions were developed for the terminal HazMat showing percentages of materials by characteristic, e.g., flammability, toxicity, gaseous, etc. For pipelines, it was recognized that incidents only occur if they are ruptured by excavation. Pipeline companies provided the HazMat flowing through their pipelines, and the ranges of flows and pressures. It was found that there were no HazMat cargos transported through the local airport.
The project report (22) included a discussion on the data limitations (proprietary or unavailable) associated with military installations, railroad, and marine, as well as the limited time period for which highway data was available. Recommendations included better overall tracking of HazMat movement data through logistical or technological means, and subsequent data entry into corresponding databases, in order facilitate future analyses. The HMCFS appendix includes a sample questionnaire, and maps of the area showing the main HazMat routes by mode, as well as the bridges, tunnels, etc. used in the study.
3.3. CASE STUDY 3
LEPC #3 (Southern Windsor County/Southern Windsor County Regional Planning Commission), Vermont
LEPC Population: Less than 100,000 people
HMCFS Year: 2006
3.3.1 Overview
Vermont’s LEPC #3 comprises 478 sq. mi. and 13 towns with a total population of around 40,000 people. The region is largely undeveloped or sparsely developed. Major highway routes in the area include I-91, I-89, and several state routes. Three rail lines traverse the area as well.
3.3.2 Commodity Flow Study
The LEPC was concerned about traffic disruptions and threat to public safety due to highway hazardous materials vehicle accidents and spills, as well as contamination of the local watershed—the source of drinking water—brought about after a derailment in 2001, which dumped thousands of gallons of diesel fuel into the Connecticut River. The LEPC’s goal through conducting the HMCFS was to verify their beliefs, i.e., that most of the HazMat transported through their area were motor vehicle fuels (diesel and gas) and heating fuels (oil and gas), or alert them to those hazardous materials being transported of which they were not aware in order to identify major concerns for emergency responders and planners.
85
Resources consisted of grant money from the SERC under the HMEP along with in-kind matching through community volunteer labor hours and driving costs to the data collection sites. The LEPC did not include fixed Tier II facilities in the HMCFS, although it possessed the information. It instead focused on HazMat on highways and railways.
The HMCFS was conducted in April–May 2006 and included over 167 total hours by 10 volunteers comprising members of the LEPC and a Community Emergency Response Team (CERT). The method used was observation and recording of information, both for rail traffic, and for motor vehicle (truck) traffic on selected highways and intersections within the region. Points of observation were chosen carefully in an effort to optimize data collection with regard to personal safety. Rail observation points consisted of rail yards, depots, and track sidings. Highway observation points consisted of interstate rest areas, truck stops, parking areas, and highway intersections. Pertinent information recorded included rail car or trailer body type and placard number.
Data collectors were trained beforehand to use the Emergency Response Guidebook (ERG) HazMat placards, rail car types, and truck body types and note the corresponding numbers on the data collection forms. The EPA’s Hazard Analysis on the Move was previously studied and used for guidance. The BTS 2002 CFS data for Vermont was used after the study was completed to verify that the local data were consistent with the state data. In addition, high crash location data in the region were obtained from readily available state DOT reports, and four years of HazMat incident history listings were supplied by the Vermont Emergency Management.
The LEPC had a good understanding of their effort’s constraints and limitations. They made a point to evaluate and list the primary and secondary impacts due to a HazMat incident with respect to people, property/environment, and the economy. Once the flow study was completed it was distributed to all of the emergency management people in the various towns that are covered by the LEPC. The commodity flow study was also used as a reference in drafting emergency plans.
The HMCFS report (23) included several relevant appendices, i.e., the BTS 2002 CFS data for Vermont, typed data sheets, ERG figures showing HazMat placards, railcar and truck body types and codes, and an area map with rail and highway routes. The report also included conclusions and recommendations on several possible/future uses of findings included local disaster mitigation planning, especially for worst case scenario, around schools and other high risk areas, evacuation plans, shelters, public building and infrastructure planning, and HazMat incident containment. The latter specifically called for a refresher of ERG procedures for the identified HazMat, and emergency response training, planning, exercising, equipment, and personnel.
86
3.4 CASE STUDY 4
Lewis/Upshur Counties, West Virginia
LEPC Population: Less than 100,000 people
HMCFS Year: 2006
3.4.1 Overview
The Lewis/Upshur Counties LEPC covers two counties with a total land area of 737 sq. mi. and population of 40,911, located in north central West Virginia. The region is characterized by steep topography in a rural setting. Two major highway routes traverse the area, I-79 in a north-south direction, and US 33 in an east-west direction.
3.4.2 Commodity Flow Survey
The HMCFS was conducted in the context of various hazard analyses and risk assessments, which are part of comprehensive emergency response plans established by the West Virginia Code in implementation of the EPCRA. The study findings were intended for use in HazMat incident prevention and mitigation efforts. Resources consisted of grant money from the SERC under the HMEP along with community volunteer labor hours, who were members of both counties’ CERTs. A consultant was hired to help conduct the project.
Prior to the HMCFS, a uniform questionnaire was developed to solicit information on HazMat at fixed facilities in both counties. Despite the low response rate, responses were comparative to ones received during the previous (1999) HMCFS conducted by the LEPC. Each responding facility in the 2006 HMCFS was also described in the project report.
The LEPC consulted their 1999 HMCFS, which made clear that local railroad freight consisted of practically 100 percent coal, hence the railroad mode was excluded from the 2006 HMCFS, as were navigable waterways because they simply did not exist in the area. The area did contain natural gas pipelines, which were considered outside the scope of the HMCFS. The steep topography of the area was recognized as a factor that inhibited heavy truck movement. National data on HazMat incidents readily available from PHMSA were examined by mode, cause, HazMat class, and consequence. The national incident data were compared with state HazMat truck incident data posted by the West Virginia DOT and the two were found to be largely in agreement. State crash data already prepared by the WVDOT were analyzed by route, county, as well as deaths, injuries, and damages. The national 2002 Commodity Flow Survey for commodity shipments originating in West Virginia was visited to provide a pre-indication on modal split and was found to largely agree with local experience.
87
Data collection was methodical. Five sites were chosen, on the two major routes, in both directions, ranging from exits, to rest stops, to intersections. Five day and night shifts took place on the same day along I-79 and US 33. Each shift consisted of multiple continuous hours and was manned by two-person crews (observer and recorder).
Recorded data included placard number, truck body type, and total traffic volume. The latter were recorded in order to compare it to total HazMat traffic and determine the probability of crashes with the aid of the state crash data. Special attention was paid to reporting the Extremely Hazardous Substances (EHS) recorded and the percent of EHS-trucks versus non-EHS trucks.
The discussion of findings included confirmation and/or deviation of study findings with respect to national trends. Similarities/differences between HazMat transported on highway and HazMat in fixed facilities were noted in the conclusions. Recommendations for the future were thoughtful, valuable, and detailed, i.e., what to do better or different next time around, how to use the results of the study further. They included updating the study on a regular basis, comparing it to ones done by neighboring counties, expanding the number of data collection sites, including rail and pipeline, conducting in-depth vulnerability and risk assessment, enhancing emergency response, developing a database of fixed facilities, standardizing data collection methods, and expanding the number of industries surveyed. In fact, subsequent to the effort, the LEPC also used information from the study to develop a risk/vulnerability analysis for their transportation routes and fixed facilities.
The data collected by the volunteers were provided to the consultant for final analysis and assimilation into a report (24). Appendices included lists of HazMat and EHSs observed in transportation and present in fixed facilities, reportable and threshold planning quantities for EHSs, photos of the data collection sites, and typed data sheets from site observations and facility surveys.
88
3.5 CASE STUDY 5
Arizona SERC and five LEPCs (Apache, Gila, Graham, Greenlee, and Navaho), Arizona
LEPC Population: Less than 100,000 people
HMCFS Year: 2008
3.5.1 Overview
The study area included portions of five counties in central/eastern Arizona, a largely rural area. A large percentage of the total land area considered is Indian Reservation land. The study focused on the US 60 and US 70 corridors along which several large communities were located and the rail lines that run parallel or across them. US 60 is the major corridor between the Phoenix metropolitan area and New Mexico, carrying a significant volume of commercial trucks, especially ones related to the mining activity in the LEPC’s area. US 70 also leads to New Mexico and is especially used by private vehicles en-route to state parks.
3.5.2 Commodity Flow Survey
This HMCFS was conducted to provide accurate information to federal, state, and local officials, to make informed decisions resource allocation, and better manage the flow of hazardous materials in the study area. The HMCFS was also to provide insight to appropriate entities (e.g., fire departments) in order to enhance emergency response and disaster preparedness for incidents.
The study was completed in two phases that encompassed HazMat transportation by truck and rail—the two primary modes of goods movement in the area. The study focused on the US 60 and US 70 corridors, including arterial highways, and rail lines running parallel or across them (i.e., Arizona Eastern Railway and Union Pacific Railroad).
Resources consisted of grants from the PHMSA’s HMEP Program and the U.S. Department of Homeland Security to the Arizona SERC. A consultant was hired to help conduct the project.
The LEPCs considered the involvement of all stakeholders in all stages of the study crucial to ensure the study’s goals were met and assure quality control of the contractor’s work. As a results, a kick-off meeting was held prior to commencing the study to obtain feedback from stakeholders, including SERC, County Emergency Management, Department of Public Safety (DPS), EPA, fire department, and industry. An interim stakeholder meeting was also held to discuss the status of the placarded truck surveys (e.g., revise data collection sites and proposed modeling methodologies).
89
Tier II information previously requested by AZSERC from fixed facilities was reviewed. It consisted of the facility name and description, HazMat name and chemical description, physical/health hazards, number of days on-site, maximum and average amounts on-site, etc.
The highway HazMat truck analysis reviewed Arizona DOT traffic counts (AADT) and Automatic Traffic Recorder data for all traffic and truck traffic levels along the corridors over various durations. Incident data from the National Response Center and the state DEQ were reviewed. The railroad analysis reviewed the FRA Office of Safety Analysis’ accident databases for railroad accidents that resulted in an HM release. Between 1999 and 2007 there were 13 highway incidents and two rail incidents that resulted in a HazMat release.
Data collection on highways consisted of HazMat placarded truck surveys in March 2008, at a total of 13 sites, 1–2 days per site, over 12-hour shifts, including three night shifts. Data were recorded in 30-minute intervals and included the total number of trucks passing the survey points, number of placarded trucks, placard type and number, and placarded truck type.
Two railroads parallel and/or cross the US 60/70 study corridors: the Arizona Eastern Railway and the Union Pacific Railroad. They provided HazMat type, quantity, and frequency information on HazMat transported along the corridors.
The results were illustrated in the project report (25) in the form of bar graphs and pie charts showing number and percent by direction of total trucks versus placarded trucks by direction; class and division of placards; and placarded truck type. It was found that percentages of placarded trucks varied greatly by corridor. Also, 13 different hazardous materials were recorded with variations by corridor. Almost all trucks in both surveyed corridors were 5-axle tank tractor-trailers.
Computer modeling using EPA’s Area Locations of Hazardous Atmospheres (ALOHA) model along with the 2004 Emergency Response Guidebook were used to determine impact radii (evacuation distances) in the event of a spill or release of any of the typical hazardous materials observed along the corridors. The results were used to delineate areas of concern along the corridors and overlay them with high-risk areas identified.
The risk and the consequence of a HazMat spill in the proximity of high-risk areas (e.g., schools, hospitals, environmentally sensitive areas, waterways, and habitats of endangered species), were explored and described in the report. Maps based on the Census 2000 Tiger/Line files identified high risk/environmentally sensitive areas and transportation networks (hotspots).
Future development/industries in the area that had the potential to increase HazMat flows were briefly discussed. Recommendations on areas of improvement in conducting future CFSs included more attention to statistical significance through increasing consecutive data collection periods and durations, number of sites, and seasonal repetition. A recommendation to improve
90
the general understanding of HazMat moving along the transportation corridors in the area was the periodic, comprehensive inspections of trucks including paperwork and loads at various locations and of adequate duration in order to yield a statistically significant sample of HazMat moving through the area. Several appendices contained detailed data and results stemming from all sources examined, e.g., site maps, Tier II facilities and information list, number and percent of all-trucks and placarded trucks by site and direction, placarded truck types by site, etc.
3.6 CASE STUDY 6
Cambria County, Pennsylvania
LEPC Population: Greater than 100,000 people
HMCFS Year: 2008
3.6.1 Overview
Cambria County is located in the southwest-central section of Pennsylvania and is approximately equally rural and urban. It consists of 703 sq. mi. and 63 municipalities and is of semi-mountainous terrain. Major highway routes include U.S. and state routes, running east-west and north-south. The major rail route belongs to Norfolk Southern (NS). The area’s waterways do not support commercial marine transportation.
3.6.2 Commodity Flow Survey
This LEPC has been conducting an HMCFS on an annual basis for the last 12 years (most recently in 2008). The purpose stated in the most recent HMCFS document was the emergency preparedness plan annual update for the 12th consecutive year, i.e., identify response needs and concerns, and enhance education and awareness.
Resources consisted of an HMEP grant and community volunteers, whose labor and other related expenses constituted the local match value. The LEPC received a small amount of funding reimbursement from the grant.
Historic data for all of the LEPC’s previous HMCFSs are included in the 2008 HMCFS report (26). For example, the top five hazardous materials transported by highway, and the top 15 hazardous materials transported by rail are listed. A good county profile is presented, describing demographics, economics, special populations, parks, etc.
For highway counts, the LEPC is limited to going out about 40 times per year and performing counts on highways. Local emergency management employees also count and mark down HazMat observations when they are “out and about.” Although the LEPC recognizes that this method is not as consistent to obtaining specific counts per hour, they feel that this method

91
helps them get a good idea of what is going up and down the roads in their jurisdiction. The participation it engenders has positive benefits as well.
For rail data, the local emergency management office is located near train tracks, and since the trains have to slow down there, it is an easy place to do counts. Emergency management staff perform railcar counts 3 to 4 hours per day approximately eight times a month during busy season of June–August and 3 to 4 times per month April–May and September–October. In 2008, they counted 144 trains. Staff members take laptop computers and other work they can do in a vehicle and locate the vehicle at the railroad locations for these field operations. When a train comes they perform the count.
The LEPC also surveys SARA facilities in conjunction with annual emergency plan updates. By talking to plant managers, the LEPC verifies shipment types that are coming and going to and from facilities, as well as HazMat vehicle/placard counts made during previous years. The most common hazardous materials stored by facilities were also identified in the HMCFS. All SARA facilities in the county receive HazMat shipments via highway. Pipelines and the hazardous materials flowing through them were also listed by a pipeline company. The highest volume commodity was natural gas, while the number one cause of pipeline incidents was excavation.
No particular hotspot analysis or map overlay was indicated in the HMCFS document. Risky populations (e.g., schools, prisons, hospitals) are described in the county profile. The HMCFSs are used to make sure training is relevant and to verify that proper equipment is purchased (in some instances the HMCFS is used as justification). The HMCFS is also distributed to county police and fire department so they have an idea of what is being transported on roads and rail within their jurisdiction. In the most recent year the LEPC added a chemical profile sheet for the top HazMat combining rail, highway, and fixed facility that were present in their jurisdiction.
92
3.7 CASE STUDY 7
LEPC: Victoria County, Texas
LEPC Population: Less than 100,000 people
HMCFS Year: 2009
3.7.1 Overview
Victoria County is located in the south-central portion of Texas and is approximately equally rural and urban. It consists of nearly 900 sq. mi. and 20 communities. The topography is gently sloping plains. Major highway routes include U.S. and state highway routes, running east-west and north-south. The primary community of 60,000 people is in the middle of the county and is the intersection for three U.S. highways, two of which (US 59 and US 77) serve as major coastal corridors. The major rail route belongs to Union Pacific (UP), with The BNSF Railway and Kansas City & Southern Railway Company (KCS) operating by trackage rights over UP lines. The community has numerous pipelines and a waterway that supports commercial marine transportation.
3.7.2 Commodity Flow Survey
Victoria County LEPC conducted an HMCFS in 2009. The purpose of conducting the study was to develop a better understanding of HazMat transport in the county, identify changes to transport patterns since the LEPC’s previous HMCFS (1996), and consideration of HazMat routing.
Funding sources included an HMEP grant, in-kind match by the university-based state agency who assisted with the project, and in-kind match provided by the LEPC through volunteer hours. The Texas Division of Emergency Management administered the HMEP grant funds and monitored project performance. A university-based state agency was contracted to help conduct the project.
A county profile is presented in the project report, describing demographics, transportation and critical facility infrastructures, climate and weather, soil and terrain, and water resources. Transportation network maps for all surface modes and pipelines are included.
Most of the volunteer effort was for collecting information about roadway HazMat transport. The project focused on the two major U.S. highways that transect the county, and also included major arterials. Overall, over 330 hours of truck traffic observations were recorded for over 24,000 trucks at 16 different locations in the county (travel time and mileage to and from count locations were additional). The volunteer effort was coordinated by local (city and county)
93
emergency management agency. The LEPC was able to obtain a high level of involvement from community members, including staff from a regional hospital, industry, and emergency response agencies. The LEPC facilitated volunteer participation by providing data collection facilities (including a mobile command unit) for protection from summer heat, and scheduling volunteer participation for different times and locations to ensure a broad coverage of data sampling.
The data were collected using representative sampling for some roadways and cluster sampling for priority roadways. Traffic count periods ranged between 15 minutes and several hours. Trucks were counted by size (straight and tractor-trailer) and type (box van, refrigerated van, bulk aggregate tank, liquid tank, utility, flatbed, etc.). Placards were identified by the most specific information available and identifiable by data recorders, up to specific UN/NA placard IDs.
The traffic data were evaluated by the university-based state agency, and presented to the LEPC in a project report (27). The percentage of placarded trucks was summarized for different roadways, by truck size and type, HazMat class/division, the most frequent placards observed, and higher hazard materials placards observed including toxic inhalation hazard (TIH), violent polymerization, and water reactive placards. In addition, the percentage of corresponding 2008 ERG numbers based on observed placards was also presented. Initial response guidelines from the ERG were summarized for higher hazard UN/NA placard IDs that were observed.
The most frequent UN/NA placard IDs observed in the county were identified. Overall, over 2,250 placards were observed; there were 180 different 4-digit UN/NA placard IDs observed, along with other placards with less-specific information (e.g., “Flammable”, etc.).
In addition, daily truck traffic patterns were identified for major roadways where data supported development of that information. Between 10 and 12 percent of trucks on the major U.S. highways in the county were observed to have HazMat placards. Overall truck traffic was estimated to be approximately 3,000 trucks per day on these highways. The project results were validated by comparison with HazMat and truck traffic observations from an adjacent LEPC’s HMCFS, and with TxDOT truck traffic survey estimates. Because of different sampling locations and procedures, information that could be directly compared with the LEPC’s 1996 study and the TxDOT data was limited (the 1996 study counted only placarded trucks, not all trucks, and at different locations; the TxDOT study classified vehicles by weight and number of axles, not truck configuration or hazardous materials content). However, comparisons for some commodities were able to be made and it was also determined that overall placarded truck traffic also increased substantially. Truck incidents locations resulting in HazMat releases were identified and mapped based on information contained in a Texas Commission on Environmental Quality incident database and PHMSA’s HMIS database.
Data for transport of hazardous materials by rail were provided by the Class I rail carriers operating over UP trackage in the county and rail summarized by class and division for major
94
trackage segments, by annual number of carloads. Information was also summarized for TIH, violent polymerization, and water reactive hazardous materials, including number of carloads per segment and initial response guidelines.
Waterborne transport of hazardous materials were estimated from the USACE Waterborne Commerce of the United States, Calendar Year 2007, Part 2 - Waterways and Harbors, Gulf Coast, Mississippi River System and Antilles report. Materials transportation quantities are limited compared with those transported along coastal counties in the state. Pipeline maps were developed using PHMSA NPMS data for different commodity types, and pipelines were assumed to be full and operating (throughput was not evaluated).
Project results were distributed to emergency response and emergency management agencies, and the local metropolitan planning organization. The project results raised attention regarding placarding requirements relative to license and weight enforcement activities. The information will be used to identify whether modifications to local HazMat routes are needed. The project results will also be used to identify and document equipment and training needs for emergency response agencies, particularly those of smaller communities in the area.
3.8 CASE STUDY RECOMMENDATIONS
A review of the case studies presented here, and other studies that were not included revealed a wide range of practices by LEPCs for conducting an HMCFS. Recommendations based on common threads identifies in the case studies include:
Funding and staffing: • Utilize available funding resources for conducting the study, such as HMEP or
EPA grants. Be sure to understand grant requirements including tracking and reporting of volunteer effort.
• Consider multi-jurisdictional efforts to help distribute the effort and increase the relevance of project outcomes to multiple communities.
• Consider use of contractors for data analysis and reporting. If contractors are used, involve the LEPC in major aspects of the project.
• Utilize volunteer participation from community stakeholders, including emergency response, industry, and health professions, military personnel, business groups, and volunteer groups such as Community Emergency Response Teams or Citizen Corps Councils. Often volunteers who participate in collecting HMCFS data will identify aspects of HazMat transport to their professions they were not previously aware of.
• Maximize volunteer participation through training, scheduling, and providing data count supplies, facilities, or equipment.
95
Project planning: • Identify specific goals for the study in advance, for example confirming types of
HazMat transported, evaluating HazMat transport in specific risk areas, etc. • A HMCFS requires time and planning, which makes conducting one in short
timeframes less likely to be successful. Coordinating the project, especially volunteer data collection, requires advance planning and may involve delays due to weather, conflicting schedules, etc.
Using existing data sources: • Use existing local, state, and national information sources. While CFS from
jurisdictions that do not share common corridors may provide examples of how to conduct a study, those project results may have little relevance to HazMat transport in your community.
Data collection:
• Use multi-person teams for data collection on busy traffic corridors. Volunteer personnel time availability and attention for data collection may be limited to only one or two hours at a time.
• Collect data at locations where traffic is either slowed or stopped, such as truck stops, rest areas, license and weight facilities, or signaled intersections.
• Use the data collection effort as an opportunity to enhance emergency response training, such as responders’ familiarity with the ERG.
Validation: • Validate results across different data sources, including regional/state traffic data,
incident reports, and prior CFS conducted for the jurisdiction or surrounding areas.
• Consider CFS information in terms of the how reliable the data are and how they were collected (sampling and precision). Recognize limitations of the CFS. Information is typically a snapshot of HazMat transportation for specific times and locations. Transport patterns may vary widely by time of day, day of week, and season of year.
Presentation: • Present project results using a variety of formats, including tables, charts, graphs,
and maps. Cross-referencing of HazMat transport information with spatial and temporal data of sensitive areas can be used to identify risk hotspots.
Implementation: • Distribute the CFS to appropriate community stakeholders.

96
• USE IT. CFS information does little good if it just “sits on the shelf.” CFS information may be applicable to a wide range of applications. Consider potential applications for CFS information in addition to the project’s original goals and other than emergency management and response agencies.
• Conduct an after-action analysis to identify lessons-learned and potential modifications to future efforts.
• Plan for follow-on efforts to evaluate HazMat transportation in the community. Jurisdictions were able identify changes in HazMat transportation patterns by referencing previous studies. Do not wait too long to conduct subsequent studies.
97
CHAPTER 4: HMCFS OBJECTIVES HMCFS objectives reported by LEPCs (Figure 25, Figure 26) have been classified in
terms of their complexity (from least to most) as: Awareness and Minimum Training Scenario Definition, Maximum Training Scenario Definition, Emergency Planning, Comprehensive Planning, Equipment Needs, Resource Scheduling, Route Adjustment, and Legal Takings. Other HMCFS applications may coincide with these classifications. These objectives are used throughout the report as they apply to baseline and existing data, new data, data analysis, and HMCFS application. At different levels, these objectives can be used for strategic, tactical, and operational planning for emergency response, transportation, and broader community planning applications. The following sections describe these objectives in further detail.
4.1 AWARENESS
A frequent complaint by LEPCs and local planners is that local officials and the general public “don’t know and don’t care” about HazMat transport risks in their community, except when it “becomes a crisis.” Documenting HazMat risks, such as through an HMCFS, can highlight needs for attention to HazMat transport emergency planning and preparedness. At its minimal level, such documentation does not have to be extremely complex. Formally identifying that HazMat is present in the community can help draw attention to HazMat transport emergency preparedness needs and associated support resource needs (personnel, funding) that go with them.
4.2 MINIMUM TRAINING SCENARIO DEFINITION
Training for the safety of emergency responders and their ability to provide effective response is grounded in part on knowing what operational requirements are anticipated. At a minimum, identifying that hazardous materials are transported in the community can guide training scenarios, although scenarios that are developed with less-specific information may also be less likely to reflect actual operational conditions should they occur. In this report, both Awareness and Minimum Training objectives are grouped together and referred to as Minimum Training.
4.3 MAXIMUM TRAINING SCENARIO DEFINITION
As additional information about HazMat transport becomes available, the ability to develop operational scenarios based on traffic patterns, specific commodities, and specific locations and conditions becomes enhanced beyond that of knowledge of HazMat presence. Training can be focused to more specific risks—for example, intersections/choke points, time of day/year, and expectations for incidents involving certain commodities and vehicle types. This can include pre-incident tactical plans to identify who does what and where they are supposed to
98
be at a specific problem or location (28). In this report, this objective is referred to as Maximum Training.
4.4 EMERGENCY PLANNING
Understanding of HazMat transport risk is an important component for emergency prevention, protection, response, and recovery in many communities. While planning for HazMat transport incidents can be done with any level of knowledge, effective use of resources requires some level of detailed knowledge to avoid misdirected efforts. These strategic response goals also include identifying potential casualties, fatalities, property damages, financial losses, environmental harm, and community disruption associated with various response strategies. One type of emergency planning activity that LEPCs have reported using HMCFS information for is designing emergency warning and notification systems, and shelter-in-place procedures and necessary supplies. While the HMCFS can inform tactical decisions that select appropriate response tactics (28), effective tactical decision-making requires thinking ahead and planning various response options to assure that the resources for effective response (i.e., appropriately trained personnel and equipment) are available at the time and place they are needed. In this report, this objective is referred to as Emergency Planning.
4.5 COMPREHENSIVE PLANNING
Community comprehensive plans incorporate a broad range of information in the process of identifying community needs, prioritizing the order in which needs will be addressed, and defining the processes by which those needs will be addressed. For a variety of reasons, local and regional planners may focus on land use, development, zoning, transport corridor development, and environmental planning but fail to account for HazMat transport risks in these plans. Given the political and sometimes controversial nature of comprehensive planning, HMCFS information should be as specific and detailed as practicable to maximize usability and prevent criticism or dismissal of its value. In this report, this objective is referred to as Comprehensive Planning.
4.6 EQUIPMENT NEEDS
Stocking and maintaining adequate levels of equipment for HazMat transport incidents can be greatly enhanced by knowing how much of what type of HazMat is being transported in a community. Locating resources also is dependent on where those resources are needed. In addition, ability to acquire grant funds for needed equipment may be enhanced through a formal documentation and needs assessment, of which an HMCFS can be an important part.
Equipment can include not only reusable tools and materials but also expendable supplies. It may include things such as personal protective equipment; detection sensors; equipment for spill confinement and containment (e.g., tractors, dozers, etc.), neutralization,
99
extinguishing, and dilution (e.g., hoses, pumps, nozzles, tanks, vehicles, etc.), and decontamination and cleanup (e.g., showers, storage bags, etc.); and supplies for spill confinement and containment, (e.g., tarps, soil, drums, plugs/patches, etc.), neutralization, extinguishing, and dilution (e.g., foam, bases, water), and decontamination and cleanup (e.g., brushes, soaps, etc.). In this report, this objective is referred to as Equipment Needs.
4.7 RESOURCE SCHEDULING
HazMat transport patterns may suggest that risks of HazMat incidents may be particularly high at certain times of the day, or seasons of the year. These patterns may vary from location to location within a jurisdiction. Scheduling of resources (e.g., personnel, apparatus, equipment, supplies, etc.) to address expected risks provides a greater level of community protection. Adjusting resource levels according to risk can save scarce budget dollars, but requires more-detailed information to ensure that the risk/resource level is consistently applied. Understanding of resource needs will also assist logistics personnel with incident response should it occur. As with planning for emergency equipment needs, understanding of resources can also help a local agency understand whether assistance will be required from outside agencies and provide information regarding specific resource needs to assist with coordinating aid agreements (28). In this report, this objective is referred to as Resource Scheduling.
4.8 ROUTE DESIGNATION
Federal law authorizes states to designate highway routes over which transport of hazardous materials may be permitted or prohibited. Chapter 49, Part 397 (29) of the Code of Federal Regulations defines requirements for route designation, restriction, or prohibition for transport of non-radioactive hazardous materials (NHRM). As with comprehensive planning, HazMat route designation can be a very controversial topic for a community. HMCFS information should be at a high level of detail and specificity to maximize usability and prevent criticism or dismissal. The rules require consideration of type and quantity of hazardous materials that will be transported over specified routes prior to their designation. FHWA’s Highway Routing of Hazardous Materials: Guidelines for Applying Criteria (30) is one source of guidance for conducting a route assessment. The information collected for an HMCFS can directly support most of the 10 most important routing analysis considerations as rated by different states in those guidelines, including type of roadway, accident history, type and quantity of hazardous material, and amount of through routing. Other information that may be included in an HMCFS as discussed in this report includes population densities, locations of special populations, and locations of critical infrastructures. Further risk analysis can identify relative impact zones and risks for different hazardous materials. In this report, this objective is referred to as Route Adjustment.
100
4.9 LEGAL TAKINGS
As local entities implement comprehensive plans, properties may be restricted to uses compatible with those plans. Current owners may suffer a loss in opportunity costs. These legal takings often end in serious proceedings that can be quite costly (e.g., local entities sometimes condemn property for rerouting roads and intersections; one legal takings case recently appeared before the U.S. Supreme Court). Such land use designations are controversial in communities. HMCFS data are likely to require a high level of detail and precision to maximize utility, prevent criticism and hold up in legal proceedings. In this report, this objective is referred to as Legal Takings.
101
CHAPTER 5: EXISTING HAZMAT TRANSPORT DATA SOURCES Information about hazardous materials transportation comes from two types of sources:
existing data that have been compiled by private entities or local, regional/state, or federal agencies, and new data that have not previously been collected and compiled. This chapter focuses on existing data sources. Existing data can be used for both a baseline assessment of information that is readily available, and a formal, comprehensive review of existing data sources.
5.1 EXISTING DATA OVERVIEW
Existing data are information that have been previously collected and assembled. Since collection of new data can represent a substantial effort, existing data can represent a resource-saving source of information for local entities. However, a general disadvantage to existing data is that the data collection, analysis, and presentation were not conducted directly for the purpose they are immediately needed for (the HMCFS), and they may have limited applicability to current community needs depending on the source. Existing data include:
• locally or institutionally available data sources: o prior HMCFS that have been conducted by the LEPC; o HMCFS that have been conducted by other adjacent LEPCs or those that
share common transport corridors; o information maintained by local, state, or federal agencies; o information maintained by local HazMat facilities and carriers; o trade, environmental, and social advocacy organizations; and o printed maps and academic journals
• electronic databases and reports that have information about: o transportation networks; o commodity movements; o system performance (traffic) levels; o population and critical facility locations; o historical incident and accident occurrences and locations; and o contact information.
5.2 LOCALLY OR INSTITUTIONALLY AVAILABLE DATA SOURCES
5.2.1 Prior HMCFS
A prior HMCFS for a jurisdiction, if available, is an important baseline data source. Ideally, the HMCFS would be recent and specifically focused on HazMat transport over the corridors of concern. However, even an HMCFS that was not conducted recently can be useful for developing a baseline of existing knowledge.
102
Sometimes knowledge of existing resources may become lost, blurred, or develop gaps with changes in LEPC leadership and membership. This makes it important to thoroughly review previous documentation, especially if the LEPC has experienced recent turnover in membership. Information from a CFS that did not focus on HazMat transport, such as a general commodity flow study for a community or region, can also be useful to identify HazMat risks through general information about traffic levels, or areas of particular interest or concern.
5.2.2 Adjacent Jurisdiction/Common Corridor HMCFS
Jurisdictions that are adjacent or nearby and share common transport corridors are another good source of HMCFS data, one that is often overlooked. In many cases, adjacent corridors such as rural Interstate and major highways, railways, waterways, and pipelines, traffic levels and cargo characteristics are likely to be very similar unless there are major traffic diversion points or cargo sources and destinations between the data source location and that of the local interest.
5.2.3 Local and State Agency Data
Local and state planning and transportation agencies may also have information about transportation network, commodity movements, population demographics, and system information such as traffic levels. State transportation agencies conduct traffic counts, including truck traffic counts, which are used to provide information for federal transportation databases, and may have additional information available. Local and state emergency management, emergency response, and environmental agencies may have information about facility locations, incidents and accidents, and company contact information. Although an incident may not be required to be reported at the federal level, information is often required to be submitted to these agencies for HazMat incidents. In the absence of detailed agency records, historical newspaper reports may also provide incident information. Jurisdictions who are conducting an HMCFS should develop a list of local and state agencies to contact to identify what information may be available. Internet searches can help in this effort.
5.2.4 Information Maintained by Shippers, Receivers, and Facilities
Local shippers and receivers may maintain records about HazMat transport that can be used for an HMCFS. This data source may be particularly useful for HazMat transport that is within, originating in, or destined for a jurisdiction. These types of sources can include manufacturing facilities, petrochemical plants, hospitals, public utilities, public institutions (schools), and retail facilities such as fueling stations. Local entities may have a better understanding of local hazardous materials shipments than of those that are travelling through their jurisdictions. Shippers and receivers in a jurisdiction are either known or can be relatively
103
easily identified. Carriers serving these associated facilities can be identified through cooperation by shippers and receivers or may be known to law enforcement.
Facilities that store certain quantities of hazardous materials are required to report information under EPCRA (31):
The Emergency Planning & Community Right-to-Know Act Section 311-312 applies to any facility at which a hazardous chemical, as defined by the Occupational Safety and Health Act, is present in an amount exceeding a specified threshold. These facilities must submit – to the SERC, LEPC, and local fire department – material safety data sheets (MSDSs) or lists of MSDSs and hazardous chemical inventory forms (also known as Tier I and II forms).
Most states require the Tier II forms, and the reporting requirements vary from state to state, as individual states can implement reporting requirements that are more stringent than federal regulations—for example, whether or not fueling stations with storage capacities less than 75,000 gallons of gasoline and/or 100,000 gallons of diesel fuel are required to submit reports (32).
The list of facilities that report to the SERC, LEPC, or the local fire department under EPCRA is a readily available resource for identification of locations storing hazardous materials and potential incidents. While only facilities that store hazardous chemicals above certain threshold levels are required to report storage information, and not transportation information, it does provide local entities with a means to identify significant users of such chemicals. These users may also have information about what chemicals they ship and receive, including number of shipments and amounts for HazMat commodities. Local entities can contact these industries to request transportation information.
At the baseline level, reviewing facility information may simply mean scanning the available information or talking with facility operators, and developing an overview summary of the information. A detailed analysis of existing facility information may be very labor intensive, particularly for more industrialized jurisdictions, as it requires an identification of applicable facilities, contacting them, obtaining the information, and processing the information. Information provided may not be in a format that is readily usable for analysis; for example, requiring entry into electronic formats from paper copies. Further, these sources may choose not to provide information about HazMat transport or may not represent all of the facilities in an area that ship or receive HazMat commodities.
104
5.2.5 Information Maintained by Carriers
5.3.1.1 Roadway Carriers
Roadway carriers that operate within a jurisdiction may be well known to emergency responders, but carriers who operate mostly outside or through a jurisdiction may be difficult to identify because, although the primary transport routes connecting to and through the area are limited, the potential number of carriers is much greater. One possible solution for identifying roadway carriers is to work in conjunction with vehicle inspection agencies at stations through which commercial vehicles must pass. The American Trucking Association (http://www.truckline.com) and the National Tank Truck Carriers, Inc. (http://www.tanktruck.org) are trucking industry associations that maintain membership directories (available on their Web sites) that can be used to identify trucking companies and points of contact. The National Association of Chemical Distributors (http://www.nacd.com) currently represents several hundred chemical distributors including companies that process, transport, and market chemical products. These associations may also be able to provide information on HazMat transportation by truck that may be useful.
Identification of carriers that primarily operate through a jurisdiction can be more easily identified for railroad, pipeline, and waterway modes than for roadways since the number of corridors for these modes is more limited as well as the number of associated operators. Information sources for these carriers are described in the following sections.
5.3.1.2 Railroad Carriers
After identifying applicable railroad operators, LEPCs can request information regarding hazardous materials that are transported on segments in and through their jurisdictions. Major (Class I) railroads are part of the Association of American Railroads (AAR) and partners in the TRANSCAER® Outreach Effort (described in Section 5.4.1.1). AAR’s March 17, 2009, circular on Recommended Railroad Operating Practices for Transportation of Hazardous Materials recommends that AAR members, when requested, assist LEPCs in assessing hazardous materials movements through their communities and safeguards to protect unintentional releases, and assist LEPCs and community response organizations in developing emergency plans for coping with and preparations for responding to HazMat incidents (33).
Of particular note are requirements for official request using a standardized form, the sensitivity of the information and associated agreements for information application, and the conditional nature of the information as applying to particular snapshots in time that may not indicate future HazMat transport activities. Appendix F includes a copy of the request form from the circular. Railroads that are not part of the AAR may not be part of this program and may or may not provide information upon request.
105
HazMat transport data provided by most railroads is essentially a census of railcars at either the HazMat class or UN/NA placard ID levels for the most frequent commodities transported or all commodities transported on a segment or in a jurisdiction, over a time period such as a calendar year. The spatial distribution of rail traffic data may for specific segments or for the overall jurisdictional area, and the temporal distribution of rail traffic is almost certainly limited by time of day, day of week, and season of year.
The AAR also maintains statistics about railroad traffic levels, including number of carloads by type of railcar. These include chemical, boxcar, grain, intermodal, etc. As with truck tanks, railcar tanks may or may not be placarded depending on commodity carried or whether they are loaded or empty. Further, tank railcars are not the only ones that may be placarded. However, as with truck tanks, they represent by far the majority of placarded vessels transported by railways.
National-level statistics about railcar transport on a weekly basis are available from the AAR at http://www.aar.org. These can be used to provide a very general sense of the proportion of chemical railcars that make up overall rail traffic in an area; however, these data are highly subject to local and seasonal variations. For example, some regions may have very high levels of some types of rail traffic (e.g., coal traffic in the Powder Basin region, grain traffic in the mid-U.S., and chemical cars in petroleum refining regions) and very little of other types of traffic depending on the season and economic conditions.
5.3.1.3 Pipeline Operators
Once pipeline operators can be identified by using tools such as PHMSA’s National Pipeline Mapping System (NPMS) or local knowledge, a request can then be made of each point-of-contact regarding commodities transported in the pipeline. Gas transmission lines are straightforward (they carry natural gas), while liquid lines are more variable in commodities—from crude oil to gasoline to chemical feedstocks. The amounts of commodities carried are of less relevance than what is carried and the particular routes (and associated population or other jurisdiction characteristics) that may be impacted. In other words, it should be assumed if a pipeline is designated as carrying particular commodities that the pipeline is full and operational, and represents a release risk should the pipeline’s integrity be compromised.
5.3.1.4 Waterway Operators
Should an LEPC desire to contact individual waterway companies to request information about commodities that are carried, the USACE also publishes a Vessel Company Summary as part of its Waterborne Transportation Lines of the United States report, which can be found at http://www.ndc.iwr.usace.army.mil/veslchar/veslchar.htm. The summary lists vessel company names, contact information, commodities carried, locations of vessel operation, and operating
106
fleet size. Users can identify what companies may be operating in their areas, and what products they are carrying and whether they are likely to be hazardous. These companies can then be contacted to request information on specific commodities and tonnage carried during a specific timeframes, such as a previous calendar year.
5.3.1.5 Airlines
Even though transport of hazardous materials by air is limited compared with other modes, accounting for air HazMat transport can be an important part of the HMCFS for some communities. Other than aviation fuels, many airports do not maintain statistics on hazardous materials shipments through their facilities. This creates a challenge for obtaining existing information about hazardous materials transport by air. As with railroads, there are a limited number of air carriers that focus exclusively on freight transport. In addition, airlines focusing on passenger transport also handle air freight. The Cargo Airlines Association (http://www.cargoair.org) has nine all-cargo airline members, while the Air Transport Association (http://www.airlines.org) has 19 passenger and freight airline members. Neither of these associations have a mechanism such as through the AAR agreements by which LEPCs can request HMCFS information. Although companies may be contacted regarding hazardous materials shipments through airport facilities, they may be unwilling to provide such information due to proprietary or security concerns. Another source of information about air HazMat transport may be the International Air Transport Association (http://www.iata.org), a trade organization that sets guidelines and standards for the airline industry.
5.2.6 Proprietary Information
Many private or military information sources are sensitive to providing information that may affect public safety and security as well as proprietary concerns. Some of these entities will provide information for an HMCFS as “good corporate citizens.” Others may have reservations about doing so. For these, a request can be made such that the level of information reported for the HMCFS is at a more general level than providing information about specific commodities. While this does not provide information about specific hazards, it does at least provide some information. Another potential method is for an entity to provide information with the source or specific location of that entity redacted from the record, such that specific hazard information can be included in the HMCFS. As a quasi-public entity, LEPCs may or may not be subject to Freedom of Information Act requirements; ability for LEPCs to establish a formal legal mechanism that exempts the LEPC from disclosure requirements for proprietary information may be an option that must be validated through legal means if it is to be used.
In any case, obtaining information from sources that are hesitant to provide information may require some legwork on the part of local jurisdictions. It will also likely be difficult to implement for a single study and is probably more suitable for an HMCFS effort conducted over
107
several years, or continuously. This will allow for development of procedures to address disclosure requirements, identify shippers, receivers, and carriers, and bring these participants on-board for cooperation in the effort.
5.2.7 TRADE ORGANIZATIONS, ENVIRONMENTAL AND SOCIAL ORGANIZATIONS, AND ACADEMIC JOURNALS
5.2.7.1 Trade Organizations
HazMat manufacturing and transportation industry trade organizations have a vested interest in safe, efficient movement of hazardous materials, and can be sources of information about HazMat transport. Trade organizations include (but are not limited to) the American Chemistry Council (http://www.americanchemistry.com, formerly the Chemical Manufacturers Association), American Petroleum Institute (http://www.api.org), and American Coatings Association (http://www.paint.org), which maintain membership listings on their Web sites.
TRANSCAER® (Transportation Community Awareness and Emergency Response) is an effort that was started by the Chemical Manufacturers Association. The organization “is a voluntary national outreach effort that focuses on assisting communities prepare for and respond to a possible hazardous material transportation incident” (http://www.transcaer.com ) and is well known in the LEPC community as an important partner in emergency planning. In fact, TRANSCAER® has a Web page with guidance for planning flow studies and examples of HMCFS study results, which can be found at http://www.transcaer.com/resources/planning-flow-studies. As discussed in Chapter 2, LEPCs who reported using this source to guide their HMCFS reported a high level of data usability and confidence, even though only a small percentage of LEPCs reported using it for their HMCFS.
5.2.7.2 Environmental and Social Organizations
Environmental and social advocacy organizations focus on the conservation and preservation of the environment and equity and protection of people, including historically disadvantaged populations. These types of organizations may also have information on impacts of hazardous materials transport relative to population and ecological vulnerability and risks, and include (but are not limited to) the Sierra Club (http://www.sierraclub.org), National Resources Defense Council (http://www.nrdc.org), and Communities for a Better Environment (http://www.cbecal.org).
5.2.8 Academic Journals
Academic journals publish studies conducted by researchers, including college and university faculty members, government employees, and private sector employees including industry and consultants. Some of this research may specifically focus on transport of hazardous
108
materials, other research more generally on transportation and commodity movements. Although there are many academic journals, and those with information about hazardous materials transportation may include but are not limited to the Journal of Hazardous Materials, Transportation Research Record, Transportation Research (there are several parts), Journal of Environmental Planning and Management, International Journal of Risk Analysis, and Hazardous Materials Control. Access to academic journals may be through subscription, purchasing individual articles, Internet search engines, or through college and university libraries.
5.6 PRINT AND OTHER DATA SOURCES
Electronic database sources are useful for a range of applications, but they may not provide a level of information sufficient at the local level for some jurisdictions, and some of them require a high level of technical resources (e.g., ability, hardware, software) that prohibits their use. Other sources of transportation network information include print maps such as the Rand McNally Motor Carriers’ Road Atlas, available at retail outlets and on the Internet at http://store.randmcnally.com. Atlases such as these depict the legal weight truck route systems in each state. Print railroad system maps are available from DeskMap Systems, Inc. Pricing and map availability information can be found online at http://www.deskmap.com/railroad.html. In 2004, DeskMap Systems, Inc. published their 3rd edition of their Professional Railroad Atlas of North America, which includes state-level maps of railroad systems, including trackage ownership. They also have 2007 maps for selected U.S. states and regions, and also offer custom mapping to customer specifications. Pennwell Books’ MAPSearch (http://www.pennwellbooks.com/mapsearch.html) is a print mapping source for maps of pipeline systems. Print maps of waterway system can be ordered from the U.S. Maritime Administration on the Internet at http://www.marad.dot.gov/index.htm.
5.4 ELECTRONIC DATA SOURCES
Existing electronic data sources cover a wide variety of information areas. Table 20 lists electronic database and mapping sources, and Table 21 lists electronic reports and other documents. Both tables indicate the smallest jurisdictional size applicability by local (L), regional/state (R/S), and national (N) scale levels. Mode applicability is indicated for highways (H), railways (R), pipelines (P), waterways (W), airways (A) and other classifications (O). General relevance to local HazMat transport is indicated by low (L), medium (M) and high (H) levels. Check marks indicate that a source provides information about transport networks, commodity movements, general system information such as traffic levels, population and critical facility locations, incidents, and points of contact. Required technical expertise for using the information source is indicate by low (L), medium (M) and high (H) levels. Further notes about using the information source are provided. These databases and reports are further described in Appendices D.1 and D.2.
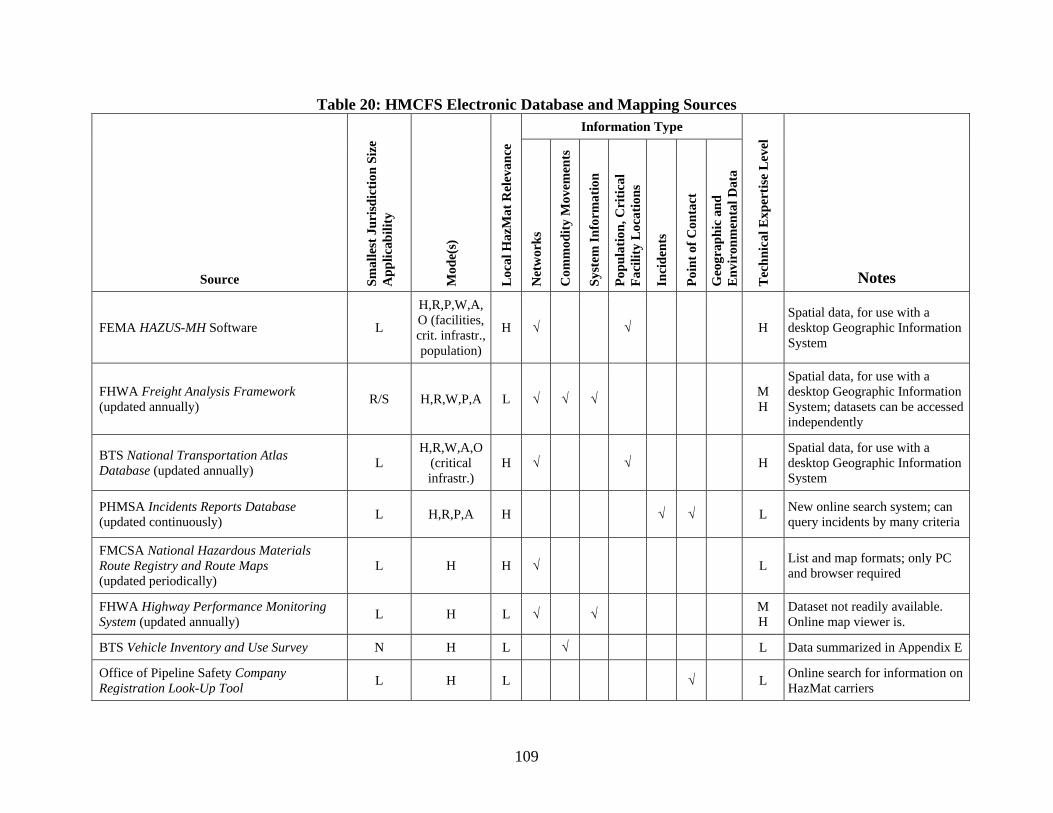
109
Table 20: HMCFS Electronic Database and Mapping Sources
Source Smal
lest
Jur
isdi
ctio
n Si
ze
App
licab
ility
Mod
e(s)
Loc
al H
azM
at R
elev
ance
Information Type
Tec
hnic
al E
xper
tise
Lev
el
Notes Net
wor
ks
Com
mod
ity M
ovem
ents
Syst
em In
form
atio
n
Popu
latio
n, C
ritic
al
Faci
lity
Loca
tions
Inci
dent
s
Poin
t of C
onta
ct
Geo
grap
hic
and
Env
iron
men
tal D
ata
FEMA HAZUS-MH Software L
H,R,P,W,A,O (facilities, crit. infrastr., population)
H √ √ H Spatial data, for use with a desktop Geographic Information System
FHWA Freight Analysis Framework (updated annually) R/S H,R,W,P,A L √ √ √ M
H
Spatial data, for use with a desktop Geographic Information System; datasets can be accessed independently
BTS National Transportation Atlas Database (updated annually) L
H,R,W,A,O (critical infrastr.)
H √ √ H Spatial data, for use with a desktop Geographic Information System
PHMSA Incidents Reports Database (updated continuously) L H,R,P,A H √ √ L New online search system; can
query incidents by many criteria
FMCSA National Hazardous Materials Route Registry and Route Maps (updated periodically)
L H H √ L List and map formats; only PC and browser required
FHWA Highway Performance Monitoring System (updated annually) L H L √ √ M
H Dataset not readily available. Online map viewer is.
BTS Vehicle Inventory and Use Survey N H L √ L Data summarized in Appendix E
Office of Pipeline Safety Company Registration Look-Up Tool L H L √ L Online search for information on
HazMat carriers
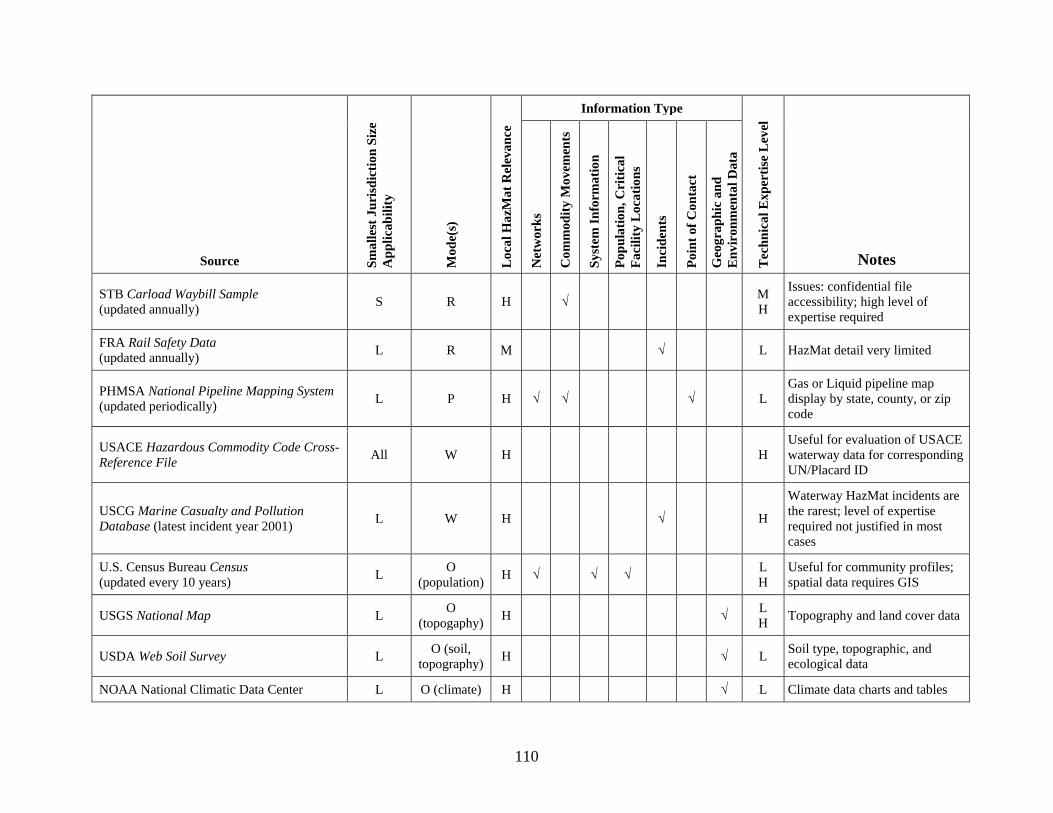
110
Source Smal
lest
Jur
isdi
ctio
n Si
ze
App
licab
ility
Mod
e(s)
Loc
al H
azM
at R
elev
ance
Information Type
Tec
hnic
al E
xper
tise
Lev
el
Notes Net
wor
ks
Com
mod
ity M
ovem
ents
Syst
em In
form
atio
n
Popu
latio
n, C
ritic
al
Faci
lity
Loca
tions
Inci
dent
s
Poin
t of C
onta
ct
Geo
grap
hic
and
Env
iron
men
tal D
ata
STB Carload Waybill Sample (updated annually) S R H √ M
H
Issues: confidential file accessibility; high level of expertise required
FRA Rail Safety Data (updated annually) L R M √ L HazMat detail very limited
PHMSA National Pipeline Mapping System (updated periodically) L P H √ √ √ L
Gas or Liquid pipeline map display by state, county, or zip code
USACE Hazardous Commodity Code Cross-Reference File All W H H
Useful for evaluation of USACE waterway data for corresponding UN/Placard ID
USCG Marine Casualty and Pollution Database (latest incident year 2001) L W H √ H
Waterway HazMat incidents are the rarest; level of expertise required not justified in most cases
U.S. Census Bureau Census (updated every 10 years) L O
(population) H √ √ √ L H
Useful for community profiles; spatial data requires GIS
USGS National Map L O (topogaphy) H √ L
H Topography and land cover data
USDA Web Soil Survey L O (soil, topography) H √ L Soil type, topographic, and
ecological data
NOAA National Climatic Data Center L O (climate) H √ L Climate data charts and tables
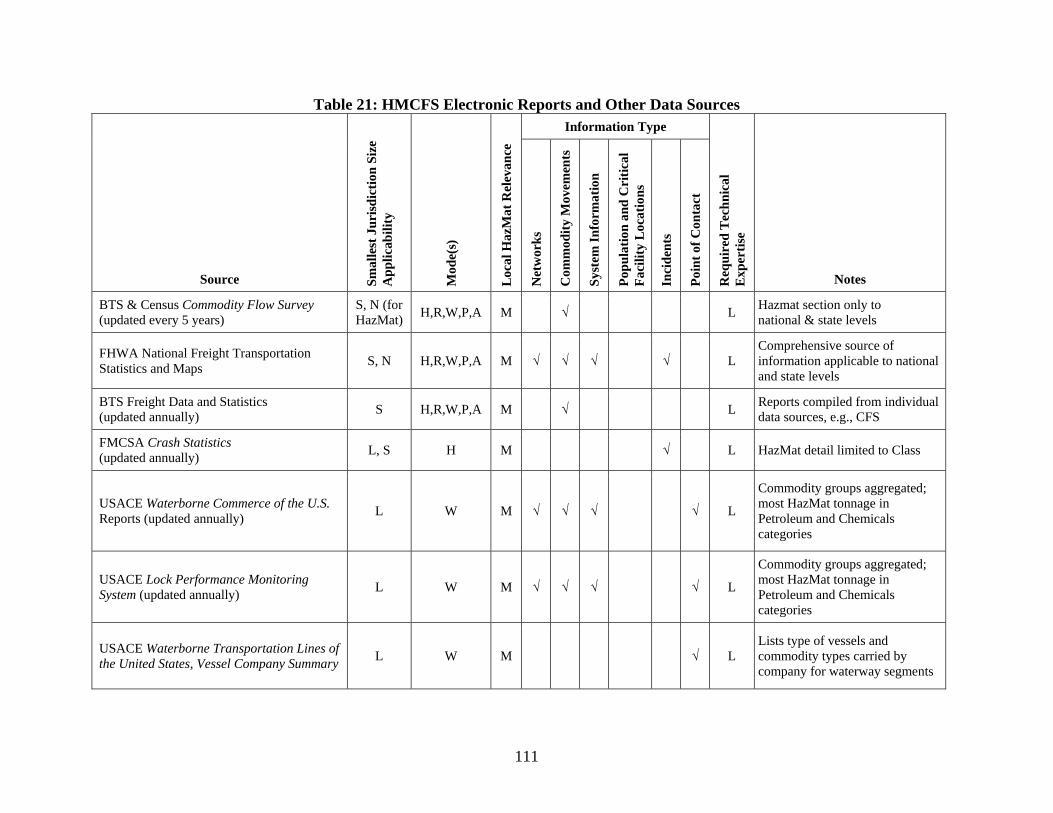
111
Table 21: HMCFS Electronic Reports and Other Data Sources
Source Smal
lest
Jur
isdi
ctio
n Si
ze
App
licab
ility
Mod
e(s)
Loc
al H
azM
at R
elev
ance
Information Type
Req
uire
d T
echn
ical
E
xper
tise
Notes Net
wor
ks
Com
mod
ity M
ovem
ents
Syst
em In
form
atio
n
Popu
latio
n an
d C
ritic
al
Faci
lity
Loca
tions
Inci
dent
s
Poin
t of C
onta
ct
BTS & Census Commodity Flow Survey (updated every 5 years)
S, N (for HazMat) H,R,W,P,A M √ L Hazmat section only to
national & state levels
FHWA National Freight Transportation Statistics and Maps S, N H,R,W,P,A M √ √ √ √ L
Comprehensive source of information applicable to national and state levels
BTS Freight Data and Statistics (updated annually) S H,R,W,P,A M √ L Reports compiled from individual
data sources, e.g., CFS
FMCSA Crash Statistics (updated annually) L, S H M √ L HazMat detail limited to Class
USACE Waterborne Commerce of the U.S. Reports (updated annually) L W M √ √ √ √ L
Commodity groups aggregated; most HazMat tonnage in Petroleum and Chemicals categories
USACE Lock Performance Monitoring System (updated annually) L W M √ √ √ √ L
Commodity groups aggregated; most HazMat tonnage in Petroleum and Chemicals categories
USACE Waterborne Transportation Lines of the United States, Vessel Company Summary L W M √ L
Lists type of vessels and commodity types carried by company for waterway segments
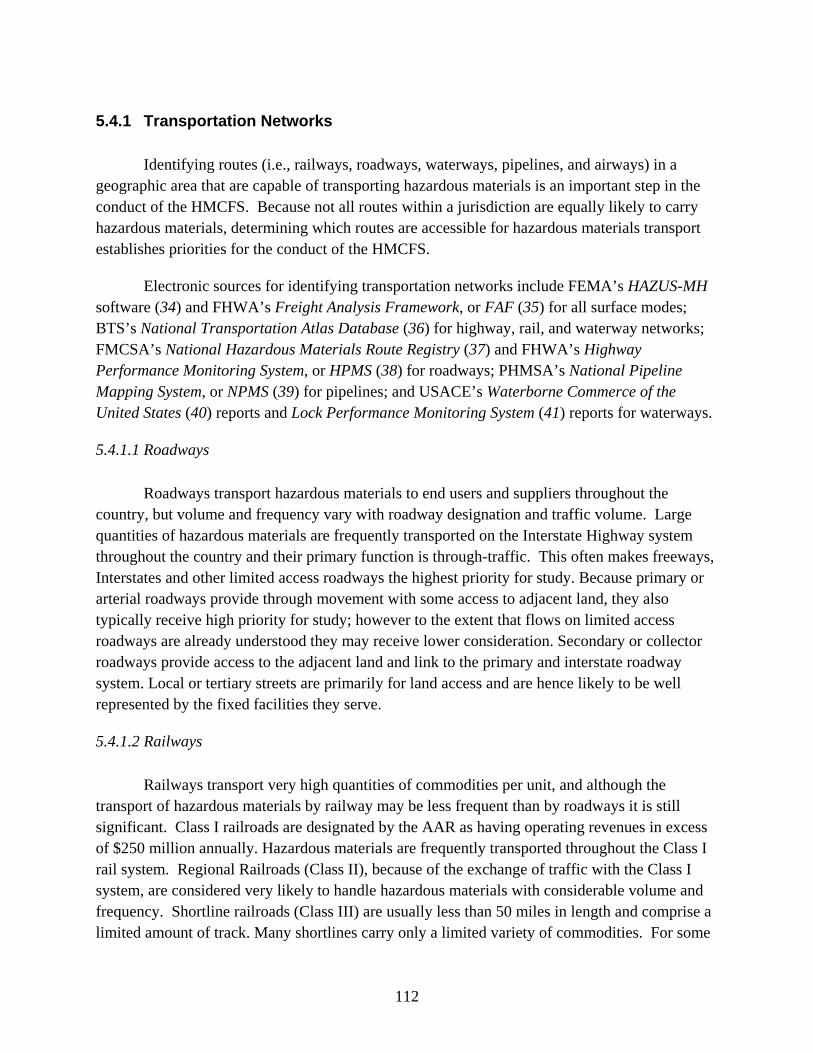
112
5.4.1 Transportation Networks
Identifying routes (i.e., railways, roadways, waterways, pipelines, and airways) in a geographic area that are capable of transporting hazardous materials is an important step in the conduct of the HMCFS. Because not all routes within a jurisdiction are equally likely to carry hazardous materials, determining which routes are accessible for hazardous materials transport establishes priorities for the conduct of the HMCFS.
Electronic sources for identifying transportation networks include FEMA’s HAZUS-MH software (34) and FHWA’s Freight Analysis Framework, or FAF (35) for all surface modes; BTS’s National Transportation Atlas Database (36) for highway, rail, and waterway networks; FMCSA’s National Hazardous Materials Route Registry (37) and FHWA’s Highway Performance Monitoring System, or HPMS (38) for roadways; PHMSA’s National Pipeline Mapping System, or NPMS (39) for pipelines; and USACE’s Waterborne Commerce of the United States (40) reports and Lock Performance Monitoring System (41) reports for waterways.
5.4.1.1 Roadways
Roadways transport hazardous materials to end users and suppliers throughout the country, but volume and frequency vary with roadway designation and traffic volume. Large quantities of hazardous materials are frequently transported on the Interstate Highway system throughout the country and their primary function is through-traffic. This often makes freeways, Interstates and other limited access roadways the highest priority for study. Because primary or arterial roadways provide through movement with some access to adjacent land, they also typically receive high priority for study; however to the extent that flows on limited access roadways are already understood they may receive lower consideration. Secondary or collector roadways provide access to the adjacent land and link to the primary and interstate roadway system. Local or tertiary streets are primarily for land access and are hence likely to be well represented by the fixed facilities they serve.
5.4.1.2 Railways
Railways transport very high quantities of commodities per unit, and although the transport of hazardous materials by railway may be less frequent than by roadways it is still significant. Class I railroads are designated by the AAR as having operating revenues in excess of $250 million annually. Hazardous materials are frequently transported throughout the Class I rail system. Regional Railroads (Class II), because of the exchange of traffic with the Class I system, are considered very likely to handle hazardous materials with considerable volume and frequency. Shortline railroads (Class III) are usually less than 50 miles in length and comprise a limited amount of track. Many shortlines carry only a limited variety of commodities. For some
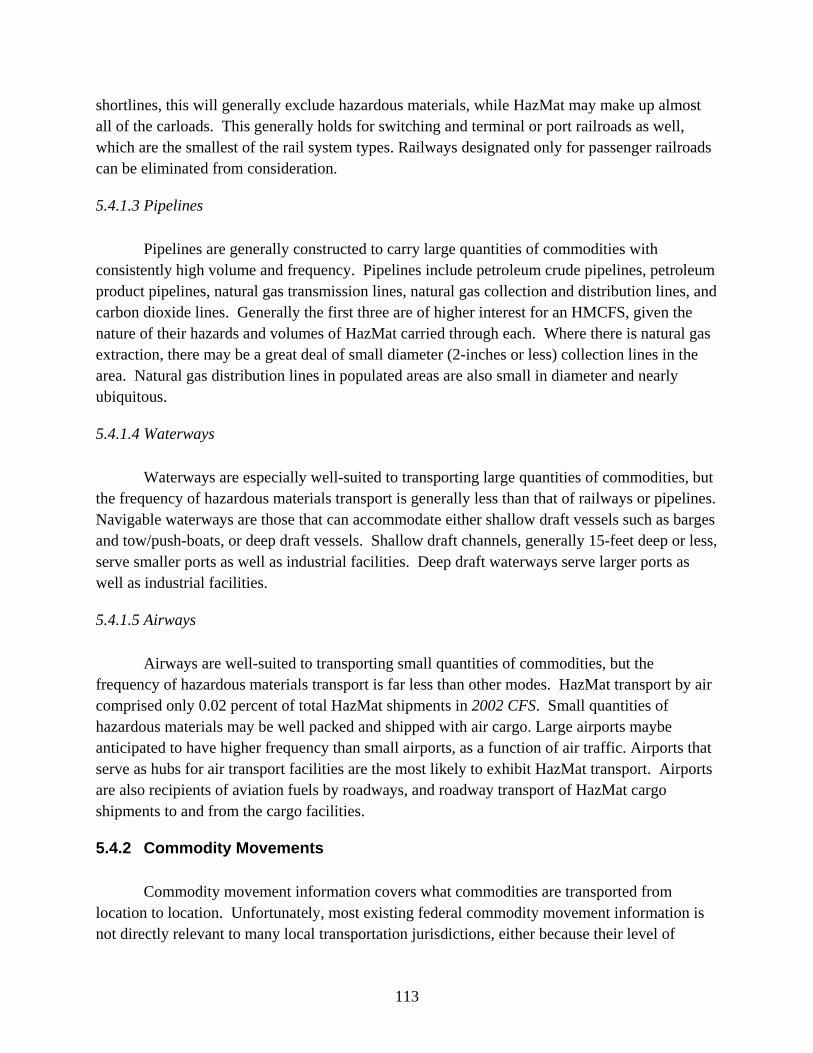
113
shortlines, this will generally exclude hazardous materials, while HazMat may make up almost all of the carloads. This generally holds for switching and terminal or port railroads as well, which are the smallest of the rail system types. Railways designated only for passenger railroads can be eliminated from consideration.
5.4.1.3 Pipelines
Pipelines are generally constructed to carry large quantities of commodities with consistently high volume and frequency. Pipelines include petroleum crude pipelines, petroleum product pipelines, natural gas transmission lines, natural gas collection and distribution lines, and carbon dioxide lines. Generally the first three are of higher interest for an HMCFS, given the nature of their hazards and volumes of HazMat carried through each. Where there is natural gas extraction, there may be a great deal of small diameter (2-inches or less) collection lines in the area. Natural gas distribution lines in populated areas are also small in diameter and nearly ubiquitous.
5.4.1.4 Waterways
Waterways are especially well-suited to transporting large quantities of commodities, but the frequency of hazardous materials transport is generally less than that of railways or pipelines. Navigable waterways are those that can accommodate either shallow draft vessels such as barges and tow/push-boats, or deep draft vessels. Shallow draft channels, generally 15-feet deep or less, serve smaller ports as well as industrial facilities. Deep draft waterways serve larger ports as well as industrial facilities.
5.4.1.5 Airways
Airways are well-suited to transporting small quantities of commodities, but the frequency of hazardous materials transport is far less than other modes. HazMat transport by air comprised only 0.02 percent of total HazMat shipments in 2002 CFS. Small quantities of hazardous materials may be well packed and shipped with air cargo. Large airports maybe anticipated to have higher frequency than small airports, as a function of air traffic. Airports that serve as hubs for air transport facilities are the most likely to exhibit HazMat transport. Airports are also recipients of aviation fuels by roadways, and roadway transport of HazMat cargo shipments to and from the cargo facilities.
5.4.2 Commodity Movements
Commodity movement information covers what commodities are transported from location to location. Unfortunately, most existing federal commodity movement information is not directly relevant to many local transportation jurisdictions, either because their level of
114
analysis is state or higher, and/or the aggregation of commodity groups limits identification of specific material hazards below class level. Electronic sources for commodity movements include FHWA’s Freight Analysis Framework, BTS’s Commodity Flow Survey and BTS’s Freight Data and Statistics (42) for all modes. The 2002 Vehicle Inventory and Use Survey, or VIUS, was conducted by the Bureau of Transportation Statistics (43) and includes information about hazardous material transport by different types of truck configurations. The data were compiled and summarized by TTI for this report (Appendix E), and can be useful for a general understanding of hazardous materials transport as well as used in conjunction with new data collection as discussed in Chapter 6. Other sources include STB’s Railroad Waybill Sample (44) for railroads and USACE’s Waterborne Commerce of the United States and Lock Performance Monitoring System reports, which can be used in conjunction with USACE's Hazardous Commodity Code Cross-Reference File (45) for waterways.
5.4.3 System Information (Traffic)
Transportation system information covers performance of the transportation network such as traffic levels on network segments. Although this is not commodity movement information, it can help to prioritize network components. Some sources may be based on model estimates rather than observation of traffic levels. Electronic sources of transportation system information include FHWA’s Freight Analysis Framework for all surface modes; FHWA’s Highway Performance Monitoring System for roadways (some of which is included in the National Transportation Atlas Database); and USACE’s Waterborne Commerce of the United States and Lock Performance Monitoring System reports for waterways.
5.4.4 Critical Facility and Population Locations
Fixed facilities that produce, store, or use hazardous materials can be identified by local industry partners and from Tier II Reports (also discussed in Section 5.2.4) or from spatial data found in the FEMA HAZUS-MH data sets. Hazardous materials may be transported by different modes to these facilities. Population centers, critical infrastructures, and future developments may be affected by or alter patterns of HazMat transport associated with such facilities. Understanding the proximity of population locations to facilities that transport hazardous materials, or the transport corridors that serve them, is an important part of a vulnerability and risk analysis for a community.
The occurrence of HazMat incidents is appropriately considered in light of the people who may be exposed as a consequence. Hence the HMCFS assessment considers potential populations exposed along HazMat flow corridors. Moreover, some populations are more vulnerable than others. At-risk residential populations consist of people residing in proximity to HazMat transportation routes. While residential populations are present throughout the week, day and night, they are subject to temporal patterns of work. For example, suburban communities
115
typically reach maximum populations from late evening to early morning, and minimum populations on weekday mornings. Retail and commercial populations may well have the opposite pattern.
Special populations are comprised of any populations that require special consideration to be appropriately protected. For example congregate care facilities, such as hospitals, nursing homes, day care facilities, and schools may require special arrangements to overcome populations with physical handicaps or may have reduced capacity to fully comprehend warnings. Prisons, juvenile detention centers, and other institutions of confinement may require special security arrangements. Any facility where large numbers of people congregate en mass, like stadiums, arenas, fair grounds, convention centers, auditoriums, and churches, may require special arrangements to accommodate the large numbers of potential exposures.
Electronic data sources with population information include FEMA’s HAZUS-MH database and the U.S. Census 2000 (46) database. Another source of local population demographic information can be found at http://www.city-data.com. BTS’s National Transportation Atlas Database includes critical facility information as well.
5.4.5 Geographic and Environmental Characteristics
The geographic and environmental characteristics of a community are another important component of risk and vulnerability characteristics. Topographic features and climatic conditions affect dispersion of hazardous material releases. Topographic information and climate data are important assumptions for release modeling and response assessments. Susceptibility of natural resources to hazardous material releases may vary according to the type of flora and fauna that inhabit them. This is especially critical for environmentally sensitive areas that contain endangered/threatened species and delicate ecosystems.
The U.S. Geological Survey (USGS) is updating The National Map (47) to improve topographic information across the United States. The USGS Web site states:
The geographic information available from The National Map includes orthoimagery (aerial photographs), elevation, geographic names, hydrography, boundaries, transportation, structures, and land cover. Other types of geographic information can be added within the viewer or brought in with The National Map data into a Geographic Information System to create specific types of maps or map views.
Soil surveys are another source of geographical data which include soils classifications, topographic characteristics, water table information, ecological information, including wildlife habitat. Soil survey information is available at the U.S. Department of Agriculture, Natural Resources Conservation Service at their Web Soil Survey (48) site.
116
Climate data are maintained by the National Climatic Data Center archives (49) of the U.S. Department of Commerce, National Oceanic and Atmospheric Administration. This includes a wide range data on climate and precipitation, including daily/monthly/seasonal averages, wind roses (charts that display wind direction and intensity), and other information.
5.4.6 Incidents and Accidents
Emergency responders and emergency managers are likely to have experiential knowledge of previous incidents and accidents on HazMat transport routes. Even if incidents have not previously involved HazMat transport, high risk locations such as hairpin turns, steep curves, or blind intersections and entrances can increase likelihood of incident occurrence. Information about incidents and accidents can help characterize HazMat transport risks in a community and identify risk hotspots (discussed further in Section 6.8). Identifying the number, location, and types of accidents occurring in the survey area can be done by reviewing the historical record of local transportation accidents. Such an historical record is useful because carriers are often reluctant to change routing practices. To the extent that environmental conditions (e.g., traffic, infrastructural conditions, weather) contribute to accidents, the specific locations of prior accidents may be more likely to experience future accidents if those conditions are repeated or persist.
Electronic sources of incident and accident data include PHMSA’s HMIS Incident Reports Database, FMCSA’s Crash Statistics (50), FRA’s Rail Safety Data (51), and USCG Marine Casualty and Pollution Database (52). It should be noted that the HMIS Incident Reports Database, which contains self-reported information from carriers about HazMat incidents, may underrepresent the all incidents that have occurred in a jurisdiction. Further information along with comparison of HMIS data with other data sets can be found in HMCRP Report 1: Hazardous Materials Transportation Incident for Root Cause Analysis (53). It also should be noted that incidents are not limited to those that involve HazMat. For example, if a particular road or intersection is known to have a high rate of truck incidents, then if the road has HazMat traffic, it may also have a high risk for HazMat incidents, even if a HazMat incident has not historically occurred there. Hence, high accident rates for trucks along a particular route may provide good reasons to limit hazardous materials along those routes. See Section 5.2 about other local and state sources of incident data.
5.4.6.1 Large Truck Incidents and Accidents
Given their frequency, network proximity to populated areas, and impact on the traveling public, large truck accidents have been an ongoing focus of many studies by government agencies and academics. Some of the more recent analyses are described below. Information from the U.S. Department of Transportation, National Highway Traffic Safety Administration’s General Estimates System indicates that between 2002 and 2006, large truck accidents accounted
117
for between 4.5 and 5.0 percent of reported accidents involving passenger cars, motorcycles, light trucks, large trucks, and buses (54).
The Federal Motor Carrier Safety Administration’s 2007 Large Truck and Bus Crash Facts report contains accident information for large truck crash occurrences by time of day, day of week, roadway type, body size and type, and hazardous materials cargo (including commodity groups) (55). According to the same report, 3.8 percent of large trucks involved in fatal crashes in 2007 were carrying HazMat cargo, while 3.1 percent of trucks involved in non-fatal crashes were carrying HazMat. A FMCSA Analysis Brief from 2004 reported that 4.2 percent of large trucks in fatal crashes were carrying HazMat cargo, on average between 1991 and 2000, while 4.4 percent of trucks involved in non-fatal crashes that required a tow-away were carrying HazMat, suggesting some improvements (56). These statistics do not appear appreciably different from the proportion of U.S. truck miles traveled while requiring a HazMat placard according to the 2002 Vehicle Inventory Use Survey data (discussed further in Appendix E).
The National Highway Traffic Safety Administration’s 2007 Traffic Safety Facts Report lists national accident rates for large trucks. Crash data reports suggest continuing improvement in accident rates from the 1970s through 2007. In 2007, the involvement rate per 100 million vehicle miles traveled was 2.02 fatal crashes, 33 injury crashes, and 147 property-damage only crashes, for a combined involvement rate of 1.82 large truck crashes per million vehicle miles traveled (57).
To put this in perspective, a single 20-mile Interstate segment with approximately 2,000 trucks per day (on an annual average) would be expected to see more than 26 large truck accidents per year given the 2007 accident rates. If approximately 4 percent of large truck accidents involve HazMat according to FMCSA, and approximately 5 percent of all U.S. truck miles are driven while they are required to carry a HazMat placard, this segment could expect to see between one and two placarded large truck accidents per year, assuming that national averages apply. Since trucks that carry HazMat below threshold levels are not required to have placards, the actual number of large truck accidents that involve HazMat on this segment would be greater. For heavily industrialized areas with even greater proportions of HazMat traffic, the number of HazMat accidents on this segment would be even larger.
The 2007 Large Truck and Bus Crash Facts Report also lists HazMat Commodity Groups involved in HazMat accidents for fatal and non-fatal crashes, including whether or not HazMat was released. Flammable liquids are carried in the highest proportion of HazMat truck crashes, followed by gases, and then explosives, corrosives, and miscellaneous dangerous goods (order depending on whether fatal or nonfatal crashes are considered).
A more detailed accident analysis by HazMat commodity group is presented in Battelle’s 2001 Report on Comparative Risks of Hazardous Materials and non-Hazardous Materials Truck Shipment Accidents/Incidents (58). According to the report:
118
Class 3 shipments account for about 64 percent of the enroute accidents with releases and about 52 percent of the non-release accidents. Class 3 shipments along with categories 2.1, 2.2, 5.1, 5.2, 8, and 9, represent about 94 percent of all enroute accidents with releases and about 93 percent of all enroute non-release accidents (p. ES-3).
The report also estimated total economic impacts for roadway HazMat accidents including injuries and deaths, cleanup costs, property damage, evacuation, product loss, traffic delay, and environmental damage. According to the report:
Class 3 represents 56 percent of all of the impacts, while categories 8, 2.1, 2.2, and 9 represent 13 percent, 9 percent, 6 percent, and 7 percent, respectively. These five categories alone account for approximately 91 percent of the estimated annual impacts for HM shipments. No other category accounts for more than three percent of the total impacts (p. ES-4).
Accounting for at least these five categories of hazardous material transport is likely to be essential to understanding incident and accident impacts in most HMCFS studies evaluating vulnerability and risk.
5.4.7 Contact Information
Obtaining contact information for HazMat transportation carriers, shippers, and receivers can allow a jurisdiction to request information from these entities about their HazMat transport activities. Electronic sources of contact information include PHMSA’s Incident Reports Database for roadway, railway, and pipeline modes; OPS’s Company Registration Look-Up Tool (59) for roadways; PHMSA’s National Pipeline Mapping System for pipelines; and USACE’s Waterborne Transportation Lines of the United States, Vessel Company Summary (60) reports for waterways.
5.7 KNOWLEDGE GAPS
5.7.1 Existing Roadway Data Gaps
Information specific to HazMat transport is not available at the local level from most existing data sources for roadways. Without specific HazMat ID or commodity flow information conducted at the local level, almost any application of existing database information in some form or other will require an assumption that HazMat traffic in a locality conform to either state or national patterns.
5.7.2 Existing Railway Data Gaps
Information provided by railroads will typically be a census of hazardous materials transported over a specific time period. The information provided by some railroads may be
119
aggregated at class level, or limited to a certain number of commodities that are transported most frequently. The spatial distribution of rail traffic data may for specific segments or for the overall jurisdictional area, and the temporal distribution of rail traffic is almost certainly annual. This level of information is generally sufficient to conduct some HazMat planning. However, a listing of transported HazMat commodities does not provide information about the proportion of overall rail traffic in a local area that is carrying a HazMat placard.
Although the STB Railcar Waybill Data provides a sample of rail shipment origin and destinations, this data source requires highly specialized modeling abilities, and the intermediate routes between an origin and destination are limited to identification at the state level. The result is that a great deal of uncertainty remains regarding the specific nature and pattern of railcar traffic over specific segments when using STB railcar waybill origin and destination data.
Routing of hazardous materials by railcar has been public safety issue for many jurisdictions, especially for large metropolitan areas, one that has grown even further with increased concern over terrorist events in recent years. This issue is a concern not only for the local jurisdictions, but also for the railroad companies themselves due to operational safety and liability. Further complicating this issue is the fact that railroads are required by law to carry certain extremely toxic materials that are prohibited from being transported by highway, pipeline, or air.
PHMSA and the FRA issued final rules in December 2008 under 49 CFR Parts 172, 174, and 209 that require that railroads consider at least 27 risk factors in selecting routes for shipments above threshold quantities of bulk Poison Inhalation Hazard (PIH) materials, Division 1.1, 1.2, or 1.3 explosives, and certain high-level radioactive materials shipments (61). Initial identification of alternate routes are to be completed by September 1, 2009 (with provisions to delay this to March 31, 2010), and beginning in 2010 railroads are required to conduct annual risk analysis.
The AAR cites the safety of railway HazMat transport—noting that “99.996 percent of rail HazMat shipments reached their destination without a release caused by a train accident” and “Rail accident rate are down 81 percent since 1980” (62). However, local commodity usage may not allow for HazMat rerouting and, even when a limited subset of extremely hazardous commodities are rerouted, the fact remains that there are many other hazardous commodities that are transported by railroad. Thus, while this ruling addresses some of the most potentially catastrophic railway transport risks, the magnitude of potential risk may remain very high for some jurisdictions given the volumes of commodities moved and proximities of populations in communities that were historically established and grew up along the nation’s rail networks.
As concern over HazMat transport by rail has grown, railroads have worked with communities to address risk through either alternate routing or alternate shipment scheduling. However, the fact remains that railway is the preferred mode of transport for bulk transport of
120
many hazardous commodities throughout the country, and either rerouting or using alternate transport modes for HazMat commodity transport may only serve to increase overall risk and/or greatly increase shipping costs. Further, railroads are private entities with business interests of maximizing efficiencies, and they own the tracks over which they operate. Rerouting or using alternate modes or schedules may be, simply, not an option. Thus, substantial risks may remain to populations located along rail corridors in many jurisdictions.
In a limited number of cases, a detailed understanding by local jurisdictions of spatial or temporal patterns of HazMat transport by rail and the proportions of HazMat rail traffic to overall rail traffic may be necessary. As good corporate partners, railroads have a stated interest in working with local communities to promote rail safety and incident response capabilities. TRANSCAER®, for example, is an important program through which Class I railroads provide training and HazMat transport information to LEPCs. If further information is needed for, say, a detailed risk analysis, one approach is for local jurisdictions to work with railroads to obtain additional information needed to support that analysis. This can include not only railway movements but also “storage-in-transit” at rail yards and on sidings. An adversarial relationship will not foster this process, since railroads are private entities with no obligation to provide information beyond which they are required by rule and law to provide to federal regulators. This process requires time, effective communication, and understanding on the part of all parties involved.
In the event that information cannot be obtained through these channels, there is an alternate means of obtaining data needed to understand the specific nature and pattern of railway transport in a jurisdiction. This is, quite simply, to observe rail traffic similar to that which might be performed for a truck traffic analysis (as described in Chapter 6). High resolution video systems might also be used. Although these are extremely resource intensive from a personnel or capital standpoint, they can be used to develop proportional estimates of HazMat transport by rail versus overall rail transport, and also for identifying temporal variations in rail traffic patterns for HazMat and overall rail transport.
In summary, collection of new (sampled) rail transport data, may be an extremely difficult task for most local entities, given the infrequency of rail traffic over most corridors relative to time required for observation of that traffic. Unless necessitated by higher-level analysis requirements such as for route analysis, collection of new rail HazMat transport data is practically limited to observation of railcar storage on sidings and in switching yards, except in limited cases where personnel are located or technology sufficient to allow for observation of railcar traffic on a more regular basis.
121
5.7.3 Existing Pipeline Data Gaps
Observation of pipeline throughput is practically impossible for an HMCFS, and it is typically assumed that pipelines are continuously operational, so from a risk analysis standpoint volume throughput information becomes less important for this mode. Information available through the PHMSA’s NPMS will allow for identifying pipeline locations and contacts in a jurisdiction. Pipeline companies do not have a standardized agreement for providing information as the railroad carriers do with the Association of American Railroads. Pipeline operators are generally cooperative with requests for information about what commodities are transported through their lines from local entities for the purposes of an HMCFS.
5.7.4 Existing Waterway Data Gaps
Data contained in USACE’s Waterborne Commerce of the United States reports are essentially a census of commodity transport over different navigable waterways and harbors along the Atlantic Coast; Gulf Coast, Mississippi River System and Antilles; Great Lakes; and Pacific Coast, Alaska and Hawaii. The reports categorize commodity movements for waterway or port segments according to USACE’s 4-digit Waterborne Commerce Statistics Center (WCSC) code, which aggregates specific commodities into commodity groups. This aggregation corresponds approximately with HazMat class, but if further information is desired, these 4-digit codes can be further specified using a listing of 5-digit commodity code groups found in the Hazardous Commodity Code Cross Reference File provided by USACE, at http://www.iwr.usace.army.mil/ndc/data/datacomm.htm. The USACE has developed a cross-reference between these 5-digit codes and associated UN Hazard ID (placard number).
The example in Appendix G illustrates how this information can be used. It is not possible to determine temporal patterns of commodity movement based on this existing data alone. For waterway shipments that originate and terminate at a jurisdiction’s facilities, it may be possible to identify temporal patterns in waterway movements, however, the loading and offloading process means that there may be considerable time when HazMat is present in the community as storage-in-transit. Further, this does not address patterns of waterway HazMat transport through a community.
Given that waterway routes are generally much more narrowly defined than even railway routes, options for rerouting of waterway traffic are much more limited. Thus, understanding the specific nature and patterns of waterway transport becomes more applicable to emergency response resource allocation and community planning applications. As with railway traffic, attempts to obtain information to understand these patterns can be obtained by working with waterway operators through industry organizations such as the American Waterways Operators (http://www.americanwaterways.com) or the Gulf Intracoastal Canal Association (http://www.gicaonline.com), or through direct observation of waterway traffic. Observation is
122
compounded by the fact that vessels may not display HazMat ID information and observation locations may not be in close proximity to shipping lanes.
Identification of vessel types (e.g., chemical barges versus hopper barges) may provide some information, particularly for identifying any temporal patterns in waterway HazMat traffic. It may also be possible to coordinate collection of specific data with U.S. Coast Guard through Port Captains, port authorities, harbormasters, or Navigation Safety Advisory Committees. However, issues with interagency coordination and agency mission for these sorts of activities, in addition to the personnel that would be required by those agencies and the local jurisdiction to participate in this sort of data collection, may limit the practical effectiveness of this approach for many jurisdictions. All things considered, obtaining information to understand the specific nature and pattern of waterway HazMat transport is likely to be challenging for many jurisdictions, but also one that is likely to be less applicable for the majority of local jurisdictions that might conduct an HMCFS.
5.7.5 Existing Airway Data Gaps
TRB’s Airport Cooperative Research Program (ACRP) Report 26: Guidebook for Conducting Airport User Surveys (63) discusses challenges of conducting airport cargo surveys. The report notes that “there is little experience with collecting data in this area” (p. 142) and “therefore virtually no standard practices that can be applied, or modified, for a particular airport” (p. 143). Although information is likely available on air cargo manifests, “this information is, naturally, highly valued by shippers and forwarders, guarded by privacy rules, and not released easily” (p. 143). As discussed previously, there does not currently appear to be a mechanism or agreement among air carriers regarding how local entities can obtain existing information on HazMat transport by air through their jurisdictions. Short of information provided by individual carriers provided for individual air cargo facilities, obtaining information about HazMat transport by air may require assuming that national-level statistics apply (from the BTS Commodity Flow Survey), or, as suggested in ACRP Report 26, it may require collection of new data through observation of truck traffic on roadway corridors to and from airport facilities.
123
CHAPTER 6: NEW HAZARDOUS MATERIALS TRANSPORT DATA SOURCES
6.1 THE NATURE OF NEW DATA
New data are comprised of information collected specifically for an HMCFS or other commodity flow study. They often require expending resources (personnel time or funds) to obtain the information. These data have a disadvantage in that they require more effort to collect than most existing data sources. However, the advantages of new data are that they are directly applicable to the immediate concern, may require less manipulation after they are collected to be used for an HMCFS and may also be used for other local applications such as transportation or community planning.
New data collection includes interviews with shippers and receivers, carriers, emergency responders and managers, and other key informants. It also includes traffic surveys ranging from very simple truck counts to much more complex examination of shipping manifests to identify local HazMat transport patterns. Collection of new data tends to be focused on roadway truck transport because:
• Locally-relevant HazMat transport data for roadway transport are generally lacking or more difficult to obtain from existing data sources.
• Roadways often serve as connectors to railroad, waterway, pipeline, and air terminals.
• Locally-relevant HazMat transport data are generally available from existing data sources for railroad, waterway, and pipeline modes.
6.2 INTERVIEWS
In addition to receiving existing, previously compiled from HazMat shippers, receivers, and carriers, and emergency response and management agencies, these entities can be interviewed regarding their knowledge of HazMat transport activities, including what is transported, to/from where, when, and how. While extensive interviews are needed to develop an empirical understanding of HazMat transport over a network, they can be helpful for developing a general understanding of transport patterns within a jurisdiction or those originating and terminating in a jurisdiction. Because the potential number of interviews is large and correspondingly time consuming, a listing of contacts can be developed and prioritized.
Interview information can be tabulated or written in list or paragraph form and summarized for each shipper, hazardous material, transport mode, etc. Although conducting interviews can be intimidating, as interviewers become more experienced the process becomes easier. Further, the amount of information can seem initially overwhelming. However, tasking
124
an LEPC subcommittee with conducting and compiling information can yield a great deal of information over time, especially if interviews are conducted in an on-going basis (for example each sub-committee member conducts one interview per week). As more information becomes known, the information may become useful for developing more a comprehensive understanding of hazardous materials transport in a community. Interview information is also important for guiding the collection of new data including verification of selected data collection locations and times. They can help identify locations where field data collection is more likely to be needed or unnecessary.
6.2.1 Interviews with HazMat Shippers, Receivers, and Carriers
For entities that are known to store (and ship) larger quantities of HazMat (Tier II reports may be a source), or those that are located along or known to ship/receive over transport corridors that are of key interest, suggested interview discussion points include:
1. What hazardous materials are shipped/received/carried? 2. What is the origin, destination, or both of the hazardous materials? 3. When are the hazardous materials shipped/received/carried by time of day, day of
week, season of year, etc. and frequency of shipment? 4. How are the hazardous materials shipped/received/carried? 5. Over what transport routes are the hazardous materials carried? 6. How much (number of shipments, volumes, etc.) hazardous materials are shipped?
6.2.2 Interviews with Emergency Responders and Managers, and Other Key Informants
Suggested interview discussion points for emergency response and management personnel, or other key informants, include:
1. Which areas of the jurisdiction are you experienced with and what are the timeframes of that experience?
2. What have you observed regarding locations, times, methods, frequency, and content of HazMat transport in those areas?
3. Are there corridors or network segments that seem to be a higher priority for understanding HazMat transport in these areas? If so, do you have suggestions for data collection locations and times?
4. Are there particular locations in these areas that are a higher risk for truck incidents and accidents than others?
5. Do you know of other individuals that should be contacted regarding their knowledge of HazMat transport?
125
6.3 FIELD DATA COLLECTION
6.3.1 Data Collection Background
Collection of new field data about hazardous materials transport is a unique challenge from a traffic data perspective. Information about traffic has long been of interest for transportation and planning professionals to describe roadway system usage and performance levels. Procedures have been developed over the past several decades for identifying traffic levels and continue to be refined as data collection technologies improve. FHWA’s current recommendations for traffic data collection practice can be found in the Traffic Monitoring Guide (64), or TMG. The guide recommends practices and procedures for traffic data collection primarily at the statewide level to support FHWA data requirements for the Highway Performance Monitoring System, discussed in Chapter 4 and Appendix D for existing data sources. The guide also includes a section describing procedures for vehicle classification monitoring to identify differences between passenger car and truck traffic patterns. The TMG points out that historically:
Not much data has been collected by [vehicle] classification and not much analytical work performed. Thus, many of these patterns are not well understood at the state and individual roadway levels. Further complicating matter is the fact that travel patterns for trucks are usually quite different than those for cars, and the data collection plans currently used tend to be structured around understanding the movements of cars not trucks (Section 4, Chapter 1, Variability section, paragraph 3).
Although understanding of truck traffic patterns has undoubtedly improved since the TMG was published in 2001, truck traffic analysis remains less of an exact science than other traffic studies. This is further complicated for HazMat truck traffic for a number of reasons. First, the TMG recommend using automated technologies for classifying the traffic stream and suggests that human observations (manual counts) be used “as a last resort.” It notes that while manual counts can classify trucks on the basis of body style, they can be “expensive and prone to error.” This is especially the case since the TMG recommends count periods of at least 24 hours (what the TMG terms “short duration counts”), and preferably 48 hours when they are not done using continuous traffic counters, or ATRs.
Technologies discussed in the TMG for use in short or continuous traffic counts include axle sensor based counters, vehicle length based counters, and machine vision based counters. Traffic data are then analyzed to identify proportions of passenger vehicles, single unit trucks, tractor-trailers, and multi-trailer trucks, or proportion the traffic according to FHWA’s 13 vehicle class categories based on weight. Unfortunately, none of these systems can automatically identify whether or not vehicles are carrying hazardous materials, let alone identify what type of hazardous materials they may be. Because of this, the direct relevance of data collected using
126
TMG-recommended procedures, which represents the bulk of existing roadway data, is very limited.
The TMG notes that new traffic monitoring technologies continue to be developed. Many large metropolitan areas and states have implemented monitoring systems on key transportation routes. The resolution of video systems that are part of these monitoring systems may enable identification of truck types, allowing for collection of truck type transport data at select transport network locations, across a range of sampling frames. Video technology implemented and configured in public transportation systems is currently not able to consistently identify HazMat placards, given the speeds at which traffic is typically passing within the field of view and the different locations that a placard may be placed on a vehicle. Even if truck type movements were to be collected using such systems at more advanced sampling levels, such as stratified/proportional or random sampling, identifying associated transport of HazMat still requires application of national-level averages of HazMat transport for different truck types, barring additional data availability such as prior state or local-specific measures of HazMat transport by different truck classes. Vehicle mounted sensor (e.g., RFID tags) systems for public monitoring of truck traffic and cargos are not on the immediate horizon either. Systems for tracking hazardous materials shipments have been considered by entities such as U.S. Department of Homeland Security. However, electronic collection of HazMat shipment information, while technologically feasible, is not likely practically implementable in many public sector jurisdictions in the immediate future, especially in small- and medium-sized communities, given resources needed to develop such a system and the political implications of doing so.
The end result is that locally-specific information about HazMat transport by roadway usually necessitates manual counts through human observations. This does not mean that truck traffic information collected using automated systems is not useful for an HMCFS. Truck traffic volume data can be used to identify locations where HazMat data collection may be focused, or be used to validate manual count information. Information about daily and seasonal variations in truck traffic patterns can also be identified from data collected by ATRs, and weigh-in-motion (WIM) data can be used to estimate proportions of empty versus loaded trucks. These data are typically maintained by state transportation agencies. However, trends for overall truck traffic may not directly apply to HazMat truck traffic, especially where seasonal variations in HazMat commodity production or consumption apply. As identified in the TMG, it is important to keep in mind that:
Truck traffic patterns are governed by a combination of local freight movements and through-truck movements. Extensive through-truck movements are likely to result in higher nighttime truck travel and higher weekend truck travel. Through-traffic can “flatten” the seasonal fluctuations present on some roads, while creating seasonal peaks on other roads that have nothing to do with economic activity associated with the land abutting that roadway section.... Local truck traffic can be generated by a single facility
127
such as a factory, or by a wider activity such as agriculture or commercial and industrial centers. These “point” or “area” truck trip generators create specific seasonal and day-of-week patterns much like recreational activity creates specific passenger car patterns. Truck trips produced by these generators can be highly seasonal (such as from many agricultural areas) or fairly constant (such as flow patterns produced by many types of major industrial plants). (Section 4, Chapter 3, Permanent/Continuous Classifiers section, Create Initial Factor Groups subsection, paragraphs 1 and 3).
Regardless of whether the field data collection effort focuses on counting trucks, types of trucks, UN/NA placard IDs, or some combination thereof, there are some general considerations that apply for selecting count locations and timing of data counts. These considerations are discussed below.
6.3.2 Selecting Count Locations
Following are some important considerations for selecting data collection locations:
1. The safety of data collection personnel and the driving public are paramount. Consider Incident Command System principles in planning to collect new data, as applicable.
2. Data collection personnel require a clear view of the roadway section(s) for which they are to obtain information. Visibility requirements for placard counts may be more restrictive given the size of the placard that is to be identified.
3. Intersections allow the data collector to identify the turning movements of vehicles, including the road that the vehicle is turning from and the road that the vehicle is turning to.
4. Parking lots of fueling stations, shopping centers, abandoned buildings, highway maintenance, and material storage lots make good locations and can also include roadway turnouts or drives in the public right of way. License and weight stations (when open) can also be good data collection locations.
5. Nighttime counts require sufficient lighting to allow placard identification, vehicle type, or other data to be observed, and provide sufficient driver visibility to assure safety (of data collectors and driving public).
6. Dry grass, weeds, or other debris under running (or hot) vehicles can ignite fires. 7. Selecting locations that do not impede or endanger the driving public or
inconvenience property owners is essential. Permission for collection of data on private property should be obtained when necessary. Objections are rare when property owners understand the purpose and nature of the data collection, provided that business and personal activities are not impeded.
8. Coordination with local emergency management and law enforcement is important to provide pubic legitimacy, promote participation, and enhance use of the results. Passers-by may report traffic observers as engaging in suspicious activities, especially
128
around industrial facilities or military installations. A letter about the data collection effort from the LEPC or other local agency may be useful to help answer questions from law enforcement or security personnel who are following up on such reports.
6.3.3 Determining Count Intervals
Published recommendations for conducting traffic counts (such as the TMG, transportation engineering manuals and other guides) typically assume that data are collected automatically or by professionals and/or personnel who can dedicate large segments of time to data collection, or collect data at various times for different sites. This conflicts with the realities faced by many LEPCs and other local entities that might use volunteers for data collection, for whom time and data collection resources are limited. Further, data collection may be conducted during times of extreme temperatures—very cold or very hot—requiring data collection to be performed from the inside of vehicles. Sitting for long periods of time inside a vehicle may lead to data collector fatigue, which requires exiting the vehicle or leaving the data collection site. The TMG points out that “it is very difficult for a person to count accurately for more than about three consecutive hours. After three hours, the concentration of most observers tends to wander, causing the number of errors to increase” (Section 4, Chapter 5, Manual Counts section, paragraph 2). Thus, there needs to be a balance between traffic counting procedures that are optimal and those that are practical.
Keeping in mind the physical and practical limitations of traffic counting practice, the goal for counting trucks or other vehicles is to collect information that is sufficient to:
1. Identify general traffic patterns; and 2. Identify differences in traffic patterns for different days and times as required by
objectives.
In general, 15-minute counts are a minimum, with 1-hour counts preferred, and 30-minute counts as a secondary options. Using count intervals in even fractions of an hour simplifies the extrapolation of counting segments into one-hour periods. Conducting 30-minute to 1-hour counts reduces effects of traffic variation while providing sufficient time for recording of vehicle traffic, if present at any appreciable levels. Longer count durations can be conducted, but it is recommended that they be recorded in separate 30-minute or 1-hour segments so that changes in traffic patterns can be evaluated for different hours of the day. Although not absolutely necessary, starting count intervals on even half-hour or hours can ease data analysis for differences in traffic patterns by time of day.
6.3.4 Scheduling Data Collection (Sampling)
Recommendations for scheduling traffic counts depend on the sampling requirements, the type of information that is collected and its application, the type and level of traffic that is
129
observed, and the desired ability to identify differences in traffic patterns for different times throughout a given day, between different days of the week, from week-to-week, or month or season of the year. The sampling framework used should be driven by the HMCFS objectives. Obviously, with a greater amount of good quality, well-sampled data increases the precision with which HazMat traffic can be described. However, more data requires more time for collecting it, processing it, and analyzing and validating it. As with any study that involves sampling, there is a trade-off between data collection feasibility, efficiency, and precision. In many cases, the goal of an HMCFS is to develop a general understanding of the characteristics of HazMat flow patterns to the degree they can inform awareness, or emergency response training, and planning. These can be accomplished using lower-level sampling techniques. As the critical nature of HMCFS objectives increases, including route designations, higher sampling strategies may be required. Matching HMCFS objectives with data sampling is discussed in Chapter 8, Promising Practice 3. Table 19 provides a summary of different traffic sampling framework examples, and advantages and disadvantages of each.
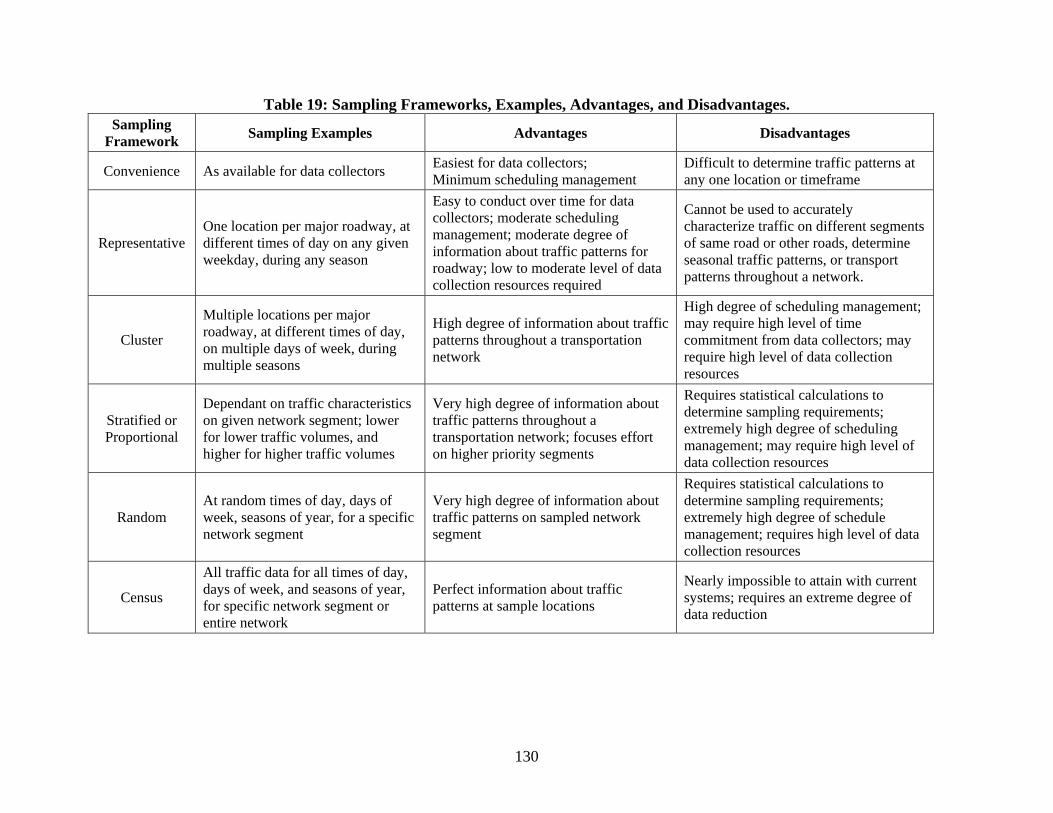
130
Table 19: Sampling Frameworks, Examples, Advantages, and Disadvantages. Sampling
Framework Sampling Examples Advantages Disadvantages
Convenience As available for data collectors Easiest for data collectors; Minimum scheduling management
Difficult to determine traffic patterns at any one location or timeframe
Representative One location per major roadway, at different times of day on any given weekday, during any season
Easy to conduct over time for data collectors; moderate scheduling management; moderate degree of information about traffic patterns for roadway; low to moderate level of data collection resources required
Cannot be used to accurately characterize traffic on different segments of same road or other roads, determine seasonal traffic patterns, or transport patterns throughout a network.
Cluster Multiple locations per major roadway, at different times of day, on multiple days of week, during multiple seasons
High degree of information about traffic patterns throughout a transportation network
High degree of scheduling management; may require high level of time commitment from data collectors; may require high level of data collection resources
Stratified or Proportional
Dependant on traffic characteristics on given network segment; lower for lower traffic volumes, and higher for higher traffic volumes
Very high degree of information about traffic patterns throughout a transportation network; focuses effort on higher priority segments
Requires statistical calculations to determine sampling requirements; extremely high degree of scheduling management; may require high level of data collection resources
Random At random times of day, days of week, seasons of year, for a specific network segment
Very high degree of information about traffic patterns on sampled network segment
Requires statistical calculations to determine sampling requirements; extremely high degree of schedule management; requires high level of data collection resources
Census All traffic data for all times of day, days of week, and seasons of year, for specific network segment or entire network
Perfect information about traffic patterns at sample locations
Nearly impossible to attain with current systems; requires an extreme degree of data reduction
131
6.3.4.1 Convenience Sample Scheduling
For a simple convenience sample (where data are collected because they are easy to obtain), data collectors might conduct truck counts before work, during lunch breaks, and after work at an intersection or location between their home and workplace, or some other location when they have time to do so on any given day. Because some data are collected, it may provide a general sense of traffic levels at certain times and locations but is unlikely to give a clear sense of traffic patterns at any one location or across a jurisdictional area, across a range of times. As the number of data collectors increases however, the range of times and locations for which data are collected increases. Without a very large pool of convenience sample data it will be difficult to determine traffic patterns across a jurisdictional area, at different times, aside from chance, but it can be used to provide a very general idea of HazMat transportation in certain areas of the community. Moreover, some routes or route segments are likely to be well represented, but others are likely to be left unobserved.
For example: Three health professionals from a local hospital located on an Interstate bypass in a rural county’s main city (the County Seat, located at the center of the county) volunteer to participate in HMCFS data collection. One volunteer occasionally has some extra time for data collection on Monday and Tuesday mornings before work, one during their lunch break on Mondays and Wednesdays, and one after work on Thursdays. Whenever they have some extra time, the volunteers conduct truck and placard counts from the hospital parking lot that overlooks the roadway. Because of how the roadway is constructed, they can only collect data for westbound traffic. These data can provide only a very general indication of HazMat traffic patterns for the westbound traffic on the roadway throughout the week. Note that if the volunteers collected a lot of data (say, at least five data counts) for each of those days and times, that could provide a very clear picture of traffic patterns at those particular days and times for that roadway.
6.3.4.2 Representative Sample Scheduling
With representative sampling, the data collection locations are selected to represent major types of HazMat transport corridors in the community. For example, data collection might be conducted at one location on an Interstate, one location on a bypass loop, one location on a major urban arterial, and one location at downtown intersection of primary roads. The data collection would be scheduled at each location at different times during the morning, daytime, and evening over the course of data collection, but not on any particular day of the week or month of year. The collected data can be used to establish general traffic patterns for these particular locations throughout the day (e.g., lower traffic levels during morning/evening and higher traffic levels during the day). The data can also be used to generally characterize the type of traffic on similar roads, but they cannot be used to accurately describe traffic characteristics on other roads or determine patterns of truck transport throughout an area. Without a very large pool of
132
representative sample data, it will be difficult to determine differences in traffic patterns across different days of the week or months of the year.
For example: A volunteer fire department is located in community near an Interstate highway on the east side of the same county as the health professionals in Section H.2 Three firefighters from department participate in HMCFS data collection. Over the course of several months, the volunteers conduct truck and placard counts on each direction of the Interstate during weekdays. They make sure that they have at least a half hour of collected data for each hour of the daytime (e.g., 8–9 a.m.), for each direction. They also coordinate to collect data during the daytime on Saturdays—one Saturday they count in the morning, and another Saturday they count in the afternoon. The LEPC assumes that these traffic counts represent traffic on the Interstate at the other end of the county, and assumes that the truck and placard traffic is similar for all weekdays at other times of the year for the weekday counts, and for all weekend days at other times of the year based on the Saturday counts.
6.3.4.3 Cluster Sample Scheduling
Cluster samples can expand representative samples to select multiple locations representing various types of roadway and are often best suited for situations where the goals and objectives are focused on very specific routes and route segments. For example, data locations are selected on an Interstate on both sides of a community, on all major highways and arterials, and key intersections not otherwise covered. The sampling is scheduled to ensure that data are collected multiple times for each day of the week throughout each day at all locations. With sampling expansion the data may also be collected at sufficient levels to represent different months or seasons of the year. While data are usable to characterize traffic flow patterns for an entire transport network, the traffic levels for the major components of a transportation network can begin to be identified for different days of the week and different times of the year, assuming that the observed traffic patterns hold for other times for which traffic is not observed.
For example: A school complex (elementary, junior high, and high school) is located near the Interstate highway on the west side of the same County Seat identified in Section H.2. This section of Interstate has had several major truck accidents in the past decade. Community officials are concerned that their emergency warning and communication system and shelter-in-place procedures are appropriate to the hazards that may be present, especially since the schools, including playground and outdoor athletic facilities, were constructed on land near the Interstate. The LEPC schedules data collection for this section of the Interstate over the course of three months during the spring (March–May). The schedule over the three month period includes three half-hour counts during each hour of the daytime (e.g., 8–9 a.m.), on three weekdays (e.g., Monday, Wednesday, and Friday) during school and after-school hours (7:00 a.m.–7:00 p.m.) and on each direction of the Interstate. The schedule is repeated so that there are two data sets per sampled weekday.
133
With the approval of their supervisors and senior administrators, four city firefighters, four city police officers, and four school teachers participate in HMCFS data collection using truck and placard ID counts. The firefighters take responsibility for the 7–11 a.m. period, the police officers for the 11 a.m.–3 p.m. period, and school teachers for the 3–7 p.m. period. With 72 hours of data collection per group (0.5 hours per sample x 3 samples per hour of the day x 4 hours of the day per period x 3 days per week x 2 directions of the roadway x 2 samples per weekday = 72 hours), and 4 data collectors per group, this works out to around 18 hours of data collection for each participant over 3 months. Assuming that the observed traffic represents the overall traffic during this time period, this should provide the community with a very good idea of the springtime, weekday, daytime HazMat transport hazards on that portion of the Interstate.
6.3.4.4 Stratified and Proportional Sample Scheduling
Both stratified and proportional samples require prior knowledge of the sampled population to determine the required data collection parameters. For example, previous data on traffic counts might be used to identify average expected traffic levels on a daily basis at key transportation network locations. Previous information about traffic levels at each location are also available, for example, at one location it may be known that peak traffic during the day is three times the level that is seen during the night, with mid-morning and mid-afternoon traffic levels twice that seen during the night, on average. Based on this information, a stratified sample determines the total number of vehicles that need to be counted in the morning, peak, and afternoon daytimes and at night. This calculation is completed for each network location, and data are collected until the number of sampled vehicles is obtained at each location and each time.
A proportional sample might separate the time periods into fixed length segments (e.g., 30-minute or 1-hour slots), and sample them proportional to the expected traffic in each time period. The schedule of data collection at each location would then reflect the expected volume of traffic in these locations. Given daily and seasonal variations in traffic patterns, either process may need to be repeated for each location and time period. Although overall estimates of average annual daily traffic may available from metropolitan and state planning agencies for major roadways and combined with estimates of daily and seasonal traffic patterns, the statistical computations associated with determining stratified and proportional sampling make this method generally impractical for most HazMat traffic count applications other than those that require very in-depth knowledge of traffic patterns and have sufficient resources available for coordinating and conducting the data collection.
6.3.4.5 Random Samples
Traffic observations are made in a random manner, either by time of day/week/month or by number of vehicles, throughout a transportation network. Random samples are most
134
appropriate when goals and objectives are very focused on a limited number of routes or route segments and the decision objectives require high degrees of accuracy, precision, and validity. Otherwise random samples can result in data collection that is expensive and time consuming. Random samples are usually unnecessary except for all but the most extreme HazMat transport applications, especially since other less expensive sampling procedures can yield adequate information for most objectives.
6.3.4.6 Census
A complete census of all traffic on transportation network is nearly impossible to obtain without automated data collection procedures such as tag-readers that collect data about vehicle locations and commodities carried. Although such systems have been conceptualized, none that are anticipated for implementation collect information about HazMat shipments to warrant serious consideration in the immediate timeframe for conducting a census of HazMat traffic. As future technology development and data collection procedures develop, collection of HazMat transport census data may become more feasible.
6.3.5 Determining Type of Traffic and HazMat Data to be Collected (Precision)
The precision of collected traffic and HazMat content data also determine what can be identified about HazMat flows in a community. Traffic information can include the number of vehicles counted (e.g., trucks), the number of units counted (e.g., number of truck trailers), the type of vehicles (e.g., van versus flatbed trucks), and sometimes the number of containers or packages in a shipment (although this can be considerably difficult for most truck traffic surveys, except for those of shipping manifests). Some jurisdictions may wish to limit the types or sizes of vehicles that are recorded.
The HazMat content of a shipment can be observed for whether or not the transported material is hazardous (e.g., whether a truck does/does not have a placard), by class or division of HazMat (e.g., as indicated by type of placard), by UN/NA placard ID number (e.g., as indicated on a placard or side of a tank), or by specific material/chemical (although this can be considerably difficult for most truck traffic surveys, except for those of shipping manifests). Together, information about traffic levels and HazMat content can be used to develop an idea about how much HazMat is being transported in a jurisdiction. Matching precision needs with HMCFS objectives is discussed further in Chapter 8, Promising Practice 4. Table 20 provides a summary of different traffic and HazMat content survey methods.
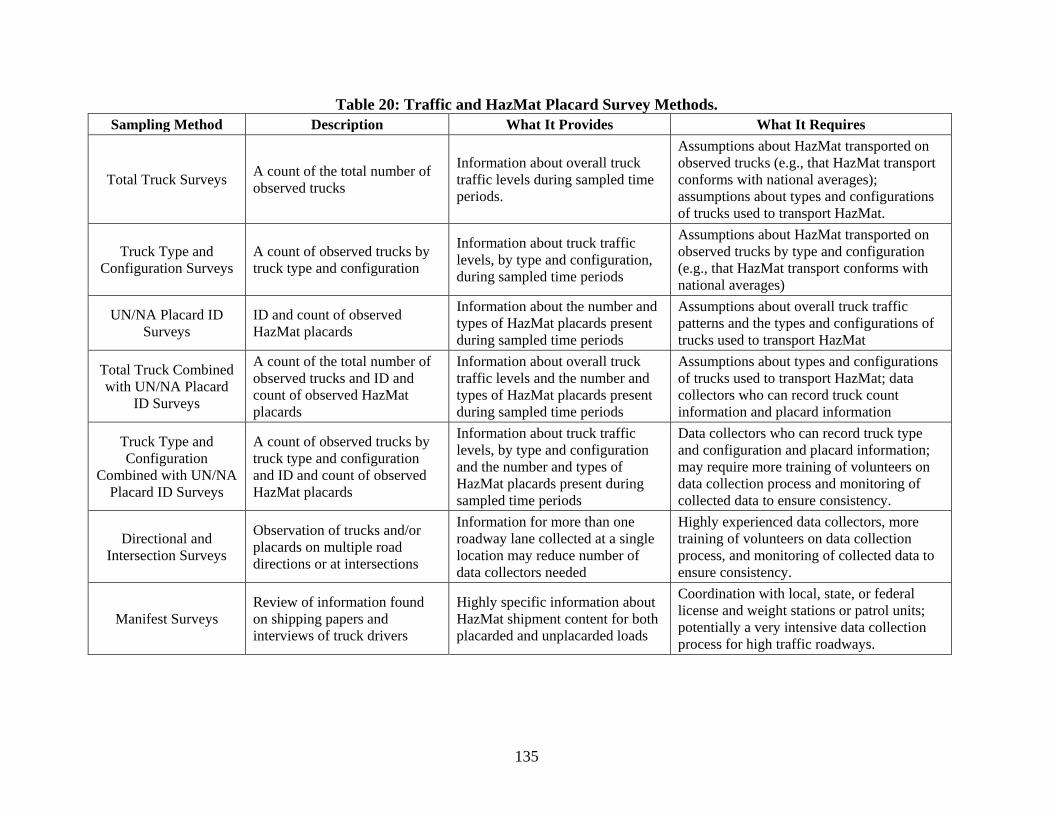
135
Table 20: Traffic and HazMat Placard Survey Methods. Sampling Method Description What It Provides What It Requires
Total Truck Surveys A count of the total number of observed trucks
Information about overall truck traffic levels during sampled time periods.
Assumptions about HazMat transported on observed trucks (e.g., that HazMat transport conforms with national averages); assumptions about types and configurations of trucks used to transport HazMat.
Truck Type and Configuration Surveys
A count of observed trucks by truck type and configuration
Information about truck traffic levels, by type and configuration, during sampled time periods
Assumptions about HazMat transported on observed trucks by type and configuration (e.g., that HazMat transport conforms with national averages)
UN/NA Placard ID Surveys
ID and count of observed HazMat placards
Information about the number and types of HazMat placards present during sampled time periods
Assumptions about overall truck traffic patterns and the types and configurations of trucks used to transport HazMat
Total Truck Combined with UN/NA Placard
ID Surveys
A count of the total number of observed trucks and ID and count of observed HazMat placards
Information about overall truck traffic levels and the number and types of HazMat placards present during sampled time periods
Assumptions about types and configurations of trucks used to transport HazMat; data collectors who can record truck count information and placard information
Truck Type and Configuration
Combined with UN/NA Placard ID Surveys
A count of observed trucks by truck type and configuration and ID and count of observed HazMat placards
Information about truck traffic levels, by type and configuration and the number and types of HazMat placards present during sampled time periods
Data collectors who can record truck type and configuration and placard information; may require more training of volunteers on data collection process and monitoring of collected data to ensure consistency.
Directional and Intersection Surveys
Observation of trucks and/or placards on multiple road directions or at intersections
Information for more than one roadway lane collected at a single location may reduce number of data collectors needed
Highly experienced data collectors, more training of volunteers on data collection process, and monitoring of collected data to ensure consistency.
Manifest Surveys Review of information found on shipping papers and interviews of truck drivers
Highly specific information about HazMat shipment content for both placarded and unplacarded loads
Coordination with local, state, or federal license and weight stations or patrol units; potentially a very intensive data collection process for high traffic roadways.
136
6.4 VEHICLE COUNTS
6.4.1 Commercial Vehicle Counts
Where existing data from automated collection systems (e.g., HPMS) are not available, counts of commercial vehicles are simple for data collectors to conduct. The idea is to simply count the number of commercial vehicles that are observed at individual locations during a specified timeframe. Without observation of whether vehicles are carrying HazMat (for example, as indicated by a placard), national averages for HazMat transportation, by class and division, will be applied to the count data to determine general estimates of the quantities of hazardous materials class and division categories that are transported in the evaluated area.
6.4.2 Vehicle Types
Additional information about types of commercial vehicles that are observed can be collected in addition to total vehicle counts. Truck type counts will allow national averages for HazMat transportation, by class and division, for each truck type to be used, rather than a national average for all trucks. It may also serve as a basis for identifying future changes in truck traffic patterns in the jurisdiction and may reduce the need for conducting future detailed placard surveys.
As discussed above, truck traffic patterns can be highly seasonal or episodic. For example, at a given point in time local construction activities might increase or decrease the proportion associated trucks (e.g., dump, bulk aggregate, or concrete trucks). Simply relying on counts of total trucks for this area might result in overstating or understating the expected HazMat transport levels if that proportion was applied to a total truck count at another location or at the same location at some time in the future.
Although traditional guidance for conducting vehicle classification counts relies on FHWA’s designation of vehicle class by tonnage and number of axles per vehicle, this type of information will not yield much useful information for HazMat classifications. Rather, vehicle classifications can be made according to truck cargo body types. An example, as used in the U.S. Census Bureau’s 2002 Vehicle Inventory and Usage Survey database. The truck type categories were evaluated for this report according to size and percentage of miles driven while requiring a HazMat placard, as described in Appendix E. The trucks were classified into eight different cargo body types, and two different sizes.
6.4.2.1 Vehicle Types
Based on the evaluation of the 2002 VIUS data, eight truck cargo body types classifications are identified as relevant to differences in HazMat transportation:
137
• liquid/gas tank trucks; Note: designation of shipping container chassis configurations was not included in the 2002 VIUS. We assume ISO tank containers to correspond to liquid/gas tanks;
• vacuum tank trucks; • dry bulk tank trucks; • ‘standard’ van box trucks, including basic enclosed, drop frame, step, walk-in,
multistop, open top, and other box trucks, and Curtainside trucks (which appear similar to standard van box trucks). Note: designation of shipping container chassis configurations was not included in the 2002 VIUS. We assume these to correspond to van configurations, with the exception of ISO tank containers which we assume to correspond to liquid/gas tanks;
• refrigerated van trucks; • utility and other service trucks; • flatbed, stake, and platform, etc. trucks; and • other truck types, including trash, garbage, or recycling, dump, concrete mixer,
concrete pumper, low boy, crane, pole, logging, pulpwood, or pipe, beverage, livestock, and other trucks not classified above.
6.4.2.2 Vehicle Sizes
Truck configurations are classified into three categories based on the 2002 VIUS data: straight trucks, tractor-trailers (also including straight trucks with a trailer), and tractors with multiple trailers.
6.4.3 Vehicle Data Collection
For vehicle counts, the data collector simply counts the total number of trucks observed, or number of trucks by type and size, for a given location and time and records the counts. Appropriate sampling frames for such efforts are convenience, representative, and cluster sampling. A simple tabulation sheet can be used. Tabulation sheets should include the following information:
• location, • date and day of week, • time period, • data collector name(s), • weather conditions, and • page numbers (if multiple pages used for same location/date/time period).
The application of national averages from the VIUS data limits the applicability of HazMat transport information obtained using this method to local jurisdictions.
138
6.5 UN/NA PLACARD ID COUNTS
6.5.1 Overview of UN/NA Placard ID Counts
Placard counts require observation of placarded vehicles as they pass by observation points. Good visibility of the observed traffic lanes is required, and an experienced data collector who is using binoculars is beneficial. While this counting technique results in direct information about the HazMat transportation patterns in an area, it is more specific and difficult to conduct than truck type counts for several reasons:
1. Placards are less than one square foot in size, and placard numbers are 3.5 inches tall. 2. While vehicles are required to display placards on front, side, and back of the
transport unit, the placement of the placards is not the same for each vehicle. 3. Higher speeds and congested traffic can make it difficult for even experienced
observers to identify every placard, especially when placards are obscured by another vehicle.
6.5.2 UN/NA Placard ID Information
The goals of a placard count are:
1. To identify whether a vehicle is placarded or has a UN/NA placard ID; 2. To identify what the class/division of the corresponding material is (indicated by
color and pattern of placard, as shown in Appendix A); and 3. To identify specific numbers or words written on the placard or UN/NA placard ID
(as shown in Appendix B). Additional markings may be present on the vehicle/vessel, for example, an orange UN number on ISO tanks and some tank trailers, or “Marine Pollutant.” Some vehicles do not have a HazMat class/division or 4-digit ID placard, but a “Dangerous” placard for when they are transporting combinations of hazardous materials.
It is important to remember that vehicles carrying less-than-placard-threshold levels can still be carrying hazardous materials. Although a count of placarded vehicles will not yield a complete picture of HazMat transport, it will provide better information about larger quantities of HazMat transported in an area. Additional information about placard requirements can be found in 49 CFR, Part 173 (65).
6.5.3 UN/NA Placard ID Data Collection
The data collection procedure for UN/NA placard ID counts is similar to that of the truck counts, except that instead of recording truck size and type, the placard information is recorded. Because placarded vehicles only make up around 5 percent of all vehicles, on average, this may
139
result in relatively low placard counts for many locations and time intervals. Appropriate sampling frames for such efforts are convenience, representative, and cluster sampling.
6.6 COMBINED VEHICLE AND PLACARD COUNTS
A more intensive data collection technique is to combine truck counts (either overall trucks or trucks by size and type) with UN/NA placard ID counts. Observation of placards and trucks are recorded for the same locations and times.
The Colorado Department of Public Safety (CDPS) has developed data tabulation sheets that they use for collecting truck and HazMat class data through their Hazardous Materials Training Unit and in cooperation with LEPCs (Appendix H). The CDPS sheets focus on different types of tank cargo bodies as identified in the 2008 ERG on pages 19 and 20, and described further in the U.S. Fire Administration’s Hazardous Materials Guide for First Responders, as well as a few additional truck types including van and flatbed configurations. An advantage of using the these configurations is that the tank types can be generally related to related to commodity types (as identified in the Hazardous Materials Guide for First Responders) and to Guide numbers (as identified in the 2008 ERG), although the ERG indicates that identifying materials using the Guide numbers “should be considered as a last resort if the material cannot be identified by other means” (9, p. 19). The sheets also provide for identification of truck configurations (for various straight truck and tractor-trailer configurations) and recording of placard class. Jurisdictions that wish to focus primarily on tank truck traffic, which correspond to the highest proportions of HazMat transport by truck type, may find these data collection sheets useful.
A local jurisdiction may desire to develop their own data collection sheet format, or use previously developed formats, such as those developed by state or federal agencies. For example, data tabulation sheets have been developed based on the CDPS data collection sheets to correspond to the 2002 VIUS categories described in above and are provided in Appendix I. In these sheets, liquid and gas tank trucks are aggregated, vacuum trucks are specifically identified, and a range of other cargo body types are identified. The truck configurations are replaced with columns for truck size/weight classifications. The sheet also allows for identification of turning movements at intersections: the data collector can indicate the direction that the truck was travelling when it approached the intersection and the direction a truck was travelling after it turned (departed the intersection). The placard type categories remain, and a field for entry of specific UN/NA placard IDs has been added. While collection of combined truck and placard data is manageable for a single data collector for roads and intersections with lower traffic volumes, it can be particularly challenging for higher volume locations. For these, it is almost essential to have data collectors working in pairs. Other data tabulation sheets may be developed by local jurisdictions as well.
140
6.7 COMMODITY OR SHIPMENT ORIGIN/DESTINATION INFORMATION
Analysis of commodity or shipment origin/destination can yield the most comprehensive information about shipments in a jurisdiction, yet is by far the most labor intensive to conduct at a level that yields data sufficient for estimating HazMat traffic flows over a network, and it is also the most mathematically intensive. In this method, access to shipping manifests is obtained through working with license and weight bureaus of authorized local and state police services, or similar vehicle inspection authorities. Shipping manifests are reviewed as part of the inspection process, and truck drivers are interviewed regarding their most likely route through a jurisdiction. Shipping paper information of interest from the 2008 ERG is shown in Appendix B, but it should be noted that shipping papers are not standardized regarding information formatting and location.
As mentioned above, not all vehicles require placards when carrying hazardous materials under threshold quantities, or required to carry only one type of placard when multiple commodity classes/divisions are present. Fortunately, shipping manifests should contain information about hazardous materials on the top for mixed freight loads. This can help ease identification of non-placarded loads, providing a more accurate picture of HazMat transport than simple placard counts.
For most LEPCs, this source of new data would be used on a more limited basis to provide an idea about where HazMat is going on major roadway networks, as well as amount of non-placarded HazMat transport. The U.S. Department of Energy (DOE) has conducted shipping manifest studies in this manner through DOE regional governor’ associations for a variety of LEPCs. The studies are conducted for 24-hour continuous counts at license and weight stations in cooperation with state enforcement agencies. Information collected includes time of day, shipment origin/destination (O/D), truck type, placard class/division/UN number, material description, and shipment weight.
A more comprehensive origin-destination/network study using this type of data is much more specialized than most LEPCs are set up to handle, and modeling of network flows using O/D data is typically performed by transportation specialists in large metropolitan planning offices, state agencies, or consultants. The analysis of this type of data is beyond the scope of this document and is anticipated under future TRB Cooperative Research Program publications.
6.8 VALIDATE DATA
It is important to address the extent to which the collected new data meet the needs of the kinds of decision objectives. This can be done in advance of the actual data analysis. For example, users might ask themselves, does precision of collected data match objectives? What other evidence might help attain decisions to implement the outcome(s) attained in the HMCFS? Addressing additional concerns helps underscore the validity of the HMCFS data:

141
• Are data appropriately documented? • Are there data outliers or questionable values? • Are data collected at similar locations consistent? • Is information consistent across different sources (baseline, existing, new field data,
and interviews)?
Further validation of the data will take place as data are analyzed. Analysis of HMCFS data are described in Chapter 7.
142
CHAPTER 7: ANALYZING DATA
7.1 HAZMAT COMMODITY FLOW ANALYSIS OVERVIEW
The ability to estimate the frequency of HazMat flows over a particular route depends on what information has been collected. The most widely-available estimates are generalized from national, regional, or statewide trends for similar route types. The most common error of attributing the state, regional, or national average flows occurs when the actual flow is more limited or does not exist. Because local officials may be familiar with the origin and destination of HazMat flows associate with fixed facilities, underestimating the risk of unique situations within the study area are less likely. This approach is therefore likely to overestimate the risk, which may squander resources by providing more attention than is warranted. These estimates can be replaced with empirically observed frequencies as they become available. Direct observation is preferred and affords greater robustness, and if that is not possible for all road segments of interest, then observation along similar routes in the study area is preferred to general trend estimates.
Analysis of HMCFS commodity flow data can range from relatively straightforward to complex, depending on the existing or new data source used and amount of manipulation or cross-referencing required. The simplest analysis will involve reviewing existing local, state, or national estimates for commodity flows, assuming those apply to the location of interest, and developing a listing of hazardous materials by class, division, or UN/NA placard ID number expected in a community. Analysis complexity increases as more locally-relevant data are used (e.g., vehicle and/or HazMat ID counts). The most complex analysis will seek to identify differences in commodity flows spatially (e.g., different network segments, intersections, etc.), temporally (time-of-day, day-of-week, season-of year, etc.) or some type of spatial-temporal combination (e.g., hotspots).
It is very important that the HMCFS project’s resources are sufficient to carry out the data analysis. While a review of existing data sources may not require any data manipulation, a complex analysis will require personnel and computing resources that are skilled in data management and validation, spread-sheeting and charting, mapping, and even statistical analysis capability. Failure to provide for such resources when scoping a complex HMCFS project will result in frustration and wasting of efforts to collect new data. This is not to minimize the importance of having a robust data set that can ultimately be used for a variety of purposes, but a recognition of the limited resources that many local have available to dedicate to an HMCFS.
143
7.2 HAZMAT COMMODITY FLOW ANALYSIS FOR RAILWAYS, PIPELINES, WATERWAYS, AND AIRWAYS
Analyzing HMCFS information for railways, pipelines, and waterways is discussed first because the process is generally straightforward:
1. Most data come from existing, previously compiled data sources. 2. The existing flow information is based on a census of all HazMat traffic in the case of
railways and waterways, and assumed to be continuous in the case of pipelines. There is no need to deal with sampling limitations, except if the STB Railway Sample Data are used, existing information is provided by shippers, receivers, and carriers, or new data are collected using some type of sampling.
Availability of locally-relevant existing flow information for airways is likely to be limited if not provided by air carriers serving the jurisdiction, and the BTS Commodity Flow Surveys represent the only other major source of publicly available data on HazMat transport by air.
Table 21 lists HazMat flow data characteristics for railway, pipeline, waterway, and airway modes. Table 22 lists HazMat flow data analysis output characteristics by data source for these modes, the maximum level of HMCFS objective that they are typically applicable for, their general relevance to a local HMCFS, and a rating of the expected effort required for analysis. Specific applications, relevance, and effort required may not conform to these guidelines in some cases.
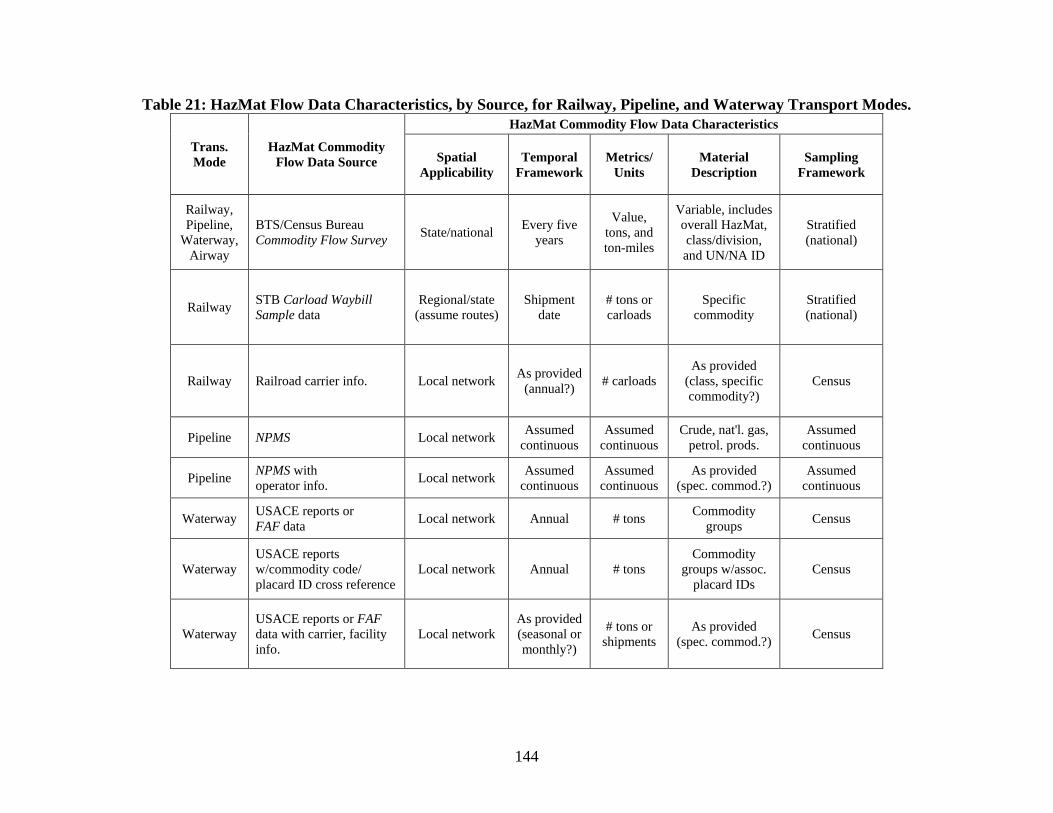
144
Table 21: HazMat Flow Data Characteristics, by Source, for Railway, Pipeline, and Waterway Transport Modes.
Trans. Mode
HazMat Commodity Flow Data Source
HazMat Commodity Flow Data Characteristics
Spatial Applicability
Temporal Framework
Metrics/ Units
Material Description
Sampling Framework
Railway, Pipeline,
Waterway, Airway
BTS/Census Bureau Commodity Flow Survey State/national Every five
years
Value, tons, and ton-miles
Variable, includes overall HazMat, class/division, and UN/NA ID
Stratified (national)
Railway STB Carload Waybill Sample data
Regional/state (assume routes)
Shipment date
# tons or carloads
Specific commodity
Stratified (national)
Railway Railroad carrier info. Local network As provided (annual?) # carloads
As provided (class, specific commodity?)
Census
Pipeline NPMS Local network Assumed continuous
Assumed continuous
Crude, nat'l. gas, petrol. prods.
Assumed continuous
Pipeline NPMS with operator info. Local network Assumed
continuous Assumed
continuous As provided
(spec. commod.?) Assumed
continuous
Waterway USACE reports or FAF data Local network Annual # tons Commodity
groups Census
Waterway USACE reports w/commodity code/ placard ID cross reference
Local network Annual # tons Commodity
groups w/assoc. placard IDs
Census
Waterway USACE reports or FAF data with carrier, facility info.
Local network As provided (seasonal or monthly?)
# tons or shipments
As provided (spec. commod.?) Census
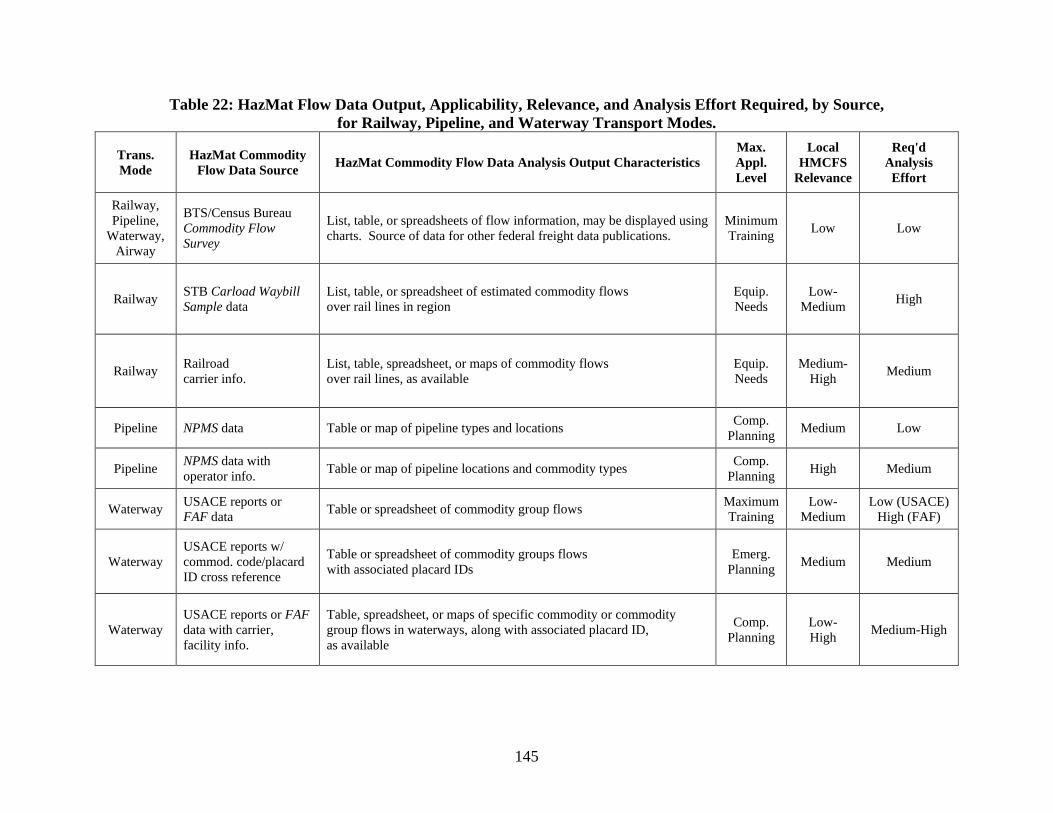
145
Table 22: HazMat Flow Data Output, Applicability, Relevance, and Analysis Effort Required, by Source, for Railway, Pipeline, and Waterway Transport Modes.
Trans. Mode
HazMat Commodity Flow Data Source HazMat Commodity Flow Data Analysis Output Characteristics
Max. Appl. Level
Local HMCFS
Relevance
Req'd Analysis
Effort
Railway, Pipeline,
Waterway, Airway
BTS/Census Bureau Commodity Flow Survey
List, table, or spreadsheets of flow information, may be displayed using charts. Source of data for other federal freight data publications.
Minimum Training Low Low
Railway STB Carload Waybill Sample data
List, table, or spreadsheet of estimated commodity flows over rail lines in region
Equip. Needs
Low-Medium High
Railway Railroad carrier info.
List, table, spreadsheet, or maps of commodity flows over rail lines, as available
Equip. Needs
Medium-High Medium
Pipeline NPMS data Table or map of pipeline types and locations Comp. Planning Medium Low
Pipeline NPMS data with operator info. Table or map of pipeline locations and commodity types Comp.
Planning High Medium
Waterway USACE reports or FAF data Table or spreadsheet of commodity group flows Maximum
Training Low-
Medium Low (USACE)
High (FAF)
Waterway USACE reports w/ commod. code/placard ID cross reference
Table or spreadsheet of commodity groups flows with associated placard IDs
Emerg. Planning Medium Medium
Waterway USACE reports or FAF data with carrier, facility info.
Table, spreadsheet, or maps of specific commodity or commodity group flows in waterways, along with associated placard ID, as available
Comp. Planning
Low- High Medium-High
146
7.3 HAZMAT COMMODITY FLOW ANALYSIS FOR TRUCKS/ROADWAYS
Table 23 lists HazMat flow data characteristics, and Table 24 lists HazMat flow data analysis output characteristics by data source for truck/roadway transport. Table 24 also lists expectation guidelines for maximum level of HMCFS objective applicability, general relevance to a local HMCFS, and general effort required for analysis. Specific applications, relevance, and effort required may not conform to these expectation guidelines in some cases.
Existing and new data can be collected at various levels, allowing alternative approaches for analysis. Existing data sources should be credited when they are used. Eleven analysis possibilities are discussed, but they are not exhaustive of all potential analysis possibilities using existing or new data discussed in this report.
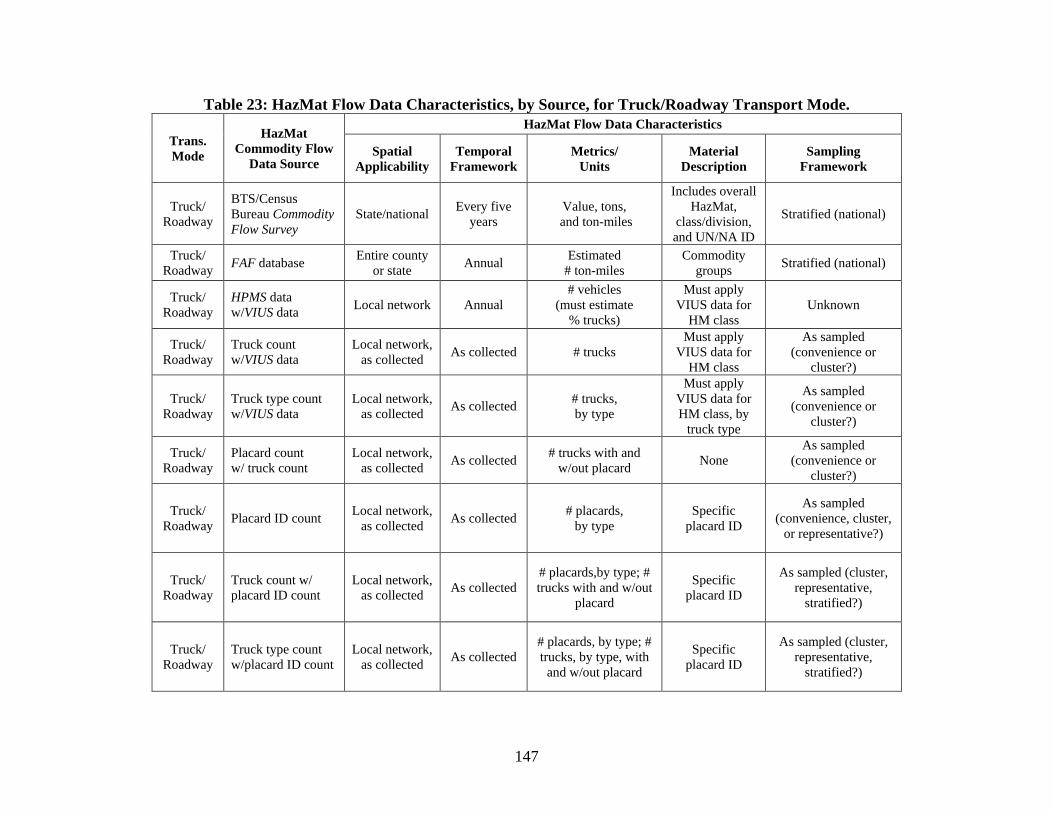
147
Table 23: HazMat Flow Data Characteristics, by Source, for Truck/Roadway Transport Mode.
Trans. Mode
HazMat Commodity Flow
Data Source
HazMat Flow Data Characteristics
Spatial Applicability
Temporal Framework
Metrics/ Units
Material Description
Sampling Framework
Truck/ Roadway
BTS/Census Bureau Commodity Flow Survey
State/national Every five years
Value, tons, and ton-miles
Includes overall HazMat,
class/division, and UN/NA ID
Stratified (national)
Truck/ Roadway FAF database Entire county
or state Annual Estimated # ton-miles
Commodity groups Stratified (national)
Truck/ Roadway
HPMS data w/VIUS data Local network Annual
# vehicles (must estimate
% trucks)
Must apply VIUS data for
HM class Unknown
Truck/ Roadway
Truck count w/VIUS data
Local network, as collected As collected # trucks
Must apply VIUS data for
HM class
As sampled (convenience or
cluster?)
Truck/ Roadway
Truck type count w/VIUS data
Local network, as collected As collected # trucks,
by type
Must apply VIUS data for HM class, by
truck type
As sampled (convenience or
cluster?)
Truck/ Roadway
Placard count w/ truck count
Local network, as collected As collected # trucks with and
w/out placard None As sampled
(convenience or cluster?)
Truck/ Roadway Placard ID count Local network,
as collected As collected # placards, by type
Specific placard ID
As sampled (convenience, cluster,
or representative?)
Truck/ Roadway
Truck count w/ placard ID count
Local network, as collected As collected
# placards,by type; # trucks with and w/out
placard
Specific placard ID
As sampled (cluster, representative,
stratified?)
Truck/ Roadway
Truck type count w/placard ID count
Local network, as collected As collected
# placards, by type; # trucks, by type, with
and w/out placard
Specific placard ID
As sampled (cluster, representative,
stratified?)
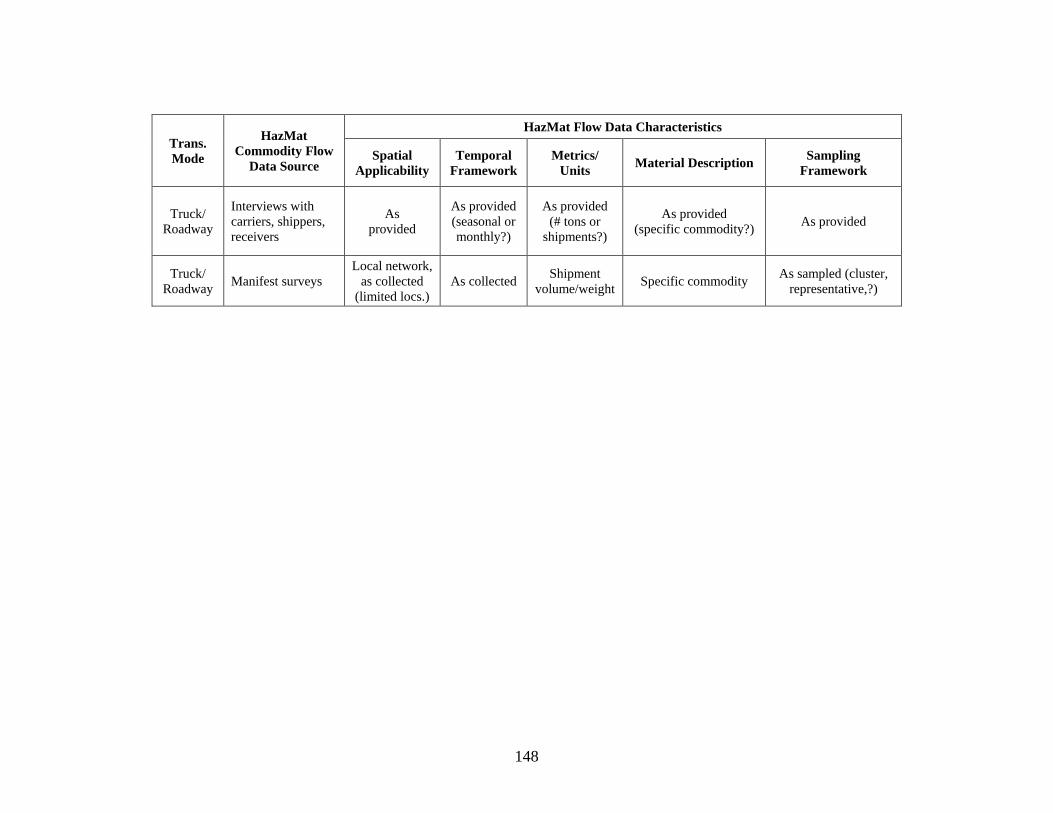
148
Trans. Mode
HazMat Commodity Flow
Data Source
HazMat Flow Data Characteristics
Spatial Applicability
Temporal Framework
Metrics/ Units Material Description Sampling
Framework
Truck/ Roadway
Interviews with carriers, shippers, receivers
As provided
As provided (seasonal or monthly?)
As provided (# tons or
shipments?)
As provided (specific commodity?) As provided
Truck/ Roadway Manifest surveys
Local network, as collected
(limited locs.) As collected Shipment
volume/weight Specific commodity As sampled (cluster, representative,?)
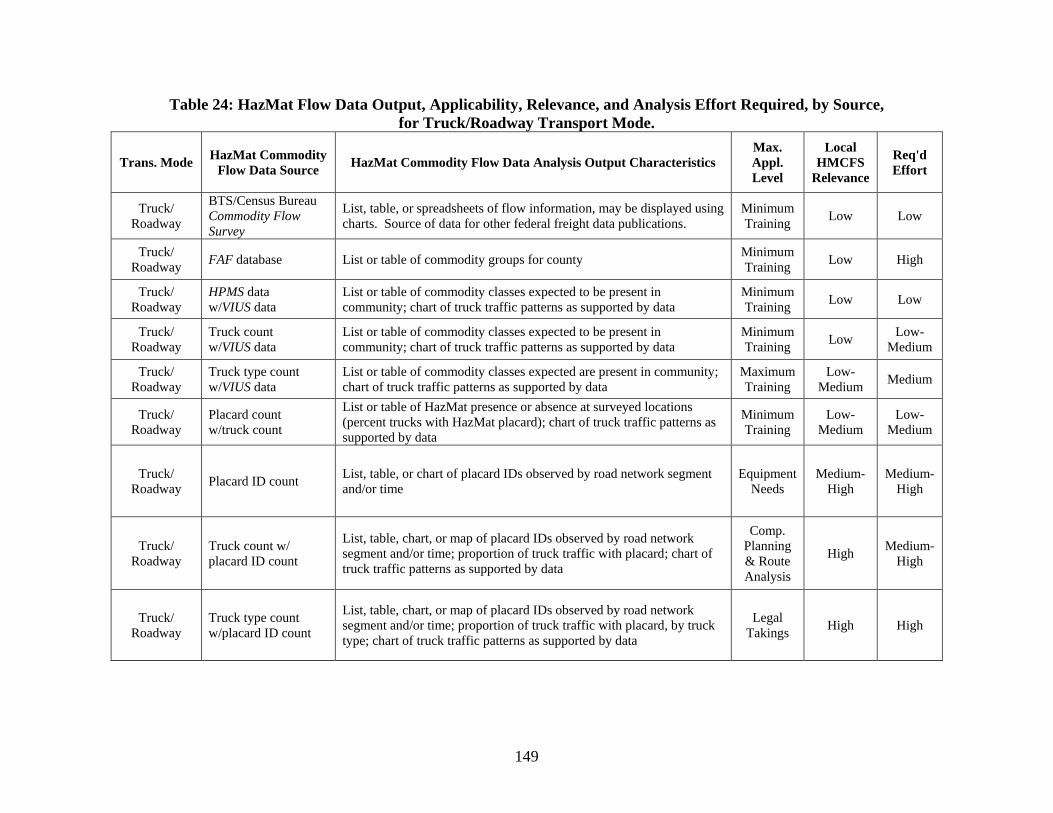
149
Table 24: HazMat Flow Data Output, Applicability, Relevance, and Analysis Effort Required, by Source, for Truck/Roadway Transport Mode.
Trans. Mode HazMat Commodity Flow Data Source HazMat Commodity Flow Data Analysis Output Characteristics
Max. Appl. Level
Local HMCFS
Relevance
Req'd Effort
Truck/ Roadway
BTS/Census Bureau Commodity Flow Survey
List, table, or spreadsheets of flow information, may be displayed using charts. Source of data for other federal freight data publications.
Minimum Training Low Low
Truck/ Roadway FAF database List or table of commodity groups for county Minimum
Training Low High
Truck/ Roadway
HPMS data w/VIUS data
List or table of commodity classes expected to be present in community; chart of truck traffic patterns as supported by data
Minimum Training Low Low
Truck/ Roadway
Truck count w/VIUS data
List or table of commodity classes expected to be present in community; chart of truck traffic patterns as supported by data
Minimum Training Low Low-
Medium
Truck/ Roadway
Truck type count w/VIUS data
List or table of commodity classes expected are present in community; chart of truck traffic patterns as supported by data
Maximum Training
Low-Medium Medium
Truck/ Roadway
Placard count w/truck count
List or table of HazMat presence or absence at surveyed locations (percent trucks with HazMat placard); chart of truck traffic patterns as supported by data
Minimum Training
Low-Medium
Low-Medium
Truck/ Roadway Placard ID count List, table, or chart of placard IDs observed by road network segment
and/or time Equipment
Needs Medium-
High Medium-
High
Truck/ Roadway
Truck count w/ placard ID count
List, table, chart, or map of placard IDs observed by road network segment and/or time; proportion of truck traffic with placard; chart of truck traffic patterns as supported by data
Comp. Planning & Route Analysis
High Medium-High
Truck/ Roadway
Truck type count w/placard ID count
List, table, chart, or map of placard IDs observed by road network segment and/or time; proportion of truck traffic with placard, by truck type; chart of truck traffic patterns as supported by data
Legal Takings High High
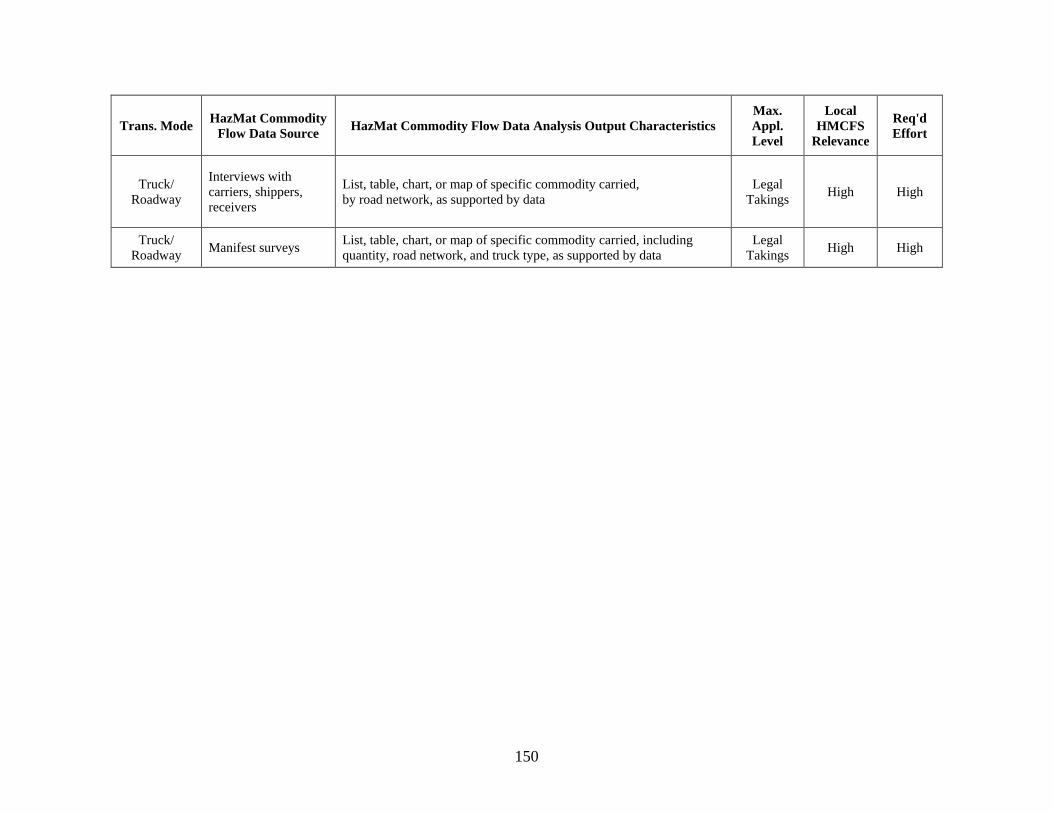
150
Trans. Mode HazMat Commodity Flow Data Source HazMat Commodity Flow Data Analysis Output Characteristics
Max. Appl. Level
Local HMCFS
Relevance
Req'd Effort
Truck/ Roadway
Interviews with carriers, shippers, receivers
List, table, chart, or map of specific commodity carried, by road network, as supported by data
Legal Takings High High
Truck/ Roadway Manifest surveys List, table, chart, or map of specific commodity carried, including
quantity, road network, and truck type, as supported by data Legal
Takings High High
151
7.3.1 Existing Data from FAF Database or BTS/Census Bureau Commodity Flow Survey
The spatial data from FHWA’s Freight Analysis Framework are available at county and state levels in terms of estimated ton-miles for commodity groups. Because the data are modeled based on a stratified national sample of economic activity, not actual traffic flows, they are only generally applicable for a local HMCFS and should only be interpreted in terms of commodity groups that can be expected to be present in a region or state. The commodity classification system in the FAF uses the Standard Classification of Transported Goods (SCTG) codes at the 2-digit level, which can be confidently associated only to the HazMat class level where the vast majority of commodities are concerned. Supported objectives may include increasing awareness about HazMat transport and minimum definition of training scenarios.
To evaluate these data:
1. Develop a listing of commodity flows for your state using Geographic Information Systems.
2. Identify commodity groups associated with HazMat transport and use the listing to indicate what may be transported in your region.
The Bureau of Transportation Statistics/U.S. Census Bureau’s 2007 Commodity Flow Survey data are applicable at a state or national level, but should only be considered generally applicable for a local HMCFS in terms of commodities that may be expected to be present in a region or state. Supported objectives may include increasing awareness about HazMat transport and minimum definition of training scenarios.
To evaluate these data:
1. Access the report at the Internet address listed for the report in Appendix D. 2. Select the desired table, review the information for HazMat shipments by mode,
class, or characteristic, for your state. 3. Develop corresponding listings and tables as an indication of what may be transported
in your region.
For example, a total of 3,344,648 million ton-miles of all commodities (hazardous and non-hazardous) were shipped in the U.S. based on the 2007 Commodity Flow Survey: 1,342,104 million ton-miles by truck. Table Sector 00: CF0700H04: Hazardous Materials Series: HazMat Shipment Characteristics by Mode by Hazardous vs. Nonhazardous status for the United States: 2007 shows that a total of 103,997 million ton-miles of truck transport were of hazardous materials. Around 7.7 percent of truck ton-miles shipped were associated with transport of hazardous materials (103,997/1,342,104).
152
A total of 181,615 million ton-miles shipped for all modes are associated with Hazard Class 3, Flammable or combustible liquids, and 55,934 million ton-miles by truck (Table Sector 00: CF0700H07: Hazardous Materials Series: HazMat Shipment Characteristics by Mode by Hazardous Class or Division for the United States: 2007 & 2002).
• Hazard Class 3, Flammable or combustible liquids correspond to 5.4 percent of all ton-miles shipped for all commodities by all modes (181,615/3,344,648), and 4.2 percent of all truck ton-miles shipped (55,934/1,342,104).
• 53.8 percent of hazardous materials shipped by truck in the U.S. were Hazard Class 3, Flammable or combustible liquids (55,934/103,997).
A total of 23,665 million ton-miles shipped by truck are associated with UN/NA Number 1203 (gasoline), 16,408 million ton-miles with UN/NA Number 1993 (flammable liquids, including diesel fuel), and 5,729 million ton-miles with UN/NA Number 1202 (diesel fuel) by truck (Table Sector 00: CF0700H08: Hazardous Materials Series: HazMat Shipment Characteristics by Mode by UN Number for the United States: 2007).
• 82 percent of Hazard Class 3, Flammable or combustible liquids shipped in the U.S. by truck were associated with UN/NA Numbers 1203, 1993, or 1202 (45,802/55,934).
• 44 percent of hazardous materials shipped by truck in the U.S. were associated with UN/NA Numbers 1203, 1993, or 1202 (45,802/103,997).
• These estimates have a very high degree of variability for the local segment, since they are drawn from a national sample. They may be off by a large degree, and additional survey data are necessary to provide further information about the validity of the data.
7.3.2 Existing Data from HPMS Combined with Existing Data from VIUS or CFS
The FHWA’s Highway Performance Monitoring System contains information for Annual Average Daily Traffic (AADT) levels for major roadway segments including the state and national highway systems. Appendix E summarizes 2002 VIUS data. Commodity flow data calculated using these sources should only be considered generally applicable for a local HMCFS in terms of level of HazMat traffic that may be expected to be present in a community because they are developed from at least three different estimates, at least one of them at the national level. Supported objectives may include increasing awareness about HazMat transport and minimum definition of training scenarios.
To evaluate these data:
1. Obtain AADT estimates for major roadway segments in your jurisdiction. 2. Determine the percentage of truck traffic in the local area that makes up total traffic
(estimate or other information source).
153
3. Apply the percentage of total traffic that is trucks to the AADT values to estimate the truck traffic levels.
4. Apply the overall percentages of HazMat truck traffic from the bottom row of the 2002 VIUS data table to the estimated truck traffic levels, or apply percentages of HazMat by truck versus all commodities by truck from the 2007 CFS, for a crude estimate of numbers of HazMat trucks on applicable segments
5. Present the information in lists and tables, as applicable.
For example: according to the HMPS traffic volume map, the AADT (all vehicles) of an Interstate section is over 100,000. An LEPC assumes that truck traffic is 15 percent of the overall traffic volume. This corresponds to over 15,000 trucks per day, on average.
Based on the 2002 VIUS data, a total of 2.3 percent of U.S. miles are driven by trucks while requiring a Class 3 placard or ‘Combustible’ placard. According to the 2007 CFS, Hazard Class 3, Flammable or combustible liquids correspond to 4.2 percent of all truck ton-miles shipped for all commodities (55,934/1,342,104). Using these estimates and assuming that all trucks on the roadway section are driven the same distance through the jurisdiction, one might expect to see from around 350 to over 600 trucks carrying Class 3 liquids per day on the Interstate. These estimates have a very high degree of variability since they mix a local estimate, a local, annual sample, and a national, annual sample; they may be off by a large degree. Additional survey data are necessary to provide further information about the validity of the data. If truck traffic levels are provided in the HMPS data, these may be used instead of the estimate as discussed in Section 7.3.3.
7.3.3 Total Truck Counts
This method improves on that described in Section 7.3.2 by conducting counts of number of trucks on different roadway segments, rather than relying on HPMS traffic level estimates. However, this method still necessitates application of overall percentages of HazMat truck traffic from the bottom row of the 2002 VIUS data table found in Appendix E, or BTS CFS data, which are national estimates. By eliminating some of the measurement error from the previous method, it is probably slightly more relevant at the local level than estimates generated entirely from existing data sources, but should still be considered only generally applicable for a local HMCFS in terms of level of HazMat traffic that may be expected to be present in a community. Conducted with convenience or representative sampling, supported objectives may include increasing awareness about HazMat transport and minimum definition of training scenarios (depending on the quantity and quality of data).
154
To evaluate these data:
1. Determine truck traffic levels and patterns. This may range from a general estimate of truck traffic in the entire jurisdiction to levels of truck traffic by time for represented locations.
2. Apply the overall percentages of HazMat truck traffic from the bottom row of the VIUS data table to the estimated truck traffic levels, or apply percentages of HazMat by truck versus all commodities by truck from the 2007 CFS, for a crude estimate of numbers of HazMat trucks for represented locations.
3. Present the information in lists, tables, and charts, as applicable.
For example, a State DOT performs counts of trucks on a section of Interstate highway. The 2007 AADTT for the Interstate was 9,210.
Based on the 2002 VIUS data, a total of 2.3 percent of U.S. miles are driven by trucks while requiring a Class 3 placard or ‘Combustible’ placard. According to the 2007 CFS, Hazard Class 3, Flammable or combustible liquids correspond to 4.2 percent of all truck ton-miles shipped for all commodities (55,934/1,342,104). Using these estimates and assuming that all trucks on the roadway section are driven the same distance through the jurisdiction, one might expect to see between around 200 and 400 trucks per day with a Hazard Class 3, Flammable Liquids placard on the Interstate. These estimates have a very high degree of variability due to the sampling of the data sources and the fact they mix a local, annual sample with a national, annual sample; they may be off by a large degree. Additional survey data are necessary to provide further information about the validity of the data.
7.3.4 Truck Type Counts
This method improves on that described in Section 7.3.3 by using counts of trucks by size and configuration (if desired) on different roadway segments, rather than relying on generic total truck counts. This allows for application of application of percentages of HazMat traffic for each truck type from respective rows of the 2002 VIUS data table found in Appendix E, which is a national estimate. By eliminating some of the measurement error from the previous method, it is probably slightly more relevant at the local level than estimates generated total truck traffic counts, and should be considered only having low-to-medium applicability for a local HMCFS in terms of level of HazMat traffic that may be expected to be present in a community, given its application of national estimates. Conducted with convenience or representative sampling, supported objectives may include increasing awareness about HazMat transport, minimum definition of training scenarios, and maximum definition of training scenarios (depending on the quantity and quality of data).
155
To evaluate these data:
1. Determine truck traffic levels and patterns by type and configuration. This may range from estimates of truck traffic in the entire jurisdiction to levels of truck traffic by time for specific locations.
2. Apply the percentages of HazMat truck traffic from the corresponding rows of the VIUS data table to the observed truck traffic levels by type and configuration for a crude estimate of numbers of HazMat trucks for represented locations.
3. Present the information in lists, tables, and charts, as applicable.
For example, an LEPC has information that shows that the 2009 truck traffic on a section of Interstate was 500 tank trucks per day, 2,500 flatbed trucks per day, 3,000 refrigerated van trucks per day, and 3,500 standard van trucks per day (the LEPC only counted trucks by type, not configuration).
Based on the 2002 VIUS data, 23.3 percent of U.S. tank truck miles, 0.5 percent of flatbed miles, 0.5 percent of refrigerated van miles, and 1.6 percent of standard van miles are driven while requiring a Class 3 placard or ‘Combustible’ placard. Using these estimates and assuming that all trucks on the roadway section are driven the same distance through the jurisdiction, one might expect to see around 200 Hazard Class 3, Flammable or combustible liquids trucks per day on the Interstate. These estimates have a high degree of variability since they mix a local, annual sample with a national, annual sample; they may be off by a large degree. Additional survey data are necessary to provide further information about the validity of the data.
7.3.5 Placard Counts Combined with Total Truck Counts
By counting the total number of trucks observed on a roadway segment and observing whether or not the truck has a HazMat placard, a locally-relevant estimate of the total percentage of truck traffic that has a HazMat placard can be made. This may be particularly useful for locations for which specifically identifying a placard (e.g., by class/division, or number) are challenging, such as locations located some distance from the observed traffic, or where traffic is travelling at high rates of speed with limited time for truck observations. For purposes of locally relevant identification of presence or absence of HazMat, this method is sufficient; however, it does not inform about the types of HazMat that being transported without application of national estimates such as the 2002 VIUS data as discussed for previous methods. Conducted with convenience or representative sampling, supported objectives may include increasing awareness about HazMat transport and minimum definition of training scenarios (depending on the quantity and quality of data).
156
To evaluate these data:
1. Determine truck traffic levels and patterns. This may range from a general estimate of truck traffic in the entire jurisdiction to levels of truck traffic by time for represented locations.
2. Determine placarded truck traffic levels and patterns. This may range from a general estimate of placarded truck traffic in the entire jurisdiction to levels of truck traffic by time for represented locations.
3. A ratio of placarded trucks to overall trucks can be estimated for applicable locations and times.
4. Present the information in lists, tables, and charts, as applicable.
For example, an LEPC conducts a 24-hour placard count during a weekday on a section of Interstate. 400 trucks were observed to have a HazMat placard during the count. The 2007 AADTT for this section of roadway was 9,250 according to the State DOT. The LEPC assumes this represents the daytime, weekday traffic level during their placard count. Using the observed placarded truck count, over 4 percent of trucks on the Interstate might display a HazMat placard if current truck traffic levels are similar to 2007 traffic levels. Assuming the placard counts follow a Poisson distribution, the LEPC is 90 percent confident the true placard count falls somewhere between 368 and 434 observations, or between 4.0 and 4.7 percent of AADTT.
Based on the 2002 VIUS data, a total of 2.3 percent of U.S. miles are driven by trucks while requiring a Class 3 placard or ‘Combustible’ placard. Based on the 2007 CFS, 53.8 percent of hazardous materials shipped by truck in the U.S. were Hazard Class 3, Flammable or combustible liquids. Using the State DOT AADTT numbers with VIUS data and assuming that all trucks on the roadway section are driven the same distance through the jurisdiction, around 200 Hazard Class 3, Flammable and combustible liquids trucks per day could be expected on the Interstate. Using the placard count with 2007 CFS data, around 230 Hazard Class 3, Flammable and combustible liquids trucks per day could be expected.
These estimates likely have a high degree of variability. They mix locally-relevant survey data with local and national samples. They may be off by a moderate degree; however, there is general agreement between the two differently derived estimates. Follow-on survey data may provide further information about the validity of the information.
7.3.6 UN/NA Placard ID Counts
Identification of specific placards that are observed enables identification of specific truck/roadway transport HazMat hazards that are present, including the relative proportion of different types of HazMat carried by trucks. As it does not include a count of trucks, it may be appropriate for use by a single data collector at busy traffic locations where both counting of
157
trucks and identifying UN/NA placard IDs is too difficult. However, when conditions permit it is probably more advantageous to count number of trucks or number of trucks by type in addition to counts of specific UN/NA placard IDs. Conducted with convenience, representative, or cluster sampling, supported objectives may include increasing awareness about HazMat transport, minimum definition of training scenarios, maximum definition of training scenarios, emergency planning, and identifying equipment needs (depending on the quantity and quality of data).
To evaluate these data:
1. Group UN/NA placard ID information according to class/division, specific ID, TIH classification and associated initial response actions, or other categories.
2. Determine levels and patterns of observed placards (by HazMat grouping). This may range from a general estimate of observed placards for the entire jurisdiction to levels of observed placards by time for specific locations.
3. Proportions of HazMat placards observed may be calculated for each grouping. 4. Present the information in lists, tables, and charts, as applicable.
For example, an LEPC collects the following information for a daytime, weekday 8-hour
placard count on a section of Interstate:
• 50 placards with UN/NA placard ID 1203 (gasoline), • 25 placards with UN/NA placard ID 1993 (various petroleum distillates), • 12 placards with UN/NA placard ID 1863 (aviation fuel), • 5 placards labeled ‘Combustible’ or ‘Fuel Oil,’ • Total number of placards counted: 200, and • Peak hourly placard count rate: 11 a.m.–12 p.m., 35 placards per hour.
Approximately 46 percent of the trucks observed with placards on the Interstate had a Hazard Class 3, Flammable or Combustible Liquids placard. This has an expected range between 39 and 53 percent, assuming a binomial distribution and that daytime, weekday HazMat traffic patterns are consistent with the observed time period. As shown these estimates have a moderate degree of variability. They are based on locally-relevant survey data, but the sample was over a limited time period. They may be off by a moderate degree, and follow-on survey data may provide further information about the validity of the information.
7.3.7 UN/NA Placard ID Counts Combined with Total Truck Counts
This method improves on that described in Section 7.3.6 by including a count of total trucks in addition to counts of specific UN/NA placard IDs. Not only can it be used to identify presence of commodities associated with specific UN/NA placard IDs, it can also be used to
158
estimate the proportion of observed truck traffic that is placarded. HazMat transportation information is approaching higher levels of local information while limiting complexity with counts of total trucks rather than truck type. Conducted with convenience, representative, cluster, stratified/proportional, or random sampling, supported objectives may include increasing awareness about HazMat transport, minimum definition of training scenarios, maximum definition of training scenarios, emergency planning, identifying equipment needs, comprehensive planning, and route analysis (depending on the quantity and quality of data).
To evaluate these data:
1. Group UN/NA placard ID information according to class/division, specific ID, TIH classification and associated initial response actions, or other categories.
2. Determine levels and patterns of observed placards (by HazMat grouping). This may range from a general estimate of placarded truck traffic in the entire jurisdiction to levels of placarded truck traffic by time for specific locations.
3. Determine truck traffic levels and patterns. This may range from a general estimate of truck traffic in the entire jurisdiction to levels of truck traffic by time for specific locations.
4. Proportions of HazMat placards observed (by grouping) to total truck traffic may be calculated.
5. Present the information in lists, tables, charts, and maps, as applicable.
For example, an LEPC collects the following information for a daytime, weekday 8-hour placard count on section of Interstate:
• 50 placards with UN/NA placard ID 1203 (gasoline), • 25 placards with UN/NA placard ID 1993 (various petroleum distillates), • 12 placards with UN/NA placard ID 1863 (aviation fuel), • 5 placards labeled ‘Combustible’ or ‘Fuel Oil,’ • Total number of placards counted: 200, • Total number of trucks counted: 5,000, • Peak hourly placard count rate: 11 a.m.–12 p.m., 35 placards per hour, and • Peak hourly truck count rate: 1 p.m. to 2 p.m., 600. Approximately 1.8 percent of all trucks observed on the Interstate had a Hazard Class 3,
Flammable or Combustible Liquids placard. Approximately 4 percent of all trucks observed on roadway had a HazMat placard, assuming that daytime, weekday HazMat and overall traffic patterns are consistent with the observed timeperiod. Hazardous materials truck traffic appears to peak during the late morning. As shown these estimates have a moderate degree of variability. They are based on locally-relevant survey data, but the sample was over a limited timeperiod.
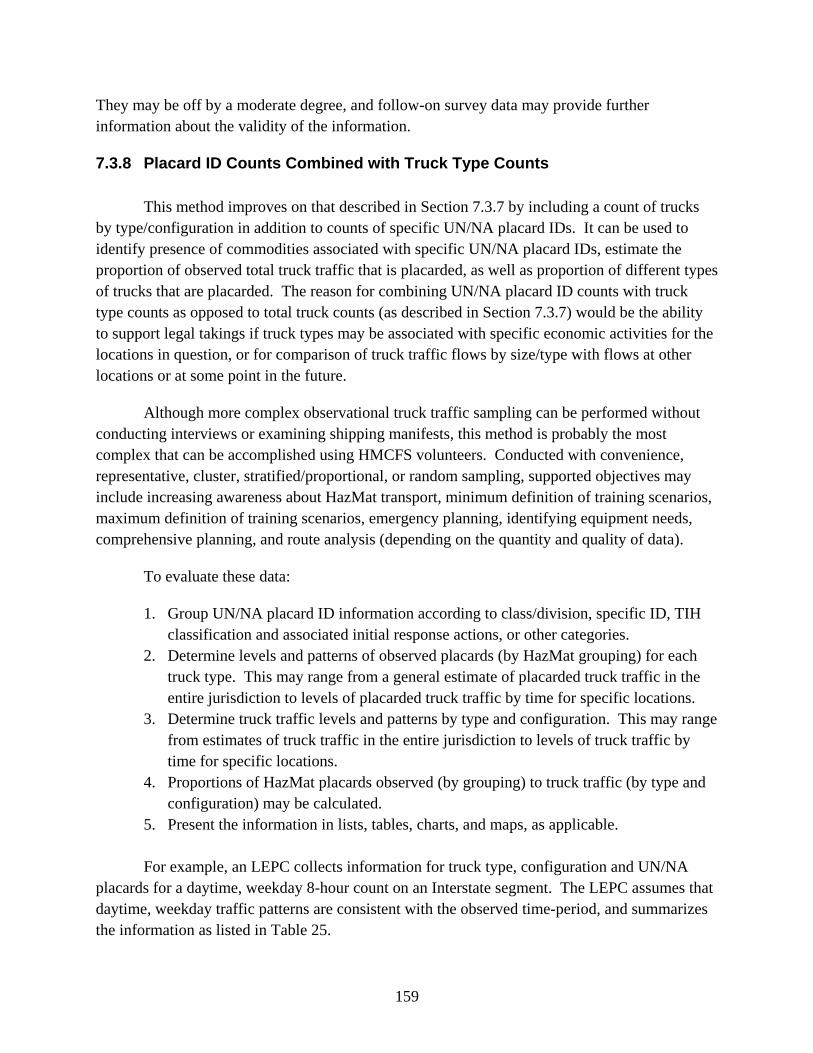
159
They may be off by a moderate degree, and follow-on survey data may provide further information about the validity of the information.
7.3.8 Placard ID Counts Combined with Truck Type Counts
This method improves on that described in Section 7.3.7 by including a count of trucks by type/configuration in addition to counts of specific UN/NA placard IDs. It can be used to identify presence of commodities associated with specific UN/NA placard IDs, estimate the proportion of observed total truck traffic that is placarded, as well as proportion of different types of trucks that are placarded. The reason for combining UN/NA placard ID counts with truck type counts as opposed to total truck counts (as described in Section 7.3.7) would be the ability to support legal takings if truck types may be associated with specific economic activities for the locations in question, or for comparison of truck traffic flows by size/type with flows at other locations or at some point in the future.
Although more complex observational truck traffic sampling can be performed without conducting interviews or examining shipping manifests, this method is probably the most complex that can be accomplished using HMCFS volunteers. Conducted with convenience, representative, cluster, stratified/proportional, or random sampling, supported objectives may include increasing awareness about HazMat transport, minimum definition of training scenarios, maximum definition of training scenarios, emergency planning, identifying equipment needs, comprehensive planning, and route analysis (depending on the quantity and quality of data).
To evaluate these data:
1. Group UN/NA placard ID information according to class/division, specific ID, TIH classification and associated initial response actions, or other categories.
2. Determine levels and patterns of observed placards (by HazMat grouping) for each truck type. This may range from a general estimate of placarded truck traffic in the entire jurisdiction to levels of placarded truck traffic by time for specific locations.
3. Determine truck traffic levels and patterns by type and configuration. This may range from estimates of truck traffic in the entire jurisdiction to levels of truck traffic by time for specific locations.
4. Proportions of HazMat placards observed (by grouping) to truck traffic (by type and configuration) may be calculated.
5. Present the information in lists, tables, charts, and maps, as applicable.
For example, an LEPC collects information for truck type, configuration and UN/NA placards for a daytime, weekday 8-hour count on an Interstate segment. The LEPC assumes that daytime, weekday traffic patterns are consistent with the observed time-period, and summarizes the information as listed in Table 25.
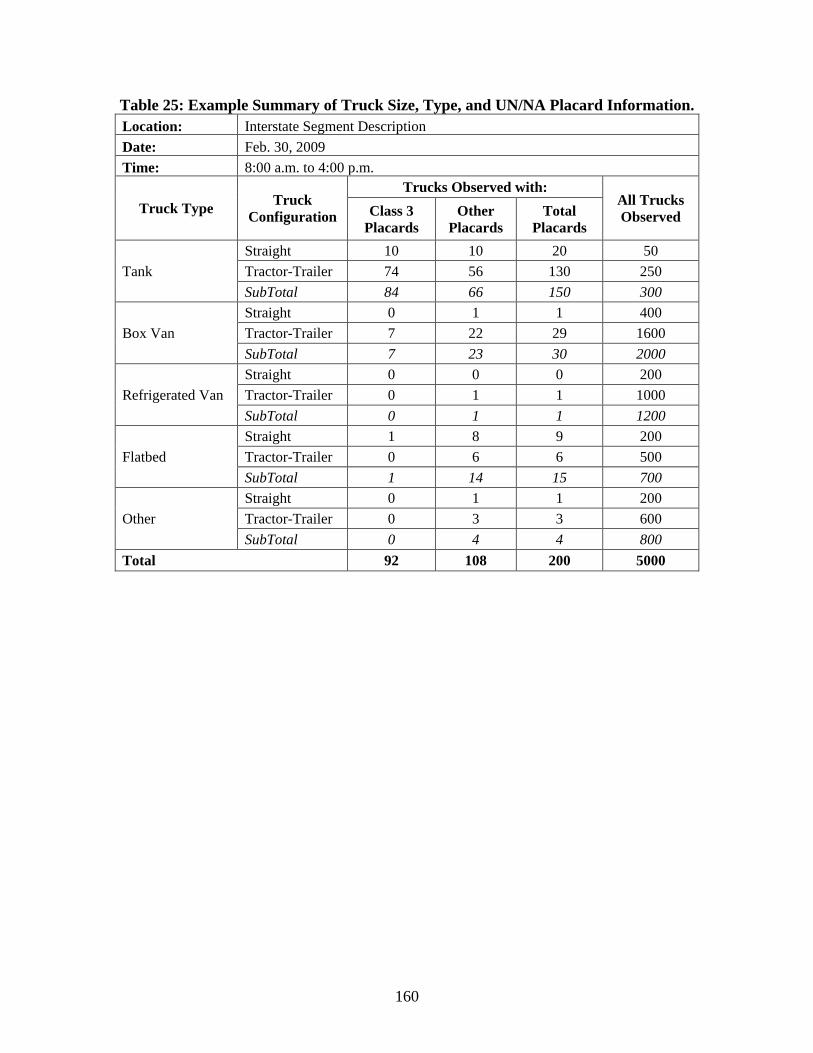
160
Table 25: Example Summary of Truck Size, Type, and UN/NA Placard Information. Location: Interstate Segment Description Date: Feb. 30, 2009 Time: 8:00 a.m. to 4:00 p.m.
Truck Type Truck Configuration
Trucks Observed with: All Trucks Observed Class 3
Placards Other
Placards Total
Placards
Tank Straight 10 10 20 50 Tractor-Trailer 74 56 130 250 SubTotal 84 66 150 300
Box Van Straight 0 1 1 400 Tractor-Trailer 7 22 29 1600 SubTotal 7 23 30 2000
Refrigerated Van Straight 0 0 0 200 Tractor-Trailer 0 1 1 1000 SubTotal 0 1 1 1200
Flatbed Straight 1 8 9 200 Tractor-Trailer 0 6 6 500 SubTotal 1 14 15 700
Other Straight 0 1 1 200 Tractor-Trailer 0 3 3 600 SubTotal 0 4 4 800
Total 92 108 200 5000

161
Table 26 summarizes the proportions of HazMat trucks and proportions of all trucks with Hazard Class 3 placard and other placards. Table 27 summarizes the hourly 90-percent confidence intervals for proportions of placarded trucks versus all trucks.
As shown these estimates have a moderate degree of variability. They are based on locally-relevant survey data, but the sample was over a limited time period. They may be off by a moderate degree but appear to suggest that some differences in HazMat traffic patterns exist, if they follow the same pattern. Follow-on survey data may provide further information about the validity of the information
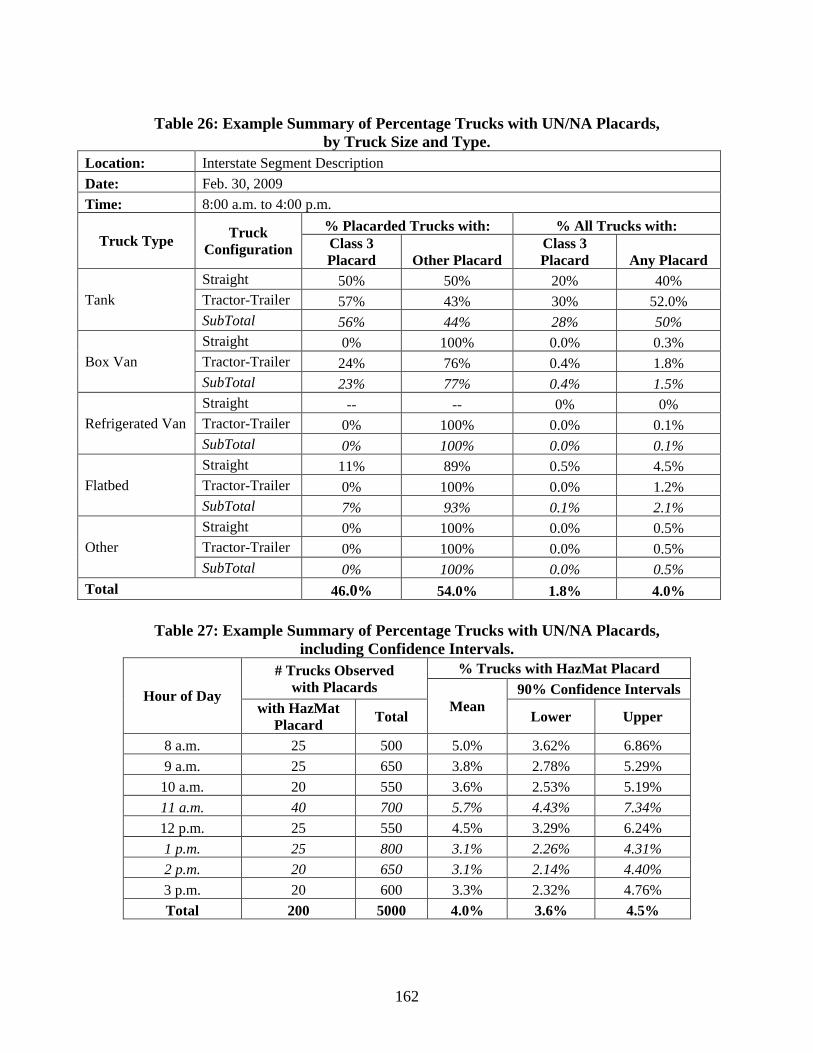
162
Table 26: Example Summary of Percentage Trucks with UN/NA Placards,
by Truck Size and Type. Location: Interstate Segment Description Date: Feb. 30, 2009 Time: 8:00 a.m. to 4:00 p.m.
Truck Type Truck Configuration
% Placarded Trucks with: % All Trucks with: Class 3 Placard Other Placard
Class 3 Placard Any Placard
Tank Straight 50% 50% 20% 40% Tractor-Trailer 57% 43% 30% 52.0% SubTotal 56% 44% 28% 50%
Box Van Straight 0% 100% 0.0% 0.3% Tractor-Trailer 24% 76% 0.4% 1.8% SubTotal 23% 77% 0.4% 1.5%
Refrigerated Van Straight -- -- 0% 0% Tractor-Trailer 0% 100% 0.0% 0.1% SubTotal 0% 100% 0.0% 0.1%
Flatbed Straight 11% 89% 0.5% 4.5% Tractor-Trailer 0% 100% 0.0% 1.2% SubTotal 7% 93% 0.1% 2.1%
Other Straight 0% 100% 0.0% 0.5% Tractor-Trailer 0% 100% 0.0% 0.5% SubTotal 0% 100% 0.0% 0.5%
Total 46.0% 54.0% 1.8% 4.0%
Table 27: Example Summary of Percentage Trucks with UN/NA Placards, including Confidence Intervals.
Hour of Day # Trucks Observed
with Placards % Trucks with HazMat Placard
Mean 90% Confidence Intervals
with HazMat Placard Total Lower Upper
8 a.m. 25 500 5.0% 3.62% 6.86% 9 a.m. 25 650 3.8% 2.78% 5.29%
10 a.m. 20 550 3.6% 2.53% 5.19% 11 a.m. 40 700 5.7% 4.43% 7.34% 12 p.m. 25 550 4.5% 3.29% 6.24% 1 p.m. 25 800 3.1% 2.26% 4.31% 2 p.m. 20 650 3.1% 2.14% 4.40% 3 p.m. 20 600 3.3% 2.32% 4.76% Total 200 5000 4.0% 3.6% 4.5%
163
7.3.9 A Note on Statistical Analysis
The 1995 Guidance includes a discussion of statistical considerations for traffic count data, including flow that vary randomly, or in daily, weekly, or seasonal patterns. A table is provided in the Guidance for confidence intervals based on a Poisson distribution, which can be used for modeling discreet event data such as truck counts. This is not the only distribution that is applicable for count information. For example, the data in Table 25 and other examples were evaluated using a binomial distribution modified for extreme proportions (below 0.1 and above 0.9). Other analyses might include regression models.
We are not minimizing the technical expertise of many LEPCs by any means, but the fact is that most LEPCs do not have actively involved personnel who are well-versed in transportation statistical methodologies. We suggest that LEPCs and other local entities who are conducting an HMCFS at objectives levels where statistical considerations are important seek the advice of transportation professionals who are trained in these analyses. Individuals with this sort of expertise can often be found at universities, larger local (MPO), state, or federal agencies, or consulting firms. The range of potential statistical methods that may be applied are not covered in this report and may be found in statistics and transportation engineering textbooks or other sources.
7.3.10 Interviews with HazMat Shippers, Receivers, and Carriers
Interviews with HazMat shippers, receivers, and carriers, as well as with emergency responders and managers and other key informants, are discussed in Section 5.2. Unless many interviews are conducted, it is unlikely that sufficient information will be obtained using this method to develop reliable estimates of HazMat transportation over roadway network segments. Limited information from interviews can be used to confirm HazMat presence and help define priority sampling locations and frameworks.
1. For each interview, list the date, time, and identity of the individual, along with a description of information relevant to the HMCFS project.
2. Compile the interview results in lists or paragraphs.
7.3.11 Shipping Manifests (Origin/Destination)
This is the most resource-intensive new data collection method described (Section 5.7) for HMCFS. As with interviews with shippers, receivers, and carriers, a great deal of shipping manifest information is needed to develop reliable estimates of HazMat transportation over local roadway networks, and full use of information obtained from shipping manifests requires advanced transportation modeling techniques. With less information, an examination of shipping manifests can be used to confirm HazMat presence, help define priority sampling
164
locations and frameworks, and provide information about percentage of non-placarded shipments that are carrying HazMat.
1. For each manifest examined, list the date, time, carrier, HazMat commodity and quantities, along with a description of information relevant to the HMCFS project provided by the carrier including their origin and destination, routes taken, and the ultimate origin and destination of the shipment if known.
2. Compile the results in tables, and summarize data accordingly.
7.4 DOCUMENTING HMCFS DATA
The purpose of the HMCFS process is to enhance a local jurisdiction’s ability to identify the inherent risks associated with the flow of HazMat into, out of, within, and through an area. From a conservative standpoint, in order to provide even a minimally acceptable level of protection, a lack of information about potential HazMat flows in a community would necessitate being prepared for almost anything. This is highly inefficient. Increasing knowledge about potential HazMat flows through a community not only helps identify what preparedness measures are more likely to be needed, it also helps identify what preparedness measures are less likely to be needed. This ability depends on three critical components:
1. Identifying where, when, and how HazMat is transported (and associated likelihood of incident occurrence);
2. Identifying what is transported (type of HazMat and associated characteristics); and 3. Determining the consequences associated with incident occurrence (incident
likelihood and who may be impacted).
The analysis of collected data and resulting description of HazMat flows depends a great deal upon the characteristics of that data. In turn, the ability to characterize HazMat flows, along with information about historical incident/accident information and population distributions, affects what can be stated about knowledge of associated risks. The HMCFS data are summarized and presented using lists, tables, charts, and maps, and this information can be used in the risk assessment. There are two goals for increasing knowledge of risks: the ability to confirm that risks are present and the ability to estimate or quantify the risks that are present.
7.4.1 Identifying HazMat Flows
The nature of the data required to verify potential HazMat flows varies. Some routes will positively verify potential flows with relatively moderate (even convenience) samples, others may require more robust sampling. The problem arises especially when HazMat flows are not empirically observed. In these cases, a statewide, regional, or national frequency may be used as the best estimate of HazMat transport frequencies along these routes until confirmed otherwise.
165
While instances where the national average would underestimate the risk can occur, the conditions giving rise to this (e.g., communities between the supplier and end-users of hazardous materials) are not likely to escape local attention. The result is an identification of all routes (or route segments) and their associated potential flows of HazMat in the study area. This information can be presented through a categorized listing, a table, or spatial designation through mapping of the study area transport networks and associated risk levels.
With a wide range of data sources and HMCFS objectives, the potential options for implementation of HMCFS data range considerably. This potential is evident in the range of responses provide to the survey and demonstrate in the case studies. Data analysis examples in Section 7.3 show a variety of potential applications that use only existing data, a mix of existing and new data, or all new data. These examples are not exhaustive of the type of evaluations that can be performed.
The data sampling and precision determine the specificity of information that can by concluded about HazMat Transport. Matching sampling and precision with HMCFS objectives is discussed further in Chapter 9. Of themselves, the estimates obtained using methods from Sections 7.3.1, 7.3.2, and 7.3.3 are useful for improving awareness about potential HazMat transport in the community or establishing very general training scenarios. As the local specificity of the information increases in Sections 7.3.4 and 7.3.5 (assuming appropriate sampling), training scenarios can become more defined, particularly if the information is compared with historical incident information.
As locally-relevant information increases in Sections 7.3.6 and 7.3.7, training scenarios can become increasingly defined and, with results confirmed by further data, the information becomes more useful for emergency planning activities. Information in Section 7.3.8 is very locally specific, and with results confirmed by further data, they can be used not only for defining training or general emergency planning needs but also identifying equipment needs, allocating resources, and possibly for route analysis justification, depending on data quality, sampling, and precision. For these higher levels of analysis, evaluating ranges of expected values at some level of confidence (90 percent and 95 percent are probably appropriate for this type of analysis) can help users understand the specificity of the information and its effect on conclusions needed to support HMCFS objectives. These evaluations should be carried out by persons with a good understanding of sampling and transportation statistics.
To illustrate these applications, consider the hypothetical case study of “Center County LEPC.” Sometown, Texas, is the main city in Center County. Sometown is approximately 30 miles from Megacity and has an Interstate highway through it. The county has a history of agricultural production and is the location for an industrial facility that uses and ships hazardous materials and a small crude petroleum processing facility. Sometown is a demographically young and growing community with a small paid fire department, and a mostly unincorporated
166
surrounding area that is served by volunteer fire departments. It has been several years or longer since the most of the VFDs have conducted any HazMat training or reviewed their standard operating guidelines for HazMat response. The last time mutual aid agreements or emergency response service incident command procedures were reviewed for any department in the county was in 2003, and the county population has grown by 50 percent since then.
While the Center County LEPC is interested in HazMat transport throughout the county, they are particularly interested in a stretch of Interstate highway east of Sometown that has the industrial facility and subdivisions on the other, including a large elementary school. Center County LEPC decides to conduct a HazMat CFS mostly to help them define training needs but possibly other applications as well. The LEPC wants to better understand the variability underlying the collected data and understand whether HazMat transportation patterns may vary by time of day. One of the LEPC members knows a faculty member from Megacity University who lives in Center County, and they agree to assist with statistically evaluating the data, where needed, as part of a class project.
Assume that the examples given in Section 7.3 apply to the Interstate segment of interest to Center County LEPC, and that the LEPC might have obtained information about HazMat transport over the segment by any one of those methods. Using information from Sections 7.3.1, 7.3.2, or 7.3.3, the LEPC might be able to raise awareness of local officials about the potential magnitude of the problem, or identify that a large number of Class 3 HazMat trucks may be going through their community and plan for training accordingly. However, few conclusions can be drawn beyond that. Using the information from Sections 7.3.4 or 7.3.5 the LEPC has better information about the types of incidents that can be expected, and although some estimates of the magnitude of potential exposure improve, the reliability of conclusions is still lower.
Using information from Sections 7.3.6 or 7.3.7, the LEPC can start to get a better handle on the type, magnitude, and source of potential exposures, although additional data would be advised. Using information from Section 7.3.8 improves on this even further by providing information about when potential exposures might occur. Not only does the LEPC have better information about HazMat transport over the segment, but the locally-relevant evidence provides justification if the LEPC needs to request modifications to practices or allocation of additional resources from other local, state, or federal agencies.
For example, by examining the confidence intervals, it appears that the proportion of truck traffic carrying HazMat during the late morning period (11 a.m.–12 p.m.) over the segment may be significantly higher than the early afternoon period (1 p.m.–3 p.m.). This information is not conclusive given that intervals identify the likely range of hourly HazMat truck traffic averages at a 90 percent level of confidence. But it appears to make sense since the shipping manager of the industrial facility near the segment was interviewed (Section 7.3.9) and indicated they do most of their shipments in the late morning. Occasionally some of those shipments are
167
Class 2.3 gases by large flatbed truck. Although traffic during the 8 a.m. to 9 a.m. period has a high average as well, it is not statistically different from any other time period. Say, for example, the elementary school sends half-day students home at 11:30 a.m., and those buses use the roadway segment of concern (it is the shortest, most direct route). The LEPC and school district may want to consider whether there are alternate routing options, even if they are less direct. The community and school may also wish to review shelter-in-place, evacuation, and emergency notification systems to ensure that protocols and procedures reflect potential hazards.
7.4.2 Risk Estimation
Procedures for conducting the risk assessment calculations are well established and depend on specific characteristics of the local setting, commodities that are transported, and modes of transport. Risk estimation calculations are particularly applicable for designation of hazardous materials route analysis but can also be useful for other objectives such as emergency planning and community planning. The general concepts for risk estimation are based on the resulting proportion of time that hazardous materials are present along a route, multiplied by the chance of accident or incident to determine the likelihood of occurrence.
For each route that is identified as having a potential HazMat flow, the estimated frequency of HazMat flow along that route is the base on which the accident rate applies to determine likelihood of incident. The frequency of HazMat flow along potential routes is based on the existing or new data that were collected for the HMCFS. Historical incident/accident information and population locations provide additional perspectives regarding level of risks due to HazMat transport over particular segments.
When HazMat commodity flows are identified at a sufficient level of detail, they can be characterized by commodity movements (e.g., tons, carloads, or number of vehicle/placard observations) on a spatial (e.g., each route or route segment) and temporal basis (e.g., daily, monthly, annually, etc.). It is important to remember that such estimates can be highly inaccurate when lower level sampling techniques or small sample sizes are used as the basis for flow frequency estimation.
Some suggested sources for further information on HazMat transport risk analysis are:
• Highway Routing of Hazardous Materials: Guidelines for Applying Criteria. Publication Number FHWA-HI-97-003. National Highway Institute, Federal Highway Administration, U.S. Department of Transportation. 1996.
• Guidelines for Chemical Transportation Risk Analysis. Center for Chemical Process Safety, American Institute of Chemical Engineers. New York, NY. 1995 (66).
168
7.4.3 Spatial Elements of Risk Estimation
A focus on HazMat flow routes or route segments that contribute significantly to the overall risk in the study area can provide insight into better management techniques and even risk reductions. Routes or route segments contribute significantly when they are characterized by high frequency of HazMat flow. Routes or route segments that frequently exceed capacity, are narrow or winding, are frequently under construction, have (draw) bridges, tunnels or other bottlenecks are often characterized by high accident rates and become priority for more extensive analysis. Routes or route segments with special populations located nearby, such as schools, hospitals, or nursing homes also receive high priority. Routes or route segments with truck stops, weigh stations, rest stops, and side-tracks may receive attention because of the associated delays along the route increasing the presence of transported hazardous materials.
7.4.4 Temporal Elements of Risk Estimation
To the extent that routes or route segments will be significantly impacted by time of day, day of the week, or season of the year, the HMCFS should consider the temporal patterns of activities. Metropolitan and larger urban areas usually exhibit daily traffic patterns that can have a significant impact on HazMat flow routes and thus need to be considered. Other daily variations in traffic patterns and flows may arise due to shift changes, commute to work, and school hours. As identified in the TMG, some communities that lack major through-routes will exhibit drastically less traffic during the dead-of-night hours compared with daylight hours. Others with major-through routes may not see a drastic reduction in traffic on these routes. Nearly all communities in the United States exhibit a weekly pattern with weekdays and weekends exhibiting marked differences. Many areas experience seasonal variations associated with the economic activity of the area (e.g., agricultural areas have planting and harvesting seasons, tourist areas have tourist seasons, petroleum refining areas have seasonal production patterns, etc.). These variations can significantly alter HazMat flows in the area.
7.4.5 HazMat Incident/Accident Likelihoods
The likelihood of a HazMat accident is determined by multiplying the accident rate by the traffic volume, which implies that accident data or estimates and traffic volume data are collected for each route or route segment. PHMSA’s HazMat Incidents Reports Database has detailed information on incidents at local, state, and national level that were required to be reported to PHMSA under 49 CFR 171.16 (67). These data are available for all modes of transportation except pipelines.
Pipeline accidents are rare, but the ever-present nature of the commodity being transported suggests that when accidents occur they result in a HazMat release. Waterway accidents are also rare and often transport non-hazardous commodities, which reduces the overall
169
likelihood of accident but with potentially massive quantities. Rail accident data as collected from the Federal Railway Administration may be examined to determine the likelihood of rail accidents in the study area. Areas that have not experienced prior accidents can estimate accident likelihood based on state, regional, or national averages for railways of the same class for future accidents. Overall and HazMat truck accident rate information is presented in Section 5.3.6 for national-level statistics, while local accident rate information may be available from state emergency response and transportation agencies, or similar agencies in large metropolitan areas.
Careful examination of local accident/incident history may help emergency managers make decisions on staffing, scheduling, and resource allocation. While local patterns many be different from these national trends, apparent differences should be understood in light of local conditions. Unique spikes or dips that are not related to unique local conditions may require further validation to form the basis of critical decisions.
Figure 37 presents hourly frequencies of serious in-transit HazMat highway incidents reported to PHMSA between 2002 and 2008. Two national patterns are readily apparent in these data. First, the weekend-weekday difference indicates that weekends have lower accident rates—beginning around 4:00 a.m. on Saturday morning and continuing through to Monday morning rush hour at around 5:00 a.m. Secondly, the weekday pattern is relatively stable across days-of-the-week—characterized by a slight increase in the early morning hours (i.e., right after midnight and declining after 3:00 or 4:00 a.m.), then increasing into the early hours of the workday (i.e., reaching a peak around 8:00 to 10:00 a.m.), and declining throughout the rest of the day (i.e., reaching low levels again around 10:00 or 11:00 p.m.).
Jurisdictions with access to local accident information may be able to develop similar charts, whether for HazMat in large metropolitan areas or at the state level, truck accidents at local or state levels, or general traffic accidents at local or state levels. Note that patterns of truck traffic accidents may not directly compare with those of general traffic accidents, with truck accidents tending to be higher in the early daytime hours, and general traffic accidents higher later in the daytime. For further information see the accident data sources described in Section 5.3.6.
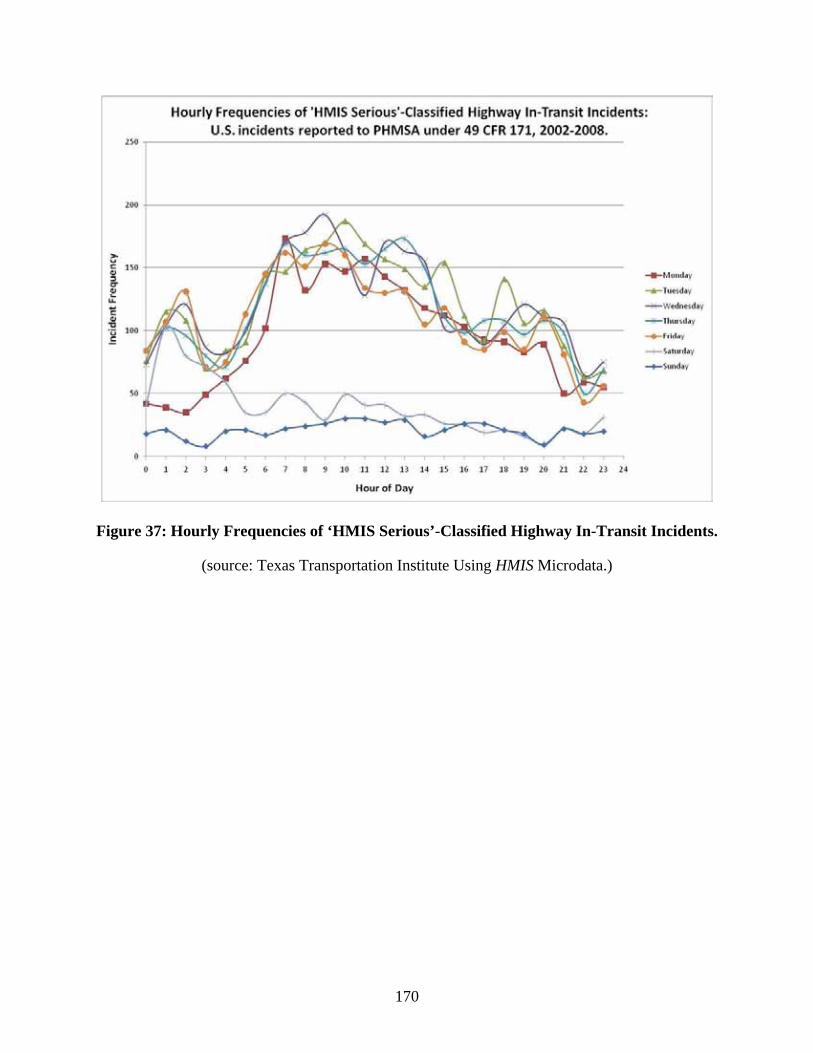
170
Figure 37: Hourly Frequencies of ‘HMIS Serious’-Classified Highway In-Transit Incidents.
(source: Texas Transportation Institute Using HMIS Microdata.)
171
7.4.6 Properties of HazMat Commodities
The volumes of various HazMat flows in terms of specific HazMat ID or class are used with the accident rates to provide an overview of the study area. Because these data are often estimates based on averages for areas that are much larger than the study area, these data are used to help focus additional research on specific transportation modes, hazard classes, and specific commodities being transported in the study area. While the goal of an HMCFS may be to identify specific or general types of HazMat being transported in the study area, identifying every single potentially hazardous material passing through the area is extremely difficult—especially when the nature of the HazMat flows in the area are complex and variable. Some areas find it advisable to concentrate on general classes of materials (e.g., flammables, corrosives) being transported.
The reporting requirements of Title III of the Superfund Amendments and Reauthorization Act (SARA) of 1986 have increased the information about hazardous materials in fixed facilities, but transportation of HazMat is not required to be reported under SARA Title III and is typically not provided to LEPCs. However, SARA III information about substances used to produce final products at a facility can be a critical indicator of flow patterns; in addition, these facilities can be interviewed regarding transport of hazardous materials as discussed in Section 5.2.
When detailed (e.g., placard number) data are available, these data can be used to establish in implications of various accidents in terms of potential consequences. For example many communities have flows of fuel (i.e., gasohol, gasoline, motor spirit, petrol), HazMat ID number 1203. The 2008 ERG indicates that this material is highly flammable and will easily ignite by heat, sparks or flames, and may form explosive vapors when mixed with air. The potential for irritation of the skin and eyes if inhaled or contacted are included among the health impacts. Procedures (Guide Number 128) outlined in the 2008 ERG indicate immediate isolation of the spill or leak to a distance of 50 meters, with downwind evacuation for large spills of at least 300 meters, and up to 800 meters in all directions if the tank (car or truck) is involved in fire.
Other commodities often found in communities include anhydrous ammonia (UN/NA placard ID 1005, Guide Number 125) and chlorine (UN/NA placard ID 1017, Guide Number 124). The 2008 ERG suggests initial isolation of 30 and 60 meters for small spills of ammonia and chorine, respectively, with daytime downwind evacuations of 0.1 and 0.2 km, respectively. Small nighttime spills increase the recommended evacuation distances to 0.2 and 1.6 km, respectively. The 2008 ERG suggests isolation of 150 and 600 meters for large spill of ammonia and chlorine, respectively, and downwind daytime evacuation zones of 0.8 and 3.5 km, respectively. Nighttime distances expand to 2.3 and 8.0 km for large spills of ammonia and
172
chlorine, respectively. These distances establish a potential hazard zone the corresponding routes or route segments in the study area.
7.4.7 Potential Consequences of HazMat Releases
The negative consequences of potential accidents are most often expressed in terms of the potential for human exposure. This exposure is related to the spatial-temporal distribution of people relative to the HazMat route or route segment. The residential population in the potential hazard zone is critical, particularly during certain periods of time (e.g., evenings, late nights, and weekends). Retail and commercial areas are of particular interest during peak use periods (e.g., shopping malls during the holiday season, office buildings during typical work hours). Special populations, particularly those located in (or near) the potential hazard zone require special attention. Planners may wish to focus on special-population facilities that reside in a confluence of potential hazard zones associated with various routes or route segments. The congregation of masses of people for special gatherings (e.g., large sporting or entertainment events, fairs, religious or political events) may also require focused attention. Event planners may wish to consider relocating some events to venues outside the potential hazard zone. Consequences associated with potential accidents are most likely to occur among populations, special populations, and mass congregations located in the potential hazard zone at the time of the accident.
7.4.8 Hotspots Analysis
With at least four critical components of HazMat risk analysis (i.e., time, space, hazardous materials, and people) and virtually infinite possibilities of each, the possible outcomes can seem both complex and somewhat overwhelming. Spatial-temporal analysis, commonly called hotspots analysis, can help LEPCs discover times and places where the co-location of people and hazardous materials need special attention. It may be as simple as asking where does presence of people and hazardous materials (releases or potential for releases) occur in space and time. Suppose a critical rail line runs services a particular plant, and passes by an elementary school. The co-location of the school and the rail line in the same space is potentially problematic, but if the HMCFS finds that the facility served by the rail line only loads and ships hazardous materials at night, the potential for concern is mitigated substantially. Hotspots analysis is discussed further in Section 9.7 for Promising Practice 9.
173
CHAPTER 8: IMPLEMENTATION OF HMCFS INFORMATION Closing the HMCFS life-cycle by using it to make decision objectives a reality is critical
in making it worthwhile. Also critical to HMCFS implementation is a recognition and complete appreciation of the limitations of the study. A review of the choices made in the conduct of the HMCFS will help decision-makers recognize how the kinds of actions to apply the study are impacted and what additional information might be required to make higher-order decisions.
8.1 REVIEW OBJECTIVES AND LIMITATIONS
Before the results of the HMCFS can be meaningfully implemented, a review of the objectives and goals guiding the HMCFS and the limitations involved in the conduct of the HMCFS helps decision-makers interpret and apply the results appropriately. For example, suppose the HMCFS result indicates that traffic on a through-town route may be unacceptable; but the risk estimates are based on national data on traffic using routes with similar classifications, and the HazMat estimates using 2002 VIUS or 2007 CFS data. Implementing actions like route adjustments that can call for acquiring property (sometimes through condemnation) on the basis of national data of similar places will likely prove difficult. If the risk estimates are based on local traffic data, local HazMat data, or both, then implementing the actions needed to mitigate these risks is likely to be accomplished with greater ease. Hence interpreting the results of the HMCFS with respect to specific goals in the context of the limitations of the study is essential to taking action as a result of the findings. Reviewing the objectives and limitations of the HMCFS involves:
• listing specific objectives, • listing the HMCFS results that bear on each outcome, and • identifying the limitations associated with each result.
Within this context, decision-makers should determine the extent to which these results merit the actions to mitigate, avoid, or prepare for the risk. The strengths and weaknesses of the HMCFS may require the modification of the original objectives to take advantage of strengths and avoid inherent weaknesses of the information provided. When specific objectives, results to support them, and the basis of the information are placed side by side (as illustrated in Table 28), the impact of actions (or the recommendations thereof) to be taken is placed in the context of the nature of the data and robustness of the results in the HMCFS.
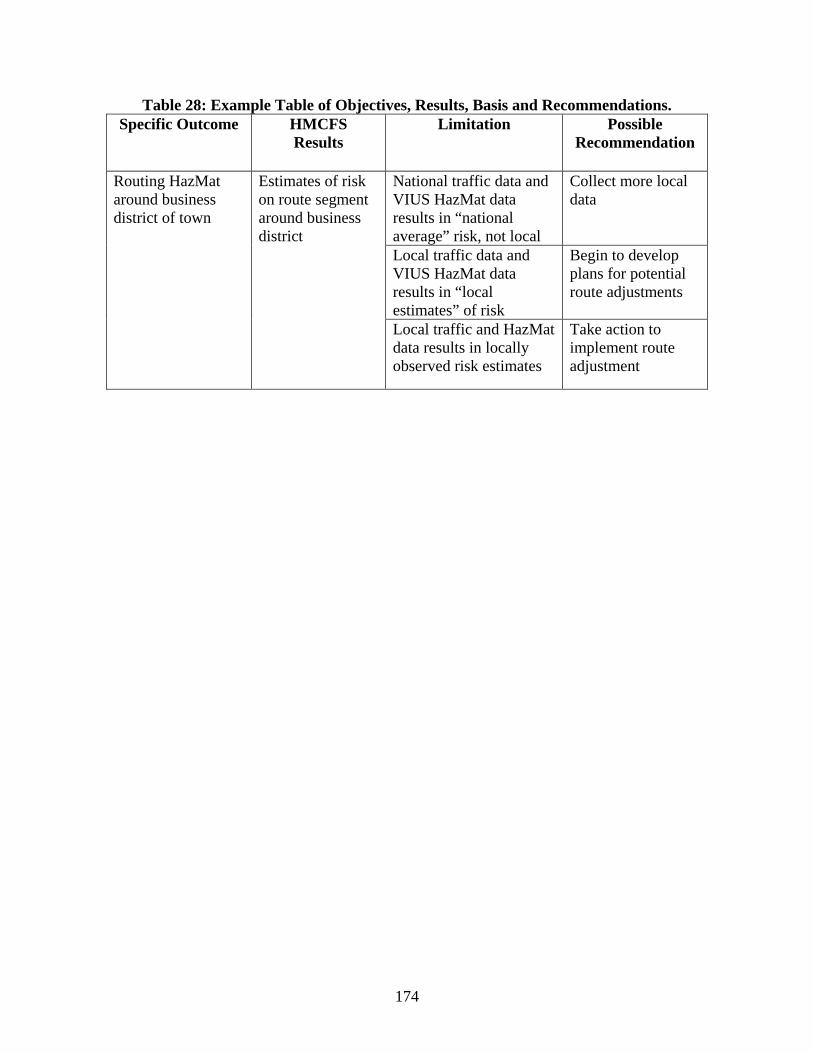
174
Table 28: Example Table of Objectives, Results, Basis and Recommendations. Specific Outcome HMCFS
Results Limitation Possible
Recommendation
Routing HazMat around business district of town
Estimates of risk on route segment around business district
National traffic data and VIUS HazMat data results in “national average” risk, not local
Collect more local data
Local traffic data and VIUS HazMat data results in “local estimates” of risk
Begin to develop plans for potential route adjustments
Local traffic and HazMat data results in locally observed risk estimates
Take action to implement route adjustment
175
8.2 DISSEMINATING AND COMMUNICATING HMCFS INFORMATION
8.2.1 Dissemination
The dissemination of the HMCFS is technically comprised of the one-way communication of the results of the study to various audiences. The act of dissemination essentially answers the question, to whom are the HMCFS results sent?
Dissemination of HMCFS results is a relatively simple three-step process.
1. Decide the critical results that can be communicated in a one-way communication without clarification or elaboration;
2. Decide to whom these critical results should be delivered and collect contact information; and
3. Deliver the documents, videos, or presentations to the contacts listed in step two.
In addition, the critical results can be placed on a website for dissemination, and interested parties can be invited to download the information at their leisure. To take advantage of existing dissemination channels, the media can be invited to a briefing on the HMCFS.
A list of HMCFS participants can be assembled from project records, and augmented with parties that have expressed interest in the HMCFS and other known end-users. Deciding what HMCFS objectives and results to disseminate may prove more challenging. Because dissemination implies a one-way communication (without feedback, clarification or interpretation), dissemination is limited to the most robust results stemming directly from the empirical result(s) without interpretation—limited to obvious outcomes.
These limitations make communicating complex, or sophisticated abstractions from the direct empirical results difficult. Hence the disseminated results are the simplest, most direct, and generic results stemming from a well-conducted HMCFS. Results at this level require little or no explanation—they are self evident.
Disseminated results are often the most obvious. This does not mean they have no value! For example the discoveries of HazMat flows where they were previously not known to exist have clear, self evident implications; they are straight-forward and extremely important for the well being and safety of the community.
8.2.2 Communication
The communication of the HMCFS information focuses on the decisions about the critical and more-subtle tendencies that are important to communicate to critical stakeholders. It
176
includes identification of stakeholders that will have special interest in the project results. Tailoring the message to the interests of each critical stakeholder will help engage them in the implementation process. It is technically comprised of two-way interaction about the study results with these stakeholders. This risk communication allows for:
• discussion and interpretation of results; • sharing of more-subtle information (e.g., impressions, suggestions); and • higher-order interpretations, such as the connection between stakeholder experience
and expertise and what was observed directly.
Hence, communication of HMCFS results in multi-way communication often involves discussion of the findings and their underlying meaning for the decision outcome(s) being considered. This multi-way discussion also can help explain the complexities of the desired decision outcome(s) and the precision of the data collection effort to assure that the HMCFS is not interpreted beyond its information capacity—decisions based on too little information are usually risky.
Communication of HMCFS results to critical stakeholders is more intense and time consuming than simple dissemination but also provides feedback about the validity of the study results and the communication of them to various audiences. It can involve:
• scheduling and holding meetings; • making presentations; • holding open forums; and • engaging in personal communication with critical stakeholders.
8.3 APPLY HMCFS RESULTS TO OBJECTIVES
The HMCFS is living document in that it contributes to ongoing planning processes including, emergency planning, transportation planning, comprehensive planning, equipment purchase planning, and HazMat route planning. Presenting them in a document is but a momentary snapshot of an ongoing process. The printed HMCFS is static, a codification of the results in a single place for future reference—a reference document. Simply stopping at this point and putting the document on-the-shelf may meet the letter of the contractual agreements and legal obligations, but it fails to stimulate discussion, decision-making, or proactive response to impending situations.
The application of the HMCFS to specific objectives is best understood in the local context. The re-examination of objectives and basis of each result provides the initial confidence in or robustness of the HMCFS results—including the variation of place-to-place and outcome-to-outcome. The communication of the results helps validate the information (does it fit with the
177
understanding/experience of local experts?) and allows for feedback about the underlying meaning of the HMCFS.
In this context, the recommendation for an implementation decision is a local matter. Implementation involves actively engaging various groups of interested parties, stakeholders, community leaders, industry, and other end users. To begin, sponsors of the HMCFS should be engaged to meet either implied or explicit contractual agreements. Participants were engaged in the HMCFS process because they have some vested interest. This interest, together with their active participation, makes them some of the most likely people to use the HMCFS for its intended purposes.
• Community leaders such as the county judge and commissioners, the mayor(s) and council(s), fire and police chiefs, and county sheriff have an interest in using these data to provide for community well-being and safety.
• Personnel engaged in emergency planning and response, at all levels public and private, will find the results of the HMCFS directly relevant to their missions.
• Hospital administrators are likely to find the results useful to validate emergency operations plans. In addition, because hospitals are often located near major transportation corridors to allow access (i.e., locations most likely to be impacted by releases along those corridors) they must also be concerned about response plans to assure the safety and wellbeing of patients and staff.
• While nursing and convalescent care facilities are less likely to have the access-engendered problem, they may find themselves located in potentially impacted corridors and in need of emergency response plans to accommodate HazMat concerns.
• Public school officials are likely to have similar concerns about their locations and student wellbeing and safety.
Sharing these data with community leaders provides a validation of the data, engenders buy-in, and increases the likelihood of the study being used for its intended purpose(s). All these officials should be engaged to inform, protect, and serve the community’s best interest. Each of these critical people and the offices they represent should be:
• briefed on the results of the HMCFS; • asked to provide any conflicting data or information; • asked to provide any data that may confirm the results; and • asked to document any adjustments they are likely to consider based on the HMCFS.
The briefings should include discussions about implications of the findings. Decisions or changes that need to be made can be identified, as well as who has authority to take action. Recommendations regarding needed changes or actions should be made. Conflicts may need to
178
be resolved but ultimately strengthen the outcomes; confirmation of HMCFS results validates the study.
High-level decision objectives (e.g., takings, comprehensive planning and equipment purchases) that have a robust basis for HMCFS results and are validated by comparison with nearby communities (e.g., with shared corridors) or feedback from local experts (e.g., fire chief, plant manager) are likely to have more robust support. However, the same high-level outcome with less basis, limited support from other sources, and contradictory feedback are likely to receive less support. Lower-level objectives (e.g., choosing training exercise scenarios or for awareness campaigns) are not likely to need this level of robustness to avoid ridicule—they need only “avoid being laughable” (or subject to ridicule) to serve the desired goal. Credibility or validity of information is not as important for lower-level objectives, hence, application can easily follow relatively weak results. As the costs increase, the reliability, validity, and robustness of the results should increase proportionally.
8.4 ARCHIVING THE HMCFS
8.4.1 Local Archiving
Once the HMCFS dissemination and communication processes are complete at the local level, the issue becomes how can it be preserved into the future in such a way as to encourage its use in ongoing processes. The first question that will have to be addressed is, what to preserve? Clearly the results of the study should be preserved. In addition, all materials disseminated to interested parties should be preserved as different materials may focus on different aspects of the HMCFS. Identifying the sources of existing data and locations and procedures for collected data are useful both for documenting what was done, and as a template of where to begin next time. Presentations can also be archived for future use in documenting changes or stable patterns.
Documents should be archived at a variety of locations so that focused catastrophes cannot wipe out all records. For example, they can be stored in county records, municipal records, sent to federal and state authorities, as well as on websites and at the public library. This will help make it nearly impossible for one failure to wipe out all the documentation of the HMCFS. Moreover, to the extent that electronic records allow for information management, searching, retrieval, and distribution from decentralized locations, electronic archival is preferred. This underscores further the need to archive through several locations to avoid being lost in the future.
8.4.2 Proposed Approach for a Centralized Directory
Access to data is a significant challenge for local emergency planning committees in conducting HazMat commodity flow survey. Existing data can be found in several formats, including existing CFS data from other LEPCs, particularly those that share common transport
179
corridors. In the survey conducted for this project, we asked LEPCs about whether they exchange HMCFS information with other LEPCs (Table 8). The survey responses indicate that approximately 15 percent of LEPCs in jurisdictions with populations of 25,000 or less have ever been asked by another LEPC for a copy of their HMCFS, increasing to around 40 percent for LEPCs with jurisdiction populations of 100,000 or greater. Around 18 percent of LEPCs in the smallest jurisdictions have ever asked another LEPC for a copy of their HMCFS, increasing to around 30 percent for larger LEPCs.
Clearly there is a substantial gap between the actual use and potential availability of valuable HMCFS information by local communities. The low levels of HMCFS exchange suggest that some way to enhance this practice is greatly needed in the LEPC community. One such approach is a centralized directory. Such a directory might simply be a database of LEPCs who have conducted an HMCFS, along with data fields describing the CFS content. Such a directory could also potentially function as a repository for hazardous materials commodity flow surveys. This information could also include representative examples of HMCFS conducted by urban or rural LEPCs in communities of various sizes and geographical settings and lessons learned related to aspects such as data sources, monetary, personnel, hardware, and software resources, data collection and analysis methodologies, formulation of results, and practical applications of findings.
There are two basic approaches for HMCFS centralized directories: maintaining a true directory that only contains information about HMCFS content, and maintaining a directory/repository that includes information about HMCFS content as well as archived copies of the documents.
8.4.2.1. Directory of Hazmat CFS Information
A directory of HMCFS information would maintain information about what CFS efforts have been undertaken, by and for whom, and what their content is. The complexity of the directory could range from low (very basic information about the HMCFS) to high (detailed information about the content of the HMCFS).
Obviously a key function of the directory would be to serve as a searchable source of HMCFS information. Because of this, a high degree of standardization would be necessary for most fields. It is suggested that checkboxes be used primarily (with binary field values), and that text entry be minimized except for those fields where it is absolutely necessary. Search functions could allow local planners and other CFS-interested users to search the directory in order to identify nearby entities that have conducted an HMCFS, or search for certain types of HMCFS content in order to identify entities whose study might serve as a model document. The search function could allow local, state, and federal officials to review the state-of-the-practice and identify how HMCFS projects are being conducted relative to funding levels.

180
Among the primary users of an HMCFS directory are volunteers who would have a range of technical capabilities. Implementation of an HMCFS directory could include development of a directory ‘how-to’ guide, possibly with some examples of how LEPCs can use information from adjacent or common corridor commodity flow studies. Such a guide might identify who the potential users of the HMCFS directory are to help increase relevance to the emergency management/responder community.
Table 29 summarizes a potential listing of fields for an HMCFS directory, grouping the directory information in three cumulative levels of complexity, lower, medium, and higher, each level building upon the previous one.
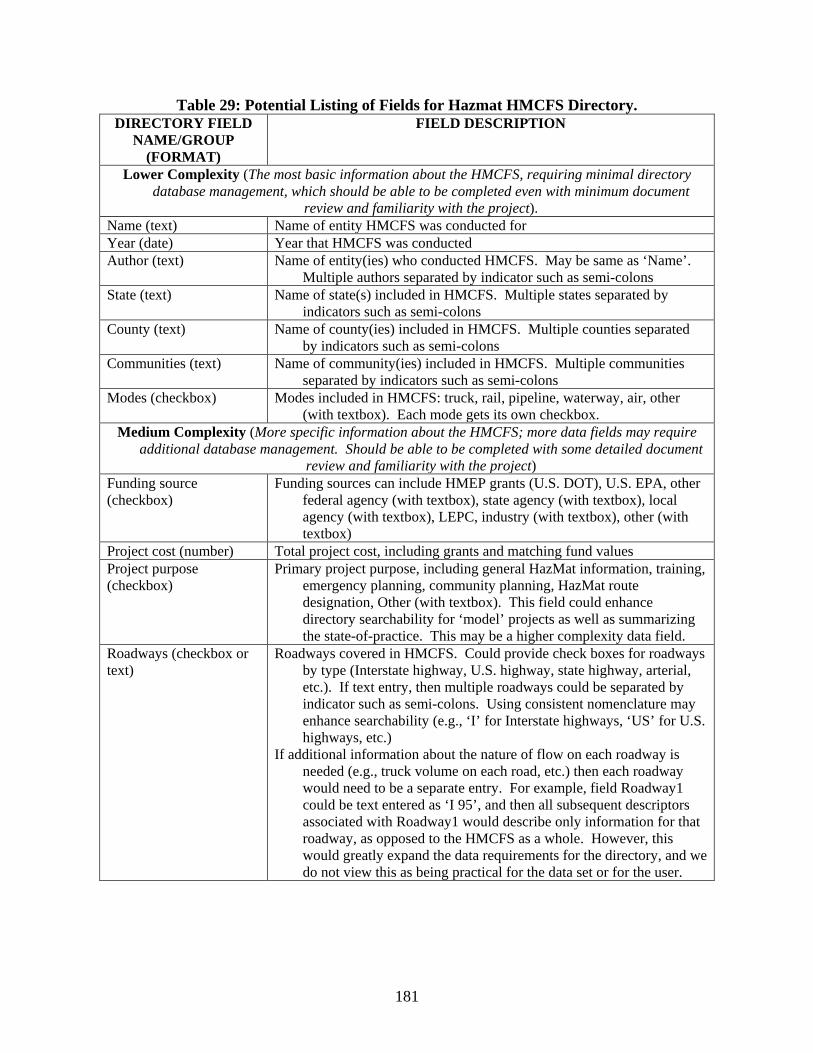
181
Table 29: Potential Listing of Fields for Hazmat HMCFS Directory. DIRECTORY FIELD
NAME/GROUP (FORMAT)
FIELD DESCRIPTION
Lower Complexity (The most basic information about the HMCFS, requiring minimal directory database management, which should be able to be completed even with minimum document
review and familiarity with the project). Name (text) Name of entity HMCFS was conducted for Year (date) Year that HMCFS was conducted Author (text) Name of entity(ies) who conducted HMCFS. May be same as ‘Name’.
Multiple authors separated by indicator such as semi-colons State (text) Name of state(s) included in HMCFS. Multiple states separated by
indicators such as semi-colons County (text) Name of county(ies) included in HMCFS. Multiple counties separated
by indicators such as semi-colons Communities (text) Name of community(ies) included in HMCFS. Multiple communities
separated by indicators such as semi-colons Modes (checkbox) Modes included in HMCFS: truck, rail, pipeline, waterway, air, other
(with textbox). Each mode gets its own checkbox. Medium Complexity (More specific information about the HMCFS; more data fields may require
additional database management. Should be able to be completed with some detailed document review and familiarity with the project)
Funding source (checkbox)
Funding sources can include HMEP grants (U.S. DOT), U.S. EPA, other federal agency (with textbox), state agency (with textbox), local agency (with textbox), LEPC, industry (with textbox), other (with textbox)
Project cost (number) Total project cost, including grants and matching fund values Project purpose (checkbox)
Primary project purpose, including general HazMat information, training, emergency planning, community planning, HazMat route designation, Other (with textbox). This field could enhance directory searchability for ‘model’ projects as well as summarizing the state-of-practice. This may be a higher complexity data field.
Roadways (checkbox or text)
Roadways covered in HMCFS. Could provide check boxes for roadways by type (Interstate highway, U.S. highway, state highway, arterial, etc.). If text entry, then multiple roadways could be separated by indicator such as semi-colons. Using consistent nomenclature may enhance searchability (e.g., ‘I’ for Interstate highways, ‘US’ for U.S. highways, etc.)
If additional information about the nature of flow on each roadway is needed (e.g., truck volume on each road, etc.) then each roadway would need to be a separate entry. For example, field Roadway1 could be text entered as ‘I 95’, and then all subsequent descriptors associated with Roadway1 would describe only information for that roadway, as opposed to the HMCFS as a whole. However, this would greatly expand the data requirements for the directory, and we do not view this as being practical for the data set or for the user.
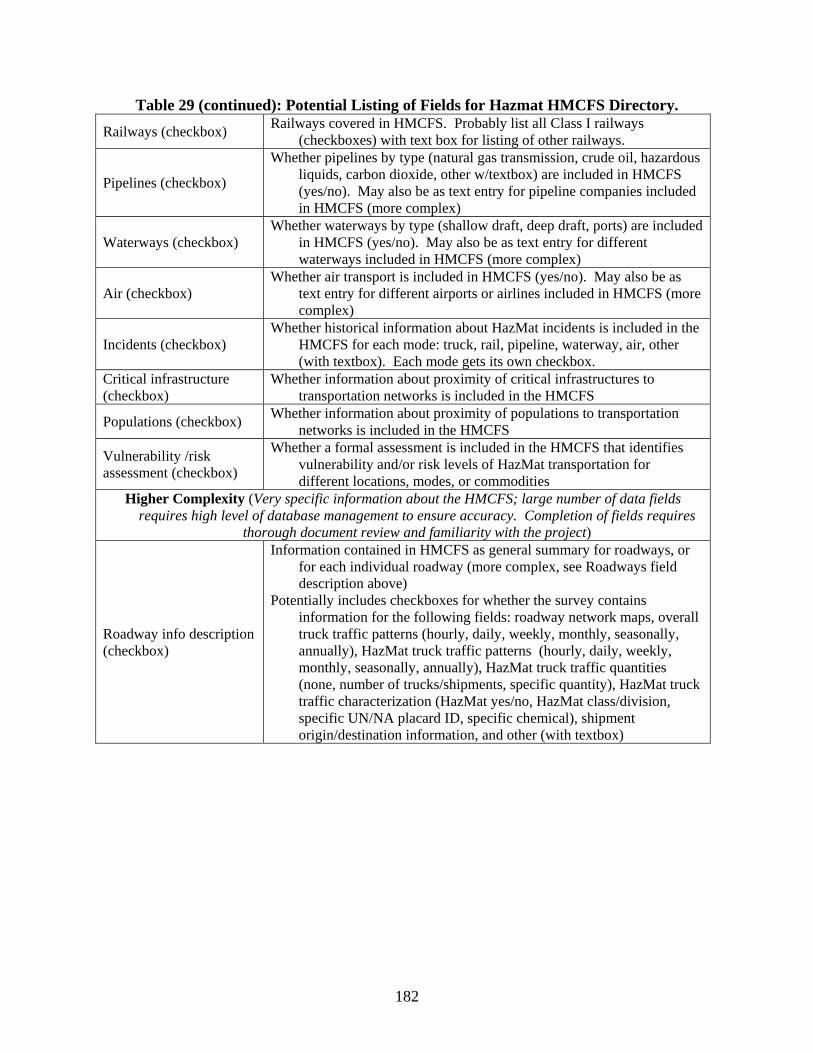
182
Table 29 (continued): Potential Listing of Fields for Hazmat HMCFS Directory. Railways (checkbox) Railways covered in HMCFS. Probably list all Class I railways
(checkboxes) with text box for listing of other railways.
Pipelines (checkbox) Whether pipelines by type (natural gas transmission, crude oil, hazardous
liquids, carbon dioxide, other w/textbox) are included in HMCFS (yes/no). May also be as text entry for pipeline companies included in HMCFS (more complex)
Waterways (checkbox) Whether waterways by type (shallow draft, deep draft, ports) are included
in HMCFS (yes/no). May also be as text entry for different waterways included in HMCFS (more complex)
Air (checkbox) Whether air transport is included in HMCFS (yes/no). May also be as
text entry for different airports or airlines included in HMCFS (more complex)
Incidents (checkbox) Whether historical information about HazMat incidents is included in the
HMCFS for each mode: truck, rail, pipeline, waterway, air, other (with textbox). Each mode gets its own checkbox.
Critical infrastructure (checkbox)
Whether information about proximity of critical infrastructures to transportation networks is included in the HMCFS
Populations (checkbox) Whether information about proximity of populations to transportation networks is included in the HMCFS
Vulnerability /risk assessment (checkbox)
Whether a formal assessment is included in the HMCFS that identifies vulnerability and/or risk levels of HazMat transportation for different locations, modes, or commodities
Higher Complexity (Very specific information about the HMCFS; large number of data fields requires high level of database management to ensure accuracy. Completion of fields requires
thorough document review and familiarity with the project)
Roadway info description (checkbox)
Information contained in HMCFS as general summary for roadways, or for each individual roadway (more complex, see Roadways field description above)
Potentially includes checkboxes for whether the survey contains information for the following fields: roadway network maps, overall truck traffic patterns (hourly, daily, weekly, monthly, seasonally, annually), HazMat truck traffic patterns (hourly, daily, weekly, monthly, seasonally, annually), HazMat truck traffic quantities (none, number of trucks/shipments, specific quantity), HazMat truck traffic characterization (HazMat yes/no, HazMat class/division, specific UN/NA placard ID, specific chemical), shipment origin/destination information, and other (with textbox)
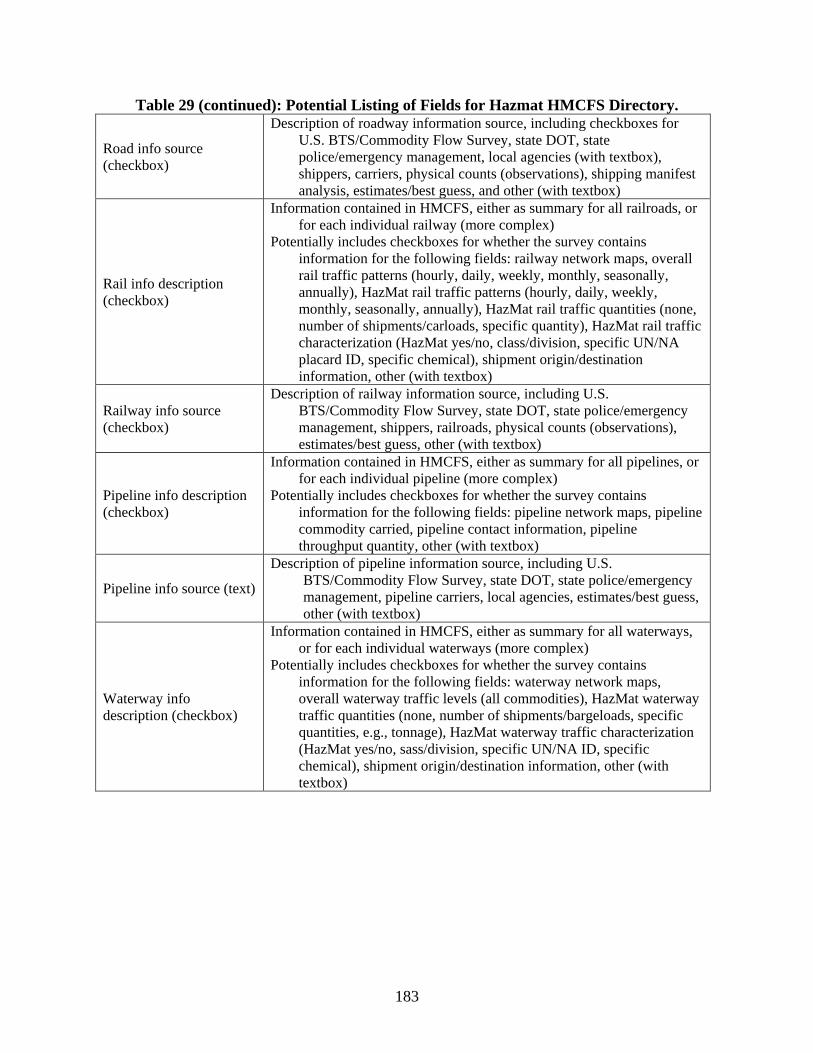
183
Table 29 (continued): Potential Listing of Fields for Hazmat HMCFS Directory.
Road info source (checkbox)
Description of roadway information source, including checkboxes for U.S. BTS/Commodity Flow Survey, state DOT, state police/emergency management, local agencies (with textbox), shippers, carriers, physical counts (observations), shipping manifest analysis, estimates/best guess, and other (with textbox)
Rail info description (checkbox)
Information contained in HMCFS, either as summary for all railroads, or for each individual railway (more complex)
Potentially includes checkboxes for whether the survey contains information for the following fields: railway network maps, overall rail traffic patterns (hourly, daily, weekly, monthly, seasonally, annually), HazMat rail traffic patterns (hourly, daily, weekly, monthly, seasonally, annually), HazMat rail traffic quantities (none, number of shipments/carloads, specific quantity), HazMat rail traffic characterization (HazMat yes/no, class/division, specific UN/NA placard ID, specific chemical), shipment origin/destination information, other (with textbox)
Railway info source (checkbox)
Description of railway information source, including U.S. BTS/Commodity Flow Survey, state DOT, state police/emergency management, shippers, railroads, physical counts (observations), estimates/best guess, other (with textbox)
Pipeline info description (checkbox)
Information contained in HMCFS, either as summary for all pipelines, or for each individual pipeline (more complex)
Potentially includes checkboxes for whether the survey contains information for the following fields: pipeline network maps, pipeline commodity carried, pipeline contact information, pipeline throughput quantity, other (with textbox)
Pipeline info source (text) Description of pipeline information source, including U.S.
BTS/Commodity Flow Survey, state DOT, state police/emergency management, pipeline carriers, local agencies, estimates/best guess, other (with textbox)
Waterway info description (checkbox)
Information contained in HMCFS, either as summary for all waterways, or for each individual waterways (more complex)
Potentially includes checkboxes for whether the survey contains information for the following fields: waterway network maps, overall waterway traffic levels (all commodities), HazMat waterway traffic quantities (none, number of shipments/bargeloads, specific quantities, e.g., tonnage), HazMat waterway traffic characterization (HazMat yes/no, sass/division, specific UN/NA ID, specific chemical), shipment origin/destination information, other (with textbox)
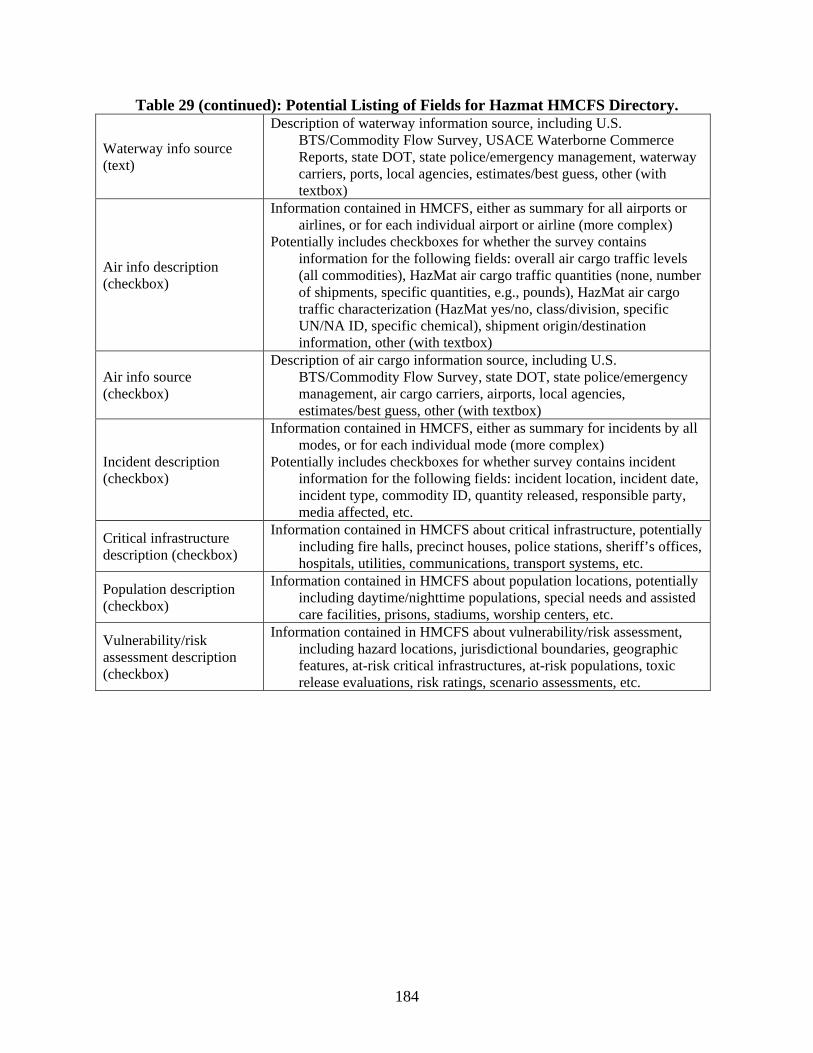
184
Table 29 (continued): Potential Listing of Fields for Hazmat HMCFS Directory.
Waterway info source (text)
Description of waterway information source, including U.S. BTS/Commodity Flow Survey, USACE Waterborne Commerce Reports, state DOT, state police/emergency management, waterway carriers, ports, local agencies, estimates/best guess, other (with textbox)
Air info description (checkbox)
Information contained in HMCFS, either as summary for all airports or airlines, or for each individual airport or airline (more complex)
Potentially includes checkboxes for whether the survey contains information for the following fields: overall air cargo traffic levels (all commodities), HazMat air cargo traffic quantities (none, number of shipments, specific quantities, e.g., pounds), HazMat air cargo traffic characterization (HazMat yes/no, class/division, specific UN/NA ID, specific chemical), shipment origin/destination information, other (with textbox)
Air info source (checkbox)
Description of air cargo information source, including U.S. BTS/Commodity Flow Survey, state DOT, state police/emergency management, air cargo carriers, airports, local agencies, estimates/best guess, other (with textbox)
Incident description (checkbox)
Information contained in HMCFS, either as summary for incidents by all modes, or for each individual mode (more complex)
Potentially includes checkboxes for whether survey contains incident information for the following fields: incident location, incident date, incident type, commodity ID, quantity released, responsible party, media affected, etc.
Critical infrastructure description (checkbox)
Information contained in HMCFS about critical infrastructure, potentially including fire halls, precinct houses, police stations, sheriff’s offices, hospitals, utilities, communications, transport systems, etc.
Population description (checkbox)
Information contained in HMCFS about population locations, potentially including daytime/nighttime populations, special needs and assisted care facilities, prisons, stadiums, worship centers, etc.
Vulnerability/risk assessment description (checkbox)
Information contained in HMCFS about vulnerability/risk assessment, including hazard locations, jurisdictional boundaries, geographic features, at-risk critical infrastructures, at-risk populations, toxic release evaluations, risk ratings, scenario assessments, etc.
185
8.4.2.2. Repository of HazMat CFS Information
In addition to functioning as a directory of HMCFS information, a centralized database might also function as a repository of HMCFS documents themselves. This would require documents to be uploaded to the repository in standardized electronic formats, presumably with file size limitations. A repository has obvious advantages in that HMCFS information is immediately available for access by a range of users. Access to the repository could be obtained through a secured user ID and password, and user identification can be validated prior to account creation to inhibit access by unauthorized or malicious users. A repository has disadvantages in that certain HMCFS information may require removal from the document before uploading. Examples include confidentiality agreements that may be required for railroad or pipeline data, and security sensitive data or information.
8.4.3 Management and Maintenance
Managing and maintaining a directory or repository at a centralized location can be accomplished at several levels, depending on the definition of the term centralized. Each level is discussed below and is accompanied by comments on its inherent strengths and weaknesses.
8.4.3.1 Federal Management and Maintenance
Under this first approach, a federal agency or public/private contractor could function as the authority responsible for setting up, maintaining, and managing a central national website. For a repository, the agency or contractor would undertake posting local HMCFS submitted by the LEPCs, perform any pre-posting quality control, conduct regular website maintenance, grant pre-access security clearance, issue newsletters, develop mailing lists, manage discussion groups, and other data and site management tasks. Access to the website would be available through a login portal according to the level of security clearance granted to different users, for example:
1. Low Security – most general HMCFS information would fall under this category. 2. Medium Security – some HMCFS information that includes data regarding hazardous
materials judged to present a higher-than-ordinary risk to the public would be grouped under this category.
3. High Security – a minority of HMCFS that includes data regarding nuclear or other highly hazardous materials that would present an extreme threat to national security if they fell in the wrong hands would be grouped under this category.
It is noted that use of these security levels may be applicable to other approaches (e.g., state or local posting) through issuance of posting guidelines; however, such an approach would lack a central coordination of this determination.
186
One example of this approach is SafeStat Online (68). SafeStat is a data-driven analysis system that determines the current relative safety status of individual motor carriers. It was developed at the Volpe Center for the Federal Motor Carrier Safety Administration (FMCSA). Data are maintained and managed at the federal level by the FMCSA. A&I Online makes SafeStat results available via the Internet to industry and the public to promote safety awareness and self-improvement. Public data include general carrier information, and a summary of their safety score. FMCSA and State Enforcement Users, as well as Motor Carrier Users, have their own secure access via the above webpage.
A second example is the U.S. DHS Homeland Security Information Network, which is a ‘computer-based counterterrorism communications system connecting all 50 states, five territories, Washington, D.C., and 50 major urban areas’ (69). DHS indicates that this network allows information to be shared between all agencies involved in combating terrorism.
A third example is Federal Emergency Management Agency’s Responder Knowledge Base (70), a Web portal that provides access to information about preparedness grants, FEMA’s Authorized Equipment List and the Interagency Board’s Standardized Equipment List, technology information for the System Assessment and Validation for Emergency Responders program, and a wide range of other content for the emergency response community. Access to some of the information on the Web portal is secured, requiring an account verification process through which the credentials of potential users are verified.
A fourth example is the recent collaboration between the PHMSA and other agencies. The Intermodal Hazmat Intelligence Portal (HIP) is characterized as an intelligence fusion center and knowledge management portal that will ‘support risk-based, data-driven decisions of federal agencies, emergency responders, and the law enforcement community’ (71). The portal is under development and the extent of its applications at the local level has not yet been determined. The portal may have the potential to function as a directory or repository of information that can be accessed by responders at the local level, provided that an interface for accessing that information is available and access at sufficient levels of detail can be granted to local users.
A further challenge is maintaining an accurate and complete listing of HMCFS that have been conducted. Since many HMCFSs are conducted using U.S. DOT HMEP Grant funds as administered through the states, stipulations that funding for an HMCFS is contingent upon posting the information to the directory/repository would probably capture a large percentage of the HMCFS efforts conducted in a given year. The information could be collected by SERCs or equivalent agencies and be submitted to a federal agency (e.g., PHMSA) with annual grant requests or fiscal year summary information. However, HMCFSs can be and are funded by other federal, state, and local entities, and obtaining a complete listing across the spectrum is likely to
187
be very challenging for any one agency. Strengths of maintaining HMCFS information at the federal level include:
• centrally located, controlled, and managed at the federal level; • nationwide geographical coverage; • more formal communication and better coordination of activities between federal
agencies and SERCs; between federal agencies and LEPCs; and among LEPCs; • highest level of control over access to security-sensitive material; • federal agencies could provide additional and/or state (or substate)-specific resources
and guidance to SERCs and LEPCs through the website; and • could be federally developed in conjunction with other state-level systems.
Weaknesses of maintaining HMCFS information at the federal level include:
• less local control over the maintenance and distribution of HMCFS information; • may not be adequately flexible and adaptable to the abilities or constraints of LEPCs
across the board; • requires drafting formal procedures related to development and management within a
willing agency; and • raises potential for bureaucratic inefficiencies up-front and along-the-way.
8.4.3.2 State Management and Maintenance
Under this second moderately-restrictive approach, each LEPC would submit their HMCFS information and any supporting files (such as reports, appendices, blank data collection sheets, spreadsheets with collected data, etc.) to the state SERC. The SERC would then post the local HMCFS information on a central state website (e.g., that state’s SERC, DEM, or DOT website). Any pre-posting quality control or pre-access security clearance to users (see federal approach for example of security levels) would depend on desires and funds/resources available. Similar or more advanced enhancements to the Free Access approach could be added to the website such as an online discussion group for peer exchange of information or advanced HMCFS site search options (by area characteristics, population size, year conducted, etc.). Maps and data (traffic counts, incidents, etc.) could be included in a section for resources to conduct an HMCFS. Since there would be a central state office acting as the host and manager of the website, users could also have the option of signing up for an email list in order to receive official newsletters and emails from the SERC or DOT and emails from peers.
The Arizona SERC website (72) reviewed for this tasking is an example of a hierarchical structure that could allow easy navigation by LEPC members. The main page features a menu that includes a subsection titled ‘The LEPC,’ which can leave little doubt as to where to find out what one needs or wants to know if they are an LEPC member. An example of resources content
188
and organization of that is Virginia’s Department of Emergency Management website (73). The website’s Library section includes a subsection called ‘LEPC Toolkit,’ which sub-classifies resources into ‘Sample LEPC Bylaws,’ ‘Sample LEPC Strategic Plans,’ ‘Sample LEPC Hazmat and Terrorism Plans and Checklists,’ and ‘Other Resources.’ A subsection titled “Commodity Flow Studies” could be added that could be further sub-classified into ‘Guidance section’ and ‘Sample HMCFS.’ The ‘Sample HMCFS’ could be whole or parts of pre-screened HMCFSs deemed appropriate for public access. At this point a login box could be added whereby additional HMCFSs could become available to the user after logging in according to the access level they were previously granted, or a registration procedure for new users. An example of such a feature is included in the website of Pennsylvania’s Emergency Management Agency (74). The current purpose of registration is only receipt of e-alerts and emails but its application could be extended to granting access level to HMCFS.
Strengths of maintaining HMCFS information at the state level include:
• centrally controlled and managed at the state level; • more formal communication and better coordination of activities between SERC and
LEPCs as well as among LEPCs; • higher level of control over access to security sensitive material; and • state could provide additional and/or state-specific resources and guidance to LEPCs
through the website.
Weaknesses of maintaining HMCFS information at the state level include:
• less local control over the accessibility of HMCFS; • may not be adequately flexible and adaptable to the abilities or constraints of LEPCs
across the board; • requires drafting formal procedures related to development and management within a
host state agency; • differential management practices by different states; • potential for HMEP funds being used for database management at state level rather
than being passed down to local entities; and • raises potential for bureaucratic inefficiencies up-front and along-the-way.
8.4.3.3 Free Access (Independent; Local Posting) Management and Maintenance
Under this least-restrictive approach, each LEPC could upload their HMCFS information and any supporting files (such as reports, appendices, blank data collection sheets, spreadsheets with collected data, etc.) to a single website that is envisioned to function like library stacks. Any LEPC could then navigate to that website and search for and download another LEPCs’ HMCFS using a search engine (e.g., Google, etc.), so by definition this approach would be 100 percent
189
free access. Enhancements such as an online discussion group (blog or forum) where peer information could be exchanged, or HMCFS site search options (by area characteristics, population, year conducted, etc.) could be added depending on funds available for the website’s initial setup and regular maintenance (if any). Access to uploading and downloading would be unrestricted and free for all. A good example of ‘library stacks’ would be Wikipedia or any online article database or a non-subscription newspaper site. There are numerous everyday examples of information exchange e-forums whose subjects range from everyday issues to sophisticated/professional ones and which are frequently hosted by Google or Yahoo.
Strengths of maintaining HMCFS information through a free access approach include:
• independently and locally controlled development, management, and maintenance; • free access to any interested party, such as public officials or concerned citizens; and • avenue for continuous public information exchange.
Weaknesses of maintaining HMCFS information through a free access approach include:
• possible upfront (setup) and periodic (maintenance) costs associated with the website; • functionality dependant on donor host website; • proprietary, safety, and security concerns inherently tied to the open access concept in
regards to local, sensitive, or confidential information; • lack of control over consistency, quality, and content of posted information; and • lack of control over obtaining information about HMCFS practices with no
centralized oversight at federal or state levels.
8.5 REVISIONS AND UPDATES
Even though most HMCFSs are conducted over the course of a year (or less), and some are conducted over longer time periods, an HMCFS is none-the-less a static picture of an ongoing, changing process. Hence, there is a need to consider when an HMCFS should be revised or updated. Continuous updating and revisions would be difficult to manage and link to various desired decision objectives. However, critical incidents or accidents in the study area, nearby, or in similar communities elsewhere should trigger the re-examination of relevant HMCFS data.
In a similar manner, significant changes in resident population, industrial or transport facilities, or route or route segments should trigger the re-examination of the relevant HMCFS data. These re-examinations may find that little or no adjustment is required. For example:
• the re-examination may demonstrate that transport on nearby parallel routes accounted for new flows, and the new routes probably serve to make HazMat transport safer than it was on the old routes; or

190
• the re-examination may demonstrate the need to conduct a new HMCFS in order to account for the significant changes in the community.
These issues may come to public light through news reports or public interest, but revisions, updates, and even conducting a new HMCFS may be a way to assure public wellbeing and provide for public safety. The faster that significant changes occur in a community or the HazMat flows therein, the more frequent the need for updates and revisions. Large metropolitan areas with complex flows are likely to opt for more frequent revision and updates to successfully manage HMCFS efforts. Even smaller communities with complex flows (especially through-traffic) may find it necessary to revise and update the HMCFS frequently, while those with less complex flows may find that a well-done HMCFS can last for years.
191
CHAPTER 9: DEVELOPING PROMISING PRACTICES Best practices reported by LEPCs in the survey, case studies, and other interviews were
overlaid on some of the most important concerns expressed by LEPCs. Promising practices were compiled from direct reports of best practices by LEPCs in meeting critical HMCFS needs, as well as logical progressions to fill identified gaps in the process, and processes developed to strengthen HMCFS utility. The 11 promising practices list below result.
1. HMCFS Objectives Checklist—Is comprised of an initial checklist of some of the objectives that local entities have reported for their HMCFS.
2. Match Protection Level with HMCFS Objectives—Evaluates the extent of match between desired risk level (goals) and HMCFS objective(s) helps ensure consistency of project results with their ultimate purpose: ensuring public protection.
3. Let HMCFS Objectives Guide Sampling—Identifies the appropriate balance between the desire for exhaustive data of the utmost precision and the decision outcome(s) anticipated, and the realities of limited resources.
4. Let HMCFS Objectives Guide Precision—Matches the desired HMCFS objectives with the level of precision of HMCFS data collection efforts saves resources while maximizing utility.
5. Stretch Limited Time and Resources—Most LEPCs are voluntary in nature, as funding for their activities tends to be sparse and difficult to come by; hence, making the most of in-kind funding, volunteer participants, industry contributions, and sequencing HMCFS activities is often critical to a successful project.
6. Consider Consecutive Year Studies—Dealing with time constraints that can be associated with funding cycles conducts a more comprehensive and complete HMCFS over several years.
7. Use the Active Participation Checklist—Active participation by LEPC members in the HMCFS is important to achieving success. The participation checklist identifies key activities often associated with LEPC members whether the HMCFS is done by the LEPC or a contractor.
8. Use Existing Data Source Checklist—There are many sources of data; the existing data source checklist provides a list of potential sources can help those engaging in the conduct of an HMCFS (especially first-timers) to start the process.
192
9. Hot Spots Analysis—Determining specific areas of concern is done by a hot spots analysis that examines collocation of hazardous materials and human population in time and space.
10. Use Risk Communication Checklist—The risk communication checklist was compiled from the LEPCs around the nation. Locations, people, or offices to consider for the communication of the HMCFS.
11. Demonstrate Local Risk—Demonstrating hazard potential with low-probability risk often meets with frustration as low-probability risks are sufficiently low as to not compete with everyday routine activities. Communicating the risk associated with HazMat transportation through an area can help local leaders understand the importance of taking preemptive actions to reduce risk and mitigate consequences.
9.1 IDENTIFYING HMCFS OBJECTIVES
Why is the HMCFS being conducted? There are many reasons local jurisdictions choose to conduct an HMCFS, ranging from very general, such as enhancing awareness about whether HazMat transport is present in a community, to very specific, such as establishing a HazMat transportation route. A large share of LEPC reported using HMCFS results to learn about hazmat transport, conduct planning, or guide training exercises. Many LEPCs also indicated using HMCFS results to inform equipment needs and some for conducting risk analysis. Twenty percent or less of LEPCs reported conducting HMCFS to support hazardous materials route adjustments.
Understanding the objectives of the HMCFS corresponds with the types of decisions users hope to make based on the information. Too little information results in decisions based on insufficient information; too much information wastes resources (i.e., time, money and personnel effort) in the process of collecting the supporting data. Lack of clarity about objectives increases the likelihood that the HMCFS will fail to satisfy user needs. Promising Practice 1: HMCFS Objectives Checklist helps focus the effort on stated objectives given the realities of limited resources.
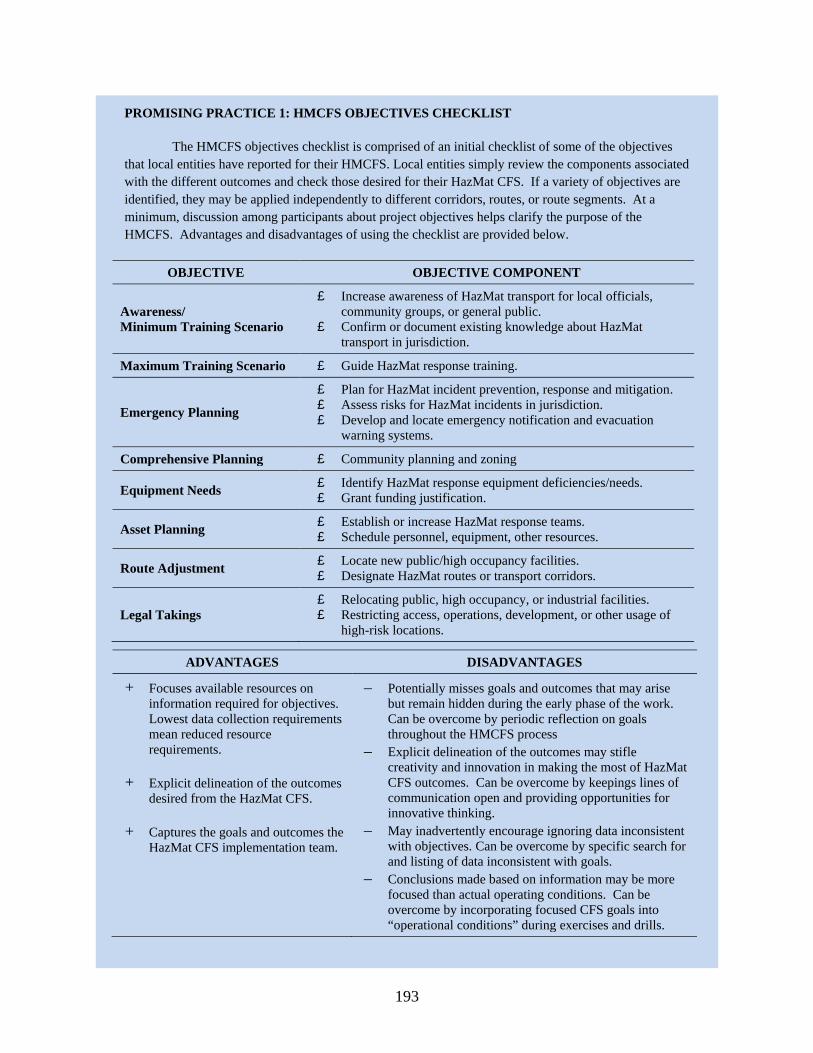
193
PROMISING PRACTICE 1: HMCFS OBJECTIVES CHECKLIST
The HMCFS objectives checklist is comprised of an initial checklist of some of the objectives that local entities have reported for their HMCFS. Local entities simply review the components associated with the different outcomes and check those desired for their HazMat CFS. If a variety of objectives are identified, they may be applied independently to different corridors, routes, or route segments. At a minimum, discussion among participants about project objectives helps clarify the purpose of the HMCFS. Advantages and disadvantages of using the checklist are provided below.
OBJECTIVE OBJECTIVE COMPONENT
Awareness/ Minimum Training Scenario
£ Increase awareness of HazMat transport for local officials, community groups, or general public.
£ Confirm or document existing knowledge about HazMat transport in jurisdiction.
Maximum Training Scenario £ Guide HazMat response training.
Emergency Planning
£ Plan for HazMat incident prevention, response and mitigation. £ Assess risks for HazMat incidents in jurisdiction. £ Develop and locate emergency notification and evacuation
warning systems.
Comprehensive Planning £ Community planning and zoning
Equipment Needs £ Identify HazMat response equipment deficiencies/needs. £ Grant funding justification.
Asset Planning £ Establish or increase HazMat response teams. £ Schedule personnel, equipment, other resources.
Route Adjustment £ Locate new public/high occupancy facilities. £ Designate HazMat routes or transport corridors.
Legal Takings £ Relocating public, high occupancy, or industrial facilities. £ Restricting access, operations, development, or other usage of
high-risk locations.
ADVANTAGES DISADVANTAGES
+ Focuses available resources on information required for objectives. Lowest data collection requirements mean reduced resource requirements.
+ Explicit delineation of the outcomes desired from the HazMat CFS.
+ Captures the goals and outcomes the HazMat CFS implementation team.
– Potentially misses goals and outcomes that may arise but remain hidden during the early phase of the work. Can be overcome by periodic reflection on goals throughout the HMCFS process
– Explicit delineation of the outcomes may stifle creativity and innovation in making the most of HazMat CFS outcomes. Can be overcome by keepings lines of communication open and providing opportunities for innovative thinking.
– May inadvertently encourage ignoring data inconsistent with objectives. Can be overcome by specific search for and listing of data inconsistent with goals.
– Conclusions made based on information may be more focused than actual operating conditions. Can be overcome by incorporating focused CFS goals into “operational conditions” during exercises and drills.
194
9.2 DEFINE LEVEL OF PROTECTION
While perceived risk among LEPCs leans toward extreme, with overall roadway risks rated above a seven on a 0 to 10 scale where 0 means no risk and 10 means extreme risk (Table 6). Local entities are often overwhelmed with trying to provide the best possible protection with extremely limited resources. When resources are limited, trying to plan for every possible outcome may result in the limited utility of what is accomplished. Too little information results in decisions based on insufficient information; too much information wastes resources (i.e., time, money and personnel effort). Planning for everything can often result in planning for nothing! Four levels of public protection (risk) goals are considered: complete protection (all risks), maximum protection (possible risks), reasonable protection (probable risks), and general protection (most-likely risk).
9.2.1 Complete Protection
The goal at this level is to protect the public from all risk. The standard of protection is zero risk tolerance. This standard was implemented under the Delaney Clause of the 1958 amendment to the Food, Drugs and Cosmetic Act of 1938 (75). Named after the Congressman Delaney of New York, the language of the bill called on the FDA to prohibit the use of chemical food additive(s) that induce cancer in humans or animals. This criterion was applied to herbicides and pesticides in processed foods until 1996, when the Delaney Clause was removed. Fundamentally, the zero tolerance policy fails to recognize human mortality, vulnerability, and that bad things happen.
9.2.2 Maximum Protection
This goal seeks to protect the public from all possible risk(s) and does not spend resource on the impossible or unforeseeable. This protection standard was originally cast from the Congressional Mandate for maximum public protection in the disposal of the unitary chemical stockpile (76). This risk was eventually standardized in the magnitude of 10-8, or greater than one chance per hundred million. One such example might be a moving tank car being hit by near-earth objects (e.g., comet or meteorite).
9.2.3 Reasonable Protection
This goal seeks to protect the public from all probable risk(s), eliminating risks with very low potential from consideration. This standard of public protection was originally cast in the Nuclear Regulatory Commission (77) language pertaining to the licensing of nuclear waste disposal for which applicants must assure that the proposed site, design, facility, closure, and institutional controls are adequate to provide reasonable assurance of protection to the general public. This risk was operationally defined as in the magnitude of 10-6 or greater than one per

195
million. One such example might be a large plane crashing into a rail yard with tank cars containing chlorine in significant quantities.
9.2.4 General Protection
This goal seeks to protect the public from risks that are most likely to occur under normal operations. This standard of protection of the public is often used as the legal standard of negligence. Operators that fail to plan for these relatively common accidents with magnitudes of 10-4 or greater than one in a hundred thousand in routine operations would certainly be held accountable. In the railroad, computing, and chemical industries this is often referred to as “five-nines” reliability. There are many such accidents, and routine tank-car or tank-truck accidents where flammable fluids are involved would be among them. Promising Practice 2: Match Protection Level with Objectives describes how local entities can match desired level of risk with HMCFS objectives.
PROMISING PRACTICE 2: MATCH PROTECTION LEVEL WITH OBJECTIVES PROBLEM Once the desired risk level (goals) and desired outcome for the project have been defined, evaluating whether they are matched to each other can help ensure consistency of project results with their ultimate purpose: ensuring public protection. PROMISING PRACTICE The objectives provide a focus for the HMCFS process, but they also have direct implications for what is considered, the implications for the results of the study, and the hazard management in the area. A balance is achieved by matching the decision objectives with the planning scenarios of interest in the study area. The desire of precise and exhaustive data is seldom realistic. Matching the decision objectives and planning scenarios meets the anticipated outcome(s) within the realities of limited resources. Emergency planning often uses accidents scenarios for a given area, to test preparedness across a distribution of accidents. Less-specific outcomes require very little, mostly generic scenarios, but more precise detailed data are required for more-specific outcomes. Awareness requires very little occurrence information, while route adjustments and takings have intense data requirements. This guidebook considers four levels of planning scenarios: complete protection from all risks, maximum protection from possible risks, reasonable protection from probable risks, and general protection from most likely.
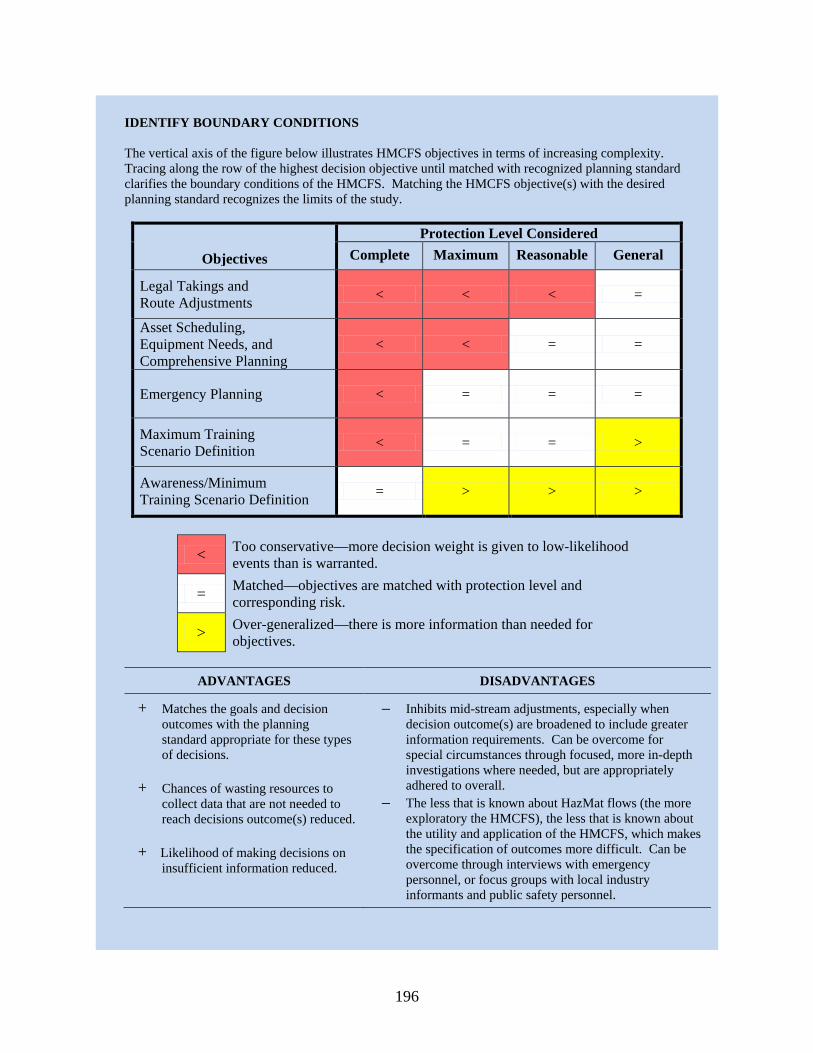
196
IDENTIFY BOUNDARY CONDITIONS The vertical axis of the figure below illustrates HMCFS objectives in terms of increasing complexity. Tracing along the row of the highest decision objective until matched with recognized planning standard clarifies the boundary conditions of the HMCFS. Matching the HMCFS objective(s) with the desired planning standard recognizes the limits of the study.
Objectives Protection Level Considered
Complete Maximum Reasonable General
Legal Takings and Route Adjustments < < < =
Asset Scheduling, Equipment Needs, and Comprehensive Planning
< < = =
Emergency Planning < = = =
Maximum Training Scenario Definition < = = >
Awareness/Minimum Training Scenario Definition = > > >
< Too conservative—more decision weight is given to low-likelihood events than is warranted.
= Matched—objectives are matched with protection level and corresponding risk.
> Over-generalized—there is more information than needed for objectives.
ADVANTAGES DISADVANTAGES
+ Matches the goals and decision outcomes with the planning standard appropriate for these types of decisions.
+ Chances of wasting resources to collect data that are not needed to reach decisions outcome(s) reduced.
+ Likelihood of making decisions on insufficient information reduced.
– Inhibits mid-stream adjustments, especially when decision outcome(s) are broadened to include greater information requirements. Can be overcome for special circumstances through focused, more in-depth investigations where needed, but are appropriately adhered to overall.
– The less that is known about HazMat flows (the more exploratory the HMCFS), the less that is known about the utility and application of the HMCFS, which makes the specification of outcomes more difficult. Can be overcome through interviews with emergency personnel, or focus groups with local industry informants and public safety personnel.
197
9.3 DEFINE SAMPLING AND PRECISION REQUIREMENTS
Some data, such as national level estimates, should only be used to develop very general ideas about the nature and patterns of what might be travelling through a jurisdiction such as a city or county. Other data provide enough information to understand the local nature and patterns of HazMat transport in a jurisdiction but not for specific times, locations, or individual HazMat commodities. At the highest level, data are very locally detailed and can be used to identify the particular nature and patterns of what has been observed in a jurisdiction, even for a specific network location, time-of-day, or HazMat commodity.
As the specificity of these levels (and associated objectives) increases, the number of applicable data sources decreases because many data sources are collected using techniques that are not appropriately matched to the precision required to support objectives. Survey responses as discussed in Chapter 2 suggest that few LEPCs are evaluating sampling requirements, and those that are typically used methods that limit ability to generalize results. Examples include:
• High traffic corridors were selected by four out of every five LEPCs for conducting vehicle and placard counts;
• The large majority (86 percent) of LEPCs conducting vehicle or placard counts reported selecting highway intersections as sampling locations;
• The timing of vehicle and placard counts was reported most often (by two out of every five LEPCs) as occurring on a day or several days throughout the year;
• Some LEPCs (about one out of every four) reported collecting vehicle or placard counts for a few hours during the year;
• Convenience was among the most important reasons cited for selecting specific sampling locations for more than half of LEPCs that conducted vehicle or placard counts,
• Logistics was among the most important reasons cited for selecting specific sampling locations for around 40 percent of LEPCs that conducted vehicle or placard counts (Figure 15);
• Being easiest for participants, industry, or carriers was cited as a reason for selecting sampling locations for around 35 percent of LEPCs that conducted vehicle or placard counts (Figure 14); and
• Logistics and safety of participants were among the most important reasons for about 40 percent and 30 percent of the LEPCs conducting vehicle and placard counts, respectively.
Promising Practice 3: Let Objectives Guide Sampling, sets some guidelines for how HazMat transport data should be sampled (that is, where, when, and how often data should be collected) in order to achieve desired project results.
198
Most LEPCs report collecting HMCFS information regarding the quantity of hazardous materials at level of presence only (Figure 19), and characterization of hazardous materials by chemical/material division (Figure 20), and yet those that collected data at greater detail, either in terms of relative quantity and UN/NA placard ID number reported significantly higher perceived usefulness associated with roadway, railway, and pipeline modes (Figure 21 and Figure 22). This suggests that the level of precision used to conduct HMCFS varies in terms of quantity of materials and which materials. Because these additional levels of precision require more effort to collect, Promising Practice 4: Let Objectives Guide Precision suggests a classification system that helps determine when the additional usefulness is warranted. It can be used to define data collection requirements for HazMat quantity (e.g., HazMat presence, relative HazMat quantity such as small, medium, and large quantities, or specific HazMat quantity such as number of gallons or pounds transported) and HazMat classification (e.g., whether or not it is HazMat, chemical/material class/division, UN/NA placard ID, or specific chemical/material name).
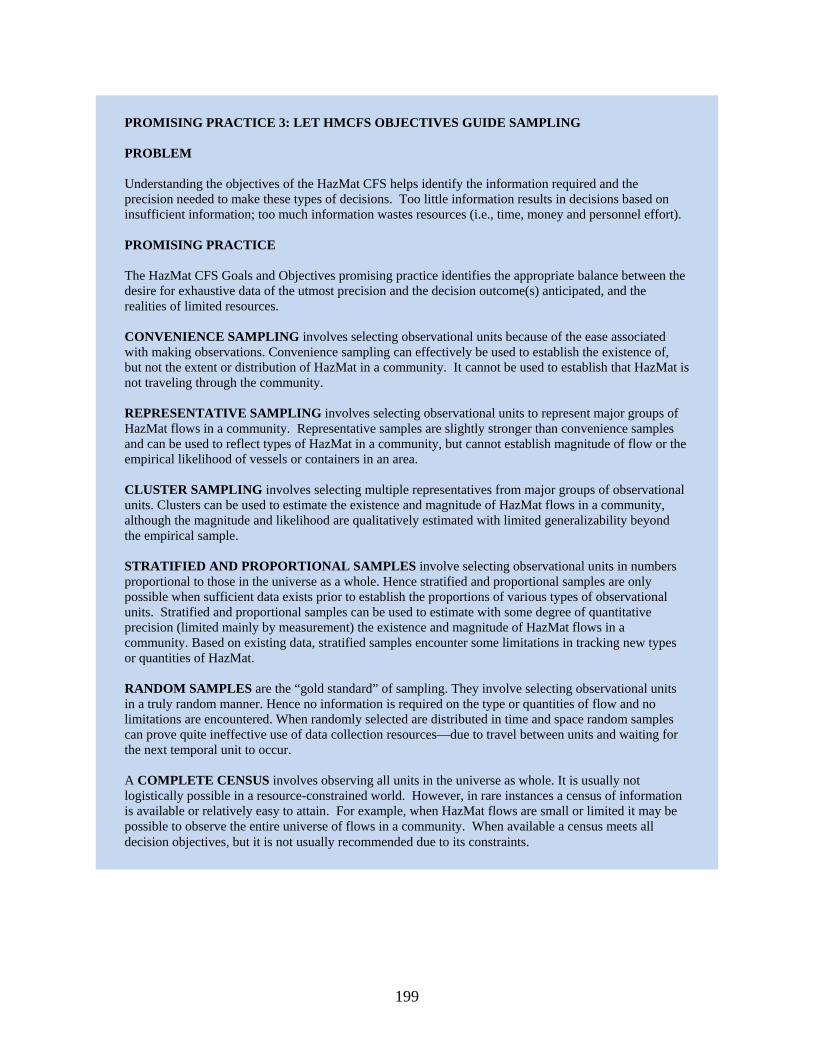
199
PROMISING PRACTICE 3: LET HMCFS OBJECTIVES GUIDE SAMPLING PROBLEM Understanding the objectives of the HazMat CFS helps identify the information required and the precision needed to make these types of decisions. Too little information results in decisions based on insufficient information; too much information wastes resources (i.e., time, money and personnel effort). PROMISING PRACTICE The HazMat CFS Goals and Objectives promising practice identifies the appropriate balance between the desire for exhaustive data of the utmost precision and the decision outcome(s) anticipated, and the realities of limited resources. CONVENIENCE SAMPLING involves selecting observational units because of the ease associated with making observations. Convenience sampling can effectively be used to establish the existence of, but not the extent or distribution of HazMat in a community. It cannot be used to establish that HazMat is not traveling through the community. REPRESENTATIVE SAMPLING involves selecting observational units to represent major groups of HazMat flows in a community. Representative samples are slightly stronger than convenience samples and can be used to reflect types of HazMat in a community, but cannot establish magnitude of flow or the empirical likelihood of vessels or containers in an area. CLUSTER SAMPLING involves selecting multiple representatives from major groups of observational units. Clusters can be used to estimate the existence and magnitude of HazMat flows in a community, although the magnitude and likelihood are qualitatively estimated with limited generalizability beyond the empirical sample. STRATIFIED AND PROPORTIONAL SAMPLES involve selecting observational units in numbers proportional to those in the universe as a whole. Hence stratified and proportional samples are only possible when sufficient data exists prior to establish the proportions of various types of observational units. Stratified and proportional samples can be used to estimate with some degree of quantitative precision (limited mainly by measurement) the existence and magnitude of HazMat flows in a community. Based on existing data, stratified samples encounter some limitations in tracking new types or quantities of HazMat. RANDOM SAMPLES are the “gold standard” of sampling. They involve selecting observational units in a truly random manner. Hence no information is required on the type or quantities of flow and no limitations are encountered. When randomly selected are distributed in time and space random samples can prove quite ineffective use of data collection resources—due to travel between units and waiting for the next temporal unit to occur. A COMPLETE CENSUS involves observing all units in the universe as whole. It is usually not logistically possible in a resource-constrained world. However, in rare instances a census of information is available or relatively easy to attain. For example, when HazMat flows are small or limited it may be possible to observe the entire universe of flows in a community. When available a census meets all decision objectives, but it is not usually recommended due to its constraints.
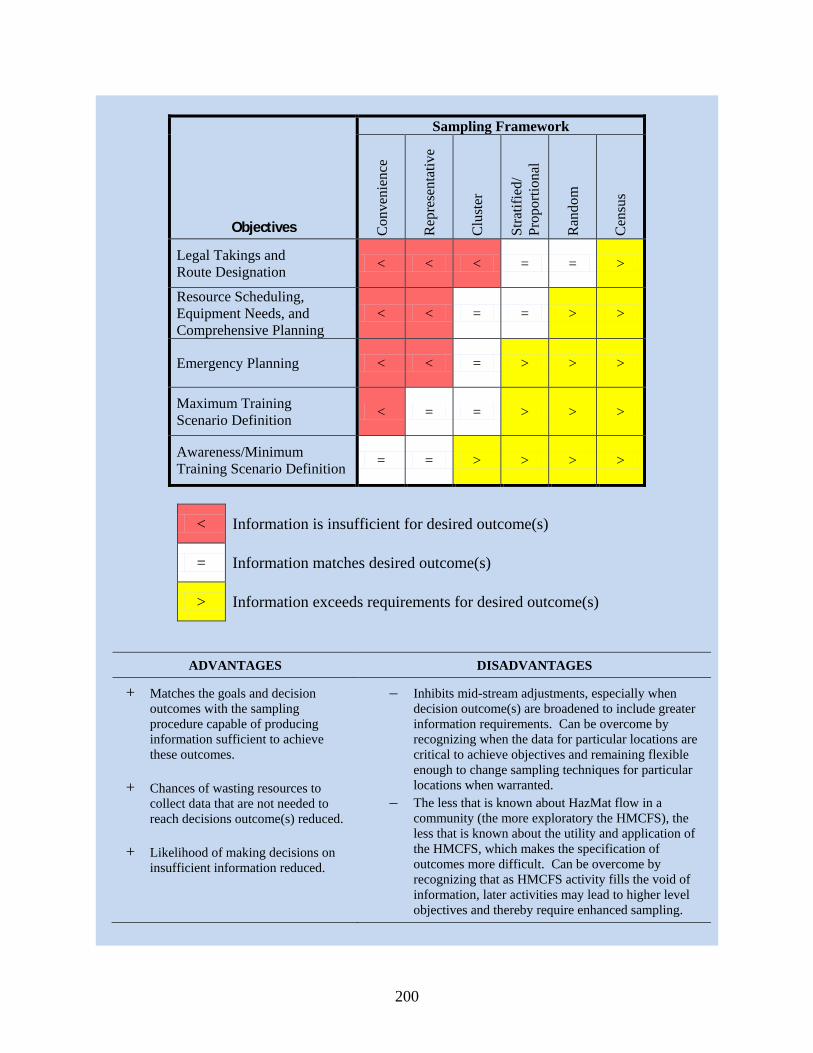
200
Objectives
Sampling Framework
Con
veni
ence
Rep
rese
ntat
ive
Clu
ster
Stra
tifie
d/
Prop
ortio
nal
Ran
dom
Cen
sus
Legal Takings and Route Designation < < < = = >
Resource Scheduling, Equipment Needs, and Comprehensive Planning
< < = = > >
Emergency Planning < < = > > >
Maximum Training Scenario Definition < = = > > >
Awareness/Minimum Training Scenario Definition = = > > > >
< Information is insufficient for desired outcome(s)
= Information matches desired outcome(s)
> Information exceeds requirements for desired outcome(s)
ADVANTAGES DISADVANTAGES
+ Matches the goals and decision outcomes with the sampling procedure capable of producing information sufficient to achieve these outcomes.
+ Chances of wasting resources to collect data that are not needed to reach decisions outcome(s) reduced.
+ Likelihood of making decisions on insufficient information reduced.
– Inhibits mid-stream adjustments, especially when decision outcome(s) are broadened to include greater information requirements. Can be overcome by recognizing when the data for particular locations are critical to achieve objectives and remaining flexible enough to change sampling techniques for particular locations when warranted.
– The less that is known about HazMat flow in a community (the more exploratory the HMCFS), the less that is known about the utility and application of the HMCFS, which makes the specification of outcomes more difficult. Can be overcome by recognizing that as HMCFS activity fills the void of information, later activities may lead to higher level objectives and thereby require enhanced sampling.
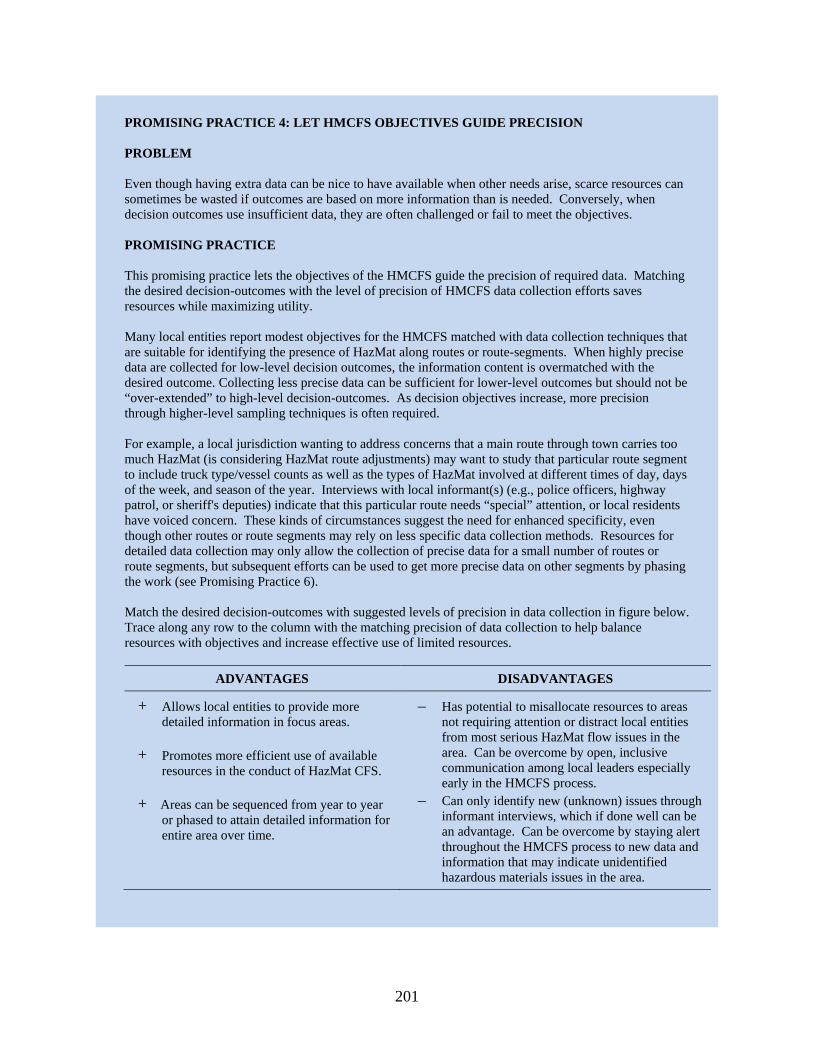
201
PROMISING PRACTICE 4: LET HMCFS OBJECTIVES GUIDE PRECISION PROBLEM Even though having extra data can be nice to have available when other needs arise, scarce resources can sometimes be wasted if outcomes are based on more information than is needed. Conversely, when decision outcomes use insufficient data, they are often challenged or fail to meet the objectives. PROMISING PRACTICE This promising practice lets the objectives of the HMCFS guide the precision of required data. Matching the desired decision-outcomes with the level of precision of HMCFS data collection efforts saves resources while maximizing utility. Many local entities report modest objectives for the HMCFS matched with data collection techniques that are suitable for identifying the presence of HazMat along routes or route-segments. When highly precise data are collected for low-level decision outcomes, the information content is overmatched with the desired outcome. Collecting less precise data can be sufficient for lower-level outcomes but should not be “over-extended” to high-level decision-outcomes. As decision objectives increase, more precision through higher-level sampling techniques is often required. For example, a local jurisdiction wanting to address concerns that a main route through town carries too much HazMat (is considering HazMat route adjustments) may want to study that particular route segment to include truck type/vessel counts as well as the types of HazMat involved at different times of day, days of the week, and season of the year. Interviews with local informant(s) (e.g., police officers, highway patrol, or sheriff's deputies) indicate that this particular route needs “special” attention, or local residents have voiced concern. These kinds of circumstances suggest the need for enhanced specificity, even though other routes or route segments may rely on less specific data collection methods. Resources for detailed data collection may only allow the collection of precise data for a small number of routes or route segments, but subsequent efforts can be used to get more precise data on other segments by phasing the work (see Promising Practice 6). Match the desired decision-outcomes with suggested levels of precision in data collection in figure below. Trace along any row to the column with the matching precision of data collection to help balance resources with objectives and increase effective use of limited resources.
ADVANTAGES DISADVANTAGES
+ Allows local entities to provide more detailed information in focus areas.
+ Promotes more efficient use of available resources in the conduct of HazMat CFS.
+ Areas can be sequenced from year to year or phased to attain detailed information for entire area over time.
– Has potential to misallocate resources to areas not requiring attention or distract local entities from most serious HazMat flow issues in the area. Can be overcome by open, inclusive communication among local leaders especially early in the HMCFS process.
– Can only identify new (unknown) issues through informant interviews, which if done well can be an advantage. Can be overcome by staying alert throughout the HMCFS process to new data and information that may indicate unidentified hazardous materials issues in the area.
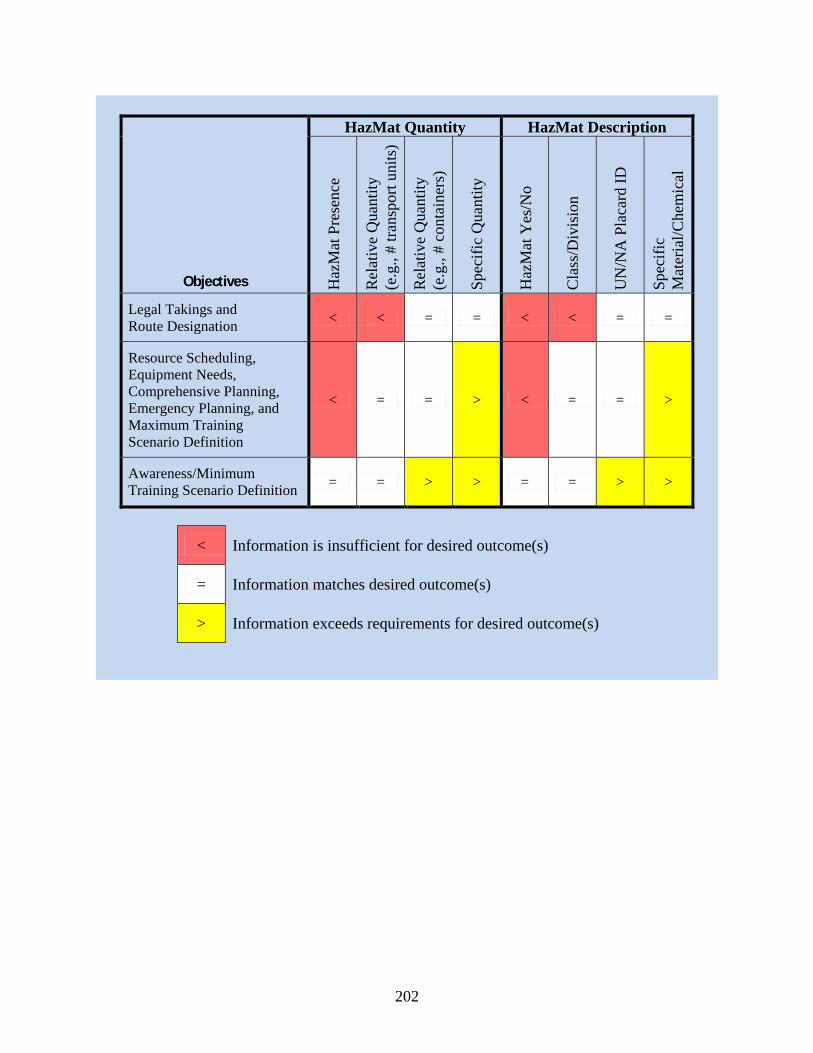
202
Objectives
HazMat Quantity HazMat Description
Haz
Mat
Pre
senc
e
Rel
ativ
e Q
uant
ity
(e.g
., #
trans
port
units
)
Rel
ativ
e Q
uant
ity
(e.g
., #
cont
aine
rs)
Spec
ific
Qua
ntity
Haz
Mat
Yes
/No
Cla
ss/D
ivis
ion
UN
/NA
Pla
card
ID
Spec
ific
Mat
eria
l/Che
mic
al
Legal Takings and Route Designation < < = = < < = =
Resource Scheduling, Equipment Needs, Comprehensive Planning, Emergency Planning, and Maximum Training Scenario Definition
< = = > < = = >
Awareness/Minimum Training Scenario Definition = = > > = = > >
< Information is insufficient for desired outcome(s)
= Information matches desired outcome(s)
> Information exceeds requirements for desired outcome(s)
203
9.4 FUNDING AND SCHEDULING HMCFS EFFORTS
When asked about what matching fund sources were used for their most recent HMCFS (Figure 29), around one of every five LEPCs reported either not knowing about matching funds (1 of 6) or that no grant funding or matching funds were used (1 of 9). Together this is nearly a 2 to 1 ratio of LEPCs not matching or not receiving grants at all, to LEPCs using the most prevalent source of matching mechanism—in-kind matching. Meanwhile, more than half of LEPCs reported funding as the key barrier and incentive to conducting HMCFSs (Figure 34 and Figure 35). Depending on the level and type of information needed, and the effort required to obtain that information, an HMCFS can range from a simple, low-cost effort to one that is very complex, involving expenditure of a large amount of monetary or personnel resources. After identifying what needs to be done, the next step is to identify how it is going to be done, and who is going to do it. Promising Practice 5: Stretch Limited Time and Resources discusses options for funding an HMCFS.
Only 1 of 14 LEPCs report collecting data for their HMCFS to reflect seasonal variation in hazardous materials transport activity throughout the year (Figure 17). Yet, many have seasonal variation associated with an agricultural economic base. Funding, time, and personnel resources were most often mentioned (about half, one-quarter and one-quarter, respectively) as barriers to the conduct of HMCFS. Hence many LEPCs report being stretched for resources to conduct HMCFSs. A few specifically mentioned loosening (about 1 in 40) or removing (about 1 in 10) HMEP restrictions (Figure 33). In fact, the annual grant funding cycle through the HMEP program creates challenges for collecting HMCFS data for more than a couple seasons, unless multi-year efforts are specifically programmed through a state’s SERC (and then funding is contingent on appropriation of HMEP funds and approval of funding administrators) or conducted using other funding sources. However funded, partitioning a complex HMCFS over several years can provide an incremental approach to a more complete outcome using resources available and allow for collecting seasonal data. Promising Practice 6: Consider Consecutive Year Studies covers how an HMCFS can be scaled over several years to address scheduling and resource limitations, and which may be particularly applicable in large jurisdictions.
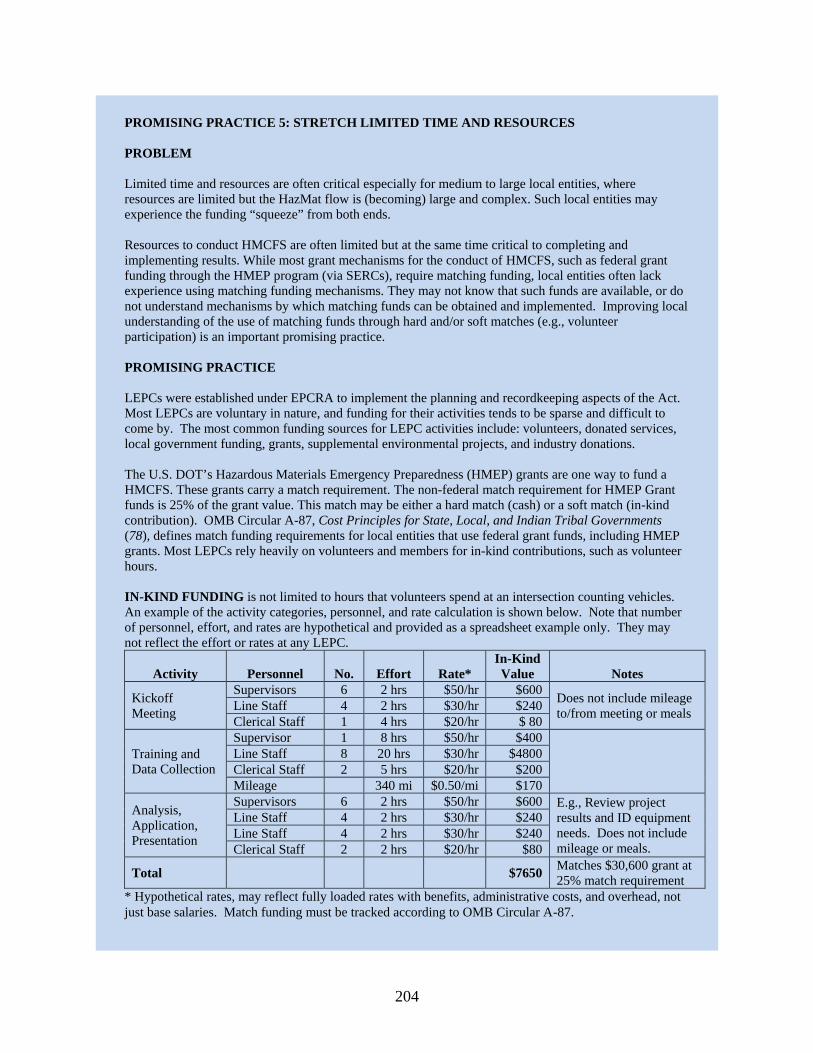
204
PROMISING PRACTICE 5: STRETCH LIMITED TIME AND RESOURCES PROBLEM Limited time and resources are often critical especially for medium to large local entities, where resources are limited but the HazMat flow is (becoming) large and complex. Such local entities may experience the funding “squeeze” from both ends. Resources to conduct HMCFS are often limited but at the same time critical to completing and implementing results. While most grant mechanisms for the conduct of HMCFS, such as federal grant funding through the HMEP program (via SERCs), require matching funding, local entities often lack experience using matching funding mechanisms. They may not know that such funds are available, or do not understand mechanisms by which matching funds can be obtained and implemented. Improving local understanding of the use of matching funds through hard and/or soft matches (e.g., volunteer participation) is an important promising practice. PROMISING PRACTICE LEPCs were established under EPCRA to implement the planning and recordkeeping aspects of the Act. Most LEPCs are voluntary in nature, and funding for their activities tends to be sparse and difficult to come by. The most common funding sources for LEPC activities include: volunteers, donated services, local government funding, grants, supplemental environmental projects, and industry donations. The U.S. DOT’s Hazardous Materials Emergency Preparedness (HMEP) grants are one way to fund a HMCFS. These grants carry a match requirement. The non-federal match requirement for HMEP Grant funds is 25% of the grant value. This match may be either a hard match (cash) or a soft match (in-kind contribution). OMB Circular A-87, Cost Principles for State, Local, and Indian Tribal Governments (78), defines match funding requirements for local entities that use federal grant funds, including HMEP grants. Most LEPCs rely heavily on volunteers and members for in-kind contributions, such as volunteer hours. IN-KIND FUNDING is not limited to hours that volunteers spend at an intersection counting vehicles. An example of the activity categories, personnel, and rate calculation is shown below. Note that number of personnel, effort, and rates are hypothetical and provided as a spreadsheet example only. They may not reflect the effort or rates at any LEPC.
Activity Personnel No. Effort Rate* In-Kind Value Notes
Kickoff Meeting
Supervisors 6 2 hrs $50/hr $600 Does not include mileage to/from meeting or meals Line Staff 4 2 hrs $30/hr $240
Clerical Staff 1 4 hrs $20/hr $ 80
Training and Data Collection
Supervisor 1 8 hrs $50/hr $400
Line Staff 8 20 hrs $30/hr $4800 Clerical Staff 2 5 hrs $20/hr $200 Mileage 340 mi $0.50/mi $170
Analysis, Application, Presentation
Supervisors 6 2 hrs $50/hr $600 E.g., Review project results and ID equipment needs. Does not include mileage or meals.
Line Staff 4 2 hrs $30/hr $240 Line Staff 4 2 hrs $30/hr $240 Clerical Staff 2 2 hrs $20/hr $80
Total $7650 Matches $30,600 grant at 25% match requirement
* Hypothetical rates, may reflect fully loaded rates with benefits, administrative costs, and overhead, not just base salaries. Match funding must be tracked according to OMB Circular A-87.
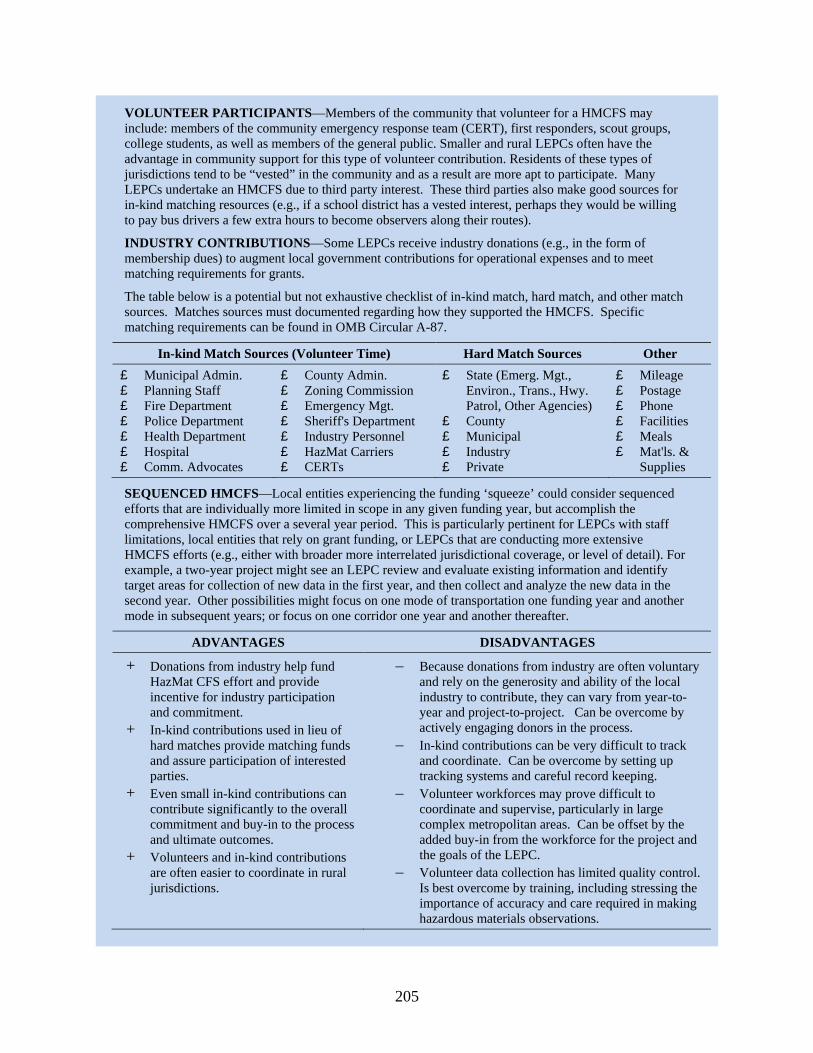
205
VOLUNTEER PARTICIPANTS—Members of the community that volunteer for a HMCFS may include: members of the community emergency response team (CERT), first responders, scout groups, college students, as well as members of the general public. Smaller and rural LEPCs often have the advantage in community support for this type of volunteer contribution. Residents of these types of jurisdictions tend to be “vested” in the community and as a result are more apt to participate. Many LEPCs undertake an HMCFS due to third party interest. These third parties also make good sources for in-kind matching resources (e.g., if a school district has a vested interest, perhaps they would be willing to pay bus drivers a few extra hours to become observers along their routes). INDUSTRY CONTRIBUTIONS—Some LEPCs receive industry donations (e.g., in the form of membership dues) to augment local government contributions for operational expenses and to meet matching requirements for grants. The table below is a potential but not exhaustive checklist of in-kind match, hard match, and other match sources. Matches sources must documented regarding how they supported the HMCFS. Specific matching requirements can be found in OMB Circular A-87.
In-kind Match Sources (Volunteer Time) Hard Match Sources Other £ Municipal Admin. £ Planning Staff £ Fire Department £ Police Department £ Health Department £ Hospital £ Comm. Advocates
£ County Admin. £ Zoning Commission £ Emergency Mgt. £ Sheriff's Department £ Industry Personnel £ HazMat Carriers £ CERTs
£ State (Emerg. Mgt., Environ., Trans., Hwy. Patrol, Other Agencies)
£ County £ Municipal £ Industry £ Private
£ Mileage £ Postage £ Phone £ Facilities £ Meals £ Mat'ls. &
Supplies SEQUENCED HMCFS—Local entities experiencing the funding ‘squeeze’ could consider sequenced efforts that are individually more limited in scope in any given funding year, but accomplish the comprehensive HMCFS over a several year period. This is particularly pertinent for LEPCs with staff limitations, local entities that rely on grant funding, or LEPCs that are conducting more extensive HMCFS efforts (e.g., either with broader more interrelated jurisdictional coverage, or level of detail). For example, a two-year project might see an LEPC review and evaluate existing information and identify target areas for collection of new data in the first year, and then collect and analyze the new data in the second year. Other possibilities might focus on one mode of transportation one funding year and another mode in subsequent years; or focus on one corridor one year and another thereafter.
ADVANTAGES DISADVANTAGES
+ Donations from industry help fund HazMat CFS effort and provide incentive for industry participation and commitment.
+ In-kind contributions used in lieu of hard matches provide matching funds and assure participation of interested parties.
+ Even small in-kind contributions can contribute significantly to the overall commitment and buy-in to the process and ultimate outcomes.
+ Volunteers and in-kind contributions are often easier to coordinate in rural jurisdictions.
– Because donations from industry are often voluntary and rely on the generosity and ability of the local industry to contribute, they can vary from year-to-year and project-to-project. Can be overcome by actively engaging donors in the process.
– In-kind contributions can be very difficult to track and coordinate. Can be overcome by setting up tracking systems and careful record keeping.
– Volunteer workforces may prove difficult to coordinate and supervise, particularly in large complex metropolitan areas. Can be offset by the added buy-in from the workforce for the project and the goals of the LEPC.
– Volunteer data collection has limited quality control. Is best overcome by training, including stressing the importance of accuracy and care required in making hazardous materials observations.
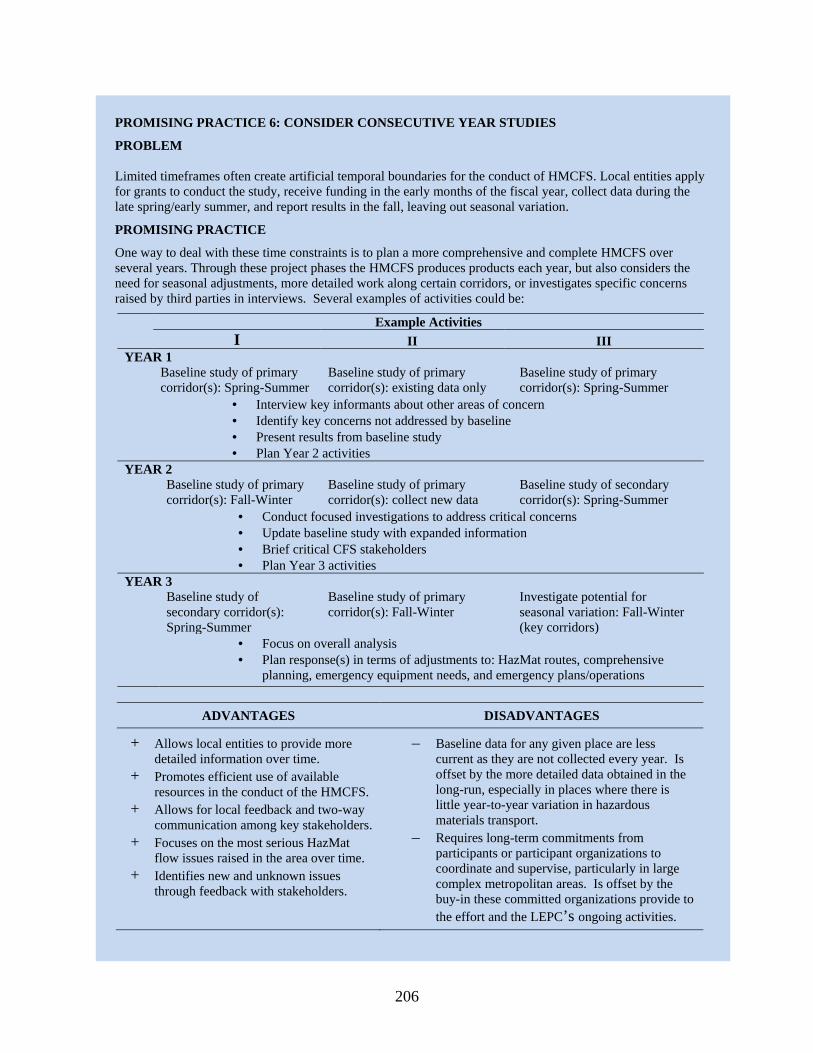
206
PROMISING PRACTICE 6: CONSIDER CONSECUTIVE YEAR STUDIES PROBLEM Limited timeframes often create artificial temporal boundaries for the conduct of HMCFS. Local entities apply for grants to conduct the study, receive funding in the early months of the fiscal year, collect data during the late spring/early summer, and report results in the fall, leaving out seasonal variation. PROMISING PRACTICE One way to deal with these time constraints is to plan a more comprehensive and complete HMCFS over several years. Through these project phases the HMCFS produces products each year, but also considers the need for seasonal adjustments, more detailed work along certain corridors, or investigates specific concerns raised by third parties in interviews. Several examples of activities could be:
Example Activities I II III
YEAR 1 Baseline study of primary
corridor(s): Spring-Summer Baseline study of primary corridor(s): existing data only
Baseline study of primary corridor(s): Spring-Summer
• Interview key informants about other areas of concern • Identify key concerns not addressed by baseline • Present results from baseline study • Plan Year 2 activities
YEAR 2 Baseline study of primary
corridor(s): Fall-Winter Baseline study of primary corridor(s): collect new data
Baseline study of secondary corridor(s): Spring-Summer
• Conduct focused investigations to address critical concerns • Update baseline study with expanded information • Brief critical CFS stakeholders • Plan Year 3 activities
YEAR 3 Baseline study of
secondary corridor(s): Spring-Summer
Baseline study of primary corridor(s): Fall-Winter
Investigate potential for seasonal variation: Fall-Winter (key corridors)
• Focus on overall analysis • Plan response(s) in terms of adjustments to: HazMat routes, comprehensive
planning, emergency equipment needs, and emergency plans/operations
ADVANTAGES DISADVANTAGES
+ Allows local entities to provide more detailed information over time.
+ Promotes efficient use of available resources in the conduct of the HMCFS.
+ Allows for local feedback and two-way communication among key stakeholders.
+ Focuses on the most serious HazMat flow issues raised in the area over time.
+ Identifies new and unknown issues through feedback with stakeholders.
– Baseline data for any given place are less current as they are not collected every year. Is offset by the more detailed data obtained in the long-run, especially in places where there is little year-to-year variation in hazardous materials transport.
– Requires long-term commitments from participants or participant organizations to coordinate and supervise, particularly in large complex metropolitan areas. Is offset by the buy-in these committed organizations provide to the effort and the LEPC’s ongoing activities.
207
9.5 DEFINE HMCFS PERSONNEL ROLES
Over one-quarter of the LEPCs who had conducted an HMCFS reported that contractors participated in the study (Figure 10). Whether an LEPC chooses to use a contractor or not depends on many issues (e.g., funding, availability, confidence), but whether a contractor is used or not, LEPC members will need to be engaged to keep them active in the process and its outcomes. Regardless of whether the HMCFS is conducted entirely internally, or if an external entity such as a contractor is brought in, an HMCFS requires the oversight of a manager or coordinator who can provide a central point for direction of the project, periodically review progress on the effort, provide input about direction of the project relative to objectives, and review project results.
Participation by local entities such as LEPCs in the commodity flow study is critical to the success of the study. The role of the LEPC and its members change only slightly with the method chosen for conducting the HMCFS. If the LEPC chooses to hire an outside entity to conduct the study, the LEPC still has a vital role. The role(s) of the LEPC and its members may include:
• providing input to the contractor about the purpose and use of the study; • providing input about known historical data and special local situations that may not
be readily known; • providing assistance to the contractor in acquiring data. For example, LEPCs are able
to more readily access data from Tier II companies and some transporters such as rail and barge companies;
• providing input on data collection site locations, to ensure collected data covers the needs of the jurisdiction; and
• interpreting results of the HMCFS, disseminating information to stakeholders, and implementing changes to local emergency and community planning practices as a result of project objectives.
An outside entity contracted to conduct an HMCFS also has a defined role. The role of the contractor may include:
• conducting preliminary meetings with the LEPC to ensure that the study is designed to meet the identified needs;
• acquiring historical data and requesting assistance from the LEPC if necessary; • designing a study to meet the needs of the LEPC; and • coordinating and conducting data collection, and analyzing data.
A local entity that conducts the study internally is also responsible for data collection and analysis. This will require, at a minimum, personnel who are experienced in the use of
208
spreadsheet software, such as Microsoft Excel®. Involvement of personnel with technical writing experience will help ensure that the information is accurately and effectively communicated through HMCFS documents. Although not critical to the HMCFS, GIS experience will be very beneficial because it allows for HazMat transport information to be communicated using maps, in addition to lists, charts, and tables.
Nearly 50 percent of the LEPCs who reported conducting an HMCFS used either volunteers or industry representatives, and the more than 50 percent used LEPC members (who usually volunteer their services) to conduct the HMCFS. Coordinating volunteers and keeping them engaged through a complex HMCFS can be a challenge. Promising Practice 7: Utilizing Volunteers to Conduct HMCFS presents issues particularly relevant to LEPCs for conducting an HMCFS using volunteer participation.
209
PROMISING PRACTICE 7: UTILIZING VOLUNTEERS TO CONDUCT HMCFS PROBLEM The LEPC is the focal point for emergency management and preparedness for HazMat in local jurisdictions. An LEPC is made up of volunteers from the community it serves. The membership of an LEPC includes representatives selected by the local governmental entities and is approved by the SERC. The LEPC membership must include local officials, police, fire, civil defense, public health, transportation, and environmental professionals, as well as representatives of facilities subject to the emergency planning requirements, community groups, and the media. Keeping this critical group of community leaders involved in the HMCFS is essential to a well-informed study that is able to be used for the objectives. PROMISING PRACTICE The voluntary composition of and participation in the LEPC are both the greatest strength and weakness of the committee. In an active LEPC, each member brings unique perspective to the committee with the diverse views of the community being represented, both public and private. This equal representation of views and knowledge is the committee’s greatest strength. Additionally the diversity of the committee provides increased resources and allows the committee to become a tool for collaboration between various industry and the community interests. However, because membership on the LEPC is voluntary, some LEPCs suffer from a passive participation. This lack of participation is often the result of members or potential members, or the entities that they represent, not understanding the importance of the committee’s functions. The consequence of this lack of participation is a weak or inactive LEPC that struggles to fulfill the responsibilities it has to the community. Hence, participation by the LEPC in the HMCFS is important to the success of the study. The very nature of the LEPC and its volunteer members provides both strengths and weaknesses. In order for an LEPC to be successful, members must be committed to the purpose of the LEPC. Demands on LEPC volunteers can be time consuming and without the cooperation and support of local government and industry, finding qualified volunteers and members can be a daunting task. Because an LEPC is voluntary in nature LEPC’s are often unmanned and under-funded as noted in the 2001 the National Institute of Chemical Studies conducted a study for the Environmental Protection Agency regarding LEPCs and Risk Management Plans (79). This study examined how LEPCs could use Risk Management Plans to improve community safety and promote hazard reductions. The study found that encouraging hazard reductions was recognized as a logical role of many LEPCs, there were a number of challenges and concerns that hindered them from implementing that role. Among the concerns were: lack of mandate under EPCRA, lack of resources, lack of technical expertise, unclear responsibilities, public apathy, and lack of support. The study team recommended a number of ways that the EPA could address LEPC concerns and strengthen their role in hazard reduction. LEPC-Conducted HMCFS—When an LEPC conducts its own HMCFS it assures the active participation of members of the LEPC in the process. Participation of committee members in a commodity flow study that is internally conducted is easily achieved, because members are physically collecting the data used in the study.
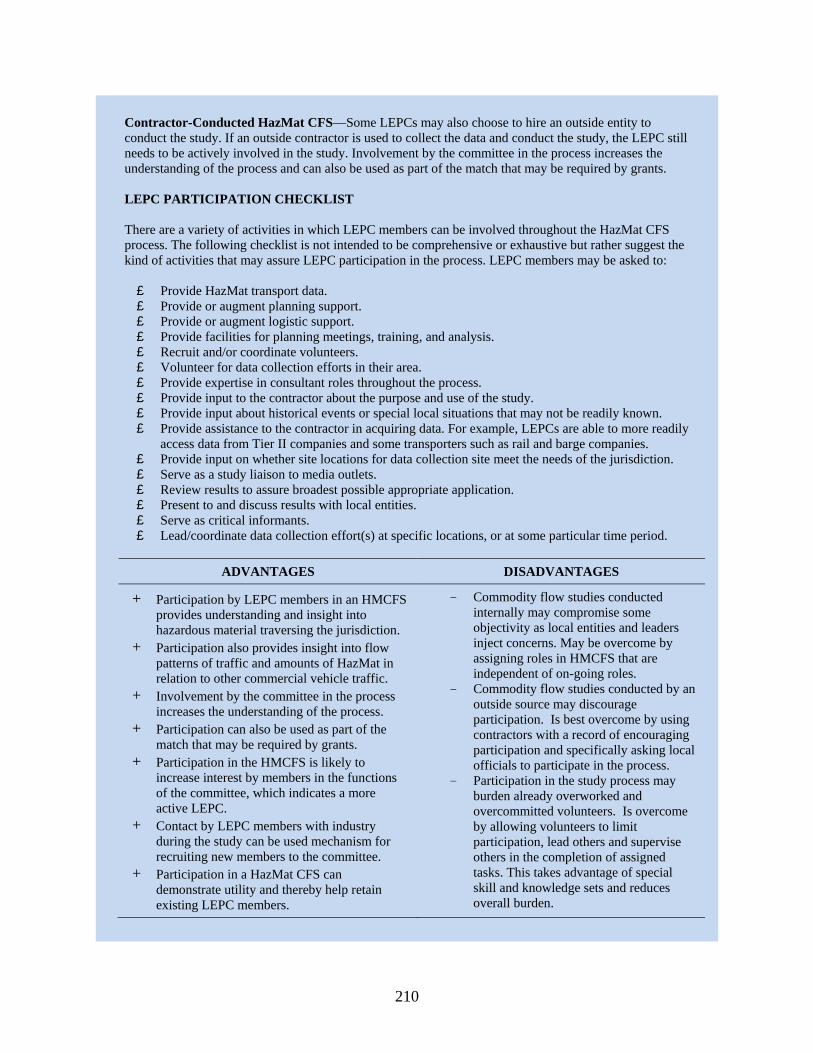
210
Contractor-Conducted HazMat CFS—Some LEPCs may also choose to hire an outside entity to conduct the study. If an outside contractor is used to collect the data and conduct the study, the LEPC still needs to be actively involved in the study. Involvement by the committee in the process increases the understanding of the process and can also be used as part of the match that may be required by grants. LEPC PARTICIPATION CHECKLIST There are a variety of activities in which LEPC members can be involved throughout the HazMat CFS process. The following checklist is not intended to be comprehensive or exhaustive but rather suggest the kind of activities that may assure LEPC participation in the process. LEPC members may be asked to: £ Provide HazMat transport data. £ Provide or augment planning support. £ Provide or augment logistic support. £ Provide facilities for planning meetings, training, and analysis. £ Recruit and/or coordinate volunteers. £ Volunteer for data collection efforts in their area. £ Provide expertise in consultant roles throughout the process. £ Provide input to the contractor about the purpose and use of the study. £ Provide input about historical events or special local situations that may not be readily known. £ Provide assistance to the contractor in acquiring data. For example, LEPCs are able to more readily
access data from Tier II companies and some transporters such as rail and barge companies. £ Provide input on whether site locations for data collection site meet the needs of the jurisdiction. £ Serve as a study liaison to media outlets. £ Review results to assure broadest possible appropriate application. £ Present to and discuss results with local entities. £ Serve as critical informants. £ Lead/coordinate data collection effort(s) at specific locations, or at some particular time period.
ADVANTAGES DISADVANTAGES
+ Participation by LEPC members in an HMCFS provides understanding and insight into hazardous material traversing the jurisdiction.
+ Participation also provides insight into flow patterns of traffic and amounts of HazMat in relation to other commercial vehicle traffic.
+ Involvement by the committee in the process increases the understanding of the process.
+ Participation can also be used as part of the match that may be required by grants.
+ Participation in the HMCFS is likely to increase interest by members in the functions of the committee, which indicates a more active LEPC.
+ Contact by LEPC members with industry during the study can be used mechanism for recruiting new members to the committee.
+ Participation in a HazMat CFS can demonstrate utility and thereby help retain existing LEPC members.
– Commodity flow studies conducted internally may compromise some objectivity as local entities and leaders inject concerns. May be overcome by assigning roles in HMCFS that are independent of on-going roles.
– Commodity flow studies conducted by an outside source may discourage participation. Is best overcome by using contractors with a record of encouraging participation and specifically asking local officials to participate in the process.
– Participation in the study process may burden already overworked and overcommitted volunteers. Is overcome by allowing volunteers to limit participation, lead others and supervise others in the completion of assigned tasks. This takes advantage of special skill and knowledge sets and reduces overall burden.
211
9.6 UTILIZE EXISTING DATA SOURCES
Nearly 40 percent of LEPCs report using local industry or fixed facility sources of existing hazardous materials data in the HMCFS, around one-third report using data from carriers or accident data, around one-quarter report using a prior HMCFS as a source of existing data, but less than 20 percent report using Census/BTS data or other federal sources of existing data (Figure 12). This seems to indicate that there are vast sources of data that are available that are underutilized by the LEPC community for conducting HMCFS. Even for the experienced, remembering the numerous sources of data can be onerous. Promising Practice 8: Use Existing Data Source Checklist presents a summary of existing data sources that allow users to tabulate the availability and relevance of different data sources covered in this chapter, and can help to determine where focus needs to be placed for collection and evaluation of existing data.
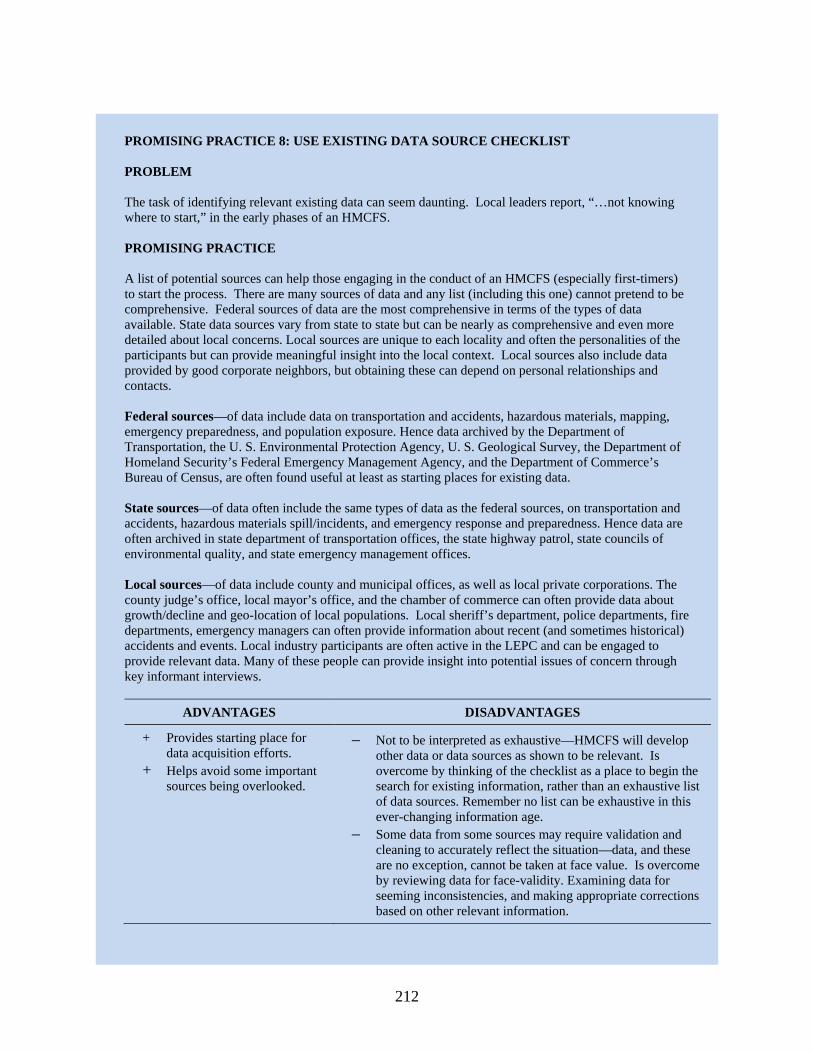
212
PROMISING PRACTICE 8: USE EXISTING DATA SOURCE CHECKLIST PROBLEM The task of identifying relevant existing data can seem daunting. Local leaders report, “…not knowing where to start,” in the early phases of an HMCFS. PROMISING PRACTICE A list of potential sources can help those engaging in the conduct of an HMCFS (especially first-timers) to start the process. There are many sources of data and any list (including this one) cannot pretend to be comprehensive. Federal sources of data are the most comprehensive in terms of the types of data available. State data sources vary from state to state but can be nearly as comprehensive and even more detailed about local concerns. Local sources are unique to each locality and often the personalities of the participants but can provide meaningful insight into the local context. Local sources also include data provided by good corporate neighbors, but obtaining these can depend on personal relationships and contacts. Federal sources—of data include data on transportation and accidents, hazardous materials, mapping, emergency preparedness, and population exposure. Hence data archived by the Department of Transportation, the U. S. Environmental Protection Agency, U. S. Geological Survey, the Department of Homeland Security’s Federal Emergency Management Agency, and the Department of Commerce’s Bureau of Census, are often found useful at least as starting places for existing data. State sources—of data often include the same types of data as the federal sources, on transportation and accidents, hazardous materials spill/incidents, and emergency response and preparedness. Hence data are often archived in state department of transportation offices, the state highway patrol, state councils of environmental quality, and state emergency management offices. Local sources—of data include county and municipal offices, as well as local private corporations. The county judge’s office, local mayor’s office, and the chamber of commerce can often provide data about growth/decline and geo-location of local populations. Local sheriff’s department, police departments, fire departments, emergency managers can often provide information about recent (and sometimes historical) accidents and events. Local industry participants are often active in the LEPC and can be engaged to provide relevant data. Many of these people can provide insight into potential issues of concern through key informant interviews.
ADVANTAGES DISADVANTAGES
+ Provides starting place for data acquisition efforts.
+ Helps avoid some important sources being overlooked.
– Not to be interpreted as exhaustive—HMCFS will develop other data or data sources as shown to be relevant. Is overcome by thinking of the checklist as a place to begin the search for existing information, rather than an exhaustive list of data sources. Remember no list can be exhaustive in this ever-changing information age.
– Some data from some sources may require validation and cleaning to accurately reflect the situation—data, and these are no exception, cannot be taken at face value. Is overcome by reviewing data for face-validity. Examining data for seeming inconsistencies, and making appropriate corrections based on other relevant information.
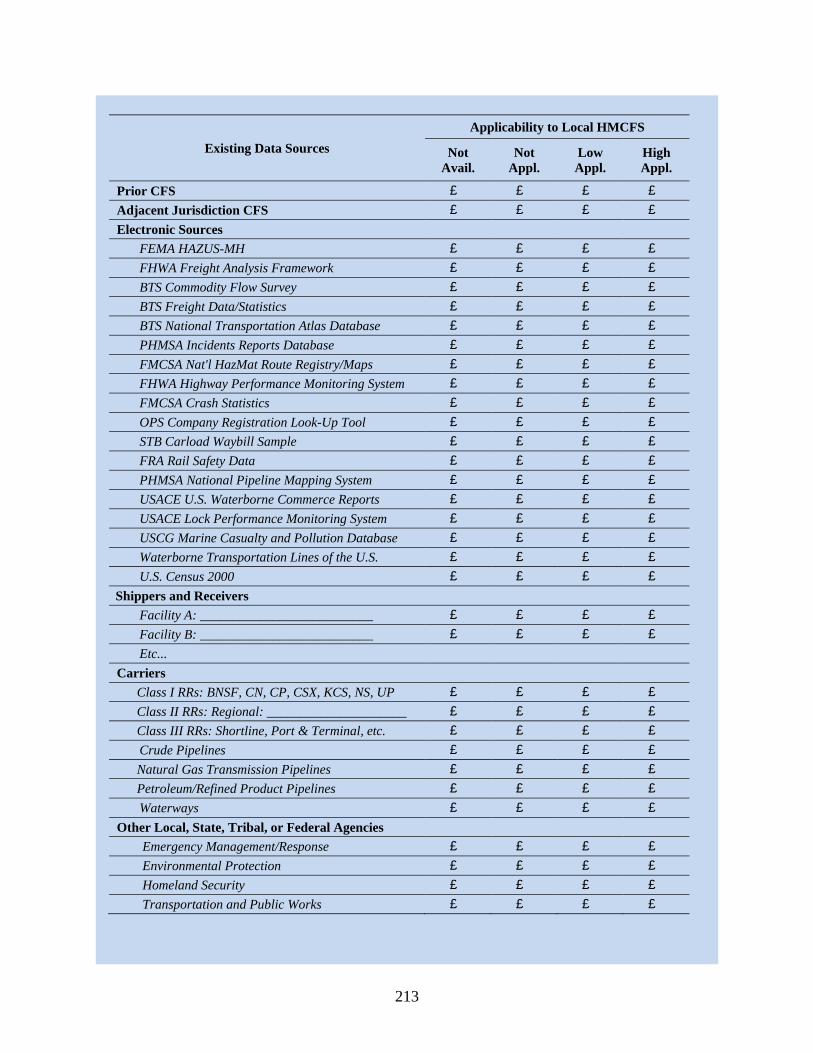
213
Existing Data Sources Applicability to Local HMCFS
Not Avail.
Not Appl.
Low Appl.
High Appl.
Prior CFS £ £ £ £ Adjacent Jurisdiction CFS £ £ £ £ Electronic Sources
FEMA HAZUS-MH £ £ £ £ FHWA Freight Analysis Framework £ £ £ £ BTS Commodity Flow Survey £ £ £ £ BTS Freight Data/Statistics £ £ £ £ BTS National Transportation Atlas Database £ £ £ £ PHMSA Incidents Reports Database £ £ £ £ FMCSA Nat'l HazMat Route Registry/Maps £ £ £ £ FHWA Highway Performance Monitoring System £ £ £ £ FMCSA Crash Statistics £ £ £ £ OPS Company Registration Look-Up Tool £ £ £ £ STB Carload Waybill Sample £ £ £ £ FRA Rail Safety Data £ £ £ £ PHMSA National Pipeline Mapping System £ £ £ £ USACE U.S. Waterborne Commerce Reports £ £ £ £ USACE Lock Performance Monitoring System £ £ £ £ USCG Marine Casualty and Pollution Database £ £ £ £ Waterborne Transportation Lines of the U.S. £ £ £ £ U.S. Census 2000 £ £ £ £
Shippers and Receivers Facility A: __________________________ £ £ £ £ Facility B: __________________________ £ £ £ £ Etc...
Carriers Class I RRs: BNSF, CN, CP, CSX, KCS, NS, UP £ £ £ £ Class II RRs: Regional: _____________________ £ £ £ £ Class III RRs: Shortline, Port & Terminal, etc. £ £ £ £ Crude Pipelines £ £ £ £ Natural Gas Transmission Pipelines £ £ £ £ Petroleum/Refined Product Pipelines £ £ £ £ Waterways £ £ £ £
Other Local, State, Tribal, or Federal Agencies Emergency Management/Response £ £ £ £ Environmental Protection £ £ £ £ Homeland Security £ £ £ £ Transportation and Public Works £ £ £ £
214
9.7 EVALUATE POTENTIAL CONSEQUENCES OF HAZMAT RELEASES
While using a particular source of data tends may improve confidence in the HMCFS participant’s confidence in the analysis, sources used by more than 1 in 5 LEPCs conducting HMCFSs, report confidence in analysis of between 5 and 7.2 (on a 0 to 10 scale), while sources used by less than 1 in 10 report confidence in the analysis of between 6.3 and 7.5. This pattern suggests that LEPCs are not satisfied with the analysis conducted in the HMCFS and searching for better ways to interpret the data. A hotspots analysis is a way to relate four critical components of HazMat risk analysis: time, space, hazardous materials, and people. The analysis can help LEPCs discover times and places where the co-location of people and hazardous materials need special attention. Hotspots (discussed in Promising Practice 9) should be easily understood and self evident in that little interpretation is required.
215
PROMISING PRACTICE 9: USE HOT SPOTS ANALYSIS PROBLEM Using the HMCFS to identify unique areas of concern in the local area provides insight into sometimes critical issues in emergency management, HazMat route adjustments, resource allocations and potential consequences. Yet local entities may not know how to interpret data to identify associated “hot spots”—general or specific areas of concern or unique risk areas. PROMISING PRACTICE Overall area(s) of potential concern are provided by an overview of risk(s) associated with the transport of HazMat over the transportation network. Determining specific areas of concern is done by a hot spots analysis. POSSIBLE HOT SPOT ANALYSES Planning for Emergency Response Capabilities: This analysis determines the existing coverage of HazMat response equipment and facilities and determines where current and future gaps exist. Hazards Identification: This analysis determines locations where HazMat incidents occur at elevated levels. This may result in finding locations along the transportation network or locations at or near fixed facilities. Land Use Compatibility: This analysis determines locations where HazMat-related land uses and adjacent land uses are not compatible. This is important when considering redevelopment or new development of land uses adjacent to HazMat routes, industrial areas or facilities where HazMat is prevalent, and high risk areas. Data and Resource Needs The data required for this type of analysis comes from a variety of sources and is largely a factor of the complexity of the desired analysis. Most, if not all, of the HazMat-related data, such as fixed facility locations and commodity flow, comes from the data collection portion of the commodity flow survey. Hot spots analysis goes beyond the HazMat-specific data, and requires additional data integration to supplement already acquired data. Hot spots analysis data are spatial in nature; that is, they represent something geographically identified, such as transportation networks or streams. In addition to spatial data, there are also temporal data, such as hourly traffic flows on targeted roadways, hours-of-operation of certain fixed facilities, or seasonal traffic patterns. The table below provides an inventory of data items that may be useful in a hot spots analysis. The simplest way to identify relationships between data sources is to examine existing printed maps. This task may be easier by using resources available on the internet, such as online maps. Many online maps have multiple data items identified, such as schools or rivers, in addition to the transportation networks.
216
Types of Data: Geographic • Transportation
o Road and intersection locations and characteristics
o Infrastructure (bridges, drainage, etc.) o Traffic volumes and mixes o Truck counts o Rail lines, sidings and yards o Truck stops o Port or intermodal facilities o Traffic accident locations o Highway-rail grade crossings
• HazMat/Emergency Response o Spill and/or release locations o HazMat incidents o Designated HazMat routes o Fixed facilities o HazMat commodity flows o Fire stations/emerg. response teams o Military installations o Other emergency response
facilities/resources
• Human o Population locations o Schools o Parks and recreation locations o Hospitals o Colleges/universities o Employment centers o Future growth/development areas o Tourist/cultural points of interest o Land use/zoning o Special needs populations
• Business o Business locations where HazMat
produced, shipped, and/or received o Business parks or clusters o Local/regional development locations
• Environmental o Drinking water sources o Habitat: oceans, lakes, rivers, wetlands, etc. o Land coverage, topography and soils
Types of Data: Temporal • Hourly traffic flow distribution
o By roadway and/or roadway type o Truck volumes
• Hourly/seasonal LOS, congestion
• Hours of operation o Facilities, businesses, etc. o Schools, employment centers, etc.
Types of Data: Other • Interviews
o Fire, police and emergency response o Industry and business representatives o Transportation providers o General public
• Weather conditions o Daily/seasonal temperatures o Daily/seasonal wind conditions o Daily/seasonal precipitation
It is also important to investigate the online resources available by local and regional planning entities. Many now have online thematic maps and online Geographic Information System (GIS) maps that are available at no charge. On a national level, the USGS maintains The National Map, which is an online GIS map viewer that is capable of displaying a wide variety of spatial data for use in a spatial analysis. Electronic geographic features and locations may require “ground-truthing” with local empirical observation or confirmation. For purchase professional GIS software is also a valuable resource for hot spots analysis. These packages are capable of displaying the different data layers in a single output and also have powerful built-in functions that perform complex spatial analyses.
217
HOT SPOTS ANALYSIS PROCEDURES Clarify Analysis Needs: Current Internet and GIS software allows for complex analysis to be performed, however, the defined outcome needs may warrant a simple solution using existing printed maps, databases, and charts. Data Coordination: The data requirements largely correlate to the hot spots analysis complexity. Users can identify both required and desired data sources for the analysis from the data source inventory above. Local, regional, or state planning organizations may already have data available in formats easily incorporated into the hot spots analysis. Perform Analysis: Hot spots analyses are largely spatial in nature. Displaying the data layers in relation to each other is the critical initial component of the analysis. Utilizing the mapping or software resources allows for critical evaluation of many data elements to determine the hot spots within a focused study area. Periodic Monitoring: Changing conditions on roadways and development patterns necessitates periodic monitoring of the hot spots analysis. Regular monitoring allows for minor adjustments to an existing analysis compared to entirely reformulating the analysis after conditions have significantly altered since the last performed analysis. EXAMPLE – SAN DIEGO HAZARDOUS MATERIAL COMMODITY FLOW STUDY The San Diego Hazardous Material Commodity Flow Study published in June 2001 contains a chapter in the report on hot spots. The report indicates that the hot spot analysis will assist in emergency preparedness for the region by determining the “placement for hazardous materials response equipment and facilities, and training priorities for emergency responders.” The hot spots discussion addresses:
• San Diego Geography – This includes a mention of the population growth experienced in the region and expected growth levels; major redevelopment areas in the study area; and hazardous material spills;
• Environmentally Sensitive Areas – This includes the water supply and resources in the area;
• Human Sensitive Areas – This includes schools, hospitals, public places (parks, etc.), and densely populated areas near heavy HazMat traffic flows; and
• Customhouse Brokers – This includes warehouses operated by customhouse brokers that experience HazMat shipments.
For the analysis, maps are utilized show the relationship between the transportation infrastructure (i.e., roads, rail), environmentally sensitive areas (i.e., streams, lakes), human sensitive areas (i.e., hospitals, schools), emergency response facilities (i.e., fire stations, police stations), and cumulative reported HazMat spills for a five-year period. A zoomed-in portion of the map included in the San Diego report is shown below.
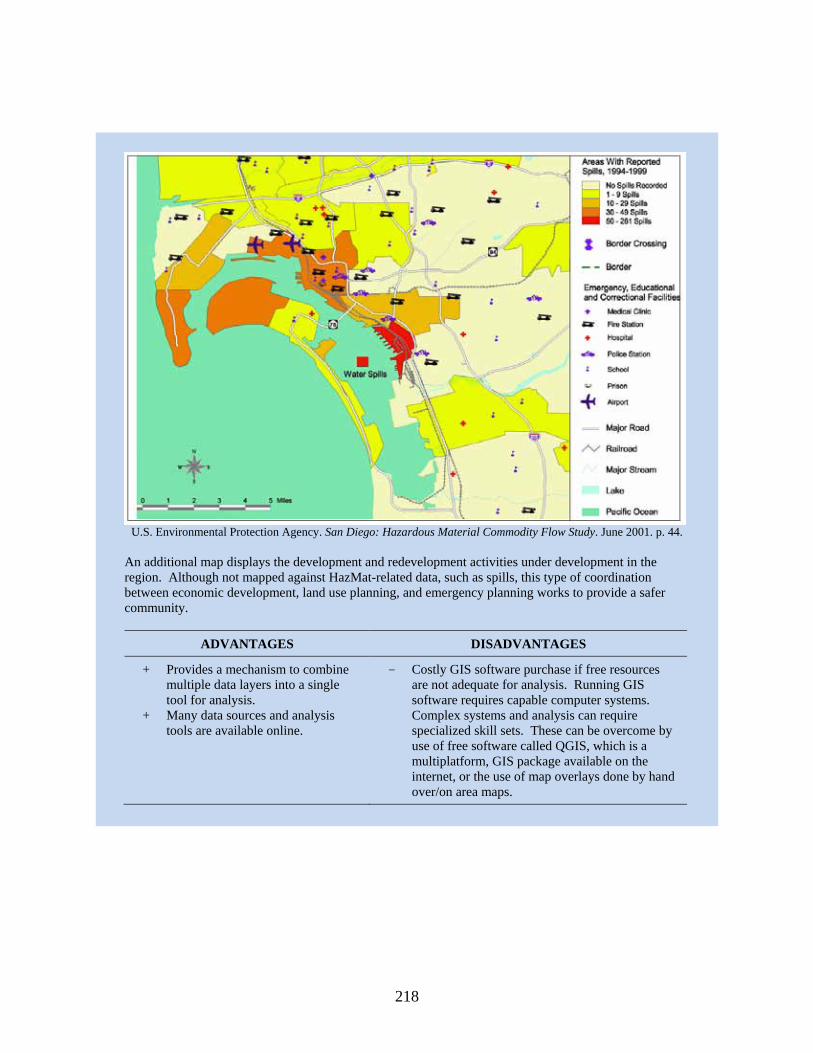
218
U.S. Environmental Protection Agency. San Diego: Hazardous Material Commodity Flow Study. June 2001. p. 44.
An additional map displays the development and redevelopment activities under development in the region. Although not mapped against HazMat-related data, such as spills, this type of coordination between economic development, land use planning, and emergency planning works to provide a safer community.
ADVANTAGES DISADVANTAGES
+ Provides a mechanism to combine multiple data layers into a single tool for analysis.
+ Many data sources and analysis tools are available online.
– Costly GIS software purchase if free resources are not adequate for analysis. Running GIS software requires capable computer systems. Complex systems and analysis can require specialized skill sets. These can be overcome by use of free software called QGIS, which is a multiplatform, GIS package available on the internet, or the use of map overlays done by hand over/on area maps.
219
9.8 COMMUNICATION WITH CRITICAL STAKE HOLDERS
Figure 29 shows that LEPCs report sending the results of the HMCFS to emergency planning and response personnel—LEPC members, fire and police departments from over 50 percent to almost 80 percent of the time. Compare this range with the frequency that HMCFS information was sent to public administrators—county commissioners, city manager, mayors, council members, or judges, hospitals and public health officials, or school officials (from 10 percent to around 35 percent of the time) and general public outlets—public meetings, local media, internet, or library (between around 2 percent and 16 percent of the time, with only public meetings exceeding 10 percent). At the same time, this pattern almost mirrors the level of improved understanding about HazMat transport risks that LEPCs reported these different groups obtained from the HMCFS (Figure 30). Emergency responders had very high improvement, followed by public health officials, community planners, and health officials (moderate improvement), then school officials and the general public (low improvement).
These results clearly demonstrate that many LEPCs are not communicating HMCFS information to a variety of public stakeholders, and thereby losing out on the opportunity to improve their understanding of HazMat transport risks. Hence, communication with stakeholders is a critical element of a successful HMCFS. Promising Practice 10 is a checklist of entities to whom HMCFS communication may be considered.
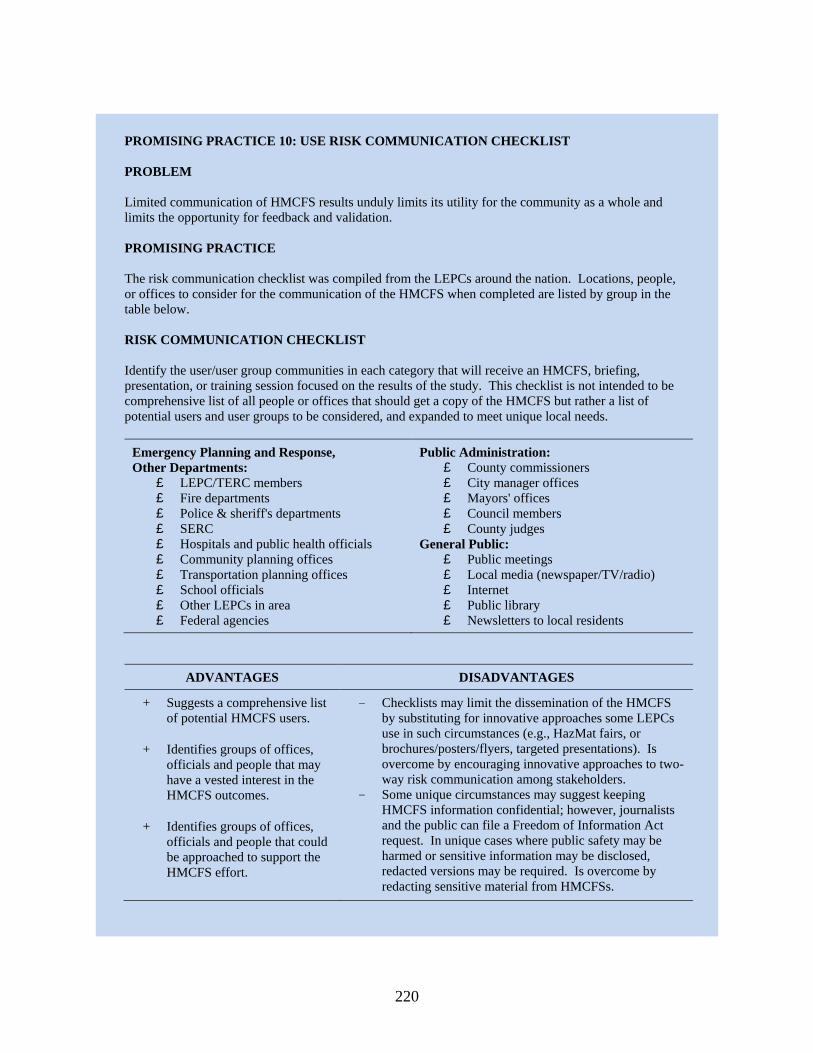
220
PROMISING PRACTICE 10: USE RISK COMMUNICATION CHECKLIST PROBLEM Limited communication of HMCFS results unduly limits its utility for the community as a whole and limits the opportunity for feedback and validation. PROMISING PRACTICE The risk communication checklist was compiled from the LEPCs around the nation. Locations, people, or offices to consider for the communication of the HMCFS when completed are listed by group in the table below. RISK COMMUNICATION CHECKLIST Identify the user/user group communities in each category that will receive an HMCFS, briefing, presentation, or training session focused on the results of the study. This checklist is not intended to be comprehensive list of all people or offices that should get a copy of the HMCFS but rather a list of potential users and user groups to be considered, and expanded to meet unique local needs.
Emergency Planning and Response, Other Departments: £ LEPC/TERC members £ Fire departments £ Police & sheriff's departments £ SERC £ Hospitals and public health officials £ Community planning offices £ Transportation planning offices £ School officials £ Other LEPCs in area £ Federal agencies
Public Administration: £ County commissioners £ City manager offices £ Mayors' offices £ Council members £ County judges
General Public: £ Public meetings £ Local media (newspaper/TV/radio) £ Internet £ Public library £ Newsletters to local residents
ADVANTAGES DISADVANTAGES
+ Suggests a comprehensive list of potential HMCFS users.
+ Identifies groups of offices, officials and people that may have a vested interest in the HMCFS outcomes.
+ Identifies groups of offices, officials and people that could be approached to support the HMCFS effort.
– Checklists may limit the dissemination of the HMCFS by substituting for innovative approaches some LEPCs use in such circumstances (e.g., HazMat fairs, or brochures/posters/flyers, targeted presentations). Is overcome by encouraging innovative approaches to two-way risk communication among stakeholders.
– Some unique circumstances may suggest keeping HMCFS information confidential; however, journalists and the public can file a Freedom of Information Act request. In unique cases where public safety may be harmed or sensitive information may be disclosed, redacted versions may be required. Is overcome by redacting sensitive material from HMCFSs.
221
9.9 DEMONSTRATING LOCAL RISK
The critical question for implementation is what will be done differently now that the HMCFS information is available? What adjustments are needed to accommodate what is now known about the transport of HazMat into, out of, within and through the community? The HMCFS helps overcome one important concern by providing evidence of potential concern for the public and local authorities.
The barrier cited most frequently to the conduct of HMCFS by LEPCs (Figure 34) is lack of funding (more than 50 percent) and lack of personnel and time (about 25 percent each). The most significant incentive to encourage LEPCs to conduct HMCFS (Figure 35) is more money (at over 60 percent). Funding from federal grant programs that may be used for conducting an HMCFS (such as HMEP) or other emergency planning activities often require a non-federal match. Other needs may be written into local or state budgets. The approval of funds that can be used as non-federal matches or for wholesale funding are often local officials who respond to input of community leaders and the general public. The results of the HMCFS can be used to engender support among critical stakeholders. Local leaders and officials charged with protection of the public cannot ignore risks. Hence using the results of the study to inform the public, public officials, and community leadership in this regard is one very useful outcome of the HMCFS process. Yet most LEPCs do not report engaging in either risk communication or risk demonstration (Figure 29). Promising Practice 11 encourages users to use the HMCFS results to Demonstrate Local Risk.
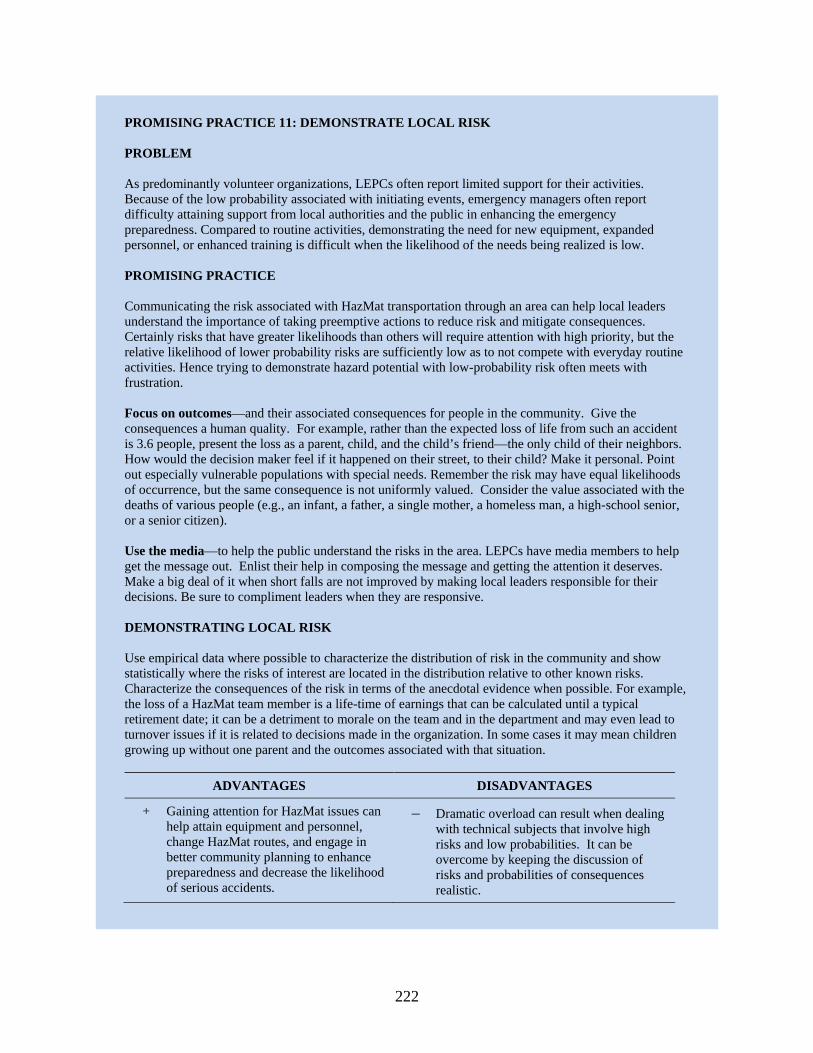
222
PROMISING PRACTICE 11: DEMONSTRATE LOCAL RISK PROBLEM As predominantly volunteer organizations, LEPCs often report limited support for their activities. Because of the low probability associated with initiating events, emergency managers often report difficulty attaining support from local authorities and the public in enhancing the emergency preparedness. Compared to routine activities, demonstrating the need for new equipment, expanded personnel, or enhanced training is difficult when the likelihood of the needs being realized is low. PROMISING PRACTICE Communicating the risk associated with HazMat transportation through an area can help local leaders understand the importance of taking preemptive actions to reduce risk and mitigate consequences. Certainly risks that have greater likelihoods than others will require attention with high priority, but the relative likelihood of lower probability risks are sufficiently low as to not compete with everyday routine activities. Hence trying to demonstrate hazard potential with low-probability risk often meets with frustration. Focus on outcomes—and their associated consequences for people in the community. Give the consequences a human quality. For example, rather than the expected loss of life from such an accident is 3.6 people, present the loss as a parent, child, and the child’s friend—the only child of their neighbors. How would the decision maker feel if it happened on their street, to their child? Make it personal. Point out especially vulnerable populations with special needs. Remember the risk may have equal likelihoods of occurrence, but the same consequence is not uniformly valued. Consider the value associated with the deaths of various people (e.g., an infant, a father, a single mother, a homeless man, a high-school senior, or a senior citizen). Use the media—to help the public understand the risks in the area. LEPCs have media members to help get the message out. Enlist their help in composing the message and getting the attention it deserves. Make a big deal of it when short falls are not improved by making local leaders responsible for their decisions. Be sure to compliment leaders when they are responsive. DEMONSTRATING LOCAL RISK Use empirical data where possible to characterize the distribution of risk in the community and show statistically where the risks of interest are located in the distribution relative to other known risks. Characterize the consequences of the risk in terms of the anecdotal evidence when possible. For example, the loss of a HazMat team member is a life-time of earnings that can be calculated until a typical retirement date; it can be a detriment to morale on the team and in the department and may even lead to turnover issues if it is related to decisions made in the organization. In some cases it may mean children growing up without one parent and the outcomes associated with that situation.
ADVANTAGES DISADVANTAGES
+ Gaining attention for HazMat issues can help attain equipment and personnel, change HazMat routes, and engage in better community planning to enhance preparedness and decrease the likelihood of serious accidents.
– Dramatic overload can result when dealing with technical subjects that involve high risks and low probabilities. It can be overcome by keeping the discussion of risks and probabilities of consequences realistic.
223
CHAPTER 10: UPDATING THE GUIDANCE FOR CONDUCTING HAZARDOUS MATERIALS FLOW SURVEYS
The U.S. DOT’s 1995 Guidance for Conducting Hazardous Materials Flow Surveys has been an important source of information about how a HazMat commodity flow study can be conducted. LEPCs who indicated that the U.S. DOT Guidance was used as a source of information for conducting their HMCFS reported significantly higher usefulness of the data (Table 11) and confidence in how it was analyzed (Table 14). While these are beneficial outcomes, use of the document appears limited in practice: only 26 percent of LEPCs reported using the Guidance for their most recent HMCFS (Figure 11). Given that the Guidance is specifically focused on conducting HazMat flow surveys, the level of usage might be expected to be higher. This may not be the case for some or all of the following reasons:
• The 1995 Guidance focuses on analysis at the state level, for roadway (truck) transportation. Commodity flow studies at the local level often have different needs and available resources than state level efforts.
• Available information has changed greatly since 1995. Old data sets have been discontinued, and new data sets have become available. Even though more data may be available for some elements of the transportation system, less data may be readily available for other elements that are deemed security-sensitive, including for hazardous materials.
• While basic methodologies for collecting commodity flow data have not changed significantly since 1995, the technologies used for evaluating data using computer software and hardware have changed a great deal. Developing technologies show promise for changing how data are collected as well.
• The Guidance provides details on procedures for collecting and evaluating truck flow information, but it provides less information about how an HMCFS fits into the big picture of local emergency planning, it provides limited information on matching HMCFS needs with data collection requirements, and minimal information about how to implement the results of such a study.
The goal of Project HM-01 is to update the Guidance for use at local levels, for multiple modes (truck, rail, pipeline, water, and air) while maintaining a user-friendly format. An updated Guidebook for Conducting Local-Level Hazardous Commodity Flow Studies should retain a similar structure with the 1995 Guidance¸ while updating the data sources and recommended analysis procedures, adding information for rail, pipeline, water, and air modes and presenting additional information about the context of HazMat planning and implementing project results. The guidebook should cover the life cycle of an HMCFS and outline project steps along the way. The mechanisms to achieve objectives should be described and explained along each step of the process. How-to guidance for conducting a simple and sound HMCFS should be provided in conformance with the wide range in capabilities and resources found among local
224
jurisdictions in the U.S. Typical issues faced by LEPCs and other local entities around the country for conducting commodity flow studies should be described. Promising practices described in Chapter 9 should be presented as options to address many challenges faced in conducting an HMCFS. Detailed information about the HMCFS process, including promising practices, can be presented as appendices in the updated Guidebook to allow for a more streamlined approach to the main document.
10.1 HMCFS PRACTICE RECOMMENDATIONS
One goal of Project HM-01 was to develop a rank-ordering of recommended practices for different community types and provide a listing of alternatives among various methods, operations, and functions. As this research documents, there are a wide variety of HMCFS objectives, existing and new data sources, methods for evaluating data, and ways of implementing outcomes and communicating results to a range of project participants and stakeholders. There is no clear-cut way of describing what an HMCFS project requires based on community size, economic base, transportation network characteristics. For example, the following HMCFS projects would likely be very different from each other:
• an LEPC for a rural jurisdiction with an agricultural production base and no major Interstate highways with an objective of identifying basic training requirements;
• the same LEPC with an Interstate highway and an objective of identifying whether a HazMat route is needed around the County Seat;
• an LEPC for a major urbanized area with a complex transportation network and many petrochemical facilities with the objective of identifying equipment and staffing requirements for a new regional HazMat team; or
• the same LEPC with the objective of defining training scenarios for an existing and equipped fire department in an urban bedroom community.
The research for this project includes a review of the literature, a survey of LEPC HMCFS practices, review of HMCFS practices through case studies and direct experience, identification of data sources that can be used for an HMCFS, and explication of their analysis and implementation. The research shows that the complexity of conducting an HMCFS project generally increases as:
• size of community increases, resulting in more diverse goods consumption; • proximity to major HazMat producers, processors, and consumers increases; • complexity of the local and regional economy increases, resulting in greater seasonal
variations in HazMat transport for different sectors; • precision required to support HMCFS objectives increases, increasing the need for
locally-relevant, specific HazMat transport data; • number of different modes included in the HMCFS increases;
225
• number of major roadway transport corridors included in the HMCFS increases; and • availability of locally-relevant existing data decreases, increasing the requirement for
collection of new data.
These factors are not in any order of importance, and they may be interrelated or completely independent of each other for any one jurisdiction. Thus, the task of recommending practices for any one type of LEPC or community versus another is virtually impossible. On the other hand, two general recommended practices can be made for all LEPCs:
1) Follow the HMCFS process. The HMCFS process identified in this report is not a new fabrication but based on the previous U.S. DOT Guidance, which incorporates previous practice and literature and is validated in experience. The outline of process was introduced in Chapter 1 and is duplicated in Section 10.1.
2) Use the Promising Practices. The Promising Practices included in Chapter 9 are based on feedback from LEPCs and direct experience with conducting HMCFS about what works and does not work for an HMCFS project. Many of these practices are not focused on the details of HMCFS data collection and analysis but rather are keys to successfully planning, conducting, evaluating, and implementing an HMCFS project.
10.2 THE HMCFS PROCESS
Figure 38 illustrates the HMCFS process, which follows the conceptual outline of the 1995 Guidance and should be continued for the updated Guidebook. The process includes six major steps:
1) Select HMCFS Leadership, Set Objectives, and Define Data Requirements —Identifying the HMCFS objectives requires a forward look to determine the kinds of data that will be required to make the desired decisions. This corresponds to Section 2.1 (Identify Specific Purpose of Study) from the 1995 Guidance.
2) Collect and Review Baseline Information and Scope HMCFS Project —Reviewing existing baseline information involves assembly of readily available data and making a preliminary determination of the HMCFS data needs (e.g., updates required, gaps in existing data). The extent to which more data are needed to address the desired outcome(s) is determined. This corresponds to information contained in Section 2.2 (Review Baseline Information) from the 1995 Guidance.
3) Collect and Review Existing HMCFS Data —Collecting and evaluating existing data involves searching prior HMCFS documents, government data, and industry data. The extent to which additional HMCFS data are needed is identified. This also corresponds to information contained in Section 2.2 (Review Baseline Information) from the 1995 Guidance.
226
4) Collect and Validate New HMCFS Data —Collecting and evaluating new HMCFS data involves gathering data from key informants and observing commodity transport activities along various HazMat routes and route segments. This corresponds to Section 2.3 (Design the Study) and Section 2.4 (Collect Original Data – Field Surveys) from the 1995 Guidance.
5) Analyze and Document HMCFS Data —Analyzing HMCFS data identifies HazMat flows over routes and route segments of concern. Spatial and temporal analysis may be conducted. This corresponds to Section 2.5 (Analyze Results) from the 1995 Guidance.
6) Implement HMCFS Information —Applying HMCFS results involves reviewing results in terms of the goals and objectives they are capable of addressing, and then applying results toward these objectives. This corresponds to Section 2.6 (Apply Results to Purposes) from the 1995 Guidance.

227
Figure 38: The HMCFS Process.
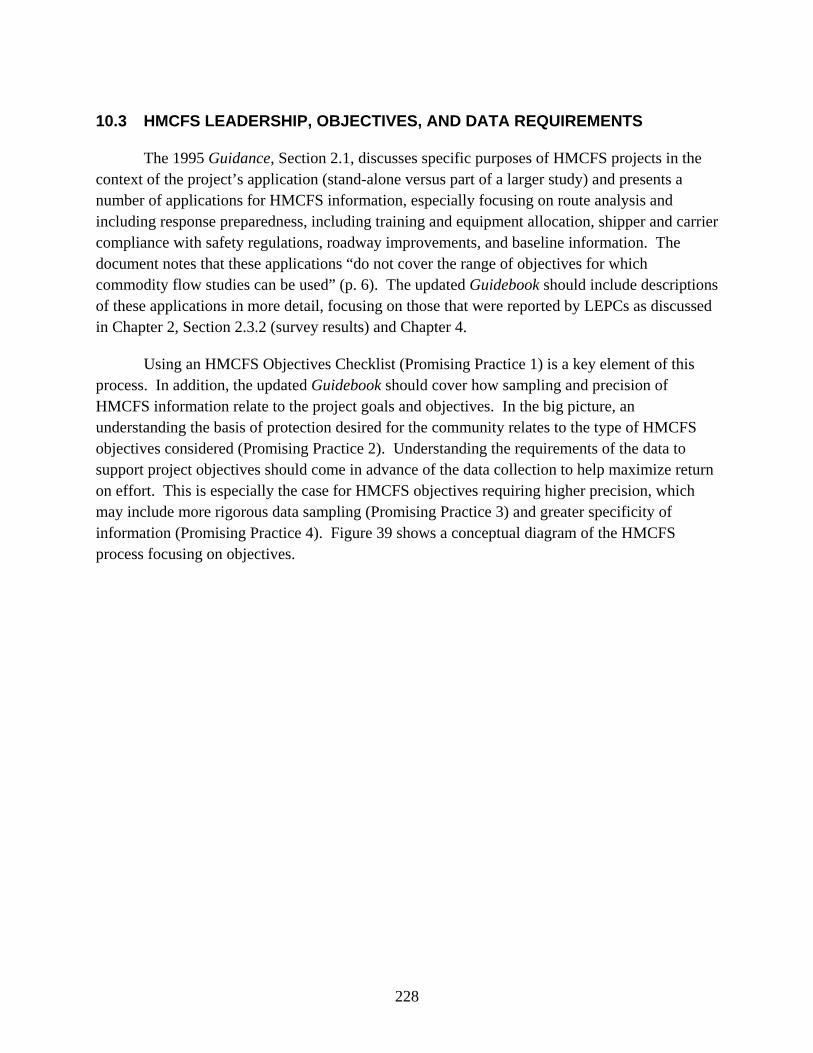
228
10.3 HMCFS LEADERSHIP, OBJECTIVES, AND DATA REQUIREMENTS
The 1995 Guidance, Section 2.1, discusses specific purposes of HMCFS projects in the context of the project’s application (stand-alone versus part of a larger study) and presents a number of applications for HMCFS information, especially focusing on route analysis and including response preparedness, including training and equipment allocation, shipper and carrier compliance with safety regulations, roadway improvements, and baseline information. The document notes that these applications “do not cover the range of objectives for which commodity flow studies can be used” (p. 6). The updated Guidebook should include descriptions of these applications in more detail, focusing on those that were reported by LEPCs as discussed in Chapter 2, Section 2.3.2 (survey results) and Chapter 4.
Using an HMCFS Objectives Checklist (Promising Practice 1) is a key element of this process. In addition, the updated Guidebook should cover how sampling and precision of HMCFS information relate to the project goals and objectives. In the big picture, an understanding the basis of protection desired for the community relates to the type of HMCFS objectives considered (Promising Practice 2). Understanding the requirements of the data to support project objectives should come in advance of the data collection to help maximize return on effort. This is especially the case for HMCFS objectives requiring higher precision, which may include more rigorous data sampling (Promising Practice 3) and greater specificity of information (Promising Practice 4). Figure 39 shows a conceptual diagram of the HMCFS process focusing on objectives.
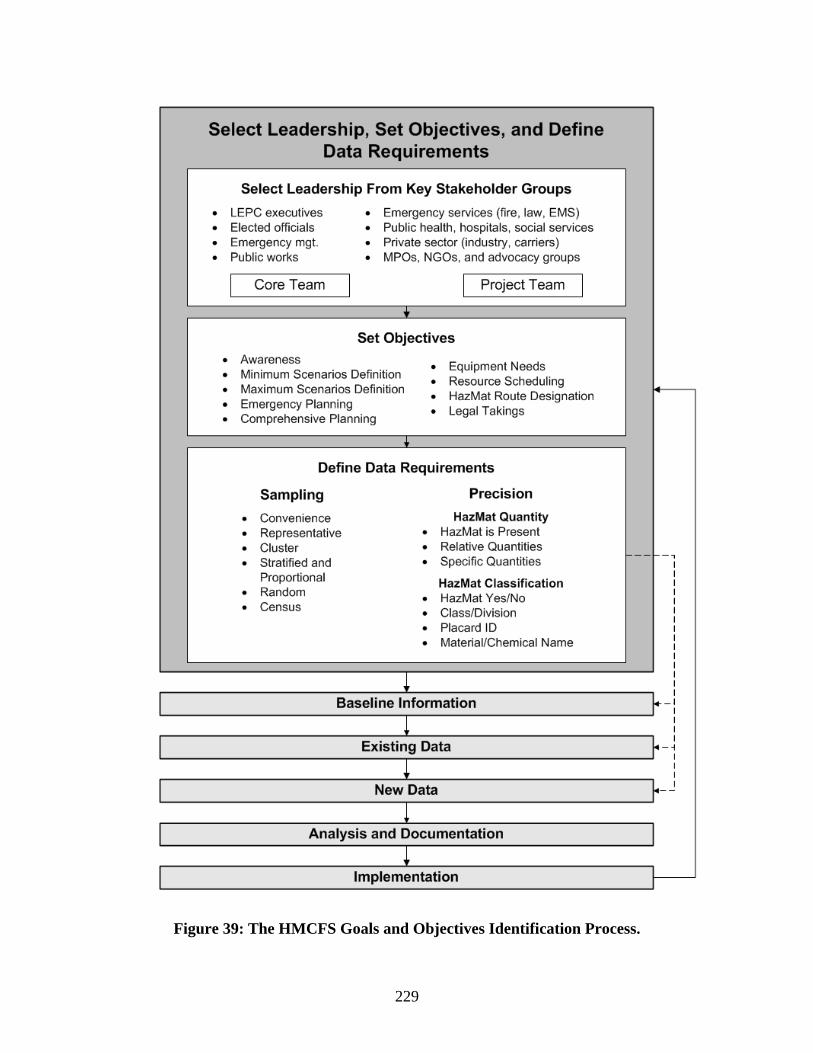
229
Figure 39: The HMCFS Goals and Objectives Identification Process.
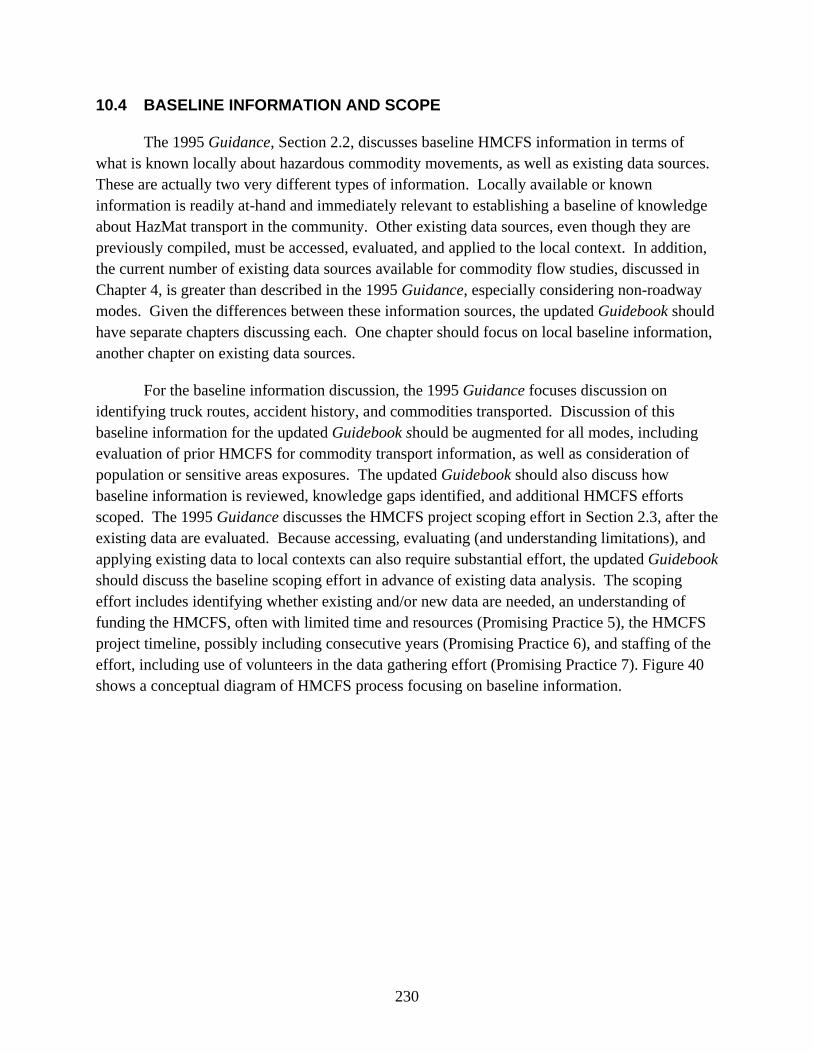
230
10.4 BASELINE INFORMATION AND SCOPE
The 1995 Guidance, Section 2.2, discusses baseline HMCFS information in terms of what is known locally about hazardous commodity movements, as well as existing data sources. These are actually two very different types of information. Locally available or known information is readily at-hand and immediately relevant to establishing a baseline of knowledge about HazMat transport in the community. Other existing data sources, even though they are previously compiled, must be accessed, evaluated, and applied to the local context. In addition, the current number of existing data sources available for commodity flow studies, discussed in Chapter 4, is greater than described in the 1995 Guidance, especially considering non-roadway modes. Given the differences between these information sources, the updated Guidebook should have separate chapters discussing each. One chapter should focus on local baseline information, another chapter on existing data sources.
For the baseline information discussion, the 1995 Guidance focuses discussion on identifying truck routes, accident history, and commodities transported. Discussion of this baseline information for the updated Guidebook should be augmented for all modes, including evaluation of prior HMCFS for commodity transport information, as well as consideration of population or sensitive areas exposures. The updated Guidebook should also discuss how baseline information is reviewed, knowledge gaps identified, and additional HMCFS efforts scoped. The 1995 Guidance discusses the HMCFS project scoping effort in Section 2.3, after the existing data are evaluated. Because accessing, evaluating (and understanding limitations), and applying existing data to local contexts can also require substantial effort, the updated Guidebook should discuss the baseline scoping effort in advance of existing data analysis. The scoping effort includes identifying whether existing and/or new data are needed, an understanding of funding the HMCFS, often with limited time and resources (Promising Practice 5), the HMCFS project timeline, possibly including consecutive years (Promising Practice 6), and staffing of the effort, including use of volunteers in the data gathering effort (Promising Practice 7). Figure 40 shows a conceptual diagram of HMCFS process focusing on baseline information.
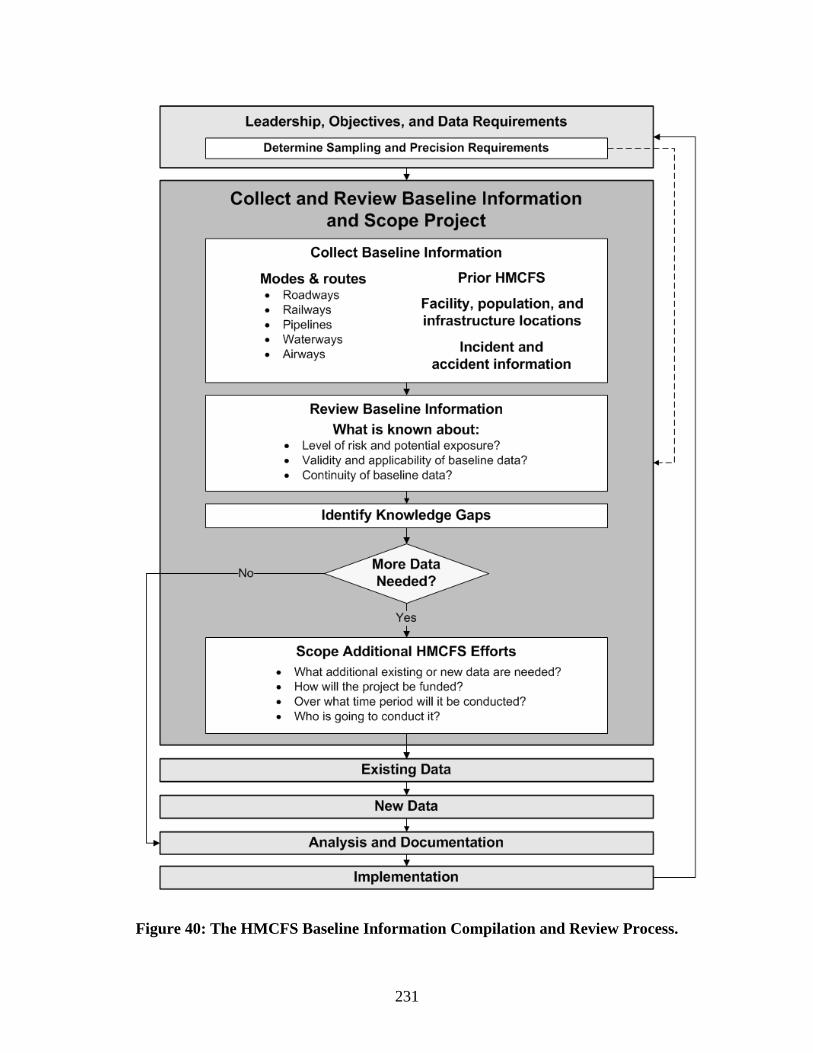
231
Figure 40: The HMCFS Baseline Information Compilation and Review Process.
232
10.5 COLLECT AND REVIEW EXISTING DATA
The 1995 Guidance, Section 2.2 discusses several existing data sources, including the Highway Performance Monitoring System, BTS Commodity Flow Survey, Truck Inventory and Use Survey, Hazardous Material Incident Reporting System, TRANSCAER, and national industry associations, and facility reporting under SARA Title III. These information sources should be included in the updated Guidebook and augmented with additional existing data sources for all transport modes as discussed in Chapter 4 of this report. These include electronic sources as well as existing HMCFS from adjacent jurisdictions, and existing information maintained by HazMat shippers, carriers, or receivers. A checklist of existing data sources (Promising Practice 8) can help ensure that applicable information is included in the local HMCFS.
A review of the existing data includes whether the data are valid and applicable to the local transportation context, and whether they provide sufficient information to identify risk and exposure. After knowledge gaps are identified, a determination is made of what new data are needed, how those data will be obtained, and whether project resources are sufficient to obtain them. Figure 41 shows a conceptual diagram of HMCFS process focusing on existing data.

233
Figure 41: The HMCFS Existing Data Collection and Evaluation Process.
234
10.6 COLLECT AND VALIDATE NEW DATA
The 1995 Guidance, Section 2.3 discusses considerations for field collection of new (original) data, including considerations for survey locations, personnel needs, and study design and resources. Section 2.4 of the Guidance discusses data collection methods, including placard surveys, manifest surveys, driver interviews, and facility surveys. Data recording procedures are also discussed including advantages and disadvantages of remote entry, on-site entry, copying shipping papers, dictation, interviews, and combinations thereof. These issues should be included in updated Guidebook and augmented as appropriate. A validation of new data includes reviewing whether the data match sampling and precision requirements, whether data are appropriately documented, whether there are outliers, whether they are consistent for similar locations, and whether they are consistent across different data sources. Figure 42 shows a conceptual diagram of HMCFS process focusing on new data.
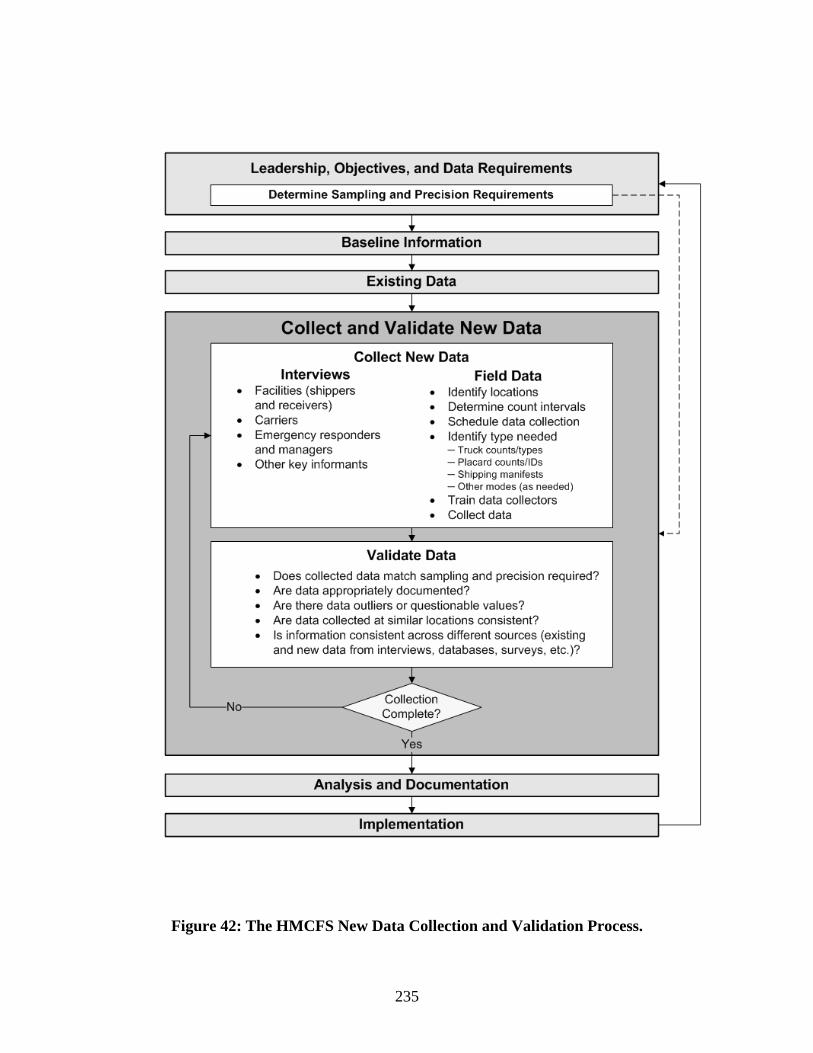
235
Figure 42: The HMCFS New Data Collection and Validation Process.
236
10.7 ANALYSIS AND DOCUMENTATION
The 1995 Guidance, Section 2.5, discusses analysis of HMCFS data. The discussion centers around an explanation of statistical considerations for traffic flow analysis, including confidence intervals and Poisson distributions. The discussion also recommends that surveys should be done at the state level to ensure consistency, and not at the local level. This approach to data analysis may be appropriate to application at regional or state levels but is inappropriate for most local jurisdictions who are conducting an HMCFS without the assistance of transportation professionals who specialize in traffic analysis, or others with appropriate statistical training. Many local jurisdictions simply lack the technical or time resources for statistical analyses as described in the 1995 Guidance. Rather, the updated Guidebook should recognize that rigorous statistical analysis is likely ill-advised or inappropriate for more basic objectives of an HMCFS such as scenario definition, and that a summary approach to the data may be more appropriate, with consideration that data collected without a high degree of precision and rigorous sampling also limit conclusions that can be drawn from them.
There are many different types of data that can be collected using traffic surveys, including vehicle counts, placard counts, manifest surveys, and interviews with shippers, carriers, receivers, and emergency responders or managers. In addition, new data may be combined with existing data, for example, simple truck counts may be combined with information from the 2002 Vehicle Inventory and Use database as discussed in Appendix E of this report. An overview of different data applications in the updated Guidebook can help potential users identify the level of information that can be reasonably obtained, without resorting to unwarranted statistical evaluations. Some HMCFS objectives may necessitate statistical evaluation of HazMat traffic flow data. In these cases, jurisdictions with these capabilities can evaluate data accordingly, or a transportation professional can be consulted.
Analyzed data should be ground-truthed with information from key informants and incident/accident information. The updated Guidebook can also identify how potential consequences can be evaluated. The spatial and temporal meaning of the data in terms of should be considered, including potential hot spots analysis (Promising Practice 9). Figure 43 shows a conceptual diagram of HMCFS process focusing on analysis.
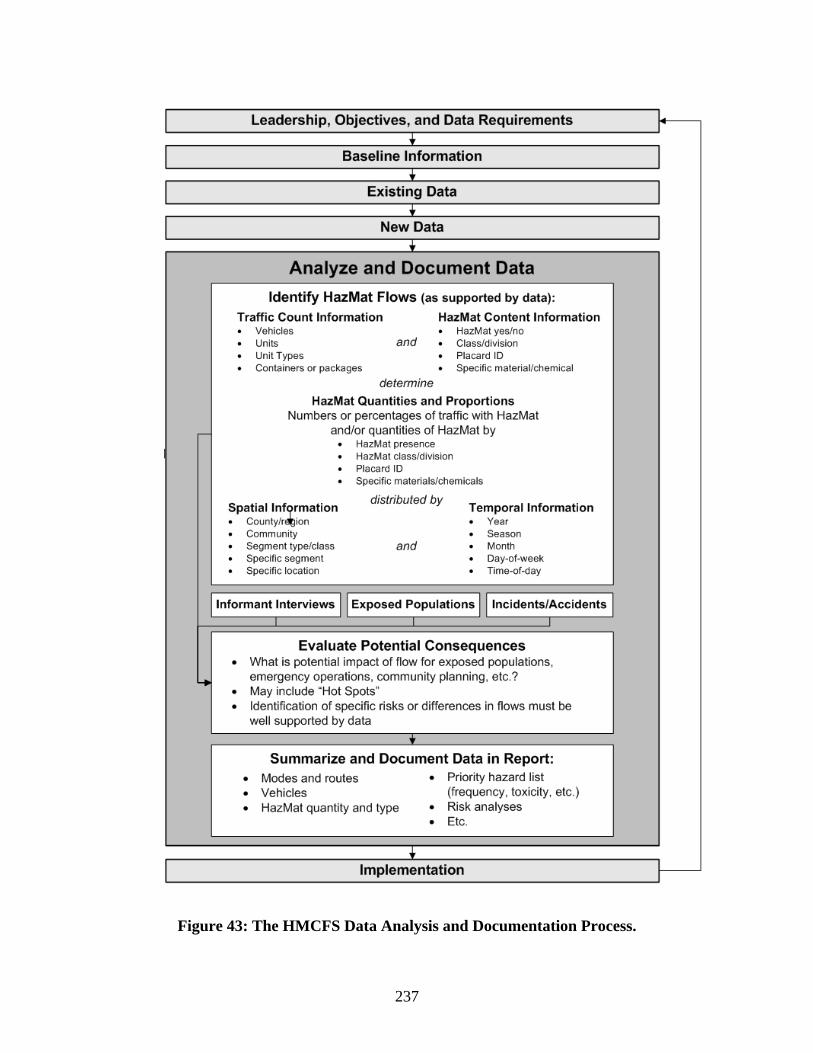
237
Figure 43: The HMCFS Data Analysis and Documentation Process.
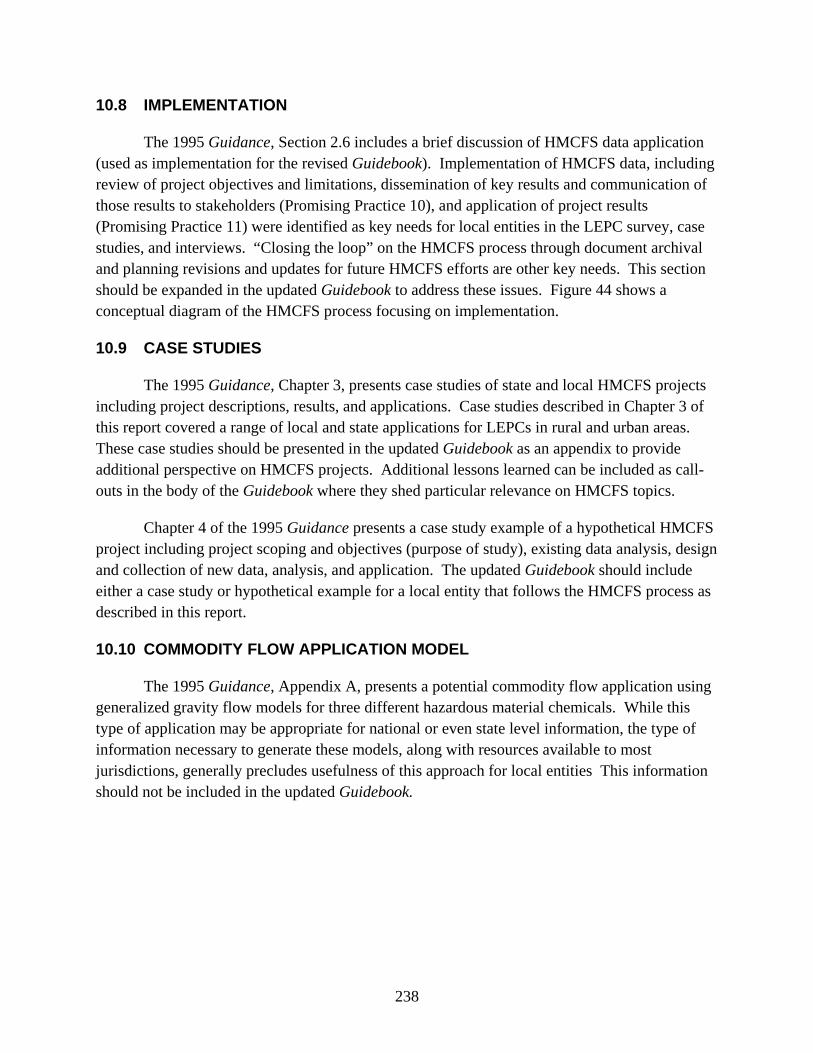
238
10.8 IMPLEMENTATION
The 1995 Guidance, Section 2.6 includes a brief discussion of HMCFS data application (used as implementation for the revised Guidebook). Implementation of HMCFS data, including review of project objectives and limitations, dissemination of key results and communication of those results to stakeholders (Promising Practice 10), and application of project results (Promising Practice 11) were identified as key needs for local entities in the LEPC survey, case studies, and interviews. “Closing the loop” on the HMCFS process through document archival and planning revisions and updates for future HMCFS efforts are other key needs. This section should be expanded in the updated Guidebook to address these issues. Figure 44 shows a conceptual diagram of the HMCFS process focusing on implementation.
10.9 CASE STUDIES
The 1995 Guidance, Chapter 3, presents case studies of state and local HMCFS projects including project descriptions, results, and applications. Case studies described in Chapter 3 of this report covered a range of local and state applications for LEPCs in rural and urban areas. These case studies should be presented in the updated Guidebook as an appendix to provide additional perspective on HMCFS projects. Additional lessons learned can be included as call-outs in the body of the Guidebook where they shed particular relevance on HMCFS topics.
Chapter 4 of the 1995 Guidance presents a case study example of a hypothetical HMCFS project including project scoping and objectives (purpose of study), existing data analysis, design and collection of new data, analysis, and application. The updated Guidebook should include either a case study or hypothetical example for a local entity that follows the HMCFS process as described in this report.
10.10 COMMODITY FLOW APPLICATION MODEL
The 1995 Guidance, Appendix A, presents a potential commodity flow application using generalized gravity flow models for three different hazardous material chemicals. While this type of application may be appropriate for national or even state level information, the type of information necessary to generate these models, along with resources available to most jurisdictions, generally precludes usefulness of this approach for local entities This information should not be included in the updated Guidebook.
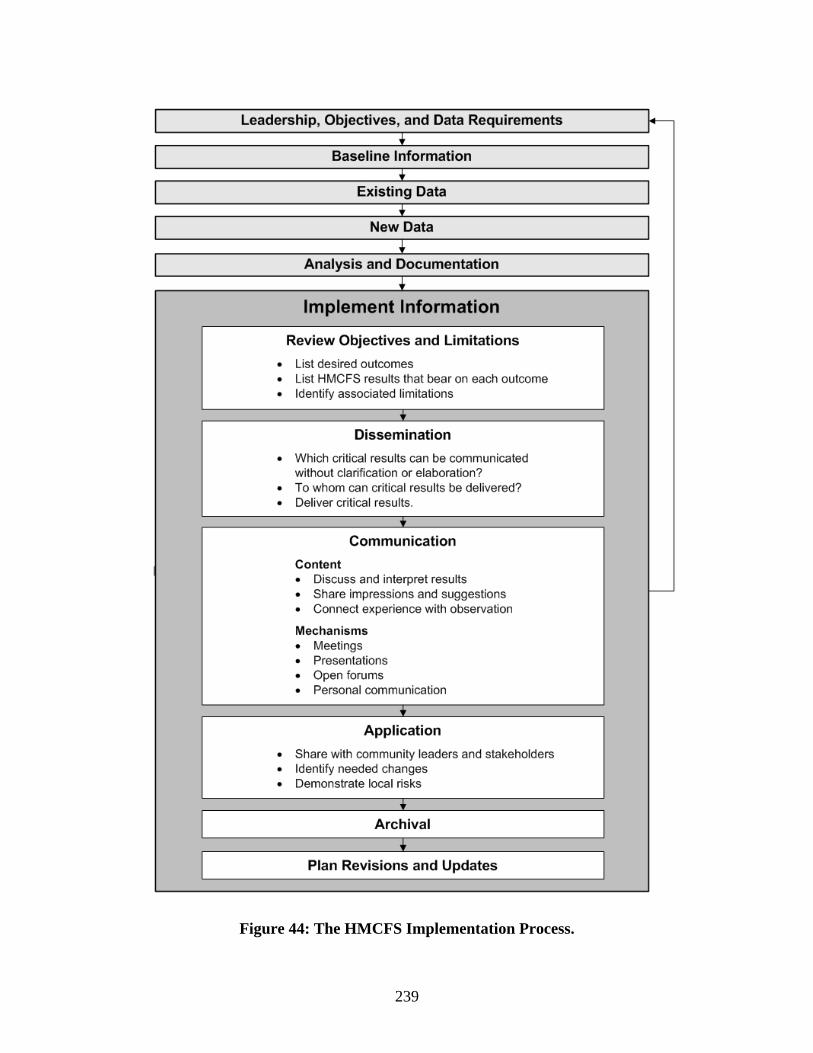
239
Figure 44: The HMCFS Implementation Process.
240
CHAPTER 11: HAZARDOUS MATERIALS COMMODITY FLOW RESEARCH NEEDS
A number of research needs related to hazardous materials commodity flows in local communities were raised by the present research. These research needs center around fundamental issues like:
• the temporal variability of hazardous material transport; • methods and activities that encourage participation in local processes; • variability of vulnerability associated with modes of transport; • the validation of existing accident data; • tracking LEPC members, executive committees, and leaderships; • multilevel communication, data collection, and achieving; and • integrating the HMCFS into community comprehensive emergency plans.
11.1 TEMPORAL VARIABILITY OF HAZARDOUS MATERIAL TRANSPORT
The extent to which hazardous material flows vary by season, month, week, day-of-the week, and hour-of-the-day is not well documented. The funding mechanisms most often used by LEPCs to conduct HMCFS limit most empirical efforts to collection of primary data in Spring and Summer months; and most of that is limited to weekday and daylight hour observations. Hence, these data often fail to reflect the seasonal variations of use of hazardous materials in a community (e.g., agricultural communities). In addition, seasonal variations in road conditions (e.g., snow-covered roads, pot-holes), accident rates, and population distribution (e.g., tourism locations such as winter and summer resort areas) are equally under-represented. Future research that explores these current gaps in the data on the transport of hazardous materials would be well received.
11.2 PARTICIPATION IN LOCAL PROCESSES
LEPCs often suffer from passive participation, turnover, and apathy. HMCFS are often conducted by LEPCs or their contractors. In either event participation, turnover, and apathy often provide considerable barriers to conducting, communicating, and implementing the outcomes associated with the HMCFS. How do organizations maintain proactive participation from stakeholders and decision makers for high-consequence–low-probability events such as hazardous materials accidents? Methods to maintain and encourage participation in local processes on an ongoing basis should be evaluated to see which provide consistent results under identified circumstances. Future research that created an inventory of methods, techniques, and activities used to attract and maintain voluntary participation in public service organizations would prove invaluable. Conversely, actions and behaviors that inadvertently create barriers to participation, encourage turnover, or increase apathy could be identified and detailed in terms of
241
how they can be avoided. Each method could be classified with respect to the types of conditions under which they work best, anticipated results, and examples of use.
11.3 VULNERABILITIES ASSOCIATED WITH DIFFERENT MODES OF HAZMAT TRANSPORT
The extent to which risk and vulnerability vary by mode of transport is an important area for further research to improve safety and security of hazardous materials transport. For example, pipeline and waterway accidents seem to occur less frequently than rail and roadway accidents. What can be learned by studying pipeline and waterway events that can reduce risk of hazardous materials events associated with other modes of transport? Can risk be reduced though reallocation among modes of transport? How should modes of transport be considered in light of the potential for terrorist attacks?
11.4 VALIDATION OF EXISTING ACCIDENT DATA
The validation of existing data is a complex and important activity. Data derived from various institutional sources, which have functions tangentially related to the potential for hazardous materials accidents, often have years of accumulated errors. For example, one institution sorted the data to make the variables of interest more easily searched, but left other parts of the data unsorted that over time destroyed the link between the sorted and unsorted portions of the data. In other cases geo-spatial data are erroneous reported truck accidents in the middle of a local bay, where there are no bridges or tunnels. Such errors can be the result of dyslexic data entry, sloppy typing, or illegible hand-writing, but whatever the source, validating the data is an important first step in using existing data. Research that developed, and tested a series of techniques to search for, detect, and correct such errors would be an invaluable asset to the future secondary use of existing data.
11.5 TRACKING LEPC MEMBERS, EXECUTIVE COMMITTEES AND LEADERSHIPS
The U.S. EPA is faced with the difficulty of keeping track of LEPC members and leaders. Maintaining membership information, contact information, responsibilities for various roles and activities is an important part of effective hazardous materials planning and implementation. Maintaining this information on a LEPC-by-LEPC basis in conjunction with boundary maps would improve planning and response. Emergency planning and response are inherently limited by knowledge of the membership and leadership—their contact information, knowledge, resources, skills, abilities and limitations. Future research that developed an internet-based self-updating national registry of LEPC members would allow more accurate records of LEPC leadership and members to be kept up to date. These records would allow LEPC members in various roles to network with members in similar roles in other locations. It could be used to address training needs associated with various roles on the LEPC, and generally better describe
242
the roles and responsibilities of LEPC members. This self-updating directory could also be used for dissemination of key materials.
11.6 MULTILEVEL COMMUNICATION, DATA COLLECTION AND ARCHIVING
Effective communication among various levels of government is often reported as a barrier. Local participants are often frustrated with lack of information provided from higher levels, short deadlines for completion, and limited funding for implementation. Federal and state organizations often find local outcomes ineffectual, undocumented, and poorly archived. Resulting outcomes often disappear with changing personnel, either literally or through lack of transitional institutional behavior. What methods can be employed to overcome these issues? What are their primary advantages and disadvantages? Which mechanisms have been most effective under what circumstances?
11.7 INTEGRATING THE HMCFS INTO COMMUNITY COMPREHENSIVE EMERGENCY PLANS
Integrating the HMCFS into comprehensive emergency planning is often left to the vagaries of future activities, which means the outcomes are often left either un-addressed or weakly integrated into the comprehensive plan. The data developed in the HMCFS are useful planning, preparedness and response information. For example, know the volume of traffic flow along a route or route segment is critical in establishing alternative routes to allow emergency response operations should they be needed. Hence engaging response personnel in conducing the HMCFS, and integrating that information into the comprehensive emergency plan can provide integration that cannot be duplicated through training alone—it goes beyond learning and knowing to understanding and acting on that knowledge. Integrating the HMCFS maps (e.g., of hotspots) with the comprehensive emergency planning maps may highlight areas where resources are needed. Research that examined this process of integration could inventory techniques, evaluate their utility, establish their limitations, and assess synergistic opportunities.

A-1
APPENDIX A
HAZARDOUS MATERIALS PLACARDS
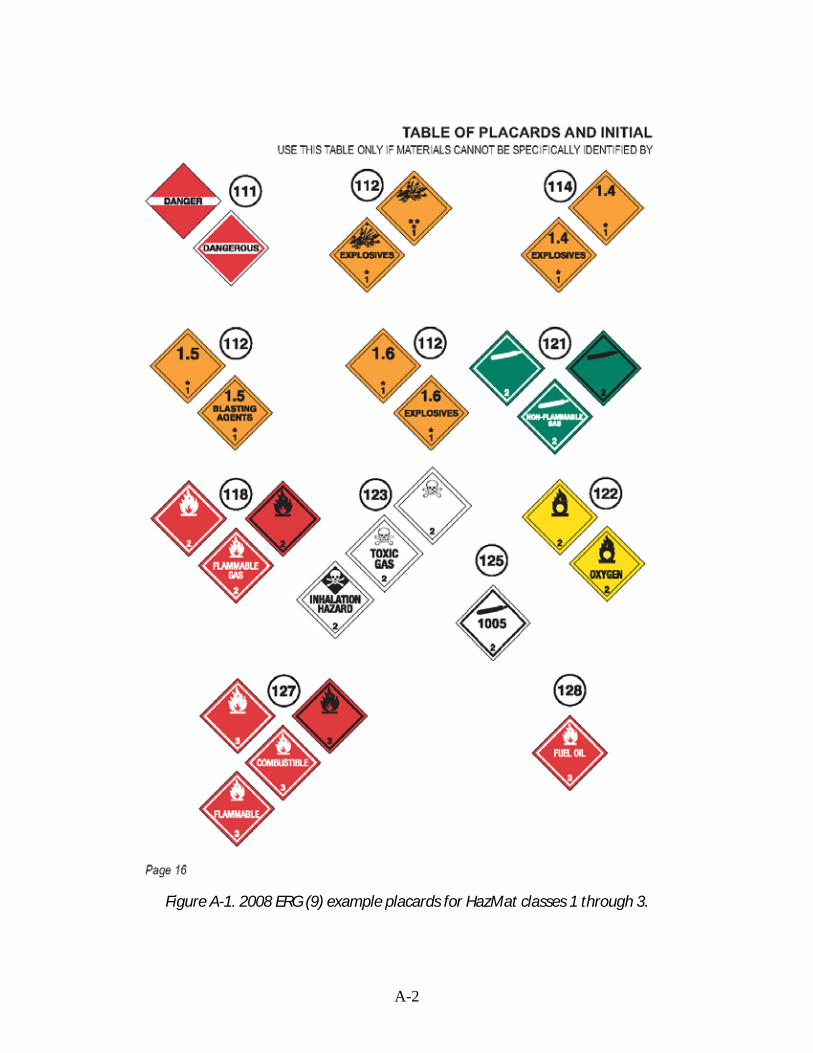
A-2
Figure A-1. 2008 ERG (9) example placards for HazMat classes 1 through 3.
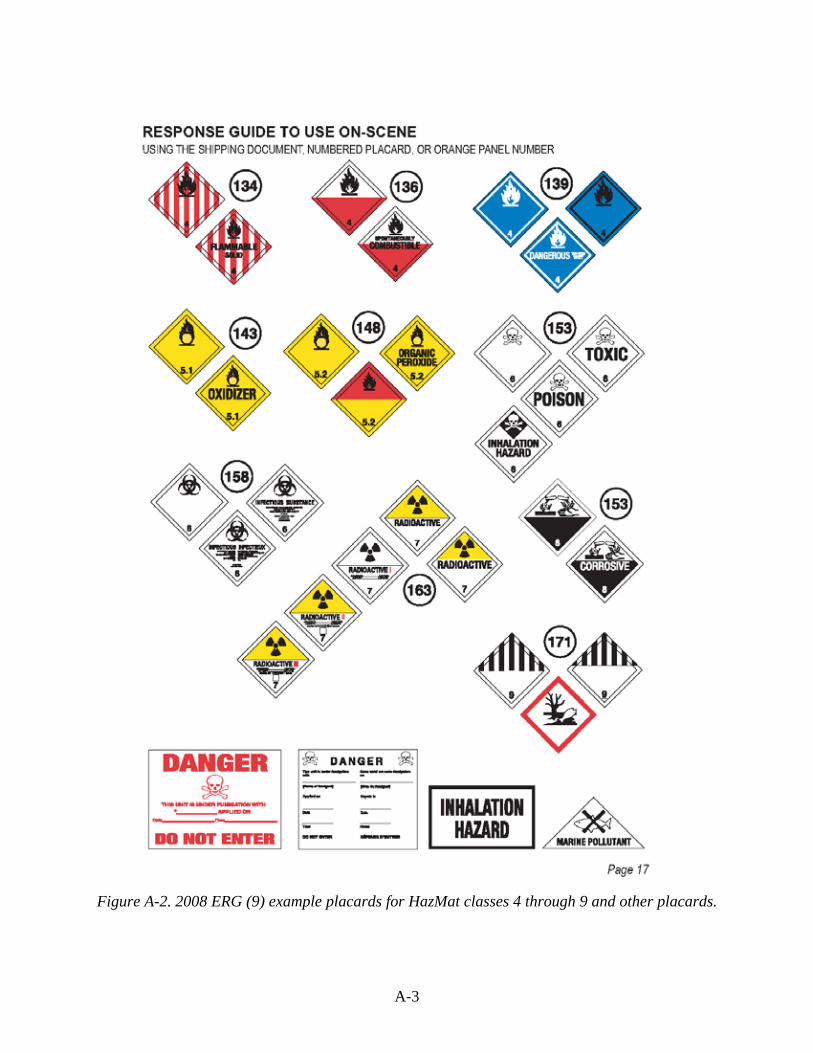
A-3
Figure A-2. 2008 ERG (9) example placards for HazMat classes 4 through 9 and other placards.

B-1
APPENDIX B
SHIPPING DOCUMENTS AND PLACARD NUMBERS
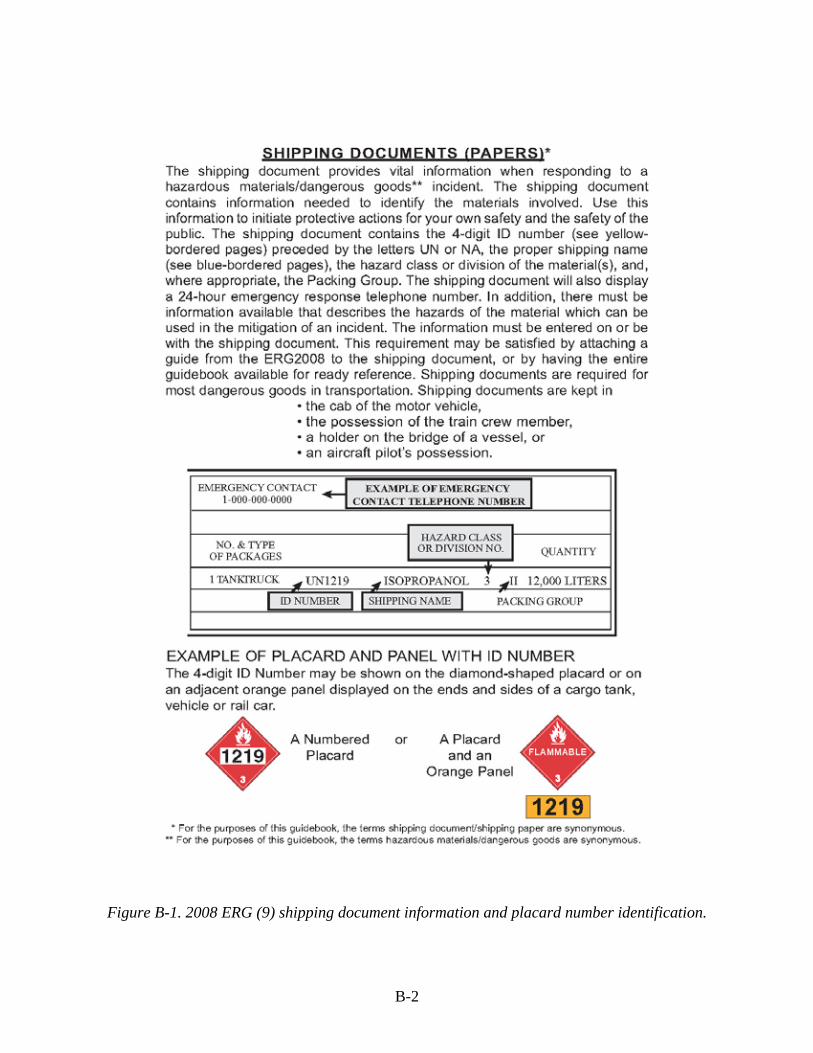
B-2
Figure B-1. 2008 ERG (9) shipping document information and placard number identification.

C-1
APPENDIX C
LEPC SURVEY ON HMCFS PRACTICES

C-2
Note: The formatting of the following survey questions has been modified from that presented in online version administered through software by Qualtrics, Inc. The content of survey questions is retained, and represented as follows:
• Questions with text response fields are represented by a small box next to or below response options for limited text responses, and a larger box below response options for short-answer responses.
• Questions presented with drop-down list of potential responses for which only one response could be selected are represented by a list of responses options below the question, and have the text “Select from drop-down list” or similar in the question text.
• Questions presented with a list of potential responses for which only one response could be selected are represented by a response list or row with associated radial dials next to the response options.
• Questions presented with a list of potential responses for which multiple responses could be selected are represented by a response list with associated check box next to response options.
• Questions presented with potential responses in a table of radial dials allowed the respondent to select one option among multiple columns for each row.
• Questions presented with a table for which respondents could provide text for multiple columns for each row are presented represented by a tabular format with boxes for limited text responses.
C-3
Hazardous Materials Commodity Flow Surveys: Understanding, Practices, Barriers, and Incentives
Project HM-01:
Hazardous Materials Commodity Flow Data and Analysis
Conducted for:
Transportation Research Board Hazardous Materials Cooperative Research Program
Conducted by:
Texas A&M University
Hazard Reduction & Recovery Center
and
Texas Transportation Institute Multimodal Freight Transportation Programs
C-4
Texas Transportation Institute and Texas A&M University are working on a project for the Transportation Research Board (TRB) to update the Guidance for Conducting Hazardous Materials Flow Surveys, published by US DOT in 1995.
Your participation in a survey about hazmat commodity flow surveys—even if you have never conducted one or your Local Emergency Response Committee (LEPC) is not currently active—will be very helpful for this effort. The survey will take between 10 and 30 minutes, depending on your experiences in this area. Thank you in advance for this substantial time commitment.
Your responses will help us produce a better guidebook that can be used by local, state, and tribal emergency planners and responders.
Your participation in the survey is voluntary. Should you have any questions about the survey, please contact Dr. George Rogers at (979) 845-7284 or Mr. David Bierling at (979) 862-2710. Should you have any questions about your rights as a research volunteer, please contact Melissa McIlheny, Texas A&M Institutional Review Board, at (979) 458-4067.
Thank you very much for your assistance!

C-5
We respect the privacy of your survey response and contact information. We will use these data as whole and not publish any identifiable information without specifically asking you. Because we have not required a login/password, your survey response will not register specific agencies/persons/locations, unless you provide it through the entry form below. If you can provide the following contact information, it is very helpful for a number of reasons: 1) It helps us identify what kind of jurisdictions are responding, from where,
and who to contact should the need arise. 2) It also keeps us informed regarding your response so that we can avoid
bothering you with follow-up requests for participation. If you’d rather not provide this information, we understand, and please advance to
the next question...thank you!
C-6
LEPC/TERC jurisdiction/agency name
(if you are responding for multiple
LEPCs, please list all of them)
State (if not applicable, enter 'NA')
Your name (first and last)
Your e-mail address
Your phone number
Your function in LEPC/TERC
Your professional occupation
Your professional title

C-7
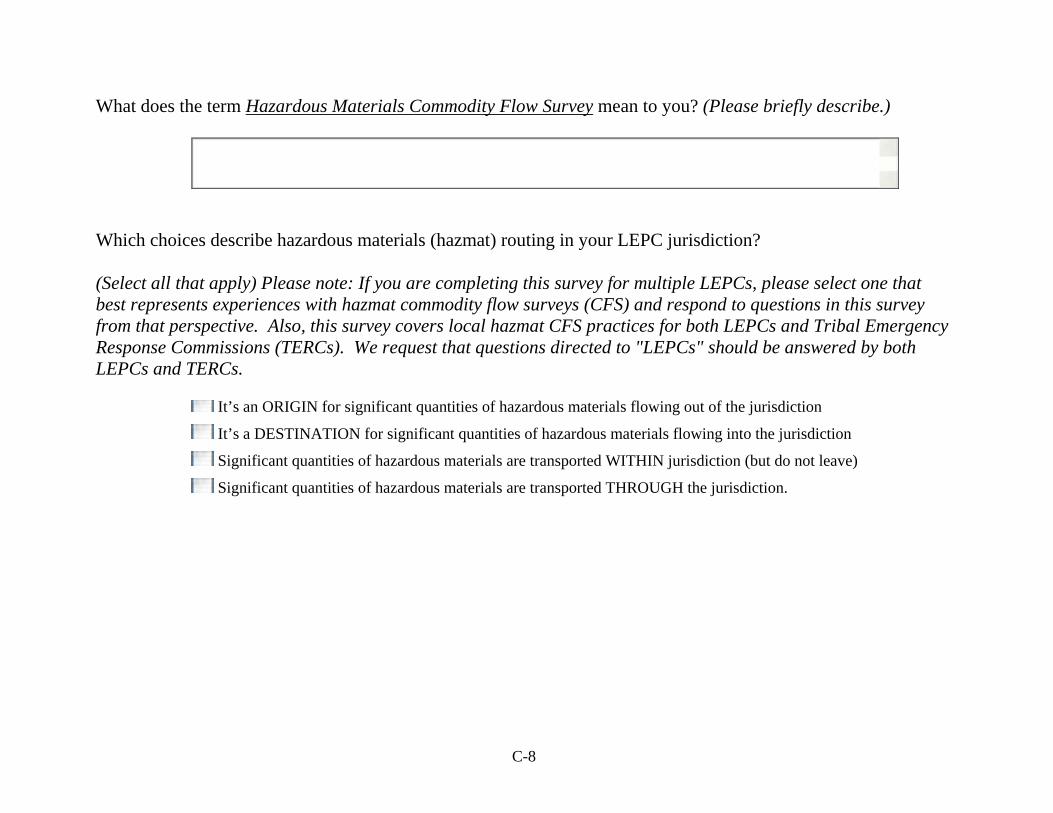
C-8
What does the term Hazardous Materials Commodity Flow Survey mean to you? (Please briefly describe.)
Which choices describe hazardous materials (hazmat) routing in your LEPC jurisdiction? (Select all that apply) Please note: If you are completing this survey for multiple LEPCs, please select one that best represents experiences with hazmat commodity flow surveys (CFS) and respond to questions in this survey from that perspective. Also, this survey covers local hazmat CFS practices for both LEPCs and Tribal Emergency Response Commissions (TERCs). We request that questions directed to "LEPCs" should be answered by both LEPCs and TERCs.
It’s an ORIGIN for significant quantities of hazardous materials flowing out of the jurisdiction
It’s a DESTINATION for significant quantities of hazardous materials flowing into the jurisdiction
Significant quantities of hazardous materials are transported WITHIN jurisdiction (but do not leave)
Significant quantities of hazardous materials are transported THROUGH the jurisdiction.
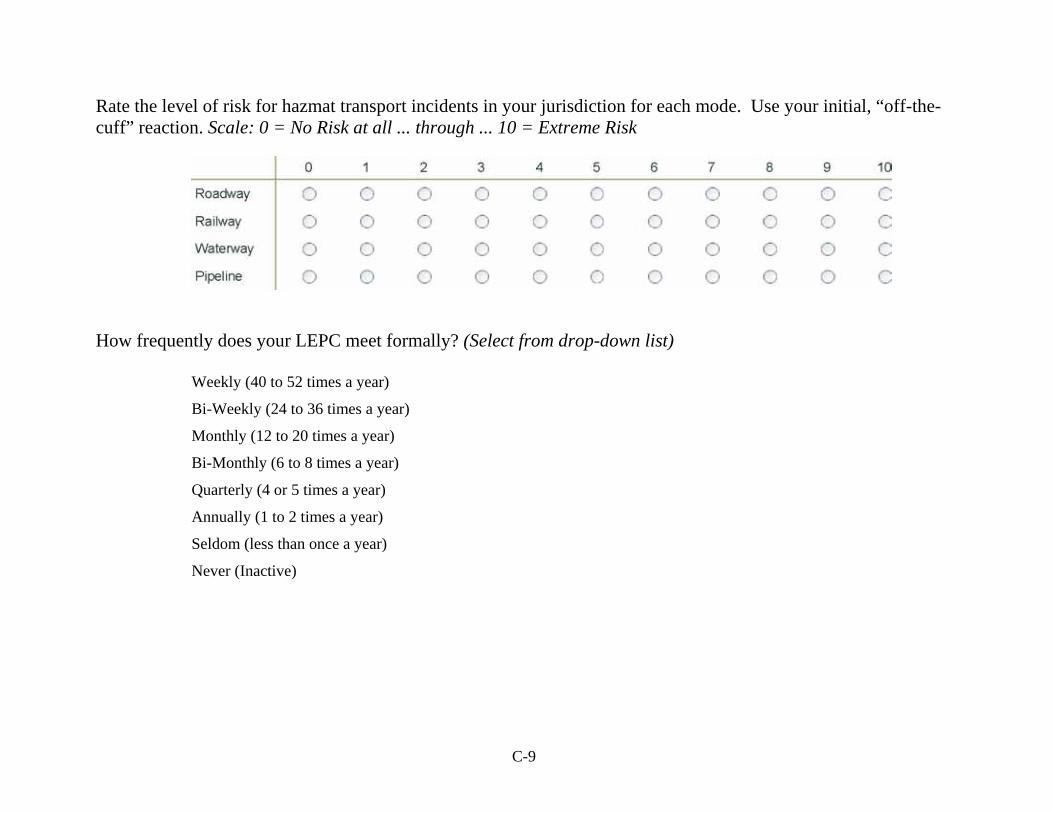
C-9
Rate the level of risk for hazmat transport incidents in your jurisdiction for each mode. Use your initial, “off-the-cuff” reaction. Scale: 0 = No Risk at all ... through ... 10 = Extreme Risk
How frequently does your LEPC meet formally? (Select from drop-down list)
Weekly (40 to 52 times a year)
Bi-Weekly (24 to 36 times a year)
Monthly (12 to 20 times a year)
Bi-Monthly (6 to 8 times a year)
Quarterly (4 or 5 times a year)
Annually (1 to 2 times a year)
Seldom (less than once a year)
Never (Inactive)
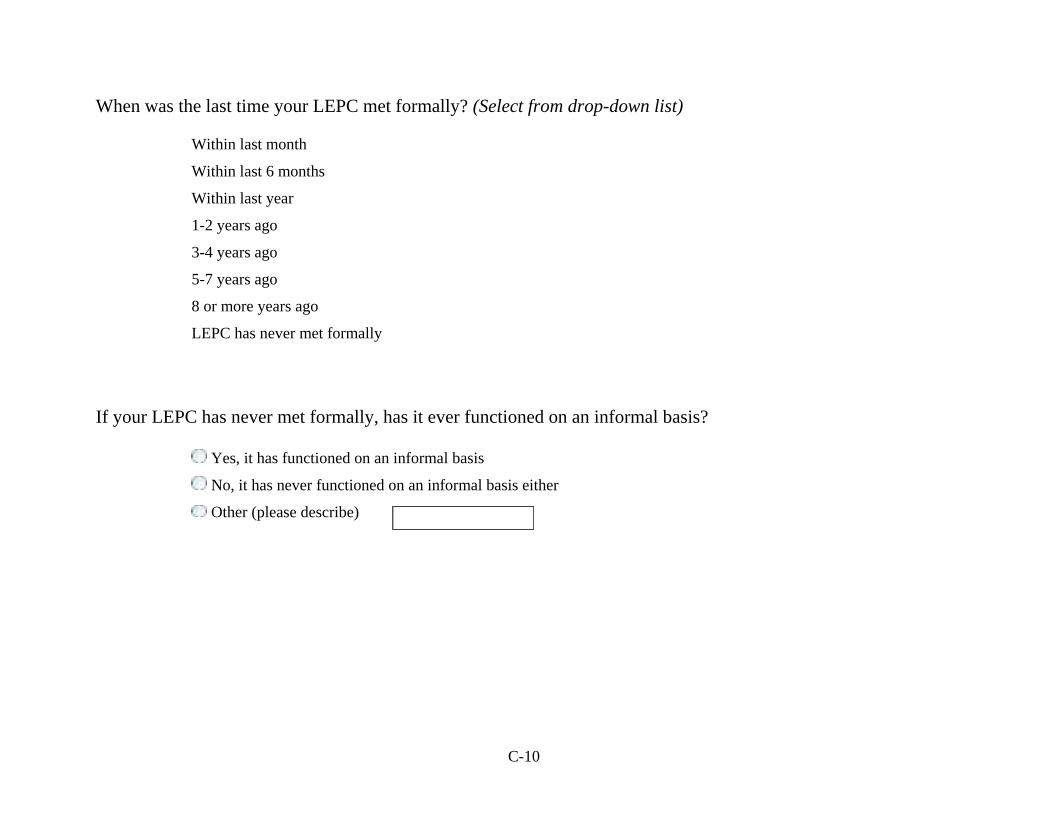
C-10
When was the last time your LEPC met formally? (Select from drop-down list)
Within last month
Within last 6 months
Within last year
1-2 years ago
3-4 years ago
5-7 years ago
8 or more years ago
LEPC has never met formally
If your LEPC has never met formally, has it ever functioned on an informal basis?
Yes, it has functioned on an informal basis
No, it has never functioned on an informal basis either
Other (please describe)
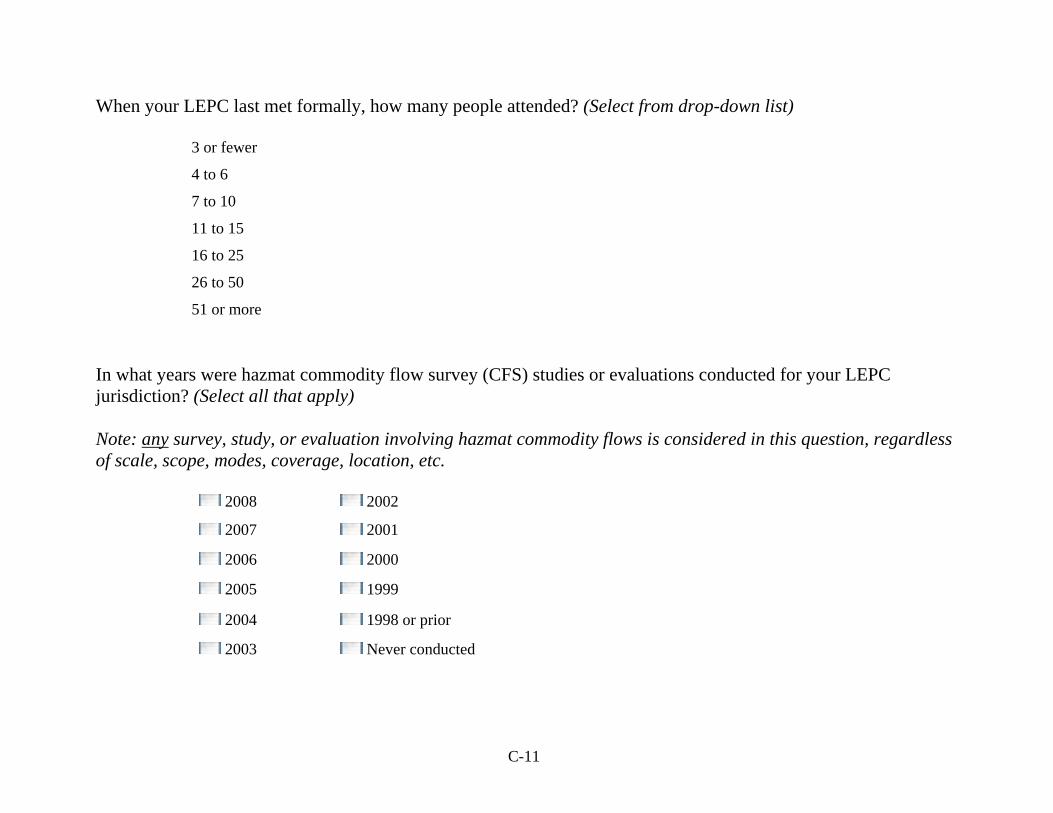
C-11
When your LEPC last met formally, how many people attended? (Select from drop-down list)
3 or fewer
4 to 6
7 to 10
11 to 15
16 to 25
26 to 50
51 or more
In what years were hazmat commodity flow survey (CFS) studies or evaluations conducted for your LEPC jurisdiction? (Select all that apply) Note: any survey, study, or evaluation involving hazmat commodity flows is considered in this question, regardless of scale, scope, modes, coverage, location, etc.
2008 2002
2007 2001
2006 2000
2005 1999
2004 1998 or prior
2003 Never conducted
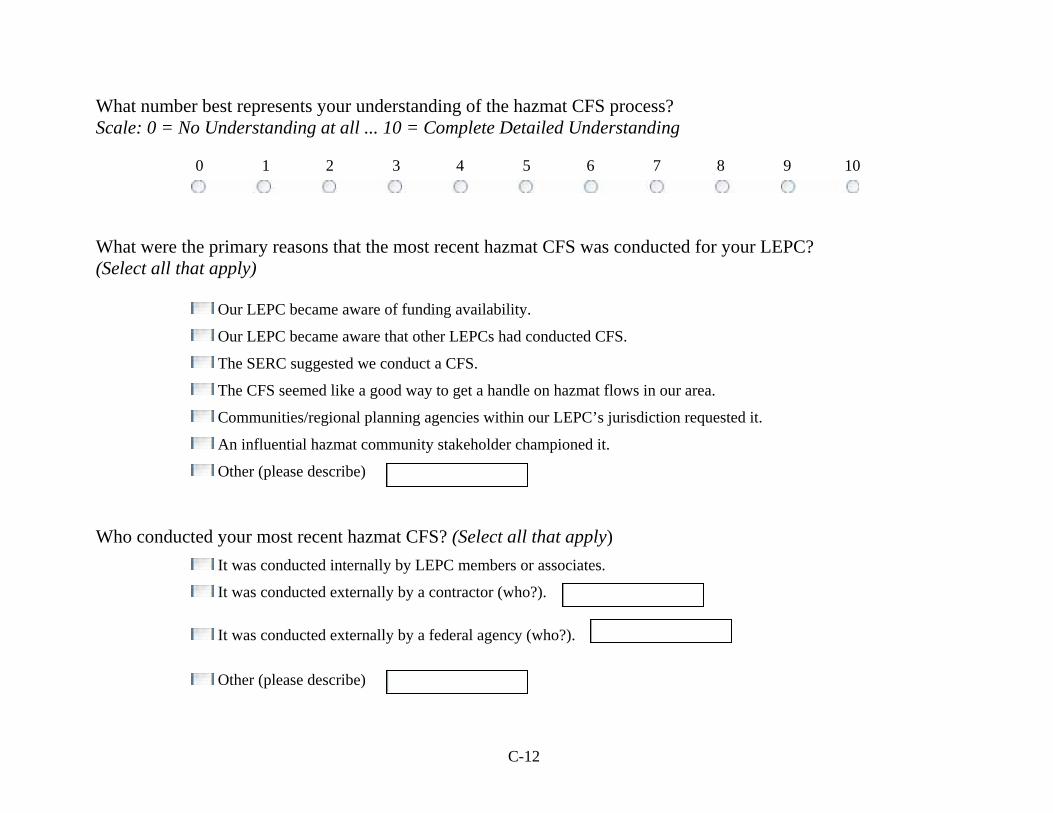
C-12
What number best represents your understanding of the hazmat CFS process? Scale: 0 = No Understanding at all ... 10 = Complete Detailed Understanding
0 1 2 3 4 5 6 7 8 9 10
What were the primary reasons that the most recent hazmat CFS was conducted for your LEPC? (Select all that apply)
Our LEPC became aware of funding availability.
Our LEPC became aware that other LEPCs had conducted CFS.
The SERC suggested we conduct a CFS.
The CFS seemed like a good way to get a handle on hazmat flows in our area.
Communities/regional planning agencies within our LEPC’s jurisdiction requested it.
An influential hazmat community stakeholder championed it.
Other (please describe)
Who conducted your most recent hazmat CFS? (Select all that apply)
It was conducted internally by LEPC members or associates.
It was conducted externally by a contractor (who?).
It was conducted externally by a federal agency (who?).
Other (please describe)
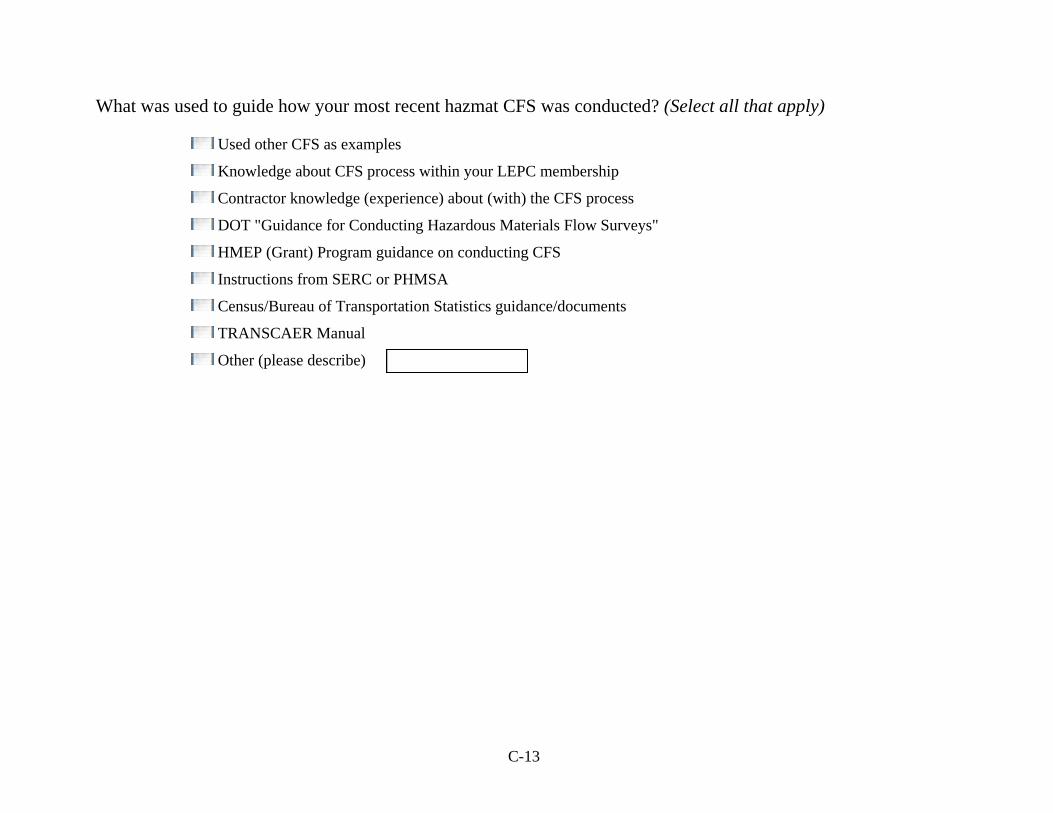
C-13
What was used to guide how your most recent hazmat CFS was conducted? (Select all that apply)
Used other CFS as examples
Knowledge about CFS process within your LEPC membership
Contractor knowledge (experience) about (with) the CFS process
DOT "Guidance for Conducting Hazardous Materials Flow Surveys"
HMEP (Grant) Program guidance on conducting CFS
Instructions from SERC or PHMSA
Census/Bureau of Transportation Statistics guidance/documents
TRANSCAER Manual
Other (please describe)
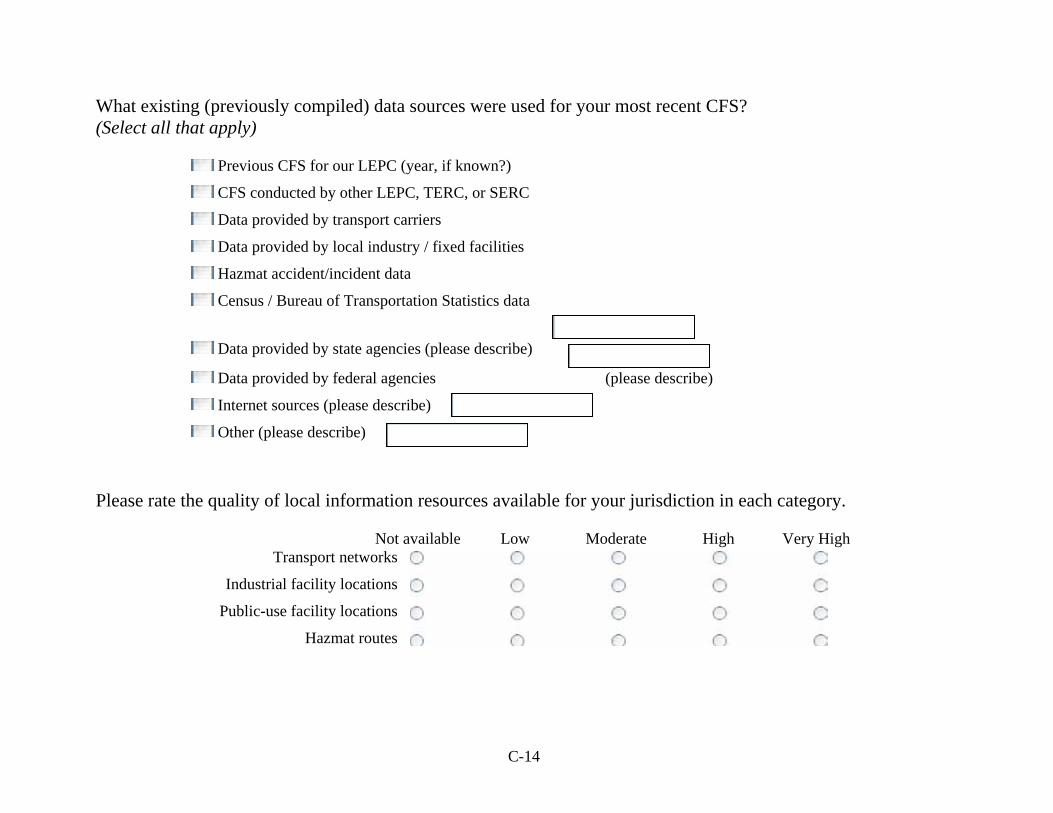
C-14
What existing (previously compiled) data sources were used for your most recent CFS? (Select all that apply)
Previous CFS for our LEPC (year, if known?)
CFS conducted by other LEPC, TERC, or SERC
Data provided by transport carriers
Data provided by local industry / fixed facilities
Hazmat accident/incident data
Census / Bureau of Transportation Statistics data
Data provided by state agencies (please describe)
Data provided by federal agencies (please describe)
Internet sources (please describe)
Other (please describe)
Please rate the quality of local information resources available for your jurisdiction in each category.
Not available Low Moderate High Very High Transport networks
Industrial facility locations
Public-use facility locations
Hazmat routes
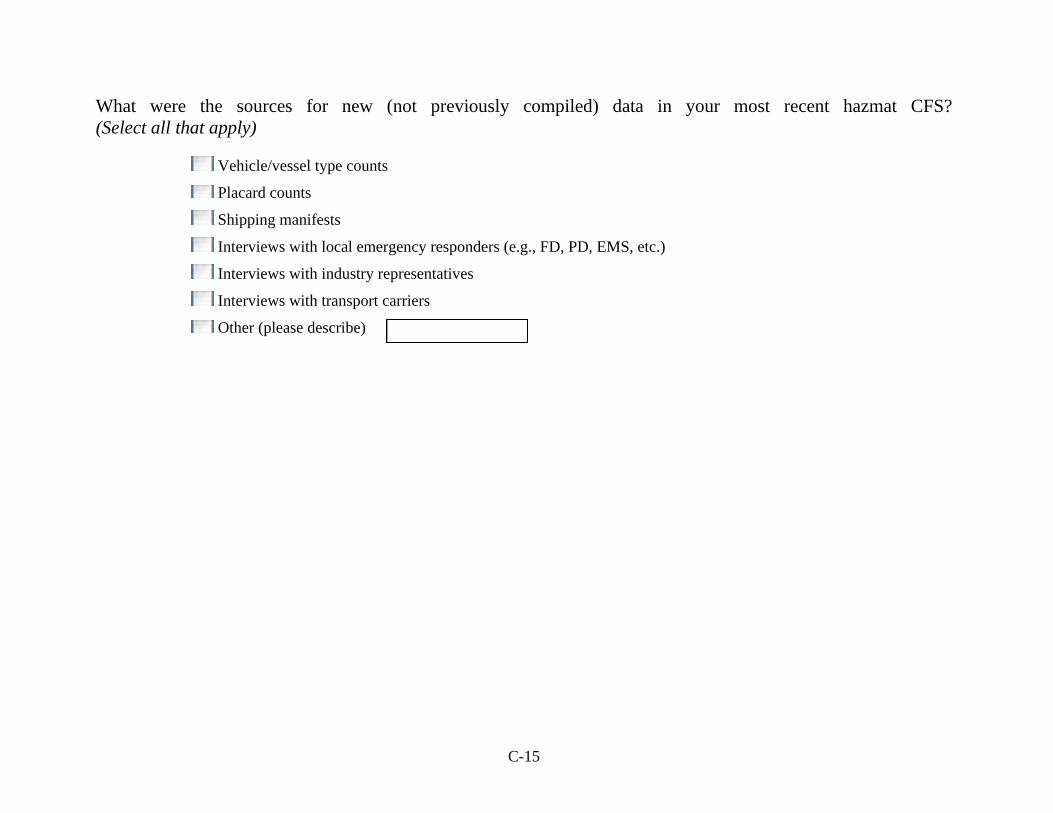
C-15
What were the sources for new (not previously compiled) data in your most recent hazmat CFS? (Select all that apply)
Vehicle/vessel type counts
Placard counts
Shipping manifests
Interviews with local emergency responders (e.g., FD, PD, EMS, etc.)
Interviews with industry representatives
Interviews with transport carriers
Other (please describe)
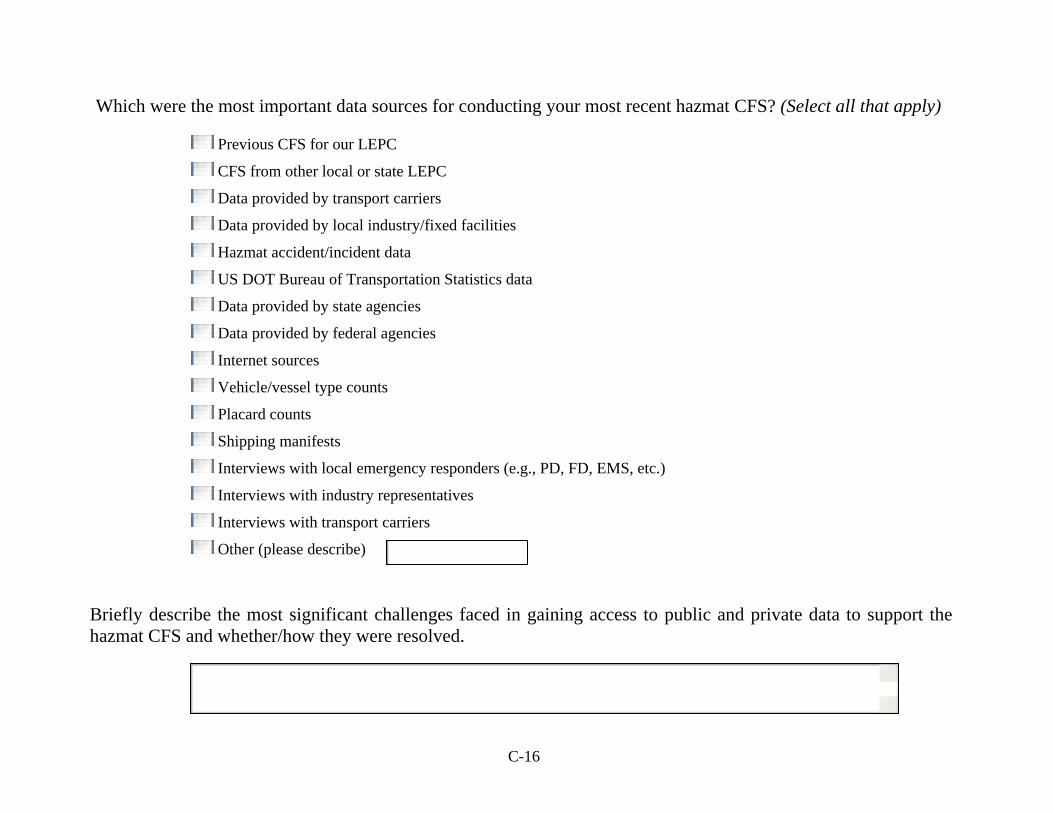
C-16
Which were the most important data sources for conducting your most recent hazmat CFS? (Select all that apply)
Previous CFS for our LEPC
CFS from other local or state LEPC
Data provided by transport carriers
Data provided by local industry/fixed facilities
Hazmat accident/incident data
US DOT Bureau of Transportation Statistics data
Data provided by state agencies
Data provided by federal agencies
Internet sources
Vehicle/vessel type counts
Placard counts
Shipping manifests
Interviews with local emergency responders (e.g., PD, FD, EMS, etc.)
Interviews with industry representatives
Interviews with transport carriers
Other (please describe)
Briefly describe the most significant challenges faced in gaining access to public and private data to support the hazmat CFS and whether/how they were resolved.
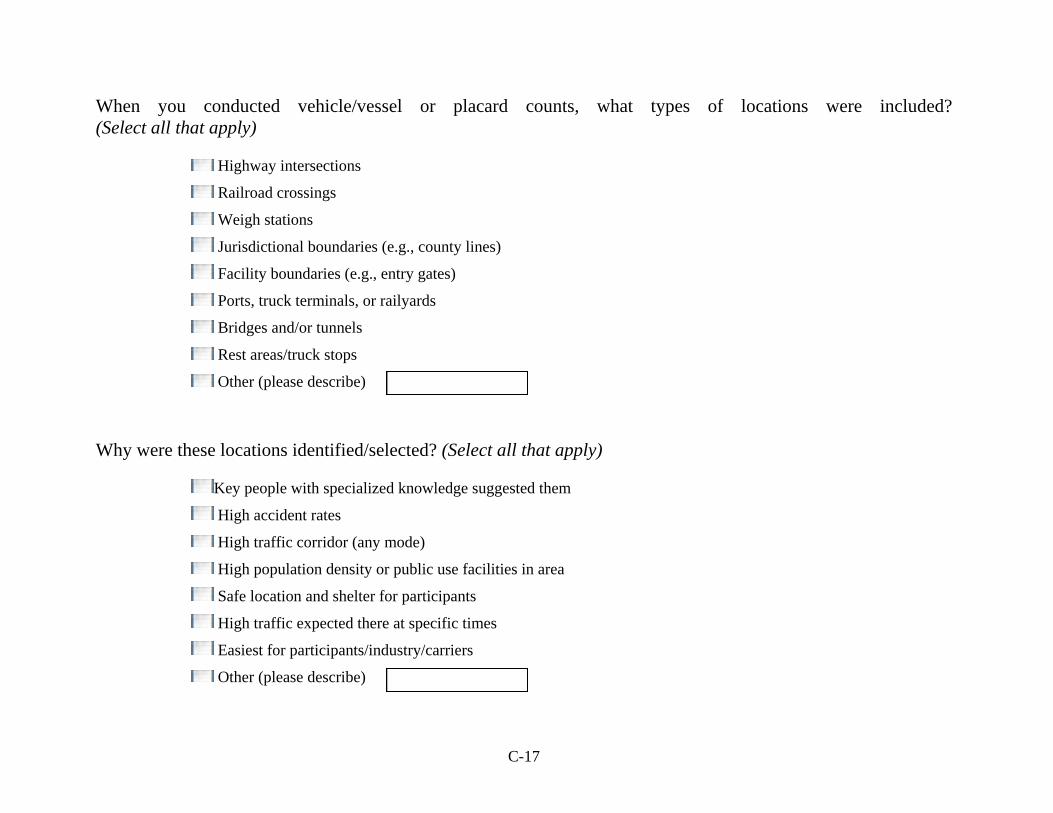
C-17
When you conducted vehicle/vessel or placard counts, what types of locations were included? (Select all that apply)
Highway intersections
Railroad crossings
Weigh stations
Jurisdictional boundaries (e.g., county lines)
Facility boundaries (e.g., entry gates)
Ports, truck terminals, or railyards
Bridges and/or tunnels
Rest areas/truck stops
Other (please describe)
Why were these locations identified/selected? (Select all that apply)
Key people with specialized knowledge suggested them
High accident rates
High traffic corridor (any mode)
High population density or public use facilities in area
Safe location and shelter for participants
High traffic expected there at specific times
Easiest for participants/industry/carriers
Other (please describe)
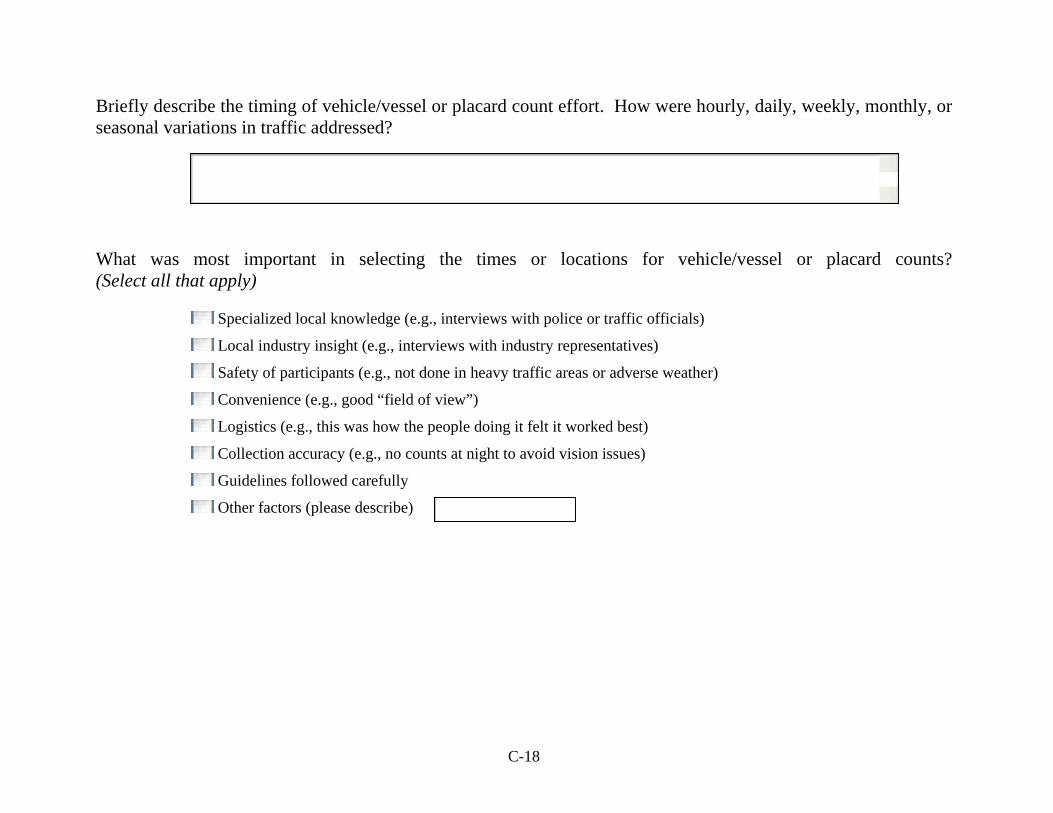
C-18
Briefly describe the timing of vehicle/vessel or placard count effort. How were hourly, daily, weekly, monthly, or seasonal variations in traffic addressed?
What was most important in selecting the times or locations for vehicle/vessel or placard counts? (Select all that apply)
Specialized local knowledge (e.g., interviews with police or traffic officials)
Local industry insight (e.g., interviews with industry representatives)
Safety of participants (e.g., not done in heavy traffic areas or adverse weather)
Convenience (e.g., good “field of view”)
Logistics (e.g., this was how the people doing it felt it worked best)
Collection accuracy (e.g., no counts at night to avoid vision issues)
Guidelines followed carefully
Other factors (please describe)
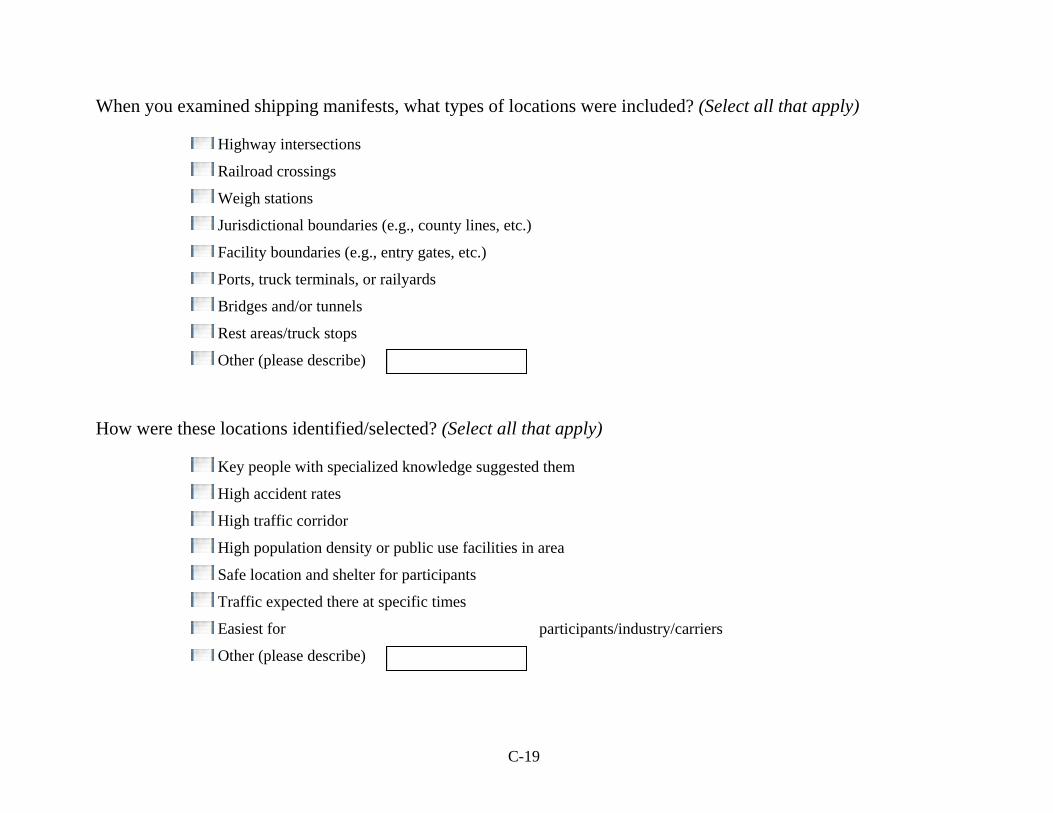
C-19
When you examined shipping manifests, what types of locations were included? (Select all that apply) Highway intersections
Railroad crossings
Weigh stations
Jurisdictional boundaries (e.g., county lines, etc.)
Facility boundaries (e.g., entry gates, etc.)
Ports, truck terminals, or railyards
Bridges and/or tunnels
Rest areas/truck stops
Other (please describe)
How were these locations identified/selected? (Select all that apply)
Key people with specialized knowledge suggested them
High accident rates
High traffic corridor
High population density or public use facilities in area
Safe location and shelter for participants
Traffic expected there at specific times
Easiest for participants/industry/carriers
Other (please describe)
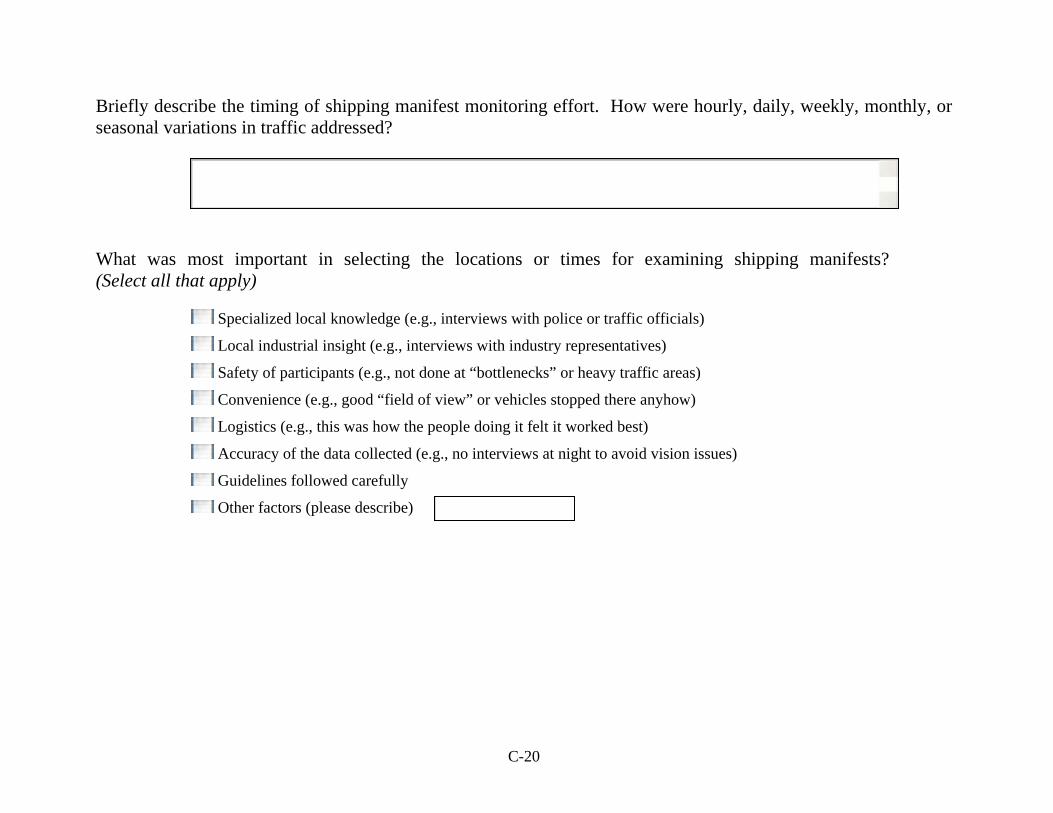
C-20
Briefly describe the timing of shipping manifest monitoring effort. How were hourly, daily, weekly, monthly, or seasonal variations in traffic addressed?
What was most important in selecting the locations or times for examining shipping manifests? (Select all that apply)
Specialized local knowledge (e.g., interviews with police or traffic officials)
Local industrial insight (e.g., interviews with industry representatives)
Safety of participants (e.g., not done at “bottlenecks” or heavy traffic areas)
Convenience (e.g., good “field of view” or vehicles stopped there anyhow)
Logistics (e.g., this was how the people doing it felt it worked best)
Accuracy of the data collected (e.g., no interviews at night to avoid vision issues)
Guidelines followed carefully
Other factors (please describe)
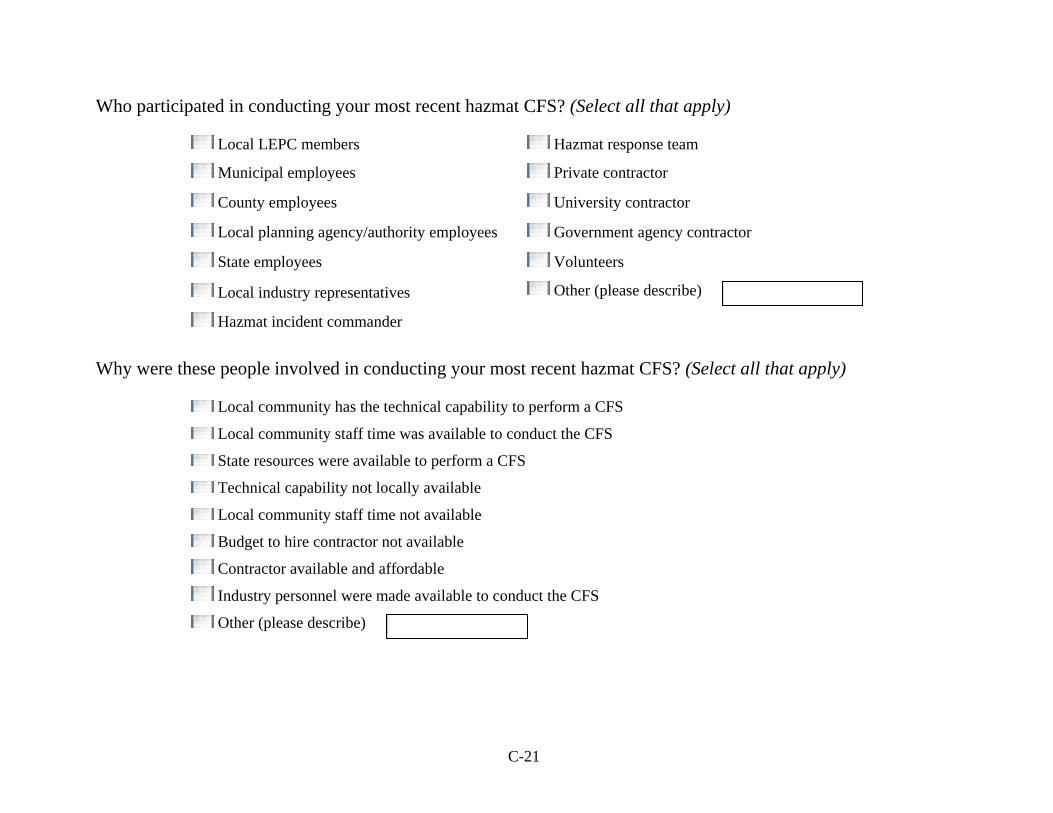
C-21
Who participated in conducting your most recent hazmat CFS? (Select all that apply)
Local LEPC members Hazmat response team
Municipal employees Private contractor
County employees University contractor
Local planning agency/authority employees Government agency contractor
State employees Volunteers
Local industry representatives Other (please describe)
Hazmat incident commander
Why were these people involved in conducting your most recent hazmat CFS? (Select all that apply)
Local community has the technical capability to perform a CFS
Local community staff time was available to conduct the CFS
State resources were available to perform a CFS
Technical capability not locally available
Local community staff time not available
Budget to hire contractor not available
Contractor available and affordable
Industry personnel were made available to conduct the CFS
Other (please describe)
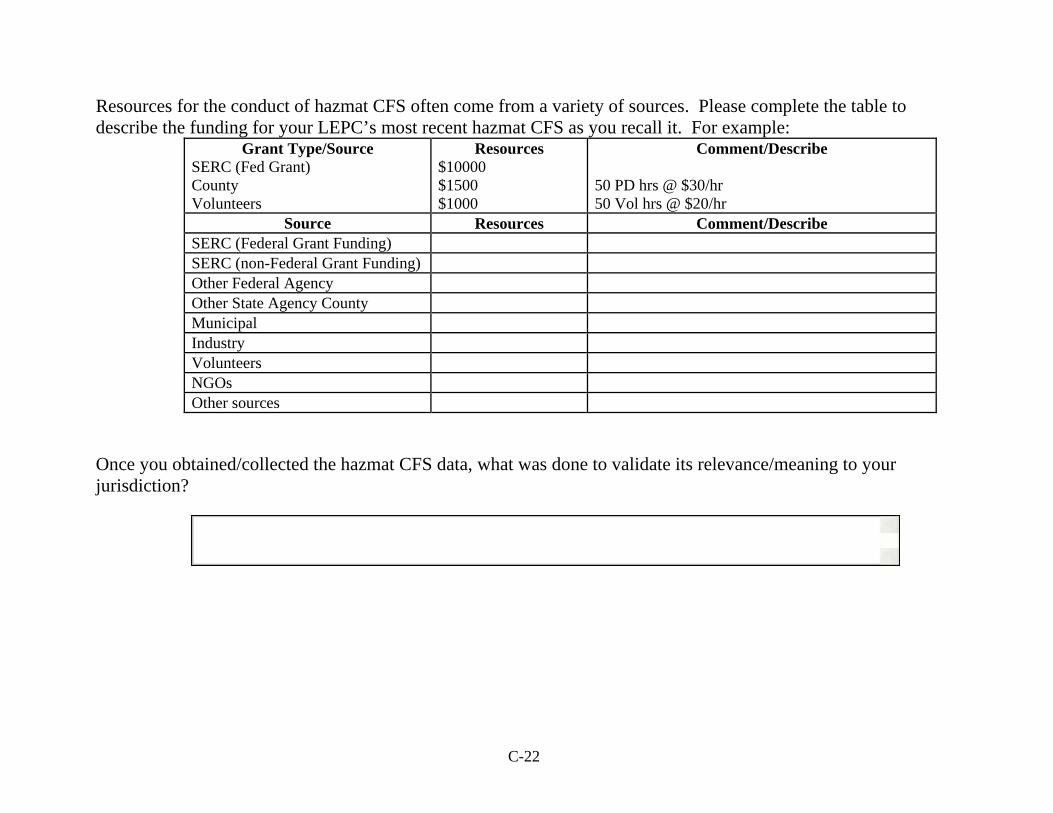
C-22
Resources for the conduct of hazmat CFS often come from a variety of sources. Please complete the table to describe the funding for your LEPC’s most recent hazmat CFS as you recall it. For example:
Grant Type/Source SERC (Fed Grant) County Volunteers
Resources $10000 $1500 $1000
Comment/Describe 50 PD hrs @ $30/hr 50 Vol hrs @ $20/hr
Source Resources Comment/Describe SERC (Federal Grant Funding) SERC (non-Federal Grant Funding) Other Federal Agency Other State Agency County Municipal Industry Volunteers NGOs Other sources
Once you obtained/collected the hazmat CFS data, what was done to validate its relevance/meaning to your jurisdiction?
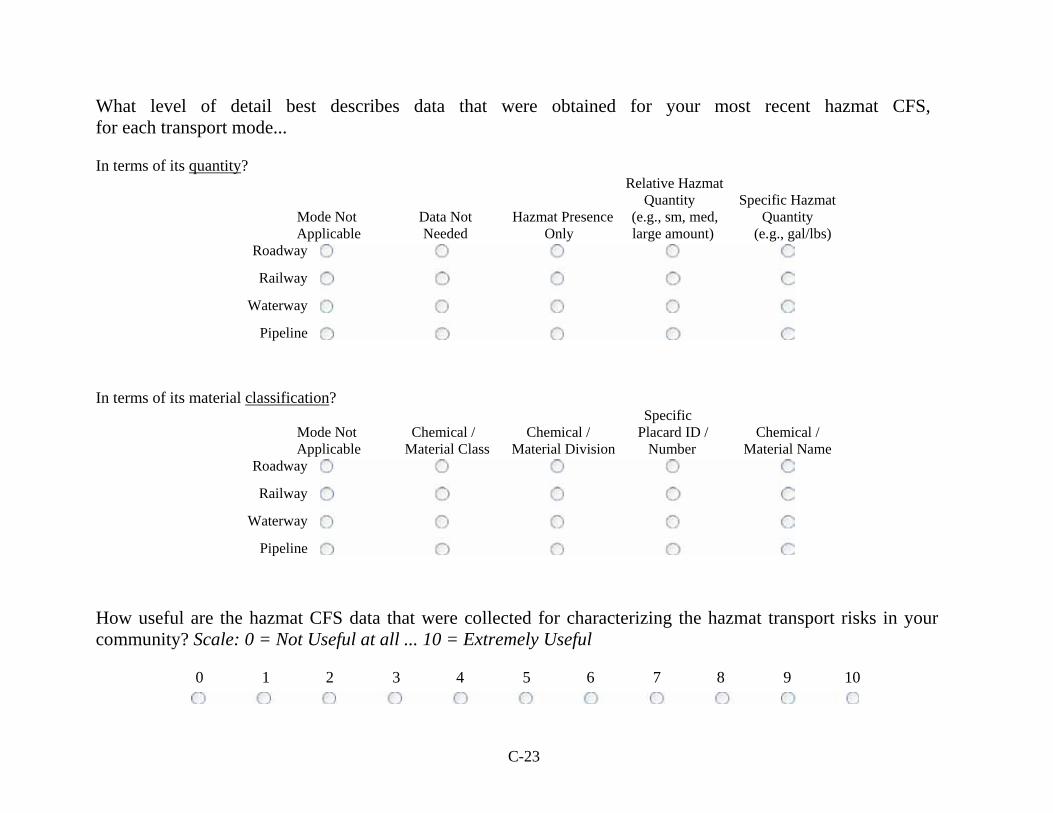
C-23
What level of detail best describes data that were obtained for your most recent hazmat CFS, for each transport mode... In terms of its quantity?
Relative Hazmat Quantity Specific Hazmat Mode Not Data Not Hazmat Presence (e.g., sm, med, Quantity Applicable Needed Only large amount) (e.g., gal/lbs)
Roadway
Railway
Waterway
Pipeline
In terms of its material classification?
Specific Mode Not Chemical / Chemical / Placard ID / Chemical / Applicable Material Class Material Division Number Material Name
Roadway
Railway
Waterway
Pipeline
How useful are the hazmat CFS data that were collected for characterizing the hazmat transport risks in your community? Scale: 0 = Not Useful at all ... 10 = Extremely Useful
0 1 2 3 4 5 6 7 8 9 10
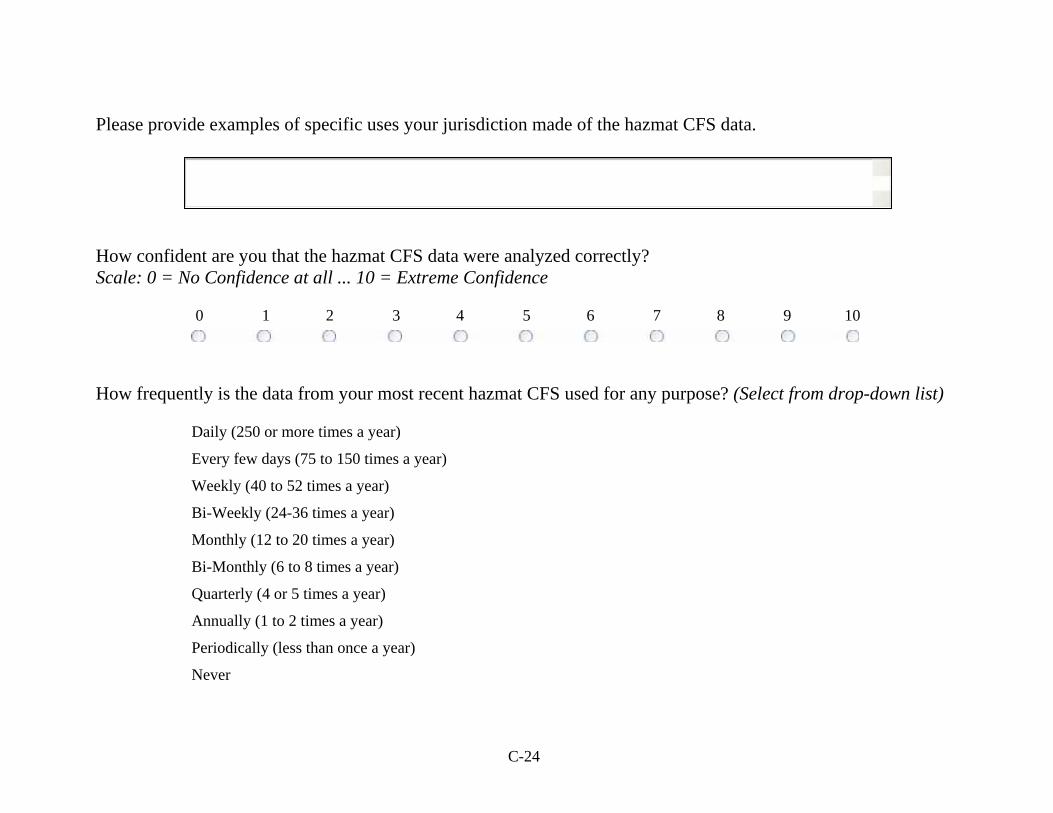
C-24
Please provide examples of specific uses your jurisdiction made of the hazmat CFS data.
How confident are you that the hazmat CFS data were analyzed correctly? Scale: 0 = No Confidence at all ... 10 = Extreme Confidence
0 1 2 3 4 5 6 7 8 9 10
How frequently is the data from your most recent hazmat CFS used for any purpose? (Select from drop-down list)
Daily (250 or more times a year)
Every few days (75 to 150 times a year)
Weekly (40 to 52 times a year)
Bi-Weekly (24-36 times a year)
Monthly (12 to 20 times a year)
Bi-Monthly (6 to 8 times a year)
Quarterly (4 or 5 times a year)
Annually (1 to 2 times a year)
Periodically (less than once a year)
Never
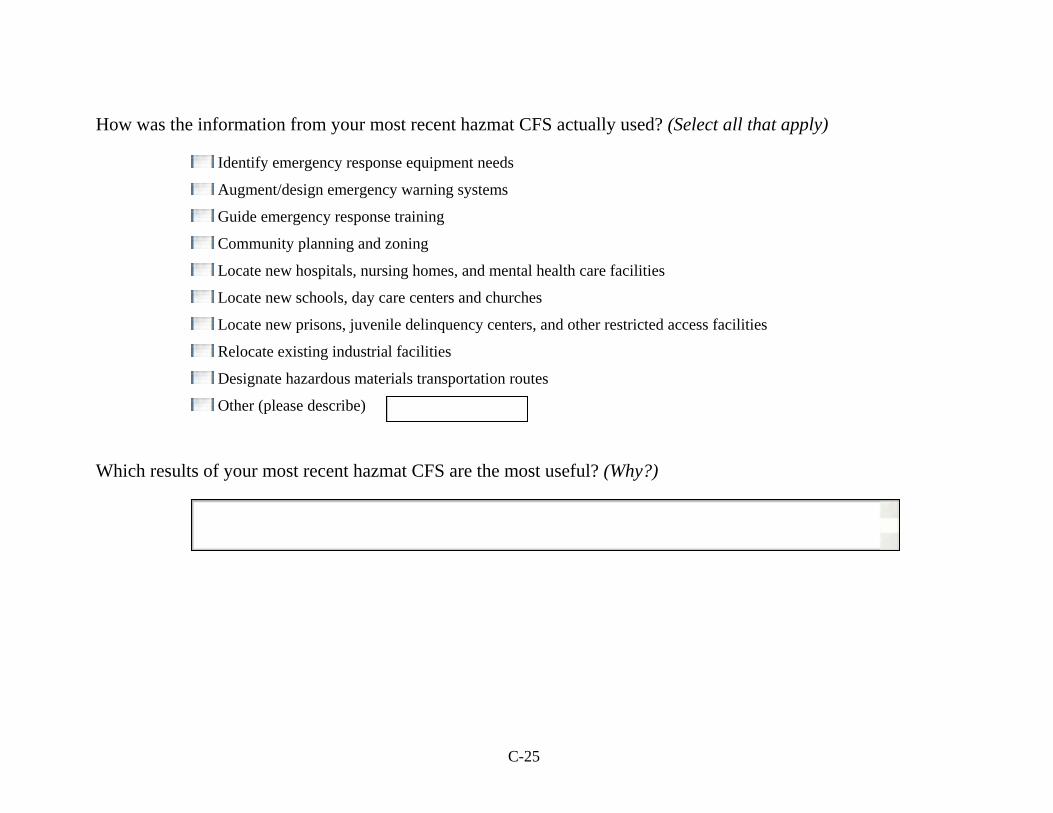
C-25
How was the information from your most recent hazmat CFS actually used? (Select all that apply)
Identify emergency response equipment needs
Augment/design emergency warning systems
Guide emergency response training
Community planning and zoning
Locate new hospitals, nursing homes, and mental health care facilities
Locate new schools, day care centers and churches
Locate new prisons, juvenile delinquency centers, and other restricted access facilities
Relocate existing industrial facilities
Designate hazardous materials transportation routes
Other (please describe)
Which results of your most recent hazmat CFS are the most useful? (Why?)
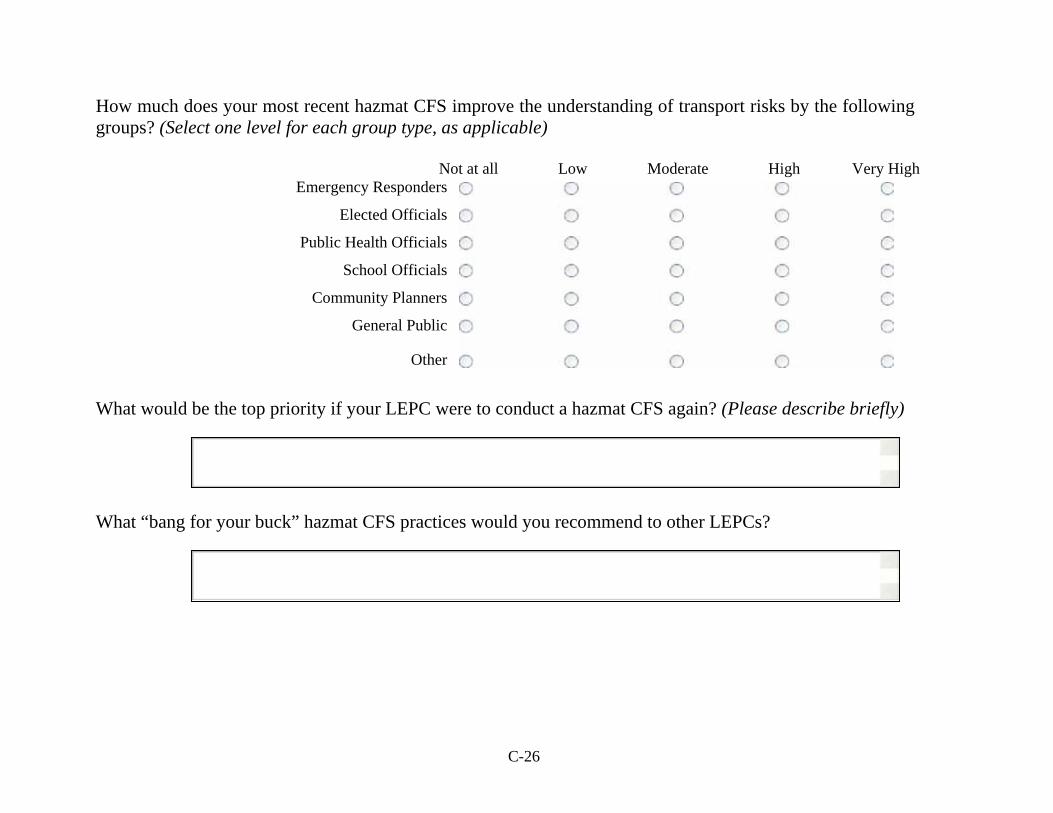
C-26
How much does your most recent hazmat CFS improve the understanding of transport risks by the following groups? (Select one level for each group type, as applicable)
Not at all Low Moderate High Very High
Emergency Responders
Elected Officials
Public Health Officials
School Officials
Community Planners
General Public
Other
What would be the top priority if your LEPC were to conduct a hazmat CFS again? (Please describe briefly)
What “bang for your buck” hazmat CFS practices would you recommend to other LEPCs?
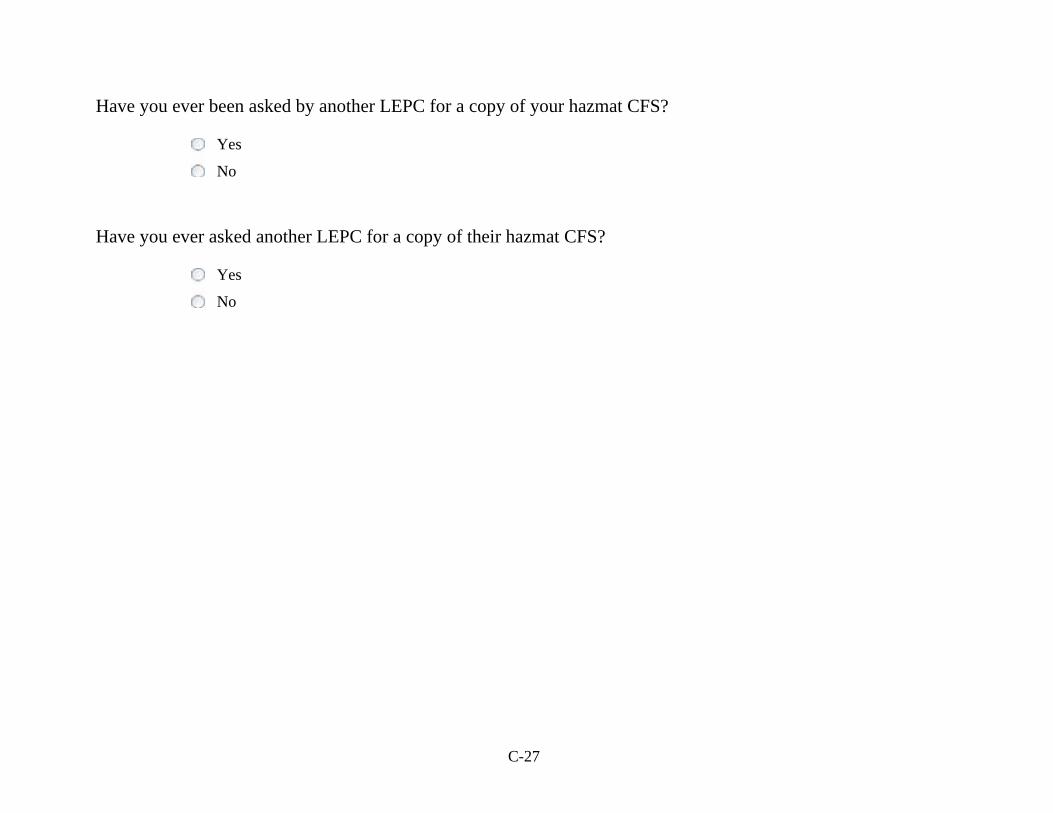
C-27
Have you ever been asked by another LEPC for a copy of your hazmat CFS?
Yes
No
Have you ever asked another LEPC for a copy of their hazmat CFS?
Yes
No
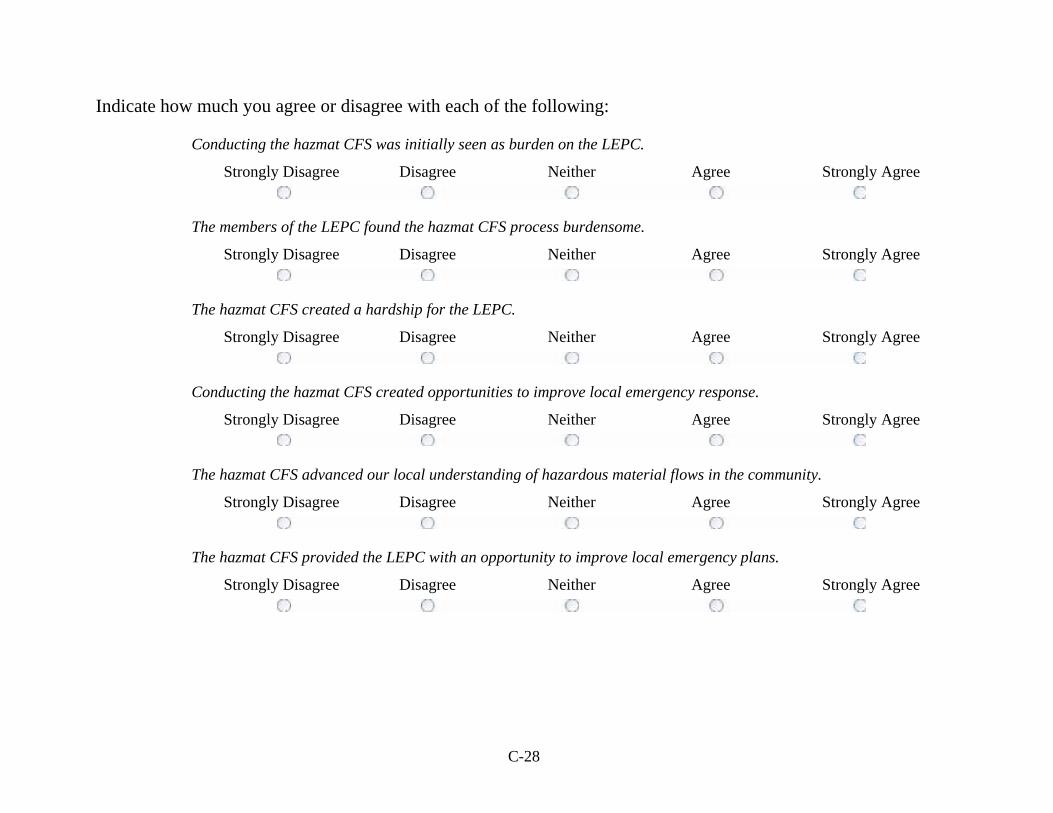
C-28
Indicate how much you agree or disagree with each of the following:
Conducting the hazmat CFS was initially seen as burden on the LEPC.
Strongly Disagree Disagree Neither Agree Strongly Agree
The members of the LEPC found the hazmat CFS process burdensome.
Strongly Disagree Disagree Neither Agree Strongly Agree
The hazmat CFS created a hardship for the LEPC.
Strongly Disagree Disagree Neither Agree Strongly Agree
Conducting the hazmat CFS created opportunities to improve local emergency response.
Strongly Disagree Disagree Neither Agree Strongly Agree
The hazmat CFS advanced our local understanding of hazardous material flows in the community.
Strongly Disagree Disagree Neither Agree Strongly Agree
The hazmat CFS provided the LEPC with an opportunity to improve local emergency plans.
Strongly Disagree Disagree Neither Agree Strongly Agree
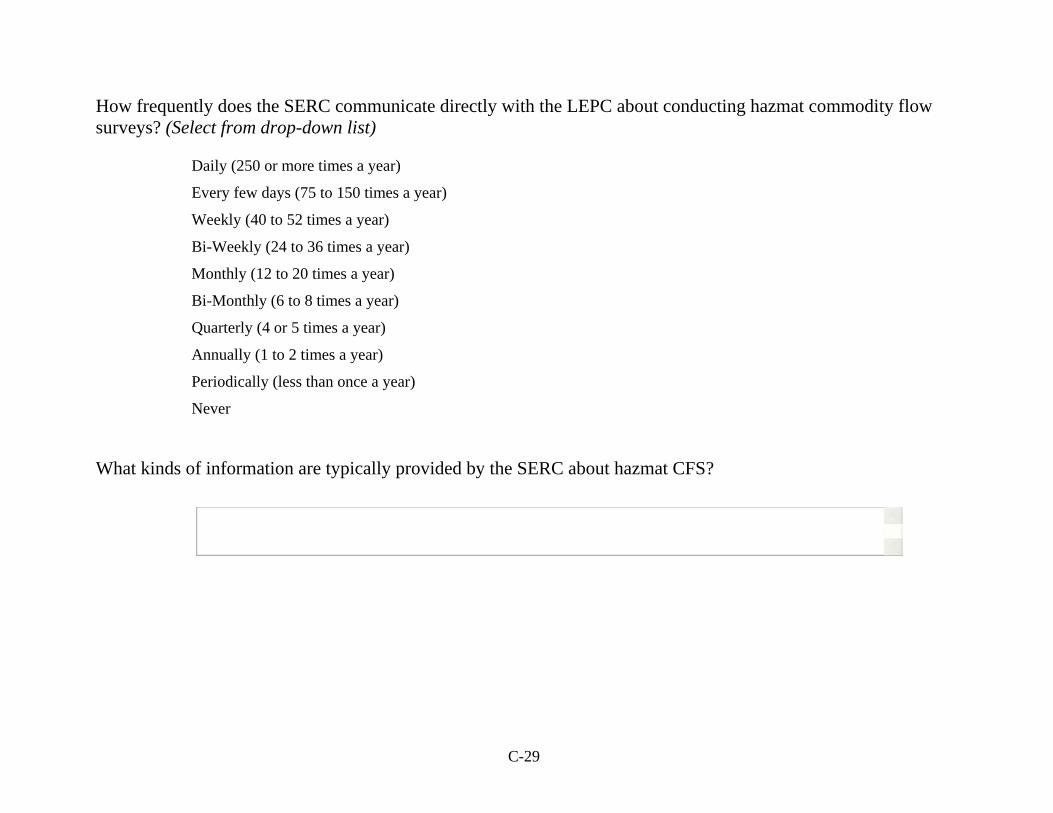
C-29
How frequently does the SERC communicate directly with the LEPC about conducting hazmat commodity flow surveys? (Select from drop-down list)
Daily (250 or more times a year)
Every few days (75 to 150 times a year)
Weekly (40 to 52 times a year)
Bi-Weekly (24 to 36 times a year)
Monthly (12 to 20 times a year)
Bi-Monthly (6 to 8 times a year)
Quarterly (4 or 5 times a year)
Annually (1 to 2 times a year)
Periodically (less than once a year)
Never What kinds of information are typically provided by the SERC about hazmat CFS?
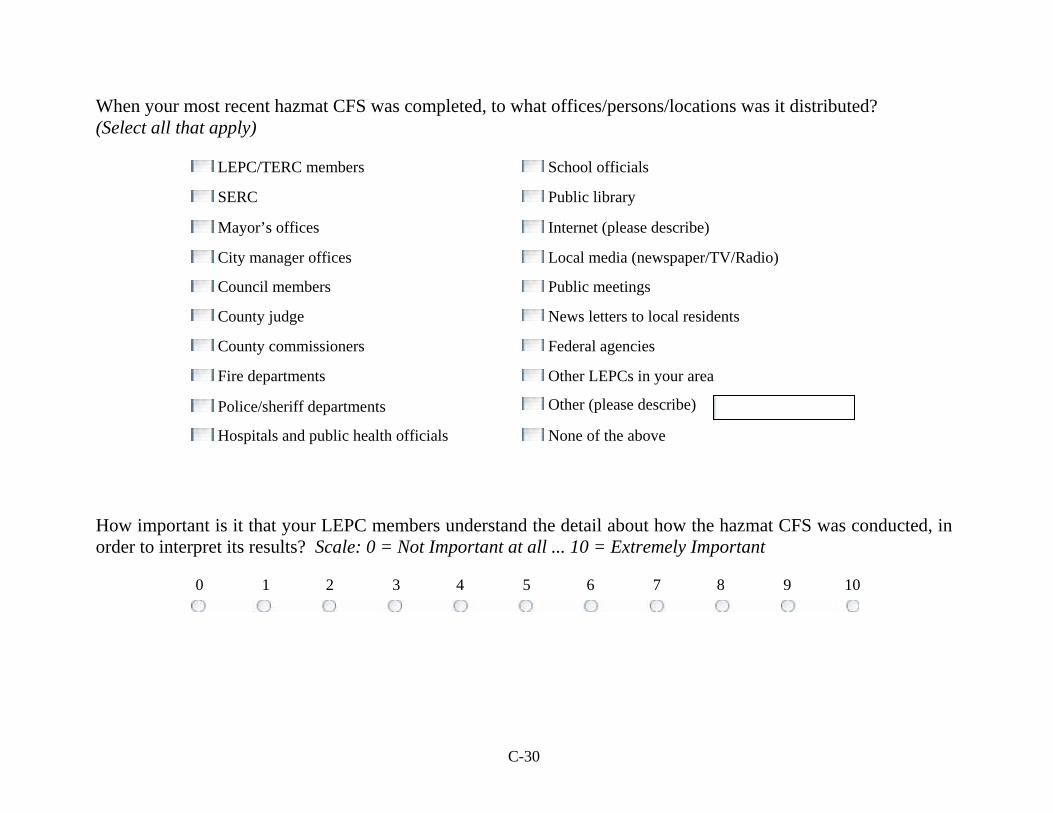
C-30
When your most recent hazmat CFS was completed, to what offices/persons/locations was it distributed? (Select all that apply)
LEPC/TERC members School officials
SERC Public library
Mayor’s offices Internet (please describe)
City manager offices Local media (newspaper/TV/Radio)
Council members Public meetings
County judge News letters to local residents
County commissioners Federal agencies
Fire departments Other LEPCs in your area
Police/sheriff departments Other (please describe)
Hospitals and public health officials None of the above
How important is it that your LEPC members understand the detail about how the hazmat CFS was conducted, in order to interpret its results? Scale: 0 = Not Important at all ... 10 = Extremely Important
0 1 2 3 4 5 6 7 8 9 10
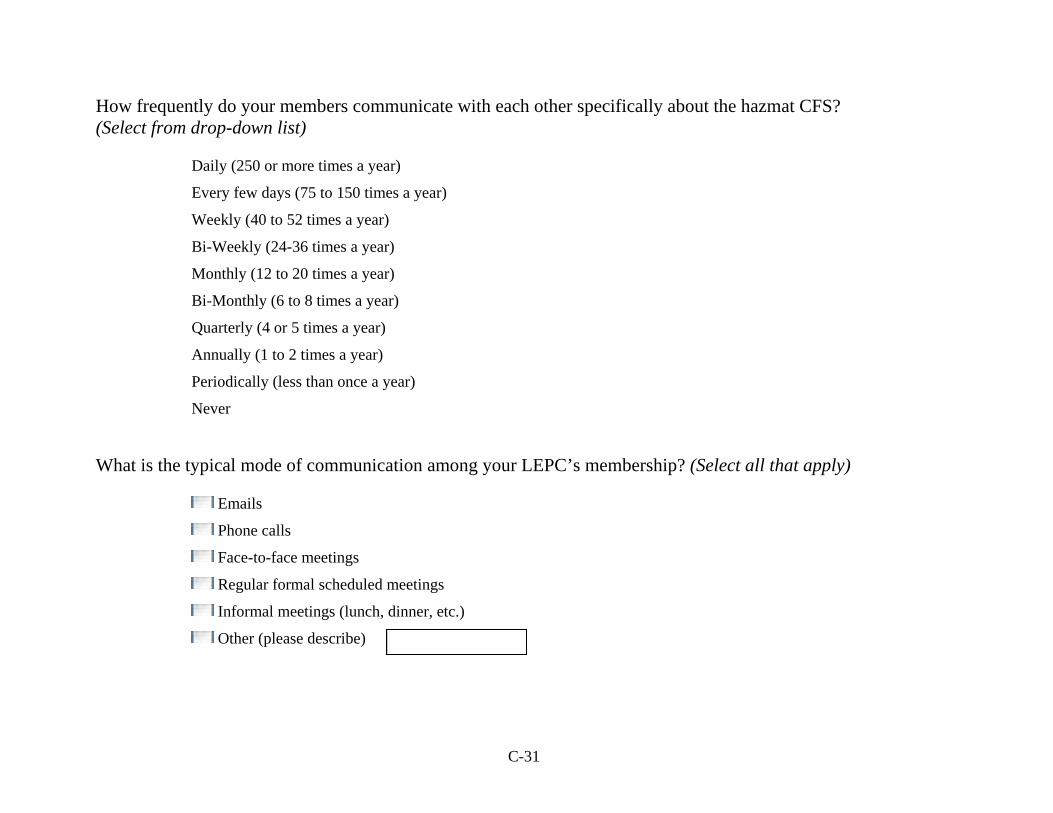
C-31
How frequently do your members communicate with each other specifically about the hazmat CFS? (Select from drop-down list)
Daily (250 or more times a year)
Every few days (75 to 150 times a year)
Weekly (40 to 52 times a year)
Bi-Weekly (24-36 times a year)
Monthly (12 to 20 times a year)
Bi-Monthly (6 to 8 times a year)
Quarterly (4 or 5 times a year)
Annually (1 to 2 times a year)
Periodically (less than once a year)
Never What is the typical mode of communication among your LEPC’s membership? (Select all that apply)
Emails
Phone calls
Face-to-face meetings
Regular formal scheduled meetings
Informal meetings (lunch, dinner, etc.)
Other (please describe)
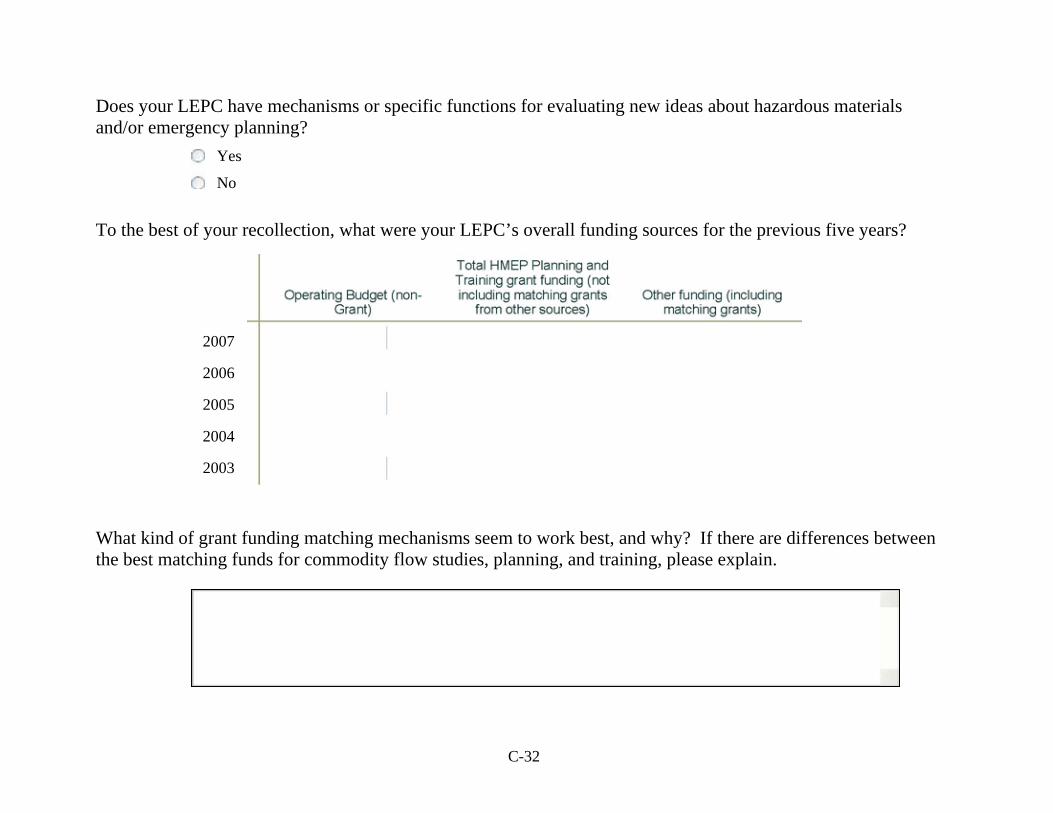
C-32
Does your LEPC have mechanisms or specific functions for evaluating new ideas about hazardous materials and/or emergency planning?
Yes
No
To the best of your recollection, what were your LEPC’s overall funding sources for the previous five years?
2007
2006
2005
2004
2003
What kind of grant funding matching mechanisms seem to work best, and why? If there are differences between the best matching funds for commodity flow studies, planning, and training, please explain.
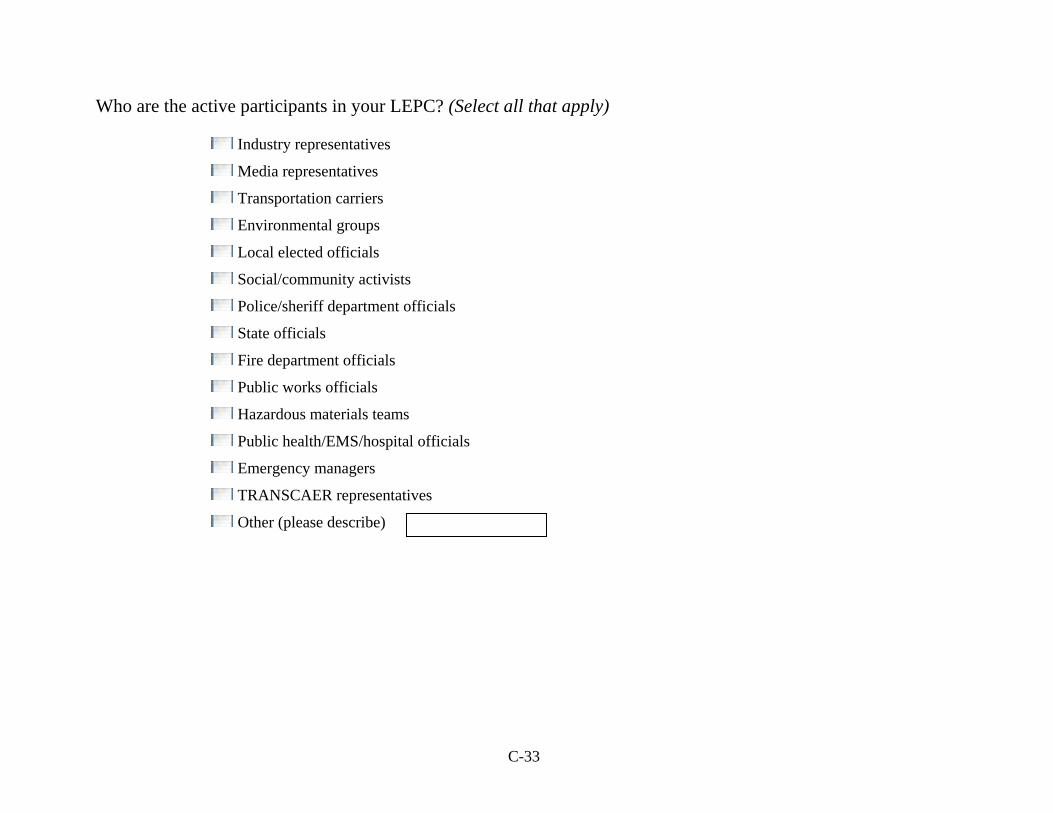
C-33
Who are the active participants in your LEPC? (Select all that apply)
Industry representatives
Media representatives
Transportation carriers
Environmental groups
Local elected officials
Social/community activists
Police/sheriff department officials
State officials
Fire department officials
Public works officials
Hazardous materials teams
Public health/EMS/hospital officials
Emergency managers
TRANSCAER representatives
Other (please describe)
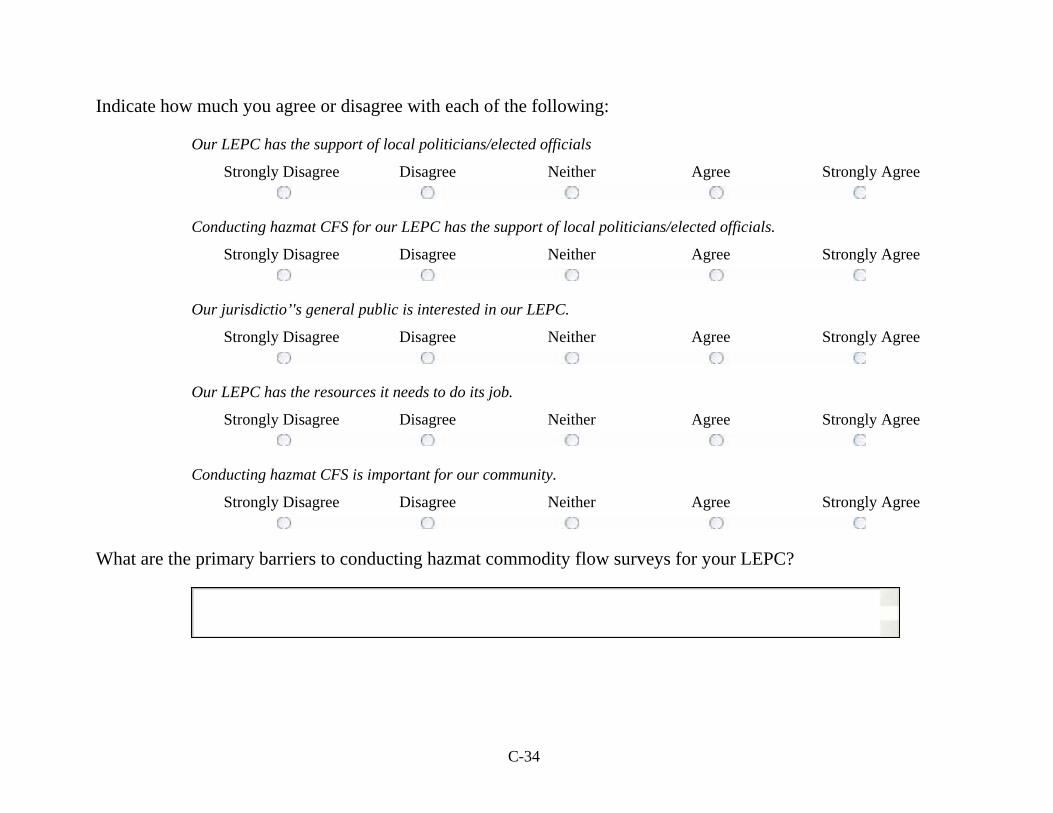
C-34
Indicate how much you agree or disagree with each of the following: Our LEPC has the support of local politicians/elected officials
Strongly Disagree Disagree Neither Agree Strongly Agree
Conducting hazmat CFS for our LEPC has the support of local politicians/elected officials.
Strongly Disagree Disagree Neither Agree Strongly Agree
Our jurisdictio’'s general public is interested in our LEPC.
Strongly Disagree Disagree Neither Agree Strongly Agree
Our LEPC has the resources it needs to do its job.
Strongly Disagree Disagree Neither Agree Strongly Agree
Conducting hazmat CFS is important for our community.
Strongly Disagree Disagree Neither Agree Strongly Agree
What are the primary barriers to conducting hazmat commodity flow surveys for your LEPC?
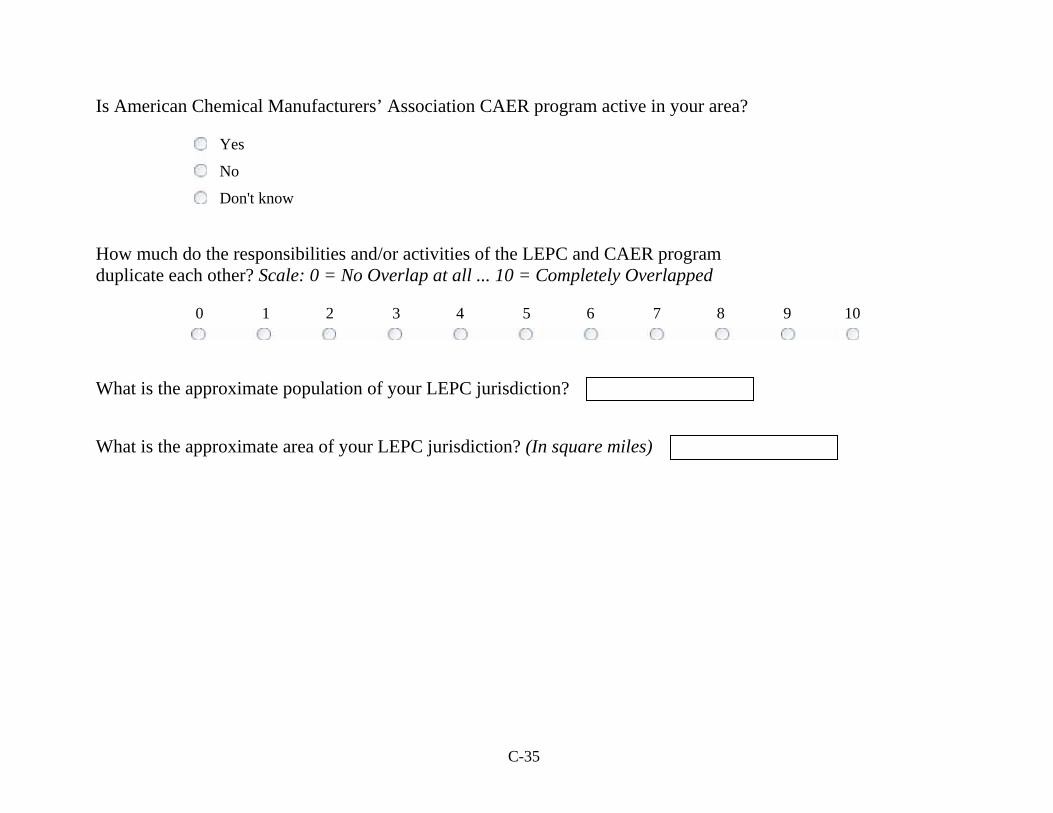
C-35
Is American Chemical Manufacturers’ Association CAER program active in your area?
Yes
No
Don't know
How much do the responsibilities and/or activities of the LEPC and CAER program duplicate each other? Scale: 0 = No Overlap at all ... 10 = Completely Overlapped
0 1 2 3 4 5 6 7 8 9 10
What is the approximate population of your LEPC jurisdiction? What is the approximate area of your LEPC jurisdiction? (In square miles)
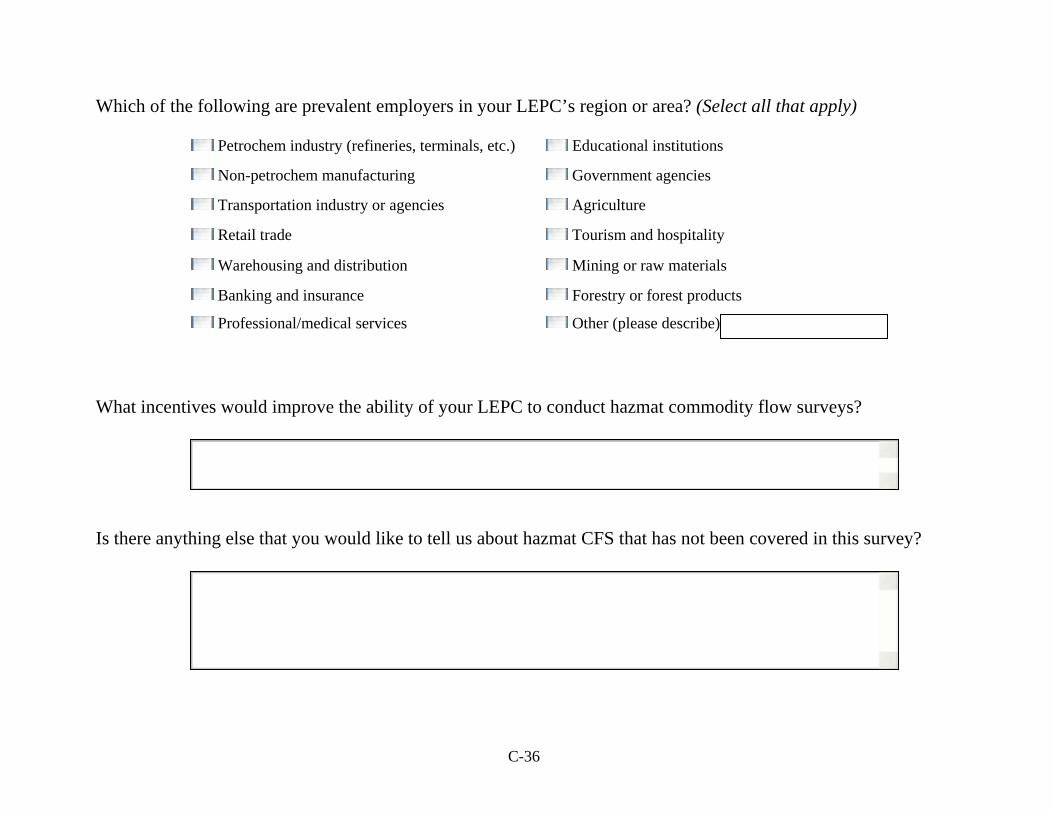
C-36
Which of the following are prevalent employers in your LEPC’s region or area? (Select all that apply)
Petrochem industry (refineries, terminals, etc.) Educational institutions
Non-petrochem manufacturing Government agencies
Transportation industry or agencies Agriculture
Retail trade Tourism and hospitality
Warehousing and distribution Mining or raw materials
Banking and insurance Forestry or forest products
Professional/medical services Other (please describe)
What incentives would improve the ability of your LEPC to conduct hazmat commodity flow surveys?
Is there anything else that you would like to tell us about hazmat CFS that has not been covered in this survey?

C-37
C-38
VERY IMPORTANT: Please be sure to click on the arrow in the lower left corner of this screen when you're finished to record your response and exit the survey. If you have any questions or comments about this project, please contact: Dr. George Rogers Texas A&M University Hazard Reduction & Recovery Center (979) 845-7284 [email protected] or Mr. David Bierling Texas Transportation Institute Multimodal Freight Transportation Programs (979) 862-2710 [email protected] Thank you! Survey Powered By Qualtrics

D-1
APPENDIX D
ELECTRONIC DATA SOURCE DESCRIPTIONS
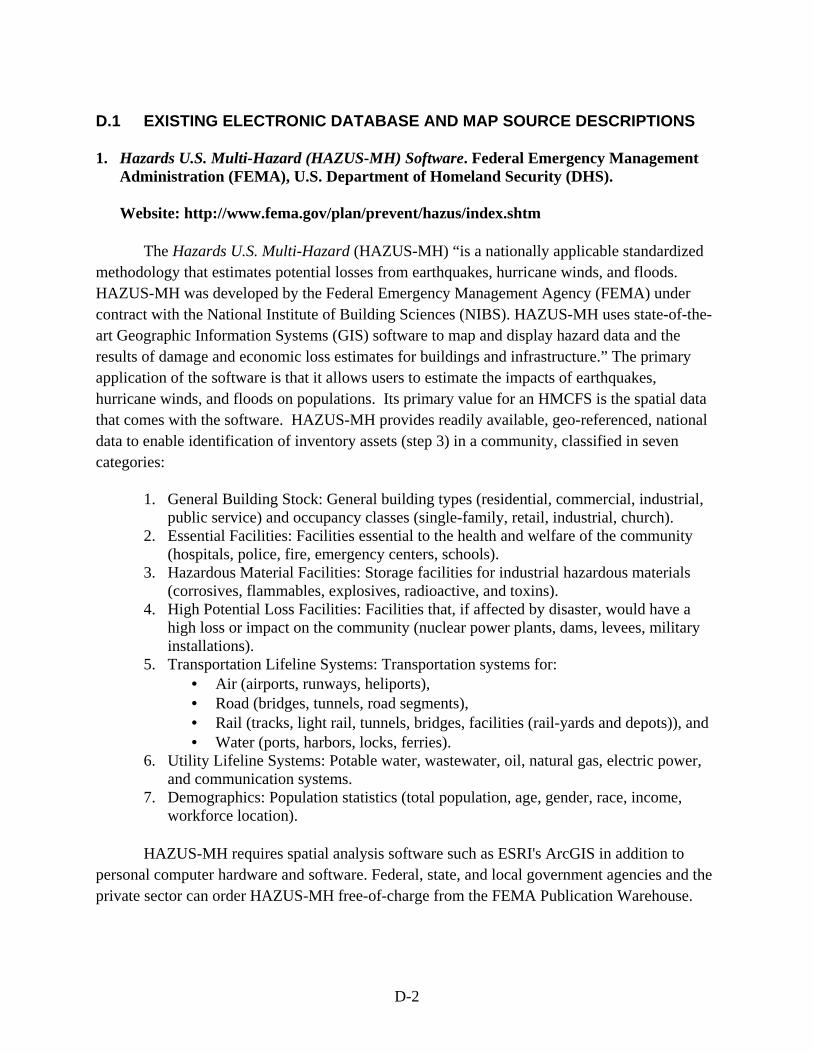
D-2
D.1 EXISTING ELECTRONIC DATABASE AND MAP SOURCE DESCRIPTIONS
1. Hazards U.S. Multi-Hazard (HAZUS-MH) Software. Federal Emergency Management Administration (FEMA), U.S. Department of Homeland Security (DHS). Website: http://www.fema.gov/plan/prevent/hazus/index.shtm
The Hazards U.S. Multi-Hazard (HAZUS-MH) “is a nationally applicable standardized
methodology that estimates potential losses from earthquakes, hurricane winds, and floods. HAZUS-MH was developed by the Federal Emergency Management Agency (FEMA) under contract with the National Institute of Building Sciences (NIBS). HAZUS-MH uses state-of-the-art Geographic Information Systems (GIS) software to map and display hazard data and the results of damage and economic loss estimates for buildings and infrastructure.” The primary application of the software is that it allows users to estimate the impacts of earthquakes, hurricane winds, and floods on populations. Its primary value for an HMCFS is the spatial data that comes with the software. HAZUS-MH provides readily available, geo-referenced, national data to enable identification of inventory assets (step 3) in a community, classified in seven categories:
1. General Building Stock: General building types (residential, commercial, industrial, public service) and occupancy classes (single-family, retail, industrial, church).
2. Essential Facilities: Facilities essential to the health and welfare of the community (hospitals, police, fire, emergency centers, schools).
3. Hazardous Material Facilities: Storage facilities for industrial hazardous materials (corrosives, flammables, explosives, radioactive, and toxins).
4. High Potential Loss Facilities: Facilities that, if affected by disaster, would have a high loss or impact on the community (nuclear power plants, dams, levees, military installations).
5. Transportation Lifeline Systems: Transportation systems for: • Air (airports, runways, heliports), • Road (bridges, tunnels, road segments), • Rail (tracks, light rail, tunnels, bridges, facilities (rail-yards and depots)), and • Water (ports, harbors, locks, ferries).
6. Utility Lifeline Systems: Potable water, wastewater, oil, natural gas, electric power, and communication systems.
7. Demographics: Population statistics (total population, age, gender, race, income, workforce location).
HAZUS-MH requires spatial analysis software such as ESRI's ArcGIS in addition to personal computer hardware and software. Federal, state, and local government agencies and the private sector can order HAZUS-MH free-of-charge from the FEMA Publication Warehouse.
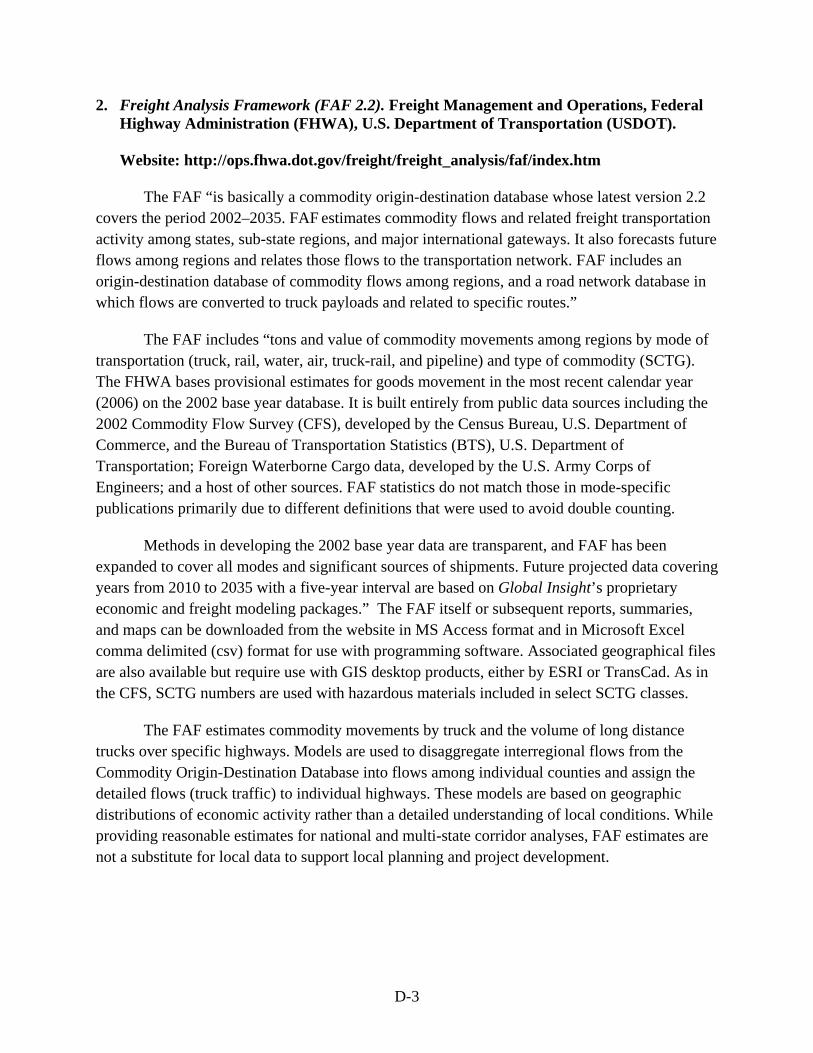
D-3
2. Freight Analysis Framework (FAF 2.2). Freight Management and Operations, Federal Highway Administration (FHWA), U.S. Department of Transportation (USDOT).
Website: http://ops.fhwa.dot.gov/freight/freight_analysis/faf/index.htm
The FAF “is basically a commodity origin-destination database whose latest version 2.2
covers the period 2002–2035. FAF estimates commodity flows and related freight transportation activity among states, sub-state regions, and major international gateways. It also forecasts future flows among regions and relates those flows to the transportation network. FAF includes an origin-destination database of commodity flows among regions, and a road network database in which flows are converted to truck payloads and related to specific routes.”
The FAF includes “tons and value of commodity movements among regions by mode of transportation (truck, rail, water, air, truck-rail, and pipeline) and type of commodity (SCTG). The FHWA bases provisional estimates for goods movement in the most recent calendar year (2006) on the 2002 base year database. It is built entirely from public data sources including the 2002 Commodity Flow Survey (CFS), developed by the Census Bureau, U.S. Department of Commerce, and the Bureau of Transportation Statistics (BTS), U.S. Department of Transportation; Foreign Waterborne Cargo data, developed by the U.S. Army Corps of Engineers; and a host of other sources. FAF statistics do not match those in mode-specific publications primarily due to different definitions that were used to avoid double counting.
Methods in developing the 2002 base year data are transparent, and FAF has been expanded to cover all modes and significant sources of shipments. Future projected data covering years from 2010 to 2035 with a five-year interval are based on Global Insight’s proprietary economic and freight modeling packages.” The FAF itself or subsequent reports, summaries, and maps can be downloaded from the website in MS Access format and in Microsoft Excel comma delimited (csv) format for use with programming software. Associated geographical files are also available but require use with GIS desktop products, either by ESRI or TransCad. As in the CFS, SCTG numbers are used with hazardous materials included in select SCTG classes.
The FAF estimates commodity movements by truck and the volume of long distance trucks over specific highways. Models are used to disaggregate interregional flows from the Commodity Origin-Destination Database into flows among individual counties and assign the detailed flows (truck traffic) to individual highways. These models are based on geographic distributions of economic activity rather than a detailed understanding of local conditions. While providing reasonable estimates for national and multi-state corridor analyses, FAF estimates are not a substitute for local data to support local planning and project development.
D-4
3. National Transportation Atlas Database (NTAD). Bureau of Transportation Statistics (BTS), Research and Innovative Technology Administration (RITA), U.S. Department of Transportation (USDOT).
Website: http://www.bts.gov/publications/national_transportation_atlas_database/2007/
NTAD “is a set of nationwide geographic databases of transportation facilities,
transportation networks, and associated infrastructure. These datasets include spatial information for transportation modal networks and intermodal terminals, as well as the related attribute information for these features, e.g., rail and road networks. A desktop Geographic Information System is required for using NTAD. The data can be ordered in the form of two CD-ROMs or directly downloaded from the website to support research, analysis, and decision-making across all modes of transportation. They are most useful at the national level but have major applications at regional, state, and local scales throughout the transportation community.”
Hazmat routes and road segments from the HPMS are two of the layers in NTAD. Individual road segments can be selected graphically by county FIPS code and highway number, for example. However, only selected attributes of road segments are present in the NTAD GIS tables. Truck route designation (or not) of a segment is present, but the percent trucks is not. The HPMS data file (or FAF network file) will have to be consulted directly on the latter for each segment selected graphically. Traffic data on rail routes or waterways are even poorer.
An advantage of NTAD is that it includes intermodal terminal locations, e.g., an airport would be an air and truck intermodal terminal. The majority of spill and release incidents occur in transfer, and it may be of help in a community trying to locate those. NTAD allows professional maps of the study area and corridors to be produced in order to visually aid the conduct of a local/regional CFS. An alternative to NTAD would be Google maps or state-provided maps.
4. Incident Reports Database. Office of Hazardous Materials Safety (OHMS), Pipeline and Hazardous Materials Administration (PHMSA), U.S. Department of Transportation (USDOT).
Website: http://www.phmsa.dot.gov/hazmat/library/data-stats/incidents Website: https://hazmatonline.phmsa.dot.gov/IncidentReportsSearch/
The Pipeline and Hazardous Materials Safety Administration’s (PHMSA) Office of Hazardous Materials Safety (OHMS) maintains the Hazardous Materials Incident Reporting System (HMIRS). It is the most detailed, comprehensive source for reported hazardous materials incidents on all modes excluding pipeline. Transportation carriers are required to report HazMat-related accidents to the National Response Center. Deep sea vessel incidents are included but not inland waterway incidents. Incidents are defined as spills or releases of a material classified as
D-5
hazardous, whether a vehicular accident occurred or not. The OHMS compiles and updates the incident data from incident reports as they are received and makes it publicly available via an online user search. Because the records are self-reported and based on conditional criteria for incidents, the data set may substantially under-report all incidents involving vehicles carrying hazardous materials. Further information about HMIRS underreporting may be found in HMCRP Report 1: Hazardous Materials Transportation Incident Data for Root Cause Analysis.
Among reports and summaries, summary statistics are prepared by the OHMS and available for download in pdf format from the website. At the national level, 10-year and annual summaries of incidents are available. The 10-year summaries are of a more aggregate nature, providing number of incidents, injuries, fatalities, and property damage dollar values by HazMat type (RAM or waste), incident type (total or serious), year, and mode. The annual summaries are more refined to include number of incidents, injuries, fatalities, and property damage values by mode, state, cause, hazard class, incident type (total or serious), incident result, and transportation phase. At the state level, incident summaries are refined only by mode to provide number of incidents, injuries, fatalities, and property damage values.
Users can use the search tool on PHMSA’s Hazmat Incident Reports Database website and state their individual constraints (after selecting a year) by filling in any field(s) on the incident reports database search form. These constraints offer the ability for a more customized incident search than the ready-made summaries. Although the search tool user interface does not include county as a constraint, complete datasets for an entire state, for example, can be downloaded to a CSV (comma-separated value) file and then be converted to spreadsheet or database file such as Microsoft Excel or Access. If a user were to download the entire file for their state over the date-range desired, they could then sort the dataset by county, city, or zip code to identify those incidents that occurred within specific jurisdictional boundaries.
Therefore, a more accurate, disaggregate analysis of hazardous materials incidents down to the regional or local level necessitates a modest exercise to search and retrieve the desired data directly from the database.
5. The National Hazardous Materials Route Registry and Route Maps. Federal Motor Carrier Safety Administration (FMCSA), U.S. Department of Transportation (USDOT). Website: http://hazmat.fmcsa.dot.gov/nhmrr/index.asp?page=route Website: http://hazmat.fmcsa.dot.gov/nhmrr/index.asp?page=maps
Based on the Federal Register route listing, the FMCSA website provides more useful and interactive ways to search and display the latest information on one or more hazardous
D-6
materials route designations. A mapping application also displays the hazardous materials route(s) that should be traveled after an origin and a destination address is entered.
6. Highway Performance Monitoring System (HPMS). Office of Highway Policy
Information, Federal Highway Administration (FHWA), U.S. Department of Transportation (USDOT). Website: http://www.fhwa.dot.gov/policy/ohpi/hpms/index.cfm
The HPMS is “a national level highway information system that includes a wide array of
data on the extent, condition, performance, use, and operating characteristics of the nation’s highways. The major purpose of the HPMS is to support a data driven decision process within FHWA, the DOT, and the Congress for legislative and funding purposes. HPMS is a nationally unique source of highway system information that is made available to the transportation community for highway and transportation planning and other purposes through the annual Highway Statistics and other data dissemination media.”
The latest annual edition of HPMS at the time of this writing is 2006. The file can be usually obtained by regions and localities by contacting the local office of the State Department of Transportation. Segment attributes of interest include truck route designation, and the percent daily or peak hour traffic that are combination trucks. An in-house exercise of considerable expertise and resources will have to be conducted by the region or locality to extract the segment data of need from the larger database, if a custom-made dataset is not readily provided by the local state DOT office. A more user friendly alternative is the HPMS Map Viewer in the above link that enables selection of truck routes to the traffic network level showing truck routes and overall traffic volumes (not truck specific). The viewer also displays population demographic information.
7. 2002 Vehicle Inventory and Use Survey (VIUS). U.S. Census Bureau, U.S. Department of Commerce. Website: http://www.census.gov/svsd/www/vius/2002.html
According to the program documentation provided on the website, the VIUS “provides
data on the physical and operational characteristics of the nation’s truck population. Its primary goal is to produce national and state-level estimates of the total number of trucks....[It] is a probability sample of all private and commercial trucks registered (or licensed) in the United States...[and] excludes vehicles owned by Federal, state, or local governments; ambulances; buses; motor homes; farm tractors; and non-powered trailer units. Additionally, trucks that were included in the sample but reported to have been sold, junked, or wrecked prior to the survey year (date varies) were deemed out-of-scope. The sampling frame was stratified by geography
D-7
and truck characteristics. The 50 states and the District of Columbia made up the 51 geographic strata. Body type and gross vehicle weight (GVW) determined the following five truck strata:
1. Pickups; 2. Minivans, other light vans, and sport utilities; 3. Light single-unit trucks (GVW 26,000 lbs. or less); 4. Heavy single-unit trucks (GVW 26,001 lbs. or more); and 5. Truck-tractors.
Therefore, the sampling frame was partitioned into 255 geographic-by-truck strata. Within each stratum, a simple random sample of truck registrations was selected without replacement.” Samples are available for nine different years between (and including) 1963 and 2002. The 2002 year had a sample of 136,113 trucks. As of this report date, the VIUS sample has been discontinued.
8. Company Registration Look-Up Tool. Office of Pipeline Safety (OPS), Pipeline and Hazardous Materials Safety Administration (PHMSA), U.S. Department of Transportation (U.S. DOT). Website: http://www.phmsa.dot.gov/hazmat/registration
“Offerors and transporters of certain quantities and types of hazardous materials,
including hazardous wastes, are required to file an annual registration statement with the U.S. DOT and to pay a fee that provides funds for grants distributed to States and Indian tribes for hazardous materials emergency response planning and training. Any user can search for a company’s registration history and view the certificates through the Company Registration Look-Up tool.” The minimum requirement is a zip code but one can also search by company name, existing PHMSA registration number, U.S. DOT Number, or FMCSA MC/MX number, if available. It is a very useful tool for local entities desiring to locate HazMat transporters based in their area.
9. Carload Waybill Sample. Surface Transportation Board (STB), U.S. Department of
Transportation (U.S. DOT). Website: http://www.stb.dot.gov/stb/industry/econ_waybill.html
The Surface Transportation Board’s (STB) Carload Waybill Sample “is a stratified
sample of carload waybills for terminated shipments by railroad carriers. These waybill data are used to create a movement specific Confidential Waybill File and a less detailed Public Use Waybill File. The elements and the file structure for both the Confidential File and the Public Use File are described in the user guide, which is available for download from the website, as is the Public Use File.”
D-8
The sample “includes waybill information from Class I, Class II, and some of the Class III railroads. The STB requires that these railroads submit waybill samples if, in any of the three preceding years, they terminated on their lines at least 4,500 revenue carloads. The Waybill Sample currently encompasses over 99 percent of all U.S. rail traffic. It is a continuous sample that is released in yearly segments. For the past several years, it has contained information on approximately 600,000 movements.”
Data from the Master Waybill Sample File “are used as input to many STB projects, analyses, and studies. Federal agencies (Department of Transportation, Department of Agriculture, etc.) use the Waybill Sample as part of their information base. The Waybill Sample is also used by States as a major source of information for developing state transportation plans. In addition, non-government groups seek access to waybill sample data for such uses as market surveys, development of verified statements in STB and State formal proceedings, forecast of rail equipment requirements, economic analysis and forecasts, academic research, etc.”
The Master Waybill File “contains sensitive shipping and revenue information, so access is restricted to: railroads; Federal agencies; the States; transportation practitioners, consultants and law firms with formal proceedings before the STB or State Boards; and certain other users. Anyone can access the non-confidential data in the Public Use File by downloading it from the website or sending a written request to STB.”
The Public Use File only provides an indication of the presence of a hazardous commodity in the car is hazardous via an ‘H’ designation in the ‘Hazardous/Bulk Material in Boxcar’ field, and the 5-digit STCC of the commodity, that would only indicate the hazard class and division (at best). STCC codes at the 7-digit level that would identify the chemical name of the hazardous material are not provided in the Public Use File. The Confidential Waybill File however does provide the STCC HazMat code at the 7-digit level as well as the 49xxxxx series railroad code specifically for hazardous commodities in the ‘Hazardous/Bulk Material in Boxcar’ field. In addition, the Public file only indicates the origin and termination BEA (Business Economic Area) whereas the Confidential file disaggregates origins and terminations to the MSA (Metropolitan Statistical Area) or county level, which is more appropriate for local use. Depending on the resources available for conducting a CFS and the level of detail a community desires in it, it may decide to go into the legal and technical trouble of obtaining and analyzing the Confidential Waybill File. However, it may probably be more resource efficient to simply request commodity flow information on the top 10 hazardous materials transported through the area from the operating railroad(s).
D-9
10. Rail Safety Data. Office of Safety Analysis, Federal Railroad Administration (FRA). Website: http://safetydata.fra.dot.gov/officeofsafety/Default.asp
The FRA Office of Safety Analysis website “makes railroad safety information readily
available to a broad constituency, including FRA personnel, railroad companies, research and planning organizations and the general public. Visitors have access to railroad safety information including accidents and incidents, inspections and highway-rail crossing data. From this site users can run dynamic queries, download a variety of safety database files, publications and forms, and view current statistical information on railroad safety. Dynamic queries dating back to 1978 can be run for accident/incident data for individual railroads, by railroad group, by region, state, or county, and for any multiannual, annual, multi-monthly, or monthly time frame.” An online report is created and displayed that contains the number of cars that released HazMat and the number of cars that released HazMat as a result of damage or derailment. Additional queries offer further constraints, such as accident cause, type, damage, or the ‘HazMat option.’ Constraints under the ‘HazMat option’ include cars carrying HazMat, cars carrying HazMat that were damaged, cars that released HazMat, or if evacuation occurred.
The geographic detail lends itself to use in regional/local CFS since it goes down to the county and railroad line levels. However, the FRA accident/incident data do not contain any information on the quantities, classes, or chemical names of the hazardous materials released. The PHMSA HMIRS database remains a more detailed source for hazardous materials incident data.
11. Office of Pipeline Safety (OPS) National Pipeline Mapping System. Pipeline and Hazardous Materials Safety Administration (PHMSA), U.S. Department of Transportation (USDOT). Website: http://www.phmsa.dot.gov/pipeline
The Office of Pipeline Safety, through the Pipeline Safety Community portal of the
PHMSA website, makes available gas and liquid pipeline maps down to the street level, through the National Pipeline Mapping System (www.npms.phmsa.dot.gov/). The OPS website also provides pipeline incident and mileage profiles by state and county, and by aggregate commodity (hazardous liquid or natural gas). The user can click on the button or link for the NPMS Public Map Viewer. The maps include information about gas transmission lines and hazardous liquid trunklines but do not contain gathering and distribution pipelines. The mapping application requires selection of the state and county for which a map is desired. The map output allows the user to zoom in or zoom out, identify particular pipelines by type and operator, and includes contact information. However, individual operators will have to be contacted in order to obtain the levels of flow of a given pipeline through a region/locality. Users should make sure that pop-
D-10
ups are allowed by their browser, and using web browsers other than Microsoft Internet Explorer may limit visibility of information.
The National Pipeline Mapping System also operates a secured access repository of pipeline data. Local, state, and federal government officials may request access to these data by sending requests to [email protected] with “Pipeline Data Request” in the subject line, and including Name, Title, Organization, Mailing Address, Phone Number, Fax Number, and Email Address. Applicants are screened to ensure they are qualified to access NPMS data; more information is available on the website.
12. Hazardous Commodity Code Cross-Reference File. Navigation Data Center (NDC), United States Army Corps of Engineers (USACE). Website: http://www.iwr.usace.army.mil/ndc/data/datahazc.htm
The USACE “developed a Hazardous Commodity Code Cross Reference File in an effort
to associate the Waterborne Commerce Statistics Center (WCSC) Commodity Codes, which are based on the Standard International Trade Classification (SITC), with hazardous commodity codes used by other Federal agencies and internationally. WCSC codes were matched with North American Emergency Response Guide (NAERG) guide numbers and hazard classes. These consist of the United Nations’ (UN) Hazard Identification Codes used worldwide to track international hazardous material cargoes and a number of general codes to cover hazardous materials not specified by the UN Codes.”
A further effort inter-relates the WCSC Commodity Codes with the USCG Chemical Hazard Response Information System (CHRIS) Codes, the NAERG Hazard Identification Numbers, and Chemical Abstract Service Registry Numbers (CAS). CHRIS Numbers “are used domestically by the U.S Shipping Industry and the USCG to designate hazardous cargo moving by vessel. The CAS Registry is the worldwide definitive chemical identification system.” Both these files are also publicly available for download through the NDC website.
D-11
13. Marine Casualty and Pollution Database. Marine Information for Safety and Law Enforcement (MISLE), Marine Safety Management System, U.S. Coast Guard (USCG).
Website: http://transtats.bts.gov/Tables.asp?DB_ID=610&DB_Name=Marine%20Casualty%20 And%20Pollution%20Database&DB_Short_Name=Marine%20Casualty/Pollution
The Marine Casualty and Pollution Database “contains data related to marine casualty investigations and pollution investigations by the U.S. Coast Guard concerning vessel and waterfront facility accidents and marine pollution incidents throughout the United States and its territories.” The data-current data, user guide, and data dictionary are posted on the web. The data are contained in nine (text) files and are publicly available on CD-ROM upon request from the Coast Guard through the Bureau of Transportation Statistics website. MISLE provides comprehensive information as to all waterway incidents and accidents and lend themselves to diversified analysis purposes. Records can be joined and filtered to satisfy a variety of objectives to a low level of geographic detail. At least an elementary level of software and database analysis skills is required as they are in comma delimited text format and need to be imported into a spreadsheet or database application for analysis.
14. United States Census 2000. U.S. Census Bureau, U.S. Department of Commerce (DOC). Website: http://www.census.gov/
The U.S. Census Bureau collects, compiles, analyzes, and makes publicly available national data through the Population & Housing Census (every 10 years), the Economic Census (every 5 years), the American Community Survey (annually), several other surveys (both Demographic & Economic), and Economic Indicators (each released on a specific schedule). The topics range from data on people and households (housing, income, poverty etc.) to data on business and industry (trade, employment, economic indicators). The output format ranges from on-screen data and map output to geographic data, i.e., GIS maps (shapefiles) that are already prepared or custom made. The data can be queried at the state, county, or census tract level via a simple zip code entry. The most recent U.S. Census was in 2000; the 2010 Census is underway. The GIS based maps would require a desktop GIS but are an invaluable tool for hotspots analyses. Overall, the Census Bureau website is a valuable source of data especially in creating a community’s profile for inclusion in the CFS document and overall support of local CFS efforts.
15. The National Map. U.S. Geological Survey. Website: http://nationalmap.gov/
The USGS collaborates with other Federal, State and local partners to improve and deliver topographic information in the form of the National Map. It can be used for many purposes including, scientific analysis, recreation and emergency response. It is accessible for
D-12
display via the Web or as downloadable data for use locally. Information available include elevation, hydrography, orthoimagery, boundaries, transportation, structures and land cover. Additional geographic information can be added either through the viewer or integrated with The National Map data in a Geographic Information System. The GIS based maps require a desktop GIS but are an invaluable tool for hotspots analyses. Overall, the the National Map is a valuable source of data especially in creating a geographic profile for inclusion in the CFS document and overall support of local CFS efforts.
16. Web Soil Survey. U.S. Department of Agriculture, Natural Resources Conservation Service. Website: http://nationalmap.gov/
The Web Soil Survey provides soil data and information produced by the National Cooperative Soil Survey. Operated by the USDA Natural Resources Conservation Service (NRCS) the Web Soil Survey accesses the largest natural resource information system in the world. NRCS has soil maps and data for more than 3000 counties are available online. Updated and maintained online, the Web Soil Survey is the single authoritative source of soil survey information. Soil surveys data such as soil type, topographic, and ecological data can be used for local and wider area planning as well as emergency planning and response. Web Soil Survey provides a useful resource for attaining soil information pertinent to hazardous materials spills for inclusion in the HMCFS document.
17. National Climatic Data Center, U.S. Department of Commerce, National Oceanic and Atmospheric Administration. Website: http://www.ncdc.noaa.gov/oa/ncdc.html
The National Climatic Data Center of the U.S. Department of Commerce and National Oceanic and Atmospheric Administration provide land- and marine-based data about upper air-flows, weather and climate patterns and events, paleoclimatology and satellite imagery. These data are summarized monthly and annually, as well as unedited weather station data for the United States. Products include extreme weather and climate events, climate normals, storm database, and climate maps of the U. S. These data may require desktop GIS, but some are available as maps. Overall the NCDE/NOAA website is a valuable resource for climate data for areas of the United States. These data provide useful profiles for inclusion in the CFS document and overall support of the CFS efforts.
D-13
D.2 EXISTING ELECTRONIC REPORT SOURCE DESCRIPTIONS
1. United States: 2007 Commodity Flow Survey. Bureau of Transportation Statistics (BTS), U.S. Department of Transportation (USDOT), and Economics and Statistics Administration, U.S. Census Bureau, U.S. Department of Commerce, December 2009.
From BTS: “The majority of 2007 CFS data products will be made available only via electronic media released on the BTS website http://www.bts.gov/publications/ commodity_flow_survey/ or the Census Bureau’s American FactFinder website http://www.factfinder.census.gov. The final data release will include only three printed publications at the national level. These reports will include national-level data for the: United States, Hazardous Materials, and Exports.”
The CFS is a primary data source in the world of freight transportation. It is conducted every 5 years and the data from the 2007 survey were released in December 2009. The industry sectors surveyed include manufacturing, mining, wholesale, and select retail.
The hazardous materials transportation series of the data provides information—at a national level—on HazMat shipments by mode (tonnage, value, and ton-miles shipped), class/division, UN number, origin and destination state, interstate and intrastate transport, toxic inhalation hazards, packing groups, and other categories, and various combinations of these categories (e.g., mode by hazard class/division). Additional CFS sections report on all commodities originating from individual states, not just hazardous materials at the national level. Shipment value, tons, and ton-miles, originating in the state are reported: by mode, distance, and weight of shipment; by two-digit commodity code (Standard Classification of Transported Goods - SCTG) and by mode; and by state of destination. In the SCTG section, the codes most heavily populated with hazardous materials are 17 (Gasoline and Aviation Turbine Fuel), 18 (Fuel Oils), 19 (Coal and Petroleum Products), 20 (Basic Chemicals), 23 (Chemical Products and Preparations).
Overall, the lowest level of detail in the hazardous materials section of the CFS is the state level, which on its own cannot support analyses at the regional or local level. Also, detailed information on chemicals or routes used cannot be gleaned. The latest CFS can be consulted in order to develop a good sense of the hazardous materials shipment characteristics to and from the entire state. Data from the 2002 survey and 1997 survey are available as well and can be used to identify general changes in HazMat transportation characteristics over time.
D-14
2. National Freight Transportation Statistics and Maps. Freight Management and
Operations, Federal Highway Administration (FHWA), U.S. Department of Transportation (USDOT).
Website:
http://www.ops.fhwa.dot.gov/freight/freight_analysis/nat_freight_stats/nat_stat.htm
This webpage contains several freight transportation related links, including a link to the FAF, several FAF by-products, and links to external sites, such as BTS. Freight Facts and Figures is an annual publication that culminates from the FAF data and projections, as they are updated annually. Individual sections can be viewed online (html) or it can be downloaded in its entirety in Adobe Acrobat format. It consists of tables and figures in the form of charts or maps. This publication is a “snapshot of the volume and value of freight flows in the United States, the physical network over which freight moves, the economic conditions that generate freight movements, the industry that carries freight, and the safety, energy, and environmental implications of freight transportation. This snapshot helps decision makers, planners, and the public understand the magnitude and importance of freight transportation in the economy.
Chapter 1 summarizes basic demographic and economic characteristics of the United States that contribute to the demand for raw materials, intermediate goods, and finished products. Chapter 2 identifies the freight that is moved and the trading partners who move it. Chapter 3 describes the freight transportation system; volumes of freight moving over the system; the amount of truck, train, and other activities required to move the freight; and the performance of the system. Chapter 4 highlights the transportation industry that operates the system. Chapter 5 covers the safety aspects, energy consumption, and environmental implications of freight transportation. Many of the tables and figures are based on the Economic Census, which is conducted once every five years. The most recently published data from the Economic Census are for 2002. Several of the tables and maps in this report are based on the Freight Analysis Framework (FAF), version 2.2, which builds on the Economic Census, to estimate all freight flows to, from, and within the United States except shipments between foreign countries that are transported through the United States.”
The National Freight Transportation Maps in Freight Facts and Figures are also made available independently on the main webpage for download in html, jpg, or pdf format. Freight Facts and Figures is primarily applicable to the national and sometimes regional levels. However, the main webpage provides links to freight profiles (statistics and maps) of individual states. FAF based statistics are output directly in html or pdf format, whereas external information links the user to other FHWA offices such as the Bureau of Transportation Statistics (BTS), Bureau of the Census, or state-specific websites, such as DOTs.
D-15
Additional links also provide access to other internal or external freight transportation related publications and resources, including links to the source of the freight statistics and maps, for example the FAF (FHWA), CFS (BTS), and Carload Waybill Sample (STB).
3. Freight Data and Statistics. Bureau of Transportation Statistics (BTS), Research and Innovative Technology Administration (RITA), U.S. Department of Transportation (USDOT).
Website: http://www.bts.gov/programs/freight_transportation/
The BTS website provides several publicly available reports for download. They are developed based on individual data sources or databases already discussed and are primarily based on the latest Commodity Flow Survey (2002). However, users may find access to the same freight data through the BTS portal to be more concise, concentrated, structured, and ultimately more user friendly.
4. Crash Statistics. Analysis & Information Online (A&I), Federal Motor Carrier Safety Administration (FMCSA), U.S. Department of Transportation (U.S. DOT). Website: http://ai.fmcsa.dot.gov/CrashProfile/CrashProfileMainNew.asp
Crash Statistics “are summarized crash statistics for large trucks and buses involved in
fatal and non-fatal crashes that occurred in the United States. They are derived from two databases: the Fatality Analysis Reporting System (FARS) and the Motor Carrier Management Information System (MCMIS). They are compiled through SAFETYNET, a database management system that allows entry, access, analysis, and reporting of data from driver/vehicle inspections, crashes, compliance reviews, assignments, and complaints that have been entered online by state agencies.”
Access to the actual data “is restricted to authorized users, e.g., state and federal government agencies. However, compilations of Crash Statistics data are made publicly available online. They contain information that can be used to identify safety problems in specific geographical areas or to compare state statistics to the national crash figures. The statistics are represented in state profile summaries in the following focus areas: Summary, Vehicle, Driver, Environment, Crash, Carrier, and Maps. Historical State Profiles are provided for the most recent five years and feature dynamic colorful state maps highlighting the large truck crash location data. National Crash Profile Reports (and maps) are also available online.”
The Vehicle area of the state profiles includes an HM report that summarizes crashes by presence or absence of an HM placard on the truck, by whether a release occurred or not, and by HM class (if released). The state profile summaries include total number of large trucks involved in crashes in the last five years, by county. Generally though, the lowest level of geographic detail is the state level, and the lowest level of commodity release detail is the class of HM as
D-16
opposed to chemical name. Both of which may limit support for route/local/regional analyses and emergency response plans. The PHMSA HMIRS database remains the most detailed source for hazardous materials incident data.
5. Waterborne Commerce of the United States (WCUS). Navigation Data Center (NDC), United States Army Corps of Engineers (USACE). Website: http://www.iwr.usace.army.mil/ndc/index.htm
Published annually in 5 volumes, “Volumes 1 through 4 present tonnage and ton-mile information on domestic and foreign cargo transported over waterways and through harbors on the Atlantic Coast, Gulf Coast/Mississippi River system, Great Lakes, and Pacific Coast, respectively, while Volume 5 presents national summary statistics.” All volumes are publicly available online for download through the NDC website. “All types of commodities moving in domestic waterborne commerce are covered, including more than 20 distinct chemical products. Commodity codes are unique to USACE waterborne data but the classification reflects the hierarchical structure of the Standard International Trade Classification (SITC).” Hazardous materials are not identified specifically or by chemical name by the WCSC codes, but by and large populate the Petroleum & Petroleum Products and Chemicals & Related Products categories. The USACE’s 4-digit WCSC code aggregates specific commodities into commodity groups. These 4-digit codes can be further specified using a listing of 5-digit commodity code groups found in the Commodity Code Cross Reference File provided by USACE, at www.iwr.usace.army.mil/ndc/data/datacomm.htm. Finally, the USACE has developed a cross-reference between these 5-digit codes and associated UN Hazard ID (placard number), described in Appendix C.1.
6. Lock Performance Monitoring System (LPMS). Navigation Data Center (NDC), United
States Army Corps of Engineers (USACE). Website: http://www.iwr.usace.army.mil/ndc/lpms/lpms.htm
The LPMS “contains annual commodity tonnage data for all locks on the inland
waterways. LPMS data and reports are also publicly available for download through the NDC website. In addition, Key Lock Reports are available that include monthly summaries and year-to-date totals of commodity tonnages and barge traffic for key locks.” However, commodities are aggregated into only nine classes in LPMS data and reports, an aggregated level of detail. Unlike the WCUS data the nine classes are not broken down further but hazardous materials by and large make up the commodities in the Petroleum & Petroleum Products and Chemicals & Related Products categories.
D-17
7. Vessel Company Summary-Waterborne Transportation Lines of the United States Vol. 2. Navigation Data Center (NDC), United States Army Corps of Engineers (USACE).
Website: http://www.ndc.iwr.usace.army.mil/veslchar/veslchar.htm
USACE publishes a Vessel Company Summary as part of its Waterborne Transportation
Lines of the United States report, which can be found at www.ndc.iwr.usace.army.mil/ veslchar/veslchar.htm. The summary lists vessel company names, contact information, commodities carried, locations of vessel operation, and operating fleet size. Users can identify what companies may be operating in their areas, and what products they are carrying and whether they are likely to be hazardous. These companies can then be contacted to request information on specific commodities and tonnage carried during a specific timeframes, such as a previous calendar year.

E-1
APPENDIX E
2002 VEHICLE INVENTORY AND USE SURVEY DATA
E-1
2002 VEHICLE INVENTORY AND USE SURVEY DATA U.S. Census Bureau’s 2002 Vehicle Inventory and Usage Survey (VIUS) database
collected information about truck transport of hazardous materials. These data were evaluated by Texas Transportation Institute for HazMat transport by truck types. The trucks were classified into eight different cargo body types and three different configurations. The VIUS data were evaluated to identify the national average percentage of truck miles driven while a DOT placard was required, according to type and size classification. The Census Bureau’s recommended mileage weighting was used to identify the national averages. It should be noted that this information, presented in the Tables E.1 through E.5, does not include confidence intervals that reflect data variation due to sampling. Decimals are rounded up to the next integer (e.g., both 2.23% and 2.28% are rounded up to 2.3%). Notes for all tables are provided after Table E.6.
E.1 VEHICLE TYPES
Based on the evaluation of the 2002 VIUS data, the truck cargo body type classifications are identified as relevant to differences in HazMat transportation:
• liquid/gas tank trucks; Note: designation of shipping container chassis configurations was not included in the 2002 VIUS. We assume ISO tank containers to correspond to liquid/gas tanks;
• vacuum tank trucks; • dry bulk tank trucks; • ‘standard’ van box trucks, including basic enclosed, drop frame, step, walk-in,
multistop, open top, and other box trucks, and Curtainside trucks (which appear similar to standard van box trucks). Note: designation of shipping container chassis configurations was not included in the 2002 VIUS. We assume these to correspond to van configurations, with the exception of ISO tank containers which we assume to correspond to liquid/gas tanks;
• refrigerated van trucks; • utility and other service trucks; • flatbed, stake, and platform, etc. trucks; and • other truck types, including trash, garbage, or recycling, dump, concrete mixer,
concrete pumper, low boy, crane, pole, logging, pulpwood, or pipe, beverage, livestock, and other trucks not classified above.

E-2
E.2 VEHICLE CONFIGURATIONS
Truck configurations are classified into three categories based on the 2002 VIUS data: straight trucks, tractor-trailers (also including straight trucks with a trailer), and tractors with multiple trailers.
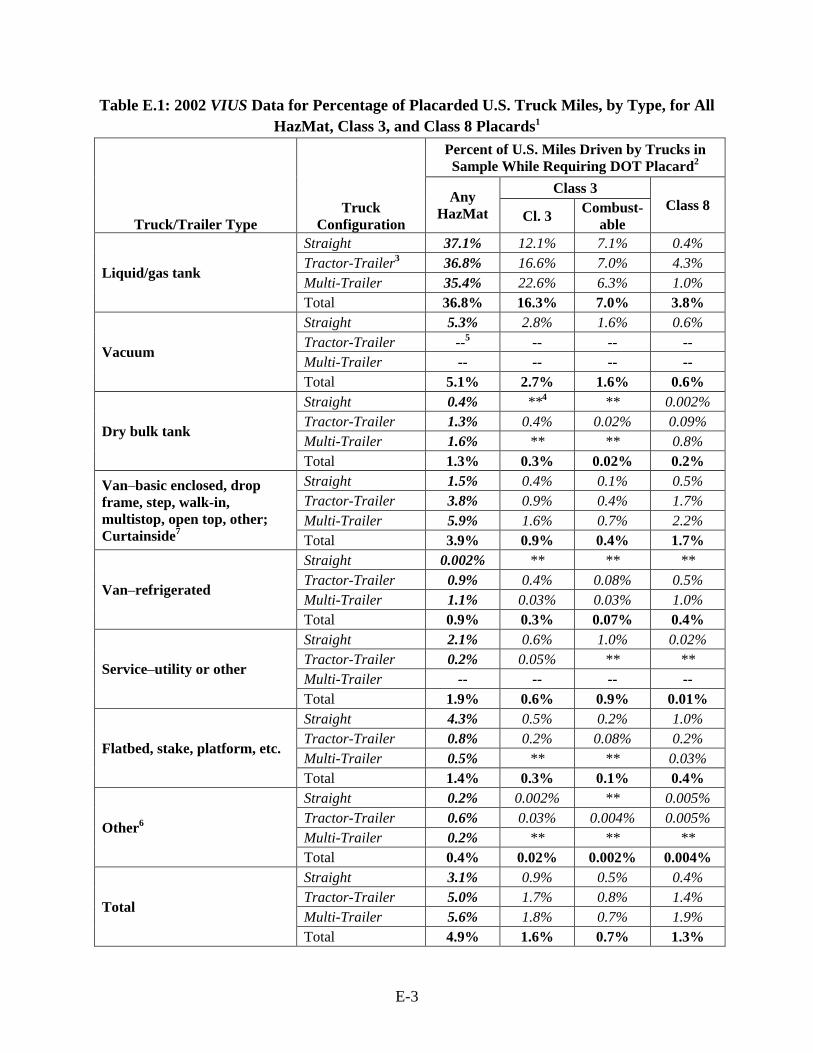
E-3
Table E.1: 2002 VIUS Data for Percentage of Placarded U.S. Truck Miles, by Type, for All HazMat, Class 3, and Class 8 Placards1
Truck/Trailer Type Truck
Configuration
Percent of U.S. Miles Driven by Trucks in Sample While Requiring DOT Placard2
Any HazMat
Class 3 Class 8
Cl. 3 Combust-able
Liquid/gas tank
Straight 37.1% 12.1% 7.1% 0.4% Tractor-Trailer3 36.8% 16.6% 7.0% 4.3% Multi-Trailer 35.4% 22.6% 6.3% 1.0% Total 36.8% 16.3% 7.0% 3.8%
Vacuum
Straight 5.3% 2.8% 1.6% 0.6% Tractor-Trailer --5 -- -- -- Multi-Trailer -- -- -- -- Total 5.1% 2.7% 1.6% 0.6%
Dry bulk tank
Straight 0.4% **4 ** 0.002% Tractor-Trailer 1.3% 0.4% 0.02% 0.09% Multi-Trailer 1.6% ** ** 0.8% Total 1.3% 0.3% 0.02% 0.2%
Van–basic enclosed, drop frame, step, walk-in, multistop, open top, other; Curtainside7
Straight 1.5% 0.4% 0.1% 0.5% Tractor-Trailer 3.8% 0.9% 0.4% 1.7% Multi-Trailer 5.9% 1.6% 0.7% 2.2% Total 3.9% 0.9% 0.4% 1.7%
Van–refrigerated
Straight 0.002% ** ** ** Tractor-Trailer 0.9% 0.4% 0.08% 0.5% Multi-Trailer 1.1% 0.03% 0.03% 1.0% Total 0.9% 0.3% 0.07% 0.4%
Service–utility or other
Straight 2.1% 0.6% 1.0% 0.02% Tractor-Trailer 0.2% 0.05% ** ** Multi-Trailer -- -- -- -- Total 1.9% 0.6% 0.9% 0.01%
Flatbed, stake, platform, etc.
Straight 4.3% 0.5% 0.2% 1.0% Tractor-Trailer 0.8% 0.2% 0.08% 0.2% Multi-Trailer 0.5% ** ** 0.03% Total 1.4% 0.3% 0.1% 0.4%
Other6
Straight 0.2% 0.002% ** 0.005% Tractor-Trailer 0.6% 0.03% 0.004% 0.005% Multi-Trailer 0.2% ** ** ** Total 0.4% 0.02% 0.002% 0.004%
Total
Straight 3.1% 0.9% 0.5% 0.4% Tractor-Trailer 5.0% 1.7% 0.8% 1.4% Multi-Trailer 5.6% 1.8% 0.7% 1.9% Total 4.9% 1.6% 0.7% 1.3%
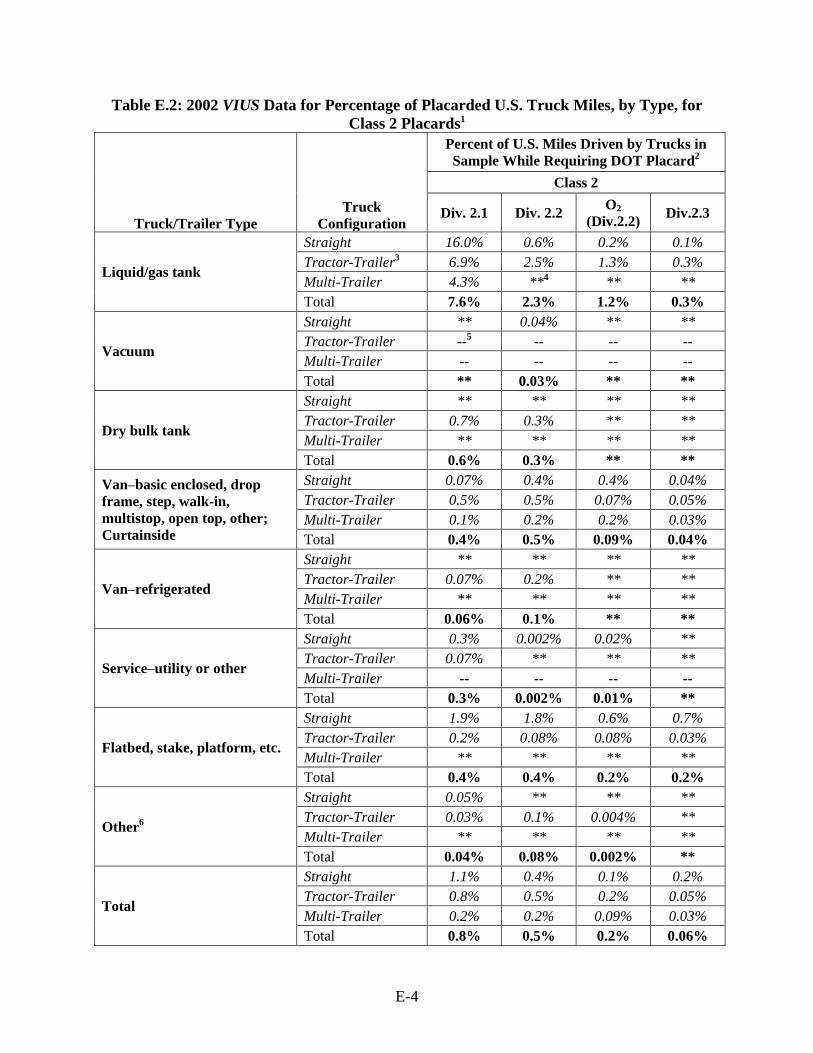
E-4
Table E.2: 2002 VIUS Data for Percentage of Placarded U.S. Truck Miles, by Type, for Class 2 Placards1
Truck/Trailer Type Truck
Configuration
Percent of U.S. Miles Driven by Trucks in Sample While Requiring DOT Placard2
Class 2
Div. 2.1 Div. 2.2 O2 (Div.2.2) Div.2.3
Liquid/gas tank
Straight 16.0% 0.6% 0.2% 0.1% Tractor-Trailer3 6.9% 2.5% 1.3% 0.3% Multi-Trailer 4.3% **4 ** ** Total 7.6% 2.3% 1.2% 0.3%
Vacuum
Straight ** 0.04% ** ** Tractor-Trailer --5 -- -- -- Multi-Trailer -- -- -- -- Total ** 0.03% ** **
Dry bulk tank
Straight ** ** ** ** Tractor-Trailer 0.7% 0.3% ** ** Multi-Trailer ** ** ** ** Total 0.6% 0.3% ** **
Van–basic enclosed, drop frame, step, walk-in, multistop, open top, other; Curtainside
Straight 0.07% 0.4% 0.4% 0.04% Tractor-Trailer 0.5% 0.5% 0.07% 0.05% Multi-Trailer 0.1% 0.2% 0.2% 0.03% Total 0.4% 0.5% 0.09% 0.04%
Van–refrigerated
Straight ** ** ** ** Tractor-Trailer 0.07% 0.2% ** ** Multi-Trailer ** ** ** ** Total 0.06% 0.1% ** **
Service–utility or other
Straight 0.3% 0.002% 0.02% ** Tractor-Trailer 0.07% ** ** ** Multi-Trailer -- -- -- -- Total 0.3% 0.002% 0.01% **
Flatbed, stake, platform, etc.
Straight 1.9% 1.8% 0.6% 0.7% Tractor-Trailer 0.2% 0.08% 0.08% 0.03% Multi-Trailer ** ** ** ** Total 0.4% 0.4% 0.2% 0.2%
Other6
Straight 0.05% ** ** ** Tractor-Trailer 0.03% 0.1% 0.004% ** Multi-Trailer ** ** ** ** Total 0.04% 0.08% 0.002% **
Total
Straight 1.1% 0.4% 0.1% 0.2% Tractor-Trailer 0.8% 0.5% 0.2% 0.05% Multi-Trailer 0.2% 0.2% 0.09% 0.03% Total 0.8% 0.5% 0.2% 0.06%
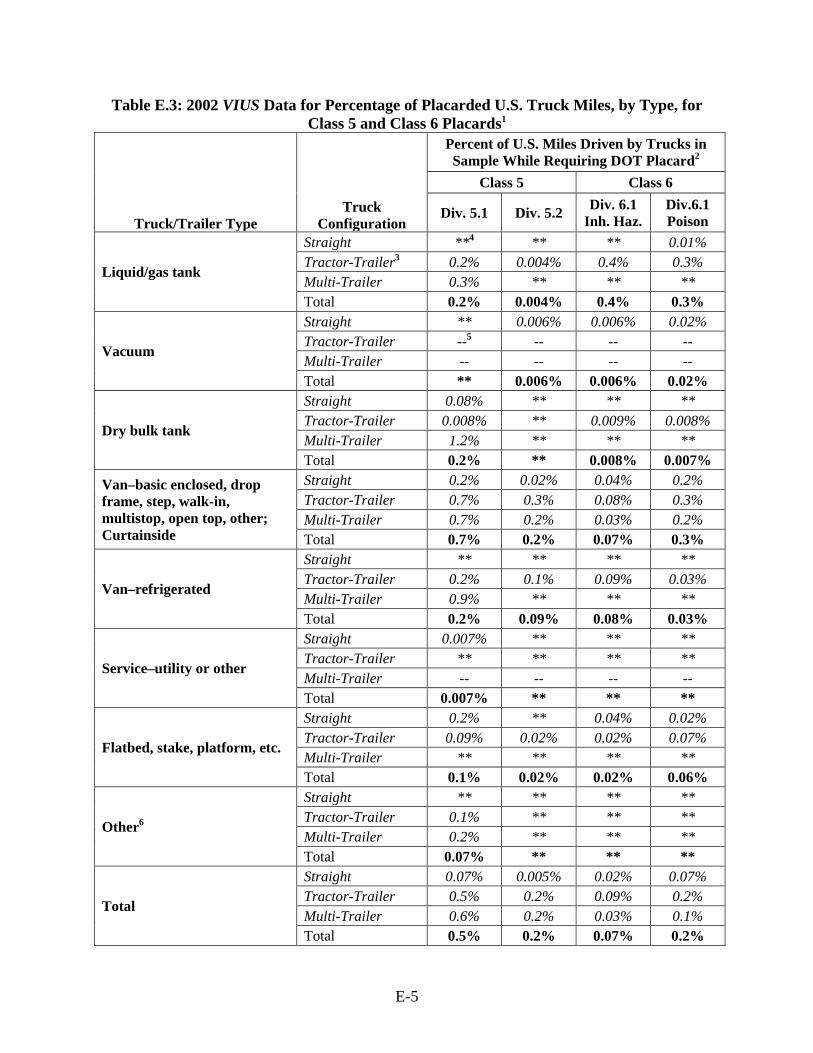
E-5
Table E.3: 2002 VIUS Data for Percentage of Placarded U.S. Truck Miles, by Type, for Class 5 and Class 6 Placards1
Truck/Trailer Type Truck
Configuration
Percent of U.S. Miles Driven by Trucks in Sample While Requiring DOT Placard2
Class 5 Class 6
Div. 5.1 Div. 5.2 Div. 6.1 Inh. Haz.
Div.6.1 Poison
Liquid/gas tank
Straight **4 ** ** 0.01% Tractor-Trailer3 0.2% 0.004% 0.4% 0.3% Multi-Trailer 0.3% ** ** ** Total 0.2% 0.004% 0.4% 0.3%
Vacuum
Straight ** 0.006% 0.006% 0.02% Tractor-Trailer --5 -- -- -- Multi-Trailer -- -- -- -- Total ** 0.006% 0.006% 0.02%
Dry bulk tank
Straight 0.08% ** ** ** Tractor-Trailer 0.008% ** 0.009% 0.008% Multi-Trailer 1.2% ** ** ** Total 0.2% ** 0.008% 0.007%
Van–basic enclosed, drop frame, step, walk-in, multistop, open top, other; Curtainside
Straight 0.2% 0.02% 0.04% 0.2% Tractor-Trailer 0.7% 0.3% 0.08% 0.3% Multi-Trailer 0.7% 0.2% 0.03% 0.2% Total 0.7% 0.2% 0.07% 0.3%
Van–refrigerated
Straight ** ** ** ** Tractor-Trailer 0.2% 0.1% 0.09% 0.03% Multi-Trailer 0.9% ** ** ** Total 0.2% 0.09% 0.08% 0.03%
Service–utility or other
Straight 0.007% ** ** ** Tractor-Trailer ** ** ** ** Multi-Trailer -- -- -- -- Total 0.007% ** ** **
Flatbed, stake, platform, etc.
Straight 0.2% ** 0.04% 0.02% Tractor-Trailer 0.09% 0.02% 0.02% 0.07% Multi-Trailer ** ** ** ** Total 0.1% 0.02% 0.02% 0.06%
Other6
Straight ** ** ** ** Tractor-Trailer 0.1% ** ** ** Multi-Trailer 0.2% ** ** ** Total 0.07% ** ** **
Total
Straight 0.07% 0.005% 0.02% 0.07% Tractor-Trailer 0.5% 0.2% 0.09% 0.2% Multi-Trailer 0.6% 0.2% 0.03% 0.1% Total 0.5% 0.2% 0.07% 0.2%
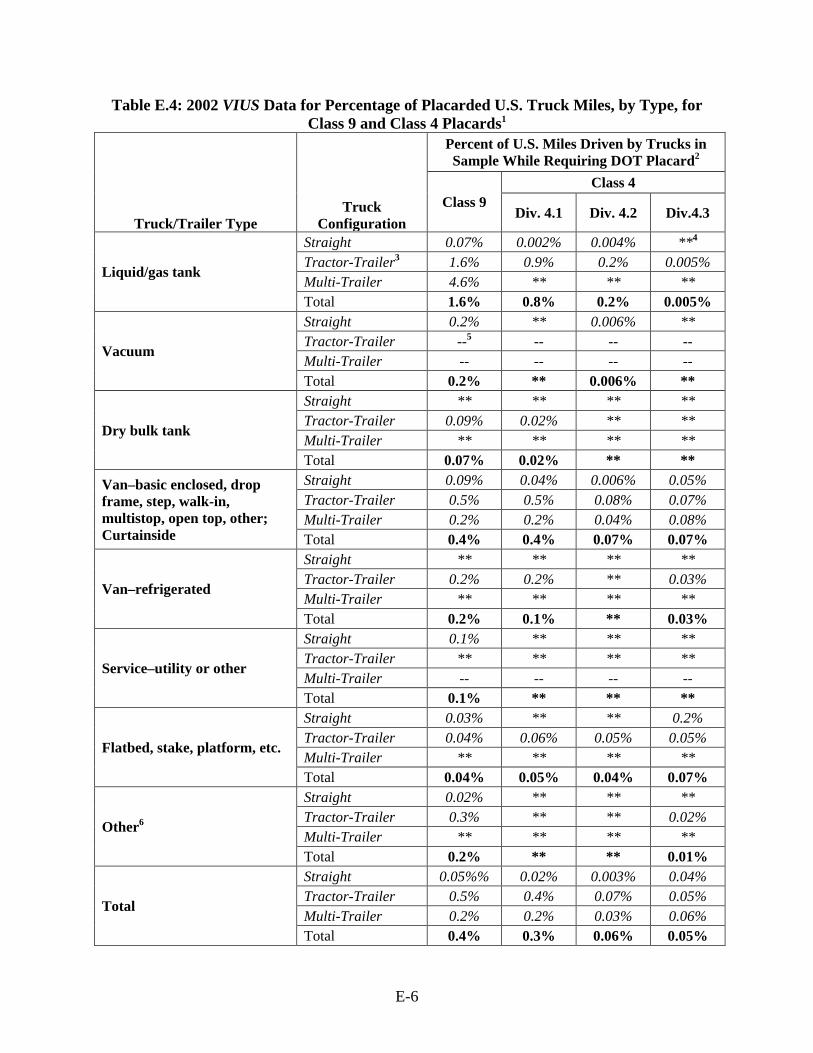
E-6
Table E.4: 2002 VIUS Data for Percentage of Placarded U.S. Truck Miles, by Type, for Class 9 and Class 4 Placards1
Truck/Trailer Type Truck
Configuration
Percent of U.S. Miles Driven by Trucks in Sample While Requiring DOT Placard2
Class 9 Class 4
Div. 4.1 Div. 4.2 Div.4.3
Liquid/gas tank
Straight 0.07% 0.002% 0.004% **4 Tractor-Trailer3 1.6% 0.9% 0.2% 0.005% Multi-Trailer 4.6% ** ** ** Total 1.6% 0.8% 0.2% 0.005%
Vacuum
Straight 0.2% ** 0.006% ** Tractor-Trailer --5 -- -- -- Multi-Trailer -- -- -- -- Total 0.2% ** 0.006% **
Dry bulk tank
Straight ** ** ** ** Tractor-Trailer 0.09% 0.02% ** ** Multi-Trailer ** ** ** ** Total 0.07% 0.02% ** **
Van–basic enclosed, drop frame, step, walk-in, multistop, open top, other; Curtainside
Straight 0.09% 0.04% 0.006% 0.05% Tractor-Trailer 0.5% 0.5% 0.08% 0.07% Multi-Trailer 0.2% 0.2% 0.04% 0.08% Total 0.4% 0.4% 0.07% 0.07%
Van–refrigerated
Straight ** ** ** ** Tractor-Trailer 0.2% 0.2% ** 0.03% Multi-Trailer ** ** ** ** Total 0.2% 0.1% ** 0.03%
Service–utility or other
Straight 0.1% ** ** ** Tractor-Trailer ** ** ** ** Multi-Trailer -- -- -- -- Total 0.1% ** ** **
Flatbed, stake, platform, etc.
Straight 0.03% ** ** 0.2% Tractor-Trailer 0.04% 0.06% 0.05% 0.05% Multi-Trailer ** ** ** ** Total 0.04% 0.05% 0.04% 0.07%
Other6
Straight 0.02% ** ** ** Tractor-Trailer 0.3% ** ** 0.02% Multi-Trailer ** ** ** ** Total 0.2% ** ** 0.01%
Total
Straight 0.05%% 0.02% 0.003% 0.04% Tractor-Trailer 0.5% 0.4% 0.07% 0.05% Multi-Trailer 0.2% 0.2% 0.03% 0.06% Total 0.4% 0.3% 0.06% 0.05%
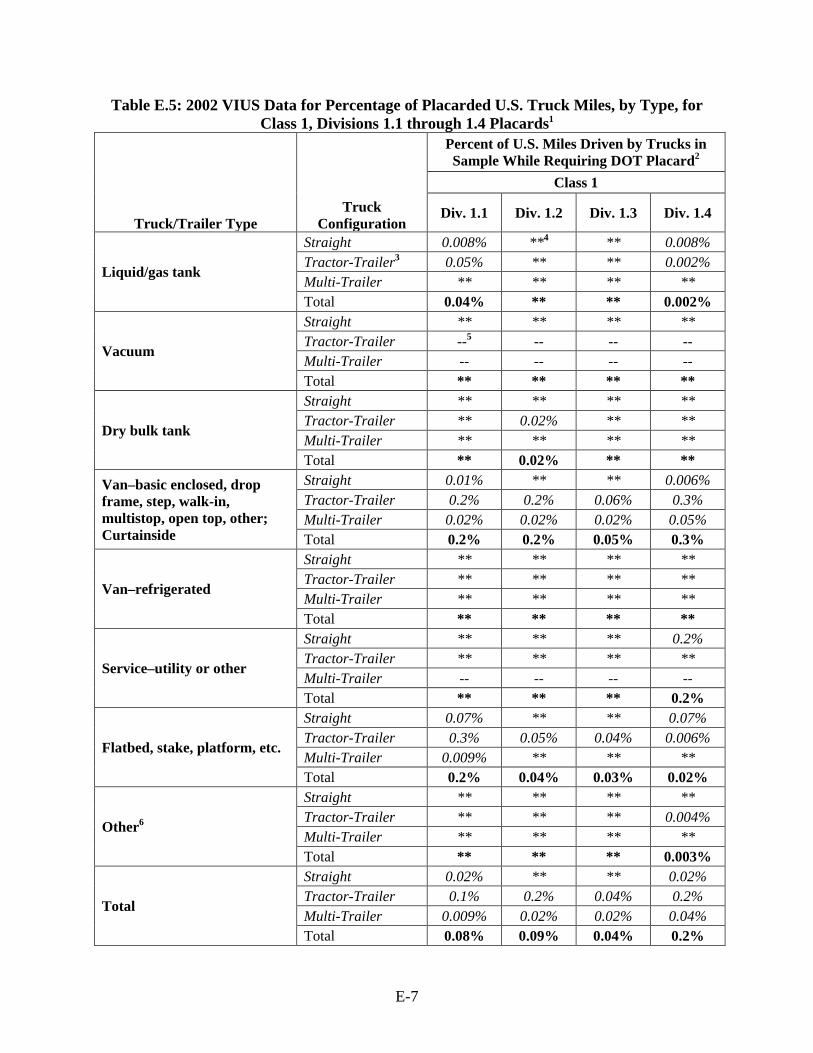
E-7
Table E.5: 2002 VIUS Data for Percentage of Placarded U.S. Truck Miles, by Type, for Class 1, Divisions 1.1 through 1.4 Placards1
Truck/Trailer Type Truck
Configuration
Percent of U.S. Miles Driven by Trucks in Sample While Requiring DOT Placard2
Class 1
Div. 1.1 Div. 1.2 Div. 1.3 Div. 1.4
Liquid/gas tank
Straight 0.008% **4 ** 0.008% Tractor-Trailer3 0.05% ** ** 0.002% Multi-Trailer ** ** ** ** Total 0.04% ** ** 0.002%
Vacuum
Straight ** ** ** ** Tractor-Trailer --5 -- -- -- Multi-Trailer -- -- -- -- Total ** ** ** **
Dry bulk tank
Straight ** ** ** ** Tractor-Trailer ** 0.02% ** ** Multi-Trailer ** ** ** ** Total ** 0.02% ** **
Van–basic enclosed, drop frame, step, walk-in, multistop, open top, other; Curtainside
Straight 0.01% ** ** 0.006% Tractor-Trailer 0.2% 0.2% 0.06% 0.3% Multi-Trailer 0.02% 0.02% 0.02% 0.05% Total 0.2% 0.2% 0.05% 0.3%
Van–refrigerated
Straight ** ** ** ** Tractor-Trailer ** ** ** ** Multi-Trailer ** ** ** ** Total ** ** ** **
Service–utility or other
Straight ** ** ** 0.2% Tractor-Trailer ** ** ** ** Multi-Trailer -- -- -- -- Total ** ** ** 0.2%
Flatbed, stake, platform, etc.
Straight 0.07% ** ** 0.07% Tractor-Trailer 0.3% 0.05% 0.04% 0.006% Multi-Trailer 0.009% ** ** ** Total 0.2% 0.04% 0.03% 0.02%
Other6
Straight ** ** ** ** Tractor-Trailer ** ** ** 0.004% Multi-Trailer ** ** ** ** Total ** ** ** 0.003%
Total
Straight 0.02% ** ** 0.02% Tractor-Trailer 0.1% 0.2% 0.04% 0.2% Multi-Trailer 0.009% 0.02% 0.02% 0.04% Total 0.08% 0.09% 0.04% 0.2%
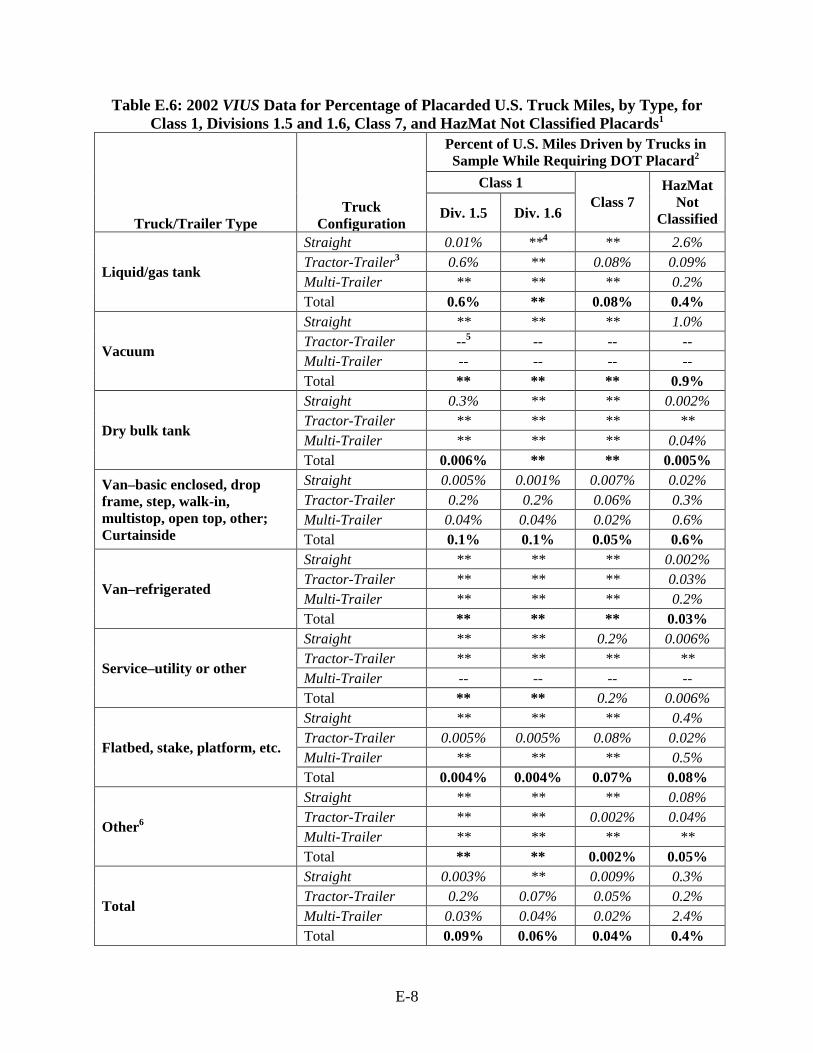
E-8
Table E.6: 2002 VIUS Data for Percentage of Placarded U.S. Truck Miles, by Type, for Class 1, Divisions 1.5 and 1.6, Class 7, and HazMat Not Classified Placards1
Truck/Trailer Type Truck
Configuration
Percent of U.S. Miles Driven by Trucks in Sample While Requiring DOT Placard2
Class 1 Class 7
HazMat Not
Classified Div. 1.5 Div. 1.6
Liquid/gas tank
Straight 0.01% **4 ** 2.6% Tractor-Trailer3 0.6% ** 0.08% 0.09% Multi-Trailer ** ** ** 0.2% Total 0.6% ** 0.08% 0.4%
Vacuum
Straight ** ** ** 1.0% Tractor-Trailer --5 -- -- -- Multi-Trailer -- -- -- -- Total ** ** ** 0.9%
Dry bulk tank
Straight 0.3% ** ** 0.002% Tractor-Trailer ** ** ** ** Multi-Trailer ** ** ** 0.04% Total 0.006% ** ** 0.005%
Van–basic enclosed, drop frame, step, walk-in, multistop, open top, other; Curtainside
Straight 0.005% 0.001% 0.007% 0.02% Tractor-Trailer 0.2% 0.2% 0.06% 0.3% Multi-Trailer 0.04% 0.04% 0.02% 0.6% Total 0.1% 0.1% 0.05% 0.6%
Van–refrigerated
Straight ** ** ** 0.002% Tractor-Trailer ** ** ** 0.03% Multi-Trailer ** ** ** 0.2% Total ** ** ** 0.03%
Service–utility or other
Straight ** ** 0.2% 0.006% Tractor-Trailer ** ** ** ** Multi-Trailer -- -- -- -- Total ** ** 0.2% 0.006%
Flatbed, stake, platform, etc.
Straight ** ** ** 0.4% Tractor-Trailer 0.005% 0.005% 0.08% 0.02% Multi-Trailer ** ** ** 0.5% Total 0.004% 0.004% 0.07% 0.08%
Other6
Straight ** ** ** 0.08% Tractor-Trailer ** ** 0.002% 0.04% Multi-Trailer ** ** ** ** Total ** ** 0.002% 0.05%
Total
Straight 0.003% ** 0.009% 0.3% Tractor-Trailer 0.2% 0.07% 0.05% 0.2% Multi-Trailer 0.03% 0.04% 0.02% 2.4% Total 0.09% 0.06% 0.04% 0.4%
E-9
Notes for Tables E.1 through E.6:
1. Percentages calculated by TTI using U.S. Census Bureau 2002 Vehicle Inventory and Use Survey microdata.
2. Not the percentage of trucks with a HazMat placard. 3. Includes straight trucks with trailers 4. Less than 0.001%, or one in ten-thousand. 5. Insufficient information in survey. 6. Includes: dump; low boy; automobile carrier; trailer-mounted equipment; beverage;
livestock; mobile home toter; pole, logging, pulpwood, or pipe; trash garbage, or recycling; concrete mixer or pumper; crane; tow/wrecker; tractor only; and other-not-elsewhere-classified truck and truck body configurations.

F-1
APPENDIX F
SAMPLE RAILROAD DATA REQUEST FORM

F-2
[Company LOGO]
REQUEST FOR HAZARDOUS MATERIALS COMMODITY FLOW INFORMATION Organization Requesting Information: _______________________________________ Contact Person: _______________________________________________ Phone Number: _______________________________________________ Email Address: _______________________________________________ Mailing Address: _______________________________________________________ (Street Address) ___________________________________________________ (City, State, Zip) Geographical Description of Area for study: _________________________________________ _____________________________________________________________________________ Preferred method to receive report: £ Email £ U.S. Mail (Mark One)
By signing below I acknowledge and agree to the terms set forth by [RAILROAD NAME] for use and dissemination of the [RAILROAD’S] Hazardous Materials Commodity Flow Information. [RAILROAD’S NAME] considers this information to be restricted information of a security sensitive nature. I thus affirm and agree that the information provided by [RAILROAD NAME] in this report will be used solely for and by bona fide emergency planning and response organizations for the expressed purpose of emergency and contingency planning. This information will not be distributed publicly in whole or in part without the expressed written permission of [RAILROAD NAME]. (Signature of person requesting commodity flow information) Return Completed Form to: [INSERT RAILROAD NAME AND ADDRESS] For [RAILROAD] Use Only [PERSON RESPONSIBLE FOR APPROVAL]: ___Yes___ NO Date: __________ Hazardous Materials Service Support:
Date Request Received:
Time Period Covered: Date Report Sent: Report sent via: £ Email £ U.S. Mail

G-1
APPENDIX G
WATERWAY DATA ANALYSIS USING USACE COMMODITY AND HAZMAT CODES
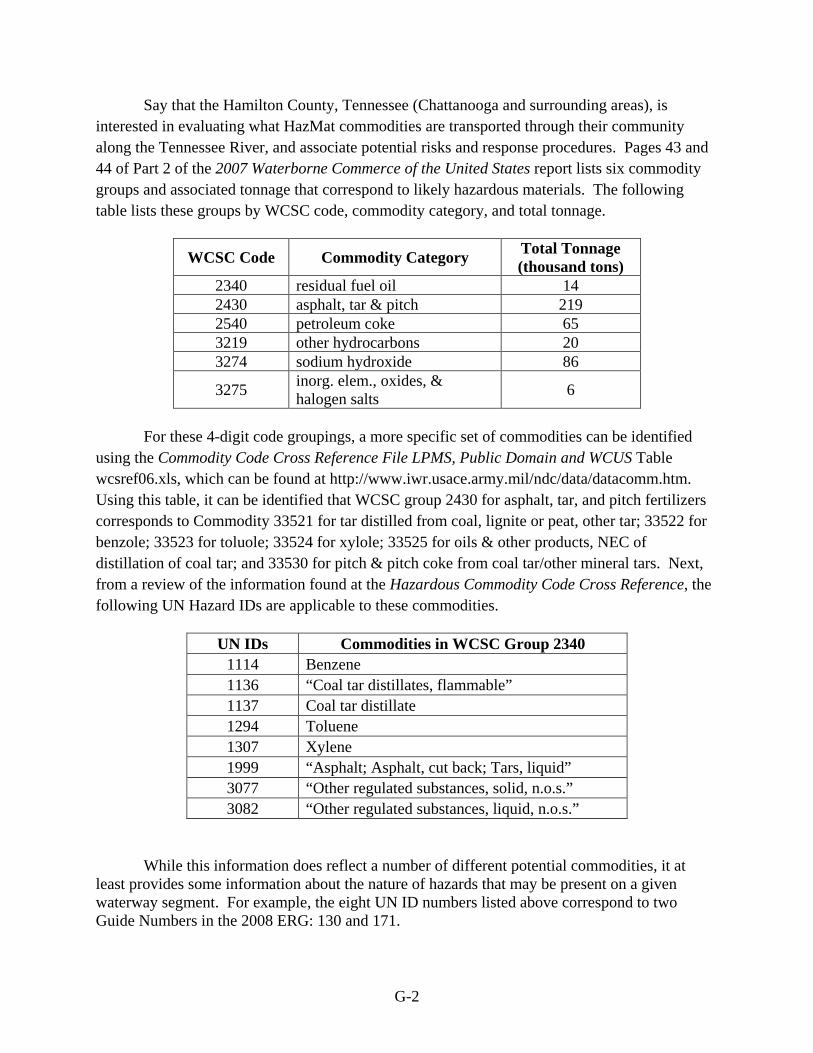
G-2
Say that the Hamilton County, Tennessee (Chattanooga and surrounding areas), is interested in evaluating what HazMat commodities are transported through their community along the Tennessee River, and associate potential risks and response procedures. Pages 43 and 44 of Part 2 of the 2007 Waterborne Commerce of the United States report lists six commodity groups and associated tonnage that correspond to likely hazardous materials. The following table lists these groups by WCSC code, commodity category, and total tonnage.
WCSC Code Commodity Category Total Tonnage (thousand tons)
2340 residual fuel oil 14 2430 asphalt, tar & pitch 219 2540 petroleum coke 65 3219 other hydrocarbons 20 3274 sodium hydroxide 86
3275 inorg. elem., oxides, & halogen salts 6
For these 4-digit code groupings, a more specific set of commodities can be identified
using the Commodity Code Cross Reference File LPMS, Public Domain and WCUS Table wcsref06.xls, which can be found at http://www.iwr.usace.army.mil/ndc/data/datacomm.htm. Using this table, it can be identified that WCSC group 2430 for asphalt, tar, and pitch fertilizers corresponds to Commodity 33521 for tar distilled from coal, lignite or peat, other tar; 33522 for benzole; 33523 for toluole; 33524 for xylole; 33525 for oils & other products, NEC of distillation of coal tar; and 33530 for pitch & pitch coke from coal tar/other mineral tars. Next, from a review of the information found at the Hazardous Commodity Code Cross Reference, the following UN Hazard IDs are applicable to these commodities.
UN IDs Commodities in WCSC Group 2340 1114 Benzene 1136 “Coal tar distillates, flammable” 1137 Coal tar distillate 1294 Toluene 1307 Xylene 1999 “Asphalt; Asphalt, cut back; Tars, liquid” 3077 “Other regulated substances, solid, n.o.s.” 3082 “Other regulated substances, liquid, n.o.s.”
While this information does reflect a number of different potential commodities, it at least provides some information about the nature of hazards that may be present on a given waterway segment. For example, the eight UN ID numbers listed above correspond to two Guide Numbers in the 2008 ERG: 130 and 171.
H-1
APPENDIX H
CDPS TRUCK/HAZMAT COUNT TABULATION SHEETS
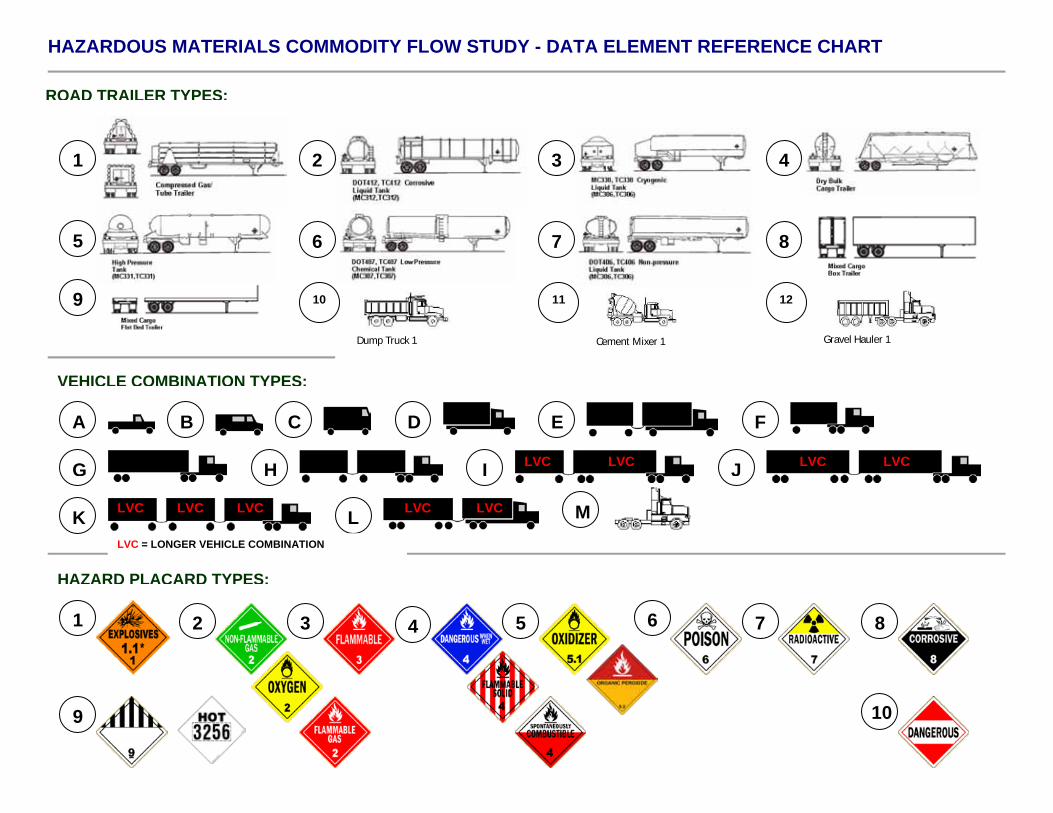
HAZARDOUS MATERIALS COMMODITY FLOW STUDY - DATA ELEMENT REFERENCE CHART
1 4
7
2
5
8
3
6
9
A B C D E F
G H I J
K L
ROAD TRAILER TYPES:
VEHICLE COMBINATION TYPES:
HAZARD PLACARD TYPES:
1 2 3 4 5 6 8 7
9 10
LVC LVC LVC LVC
LVC LVC LVC LVC LVC
LVC = LONGER VEHICLE COMBINATION
10 11 12
Dump Truck 1
Cement Mixer 1
Gravel Hauler 1
M
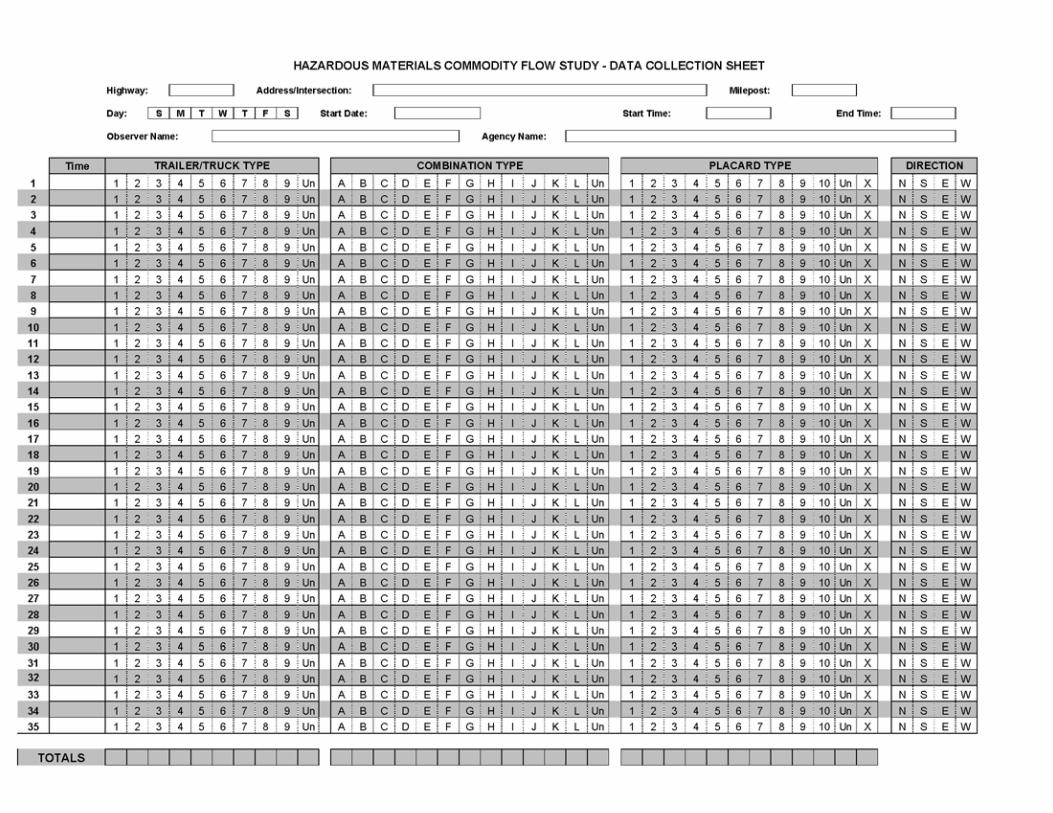


I-1
APPENDIX I
TRUCK/HAZMAT COUNT TABULATION SHEET FOR VIUS CARGO BODY TYPE, SIZE AND WEIGHT CLASSIFICATIONS
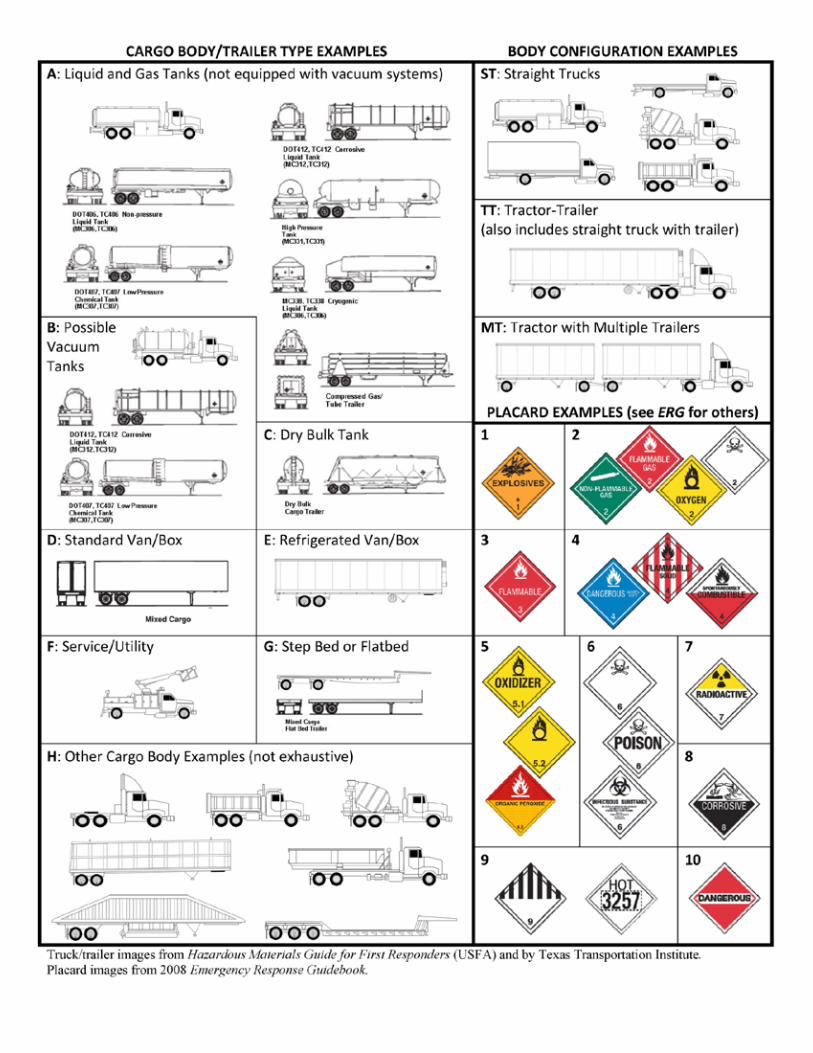
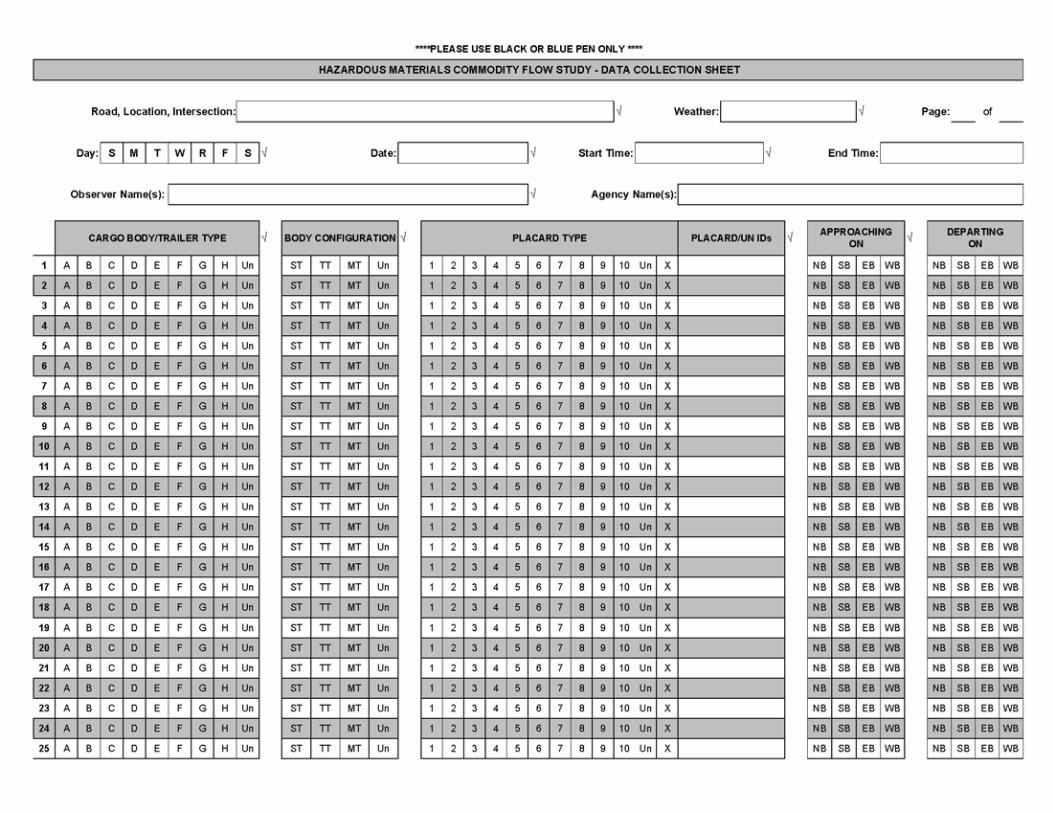

240
REFERENCES
1) Superfund Amendments and Reauthorization Act of 1986. U.S. House of Representatives Code Title 42, Chapter 103.
2) Emergency Management, Emergency Planning and Community Right-to-Know Act (EPCRA) Local Emergency Planning Requirements. U.S. Environmental Protection Agency. http://www.epa.gov. Accessed October 2008.
3) Office of Solid Waste and Emergency Response, Fact Sheet: The Emergency Planning and Community Right-to-Know Act. EPA 550-F-00-004, March 2000.
4) Local Emergency Planning Committee (LEPC) Primer for Local Planning for Hazardous Materials, Texas Handbook for LEPCs. Texas Governor’s Division of Emergency Management, July 2006.
5) Comprehensive Emergency Response Plans. U.S. House of Representatives Code Title 42, Chapter 116, Subchapter I, Section 11003.
6) Pipeline and Hazardous Materials Safety Administration, U.S. Department of Transportation. Part 105—Hazardous Materials Program Definitions and General Procedures: Subpart A—General Definitions: Hazardous material. 49 CFR, Part 105.5(b).
7) Hazardous Materials Emergency Planning Guide. Report Number NRT-1, National Response Team. March 1987.
8) Pipeline and Hazardous Materials Safety Administration, U.S. Department of Transportation. Part 173—Shippers—General Requirements for Shipments and Packagings: Subpart —General: Hazardous materials classes and index to hazard class definitions. 49 CFR, Part 173.2.
9) Cloutier, M., and G. Cushmac. 2008 Emergency Response Guidebook: A Guidebook for First Responders During the Initial Phase of a Dangerous Goods/Hazardous Materials Transportation Incident. Office of Hazardous Materials Initiatives and Training, Pipeline and Hazardous Materials Safety Administration, U.S. Department of Transportation, 2008.
10) United States: 2007 Commodity Flow Survey. Bureau of Transportation Statistics, U.S. Department of Transportation, and Economics and Statistics Administration, U.S. Census Bureau, U.S. Department of Commerce, December 2009. http://www.bts.gov/publications/commodity_flow_survey/. Accessed March 2010.
11) Hazardous Materials Information System Incident Reports Database. Office of Hazardous Materials Safety, Pipeline and Hazardous Materials Administration, U.S. Department of Transportation.
241
12) Technical Guide for Hazards Analysis. U.S. Environmental Protection Agency, Federal Emergency Management Agency, and U.S. Department of Transportation, December 1987.
13) Transportation Research Board. Special Report 239—Hazardous Materials Shipment Information for Emergency Response. Transportation Research Board of the National Academies. Washington, D.C., 2005.
14) Hazardous Materials Guide for First Responders. U.S. Fire Administration, Federal Emergency Management Administration, U.S. Department of Homeland Security, 1998.
15) Hazards Analysis on the Move. Report Number EPA 550-F-93-004.U.S. Environmental Protection Agency, Office of Solid Waste and Emergency Response, October 1993.
16) ICF, Inc. Guidance for Conducting Hazardous Materials Flow Surveys. Report DOT-VNTSC-RSPA-94-2. Research and Special Programs Administration, U.S. Department of Transportation, January 1995.
17) Comprehensive Preparedness Guide (CPG) 101: Developing and Maintaining State, Territorial, Tribal, and Local Government Emergency Plans. Federal Emergency Management Agency, U.S. Department of Homeland Security, March 2009.
18) Special Report 283 – Cooperative Research for Hazardous Materials Transportation: Defining the Need, Converging on Solutions. Transportation Research Board of the National Academies. Washington, D.C., 2005.
19) Pipeline and Hazardous Materials Safety Administration, U.S. Department of Transportation. Hazardous Materials Public Sector Training and Planning Grants: Activities eligible for funding. 49 CFR, Part 110.40, 2001.
20) Grants. U.S. Department of Transportation, Pipeline and Hazardous Materials Safety Administration. http://www.phmsa.dot.gov/hazmat/grants. Accessed April 2010.
21) 2008 Nationwide Survey of Local Emergency Planning Committees (LEPCs): Final Report. U.S. Environmental Protection Agency. http://www.epa.gov/OEM/docs/chem/ 2008_lepcsurv.pdf. Accessed June 2009.
22) Erten-Unal, M., Ozdural, P., and S. Paranjape. Final Report on Hazardous Materials Commodity Flow Study for the Peninsula Local Emergency Planning Committee. Department of Civil and Environmental Engineering, Old Dominion University, September 2002.
23) Commodity Flow Study, Southern and Western Windsor County. Local Emergency Planning Committee #3, Vermont, 2006.
24) Lewis/Upshur LEPC Commodity Flow Study. Lewis/Upshur Counties LEPC, West Virginia, 2006.
242
25) AMEC Earth & Environmental, Inc. Hazardous Materials Commodity Flow Study Report; US 60 and US 70 Corridors, Arterial Highways, and Railroads; Gila, Navajo, Apache, Graham, and Greenlee Counties, Arizona. Arizona State Emergency Response Commission, Arizona Division of Emergency Management, May 8, 2008.
26) Hazardous Commodity Flow Study. Cambria County Emergency Management, Pennsylvania, 2008.
27) Bierling, D.H., Proctor, E.N., Land, A.M., Jasek, D.L., Olson, L.E., and J.R. Weinberger. Hazardous Materials Commodity Flow Study: Victoria County, Texas. Texas Transportation Institute, The Texas A&M University System, December 2009.
28) Noll, G.S., M.S. Hildebrand, and J. Yvorra. Hazardous Materials: Managing the Incident, 3rd. Ed. Red Hat Publishing Company, Inc. Chester, MA, 2005.
29) Federal Motor Carrier Safety Administration, U.S. Department of Transportation. Transportation of Hazardous Materials; Driving and Parking Rules: Federal standards. 49 CFR, Part 397.
30) Highway Routing of Hazardous Materials: Guidelines for Applying Criteria. Publication Number FHWA-HI-97-003. National Highway Institute, Federal Highway Administration, U.S. Department of Transportation, 1996.
31) Emergency Planning and Community Right-To-Know Act (EPCRA). U.S. Environmental Protection Agency. http://epa.gov/oecaagct/lcra.html. Accessed July 2009.
32) The Petroleum Marketers Association of America. EPA-EPCRA Tier II Reporting: Compliance Deadline for Annual EPCRA Tier II Reporting. http://www.pmaa.org/ userfiles/file/Regulatory/2009/Regulatory%20Reports/February%2013,%202009%20-%20EPCRA%20Tier%20II%20 Reporting%20EPA_GEN_1.pdf. Accessed July 2009.
33) Recommended Railroad Operating Practices for Transportation of Hazardous Materials. Circular No. OT-55-J. Association of American Railroads. March 17, 2009.
34) Hazards U.S. Multi-Hazard (HAZUS-MH) Software. Federal Emergency Management Administration, U.S. Department of Homeland Security.
35) Freight Analysis Framework (FAF 2.2). Freight Management and Operations, Federal Highway Administration, U.S. Department of Transportation.
36) National Transportation Atlas Database (NTAD). Bureau of Transportation Statistics, Research and Innovative Technology Administration, U.S. Department of Transportation.
37) The National Hazardous Materials Route Registry and Route Maps. Federal Motor Carrier Safety Administration, U.S. Department of Transportation.
38) Highway Performance Monitoring System (HPMS). Office of Highway Policy Information, Federal Highway Administration, U.S. Department of Transportation.
243
39) National Pipeline Mapping System (NPMS). Office of Pipeline Safety, Pipeline and Hazardous Materials Safety Administration, U.S. Department of Transportation.
40) Waterborne Commerce of the United States (WCUS). Navigation Data Center, United States Army Corps of Engineers.
41) Lock Performance Monitoring System (LPMS). Navigation Data Center, United States Army Corps of Engineers.
42) Freight Data and Statistics. Bureau of Transportation Statistics, Research and Innovative Technology Administration, U.S. Department of Transportation.
43) 2002 Vehicle Inventory and Use Survey. Transportation Characteristics Branch, Service Sector Statistics Division, U.S. Census Bureau.
44) Carload Waybill Sample. Surface Transportation Board, U.S. Department of Transportation.
45) Hazardous Commodity Code Cross-Reference File. Navigation Data Center, United States Army Corps of Engineers.
46) United States Census 2000. U.S. Census Bureau, U.S. Department of Commerce.
47) The National Map. U.S. Geological Survey. http://nationalmap.gov/. Accessed March 2010.
48) Web Soil Survey. U.S. Department of Agriculture, Natural Resources Conservation Service. http://websoilsurvey.nrcs.usda.gov/app/. Accessed March 2010.
49) National Climatic Data Center. U.S. Department of Commerce, National Oceanic and Atmospheric Administration. http://www.ncdc.noaa.gov/oa/ncdc.html. Accessed March 2010.
50) Crash Statistics. Analysis & Information Online, Federal Motor Carrier Safety Administration, U.S. Department of Transportation.
51) Rail Safety Data. Office of Safety Analysis, Federal Railroad Administration, U.S. Department of Transportation.
52) Marine Casualty and Pollution Database. Marine Information for Safety and Law Enforcement, Marine Safety Management System, U.S. Coast Guard.
53) Battelle Memorial Institute. HMCRP Report 1: Hazardous Materials Transportation Incident Data for Root Cause Analysis. TRB, National Research Council, Washington, D.C., 2009.
244
54) Transportation Statistics Annual Report 2007. Table B-5. Bureau of Transportation Statistics, Research and Innovative Technology Administration, U.S. Department of Transportation, June 2008.
55) Large Truck and Bus Crash Facts 2007. Analysis Division, Federal Motor Carrier Safety Administration, U.S. Department of Transportation, January 2009.
56) Craft, R. Crashes Involving Trucks Carrying Hazardous Materials. Analysis Brief. Publication Number FMCSA-RI-04-024. Federal Motor Carrier Safety Administration, U.S. Department of Transportation, May 2004.
57) Traffic Safety Facts 2007. Report Number DOT HS 811 002. National Center for Statistics and Analysis, National Highway Traffic Safety Administration, U.S. Department of Transportation, 2008.
58) Battelle Memorial Institute. Comparative Risks of Hazardous Materials and non-Hazardous Materials Truck Shipment Accidents/Incidents: Final Report. Federal Motor Carrier Safety Administration, U.S. Department of Transportation, March 2001.
59) Company Registration Look-Up Tool. Office of Pipeline Safety, Pipeline and Hazardous Materials Safety Administration, U.S. Department of Transportation.
60) Vessel Company Summary-Waterborne Transportation Lines of the United States Vol. 2. Navigation Data Center, United States Army Corps of Engineers.
61) Federal Railroad Administration Rail Hazmat Routing Rule Fact Sheet. Federal Railroad Administration, U.S. Department of Administration. http://www.fra.dot.gov/Downloads/ FRA%20Rail%20Hazmat%20Routing%20Rule%20Fact%20Sheet%20(December%202008).pdf. Accessed August 2009.
62) Hazmat Transportation by Rail: An Unfair Liability. Policy and Economics Department, Association of American Railroads, June 2009.
63) Biggs, D.C., Bol, M.A., Baker, J., Gosling, G.D., Franz, J.D., and J.P. Cripwell. ACRP Report 26: Guidebook for Conducting Airport User Surveys. TRB, National Research Council, Washington, D.C., 2009.
64) Traffic Monitoring Guide. Office of Highway Policy Information, Federal Highway Administration, U.S. Department of Transportation. Report FHWA-PL-01-021. http://www.fhwa.dot.gov/ohim/tmguide, 2001.
65) Federal Motor Carrier Safety Administration, U.S. Department of Transportation. Shippers – General Requirements for Shipping and Packages. 49 CFR, Part 173.
66) Guidelines for Chemical Transportation Risk Analysis. Center for Chemical Process Safety, American Institute of Chemical Engineers.

245
67) Pipeline and Hazardous Materials Safety Administration, U.S. Department of Transportation. Subchapter C—Hazardous Materials Regulations: Part 171—General Information, Regulations, and Definitions: Detailed hazardous materials incident reports. 49 CFR, Part 171.16.
68) SafeStat Online. Analysis & Information Online (A&I), Federal Motor Carrier Safety Administration (FMCSA), U.S. Department of Transportation (USDOT). https://ai.fmcsa.dot.gov/login/default.asp. Accessed February 2009.
69) Homeland Security Information Network. Department of Homeland Security (DHS). http://www.dhs.gov/xinfoshare/programs/gc_1156888108137.shtm. Accessed January 2009.
70) Responder Knowledge Base. Federal Emergency Management Administration, U.S. Department of Homeland Security. https://www.rkb.us. Accessed January 2010.
71) Interagency Effort Established Intermodal Hazmat Intelligence Portal. PHMSA Focus Newsletter. Pipeline and Hazardous Materials Safety Administration (PHMSA), U.S. Department of Transportation (USDOT). Volume 3, Number 1, Fall/Winter 2007. http://www.phmsa.dot.gov/media/newsletters.
72) Arizona State Emergency Response Commission. https://www.azserc.org/Default.aspx. Accessed April 2009.
73) Virginia Department of Emergency Management. http://www.vaemergency.com/library/lepc/. Accessed April 2009.
74) Pennsylvania Emergency Management Agency. https://www.pema.state.pa.us/pema/guestaccount/registration_form.asp? Accessed April 2009.
75) The Delaney Clause, Food Additives Amendment of 1958 to the Federal Food, Drug, and Cosmetic Act of 1954, Section 409 (21 U.S.C. 348 (c)(3)(A)).
76) Department of Defense Authorization Act of 1986, P.L. 99-145, Section 1412 (Nov. 8, 1985), 50 U.S.C. § 1521.
77) NUREG-0654 / FEMA-REP-1/ Rev. 1/ Supp.3, Criteria for Preparation and Evaluation of Radiological Emergency Response Plans and Preparedness in Support of Nuclear Power Plants, U. S. Nuclear Regulatory Commission, and Federal Emergency Management Agency, July 1996.
78) U.S. Office of Management and Budget. Cost Principles for State, Local, and Indian Tribal Governments (OMB Circular A-87). 2 CFR, Part 225, 2005.
79) National Institute for Chemical Studies. Local Emergency Planning Committees and Risk Management Plans: Encouraging Hazard Reduction. Chemical Emergency Preparedness and Prevention Office, U.S. Environmental Protection Agency, June 2001.


![Opfris- en vervolgtrainingen Basale reanimatie...Basale reanimatie Concept scenario Scenario x – [titel van het scenario] Doelstelling: Doel van het scenario Benodigdheden: • Gewenst](https://img.pdfslide.net/doc/110x75/609f7599109fc8347d5ef64b/opfris-en-vervolgtrainingen-basale-reanimatie-basale-reanimatie-concept-scenario.jpg)