Embed Size (px)
Citation preview
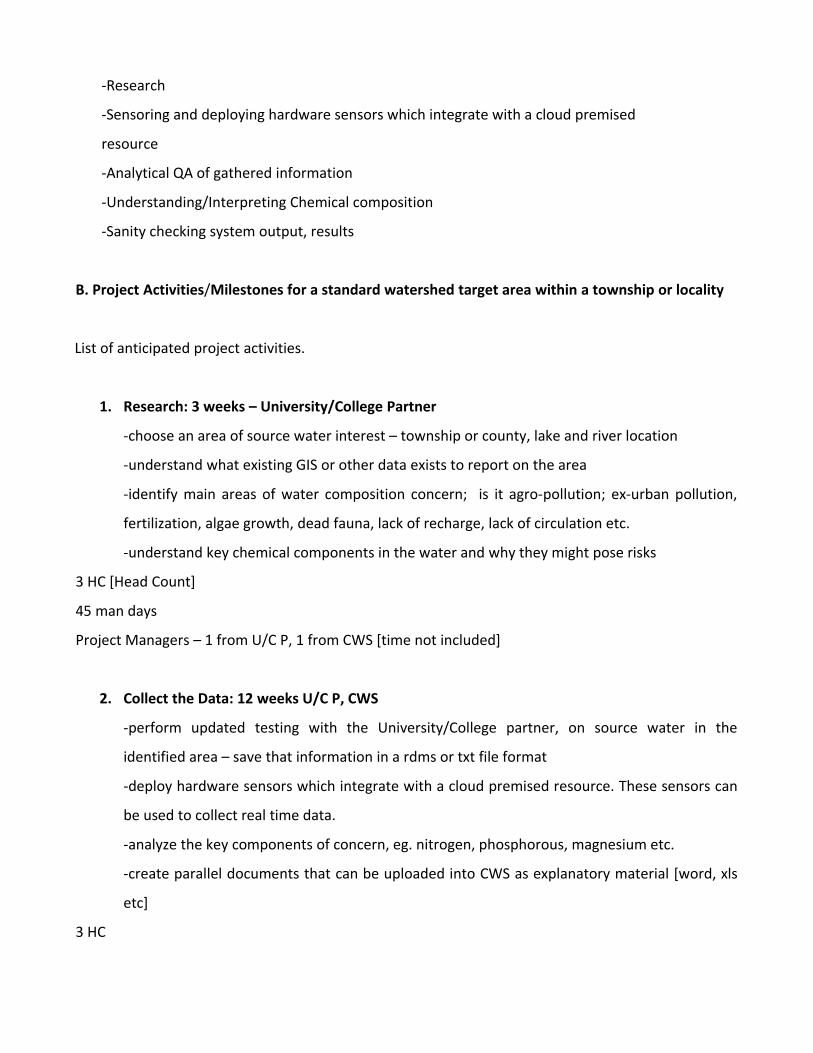
Project Outline
CWS' focus is on building Cloud based Software and Database Systems to collect, analyze and report
on all information around source water. We would integrate existing and future information systems
which have data on key aspects of a part of a targeted area – usually at the township, county or
borough level [this makes the project manageable and more concrete]. Within a target watershed
area there is quite likely many GIS systems which might have water quality/source issues but reside
on different servers/locations, or other silos of information in discrete agencies, separated by area,
townships, regions and by entity – all of these need to share their information.
A key pain point is lost information, shelved data, or unshared research and data. Oftentimes there
is research but no follow up and no historical database of information lending itself to easy analysis
and reporting, which covers a specific water-shed area. This means that money and time is wasted
and policy actions are reactive, not proactive.
A. Solution:
A cloud platform which performs analytics, and produces government-compliant reporting resolves
the silos of information dilemma.
Our cloud system will allow the integration of GIS and other relevant information databases or
spreadsheets; and focuses providing relevant data on water quality information, scientific research
detail, and chemical composition analysis. The cloud model will allow us to centrally manage this
information and create a work-flow of activity to resolve issues identified by the system. It allows
scalability, the use of 'big data' and elasticity. It will also allow us to keep historical data, and
produce various necessary reports.
The system is accessed via a browser and easy to use. Depending on your 'role' you will see
information pertinent to your level of access. There is no need to download applications or run local
servers. To help us achieve these goals, we would employ resources or assistance from our
University/College Partner and have their expertise complement ours, namely in the areas of:
-Research
-Sensoring and deploying hardware sensors which integrate with a cloud premised
resource
-Analytical QA of gathered information
-Understanding/Interpreting Chemical composition
-Sanity checking system output, results
B. Project Activities/Milestones for a standard watershed target area within a township or locality
List of anticipated project activities.
1. Research: 3 weeks – University/College Partner
-choose an area of source water interest – township or county, lake and river location
-understand what existing GIS or other data exists to report on the area
-identify main areas of water composition concern; is it agro-pollution; ex-urban pollution,
fertilization, algae growth, dead fauna, lack of recharge, lack of circulation etc.
-understand key chemical components in the water and why they might pose risks
3 HC [Head Count]
45 man days
Project Managers – 1 from U/C P, 1 from CWS [time not included]
2. Collect the Data: 12 weeks U/C P, CWS
-perform updated testing with the University/College partner, on source water in the
identified area – save that information in a rdms or txt file format
-deploy hardware sensors which integrate with a cloud premised resource. These sensors can
be used to collect real time data.
-analyze the key components of concern, eg. nitrogen, phosphorous, magnesium etc.
-create parallel documents that can be uploaded into CWS as explanatory material [word, xls
etc]
3 HC
180 man days
3. Cloudify the Data: 20 weeks, U/C P, CWS
-Upload the existing and new information into CWS
-this entails creating/modifying the existing data utility upload features of CWS
-understanding the data models of the existing systems
-cleaning and scrubbing the data
3 HC [1 part time]
245 man days
4. Use the Data: 4 weeks, UP, CWS
-Analyze and do QA of the uploaded cloud based information
-Understanding/Interpreting Chemical composition
-Sanity checking system output, results
-Produce reports, hopefully with historical information, trends and analysis from the cloud
system
-propose work flow and practical solutions based on the historical and current data
3 HC [2 part time]
40 man days
Total Number of weeks estimated for one watershed area: 39 weeks
Total Man days: 510
Project Management Time from U/C P and CWS not included.
Outcomes:
-Integrated set of GIS and other relevant DB information systems into the private Cloud
platform.
-Improved sensor deployment and research in the target watershed area.
-Greatly improved data quality and improved data understanding due to the cloudification of
relevant source water information.
-Processes to automate water sensor information-gathering; and better research methods and
concepts pertaining to the target water-shed area.
-Definite conclusions about water quality, water issues and what can be done to better manage
watershed resources in the target area.
-A model and approach that can be applied to other township or same sized, water-shed areas.
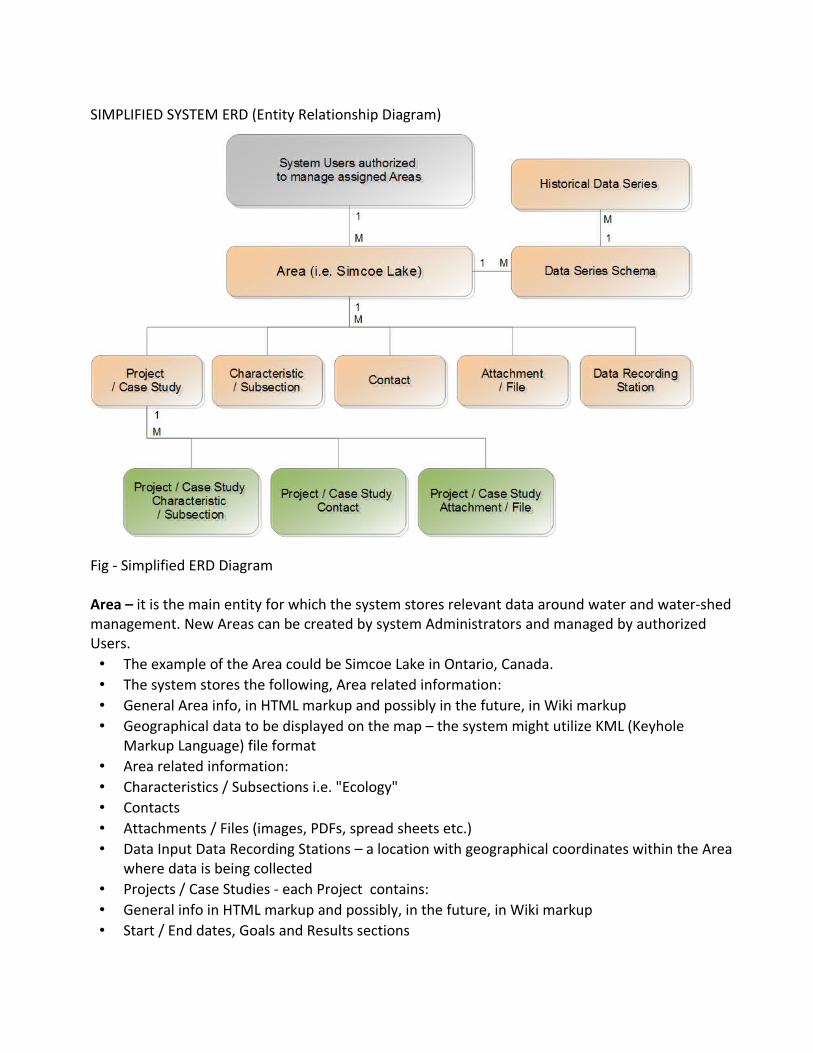
SIMPLIFIED SYSTEM ERD (Entity Relationship Diagram)
Fig - Simplified ERD Diagram
Area – it is the main entity for which the system stores relevant data around water and water-shed management. New Areas can be created by system Administrators and managed by authorized Users.• The example of the Area could be Simcoe Lake in Ontario, Canada. • The system stores the following, Area related information:• General Area info, in HTML markup and possibly in the future, in Wiki markup• Geographical data to be displayed on the map – the system might utilize KML (Keyhole
Markup Language) file format• Area related information:• Characteristics / Subsections i.e. "Ecology"• Contacts• Attachments / Files (images, PDFs, spread sheets etc.)• Data Input Data Recording Stations – a location with geographical coordinates within the Area
where data is being collected• Projects / Case Studies - each Project contains:• General info in HTML markup and possibly, in the future, in Wiki markup• Start / End dates, Goals and Results sections
• Project Characteristics / Subsections• Project Contacts• Project Attachments / Files• General Area info, in HTML markup and possibly in the future, in Wiki markup.
Area Data Series Schema – each Area has its own schema. In order to make the system easily adaptable to new circumstances and data sets, the schema can be adjusted at any time even after some historical data series already exists in the system.We are in the process of finalizing attributes of each system field. As of now, we have:• Unique system ID• Long Description (i.e. Oxygen Level, Temperature etc.)• Short Description• Data Type (might be optional)• Acceptable data ranges (i.e. Only values between 1-10 are valid)• Quality levels (i.e. anything below 5 is WARNING, anything below 3 is DANGEROUS etc.)
Historical Data Series - data series for the Area, conforming to the Area's Data Series Schema.Each data series, at a minimum will contain:• Timestamp• Location: either coordinates or reference to existing Data Recording Station in Public Wiki
system.• Optional reference to Area project• List of field / value keys
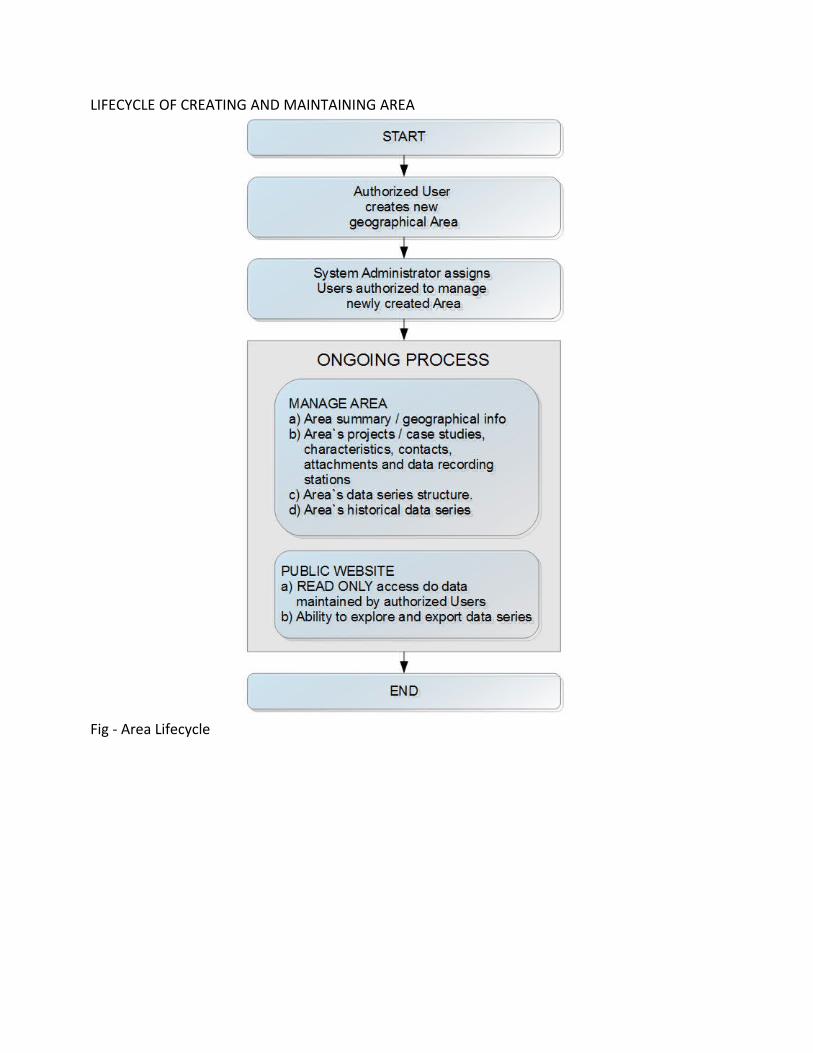
LIFECYCLE OF CREATING AND MAINTAINING AREA
Fig - Area Lifecycle
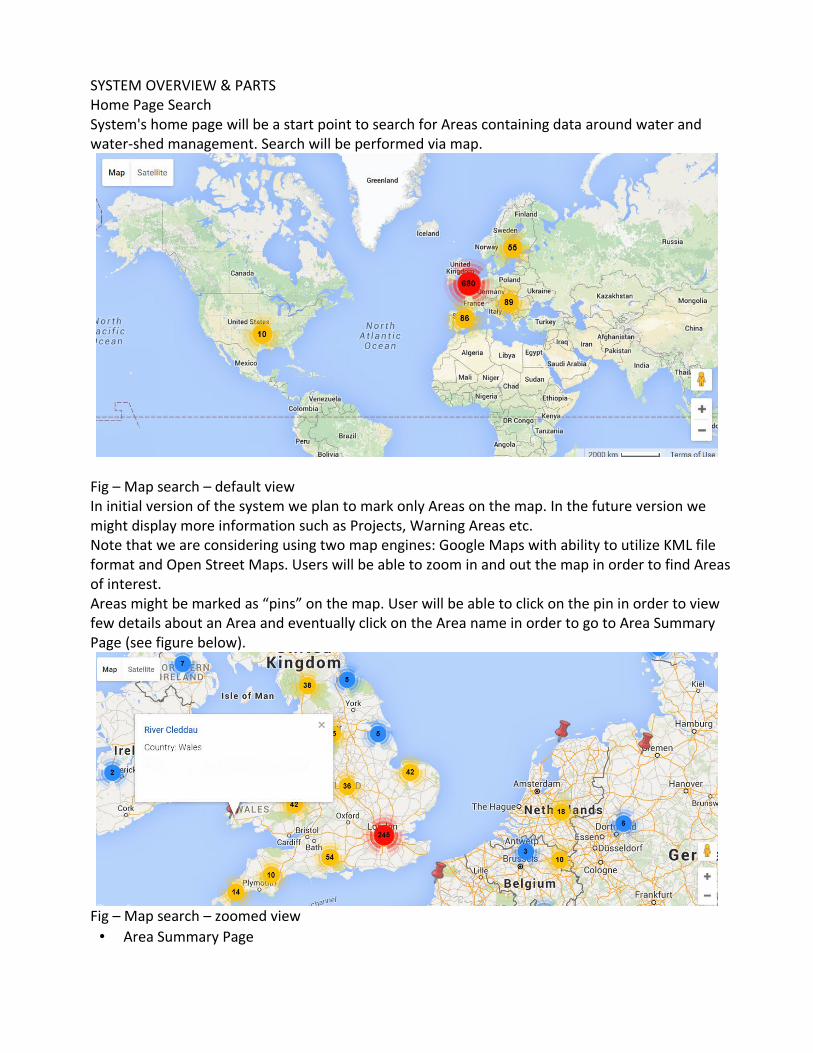
SYSTEM OVERVIEW & PARTSHome Page SearchSystem's home page will be a start point to search for Areas containing data around water and water-shed management. Search will be performed via map.
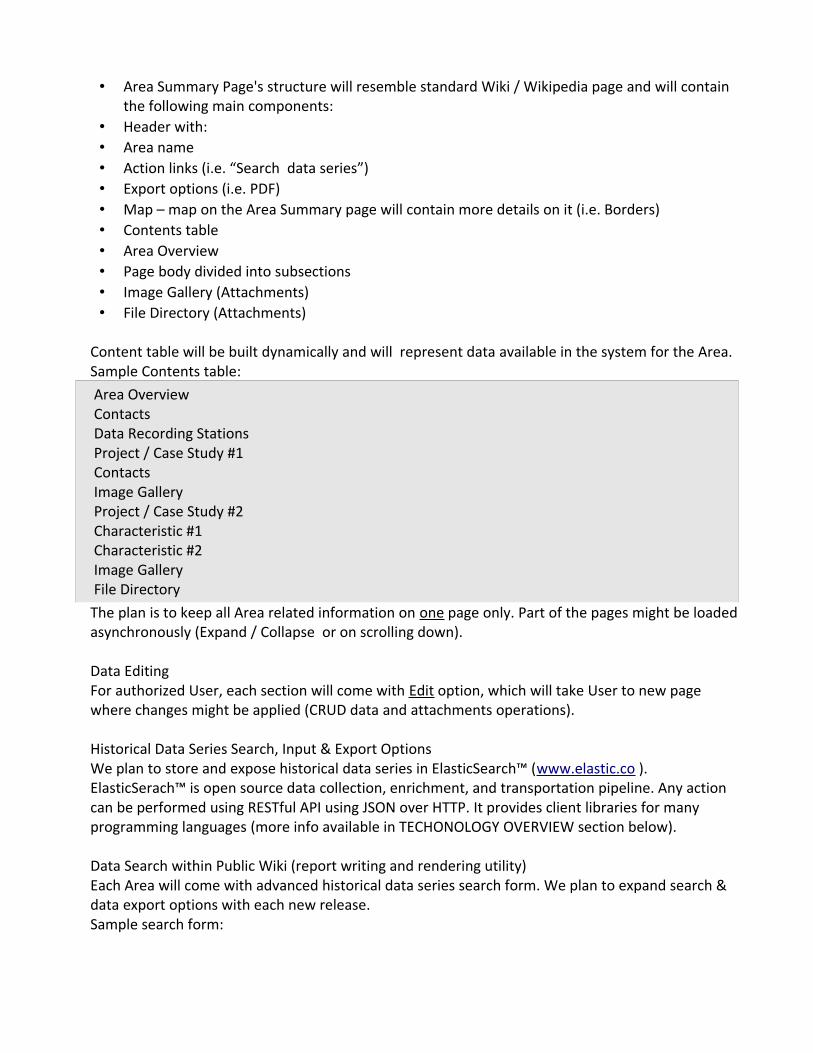
Fig – Map search – default viewIn initial version of the system we plan to mark only Areas on the map. In the future version we might display more information such as Projects, Warning Areas etc.Note that we are considering using two map engines: Google Maps with ability to utilize KML file format and Open Street Maps. Users will be able to zoom in and out the map in order to find Areas of interest.Areas might be marked as “pins” on the map. User will be able to click on the pin in order to view few details about an Area and eventually click on the Area name in order to go to Area Summary Page (see figure below).
Fig – Map search – zoomed view• Area Summary Page
• Area Summary Page's structure will resemble standard Wiki / Wikipedia page and will contain the following main components:
• Header with:• Area name • Action links (i.e. “Search data series”)• Export options (i.e. PDF)• Map – map on the Area Summary page will contain more details on it (i.e. Borders)• Contents table• Area Overview• Page body divided into subsections• Image Gallery (Attachments)• File Directory (Attachments)
Content table will be built dynamically and will represent data available in the system for the Area.Sample Contents table:Area OverviewContactsData Recording StationsProject / Case Study #1ContactsImage GalleryProject / Case Study #2Characteristic #1Characteristic #2Image GalleryFile Directory The plan is to keep all Area related information on one page only. Part of the pages might be loadedasynchronously (Expand / Collapse or on scrolling down).
Data EditingFor authorized User, each section will come with Edit option, which will take User to new page where changes might be applied (CRUD data and attachments operations).
Historical Data Series Search, Input & Export OptionsWe plan to store and expose historical data series in ElasticSearch™ (www.elastic.co ). ElasticSerach™ is open source data collection, enrichment, and transportation pipeline. Any action can be performed using RESTful API using JSON over HTTP. It provides client libraries for many programming languages (more info available in TECHONOLOGY OVERVIEW section below).
Data Search within Public Wiki (report writing and rendering utility)Each Area will come with advanced historical data series search form. We plan to expand search & data export options with each new release.Sample search form:
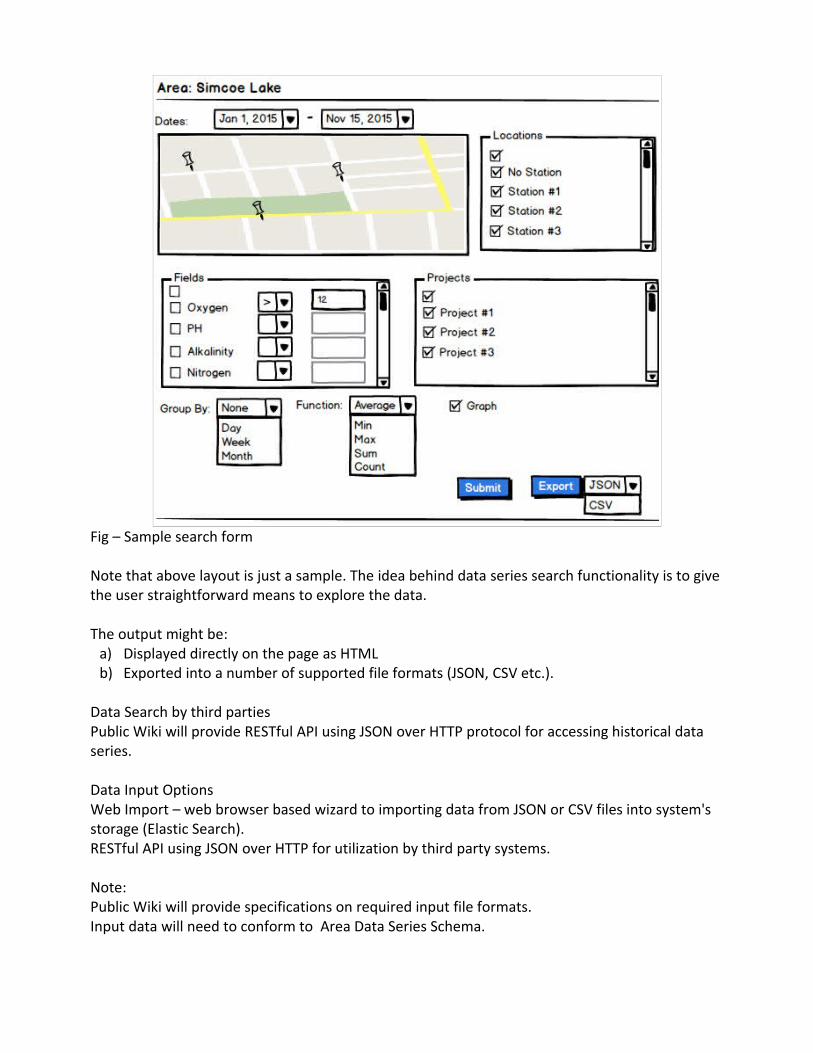
Fig – Sample search form
Note that above layout is just a sample. The idea behind data series search functionality is to give the user straightforward means to explore the data.
The output might be:a) Displayed directly on the page as HTMLb) Exported into a number of supported file formats (JSON, CSV etc.).
Data Search by third partiesPublic Wiki will provide RESTful API using JSON over HTTP protocol for accessing historical data series.
Data Input OptionsWeb Import – web browser based wizard to importing data from JSON or CSV files into system's storage (Elastic Search).RESTful API using JSON over HTTP for utilization by third party systems.
Note:Public Wiki will provide specifications on required input file formats.Input data will need to conform to Area Data Series Schema.
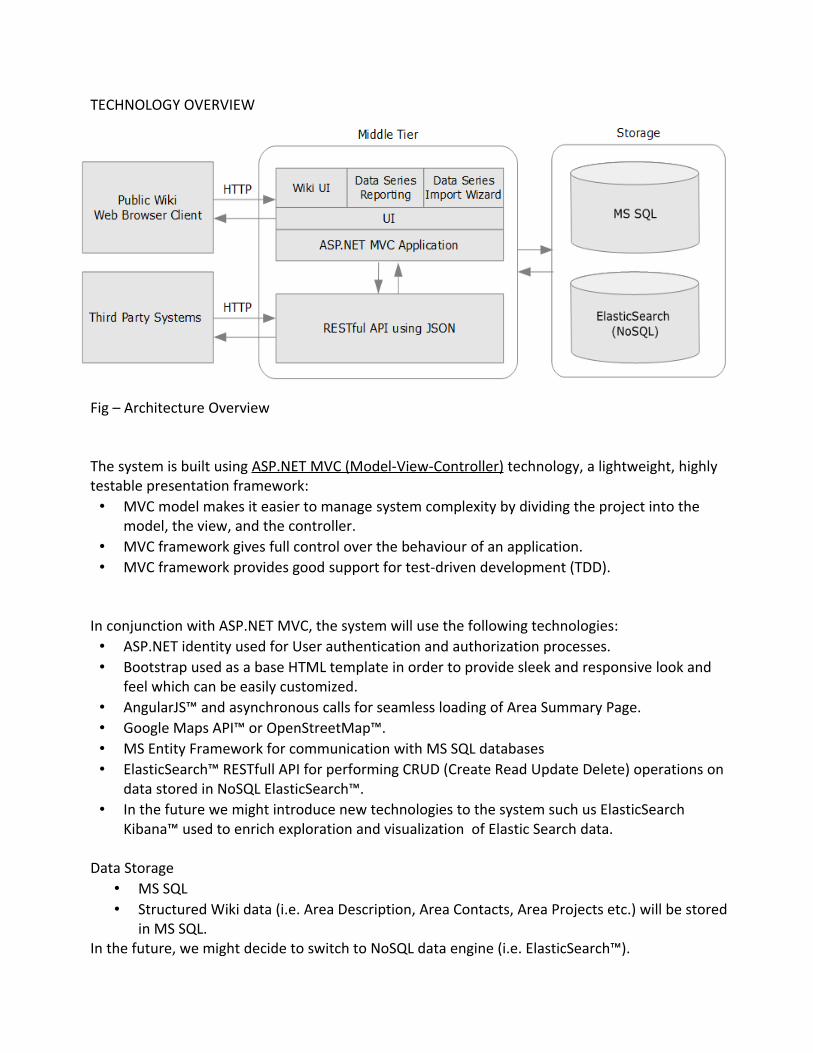
TECHNOLOGY OVERVIEW
Fig – Architecture Overview
The system is built using ASP.NET MVC (Model-View-Controller) technology, a lightweight, highly testable presentation framework:• MVC model makes it easier to manage system complexity by dividing the project into the
model, the view, and the controller.• MVC framework gives full control over the behaviour of an application.• MVC framework provides good support for test-driven development (TDD).
In conjunction with ASP.NET MVC, the system will use the following technologies:• ASP.NET identity used for User authentication and authorization processes.• Bootstrap used as a base HTML template in order to provide sleek and responsive look and
feel which can be easily customized.• AngularJS™ and asynchronous calls for seamless loading of Area Summary Page.• Google Maps API™ or OpenStreetMap™.• MS Entity Framework for communication with MS SQL databases• ElasticSearch™ RESTfull API for performing CRUD (Create Read Update Delete) operations on
data stored in NoSQL ElasticSearch™.• In the future we might introduce new technologies to the system such us ElasticSearch
Kibana™ used to enrich exploration and visualization of Elastic Search data.
Data Storage• MS SQL• Structured Wiki data (i.e. Area Description, Area Contacts, Area Projects etc.) will be stored
in MS SQL. In the future, we might decide to switch to NoSQL data engine (i.e. ElasticSearch™).
ElasticSearchHigh volumes of historical data series will be stored in ElasticSearch.ElasticSearch is a standalone database server, written in Java on the top of Apache Lucene™ (https://lucene.apache.org/). It is easily scalable and supports clustering. It stores data in a sophisticated format optimized for language based searches.
ElasticSearch highlights:• Distributed, scalable and highly available engine.• Massively Distributed – ability to start small and scale horizontally as the system grows by
adding more nodes. Supports huge volumes of data.• Fast data searches and advanced analytics.• High availability, resilient ElasticSearch™ clusters. Data is reorganized and rebalanced
automatically when new or failed nodes are discovered.• Powerful RESTful API – most of the actions can be performed using a simple RESTful API using
JSON over HTTP.• Schema free – easy process to adjust allowed historical data series schema and make the data
searchable.• Build on top of Apache Lucene™ - high performance information retrieval engine.• Distributed under Apache 2 Open Source License.
LOCALIZATIONPublic Wiki will support localization. Initially we will support English version, but system's structure will be ready for new language versions if required.