Embed Size (px)
Citation preview
Planting AntaRctica in KAnsas (Project PARKA) Page 1 9/10/13
OverviewHuman activities (burning of fossil fuels, deforestation, cement production) have driven the rapid 40% increase in atmospheric carbon dioxide CO2, from preindustrial levels of 280 ppmv (parts per million volume) to current levels of nearly 400 ppmv. Present-day atmospheric CO2 concentration is projected to double by the end of the 21st century. Nearly one-third of emitted anthropogenic CO2 is absorbed by the oceans, resulting in reductions in seawater pH and alterations in carbonate chemistry (i.e., reductions in carbonate, CO32-, ions). This shift in the ocean towards more acidic conditions is known as ocean acidification. The faster the increase of CO2 in the atmosphere, the faster the acidification of the ocean. The current rapid rate of oceanic CO2 uptake is paralleled by rates of acidification at least ten times faster than any change seen in the fossil record over the past 65 million years. These rapid changes are expected to cause adverse ecosystem wide effects.
One consequence of ocean acidification is the decrease in the availability of carbonate ions in the ocean. The reduction in carbonate ions makes it more difficult for calcifying organisms, which use calcium carbonate to form their shells, to grow and survive. Damage to the shells and
skeletons of mollusks and corals has been observed as a result of ocean acidification. Additionally, ocean acidification has a wide-ranging potential for impacting the physiology and metabolism of both calcifying and non-calcifying marine organisms. Sufficiently elevated CO2 concentrations/decreased pH levels can alter internal acid-base balance, compromising homeostatic regulation and disrupting internal systems ranging from oxygen transport to ion balance and metabolism. Much of scientists’ current research on ocean acidification focuses on how organisms respond to increased CO2 /decreased pH and if they can acclimate or adapt to these changes.
Project PARKA (Planting AntaRctica in KAnsas)
Take Home Messages
Ocean acidification results from increased levels of carbon dioxide dissolving into the ocean, which lowers the pH of the ocean. This acidification process impacts oceanic organisms that use calcification to make their shells. Scientists use a range of data sets to understand the process and consequences of ocean acidification.
Ocean Acidification: Whats and HowsMaterials
For the leader:Computer
Projector
Graphing paper
Yeast Experiment Instructions and materials------------------------------------------------
For the activity:Ocean Acidification Data Figures
Ocean Acidification Calcifying Organisms Data Figures
Ocean Acidification & Shells Worksheet
Petri dishes
pH strips
Scallop and clam shells
treatment liquids: tap water, white vinegar, seltzer water, & salt water
Books
Magnifying Glass (optional)
Planting AntaRctica in KAnsas (Project PARKA) Page 2 9/10/13
Motivating Questions
• How does ocean acidification happen? • What are some of the potential consequences of ocean acidification on calcifying organisms?
StructureThe students will be exposed to a range of data on ocean acidification. Through a class demonstration, lead by you, the students will collect data to investigate how ocean acidification works (increases in CO2 in the air correlate with decreases in pH). Students will then work through multiple published data visuals to explore how scientists understand that ocean acidification is occurring. The final component of the section exposes students to the impacts of ocean acidification on calcifying organisms. Students will first observe the impacts of acidification on shell strength through a hands-on demonstration and then again look at multiple data visualizations of published results on ocean acidification impacts.
Time Required AudienceTwo 45-minute periods or One 90-minute period High school students (9th-12th grade).
Activity OutlineEngage: Students will be exposed to a demonstration of how ocean acidification works by witnessing increases in CO2 in the air and a subsequent decrease in pH.
10 minutes
Explore: Students will be presented a range of data – through collection, interpretation, and observations – to explore how the process and potential implications or consequences of ocean acidification.
70 minutes
Make Sense: Through a class discussion students will reflect upon the multiple demonstrations and data to process what they have learned about how ocean acidification works and the potential impacts of ocean acidification on calcifying organisms.
10 minutes
Total:90 minutes
Next Generation Science Standards
Performance & Expectation Science & Engineering Practice Disciplinary Core Ideas Crosscutting Concepts
Matter and Energy in Organisms and Ecosystems, HS-LS2-5
Developing and Using Models LS2.B Cycles of Matter and Energy Transfer in Ecosystems Systems and System Models
Matter and Energy in Organisms and Ecosystems, HS-LS1-6
Constructing Explanations and Designing Solutions
LS1.C Organization for Matter and Energy Flow in Organisms Energy and Matter
Interdependent Relationships in Ecosystems, HS-LS2-1
Using Mathematics and Computational Thinking
LS2.A Interdependent Relationships in Ecosystems Scale, Proportion, and Quantity
Interdependent Relationships in Ecosystems, HS-LS2-6
Engaging in Argument from Evidence
LS2.C Ecosystem Dynamics, Functioning, and Resilience Stability and Change
Natural Selection and Evolution, HS-LS4-4
Constructing Explanations and Designing Solutions LS4.C Adaptation Cause and Effect
Natural Selection and Evolution, HS-LS4-5
Engaging in Argument from Evidence LS4.C Adaptation Cause ad Effect
Earth's Systems, HS-ESS2-2 Analyzing and Interpreting DataESS2.A Earth Materials and Systems Stability and Change
Weather and Climate HS-ESS3-5 Analyzing and Interpreting DataESS3.D Global Climate Change Stability and Change
Human Impacts HS-ESS3-6 Using Mathematics and Computational Thinking
ESS2.D Weather and Climate, ESS3.D Global Climate Change Systems and System Models
Planting AntaRctica in KAnsas (Project PARKA) Page 3 9/10/13
Preparation (30 minutes day of, 20 minutes 2-days before)
Two Days Before – Prepare the shells
1. The bags of shells are organized into small group quantities. It does not matter what size shells the students use for the activity, but that the shells are of a similar size across the treatments.
2. Place the scallop shells and clam shells into the halves of petri dishes.
a. Collect four halves of a petri dish for each group.
b. Put a Baby Deep Scallop shell and a Purple Baby Clam shell into each half of a petri dish.
3. Have the students make initial observations and measurements of the shells.
a. Tell the students that over the next two days they will be conducting a hands-on demonstration of a consequence of ocean acidification on organisms that require calcium carbonate to make their shells.
b. Pass out the petri dishes with the shells (no liquid) to the different small groups. Have the students look at the shells and make observations about similarities and
differences among the shells in the four different treatments.
c. Have the students record their observations on the “Ocean Acidification & Shells Worksheet” in the “Prior to the shells being put in the treatments” section.*
4. Begin the demonstration by placing a liquid in each of the halves of the petri dishes.
a. Fill each half of a petri dish with one of the different liquids:
i. Tap water
ii. White Vinegar
iii. Seltzer water
iv. Ocean water (follow the instructions on the OC Sea Salt packaging for mixing up the salt water)
5. Measure and record the pH of each halves of the petri dishes (to either have for your students or to know what the pH was at the start of the demonstration as a comparison for the students).
6. Leave the shells to sit for at least 24 hours, but better for 48 hours.
Day of the Lesson1. Label the petri dishes with the different
Kansas State Science Standards Standard Benchmark: The student will Indicator
1: Science as Inquiry 1: demonstrate the abilities necessary to do scientific inquiry
4. actively engages in conducting an inquiry, formulating and revising his or her scientific explanations and models (physical, conceptual, or mathematical) using logic and evidence, and recognizing that potential alternative explanations and models should be considered.
2A: Chemistry 3: gain a basic concept of chemical reactions
1. understands a chemical reaction occurs when one or more substances (reactants) react to form a different chemical substance(s) (products). There are different types of chemical reactions all of which demonstrate the Law of Conservation of Matter and Energy.
3: Life Science4: understand the interdependence of organisms and their interactions with the physical environment
5. understands human beings live within and impact ecosystems.
6: Science in Personal and Environmental Perspectives
3: understand that human populations use natural resources and influence environmental quality
1. a. These processes of ecosystems include maintenance of the atmosphere, generation of soils, control of the hydrologic cycle, and recycling of nutrients. Humans are altering many of these processes, and the changes may be detrimental, beneficial, or both to ecosystem function
7: History and Nature of Science
1: develop an understanding that science is a human endeavor that uses models to describe and explain the physical universe
2. Scientific knowledge is made public through presentations at professional meetings and publications in scientific journals.
Planting AntaRctica in KAnsas (Project PARKA) Page 4 9/10/13
1. treatments. Each small group will get four half-petri dishes (one for each treatment).
2. Remove the Baby Deep Scallop shell and a Purple Baby Clam from the containers, dry them off, and put each pair into the corresponding half of a petri dish.
3. Write the motivating questions up on the board:
Q. How does ocean acidification happen? Q. What are some of the potential consequences of ocean acidification on calcifying organisms?
4. Follow the Yeast Experiment Instructions to prepare the demonstration for the class.
5. Make copies of the “Ocean Acidification & Shells Worksheet” for each student.
6. Make sure you have the “Ocean Acidification Data Figures” and “Ocean Acidification Calcifying Organisms Data Figures” prepared for each small group. Each group will receive one figure for the activity.
7. Write the data figure prompting questions on the board or an overhead sheet (and if possible keep covered from the students until you will use them):
a. What is included in the figure?
b. What conclusions did they draw from the figure?
c. What does their figure tell us about the story of ocean acidification?
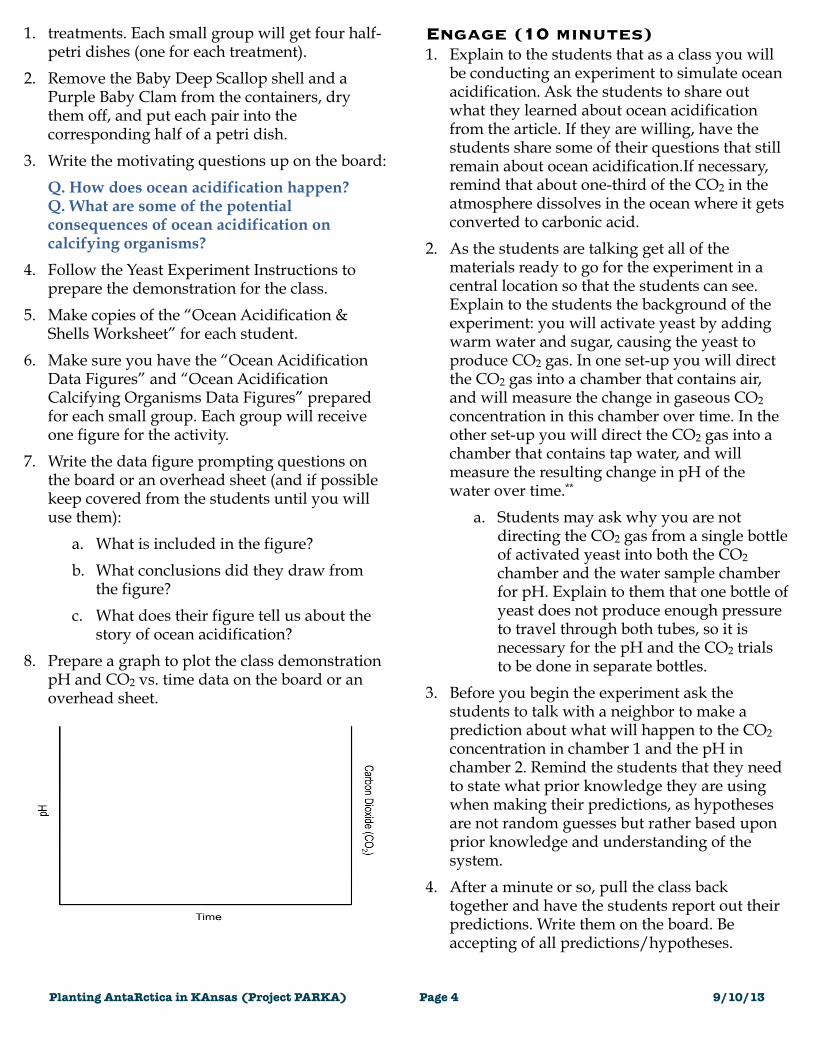
8. Prepare a graph to plot the class demonstration pH and CO2 vs. time data on the board or an overhead sheet.
Engage (10 minutes)1. Explain to the students that as a class you will
be conducting an experiment to simulate ocean acidification. Ask the students to share out what they learned about ocean acidification from the article. If they are willing, have the students share some of their questions that still remain about ocean acidification.If necessary, remind that about one-third of the CO2 in the atmosphere dissolves in the ocean where it gets converted to carbonic acid.
2. As the students are talking get all of the materials ready to go for the experiment in a central location so that the students can see. Explain to the students the background of the experiment: you will activate yeast by adding warm water and sugar, causing the yeast to produce CO2 gas. In one set-up you will direct the CO2 gas into a chamber that contains air, and will measure the change in gaseous CO2 concentration in this chamber over time. In the other set-up you will direct the CO2 gas into a chamber that contains tap water, and will measure the resulting change in pH of the water over time.**
a. Students may ask why you are not directing the CO2 gas from a single bottle of activated yeast into both the CO2 chamber and the water sample chamber for pH. Explain to them that one bottle of yeast does not produce enough pressure to travel through both tubes, so it is necessary for the pH and the CO2 trials to be done in separate bottles.
3. Before you begin the experiment ask the students to talk with a neighbor to make a prediction about what will happen to the CO2 concentration in chamber 1 and the pH in chamber 2. Remind the students that they need to state what prior knowledge they are using when making their predictions, as hypotheses are not random guesses but rather based upon prior knowledge and understanding of the system.
4. After a minute or so, pull the class back together and have the students report out their predictions. Write them on the board. Be accepting of all predictions/hypotheses.
Planting AntaRctica in KAnsas (Project PARKA) Page 5 9/10/13
5. After the students have shared their predictions begin the experiment (it might be good to have a helper as both bottles need to be started at the same time):
a. By filling both round 500 ml bottle up to the white line with water that is hot to the touch. Then use the funnel to add 3 packets of sugar to the hot water, and then add 1 packet of yeast. Stir by swirling the bottle for 5 seconds. (This is the only time you need to stir the solution. Do not overmix or you will affect the reaction rate!)
b. For the pH water chamber, QUICKLY insert the black, rubber stopper into the top of the bottle. Make sure the seal is tight. Place the attached rubber tubing into the room-temperature water with your pH sensor.
c. For the CO2 chamber, QUICKLY insert the black, rubber stopper into the top of the bottle. Make sure the seal is tight.
d. Start the 3-minute sand timer.
6. Inform the students that the experiment will run for the next 24 minutes and you will record the data every three minutes. After the experiment is complete, you all will analyze the data together as a class.
Explore (70 minutes)1. While you are waiting for the yeast experiment
results, tell the students that you will be looking at multiple datasets that scientists are using to determine that ocean acidification is occurring.
2. The students will work in small groups to interpret a dataset. Each group will be given different datasets. The students need to work together to understand that data visualization, draw conclusions from the data visualization, and determine what piece of the ocean acidification story their data visualization tells. The students will present their data visualization to the class at the end of their 10 minutes.
3. Pass out the Ocean Acidification Data Figures to each small group.
4. As the students are talking through their data visualizations, circulate and answer questions as needed.
a. Atmospheric CO2 Over Time – The graph shows atmospheric carbon dioxide levels from the 1800s to predicted levels in 2300. Two different IPCC models are used in this figure. IS92a uses carbon concentrations that increase at 1% per year after 1990 and carbon dioxide emissions that continue at today’s rate. S650 uses carbon dioxide emissions that decrease and eventually the atmospheric CO2 levels stabilize (a stabilization scenario).
b. Atmospheric CO2 and Global Ocean pH – The graph shows different scenarios based upon population, economic growth, etc. as predicted by the Intergovernmental Panel on Climate Change (IPCC). The top figure shows projected CO2 levels from 2000 to 2100, the bottom figured shows projected global ocean pH levels for the same timeframe. The different lines represent the different emission scenarios that went into the model.
c. pH and Oceanic Dissolved Carbon Dioxide – The graph combines historical data with predictions made using models to show pH and oceanic dissolved carbon dioxide over time.
5. After ten minutes have passed (or the students begin to wrap-up their work), have each group report to the class what they were interpreting and their responses to the three prompting questions:
a. What is included in the figure?
b. What conclusions did they draw from the figure?
c. What does their figure tell us about the story of ocean acidification?
6. Have the students work together to use the different pieces of data to understand that: atmospheric CO2 is increasing over time → increase in the amount of dissolved CO2 in the oceans → decreases oceanic pH (Note – it might
Planting AntaRctica in KAnsas (Project PARKA) Page 6 9/10/13
6. be helpful to write this on the board as they are working through the connections and ocean acidification story).
7. Take a 30 second get up and walk around break ☺, while the students are taking their break prepare the data from the yeast experiment for the students.
8. As a class create a graph of the pH and CO2 concentration over time. Label your axes, and include units.
9. When the graph is complete, have the students examine the graph and interpret it. Ask the students: did the CO2 concentration increase or decrease? What about the pH?
10. Have the students turn to their neighbor and discuss: what is the relationship between CO2 and pH? Remind the students to use evidence and data to support their explanations of the relationship.
11. After a few minutes have the students report out to one another what they were talking about in their pairs.
12. After a few partner groups have shared, ask the students to think about how this experiment relates to the data that they were looking at with respect to ocean acidification.
13. As the conversation winds down, return the students attention to the relationships among the different datasets of ocean acidification. Ask the students if they have any questions about what you have covered so far in class. (This is the end of the process of ocean acidification component of the class, so it is important to ensure that students understand how it works, before they can look into potential impacts of ocean acidification on calcifying organisms).
14. Once the students are feeling confident in the process of ocean acidification, tell them that they will be finishing the hands-on demonstration of a consequence of ocean acidification on organisms that require calcium carbonate to make their shells.
15. Pass out the petri dishes with the shells in solutions to the different small groups. Have
the students look at the shells and make observations about similarities and differences among the four different treatments (average pH values provided):
a. tap water ~ pH 7
b. vinegar ~ pH 3
c. seltzer water ~ pH 4-5
d. salt water (control) ~ pH 8
16. Have the students record their observations on the “Ocean Acidification & Shells Worksheet.”
17. Make sure the students are making comparisons within species (scallop or clam) and between species (scallop and clam). Also remind the students to use the pH strips to determine the pH values of each treatment.
18. When they are done making their observations and collecting the pH data, that students may pile books on the different shells to determine the strength of shells across the different treatments and species.
19. After some fun breaking shells, bring the students back together to talk about their results. Ask the students what relationship they observed between pH and shell shape/size. What relationship did they observe between pH and shell strength? As a class discuss this. Remind the students to refer to data and evidence when making statements about the affects of pH on the shell strength.
a. The students should observe that as the pH decreases the scallop shell and clamshell strength decreases.
b. The students should also observe that the scallop shells are in general weaker than the clamshells within each treatment.
20. Have the students return to their data interpretation small groups and pass out the Ocean Acidification Calcifying Organisms Data Figures to each small group. Inform the students that they will be now be looking at additional data for the impacts of ocean acidification on organisms that need carbonate to make their shells (calcifiers).
21. As the students are talking through their data visualizations, answer questions as needed.
Planting AntaRctica in KAnsas (Project PARKA) Page 7 9/10/13
a. Dissolved CO2, HCO3-, CO32-, and pH – The graph is known as a Bjerrum plot. It shows the proportion of dissolved carbon dioxide (CO2), bicarbonate (HCO3-), and carbonate (CO32-) at different pH levels in a solution at equilibrium.
b. Net Calcification, CO2, Carbonate (CO32-), and pH – The graphs show the relationship between net calcification and partial pressure CO2, carbonate ion concentration, and pH for Mytilus edulis (blue mussel) and Crassostrea gigas (pacific oyster).
c. M. mercenaria Grown Under Different CO2 Concentrations – The scanning electron microscopy (SEM) images are of M. mercernaria (saltwater clam species) that were grown in different CO2 levels for 36 days ranging from 250-1500ppm.
22. After ten minutes have passed (or the students begin to wrap-up their work), have each group report to the class what they were interpreting and their responses to the three prompting questions:
a. What is included in the figure?
b. What conclusions did they draw from the figure?
c. What does their figure tell us about the story of ocean acidification?
23. Have the students work together to use the different pieces of data to build upon their understanding of ocean acidification to include the impacts on calcifying organisms that:
a. Atmospheric CO2 is increasing over time
b. Increase in the amount of dissolved CO2 in the oceans
c. Decreases oceanic pH
d. Decreases the amount of carbonate (CO32-) in the ocean
e. Decreases the net calcification of organisms (e.g. blue mussel and pacific oyster)
f. Decreases growth rates/shell sizes of organisms (e.g. saltwater clams)
Make Sense (10 minutes)1. Once the discussion slows down, point to the
motivating questions and ask: Q. How does ocean acidification happen?
Q. What are some of the potential consequences of ocean acidification on calcifying organisms?
2. Ask students to share their ideas about the questions with a partner. After a minute, ask volunteers to share the ideas they discussed with the entire class. Be accepting of all responses from the students. This is your opportunity to make sure the students understand the “take home message” of the section. Make sure the students have processed that:
a. Ocean acidification is due to an increase in the amount of dissolved carbon dioxide in the ocean. The increase in the amount of dissolved carbon dioxide decreases the oceanic pH (making the water more acidic).
b. A decrease the in the oceanic pH is coupled with a decrease in the available carbonate ions in the water, which means there is less carbonate available for organisms that use calcium carbonate to make their shells.
3. As the discussion slows down, ask the students if there are other organisms in the ocean that may be impacted by ocean acidification. Have the students turn to their neighbor and discuss with a partner their thoughts for 60 seconds. Encourage the students to think both through this section as well as the two previous sections of the unit (phytoplankton, Antarctic science, food webs, etc.).
4. After a minute bring the class back together and have a couple volunteers share out to the class some of the ideas that surfaced in their discussions. Be accepting of all answers, as this is an initial brainstorming session to prepare them for the final section of the unit.
5. Ask if the students have any final questions
Planting AntaRctica in KAnsas (Project PARKA) Page 8 9/10/13
5. about the activities and presentations of the day.
HomeworkHave the students develop a concept map*** to demonstrate the process of ocean acidification and how ocean acidification impacts and/or effects calcifying organisms. Challenge the students to think about including the impacts and/or effects of non-calcifying organisms as well. Encourage the students to include 15-25 key concepts within their concept map.
-- ENDNOTES --* - Note – you could also have the students write down how the number of Hydrogen ions would change
with changes in pH across the treatments.*** - This experiment is adapted from “Ocean Acidification – Lesson 2: Yeast Experiment” C*MORE Science Kits (http://cmore.soest.hawaii.edu/education.htm).
*** - If your students are not familiar with a concept map make sure to provide them with a bit of background before they complete the homework assignment. Some good concept map resources include:
• University of Delaware's “How to Construct a Concept Map” article (http://www.udel.edu/chem/white/teaching/ConceptMap.html)
• Concept Map Builder by COSEE Ocean Systems (http://cosee.umaine.edu/tools/cmb/)
Planting AntaRctica in KAnsas (Project PARKA) Page 9 9/10/13
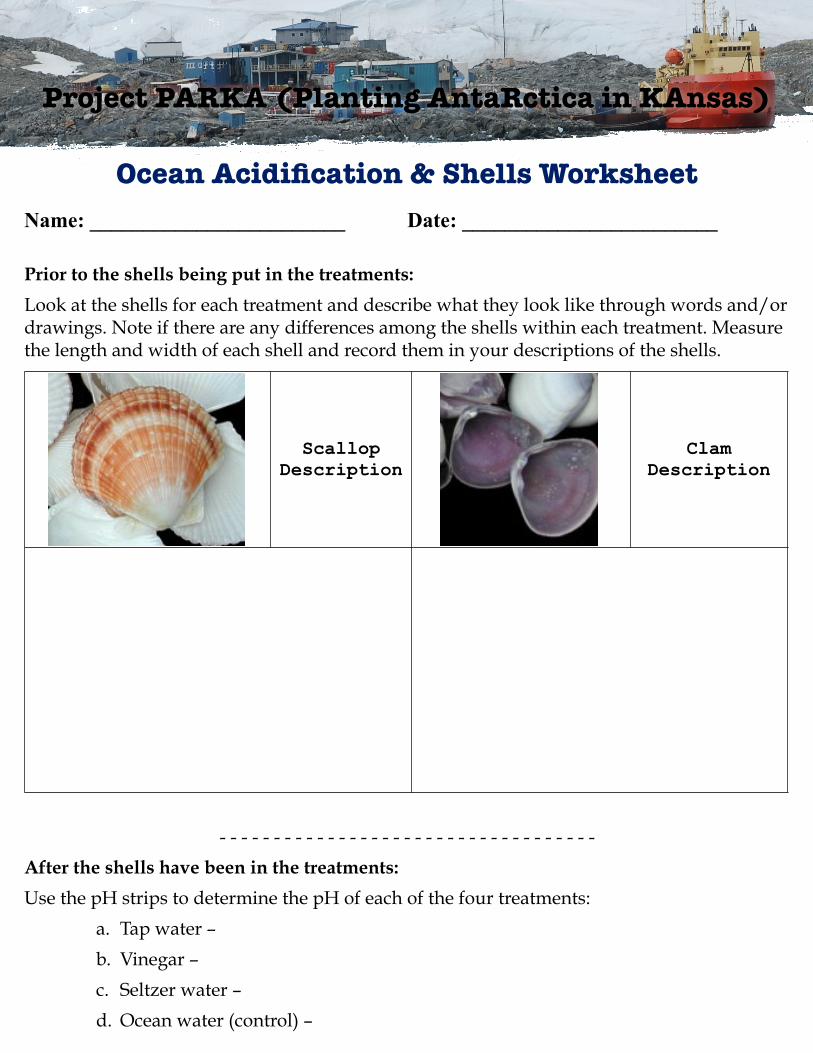
Name: ________________________ Date: ________________________
Prior to the shells being put in the treatments:
Look at the shells for each treatment and describe what they look like through words and/or drawings. Note if there are any differences among the shells within each treatment. Measure the length and width of each shell and record them in your descriptions of the shells.
Scallop Description
Clam Description
- - - - - - - - - - - - - - - - - - - - - - - - - - - - - - - - - - -
After the shells have been in the treatments:
Use the pH strips to determine the pH of each of the four treatments:
a. Tap water –
b. Vinegar –
c. Seltzer water –
d. Ocean water (control) –
Project PARKA (Planting AntaRctica in KAnsas)
Ocean Acidification & Shells Worksheet
Planting AntaRctica in KAnsas (Project PARKA) Page 10 9/10/13
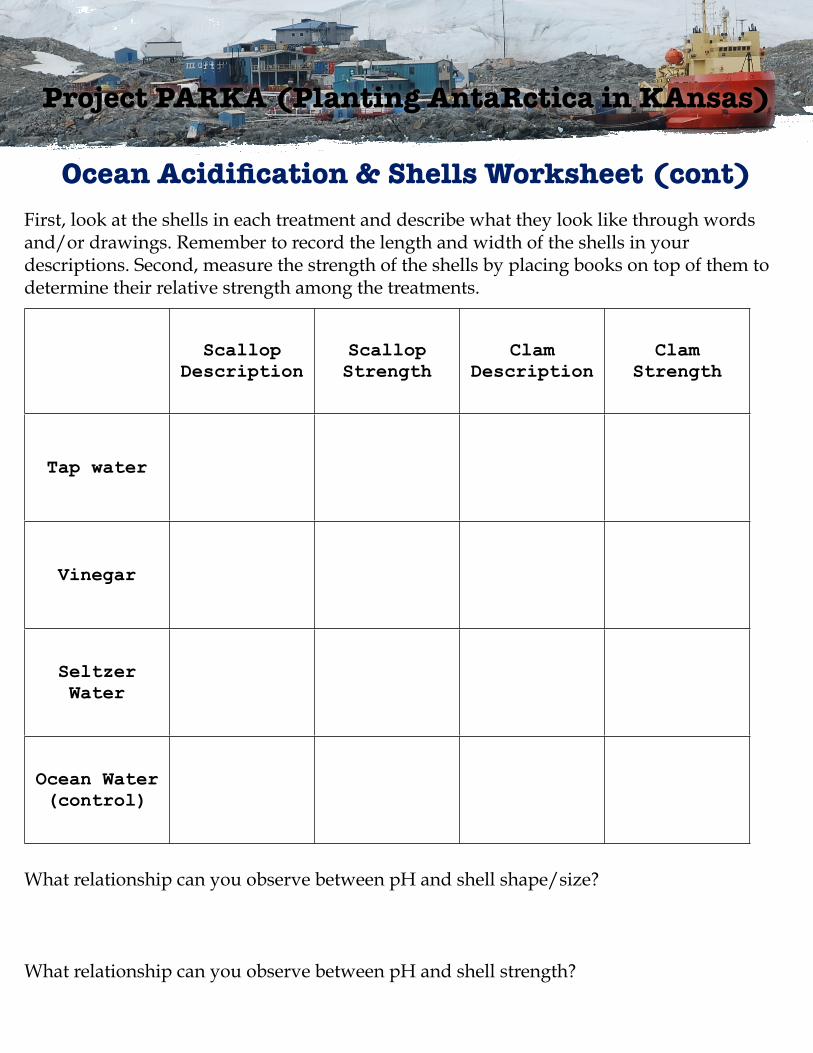
First, look at the shells in each treatment and describe what they look like through words and/or drawings. Remember to record the length and width of the shells in your descriptions. Second, measure the strength of the shells by placing books on top of them to determine their relative strength among the treatments.
Scallop Description
Scallop Strength
Clam Description
Clam Strength
Tap water
Vinegar
Seltzer Water
Ocean Water (control)
What relationship can you observe between pH and shell shape/size?
What relationship can you observe between pH and shell strength?
Project PARKA (Planting AntaRctica in KAnsas)
Ocean Acidification & Shells Worksheet (cont)
Planting AntaRctica in KAnsas (Project PARKA) Page 11 9/10/13
Name: ________________________ Date: ________________________
Develop a concept map of the process of ocean acidification and how ocean acidification impacts and/or effects calcifying organisms. Try also to include some of the impacts and/or effects of non-calcifying organisms that we discussed at the end of class today into your concept map.
Project PARKA (Planting AntaRctica in KAnsas)
Ocean Acidification – Homework Assignment