Embed Size (px)
Citation preview
Management 803 – Decision Making Analysis
Fall 2015 – Dr. Steven Farmer
Group Seven
Thao Doan
Spencer Harlow
Matthew Helmick
Chris Latawiec
Michael Rohlmeier
Student Perception of Campus Safety

Table of Contents
1.0 Background Information.....................................................................................................2
2.0 Statement of Problem........................................................................................................4
3.0 Literature Review...............................................................................................................5
3.1 Wichita State University Main Campus defined...............................................................................5
3.2 Jeanne Clery Act and Statistics.........................................................................................................5
3.3 Wichita State University Crime Statistics Comparison.....................................................................8
3.4 Causes of Student Fear on Campus..................................................................................................9
4.0 Exploratory Research........................................................................................................13
4.1 Short Exploratory Survey................................................................................................................15
The five most selected factors that students selected in regards to them feeling safe on campus were:........................................................................................................................17
5.0 Research Questions and Objectives...................................................................................18
6.0 Methodology....................................................................................................................20
6.1 Population and Sampling................................................................................................................20
6.2 Proposed Data Collection Techniques............................................................................................20
6.3 Instrumentation..............................................................................................................................22
6.4 Research Design..............................................................................................................................23
6.5 Project Schedule and Budget..........................................................................................................25
6.5.1 Schedule...................................................................................................................................25
6.5.2 Budget......................................................................................................................................25
7.0 References.......................................................................................................................26
8.0 Appendix..........................................................................................................................29
List of Tables
Table 1........................................................................................................................................... 8
Table 2......................................................................................................................................... 22
2

1.0 Background Information
Wichita State University is the third largest State University in Kansas. It is located in Wichita,
Kansas and has a student enrollment of approximately 15,000 student for the 2015 Fall
Semester.
There have been a number of crimes in the past two years committed either on or near the
main campus of Wichita State University. Of these, a few have been violent. The most recent
violent crime was committed right before the 2015 fall semester began. A student was found
dead outside of Fairmount Towers dormitories. He had been shot to death on 22nd street, right
next to the Towers.
These crimes have been publicized by the Wichita media. They have also been released to all
students, faculty, and staff of the University via email in compliance with the Federal Jeanne Clery
Disclosure of Campus Security Policy and Campus Crime Statistics Act of 1998.
Some students have said that “they do not feel safe on campus” and “campus safety is not very good”
because of the numerous crimes in the past two years. However, it is not clear if sentiments such as
these are shared by a majority of the students.
3

2.0 Statement of Problem
There is no currently available measure that adequately describes the perception of the Wichita
State University student body in regards to campus safety.
4

3.0 Literature Review
3.1 Wichita State University Main Campus defined
The Wichita State University main campus is located northeast of downtown Wichita on a 330-
acre plot of land. The main campus is generally bordered by East 21st St. North, East 17th St.
North, North Hillside St., and North Oliver Ave. The University’s main campus also contains
certain properties on the South side of East 17th St. North, as well as properties located at the
Northwest corner of East 21st St. North & North Hillside St. which includes Fairmount Towers,
the Child Development Center, and a vacant lot on the west side of North Chautauqua St. Also
part of the main campus are the properties located at the southwest corner of East 17th St.
North & North Hillside St. which includes the Intensive English Language Center, Intensive
English Annex, and a vacant lot at the southeast corner of East 17th St. North & North Lorraine
Ave. In addition, a parking lot located at 3608 East 21st St. North, which is leased on school
days from the University United Methodist Church, is part of the main campus.
3.2 Jeanne Clery Act and Statistics
The Clery Center for Security on Campus was founded in 1987, by Connie and Howard Clery
after their daughter Jeanne Clery was raped and murdered while in her college dorm room.
The initial focus of the foundation was on campus safety in general, however through their
research they found very limited amounts of information on crime committed on campus’ was
actually being provided to students and their families; something even more disturbing to the
Clery’s was the lack of any uniform laws requiring universities to do so. With the Cleary’s help
and persistence, in 1990 Congress approved the Crime Awareness and Campus Security Act, in
1991 the act was renamed in Jeanne’s honor; the Jeanne Clery Act was born.
The Jeanne Clery Act “requires colleges and universities to disclose their security policies, keep
a public crime log, publish an annual crime report and provide timely warnings to students and
campus employees about a crime posing an immediate or ongoing threat to students and
campus employees.” (Clery Center 2008)
5

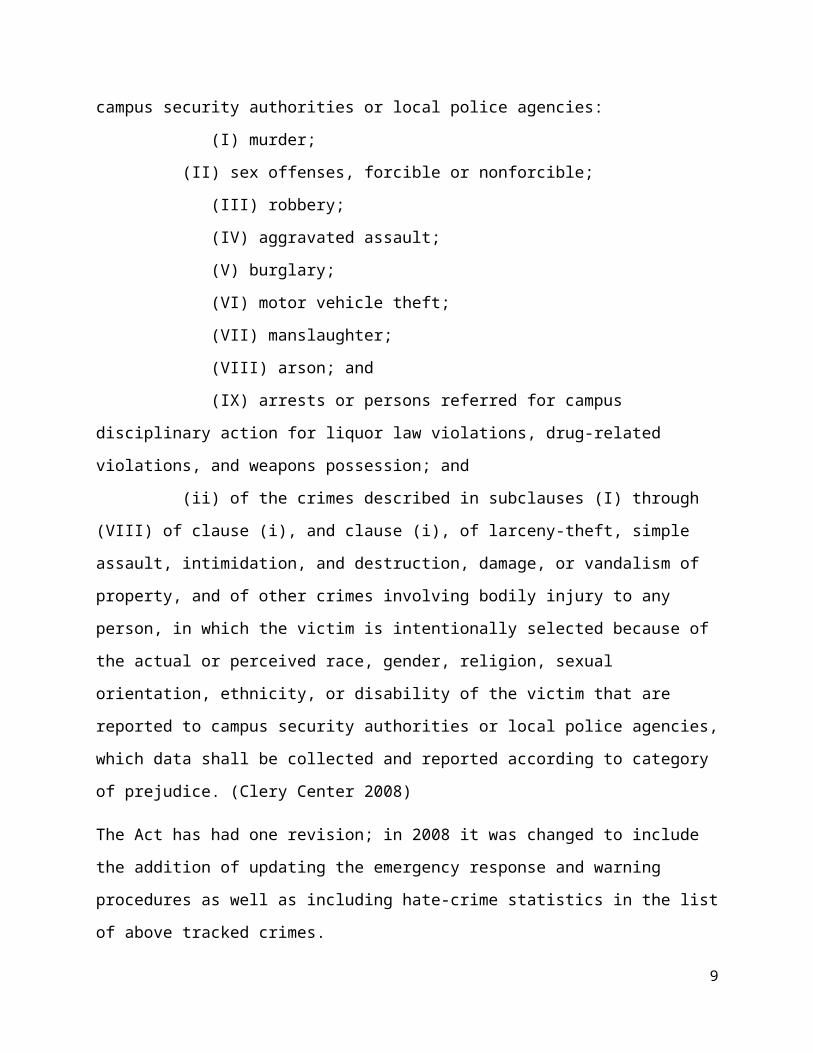
Along with mandating measurement of specific crime statistics on campus’ the act clearly
outlines procedures for universities to make their crimes statistics for current year and the 2
preceding calendar years readily available. The Clery Act specifically outlines which crime
statistics must be measured at any university campus:
(F) Statistics concerning the occurrence on campus, in or on noncampus buildings or property,
and on public property during the most recent calendar year, and during the 2 preceding
calendar years for which data are available--
(i) of the following criminal offenses reported to campus security authorities or local police
agencies:
(I) murder;
(II) sex offenses, forcible or nonforcible;
(III) robbery;
(IV) aggravated assault;
(V) burglary;
(VI) motor vehicle theft;
(VII) manslaughter;
(VIII) arson; and
(IX) arrests or persons referred for campus disciplinary action for liquor law violations,
drug-related violations, and weapons possession; and
(ii) of the crimes described in subclauses (I) through (VIII) of clause (i), and clause (i), of
larceny-theft, simple assault, intimidation, and destruction, damage, or vandalism of property,
and of other crimes involving bodily injury to any person, in which the victim is intentionally
selected because of the actual or perceived race, gender, religion, sexual orientation, ethnicity,
or disability of the victim that are reported to campus security authorities or local police
agencies, which data shall be collected and reported according to category of prejudice. (Clery
Center 2008)
The Act has had one revision; in 2008 it was changed to include the addition of updating the
emergency response and warning procedures as well as including hate-crime statistics in the list
of above tracked crimes.
6

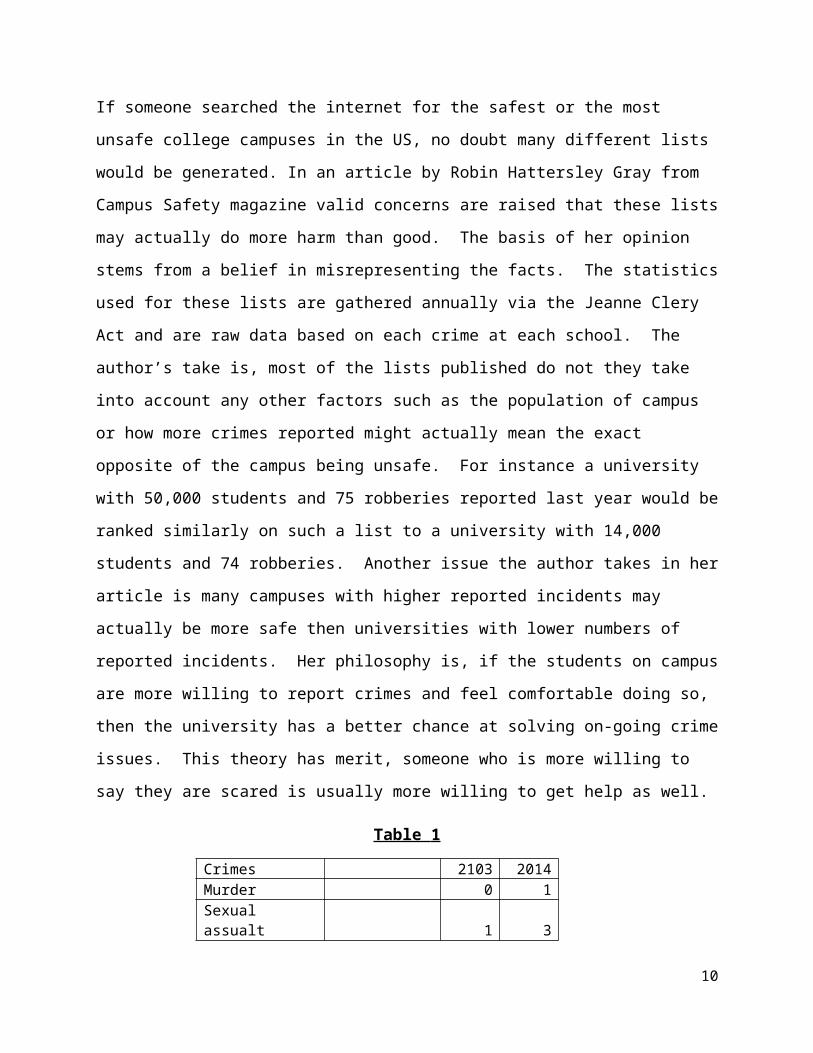
If someone searched the internet for the safest or the most unsafe college campuses in the US,
no doubt many different lists would be generated. In an article by Robin Hattersley Gray from
Campus Safety magazine valid concerns are raised that these lists may actually do more harm
than good. The basis of her opinion stems from a belief in misrepresenting the facts. The
statistics used for these lists are gathered annually via the Jeanne Clery Act and are raw data
based on each crime at each school. The author’s take is, most of the lists published do not
they take into account any other factors such as the population of campus or how more crimes
reported might actually mean the exact opposite of the campus being unsafe. For instance a
university with 50,000 students and 75 robberies reported last year would be ranked similarly
on such a list to a university with 14,000 students and 74 robberies. Another issue the author
takes in her article is many campuses with higher reported incidents may actually be more safe
then universities with lower numbers of reported incidents. Her philosophy is, if the students
on campus are more willing to report crimes and feel comfortable doing so, then the university
has a better chance at solving on-going crime issues. This theory has merit, someone who is
more willing to say they are scared is usually more willing to get help as well.
Table 1
Crimes 2103 2014Murder 0 1Sexual assualt 1 3Domestic violence 4 1Stalking 0 3Robbery 7 0Aggravated assault 0 0Burglary 1 2Motor vehicle theft 1 4Arson 2 0Hate crimes 0 0Liquor law violations Arrests 0 5
Disiplinary referrals 18 19
Drug-related violations Arrests 5 19
7

Disiplinary referrals 2 13
Weapons violations Arrests 1 0
Disiplinary referrals 3 0
From worried parents sending their child off to college, to seasoned students returning to
classes after a summer away, campus safety is an important and pressing issue. College
campuses across Kansas were compared by The Wichita Eagle recently based on the crime
statistics collected via The Jeane Clery Act. “Although Wichita State has had several high-profile
crimes on campus this year, the university’s crime rate is about average among universities in
Kansas…” (Morrison 2015). The study did take into account all of the state universities
populations and compared on a per capita basis when they did their comparisons. Wichita
State did stand out in one area, consistency. While other campuses crime numbers have
fluctuated, some significantly over the past 5 years, Wichita State has remained steadily in the
middle of the group of Kansas universities.
3.3 Wichita State University Crime Statistics Comparison
From 2011 to 2013 Wichita State University ranked 10,398th of 11,229 universities in crime
related incidents on and around campus. During that same period the university ranked
9,033rd in crime incidents per capita. This shows that WSU has a high level of crime related
incidents on and around campus when compared to other colleges and universities in the
nation (U.S. Department of Education, 2015).
Compared to other universities and colleges in Kansas from 2011 to 2013 Wichita State
University ranked 127th out of 133 in crime related incidents on and around campus and the
university was 90th in crime incidents per capita. This makes it obvious that WSU also has a
high crime rate compared to the other universities in Kansas (U.S. Department of Education,
2015).
8
Compared to other universities and colleges of similar size (11,000 to 17,000) from 2011-2013
WSU ranked 786th of 889 in crime incidents on and around campus and 785th in crime
incidents per capita. Once again, this shows that WSU has a high level of crime when compared
to other universities of similar size (U.S. Department of Education, 2015).
This shows that if the results of this research project indicate that the perception of campus
safety is low, one of the causes might be that the university does not compare favorably to
other universities in crime on and around campus (U.S. Department of Education, 2015).
As part of the background research for this project, an online safety ranking named “college
factual” (College Factual 2015) provided information about the Wichita State University and its
crime rating which was able to be compared to the previously mentioned data in order to give
the data validity.
3.4 Causes of Student Fear on Campus
The perception of campus safety may vary as a function of students’ own heritage,
culture, or their individual pre-conceptions and beliefs. As was demonstrated during an on-
campus meeting at WSU in the Spring 2015 semester when the faculty from Tomas Bata
University of Zlin, Dr. Eliska Pastuszkova, the Head of the Department of Finance and
Accounting, and the students from the Czech Republic perceived WSU safety quite differently
than their local peers. Several of the members of the visiting group stated that they were used
to a much safer campus and surrounding community. In order to address the concerns of
safety in the surrounding community Wichita State University has implemented a Safe Ride
program for WSU students, as reported by Jennifer Searle in KWCH 12 Eyewitness News (Searle
2011).
Safety in the areas near campus is also important because students tend to use these areas on
a more regular basis. Varying student perceptions have been manifested further during the
meetings on the WSU campus after the attacks close to campus in November 2014, as
documented in an article by Ashley Arnold (2014).
9
In her study of the perception of campus safety among the students at the University of Mary
Washington, Ratti found four general conclusions. First, she found that in general students felt
safe on campus. She also found that the majority of students never use the campus security
services and that the students were generally either neutral or satisfied with campus security
services. Finally she found that the students felt least safe in similar locations on campus (Ratti
2010).
This information has helped to show some areas that might be important for the research of
this project. Her first three conclusions show that it might not be necessary to increase campus
security services because they are underutilized and unnecessary for developing the perception
of a safe campus. Ratti’s fourth conclusion could have several applications. If this study is able
to locate the areas on campus where students feel the least safe, stepping up campus security
in these areas could help to address these concerns. It could also show where campus
renovation might be advantageous to add lighting or create alternate routes to allow students
to avoid certain portions of campus.
Studies have been performed that provide evidence showing a strong relationship between
perceptions of safety and the physical environment. Students may not feel safe on campus due
to certain territorial factors such as darkness, lack of surrounding people, lack of surveillance,
run-down quality of buildings and grounds, and poor maintenance. These factors in general
contribute to the greater fear for students (Loukaitou-Sideris and Fink, 2009). This is consistent
with the result of Day (1994), which indicated that the inadequacy of lightning makes students
more fearful of crime at night. Furthermore, the structure or specific design of campus
influences perceptions of safety. A study by Fisher and Nasar (1992) pointed out that locations
with many spaces where potential perpetrators can hide generate the highest level of fear of
crime. Students are more fearful of being attacked if the surroundings do not present a clear
path for them to make an escape (Loukaitou-Sideris and Fink, 2009). Moreover, Valentine
(1990) classified public areas which are perceived to be threatening into two main categories,
areas with limited exits and desolated open spaces. Based on these research findings as well as
an analysis of certain territorial factors on campus, a list of factors has been compiled to assist
students in defining the concept of campus safety. This list will contain multiple physical
10

elements such as lightning, the presence of crowds, conditions and structures of grounds and
buildings, and particular areas of campus and will be discussed later in this report.
Not only do the structural and environmental factors of the surroundings effect the
perception of campus safety, but the time of day when a student is present on campus will also
affect his or her definition of campus safety. Sloan, Lanier and Beer (2000) claimed that
students reported a higher level of fear at night than during the day. In a survey by McCreedy
and Dennis (1996), the number of students who avoided enrolling in night classes due to fear
accounted for 27 percent of the total respondents. This will be an important factor in the
research carried out in this project.
In her study of the factors affecting the perceptions of safety on campus, Kirk focused on the
geographical and architectural elements of the University of Illinois at Urbana-Champaign. Her
study showed that the main factors contributing to students feeling unsafe in an area of
campus are the availability of places where someone could be hiding and the lighting of the
area. Kirk also found that popular myths about a location on campus affected student’s
perceptions of the safety of that location. Finally, Kirk found that gender plays a large role in
determining if a student will perceive campus to be safe or unsafe (Kirk 1988).
Kirk’s study helps to point out several areas that will be important to research as a part of this
project. As with Ratti’s study the location on campus and physical features of that location play
an important role and will need to be explored in the study of the perceptions of campus safety
at WSU. Kirk also brings up the point that even fictional stories can affect the perception of
campus safety. This might fall outside of the scope of this research project, but is important to
consider and might be valuable for future research considerations. Also the determination that
gender plays a role in perception of campus safety will be important to the research at Wichita
State. This project will need to take these differences into account and determine their effect
on the student perceptions of campus safety.
A study by Fisher and Sloan (2003) insisted that “gender is the strongest predictor of
fear of victimization.” Women are more likely to report a greater fear level for all types of
crime on campus than men (Fisher and Sloan, 2003). In contrast to women, men do not tend to
11

perceive being alone or seeing strangers especially at night on campus as a threat (McCormick,
Nadeau, Provost, Gaeddert, and Sabo 1996). The explanation for these differences comes from
the fact that most women do not possess a strong physical ability to defend themselves
(Loukaitou-Sideris and Fink, 2009). As a result, women are more likely to take safety
precautions than are men (Currie, 1994).
12

4.0 Exploratory Research
In order to measure the student body perception of “campus safety,” first it must be defined.
This is the goal of the exploratory research.
There are many aspects to campus safety, and these aspects are subjective. Some people
believe that having an adequate police force is the most important factor, while others believe
that adequate lighting at night is the most important thing to make them feel safe.
The first step to define campus safety was to use secondary data research to determine what
made students feel safe and unsafe on a college campus. This research is reflected in the
literature review above. It was determined that the defining characteristics of a safe campus
are:
Well maintained buildings and grounds
Spread out areas – clear escape routes
Adequate lighting
Presence of police officers
Presence of a lot of people
Some factors that have been highly debated topics at the state and national level were also
included:
Ability/inability to carry a concealed firearm on campus
Student access to mental health and psychology professionals
Active shooter training classes
From this research a list of 10 concepts was developed that adequately defined campus safety.
In order to narrow this list to five concepts that could be measured with a short survey.
The next step was to take this list of 10 items to students, in the form of the short survey that
was created, and have them determine the most important factors to them. Simply put, an
understanding of student’s thoughts concerning the five most important aspects of campus
13

safety were desired. This was important information because the students’ definition of
campus safety was needed in order to accurately measure their perception campus safety.
A short exploratory survey was created that consisted of three questions. The first question
was merely to identify whether or not the individual being surveyed was a student at Wichita
State. The second question asked the respondent to identify as a male or female. As shown in
the literary review section, the research indicates there are significant differences between
men and women in regards to feeling safe on campus. In the final question, the respondents
were asked to identify the most important characteristics of a safe campus. The list of 10
characteristics, as discussed previously, were provided to the respondents who were asked to
pick the top five most important factors that contribute to their perception of safety on
campus.
This short survey was administered to 20 students. If the respondent did not identify as a
student, they were not included in the results because this project only seeks to identify how
students feel about campus safety. The survey was administered via a mobile tablet computer.
Students were approached on campus and told this survey was for a class as a part of the MBA
program. They were asked if they would “take one minute to fill out the three-question survey
regarding campus safety.” This approach was used because it was believed that identifying the
researchers as students and indicating that it would take a short amount of time to complete
would give the best chance for a student to agree to take the survey. The survey was
administered via a tablet to give the students and their responses more anonymity. It was
believed that there would be less social desirability bias with this method than with paper
surveys that would be collected by the researchers after completion. The tablet also enabled
the use of a survey-creating program called Survey Monkey. Survey Monkey is a free tool that
was used to create a simple and easy to understand survey, and it tabulated all of the results.
Once the respondents completed the survey, the top five most selected results from question
three were identified. These five factors became the concepts used to define campus safety.
The questions in the main questionnaire are all designed to measure these concepts.
14

Below is a copy of the survey and a list of the top five defining characteristics of campus safety
chosen by students:
4.1 Short Exploratory Survey
1. 1 Are you currently a student at Wichita State University
o Yes
o No
2. Are you male of female?
oMale
o Female
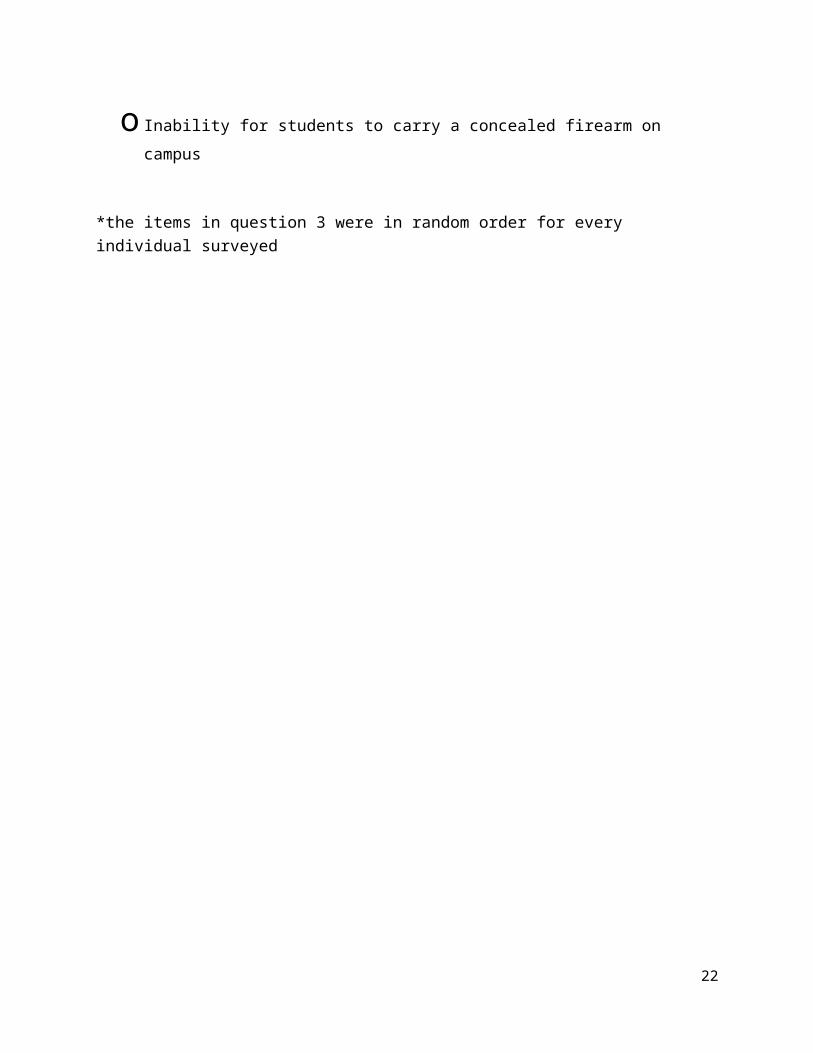
3. Which of the following factors would make you feel most safe on a college campus? (choose five)
o A well-lit campus
o Adequate sized police force
oWell maintained buildings and grounds
o A large number of people on campus
o Access to mental health and psychology professionals
o Active shooter training
o Campus emergency buttons
o Large, spread out areas
o Ability for students to carry a concealed firearm on campus
o Inability for students to carry a concealed firearm on campus
15

*the items in question 3 were in random order for every individual surveyed
4.2 Results of Exploratory Survey
List of each item and the number of times it was selected in order from the most selections to
the least.
16

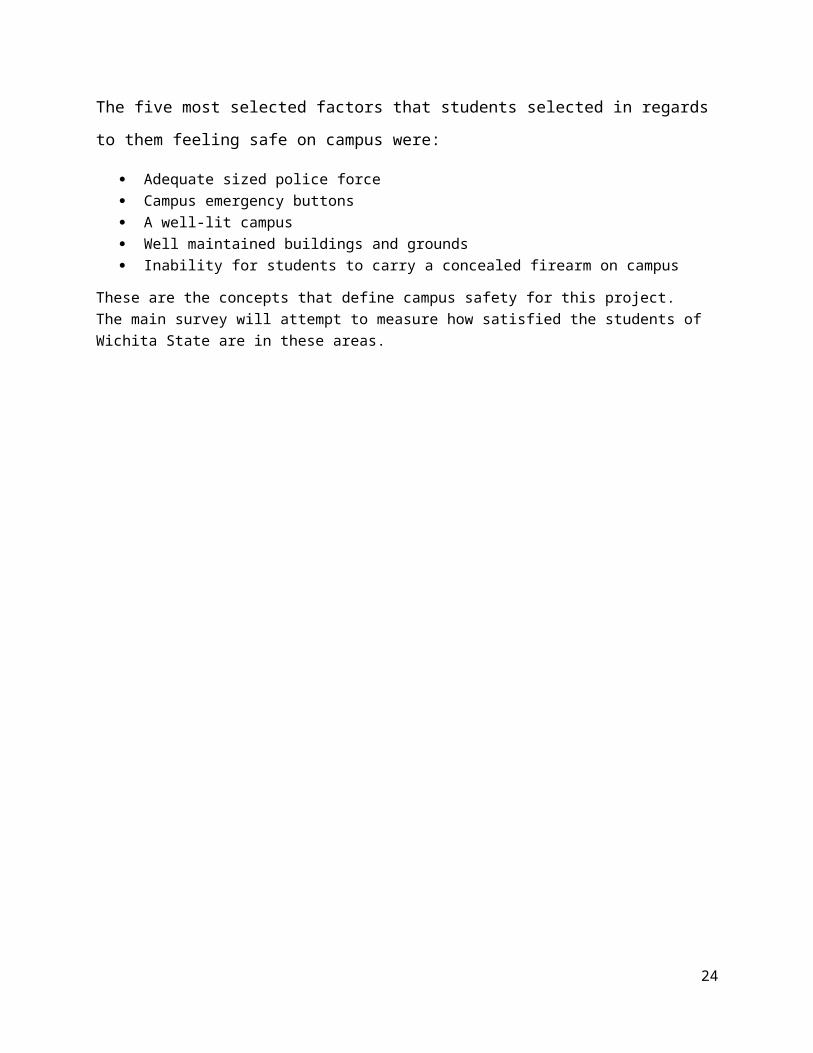
The five most selected factors that students selected in regards to them feeling safe on campus
were:
Adequate sized police force Campus emergency buttons A well-lit campus Well maintained buildings and grounds Inability for students to carry a concealed firearm on campus
These are the concepts that define campus safety for this project. The main survey will attempt to measure how satisfied the students of Wichita State are in these areas.
17

5.0 Research Questions and Objectives
The question this research seeks to answer is: What is the perception of the Wichita State
University Student Body regarding campus safety?
The objectives that need to be executed in order to answer this question are:
Determine the factors that are the most important to students in regards to campus
safety. Use the students to define “campus safety.”
Determine how well the students feel Wichita State is addressing these factors.
It is important to note that measuring “perception” is an attempt to measure a subjective
concept. That is why it is extremely important for the students to help to define “campus
safety.” In order to get an accurate measure of how students feel about campus safety, their
definition of campus safety must first be understood and used to develop the final survey.
Students might feel like Wichita State is meeting the state’s definition of a safe campus, but
that doesn’t mean they feel safe on campus.
Identify how Wichita State University compares to other Universities of similar student
body size in campus safety and crime statistics including campus arrests, campus arrests
per capita, and violent crimes per capita.
The secondary data analysis shown above addresses this information. This objective is
important because it gives an indicator as to how safe Wichita State University is compared to
similar campuses. It gives an indication as to how Wichita State is actually performing in
regards to campus safety. More analysis may be necessary as the research progresses and
more factors are uncovered.
The ultimate beneficiary of this data is Wichita State University. It will give the University an
idea of how they are performing in campus safety compared to other colleges, and it will also
give insight as to how students feel about Wichita State campus safety. If students do not feel
safe on campus, and WSU does not compare well to other Universities in campus safety, it may
be an indicator that WSU is not a safe campus. If students do not feel safe on campus and WSU
18

is doing comparatively well in campus safety, it may be an indicator that students need to be
educated on all of the programs and safety procedures that WSU already has in place.
The students might also benefit from this research. The research may indicate that WSU needs
to do more to secure the campus. The research might also indicate that WSU is a safe campus,
and that students just need a reminder of all of the safety programs and procedures that the
school already has.
19

6.0 Methodology
6.1 Population and Sampling
The target population for this project is narrow; it will include students at Wichita State
University who attend classes at the main campus (1845 Fairmount St.).
It was originally thought that the sample frame would include the entire target population and
that would be used to conduct a probability sampling method because of the well-defined
target population. The original plan was to use the University’s survey program called Qualtrics
to send a survey out to students via their student email addresses. Simple random sampling
was going to be the sampling technique.
However, access to the email accounts that made up the desired sample frame was not
granted. Dr. Steven Farmer reported that University does not want spam to go out to students
through their email addresses, and that it would not be possible to email them a survey via
Qualtrics.
It was decided to utilize a non-probability sampling method with the unit of analysis being
individual students. A convenience sampling method will be employed by approaching
individuals at the Rhatigan Student Center on the Wichita State University Campus and asking
them to take the survey. The RSC is a social hub on campus, and it is one of the busiest
buildings on campus during the day. 200 students will be surveyed: 100 males and 100
females. The time of day when students are approached will also vary so the sample will be
comprised of students who are on campus at different periods during the day. This is important
because students who have night classes may feel different about campus safety than students
who have morning classes, so this technique will attempt to reach students in several different
time frames.
6.2 Proposed Data Collection Techniques
The primary method of data collection will be a self-administered questionnaire, and the
sample will be reached via an intercept method. The questionnaire has been developed to
20

measure the “concepts that define campus safety” that have been identified through the
exploratory research.
Once the questions for the survey have been created, they will be put into an electronic survey
using the Survey Monkey mobile application. The survey will then be available to administer to
students via a mobile tablet computer.
Students will again be approached at the Rhatigan Student Center with the tablet in hand.
Individual members of the group will approach them, rather than the entire group. Again the
researchers will indentify themselves as students completing research for a class as a part of
the MBA program and the students will be asked to take a five minute survey pertaining to
campus safety at WSU. It is believed that students will be more willing to take a survey to help
out fellow students then they would be to take a random survey. It is also believed that they
will be willing to take a survey about campus safety as long as the survey is short.
If the student is willing to cooperate, the researcher who approached the student will hand
them the tablet and ask them to take the questionnaire. The student will be informed that the
researcher will be sitting nearby if they have any questions, and to let the researcher know
when they are done.
Once the student has finished taking the survey, the researcher will thank them for their time.
As an added incentive to thank them for their time the researchers have reached out to the
Wichita Quiktrip office and asked them to donate coupons that will be handed to students once
they complete the survey. The donation request was submitted on October 12, and the desire
is to receive a response from them in the next couple weeks.
The researchers will continue to approach students in this way until 100 males and 100 females
have agreed to take the survey. Again students will be surveyed at different times during the
day. Four different time frames will be used with 50 students being surveyed in each time
frame (25 males and 25 females). The time frames will be:
8 AM – 11 AM
11 AM – 2 PM
2 PM – 5 PM
21
5 PM – 8 PM
The data collection method is simple. Most complexity has been removed, and it will be an
effective way to collect data.
A copy of the survey has been included in the Appendix.
6.3 Instrumentation
Table 2
The main objective was to determine how WSU students felt about campus safety. This means
a nominal or ordinal scale will not provide enough data. An interval scale will have to be used
to get an accurate measure on the student body perception of campus safety. A Likert Scale is
widely accepted as an interval measurement. It is also a great way to measure customer
satisfaction, or in this case, student perception. Here is how all of the Likert Scale questions will
be coded: 1 = strongly disagree, 3 = neutral, 5 = strongly agree.
22

A Likert Scale was not used for the conceal/carry questions (questions 10 and 11) because it
was hard to word the question without making it a leading question. Nominal data was enough
to gauge the opinion on conceal/carry laws on campus, and interval data was not necessary to
get an accurate picture of whether or not it made students feel safe/unsafe.
It is believed that using mostly Likert Scale questions would speed up the data collection
process. This is important because 200 surveys need to be administered, and students do not
want to take much time to fill out a survey.
6.4 Research Design
Descriptive research will be conducted to determine student body’s perception of campus
safety. Enough background information has been gathered to know that some people believe
the WSU campus to be unsafe. However it is not known how the student body feels as a whole.
This research will attempt to “paint a picture” of the Wichita State Campus Safety scene. The
information gathered from this study may be used by the University to make decisions
regarding campus safety, or it may be used to provide a clearer avenue for additional research.
A descriptive study is appropriate because after a little bit of exploratory research, the desired
information will become clear. The exploratory research helped to define “campus safety” and
gave the initial concepts to present to the students. Now descriptive research will be used to
gain additional insight to the campus safety situation. A causal study could not be used for this
project for multiple reasons. One, there is not enough information available to conduct a
campus safety causal study. It is not known if the student body feels safe or unsafe on campus,
so causality in regards to campus safety cannot be determined.
There are a few sources of bias and systematic error that this research will seek to mitigate.
One is social desirability bias. It is a concern that if the anonymity of the students is not
protected during the administration of the survey, they will be not honest with us if they feel
unsafe on campus. It is believed that this bias will be especially present in males. The survey
will be administered via tablet to reduce this error. Once participants have submitted the
survey via tablet, no identifiable information will be attached to their responses.
23
Using a tablet has also helped in the elimination of data-processing errors. Originally the survey
was going to be administered via paper, which meant all of the data from the responses would
have to be manually entered into a computer to process it. This is no longer an issue.
One of the primary concerns is sample selection bias. It is believed that the time of day a
student is on campus may affect how safe they feel. This means it will be necessary to reach
students that are on campus at different times during the day. The plan is to survey an equal
amount of students in four different time frames as shown above. However, just because a
student is surveyed at 8:00 PM does not mean they are consistently on campus during that
time of day. Surveying students in different time frames will help to reduce this error, but it will
also be necessary to include a survey question that asks students to clarify what times they are
most often on campus.
Sample selection bias may exist in another area as well. International Students make up a
significant population of the WSU campus. As noted in the literary review, international
students may feel different about campus safety than domestic students. We will attempt to
survey 10-20 international students, but a sample selection bias may still be present.
There is a chance an extremity bias will present itself in the responses if some of the students
interviewed have had bad experiences on campus. This issue will be discussed further with Dr.
Farmer if it becomes an issue in the research.
Issues with the initial plan to administer the survey via email included self-selection and non-
response bias. It was a concern that students would not care enough to take the survey and
that students who were very concerned about campus safety would be more likely to take the
survey. By personally administering the survey on campus it is believed that both of these
sources of bias have been substantially reduced.
One of the most important aspects of the survey was to keep it short. It is desirable to not take
up very much the students’ time in order to increase the likelihood of participation and to
reduce the time required to administer the survey. It was determined to be in the best interest
of the researchers and the the students to have a small number of questions. The survey was
limited to 11 questions, and even though four questions are Likert scales that require multiple
24

responses, it is anticipated that the survey will take no longer than five minutes to complete.
The time taken to complete the survey will be measured as part of the pre-test.
6.5 Project Schedule and Budget
6.5.1 Schedule
Monday, October 19, 2015: Survey will be administered to 10-20 students as a pre-test.
Revisions will be made.
Monday, October 26, 2015: Administration of re-designed survey will begin.
Wednesday, November 11, 2015: Data will be coded for analysis using standard coding
procedures.
Wednesday, November 18, 2015: Data analysis will be completed.
Sunday, November 29, 2015: Report will be finished and presentation will be prepared.
6.5.2 Budget
$0.00 has been budgeted for this research project. The research design was created with this in
mind.
25

7.0 References
Arnold, Ashley. November 14, 2014. Wichita State hosts meeting on safety after attack
close to campus. Ksn.com. http://ksn.com/2014/11/18/wichita-state-hosts-meeting-on-
safety-after-attack-close-to-campus/. Retrieved 12th October, 2015.
Clery Center, Jeanne Clery Act Text, http://clerycenter.org/sites/default/files/Jeanne
%20Clery%20Act%20Full%20Text.pdf, 2008.
College factual.
http://www.collegefactual.com/colleges/wichita-state-university/student-life/crime/.
Retrieved 10th October, 2015.
Currie, Dawn H. 1994. Women’s Safety on Campus: Challenging the University as
Gendered Space. Humanity & Society 18 (3): 24-47
Day, K. 1994. Conceptualizing women’s fear of sexual assault on campus: A review of
causes and recommendations for change. Environment and Behavior 26: 742–765.
Fisher, B. S. and J. L. Nasar. 1992. Fear of crime in relation to three exterior site features:
Prospect, refuge, and escape. Environment and Behavior 24: 35–65.
Fisher, B. S., and J. J. Sloan. 2003. Unraveling the fear of victimization among college
women: Is the “shadow of sexual assault hypothesis” supported? Justice Quarterly 20:
633–659.
Hattersley Gray, R. 2014. Ranking colleges on safety won’t protect students, but this
safety checklist will. Campus Safety Magazine,
http://www.campussafetymagazine.com/article/ranking_colleges_on_safety_wont_pro
tect_students_but_this_checklist_will April 15, 2014
Kirk, N. L, 1988. Factors Affecting Perceptions of Safety in a Campus Environment.
Environmental Design Research Association, EDRA 19.
Loukaitou-Sideris, Anastasia and Camille Fink. 2009. Addressing Women’s Fear of
Victimization in Transportation Settings. Urban Affairs Review 44 (4): 554-587.
26
McCormick, N., R. Nadeau, J. Provost, W. Gaeddert, and A. Sabo. 1996. Feelings of
safety, fears, and knowledge and the use of public safety resources. Campus Law
Enforcement Journal 26 (3): 15–18, 32–33
McCreedy, K. R., and B. G. Dennis. 1996. Sex-related offenses and fear of crime on
campus. Journal of Contemporary Criminal Justice 12: 69–80
Morrison, O. Crime rate at Wichita State about average among Kansas universities. The
Wichita Eagle, http://www.kansas.com/news/local/crime/article37396614.html
October 2, 2015.
Ratti, Cassandra L, 2010. Student Perceptions of Campus Safety at the University of
Mary Washington. Unpublished thesis, University of Mary Washington, Fredericksburg,
VA.
Searle, Jennifer. September 12, 2011. WSU continues to offer students a safe ride
home. KWCH 12 Eyewitness News.
http://articles.kwch.com/2011-09-12/wsu_30147345. Retrieved 9th October, 2015.
Sloan, J. J., M. M. Lanier, and D. L. Beer. 2000. Policing the contemporary university
campus: Challenging traditional organizational models. Journal of Security
Administration 23: 1–20.
U.S. Department of Education, Office of Postsecondary Education, The Campus Safety
and Security Data Analysis and Cutting Tool,
http://ope.ed.gov/Security/GetDownloadFile.aspx, 9/27/2015.
Valentine. G. 1990. Women’s fear and the design of public space. Built Environment 16
(4): 288-303.
Wichita State University, Jeanne Clery Disclosure of Campus Security Police and
Campus Crime Statistics, Annual Security and Fire Safety Report,
http://webs.wichita.edu/?u=police&p=/annualsecurityreport/, October 1, 2015.
Willis, J. G. 2015. The dispositions of effective college public safety officers. Campus
Safety Magazine,
http://www.campussafetymagazine.com/article/the_dispositions_of_effective_college_
public_safety_officers May 8, 2015
27
8.0 Appendix
Draft of Survey
This survey will be pretested before it has been administered
28
29

30

31

32

33