Embed Size (px)
Citation preview

Project Portfolio Valuation
with Enterprise Architecture
Anastasia Maria Krisnawati M.Sc. Thesis August 2015
Supervisors:
Dr. Maria-Eugina Iacob
Dr. Ir. Marten J. van Sinderen
Dr. Lianne Bodenstaff
Faculty of Electrical Engineering,
Mathematics & Computer Science

ii
MASTER THESIS
PROJECT PORTFOLIO VALUATION WITH
ENTERPRISE ARCHITECTURE
ANASTASIA MARIA KRISNAWATI
S1341677
Master of Science in Business Information Technology
University of Twente
Enschede, The Netherlands
Graduation committee
Dr. Maria-Eugenia Iacob, University of Twente
Dr. Ir. Marten J. van Sinderen, University of Twente
Dr. Lianne Bodenstaff, BiZZdesign

iii
Acknowledgement
Praise the Lord, for His blessing and giving me strength so that I can finish my master degree study at
University of Twente.
This thesis report is the result of my final project for Business Information Technology MSc program at
University of Twente. The research has been conducted as a graduate internship assignment at
BiZZdesign B.V. It has been a very challenging yet gives me valuable learning experience. Thus, I would
like to acknowledge the people that support, encourage and contributed to this work.
Firstly, I would like to give my gratitude to my supervisors from University of Twente: Ms. Maria Iacob
and Mr. Marten van Sinderen for their guidance, critical feedback and helpful input so that I can finish
my thesis. My sincere thanks also to Ms. Lianne Bodenstaff from BiZZdesign for her support, motivation,
guidance and helpful input. I would like to pay my thanks to Mr. Dick Quartel for giving me the
opportunity doing internship in BiZZdesign and give freedom of choosing my research topic. I would not
have been able to finish this thesis graduation assignment without all of your support.
Secondly, I would like to thank the Ministry of Communication and Information Technology of the
Republic of Indonesia (MCIT), to give me the opportunity in pursuing my master study through its
scholarship program.
Thirdly, to all my friends in Enschede who color my life here. Retno, Rindia, Iwan and all PPIE members
that make me feel like home in Enschede. Shu and Zaharah, who always motivate and make seven
months doing internship and working on my thesis is enjoyable. Diego and Hao Ding, who often be my
teammates. Special thanks to Uli, Anisah and Sanny for continuous support and motivation to finish this
thesis and our study in Europe.
Last but not least, I would like to thank my beloved family in Indonesia: Bapak, Mama, Siska and Rio for
your everlasting support and never-ending prayers
Enschede, August 2015
AM Krisnawati

iv
Executive Summary
In the dynamic environment nowadays, organizations are required to transform continuously
and steadily improve their current situation in order to achieve their goals. This transformation
process could be accomplished by executing a number of projects periodically. As consequence,
the ability to assess and prioritize the projects becomes highly important, which is achieved by
performing a project portfolio valuation. However, this process in practice is often solely based
on manager’s personal belief or by using minimal portfolio method. Therefore, this research
aims at finding an approach to improve the decision making in project portfolio valuation.
Enterprise Architecture (EA) is a comprehensive concept that illustrates the business process,
application and infrastructure that could be used throughout the entire process, starting from
the design, analysis and transformation phase of the organization. In this study, we explore the
potential of using the information from EA for project portfolio valuation. Firstly, different
project portfolio methods are evaluated based on specified criteria. The criteria consist of the
possibility of using the information from EA and that the evaluation should be as
comprehensive as possible; e.g. based on financial, non-financial and risk.
EA-based Investment Portfolio method is introduced and designed based on Investment
Portfolio method combine with the information that is obtained from the architecture. Three
domains that are subjected to assessment are: business domain, technology and financial
domain. For the first two domains, the factors from Information Economics method are
adopted to score the projects. The scoring process is performed by combining the original IE
score card and the information from EA. Subsequently, the result of the appraisal process is
visualized in the bubble chart and used to specify the project prioritization.
ArchiPharma case study is carried out to demonstrate the application of the proposed method.
Semi-structured interviews with four research and business consultants are conducted to
evaluate the ease of understanding, the applicability, and the usefulness of the proposed
method. In conclusion, EA-based Investment Portfolio Method is able to facilitate the project
portfolio valuation with a comprehensive justification. It also reveals the importance of
collaboration between EA and PPM (Project Portfolio Management) in the practice.

v
Table of Contents
Acknowledgement ....................................................................................................................................... iii
Executive Summary ...................................................................................................................................... iv
Table of Contents .......................................................................................................................................... v
List of Figures ............................................................................................................................................. viii
List of Tables ................................................................................................................................................. x
1. Introduction .......................................................................................................................................... 1
1.1 Problem Statement ....................................................................................................................... 1
1.2 Research Goal ............................................................................................................................... 2
1.3 Research Objective and Questions ............................................................................................... 3
1.4 Research Methodology ................................................................................................................. 3
1.5 Structure of the Report ................................................................................................................. 5
2. Theoretical Background ........................................................................................................................ 6
2.1 Relation between EA and Portfolio Management ........................................................................ 6
2.2 Portfolio Management .................................................................................................................. 9
2.2.1 IT portfolio management step-by-step Methodology (Handler & Maizlish, 2005) ................... 11
2.2.2 Project Portfolio Management (PPM) framework by Rajegopal et al., (2007) .......................... 12
2.2.3 BiZZdesign Enterprise Portfolio Management (2014) ............................................................... 13
2.3 Enterprise Architecture ............................................................................................................... 14
2.3.1 The value of EA Framework and modeling ......................................................................... 17
2.3.2 ArchiMate Viewpoints ........................................................................................................ 19
2.4 Project Portfolio Valuation Methods .......................................................................................... 23
2.4.1 Financial Approaches ................................................................................................................. 23
2.4.2 Multi-criteria Approaches .......................................................................................................... 24
2.4.3. Portfolio Approaches ................................................................................................................ 27
2.4.4 Portfolio approaches evaluation ................................................................................................ 30
3. EA-Based Investment Portfolio Method ............................................................................................. 33
3.1 EA-based Investment Portfolio Method ..................................................................................... 33
3.2 Business domain assessment ...................................................................................................... 34
3.2.1 Strategy Match (SM) ........................................................................................................... 35
3.2.2 Competitive Advantage (CA) ...................................................................................................... 38
3.2.3 Management Information (MI) .................................................................................................. 39

vi
3.2.4 Competitive Response (CR) ........................................................................................................ 42
3.2.5 Project or Organization Risk (OR) .............................................................................................. 43
3.3 Technology Domain Assessment: ..................................................................................................... 44
3.3.1 Strategic IS Architecture (SA) ..................................................................................................... 45
3.3.2 Definitional Uncertainty (DU) .................................................................................................... 47
3.3.3 Technical Uncertainty (TU) ........................................................................................................ 49
3.3.4 IS Infrastructure Risk (IR) ........................................................................................................... 56
3.4 Financial assessment ......................................................................................................................... 59
3.5Calculation contribution to Business and Technology domain ......................................................... 60
3.6 Project Visualization .......................................................................................................................... 61
3.7 Project Prioritization ......................................................................................................................... 63
3.8 Summary ........................................................................................................................................... 64
4. Demonstration ArchiPharma Case ...................................................................................................... 65
4.1 Case Study Description ............................................................................................................... 65
4.1.1 List of projects in Archipharma ........................................................................................... 66
4.1.2 Corporate Value of Archipharma ........................................................................................ 67
4.2 Business Domain Assessment ..................................................................................................... 68
4.2.1 Strategic Match (SM) .......................................................................................................... 68
4.2.2 Competitive Advantage (CA) ............................................................................................... 72
4.2.3 Management Information (MI) ........................................................................................... 75
4.2.4 Competitive Response (CR) ................................................................................................. 78
4.2.5 Project/Organization Risk (OR) ........................................................................................... 79
4.3 Technology Domain Assessment ................................................................................................ 82
4.3.1 Strategic IS Architecture (SA) ..................................................................................................... 82
4.3.2 Definitional Uncertainty (DU) ............................................................................................. 84
4.3.3 Technical Uncertainty (TU) ........................................................................................................ 87
4.3.4 IS Infrastructure Risk (IR) .................................................................................................... 90
4.4 Financial Consequence................................................................................................................ 93
4.5 Project prioritization ................................................................................................................... 94
4.6 Project Visualization .................................................................................................................... 97
4.7 Summary ................................................................................................................................... 100
5. Evaluation ......................................................................................................................................... 101

vii
5.1 Evaluation method and interview setting ................................................................................. 101
5.1.1 Interview setting ...................................................................................................................... 102
5.2 Result and analysis .......................................................................................................................... 103
5.3 Summary ......................................................................................................................................... 104
6. Conclusion ......................................................................................................................................... 107
6.1 Answers to Research Questions................................................................................................ 107
6.2 Research Contribution .................................................................................................................... 109
6.3 Research Limitations ....................................................................................................................... 110
6.4 Recommendations for Future Research ......................................................................................... 110
References ................................................................................................................................................ 112
Appendix 1 ................................................................................................................................................ 117
Information Economic’s Business Domain (Assessment) ..................................................................... 117
Information Economic’s Technology Domain (Assessment) ................................................................ 119
Appendix 2 ................................................................................................................................................ 122
Corporate Values .................................................................................................................................. 122
Appendix 3 ................................................................................................................................................ 124
Archiparma strategic value project’s script .......................................................................................... 124
Appendix 4 ................................................................................................................................................ 126
Archiparma Risk Analysis ...................................................................................................................... 126
Appendix 5 ................................................................................................................................................ 128
Interview’s Transcript ........................................................................................................................... 128
Appendix 6 ................................................................................................................................................ 135
Archipharma’s Architecture .................................................................................................................. 135

viii
List of Figures
Figure 1: Applications for enterprise architecture (Op’t Land et al., 2009). ................................................ 2
Figure 2: DSRM Process ................................................................................................................................ 5
Figure 3: Relationships between three disciplines (Iacob, Quartel, et al., 2012) ......................................... 7
Figure 4: The triangle between strategy management, project portfolio management and enterprise
architecture(Bodenstaff et al., 2014) ............................................................................................................ 8
Figure 5 : The role of enterprise architecture (Op’t Land et al., 2009) ......................................................... 9
Figure 6 : EPM Cycle(Bodenstaff et al., 2014) ............................................................................................. 14
Figure 7: The Archimate Core Metamodel (Jonkers, van den Berg, Iacob, & Quartel, 2010) .................... 16
Figure 8: TOGAF-Archimate (Iacob & Jonkers, 2006) ................................................................................. 17
Figure 9: Motivation and implementation extension (Jonkers, Quartel, van Gils, & Franken, 2012) ....... 18
Figure 10: View Categories (Iacob, Jonkers, et al., 2012) ........................................................................... 20
Figure 11: Project Viewpoint ...................................................................................................................... 21
Figure 12: Business function viewpoint ...................................................................................................... 21
Figure 13: Architecture implementation and migration viewpoint ............................................................ 21
Figure 14: Requirements realization viewpoint .......................................................................................... 22
Figure 15: Layered viewpoint ...................................................................................................................... 22
Figure 16: Corporate Values(Parker et al., 1988)........................................................................................ 26
Figure 17: IE score card ............................................................................................................................... 26
Figure 18: SIESTA (Renkema & Berghout, 1997) ......................................................................................... 27
Figure 19: Investment Portfolio (Renkema & Berghout, 1997) .................................................................. 28
Figure 20 : Road Map(Mo A. Mahmood, 1999) .......................................................................................... 29
Figure 21: EA-based Investment Portfolio Method .................................................................................... 34
Figure 22: Business Domain Assessment Process ....................................................................................... 35
Figure 23: Business domain – SM’s process ............................................................................................... 36
Figure 24: EA-based SM's worksheet .......................................................................................................... 37
Figure 25: Architecture SM's scoring overview .......................................................................................... 38
Figure 26: Business domain – CA’s process ............................................................................................... 39
Figure 27: Business domain – MI’s process ................................................................................................ 40
Figure 28: EA-based MI's worksheet ........................................................................................................... 41
Figure 29: Architecture MI's scoring overview ........................................................................................... 42
Figure 30: Business domain – CR’s process ................................................................................................ 42
Figure 31: Business domain – OR’s process ................................................................................................ 43
Figure 32: Technology domain assessment ................................................................................................ 44
Figure 33: Technology domain – SA’s process ............................................................................................ 45
Figure 34: EA-based SA worksheet ............................................................................................................. 46
Figure 35: Archimetal SA's scoring overview .............................................................................................. 47
Figure 36: Technology domain – DU’s process ........................................................................................... 47
Figure 37: Archisurance Motivation View ................................................................................................... 48
Figure 38: EA-based DU Worksheet ............................................................................................................ 49
Figure 39: Technology domain – TU’s process............................................................................................ 50
Figure 40: EA-based TU worksheet ............................................................................................................. 53

ix
Figure 41: IT competency capability overview ........................................................................................... 54
Figure 42: Hardware dependencies scoring overview ................................................................................ 54
Figure 43: Software dependencies scoring overview ................................................................................. 55
Figure 44: Application dependencies scoring overview ............................................................................. 55
Figure 45: Technology domain – IR’s process ............................................................................................. 56
Figure 46: EA-based IR worksheet .............................................................................................................. 57
Figure 47: Architecture IR's scoring overview ............................................................................................ 58
Figure 48: Example EA-based investment Portfolio visualization .............................................................. 61
Figure 49: Portfolio Map ............................................................................................................................. 62
Figure 50 : Archiparma’s Vision, Mission and Strategies ............................................................................ 69
Figure 51: Archipharma’s Strategy Implementation................................................................................... 69
Figure 52: Five force model(Porter, 2008) .................................................................................................. 72
Figure 53: Archipharma- Business Function view- ...................................................................................... 76
Figure 54: Archipharma Roadmap view ...................................................................................................... 82
Figure 55: Archipharma's Program Motivation View ................................................................................. 85
Figure 56 : Archipharma application realization view ................................................................................ 87
Figure 57: Archipharma Infrastructure Usage View ................................................................................... 87
Figure 58: Archipharma Capability View ..................................................................................................... 88
Figure 59: ArchiPharma's Layered Architecture ......................................................................................... 91
Figure 60: Archipharma's projects overview .............................................................................................. 98
Figure 61 : First Priority Project's Overview ................................................................................................ 99
Figure 62 : Second Prioritize Project's Overview ........................................................................................ 99
Figure 63 : Third Prioritize Project's Overview ......................................................................................... 100

x
List of Tables Table 1: Thesis structure ............................................................................................................................... 5
Table 2 : Comparative overview (Project Management Institute, 2006) ................................................... 10
Table 3: Viewpoint classified by goal and level of detail (Iacob, Jonkers, et al., 2012) .............................. 20
Table 4: Necessity Criteria(Kleersnijder & Berghout, 2012) ....................................................................... 29
Table 5: Business Criteria (Kleersnijder & Berghout, 2012) ........................................................................ 30
Table 6 : Portfolio methods analysis ........................................................................................................... 31
Table 7: Overview of “Create motivation and program architecture” activity .......................................... 36
Table 8: Overview of "strategic match scoring" activity ............................................................................. 37
Table 9: Overview of "competitive advantage scoring" activity ................................................................ 39
Table 10: Overview of "create business layer architecture" activity .......................................................... 40
Table 11: Overview of "management information scoring" activity .......................................................... 41
Table 12: Overview of "competitive response scoring" activity ................................................................. 43
Table 13: Overview of "organizational risk scoring" activity ...................................................................... 44
Table 14: Overview of “Create Roadmap Architecture” activity ................................................................ 45
Table 15: Overview of “Strategic IS Architecture Scoring” activity ............................................................ 46
Table 16: Overview of “Definitional Uncertainty Scoring” activity ............................................................. 48
Table 17: Overview of “Create capability, infrastructure and application architecture” activity .............. 50
Table 18: Overview of “Technical Uncertainty Scoring” activity ................................................................ 51
Table 19: Overview of “Create layered architecture” activity .................................................................... 56
Table 20: Overview of “IS infrastructure risk scoring” activity ................................................................... 57
Table 21: Example contribution to business and IT domain ....................................................................... 60
Table 22: Project prioritization ................................................................................................................... 63
Table 23: Archipharma Corporate Values ................................................................................................... 68
Table 24: Archipharma SM's score.............................................................................................................. 70
Table 25: Archipharma CA’s Score .............................................................................................................. 73
Table 26: Archipharma MI's score .............................................................................................................. 76
Table 27: Archipharma CR's score .............................................................................................................. 78
Table 28: Archipharma’s Risk Level matrix ................................................................................................. 80
Table 29: Archipharma risk profile mapping............................................................................................... 80
Table 30: Archipharma’s OR score ............................................................................................................. 80
Table 31: Archipharma SA's score .............................................................................................................. 83
Table 32: Archipharma DU's score ............................................................................................................. 85
Table 33: ArchipharmaTU's score ............................................................................................................... 89
Table 34: Archipharma’s IR score ............................................................................................................... 91
Table 35: Archiparma's project benefit ...................................................................................................... 93
Table 36: Archipharma's Project score ....................................................................................................... 95
Table 37: Archipharma's project range score ............................................................................................. 96
Table 38 : Evaluation criteria .................................................................................................................... 102
Table 39 : Interview session summary ...................................................................................................... 105
1
1. Introduction
This chapter describes an overview of the problem statement that motivates the research,
which is followed by the research goal. Subsequently, main objective of the study and three
research questions are formulated as the structural basis to conduct the research. Lastly, the
research methodology chosen to be carried out in the research is elaborated and concluded by
the structure of the thesis report.
1.1 Problem Statement
Project portfolio selection and associated activity of managing selected projects throughout
their lifecycles are important activities in many organizations (Archer & Ghasemzadeh, 1999).
At the beginning of a year, a semester, or a quarter, the executive board in an organization will
have to reach an important decision to select and execute a number of critical project
proposals. The list of the projects in an organization, either public or commercial, can be
influenced by internal and external factors. Internally, an organization needs to transform the
current situation into a better condition in the future based on their goals, by executing the
critical projects. Externally, they need to face and deal with their changing environment in their
business. For example, the projects could be proposed to meet customers’ demands, adapt to
new regulations, etc. Thus, selecting and ranking the proposed projects is an initial and
important activity for an organization.
Nowadays, most modern organizations are all heavily dependent on the smooth operation of
Information System (IS) to support their industrial production, service provision, and business
administration (Deng & Wibowo, 2008). Thus, a number of proposed IT projects will continue to
exist depending on the necessity of the organization. With the increasing number and
complexity of IT projects, the tension to make timely decisions in fluctuating environments
intensifies the difficulty in ranking the projects. Proper justification is needed to be able to
come up with a ranking list that accommodates different perspectives; e.g. multiple selection
criteria, a possibility of subjective assessments, budget constraints, overlapping with other
projects, and the organization’s strategy alignment.
Along with the aforementioned issues, a structured and comprehensive approach is required to
analyze the given list of the IT projects. Moreover, this approach is expected to optimize a
particular goal that the organization considers as the most important one. By this means,
Enterprise Architecture(EA) gives a coherent whole of principles, methods, and models that are
used in the design and realization of an enterprise’s organizational structure, business
processes, information systems, and infrastructure (Lankhorst, 2005). With the use of

2
enterprise architecture (EA)-based method, an organization can have a holistic view of the
enterprise as the basis of their analysis process. (Jensen, Cline, & Owen, 2011)
Furthermore, according to Martin Op’t Land et al., a project is aimed to realize parts of the to-
be situation. In doing so, the projects need to have a clear view of the to-be and the as-is
situation (Op’t Land et al., 2009). They also identify seven key applications for EA that provide
an instrument to ensure compliance, governance, and informed decision-making regarding the
transformation from the as-is to the to-be situation. Figure 1 highlights these seven
applications: situation description, strategic direction, gap analysis, tactical planning,
operational planning, selection of partial solutions and solution architecture.
Figure 1: Applications for enterprise architecture (Op’t Land et al., 2009).
Hence, the EA-based method can give a comprehensive approach in order to make a list of
ranked projects as a means to support the investment decision making process. In spite of this,
only a few researches have implemented this approach. Ring S.J. et al. conducted a research of
an integrated architecture-based investment decision at the U.S. Department of Defense (DoD),
implemented with the linkage of an integrated DoDAF architectures and their portfolio analysis
tool(Ring, Lamar, Heim, & Goyette, 2005). Another study by Quartel D. et al. also formalized IT
portfolio valuation by using enterprise architecture and business requirements modeling, which
is realized using ArchiMate and BiZZdesign Architect (Quartel, Steen, & Lankhorst, 2010).
1.2 Research Goal
The purpose of this research is to develop an EA-based method for project portfolio valuation.
The proposed method here is used in the early process of project management in prioritizing a
set of projects that needs to be defined in order to transform their organization from the
current state to the desired situation in the future. The research focuses on defining the criteria
to valuate projects which taking into account financial, non-financial, risk and architecture

3
perspectives. By conducting a literature study, we develop a comprehensive project portfolio
valuation method and use the architecture as an input. Therefore, this thesis aims at finding an
approach to improve the decision making of project portfolio valuation using Enterprise
Architecture.
1.3 Research Objective and Questions
Based on the goal in the previous section, we define the main objective of this study as follows:
“To develop an EA-based method for project portfolio valuation”
Afterwards, three research questions are formulated to investigate the process of developing
the method. The research questions are:
RQ1 . Which project portfolio valuation techniques can be the basis for the EA-based method?
RQ1.1. What are the existing techniques for project portfolio valuation?
RQ1.2. What are the criteria for choosing the project portfolio valuation technique?
The first research question and its sub-questions aim to seek the suitable basis method(s) that
support the decision making process and could extract the information from EA. After gathering
the possible available methods from literature studies, the basis method will be selected based
on the defined criteria.
RQ2. How can EA support the project portfolio valuation?
RQ2.1. What is the relationship between EA and portfolio valuation?
RQ2.2. What information could be taken from EA to support project portfolio valuation?
The second research question and its sub-questions investigate the concrete information from
EA to serve project portfolio valuation. First, the relationship between EA and project portfolio
valuation is discussed as the background concept. Afterwards, the potential information that
could be used as an input in the portfolio valuation process is presented.
RQ3. How to design an EA-based method for project portfolio valuation?
After addressing the previous research questions and gathering the relevant information, the
third research question aims to design the proposed method and achieve the main objective.
1.4 Research Methodology
In this study, the Design Science Research Methodology (DSRM) by Peffers et al. (2008) is
carried out to conduct the research. Six activities which are defined in DSRM will be used to
address the previous research questions (as illustrated in Figure 2).

4
Problem Identification and motivation
The importance of establishing a ranking from the given list of projects in an organization is
addressed in section1.1. Furthermore, the motivation behind the research conducted in this
thesis is also described. As mentioned before, EA-based method is chosen to rank the projects
to improve the decision making of project portfolio valuation with comprehensive justification.
Define the objectives of a solution
Research goal is formalized to ensure that the research advances in the intended direction.
Afterwards, the main objective and three research questions are determined to elaborate a
detailed guideline for achieving the objective of the research.
Design and development
Literature review will be conducted in the research to give an insight into the important
concepts related to the proposed method. It is carried out as a part of the development
method to investigate various methods that are used to establish a project ranking. After
reviewing relevant literatures in order to formulate the important concept of the developed
method, an analysis will be carried out by means of making criteria to evaluate the existing
method based on BiZZdesign’s needs.
Demonstration
The proposed method could be demonstrated to solve one or more instance of the problem
using experimentation, simulation, case study, proof or other appropriate activity. In this
research, the efficacy of the method is executed by the use of the Archipharma case study from
BiZZdesign.
Evaluation
For the evaluation, an interview with EA consultant(s) will be held for further notice on the
strength and weaknesses of the method. Analysis of the interview’s result will also be carried
out by the author.
Communication
In the end, the research is delivered in the form of a thesis report and a presentation to the
committee to elaborate the complete processes from problem identification and its
importance, the artifact, its utility and novelty, the rigor of its design, and its effectiveness
(Peffers et al., 2008).

5
Figure 2: DSRM Process
1.5 Structure of the Report
The thesis report is structured in six chapters to communicate the process of defining the method to the readers. Furthermore, it is also the outcome of the thesis project as a whole. As shown in Figure 2, Chapter 1 acquaints the reader to the major highlight of the report. The identification of the research problem and motivation behind it is also defined in Chapter 1 (Introduction). In the next chapter, the summary of literature review about the important concepts and techniques that are related to project portfolio valuation and EA are described. Furthermore, in Chapter 3, the development of EA-based project portfolio valuation method is clarified with the explanation of the selected criteria. Chapter 4 illustrated the feasibility of the method by using it in Archipharma case study in BiZZdesign that showed the project valuation processes. After showing the implementation of the method, the evaluation of the method is presented in Chapter 5. This chapter aims to evaluate the efficacy of the method by means of interviews. Finally, Chapter 6 comprises the research with the conclusion and answers of the entire research questions. The highlight about the structure of the thesis report is shown in Table 1.
Table 1: Thesis structure
Chapter Activities Research Questions
1 Introduction Problem identification, motivation, research goal, research objective and questions, and research methodology.
2 Literature Review Theoretical background of key concepts (Strategy, EA and Portfolio Management), Selection of the reference method.
RQ 1 – RQ 2
3 Design and method development Design of proposed method.
RQ 3
4 Demonstration ArchiPharma case study.
5 Evaluation Interview sessions.
6 Conclusion Answers to research question, research contribution, research limitations, future works and recommendations.
All research questions
Identify Problem & Motivate
Improving decision
making process
Chapter 1
Define Objective of a Solution
Develop EA-based method for project portfolio valuation
Chapter 1
Design & Development
EA-based
method for project portfolio
valuation Chapter 2 & 3
Demonstration
Case study in BizzDesign Chapter 4
Communication
Thesis Report
Evaluation
Interview sessions
Chapter 5
Process Iteration

6
2. Theoretical Background
This chapter aims to provide relevant existing literature on the relationship between Business
Strategy, Enterprise Architecture, Portfolio Management and Portfolio Management Methods.
Section 2.1 underlines the relationships between EA and Portfolio Management, then in Section
2.2 and 2.3 details information about portfolio management and EA is described respectively.
Finally, Section 2.4 discusses the existing portfolio management methods.
2.1 Relation between EA and Portfolio Management
As discussed in the Introduction, this research explores the application of using information
from EA to improve the decision making of project portfolio valuation. EA is a coherent set of
descriptions, covering a regulation-oriented, design-oriented and patterns-oriented perspective
on an enterprise which can help organizations and their transformations processes in
successfully executing their strategy (Op’t Land et al., 2009). While project portfolio valuation is
one of the process in the Portfolio Management, which is an approach of managing a collection
of projects based on the organization's goals. In this section, the relationship between EA and
Portfolio Management is discussed further to get theoretical background for developing an EA-
based method for project portfolio valuation.
In order to develop a Project Portfolio Valuation method from EA perspective, the relationship
between related fields (Strategy, EA and Portfolio Management) and how they influence each
other are explained afterwards. To do so, three (3) sources are discussed to demonstrate the
use of Portfolio Management based on an EA perspective by using an EA modeling language.
The further discussion is provided in the following paragraphs.
First, M. E. Iacob et al. (2012) identify three related disciplines that need to be aligned with
each other in order to achieve certain goals of an organization. They are business strategy, EA
and Projects and program that are related to each other and contribute to the success of
business requirement management. How those three components are related to each other is
shown in Figure 3. In this figure, Projects and programs represents portfolio management.

7
Figure 3: Relationships between three disciplines (Iacob, Quartel, et al., 2012)
Several aspects which are embodied in the business strategy are strategic goals, resources,
competencies and capabilities that an organization aims to achieve in the future. Business
requirement management derives the strategy into more concrete goals and requirements to
form tactical and operational planning. Moreover, some of architecture elements realize these
goals and requirements, while others are emphasized on the projects and programs. The
dashed arrows among the related fields indicate the indirect contribution of EA and Projects
and Programs to the business strategy for the goals and requirements.
Portfolio management uses the tactic that an organization employs to achieve its strategy,
whereas the “operation” is captured by the EA via the contribution of IT artifact, such as
software services and applications, to improve the business processes, services and products of
the organization.
In this research, we mainly focus on the relationship between EA and portfolio management as
a means of an organization to evaluate the projects. Furthermore, we investigate the existing
methods and techniques for the appraisal of IT investment. More exploration on how EA and
portfolio management is investigated in the research in order to assist an organization to reach
a better decision making process with holistic consideration in managing their portfolio that
eventually lead them to achieve their goals.
The second literature is provided by Bodenstaff et al., (2014) which addressees multiple
disciplines ; strategy management, portfolio management and EA (shown in Figure 4) that are
involved in the planning and implementation of large business transformation.

8
They argued that EA provides an organization the basis to analyze and communicate the
information on the impact changes to close the gap between strategy planning and
implementation.
Figure 4: The triangle between strategy management, project portfolio management and enterprise
architecture(Bodenstaff et al., 2014)
Similar to both previous studies (M. E. Iacob et al., Bodenstaff et al. ), Op’t Land et al. (2009)
also depicted the relation between strategy, EA and Programme Management (shown in Figure
5). They started with a problem in executing a strategy which the research revealed that less
than 60% of an organization’s strategic objectives were actually reached. Thus, they considered
that an instrument is urgently needed to support the process of executing the strategy. Two
primary requirements for the instrument are “organizing the organization” and “change
management”. The first requirement demands the formulated strategy to be more specific,
unambiguous, achievable, relevant and actionable, while at the same time is capable to provide
an overview of the desired future state and the impact of change with respect to the current
state. The second requirement is to achieve a common understanding and to share the
commitment among all stakeholders that are involved. Consequently, a common language and
models are required as a tool for an effective communication among the stakeholder. In more
concrete and detail points, they identified seven key applications for enterprise architecture:
1. Situation description; Examining (shortcoming) problems in advance, including the
existing situation.
2. Strategic direction; Conveying (and motivate) the forthcoming direction of the enterprise
and investigate various alternatives.
3. Gap analysis; determining key problems, challenges issues, impediments, chances, etc.
and also enacting well-motivated design decision to enable the organization to move from
the current situation into the desired strategic direction.
4. Tactical planning; Specifying boundaries and determining plateaus (intermediary steps)
for the enterprise transformation with regards to the strategic direction.

9
5. Operational planning; Providing obvious context and direction for a portfolio of projects
working against the realization of the first plateau as specified in the tactical planning
level.
6. Selection of partial solutions; Choosing one or more standard solution and/or packages
that become part of the solution.
7. Solution architecture; producing high level design of current step for the transformation
of the enterprise that will be realized (and implemented) with a specific project.
Figure 5 shows the relation between the three fields which are strategy, architecture and
program management that are used for the governance of the enterprise transformation. Here,
EA provides a “dashboard” that gives a perspective for the architect and stakeholders to steer
the enterprise’s transformation process. The term of “dashboard” highlights the relevant
aspects of the existing state of the enterprise, its future direction and the desired state of the
enterprise.
Figure 5 : The role of enterprise architecture (Op’t Land et al., 2009)
In this section, we discussed three sources that give a strong motivation regarding the relation
between Strategy management, EA, and Portfolio Management. It describes that after defining
its strategy formulation, an organization needs to synchronize the three fields (Strategy, EA and
Portfolio Management) in order to achieve their goals. In the following section, the Portfolio
Management and EA are discussed in depth to gain more insight to establish a portfolio method
from EA perspective.
2.2 Portfolio Management
Following the general description of the relationship between business strategy, EA, portfolio
management, a thorough explanation of portfolio management is elaborated provided in this
section. According to Project Management Institute (PMI), project management and program

10
management have traditionally focused on “doing the work right”, while portfolio management
is concerned with “doing the right work”.
PMI defines portfolio as a collection of projects (temporary endeavors undertaken to create a
unique product, service or result) and/or programs (a group of related projects managed in a
coordinated way to obtain benefits and control which is not available from managing them
individually) and other work that are grouped together to facilitate the effective management
of that work to meet strategic business objectives.
In order to realize the strategic business objective, a portfolio should be managed in a process
that is called as portfolio management. Project Portfolio management is an approach to achieve
strategic goals by selecting, prioritizing, assessing, and managing projects, programs and other
related work based upon their alignment and contribution to an organization’s strategies and
objectives (Project Management Institute, 2006). Table 2 summarizes the comparative
overview of Project, Program and Portfolio Management from PMI (2006). It shows that
portfolio management deals with the business scope related to the goals of an organization.
Thus, it combines (a) an organization’s focus of ensuring that the selected projects for
investment meet the portfolio strategy with (b) the project management focus of delivering
projects effectively and within their planned contribution to the portfolio (Project Management
Institute, 2006). Table 2 : Comparative overview (Project Management Institute, 2006)
PROJECT PROGRAMS PORTFOLIOS
Projects have a narrow scope with specific deliverables
Programs have a wide scope that may have to change to meet the benefit expectations of the organization.
Portfolio have a business scope that changes with the strategic goals of the organization.
The project manager tries to keep change to a minimum
Program managers have to expect change and even embrace it.
Portfolio managers continually monitor changes in the broad environment.
Success is measured by budget, on time, and products delivered to specification.
Success is measured in terms of Return On Investment (ROI), new capabilities, and benefit delivery.
Success is measured in terms of aggregate performance of portfolio components.
Leadership style focuses on task delivery and directive in order to meet the success criteria.
Leadership style focuses on managing relationships, and conflict resolution. Program manager’s need to facilitate and manage the political aspects of the stakeholder management.
Leadership style focuses on adding value to portfolio decision-making.
Project managers manage technicians, specialists, etc.
Program managers manage project managers.
Portfolio managers may manage or coordinate portfolio management staff.
Project managers are team players who motivate using their knowledge and skills.
Program managers are leaders providing vision and leadership.
Portfolio managers are leaders providing insight and synthesis.

11
Project managers conduct detailed planning to manage the delivery of products of the project.
Program managers create high-level plans providing guidance to projects where detailed plans are created.
Portfolio managers create and maintain necessary process and communication relative to the aggregate portfolio.
Project managers monitor and control tasks and the work of producing the projects products
Program managers monitor projects and ongoing work through governance structures.
Portfolio managers monitor aggregate performance and value indicators
From the practical perspective, Gartner (2013) defines Portfolio Management as a shift from
the practice of using a single integrated application for supporting business requirements to use
a collection of application, technologies and services to create a system that addresses the
unique requirements of an organization and leverages best-of-breed opportunities.
The stakeholders of an organization have an important role and are involved in portfolio
management of projects and programs, which includes, but not limited to (Project
Management Institute, 2006):
- Executive managers
- Portfolio review board
- Portfolio managers
- Sponsor
- Program managers
- Project managers
- Program or Project Management Office
- Project team
- Operations management
- Functional managers
- Finance managers
- Customers
- Vendors or Business partners
-
Nevertheless, the portfolio management approach would not be sufficient by solely clarifying
its definition and the stakeholders in the abstract level. A clear and concrete stepwise or
method is needed in an organization to handle their portfolio management. Three methods are
selected and discussed in the following sections to give a concrete insight into the portfolio
management. The methods are selected based on their completeness provided by the method
related to the relevant feature discussed in portfolio management.
2.2.1 IT portfolio management step-by-step Methodology (Handler & Maizlish, 2005)
According to Handler & Maizlish (2005), IT portfolio management is a tool that supports
companies during times of both robust growth and economic downturn. It consists of three

12
primary phases: IT discovery portfolio, IT project portfolio, and IT asset portfolio. IT discovery
contains a typical longer-term IT investment. A typical medium-to short-term investments are
included in the IT project phase. Eventually, IT asset phase defines the existing operation and
maintenance investment. A proven process for applying IT portfolio management is identified
by them consisting of eight stages:
(1) Develop an IT portfolio management game plan: to specify the objective of IT portfolio
management.
(2) Planning the IT portfolio: to determine the investment strategy.
(3) Create IT portfolio: to create and store both current and planned projects. The as-is
portfolio is captured in a standardized business case and located in a centralized database.
Defining the project’s metric and building a portfolio view to compare investments against
each other. The assessment can be made in the basis of several dimensions such as;
technical condition, business value and risk. Thus, a consistent and standardized set of
criteria with threshold levels should be established.
(4) Assess IT portfolio: to assess and measure the portfolio against the target continuously,
while taking into account the internal and external possible trigger events. The review
process should be conducted at least on a quarterly basis. It also suggests frequently
evaluating and updating the business case for each project.
(5) Balance IT portfolio: A committee of senior management identifies the optimal allocation
of investment by determining trade-offs within the portfolio. The portfolio refers to the
investments that have been selected and funded by the same committee.
(6) Communicate IT portfolio: It suggests that the communication regarding the goals, status
and what needs to be changed in the portfolio must occur throughout all phases to the
entire relevant stakeholder.
(7) Develop and evolve IT governance and organization: This stage defines the roles and
responsibilities in the portfolio management process.
(8) Assess IT Portfolio management process execution: Finally, the execution of the projects is
evaluated based on the goals defined in the game plan (phase 1).
2.2.2 Project Portfolio Management (PPM) framework by Rajegopal et al., (2007)
Rajegopal et al., (2007)design a high-level view of the PPM framework to provide an overview
for the organization with regard to where they should start, and what is the makeup of the PPM
process. A PPM framework needs to be designed to map the health/contribution data for each
project onto the business decision criteria and needs to empower managers with the ability to
see whether a project either sufficiently meets or exceeds the threshold indicator, thereby
identifying portions of the portfolio that are out of compliance (Rajegopal et al., 2007). The
PPM framework at a minimum should include four processes:
(1) Portfolio definition, strategy alignment and ideas management

13
The first process is to define the terms, scope, domain and definition of the portfolio. The
variables to be considered are domain or scope of organizational coverage include within
the portfolio, scope of included work, the key performance indicators (KPIs) and type of
scoring models. Afterwards, a strategy alignment is established to recognize what the
organization considers as important. Thus, strategic objectives should be clearly defined.
To be more specific, three processes are suggested to be implemented: the current state
assessment (what is), the future state vision (what should be), and the gap analysis (how
to), for defining the business goals and strategies. Lastly, the idea management is defined
as the capabilities for managing idea systematically. Thus, the framework suggests ten
typical steps: creation, categorization, consolidation, exploration, ensuring strategic fit,
business case preparation, commercialization, technology assessment, project registration
and submission.
(2) Resource and business capability analysis
In the second process, three steps are suggested to run resource and business capability
analysis. Determining the resource demand and constraint is the first step. It is followed
by creating resource supply and demand scenarios as the second step and finally
allocating the resources.
(3) Portfolio selection, prioritization and authorization
In this process, the key issues that need to be addressed are: documenting a detailed
inventory of projects, developing a value ranking for each project based on the tactical
criteria and strategic objectives, analyzing and identifying project risks vs. benefits, and
developing an idea of an optimum or acceptable size of the project pipeline.
(4) Portfolio execution and monitoring
Five steps are suggested in executing and monitoring the portfolio, that are: Gathering
project portfolio information, measuring and analyzing the project portfolio, analyzing the
impact of changes towards the project portfolio, reviewing portfolio changes and
reforecasting, and lastly communicating and implementing portfolio changes.
2.2.3 BiZZdesign Enterprise Portfolio Management (2014)
BiZZdesign is a spin-off from a large (multi million) research project that was found in 2001 in
the Netherlands. (http://www.bizzdesign.com). As an innovative and a leading business design
company, BiZZdesign continually delivers added value to their customers in order to improve
their businesses more effectively by developing and sharing innovative solutions. BiZZdesign
provides integrated solutions consisting of design tools, training, business consultancy and best
practices to achieve the true business agility. In the Project Portfolio Management fields,
BiZZdesign designs an Enterprise Portfolio Management (EPM) cycle that contains several key
elements that are required for a successful implementation process in an organization
(Bodenstaff et al., 2014). EPM is an integrated portfolio management approach that tightly

14
manages the strategy planning based on various portfolios of interdependent assets, for
instance product portfolios and project portfolios (Bodenstaff et al., 2014). It consists of two
phases (shown in Figure 6): the design phase and the execution phase which contains three
activities respectively. In the design phase, the relevant stakeholders firstly define their goals
and afterwards the portfolios are aligned with the goals, and finally the stakeholders formulate
a valuation model that conveys their concerns. In the execution phase, the stakeholders store
and analyze assets and projects first. Subsequently, they visualize the portfolio score of the
applicable metrics, which are depicted in the dashboard to facilitate their concerns. Dashboards
are a powerful way to address such concerns in a direct way (Bodenstaff et al., 2014). Finally, a
decision-making on investments in assets or projects can be made using the result in the
portfolio as an input review.
Figure 6 : EPM Cycle(Bodenstaff et al., 2014)
In general, the two previous portfolio methods (Maizlish& Handler, Rajegopal et al) are
summarized in the BiZZdesign’s EPM cycle. First, the goals need to be defined, along with the
portfolio based on the concern of the decision-maker. A valuation model is then carried out to
give a prioritization of the proposed projects/assets and finally to execute the portfolio as well
as monitor and keep this process as a lifecycle instead of a finite process. In accordance with
the objective of the research, the focus on the valuation process in BiZZdesign’s EPM cycle will
be performed with the utilization of the information gained from the EA. In the next section, a
discussion of the EA is provided to gain a clear insight into this topic.
2.3 Enterprise Architecture
The concept of EA has been raised over the last decade to deal with the business and IT
complexity. It could be used to address several issues in an organization that requires a holistic
approach such as (Iacob et al., 2012):
- The increasing complexity as a result of mergers and acquisitions, outsourcing, internet,
mobility, e-business, etc.;
- High IT cost;

15
- The organization of main processes from business’ perspective and IT’s perspective e.g.,
lack of trust, difference in perspective, or conflict of interest;
- Lack of control on IT costs;
- Lack of control on the effects of business changes on supporting information systems.
Iacob et al., (2012) specify the concept of EA as a complete, consistent and coherent set of
methods, rules, models and tools which guides the (re)design, migration, implementation and
governance of business processes, organizational structures, information systems and the
technical infrastructure of an organization according to a vision. From the best practice
perspective, Gartner (2015) defines EA as a discipline for proactively and holistically leading an
enterprise’s response to disruptive force by identifying and analyzing the execution of change
toward desired business vision and outcome. EA delivers value by presenting business and IT
leaders with signature-ready recommendations for adjusting policies and projects to achieve a
target of desired business outcomes that capitalize on relevant business disruption. EA is used
to steer decision making towards the evolution of the future state architecture. Moreover,
referred to Gartner, EA can be used by an organization to control decision making towards the
evolution of the future state architecture, which in this research referred as a target
architecture which define the desired future situation according to an organization’s vision.
While the current situation is referred as baseline architecture.
An organization typically will apply EA’s concept by following a specific EA framework, which
maps all of the software development processes within the enterprise and how they relate and
interact to fulfill the enterprise’s mission (Urbaczewski & Mrdalj, 2006). Furthermore, Iacob et
al., (2012) determine three ingredients in Enterprise Architecture; a framework, a language and
a process. A framework represents the subdivision of architecture in different domains
including the relationship between these domains. A language defines the concepts for
describing an architecture while a process provides a step-wise prescriptive method for
developing architectural descriptions.
TOGAF (The Open Group Architecture Framework) is known as one of the leading enterprise
architecture methods (Iacob et al, 2012). With TOGAF Architecture Development Method
(ADM), a stepwise, iterative process for the development and implementation of an EA can be
carried out. It consists of ten phases, (depicted in figure 7) which can be grouped into four main
parts as follows (Iacob et al, 2012):
1. “Getting the organization committed and involved”. This section consists of a
preliminary phase and phases A (Architecture vision). The preliminary phase includes
preparatory measures of the organization, e.g., establishing an architecture capability,
tailoring the architecture methods and techniques and determining an initial set of

16
architecture principal. With the architecture vision, the formulation of architecture vision
is performed with a high-level overview of the change that is envisaged.
2. “Getting the architecture right”. Phase B (business architecture), Phase C (information
system architectures and Phase D (technology architecture) are included in this section.
Three types of baseline and target architecture (business, information system and
technology) is developed as well as its gap analysis.
3. “Making the architecture work”. Three subsequent phases are enclosed in this part. It
explores the implementation and migration planning to the desired situation. First, in
phase E, Opportunities and Solutions, the result of gap analysis is consolidated while the
required work packages are determined. It is then followed by Phase F, Migration
planning, in which the work packaged is prioritized while a migration plan is created.
Lastly, in Phase G, Implementation Governance, the compliance of the implementation
projects is maintained by using the architecture.
4. “Keep the process running”. In the last phase, Change Management, the new critical
requirements that appear during the architecture development cycle are identified.
Figure 7: The Archimate Core Metamodel (Jonkers, van den Berg, Iacob, & Quartel, 2010)
Along with TOGAF, Archimate is introduced to define an actual modeling language. There are
two dimensions in the Archimate core (Figure 8); layer dimension that represents a successive
abstraction level to be modeled, and aspect dimension which reflects different concern of the
enterprise that need to be modeled. As depicted in Figure 8, there are three layers in the layer
dimension (Iacob et al, 2012):
17
- Business layer describes the value proposition, business strategy and the working model
of the enterprise.
- Application layer determines applications that are employed to deliver services to
support all the processes in the business layer of the enterprise.
- Technology layer represents the infrastructural services needed to run the application.
For the aspect dimension, three aspects are identified as follows:
- The structure aspect, that determines actors that are involved and how they are related
to each other.
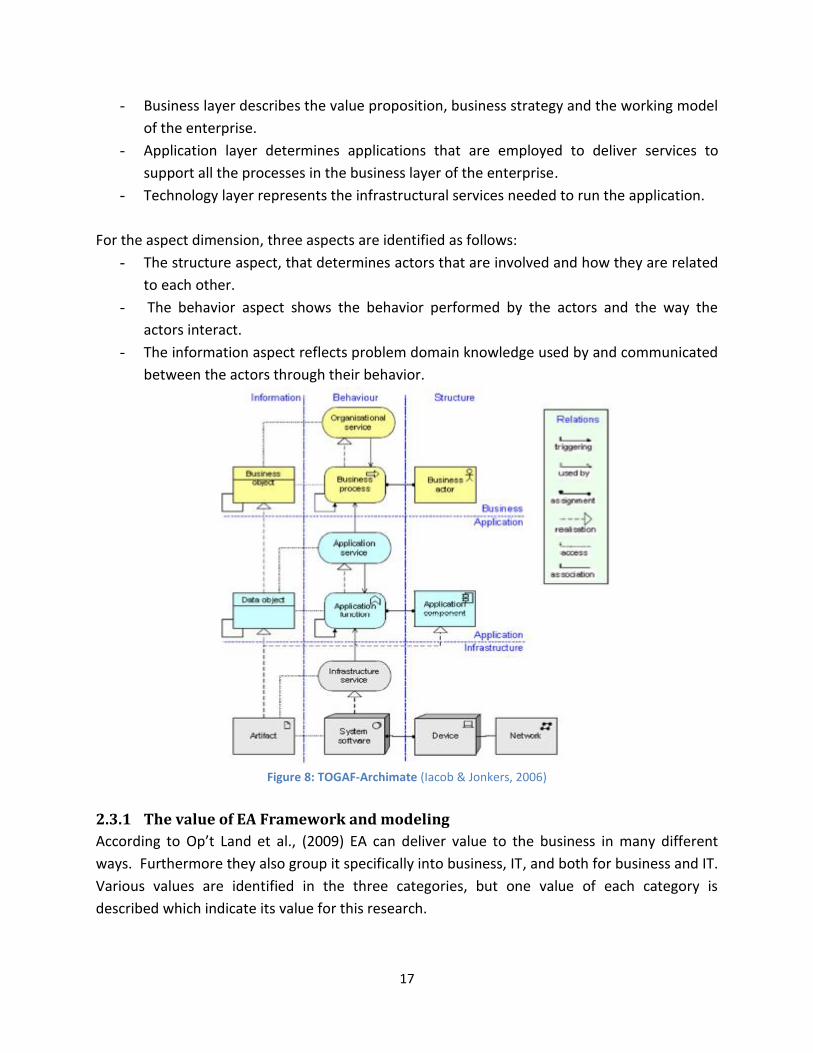
- The behavior aspect shows the behavior performed by the actors and the way the
actors interact.
- The information aspect reflects problem domain knowledge used by and communicated
between the actors through their behavior.
Figure 8: TOGAF-Archimate (Iacob & Jonkers, 2006)
2.3.1 The value of EA Framework and modeling
According to Op’t Land et al., (2009) EA can deliver value to the business in many different
ways. Furthermore they also group it specifically into business, IT, and both for business and IT.
Various values are identified in the three categories, but one value of each category is
described which indicate its value for this research.

18
Translating strategy in executable projects is one of the values of EA for the business
stakeholder. The modeling tool in EA is able to facilitate the organization to portray the high
level goal or strategy into detailed project. In the Archimate, EA’s modeling language that
followed TOGAF framework; realize this value in the motivation extension and implementation
and migration extension. Figure 9 shows the summary of these two extensions.
Figure 9: Motivation and implementation extension (Jonkers, Quartel, van Gils, & Franken, 2012)
The second group is the value of EA for IT. The value of EA for IT that is pointed out in this
research is EA ensure effective IT planning and management of IT roadmaps (and portfolio
management), also enabling improved planning for resource skills and training and including
application portfolio rationalization. This value is realized since EA gives clear picture of the
organization’s structure and development, from different viewpoint, during various stages of
the transformation process (Bodenstaff et al., 2014).
The last category is the value of EA for business and IT. It improves business and IT alignment,
allowing, for example, the identification of misalignment of individual projects with strategic
outcome in the early stages. This is similar to the first value for business stakeholder, from the
EA model; an organization can identify its entire projects and align it with the goal of the
organization. From the process of modeling, then the misalignment can be identified as early as
possible.

19
2.3.2 ArchiMate Viewpoints
In order to maintain a coherent enterprise architecture which represents complex activities in
an organization, various people with diverse backgrounds are needed to be involved. Thus,
various architectural frameworks (e.g TOGAF, Zachman framework) are developed to explain
the architectural description in accordance with its stakeholder. However, the problem of
looking at enterprise architecture through the lens of an architectural framework is that it
categorizes and divides architectural descriptions rather than providing insight into their
coherence (The Open Group, 2012). ArchiMate accommodate this problem with a flexible
approach in which architects and other stakeholders can define their own views on
architecture. A definition of view and viewpoints are described in the ArchiMate 2.1
specification. A view is defined as a part of an architecture description that addresses a set of
related concerns and is addressed to a set of stakeholder. A Viewpoints specify the view, which
prescribe the concepts, models, analysis techniques, and visualizations that are provided by the
view (The Open Group, 2012). In the specification documents, these two concepts are
simplified, where a view is what you see and a viewpoint is where you are looking from.
There are 15 viewpoints in the ArchiMate core viewpoints, 6 viewpoints in the motivation
extension, and 3 viewpoint in the implementation and migration viewpoints. In total, there are
24 viewpoints and it is classified into two dimensions; the purpose and the content of views
(Iacob et al., 2012). The purposes of the views are:
- Designing
Architects and designers are supported by the design viewpoints in the design process
from initial scratch to detailed one.
- Deciding
With the decision support viewpoints, the managers get a more insight into cross-domain
architecture relationships that support the decision-making process.
- Informing
Informing viewpoints aim to inform the stakeholders about the architecture so that they
can acquire an understanding and commitment.
While the content of a viewpoint consists of following abstraction levels:
- Details
The content typically considers one layer and one aspect of the ArchiMate framework.
- Coherence
The view here includes multiple layers or multiple aspects.
- Overview
This is an abstraction level that addresses both multiple layers and multiple aspects.

20
Figure 10: View Categories (Iacob, Jonkers, et al., 2012)
The list of viewpoints which its goal is for deciding and informing is presented in Table 3. The
stakeholders can choose from the list to support both the decision-making process and
communication process by presenting models that will give more insight about a specific
concern. Figure 11-15 show some of the concepts and relationships of ArchiMate viewpoints
described by M.E Iacob et al (2012).
Table 3: Viewpoint classified by goal and level of detail (Iacob, Jonkers, et al., 2012)
Goal/ level Detail Coherence Overview
Decide Actor cooperation view
Stakeholder
Goal refinement
Goal contribution
Principles
Requirements realization
Motivation
Landscape maps
Layered view
Service realization view
Organization structure
view
Business process
cooperation view
Business products view
Stakeholder
Goal refinement
Principles
Requirements realization
Motivation
Landscape maps
Layered view
Motivation
Programs and projects
Migration
Implementation and
migration
Inform Organization
Business function
Business process
Information structure
Application structure
Application behavior
Technology infrastructure
Actor cooperation
Business process
cooperation
Application cooperation
Product
Stakeholder
Goal refinement
Service realization
Implementation and
‘deployment’
Application usage
Layered view
Motivation
Programs and projects

21
Stakeholder
Goal Refinement
Goal contribution
Principles
Requirements realization
Motivation
Principles
Requirements realization
Motivation
Migration
Implementation and
migration
Figure 11: Project Viewpoint
Figure 12: Business function viewpoint
Figure 13: Architecture implementation and migration viewpoint

22
Figure 14: Requirements realization viewpoint
Figure 15: Layered viewpoint

23
2.4 Project Portfolio Valuation Methods
There is immense number of categories of IT investment methods provided by various
researchers. The practitioner also has seen this as an essential for them, since a number of
financial, hardware and human resources are invested by the organization to achieve their
goals. Managers still draw some of their IS investment decisions on so-called “acts of faith”, i.e.
on their intuition and instincts (Walter & Spitta, 2004). The investment decision is a result of
some implicit and non-transparent process, that based on, mostly qualitative, business cases,
mixed with politics and power (Bodenstaff et al., 2014). Thus, the research in this topic is seen
as an important theoretically and practically to help an organization have a better decision
making process. One way to help the decision-making process in the organization is by
providing a list of project ranking from their project’s list. To provide the ranking of the project,
each project should assess with sufficient method. A number of existing IT valuation methods
are described in the next section, to give a theoretical foundation in this research and give
various insights about the technique for support IT/IS (information technology/ information
system) investment decision. Four basic approaches proposed by Renkema & Berghout(1997)
are adopted as a guideline to determine a number of methods distinguished by financial
approach, multi-criteria approach, and portfolio approach.
2.4.1 Financial Approaches
Most of the organizations used financial technique to assess the proposed project, so that the
return value of the investment can be evaluated. The methods regarding assessment of the
financial value are also discussed in number of literature (Schnierderjans et al, Renkema et al,
Irani et al). The majority of financial methods are:
- Net Present Value (NPV)
The net present value is the technique for discounting all the costs (consumed cash flows) and
benefits (generated flows) of a project to the present value of money (Roditi, 2014). Typically, if
the result of this appraisal is more than zero, the project can be approved.
Limitation: The decision-maker is considered to have an aversion to risk (Renkema & Berghout,
1997) and many IT investment decisions are not made based on longer-term cash flows
(Schniederjans et al, 2004)
- Payback Period (PP)
Payback Period is the period between the moment that the IS investment is made and the
moment that the total sum of the investment is recovered through the incoming cash flow
(Renkema & Berghout, 1997). It is the most extensively used financial methodology to evaluate
IT investment project, because of the simplicity and familiarity (Schniederjans et al, 2004).

24
Limitation: This method would appear counterproductive to those IT/IS deployments that seek
long-term flexibility and integration (Irani & Love, 2002)
- Internal rate of return (IRR)
Internal rate of return or discounted-cash-flow rate of return is the discount rate that makes
the NPV of a project equals zero (Schinerdejans et al). The project considers as beneficial, if the
IRR is greater than the opportunity cost of capital.
Limitation: Schinederjans et al describes two problems exist with the IRR. First, there may be
more than one IRR that equates the NPV of investment to zero, and in many situations the
opportunity cost of capital may not be equal for each cash flow.
- Return on Investment (ROI)
Return on Investment evaluates profitability based on total investment, both debt and equity
(schinerdejans et al). It is a ratio of the profit to the total cost showing how many times the
profit of the IT investment (benefit minus costs) is higher than the capital spent for the
investment (Roditi, 2014).
Limitation: Although the calculation is quite simple, but it ignores the time value of money.
2.4.2 Multi-criteria Approaches
Information System (IS) investment not only can be expressed in monetary term, there are
other positive or negative non-financial consequences. Methods from the multi-criteria
approach can be used to compare the different consequences on an equal basis (Renkema &
Berghout, 1997).
- Information Economics
Information economics evaluates IS investment by three criteria; enhanced ROI, Business
domain and Technology domain. The enhance ROI not only looks at cash flows, arising from
cost reduction and cost avoidance, but also provides some additional techniques to
estimate incoming cash flows by value linking, value acceleration, value restructuring, and
innovation valuation (Renkema et al). Five factors are assessed in the business domain:
1. Strategic Match (SM)
This factor is assessed on the degree which an information technology project
supports or aligns with enterprise or line of business stated strategic goals.
2. Competitive Advantage (CA)
This factor is rated on the degree to which the project facilities automated inter-
organizational collaboration or other competitive advantages.
3. Competitive Response (CR)
Competitive response evaluates the degree to which failure of the system will cause
competitive damage to the enterprise.

25
4. Management Information (MI)
The assessment of this factor depends on the degree to which the project provides
management information on the core activities of the enterprise or line of business
5. Organizational Risk (OR)
This factor measures the degree to which the organization is capable of carrying out
the changes required by the project.
Technology domain factors are:
1. Strategic Information System (IS) Architecture (SA)
This factor assesses the degree to which the project is aligned with the overall
information systems strategies.
2. Definitional Uncertainty (DU)
Definitional uncertainty measures the degree to which the requirements and/or the
specification are known.
3. Technical Uncertainty (TU)
This factor evaluates the readiness of the technology domain to undertake the project.
Four assessments consist of: skills required hardware dependencies, software
dependencies, and application software.
4. IS Infrastructure Risk (IR)
IS infrastructure risk is rated on the degree of nonproject investment necessary to
accommodate the project.
The evaluation process in the business and technology domain is scored and range from 0-5,
the detail score card for each factor are listed in Appendix1, and the calculation of IE score
card is depicted in Figure 17. The measurement calculates the values of the business and
technology domain factors multiplied by the weight. The weighting proposed by Parker et al.
(1988) is based on four quadrants in the corporate values; Investment, strategic,
infrastructure and breakthrough management, is showed in Figure 16. The detail weight value
for each quadrant is described in Appendix2.

26
Figure 16: Corporate Values(Parker et al., 1988)
Evaluator Business Domain Technology Domain
ROI SM CA MI CR OR SA DU TU IR
Business Domain
Technology Domain
Where: ROI = Enhance simple ROI SM = Strategic Match CA = Competitive Advantage MI = Management Information CR = Competitive Response OR = Organizational Risk SA = Strategic IS Architecture DU = Definitional Uncertainty TU = Technical Uncertainty IR = IS Infrastructure Risk
Figure 17: IE score card
- SIESTA (Strategic Investment Evaluation and Selection Tool Amsterdam)
University of Amsterdam designed a multi-criteria method that supported by several
questionnaires and additional software (Renkema et al, 1997). Figure 18 shows the general
evaluation criteria in the SIESTA’s model; contain business and technology domain. In detail, it
consists of seven business criteria, six technological criteria, four business risks, and eight
technological risks. The SIESTA method probably is the one of the most comprehensive multi-

27
criteria methods available to the evaluator (Renkema & Berghout, 1997), yet it difficult to use
because the various number of the criteria.
Figure 18: SIESTA (Renkema & Berghout, 1997)
2.4.3. Portfolio Approaches
- Bedell’s Method
Bedell’s method presents a decision support for IS resource allocation by answering three
questions (Quartel et al, Renkema et al, Shuurman et al):
1. Should the organization invest in information systems?
2. On which business processes should the investments focus?
3. For which activities within these processes should information systems be developed or
improved?
The main idea of this method is the balance needed between “effectiveness of the information
system” and “their level of strategic importance”. In order to answer the three questions and
calculate the balance ratio, a number of information needs to be specified (Quartel et al.,
2010):
The importance of each business process to the organization
The importance of each business activity to the business process
The effectiveness of an information system in supporting business activities
The contribution of each information system and three portfolios (organization-level portfolio,
business process-level portfolio, and activity-level portfolio) are used to prioritize the
investment proposals. The importance of the system multiplied with the improvement of
quality after development is used to determine the contribution of an IS. Finally a Project-
Return index (PRI) could be calculated by relating the contribution of the IS to the development
costs (Renkema & Berghout, 1997).

28
- Investment Portfolio
In this method, IS investment proposals are evaluated based on three criteria simultaneously
(Renkema & Berghout, 1997), then mapped into Figure 19. It evaluates an IT investment’s
contribution the following three criteria;
The contribution to the business domain.
The contribution to the technology domain.
The evaluation criteria of the information economics method are used to measure the
business and technology contribution (Schniederjans et al., 2004).
The financial consequences, by means of net present value (NPV) calculation. The size of
the circle on the map indicates the NPV value.
The visualization of the portfolio depicts in Figure 19; the contribution to technological domain
plot on the horizontal axis and contribution to business domain on the vertical axis.
Figure 19: Investment Portfolio (Renkema & Berghout, 1997)
- Road Map
A road map for the evaluation of IT investment is formalized by Mo A. Mahmood (1999) as
shown in Figure20, is made based on three major consideration :
(1) The process of evaluating all types of IT investments should assess both tangible and
intangible benefits. Even though each type of IT investment could need different
consideration, most IT investments entangle both quantitative and qualitative benefit to a
certain degree.
(2) Assessing the risk of IT investments also seen as something urgent and required in the IT
evaluation process to ensure the benefits fairly compensate the risks.
(3) The process argues to evaluate intangible benefits and risks prior to tangible benefit.
Since in cognitive psychology recommend for individual confronted with both qualitative
and quantitative factors simultaneous consideration, tends to decide more into the
concrete factors than the abstract criteria.

29
The road map can be used, first by measuring the benefits and risks on the left, and then selects an appropriate evaluation method on the right.
Figure 20 : Road Map(Mo A. Mahmood, 1999)
- Hourglass Method
In the Hourglass method, the portfolio management is developed for non-profit organization;
the municipality of Groningen. Prioritization is chosen for the portfolio method design. To
ensure a proper prioritization, projects have to be set against certain criteria and need to be
weighed (Kleersnijder & Berghout, 2012) . The method is based on two main categories of
criteria; being ‘necessity’ and ‘business’. Table 4 shows the list of the necessity criteria, while
for the business criteria are indicated in Table 5. Each project will be scored using the weight
scoring model (two main categories), then divide it as priority one (score=>80 point), priority
two (score >60 and <80 point), priority three (score < 60 point). The status of the project (time,
finance and resource) also indicated by green, orange and red color. Table 4: Necessity Criteria(Kleersnijder & Berghout, 2012)
Necessity Weight Description Score
0 1 2
Legal necessity 24 A change in existing legislation or new legislation as a result og the project. Example: under usual Law Disclosure of public law restrictions, a digital registration system is required
Project has no legal necessity
Project has no clear legal necessity
Project has a legal necessity
Political priority
18 A change in existing local policy or new local policy as a result of the project,
Project has no political priority
Project has a partial political priority
Project has a high political priority
Public interest 18 The project is directly relevant to citizens. This can be both a direct and an indiriect interest. Example: Expansion of digital
Project has no interest for civilians
Project has a partial interest for civilians
Project has a high interest for civilians
Management Support
Competitive Advantage
Business Transformation
Multi-objective, Multi-criteria
Value Analysis
Critical Success Factors
IT benefits / risks to be measured
Step 1 : Intangible Benefits Evaluation
IT evaluation methods may be used
Step 2 : IT Investment Risk Analysis
Step 3 : Tangible Benefits Evaluation
Physical Risks
Managerial Risks
Real Options
Risk Portfolio Approach
Delphi Approach
- Return on Investment - Cost-Benefit Analysis - Real Options - Risk Portfolio Approach - Delphi Approach - is - Return on Management - Information Economics
Productivity and Operating Process Performance

30
services on the website
Necessity Weight Description Score
0 1 2
Organizational necessity
12 The project is important for the development of the organization. Example: Replacement of an application with another application, making the organization work more effectively.
Project has no organizational necessity
Project has a partial organizational necessity
Project has a high organizational necessity
Technical necessity
12 A project must be executed technically. Hardware/software is replaced/outdated or support has stopped: a project is technically necessary or a prerequisite for another project.
Project has no technical necessity
Project has a partial technical necessity
Project has a high technical necessity
Table 5: Business Criteria (Kleersnijder & Berghout, 2012)
Business Weight Description Score
0 1 2
Communality 8 The implementation of the project affects a large part of the organization. For example: The introduction of the ‘Complaints’ system for all departments.
No communality. It is department related.
Some communality between departments
High communality. It affects all departments.
Time 6 A project that is under pressure and has certain deadlines.
No direct effect on the organization.
Project should be completed within two years
Project should be completed within one year.
Return 6 Projects with a return on investments; Clarified in the business proposal
Project does not get finances returned.
Project possibly gets finances returned.
Project gets finances returned.
ICT vision 3 Project that is part of the ICT vision.
Project does not fit into the ICT vision.
Project partly fits into the ICT vision.
Project fits into the ICT vision.
Finance 3 The basis of the funding of the project.
Finance and budget are not arranged.
Finance and budget might be arranged.
Finance and budget are arranged.
2.4.4 Portfolio approaches evaluation
In this section, a brief comparative evaluation of the portfolio approach is carried out to specify
which of the existing method can be adopted to develop an EA-based IT investment in the
valuation process in the Portfolio lifecycle. The criteria to be used for the evaluation are
subsequently:

31
- Evaluation criteria
Financial, non-financial and risks are used as the factors in the evaluation criteria. Since
the consequence of IS investment not only can be evaluated based on the monetary term,
but also non-financial one. Risks also should be considered by the stakeholder when they
prioritize the project.
- Ease of Use
As the objective of this research is to give recommendations for the organization by
providing a list of projects that have already been prioritized. The ease of use is required
to give the organization a clear insight and rapid decision making processes.
- Information from architecture
Investigate the extraction processes from the architecture also needed, thus the
developed method can be assigned as an EA-based analytical method.
Table 6 : Portfolio methods analysis
Bedell’s Method
Investment Portfolio Road Map Hourglass’s Method
Evaluation Criteria
Financial No preference Return (NPV) ROI/ROM None, only the status of financial budgeting
Nonfinancial Quality and importance
Business and IT domain Critical Success Factors Necessity and business’ criteria
Risks None Deduction from expectation
Risk analysis None
Ease of Use More difficult Quite easy Quite easy Quite easy
Information from Architecture
Effectiveness & importance of
IT in the architecture
relation
Possibility to obtain the information of IT domain,
Risk assessment
Possibility takes the risk assessment from
architecture, modeled the CSF as a goal in the
architecture
Less possibility
From the evaluation depicted in Table 6, the Investment portfolio, road map and Hourglass’s
method have fulfilled the evaluation criteria and the ease of use compared with Bedell’s
method. However, the road map does not provide a guideline to summarize the result of the
overall method. A portfolio’s dashboard could be used to plot the intangible and tangible
evaluation in the horizontal and vertical axis, with additional color to define the risk level.
In the evaluation criteria, Bedell’s method does not conduct the risk evaluation mechanism in
their method. Moreover, architecture-based approach to IT valuation using extended Bedell’s
method has been carried out (Quartel et al., 2010). The Hourglass method seems to have the
least possibility to get the information from architecture, since most of data that could be used
in the evaluation criteria is based on the interview with the relevant stakeholder.

32
The information portfolio appears to become the most convenient reference method for
valuation process analysis in this research. The author suggested using the criteria from
information economics to evaluate of business and technology domain. Furthermore,
information economics give clear quantification of two domains by using the scorecard of each
factor. However, further investigation is needed to seek the relevant information that could be
gained from the architecture. Other relevant literature about the EA-based analysis also could
be used, so that can give insight information for the organization to combine the method and
utilize the information from the architecture.

33
3. EA-Based Investment Portfolio Method
This chapter illustrates an EA-based Investment Portfolio method for valuation process in
BiZZdesign’s EPM cycle. Firstly, a brief overview of the method is described in section 3.1, then
the detail explanation about the factors needed to be assessed and the mechanism to
collaborate with organization’s architecture is provided.
3.1 EA-based Investment Portfolio Method
An EA-based Investment Portfolio method is elaborated in this section. As described in section
2.4.4, the original method evaluates three criteria simultaneously (Renkema & Berghout, 1997):
the contribution to business domain, the contribution to technology domain and the financial
consequences. The assessment of business and technology domain is performed by means of
information economics method. In order to develop an EA-based investment portfolio method,
the information from EA will be included in two factors of business domain: SM and MI, and all
factors of technology domain. Furthermore, a weight-scoring is applied to rank the project
score.
Figure 21 shows the high-level process in the EA-based investment portfolio method. In the
business domain, two of the four factors in the business domain: Strategic Match (SM) and
Management Information (MI) will use the information taken from the EA. Detailed information
about the requirement of the architecture and the type of architecture’s viewpoint are
explained in section 3.2. The information extracted from the EA is used to carry out the
assessment for each particular factor. For the rest of the factors, competitive strategy and risk
analysis are the input to perform the assessment process. Subsequently, the original IE score
card is used for these three factors, but an EA-based IE score card is defined for the previous
two.
Four criteria in the technology domain will use the information taken from the architecture, as
the basis to perform an assessment in the technology domain. Section 3.2 describes the
assessment mechanism; from extracting the architecture’s information to the scoring in the
technology domain. And section 3.3 describes the formula to calculate the financial
consequence. Finally, the project’s value can be calculated from the formula in the Information
Economics Method, then the three criteria of EA-based investment portfolio method is
visualized in the bubble chart. From this valuation process, the relevant stakeholders will
receive a number of prioritized projects based on their project’s value for each program in the
organization’s portfolio. With the project value score, the organization not only can get the
prioritize project, but also can analyze the mapping of the project from three dimensions;

34
contribution to business domain, contribution to technology domain and its financial
consequences.
The proposed method emphasizes on the utilization of EA as an input from the original method.
With the input from EA, the organization could have a more comprehensive and concrete idea
as the basis of their decision making process. The visualization of EA could improve the
objectivity of the stakeholder in the project valuation process. An outline regarding the EA
which give the overview of the organization from different layers and viewpoint is elaborated in
the section 3.2 and section 3.3.
Figure 21: EA-based Investment Portfolio Method
3.2 Business domain assessment
Five factors are valuated in the business domain; Strategic Match (SM), Competitive Advantage
(CA), Management Information (MI), Competitive Response (CR) and Organization Risk (OR).
Based on the characteristic of each factor defined by Parker et al in the Information Economics,
two factors will be assessed using the input from EA. These two factors are; Strategic Match
(SM) and Management Information (MI). The summary of the business domain assessment is
illustrated in Figure 22. After the assessment of five factors, the five business factors’ score and
the corporate value are used to calculate the business domain value. The description of each
business domains’ factor, the input, output and the assessment process will be elaborated in
the following section.
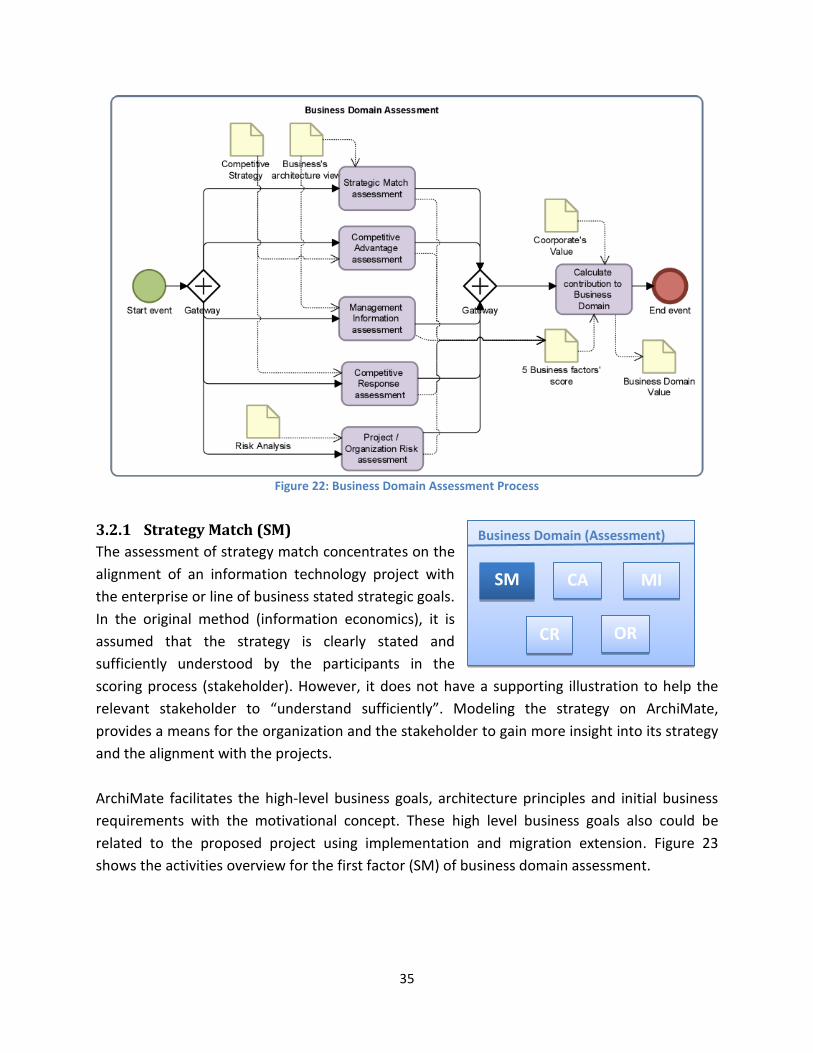
35
Business Domain (Assessment)
SM CA MI
CR OR
Figure 22: Business Domain Assessment Process
3.2.1 Strategy Match (SM)
The assessment of strategy match concentrates on the
alignment of an information technology project with
the enterprise or line of business stated strategic goals.
In the original method (information economics), it is
assumed that the strategy is clearly stated and
sufficiently understood by the participants in the
scoring process (stakeholder). However, it does not have a supporting illustration to help the
relevant stakeholder to “understand sufficiently”. Modeling the strategy on ArchiMate,
provides a means for the organization and the stakeholder to gain more insight into its strategy
and the alignment with the projects.
ArchiMate facilitates the high-level business goals, architecture principles and initial business
requirements with the motivational concept. These high level business goals also could be
related to the proposed project using implementation and migration extension. Figure 23
shows the activities overview for the first factor (SM) of business domain assessment.

36
Figure 23: Business domain – SM’s process
(1A) Create motivation and program architecture
The purpose of the first activity in the SM’s process is to create the motivation and program
architecture viewpoint of an organization. Using the organization’s strategy and the list of
projects/programs, a model that illustrates the primary goals of the organization and the
relation to its projects/programs can be created. In this step, it is assumed that the organization
already defines its strategy. A brief guideline to define a clear and well-defined business
strategy can be carried out from step A of the capability-based planning method (Anastasios,
2014).
A summary of “create motivation and program architecture” activity is given in Table 7. The
same template will be used for other activities. Figure 25 illustrates the example of the
architecture. However, the structure of the architecture could be different from one to another
depending on the condition of the organization. The main idea in this activity is to create an
architecture that shows the relation (if any) between the strategic goals of the organization
with the list of programs/projects.
Table 7: Overview of “Create motivation and program architecture” activity
1A. Create Motivation and program Architecture
Description Creation of Motivation and program architecture
Input Organization’s Strategic Goal, List of projects/programs
Possible Actor(s) Enterprise Architect
Technique General Architecture Modelling Approach (M. E. Iacob et al., 2012)using EA modeling
tool
Output Motivation and program architecture of the organization

37
(1B) Strategic Match Scoring
By using the input architecture, the organization has a basis to assess the score of the strategic
match using EA-based SM’s worksheet (Figure 24).
Table 8: Overview of "strategic match scoring" activity
1B. Strategic Match Scoring
Description Scoring activity to determine the degree to which an information technology project
supports or aligns with the enterprise or line of business stated strategic goals
modeled on the architecture.
Input Motivation and project architecture of the organization
Architecture Layer : Implementation and Migration Extension
Architecture Aspect : Motivation Extension
Possible Actor(s) Program or Project Management Office, Enterprise Architect
Technique Scoring using EA-based SM worksheet and input architecture
Output Architecture-based SM’s score (0-5)
EA-based SM’s worksheet is adopted from the Information Economic’s Strategic Match
worksheet (Parker et al., 1988) and combine with the information from EA. The score for
“strategic match” factor in business domain is formulated based on the description in the
worksheet. The example of scoring for this factor is shown in Figure 25, which could be the
basis for the score of 2, 3, 4 and 5. For scoring 0 and 1, the description in the worksheet
explicitly describes that they indicate that there is no direct or indirect relationship between
the projects and the strategic goals. Nevertheless, if the project could improve the operational
efficiency in the organization, scoring 1 would be considered. Since the operational processes of
each organization are different from one another, the justification between these scoring also
will be distinct from each other.
Figure 24: EA-based SM's worksheet
0. The project has no direct or indirect relationship with the achievement of stated corporate (or departmental) strategic goals modeled on the architecture.
1. The project has no direct or indirect relationship to such goals modeled on the architecture, but will lead to improved operational efficiencies.
2. The project has no direct relationship to such goals, but the project is a prerequisite system (precursor) to another system that achieves a portion of corporate strategic goal modeled on the architecture.
3. The project has no direct relationship to such goals, but the project is a prerequisite system (precursor) to another system that achieves a corporate strategic goal modeled on the architecture.
4. The project achieves a portion of a stated corporate strategic goal modeled on the architecture. 5. The project achieves a stated corporate strategic goal modeled on the architecture.

38
Business Domain (Assessment)
SM CA MI
CR OR
Figure 25: Architecture SM's scoring overview
3.2.2 Competitive Advantage (CA)
The question in this factor is: what makes this
service unique? (Gronlund, 2000) by considering
the major strategy that is implemented by the
business (Parker et al., 1988). Porter (1998)
indicated the type of competitive advantage by
implementation of cost leadership, differentiation
or focus. In this factor, the basis for decision making is not from the EA, but based on the
CA’s worksheet (e.g.: Appendix 1.2).

39
Business Domain (Assessment)
SM CA MI
CR OR
Figure 26: Business domain – CA’s process
Figure 26 shows the process of CA scoring that uses the major strategy that is followed by the
business. This factor assesses the value or contribution of the project to accomplish the
organization’s objective to achieve its competitive advantage. The organization could adopt
Porter’s generic competitive strategies (Porter, 1998) to develop their strategy in order to gain
a competitive advantage. Thus, CA worksheet which is used to assess this factor will be
different from one another. Table 9: Overview of "competitive advantage scoring" activity
Competitive Advantage Scoring
Description Scoring activity to appraise the degree to which the proposed project provides an
advantage in the marketplace.
Input Business strategy to gain competitive advantage or Competitive Advantage strategy.
Possible Actor(s) Program or Project Management Office
Technique Scoring using CA worksheet
Output CA’s score (0-5)
3.2.3 Management Information (MI)
The evaluation process for MI should be conducted based
on the relationship between the project and the core
activities modeled in the business layer. Thus, the
description about the core activities in the organization is
required. Parker et al., (1988) gives the examples of
management information about the core activities:
- Strategic Planning : Services, Marketing, Product Planning Capacity, Facility Forecasting
- Management Control : Budget, Sales Target, Service Performance, Capacity, Facility
Utilization
- Operation Control: Customer Services, Information, Claims, Capacity, Facility Scheduling.

40
By modeling the core activities in the organization’s business layer architecture, the relevant
stakeholder can obviously assess whether a particular project related with its MISCA
(Management Information support of core activities).
Figure 27: Business domain – MI’s process
(3A) Create Business Layer Architecture
The first activity in this factor is creating business layer architecture of the organization which
describes the core activities that are used as the basis to carry out the assessment process.
Table 10: Overview of "create business layer architecture" activity
3A. Create Business Layer Architecture
Description Creation of business layer architecture of the organization
Input Organization’s Core activities
Possible Actor(s) Enterprise Architect
Technique General Architecture Modelling Approach (M. E. Iacob et al., 2012) using EA modeling
tool
Output Business architecture of the organization
(3)-b Management Information Scoring
The purpose of this step is to assess the core activity in the MI’s process. The relevant
stakeholder; e.g. Program or Project Management Office evaluates the proposed
projects/programs by comparing them with the business architecture as the output from the
previous activity. The input architecture and EA-based MI worksheet (Figure 28) facilitate the
scoring decision on this factor.

41
Table 11: Overview of "management information scoring" activity
3B. Management Information Scoring
Description Scoring activity to specify the degree to which the project provides management
information on the core activities modeled on the architecture.
Input Business architecture of the organization
Architecture Layer : Business Layer
Architecture Aspect : Behavior, structure
Possible Actor(s) Program or Project Management Office
Technique Scoring using EA-based MI worksheet and input architecture
Output Architecture-based MI’s score (0-5)
Figure 28: EA-based MI's worksheet
The overview of the architecture for scoring 4 and 5 is displayed in Figure 29. Scoring 4 gives
the example of modeling MISCA in the future by relating the project with the defined core
activities which modeled on the target architecture. If the project contributes to MISCA in the
current situation, then the score 5 can be given. Illustration of others score (1, 2 & 3) quite
depend on the condition of the organization. If the project is unrelated to the MISCA, the score
of this factor will be 0. For the justification of scoring 1, 2 and 3; the actor(s) should have an
understanding of the function and its information that are required by the organization’s core
activities.
0. The project is unrelated to management information support of core activities (MISCA) modeled on the architecture.
1. The project is unrelated to MISCA modeled on the architecture, but does provide some data on functions that bear on core activities in the enterprise.
2. The project is unrelated to MISCA modeled on the architecture, but does provide information on functions that directly support core activities.
3. The project is unrelated to MISCA modeled on the architecture, but provides essential information on function identified as core activities. Such information is operational in character.
4. The project is essential to providing MISCA modeled on the architecture in future. 5. The project is essential to providing MISCA modeled on the architecture in a current period.

42
Business Domain (Assessment)
SM CA MI
CR OR
Figure 29: Architecture MI's scoring overview
3.2.4 Competitive Response (CR)
The assessment of competitive response is related to
the business risk associated with not undertaking the
project. The basis of this factor is not gain from EA, but
from the CR’s worksheet (appendix 1.4). The rating
process for CR is varied by examining the effect of
postponing the project for at least a year (low score)
until there is a loss of competitive opportunity for the organization by doing so. The
question in this factor is: how long is it possible to delay the project without any significant
reduction of competitive strength? (Andresen, 2001).
Figure 30: Business domain – CR’s process
In this step, it is assumed that the proposed project has a business case accordingly or any
document with a detailed description about the necessity of the project. However, information

43
Business Domain (Assessment)
SM CA MI
CR OR
about the process of making a business case is not covered in this thesis. The organization could
adopt a business case development method by (Ward, Daniel, & Peppard, 2007) and (Harvard
Business Review Press, 2010) which provide a stepwise approach to develop the business case.
Table 12: Overview of "competitive response scoring" activity
Competitive Response Scoring
Description Scoring activity to measure the degree to which failure to implement the project will
cause competitive damage to the organization.
Input Competitive strategy analysis
Possible Actor(s) Program or Project Management Office
Technique Scoring using CR worksheet
Output CR’s worksheet (0-5)
3.2.5 Project or Organization Risk (OR)
Similar to CA and CR, the measurement process of OR is
based on the OR’s worksheet at Appendix 1.5. This factor
assesses the preparedness of the business for the changes
caused by implementing the proposed project. In the OR’s
worksheet, eight elements of the risk that being assessed
are: formulation of a business domain plan to implement
the project, the presence of business management, contingency plan, documentation of
processes and procedures, user training plan, the existence of management champion,
product’s definition, and market’s understanding.
Figure 31: Business domain – OR’s process
The description of the changes needed in the organization for enabling project’s benefits and its
associated risk analysis in the business case document could be used as the input to score CR.
Hence, it is again assumed that the proposed project has a business case accordingly or any

44
document that has a detailed description about the risk analysis of the project. By assessing this
factor, the organization may know the reason why the proposed project does not work as it
should and become less valuable, which could be considered as the most crucial risk of all
(Willcocks, 2013).
Table 13: Overview of "organizational risk scoring" activity
Organization Risk Scoring
Description Scoring the activity to assess the degree to which the organization is capable of
carrying out the changes required by the project.
Input Business case
Possible Actor(s) Program or Project Management Office
Technique Scoring using OR worksheet
Output OR’s worksheet (0-5)
3.3 Technology Domain Assessment:
There are four criteria to assess the technology domain; Strategic IS Architecture (SA),
Definitional uncertainty (DU), IS Infrastructure Risk (IS), and Technical Uncertainty (TU). The
input for all factors can be gained from the architecture view. Similar to the business domain,
the calculation of technology domain is executed after multiplying each technology factors’
score by the corporate’s value (the weight). The description of each technology domains’
factor, the input, output and the assessment process will be elaborated in the following section.
Figure 32: Technology domain assessment

45
Technology Domain (Assessment)
SA DU
TU IR
3.3.1 Strategic IS Architecture (SA)
SA assesses the degree to which the project is
aligned with the current IT strategy. The score of
each projects/programs is evaluated based on its
integration with the current Information systems
plan (the blueprint). The information systems plan
reflects the alignment of the projects and overall IS
strategy (Parker et al., 1988). The overview of
required steps to carry out the assesment is
indicated in Figure 33.
Figure 33: Technology domain – SA’s process
(1A) Create Roadmap Architecture
The first step in the SA’s process is creating roadmap architecture of the organization. The
architecture roadmap lists individual work packages that will realize the target architecture and
lays them out in a timeline to show the progression from the Baseline Architecture to the
Target Architecture (The Open Group, 2011). In accordance with a blueprint or IS plan of the
organization, a roadmap architecture can be developed. This roadmap architecture will be used
in the next step as the basis to assess SA’s score of the projects. Table 14: Overview of “Create Roadmap Architecture” activity
1A. Create Roadmap Architecture
Description Creation of organization’s roadmap architecture
Input Organization’s Blueprint/ IS Plan
Possible Actor(s) Enterprise Architect
Technique General Architecture Modelling Approach (M. E. Iacob et al., 2012) using EA modeling tool

46
0. The proposed project is unrelated to the roadmap architecture. 1. The proposed project is a part of the roadmap architecture, but its priorities are not defined. 2. The proposed project is a part of the roadmap architecture, and has a low $ payoff; it is not prerequisite to
other roadmap projects, nor is it closely linked to other prerequisite projects. 3. The proposed project is an integral part of the roadmap architecture, and has medium $ payoff; it is not
prerequisite to other roadmap projects, but is loosely linked to other prerequisite projects. 4. The proposed project is an integral part of the roadmap architecture, and has a high $ payoff; it is not
prerequisite to other roadmap projects, but is closely linked to other prerequisite projects. 5. The proposed project is an integral part of the roadmap architecture, and is one that is to be implemented
first; it is prerequisite projects to other roadmap projects.
Output Roadmap architecture of the organization
(1B) Strategic IS Architecture Scoring
The next step for scoring SA, EA-based SA worksheet (Figure 34) is used to specify the degree
alignment between projects and overall IS strategies.
Table 15: Overview of “Strategic IS Architecture Scoring” activity
1B. Strategic IS Architecture Scoring
Description Scoring the activity to determine the degree of the project alignment with the overall information system strategies.
Input - The roadmap of an organization’s information systems plan modeled on the implementation and migration viewpoint. Architecture Layer : Business layer, application layer, technology layer, Implementation and migration extension
Architecture Aspect : Motivation Extension - Business case.
Possible Actor(s) Program or Project Management Office
Technique Scoring using EA-based SA worksheet, input architecture and business case.
Output EA-based SA’s score (0-5)
Figure 34: EA-based SA worksheet
A roadmap architecture from Archimethal case study (Bjekovic et al., 2014) is used with
additional fictional projects modeled in the architecture (shown in Figure 35) to show the
example of SA’s scoring process. The example for scoring 1 until 5 is given, while for 0, it
depends on the organization blueprint whether a specific project is unrelated with its roadmap
architecture. As depicted in Figure 35, score 2, 3, 4 and 5 cannot be distinguished by the
structure of roadmap architecture alone. As long as the projects/programs are modeled on the
roadmap architecture and being a part of the timeline, the possible score range lies in between
2-5. Therefore, more detailed information from the business case or another document about
the projects/ programs is needed. The examples of information needed are the payoff of
projects in terms of finance, the dependency with other projects, and the urgency of the
project.

47
Technology Domain (Assessment)
SA DU
TU IR
Figure 35: Archimetal SA's scoring overview
3.3.2 Definitional Uncertainty (DU)
DU is the first risk addressed from technology domain.
It assesses the degree to which the project
specification is ill-defined and/or unapproved; the key
here is the unknown requirements (Parker et al).
Before deciding the scoring, the relevant stakeholder
can analyze the current EA, which is modeled in the
requirements view of the architecture. However, the requirements modeled on the
architecture are not necessarily sufficient to assess DU factor. Thus, related document
which has detailed description of the requirements and specification of each project (e.g.
Business case document) is needed.
Figure 36: Technology domain – DU’s process

48
Table 16: Overview of “Definitional Uncertainty Scoring” activity
Definitional Uncertainty Scoring
Description Scoring the activity to specify the degree to which requirement, specifications and changes
in the project are known.
Input - Motivation architecture of the organization
Architecture Layer : Business, application, technology layer,
Architecture Aspect : Motivation
- Business Case document
Possible Actor(s) Program or Project Management Office, Enterprise Architect
Technique Scoring using EA-based DU worksheet and input architecture
Output EA-based DU’s score (0-5)
The process of scoring DU’s factor is briefly illustrated in Figure 36. Motivation view
architecture and business case could be used to adjust the score of DU’s factor. Definitional
Uncertainty is the assessment of “to what degree the requirements and specification are
known and how great the complexity of the area and the probability of non-project routine
changes in the information system are (Gronlund, 2000). Thus, DU’s score of the project is
defined based on the input documents and EA-based DU worksheet (Figure 38). It is assumed
again that the project should have a business case accordingly or any document that has the
detailed description of the specification or requirement of the project.
Figure 37: Archisurance Motivation View

49
Technology Domain (Assessment)
SA DU
TU IR
Using the motivation view modeled in the architecture, the organization could have a general
or a high-level requirement derived from the organization’s strategic goal. However, the
detailed requirements, specifications and change in risk information related to the project are
obtained from the business case document. Figure 37 shows the possibility of scoring 0 to 3
from the motivation view of Archisurance’s case study. It depends on the detail of the proposed
project that will be assessed.
Figure 38: EA-based DU Worksheet
3.3.3 Technical Uncertainty (TU)
As specified in Information Economics (Parker et al.,
1988), the purpose of technical uncertainty
assessment is to recognize the risk and emphasize the
preparedness and preparations needed for a
successful project. The project will be assessed based
on four separate aspects: skills required, hardware
dependencies, software dependencies and application software. Similar with other factors,
two steps are carried out to develop the architecture and specify the score of the projects in
this factor (shown in Figure 39).
SCORE (0-5) 0. Requirements modeled on architecture are firm and approved. Specifications are firm and approved.
Investigated area is straightforward. High probability of no changes. 1. Requirements modeled on architecture moderately firm. Specifications are moderately firm. No formal
approvals. Investigated area is straightforward. Low probability of nonroutine changes. 2. Requirements modeled on architecture moderately firm. Specifications are moderately firm. Investigated
area is straightforward. Reasonable probability of nonroutine changes. 3. Requirements modeled on architecture moderately firm. Specifications are moderately firm. Investigated
area is straightforward. Changes are almost certain almost immediately. 4. Requirements modeled on architecture not firm. Specifications are not firm. Area is quite complex.
Changes are almost certain, even during the project period. 5. Requirements modeled on architecture unknown. Specifications are unknown. Area may be quite
complex. Changes may be ongoing, but the key here is unknown requirements.

50
Figure 39: Technology domain – TU’s process
(3A) Create Capability, Infrastructure and Application Architecture The goal of this step is to develop three architecture viewpoints of the organization. Since four
separate aspects are assessed in this factor, a capability, infrastructure and application
architecture can be developed. Capability is a concept in ArchiMate recommended by M.-E.
Iacob et al., (2012), Aldea et al. (2015), and Anastasios (2014). In this method, the concept of
capability is used to model the skills capability of the organization. In the meantime, by using
the infrastructure and application landscape, the architect could model the infrastructure and
application architecture of the organization.
Table 17: Overview of “Create capability, infrastructure and application architecture” activity
3A. Create Capability, Infrastructure and Application Architecture
Description Creation of capability, infrastructure, and application architecture
Input Required skills, infrastructure landscape of the organization, application landscape of
the organization
Possible Actor(s) Enterprise Architect
Technique General Architecture Modelling Approach (M. E. Iacob et al., 2012) using EA modeling
tool
Output Capability, infrastructure and application architecture of the organization
(3B) Technical Uncertainty Scoring
After modeling the architecture, the next step is scoring the technical uncertainty factor of the
project. Similar with the previous steps, EA-based TU worksheet (Figure 40) and the input
architecture will be used to define the score.

51
Table 18: Overview of “Technical Uncertainty Scoring” activity
3B. Technical Uncertainty Scoring
Description Scoring the activity to determine the readiness of the technology domain to carry out the
project.
Input Capability, infrastructure and application architecture of the organization
Architecture Layer : Application layer, technology layer, implementation and migration
extension
Architecture Aspect : Behavior, structure, information
Possible Actor(s) Program or Project Management Office, Enterprise Architect
Technique Scoring using EA-based TU worksheet and input architecture
Output EA-based TU’s score (0-5)
The first aspect assessed in the TU is the required skill, Figure 41 give an overview of the scoring
capability architecture. The scoring overview is defined into two categories: first for scoring 1-3,
and second for 4-5. The first category shows that some new skills are required, while the
second shows that extensive (new) skills are required by the organization.
Infrastructure architecture of the organization is used to score the hardware dependencies and
the system software dependencies using different viewpoints (Section 2.3.2). For instance, the
infrastructure usage viewpoint is used for scoring the hardware dependencies, while
infrastructure viewpoint and motivation viewpoint are used to score the system software
dependencies. The scoring overview of 0, 1, 2 and 3 for hardware dependencies is illustrated in
Figure 42. The concept of infrastructure service depicts the use of the hardware in a similar or
different application (scoring 0/1). The score 2 shows that the service exists but is not yet used
operationally by any application, while score 3 indicates that the hardware is available but does
not give any service yet. Lastly, the score 4 and 5 depend on the condition of the organization
on whether the requirement of the project related to the infrastructure’s state of affairs in the
organization is satisfied: whether the infrastructure is not available or the key feature are not
tested or implemented.
The scoring overview of the system software dependencies is shown in Figure 43. The
motivation extension is used to show the programming requirement of the system software.
For scoring 0/1 the project depends on the standard software with or without programming’s
requirement. Meanwhile, the scoring 2/3 is considered when the interface is a requirement and
whether the programming or new feature in the operating software is needed. The last
overview of scoring 4/5 is based on the project’s dependency with the advance level of the
system software’s requirement.

52
Afterwards, the illustration of application architecture (Figure 44) is used to determine the
dependency on application software development. When the existing application service can
be used by the project, the score is 0. Meanwhile, if a modification is needed, the score range
considered is 1-3, depending on the level of complexity and difficulty level of the software
modification. Finally, after each aspect is already assessed, the score of EA-based TU is defined
from the average value of the previous four separate assessments. TU’s score is calculated with
equation (3.1)
TU’s score =
Where: (3.1)
A = Score of skills required
B = Score of hardware dependencies
C = Score of system software dependencies (other than application software)
D = Score of application software dependencies

53
Figure 40: EA-based TU worksheet
SCORE (0-5)
A. Skills required are available in the technology domain
B. Dependency on specific hardware is not currently available
C. Dependency on software capabilities is not currently available
D. Dependency on application software development
Total (A+B+C+D)/4 = Rating: A. Skills required
0. No new skills for staff nor management. Both have experience. 1. Some new skills for staff, none for management. 2. Some new skills required for staff and management. 3. Some new skills required for staff, extensive for management. 4. Extensive (new) skills required for staff, some for management. 5. Extensive (new) skills required for staff, and management.
B. Hardware dependencies 0. Hardware modeled in the architecture is in use for similar application. 1. Hardware modeled in the architecture is in use, but for a different application. 2. Hardwaremodeled in the architecture exists, and has been tested, but not operationally. 3. Hardware modeled in the architecture exists, but is not utilized yet within organization. 4. Some key features are not tested or implemented. 5. Key requirements are not now available in MIS configuration.
C. System software dependencies (other than application software) 0. Standard software, or straight-forward or no programming required. 1. Standard software is used, but complex programming is required. 2. Some new interfaces between software are required and complex programming may be required. 3. Some new features are required in operating software, and complex interfaces between software
may be required. 4. Features not currently supported are needed, and moderate advance in local state of the art is
required. 5. Significant advance in state of the art is required
D. Application Software 0. Application services exist with minimal modification required. 1. Programs are available commercially with minimal modifications or programs available in-house with
moderate modifications, or software will be developed in-house with minimal complexity. 2. Programs are available commercially with moderate modifications, or in-house programs are
available but modifications are extensive, or software will be developed in-house with minimal design complexity but moderate programming complexity.
3. Software is available commercially but the complexity is high, or software will be developed in-house and the difficulty is moderate.
4. No package or current in-house Software exists. Complexity design and programming are required, with moderate difficulty.
5. No package or current in-house Software exists. Complexity design and programming is required, even if contracted outside.
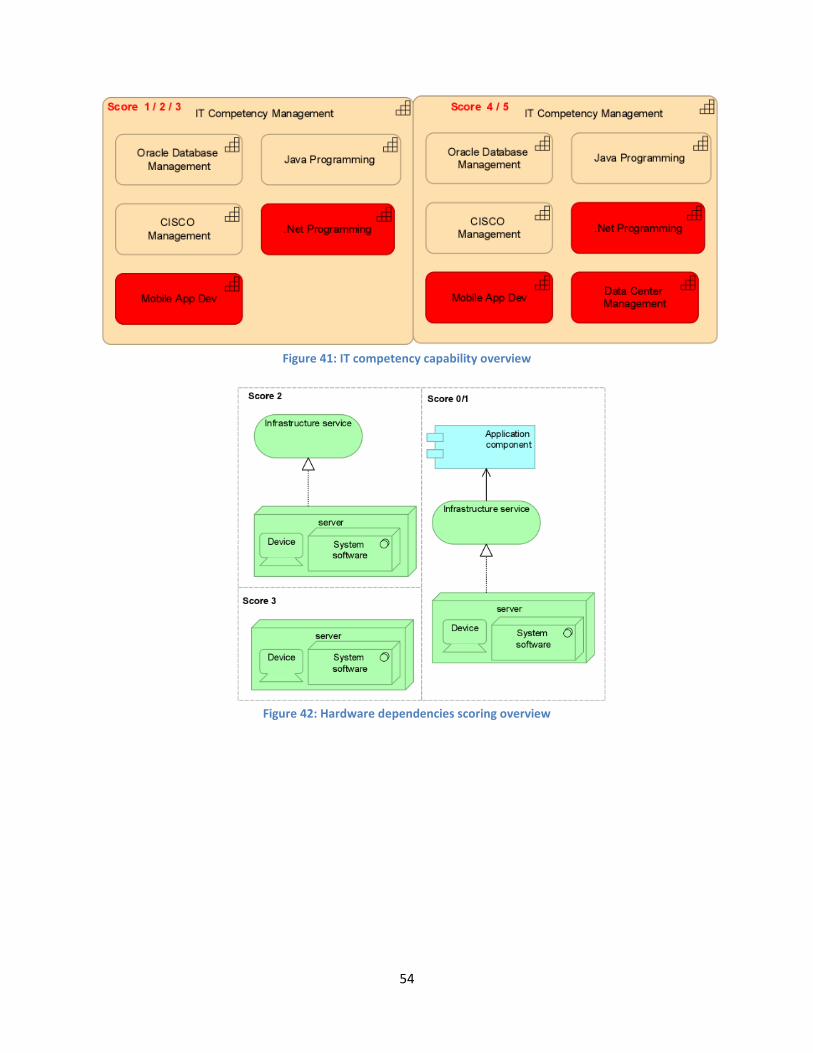
54
Figure 41: IT competency capability overview
Figure 42: Hardware dependencies scoring overview

55
Figure 43: Software dependencies scoring overview
Figure 44: Application dependencies scoring overview

56
Technology Domain (Assessment)
SA DU
TU IR
3.3.4 IS Infrastructure Risk (IR)
IR measures the degree to which the entire IS
organization is both required to support the project
and prepared to do so (Parker et al., 1988). The
terms of entire IS organization points out the
hardware, software and staff that are needed to
accommodate the proposed project.
It is also seen as an environmental assessment including the factors such as data
administration (for instance new data dictionary requirements), communications (e.g. new
forms of communications capabilities required), and distributed systems (such as new
methods of data access required).
Figure 45: Technology domain – IR’s process
(4A) Create Layered Architecture
In this factor, a layered architecture will be used in order to illustrate the current IS
environmental support in the organization. By using a layered viewpoint, an overview of IS
infrastructure can be represented in one diagram. Thus, it can be used as a support for impact
of change analysis and performance analysis or for extending the service portfolio (The Open
Group, 2012).
Table 19: Overview of “Create layered architecture” activity
4A. Create Layered Architecture
Description Creation of the organization’s layered architecture
Input IS organization description
Possible Actor(s) Enterprise Architect
Technique General Architecture Modelling Approach (M. E. Iacob et al., 2012) using EA modeling
tool
Output Layered architecture of the organization

57
(4B) IS Infrastructure Risk Scoring
The next step is to rate the score of IS infrastructure risk using the original IS infrastructure risk
worksheet based on the input architecture. The range of the score (0-5) is based on the
necessary changes of the current IS organization. It varies from small, moderate and substantial
changes needed for the existing infrastructure.
Table 20: Overview of “IS infrastructure risk scoring” activity
4B. IS Infrastructure Risk Scoring
Description Scoring the activity to specify the degree of nonproject investment necessary to
accommodate the proposed project.
Input Layered architecture of the organization
Architecture Layer : Application layer, technology layer
Architecture Aspect : Information, behavior, structure
Possible Actor(s) Program or Project Management Office
Technique Scoring using IR worksheet and input architecture
Output EA-based IR’s score (0-5)
Figure 46: EA-based IR worksheet
0. The system uses the existing services and facilities. No investment in IS prerequisite facilities (e.g., database management) is required; no up-front costs not directly a part of the project itself are anticipated.
1. Change in one element of the computer service delivery system is required for this project. The associated up-front investment other than direct project costs is relatively small.
2. Small change in several elements of the computer service delivery system are required. Some up-front investment is necessary to accommodate this project. Some later investment for subsequent integration of this project into the mainstream of the IS environment may be necessary.
3. Moderate changes in several elements of the computer service delivery system are required. Some up-front investment is necessary to accommodate this project; some later investment for subsequent integration of this project into the mainstream of the IS environment will be necessary.
4. A moderate change in elements of the computer service delivery is required, in multiple areas. Moderate to high up-front investment in staff, software, hardware, and management is necessary to accommodate the project. This investment is not include in the direct project cost, but represents IS facilities investment to create the needed environment will be necessary for the project.
5. Substantial change in elements of the computer service delivery is required, in multiple areas. Considerable up-front investment in staff, software, hardware, and management is necessary to accommodate the project. This investment is not include in the direct project cost, but represents IS facilities investment to create the needed environment for the project.

58
Figure 47: Architecture IR's scoring overview
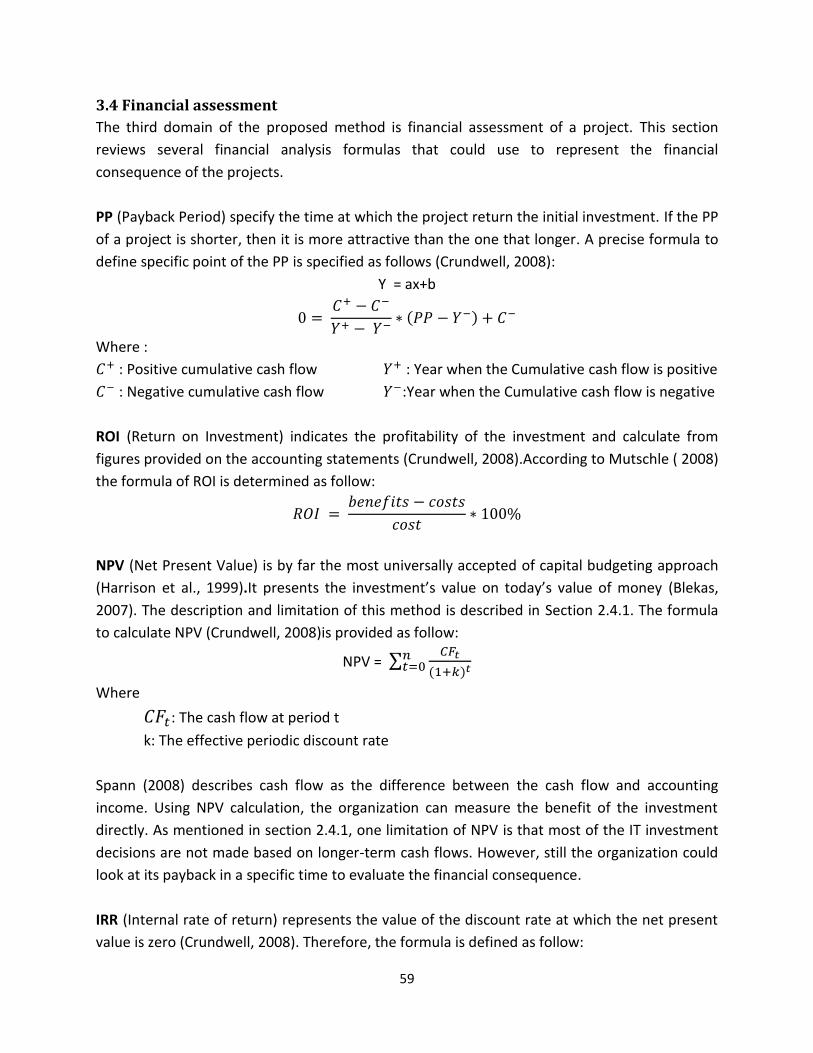
59
3.4 Financial assessment
The third domain of the proposed method is financial assessment of a project. This section
reviews several financial analysis formulas that could use to represent the financial
consequence of the projects.
PP (Payback Period) specify the time at which the project return the initial investment. If the PP
of a project is shorter, then it is more attractive than the one that longer. A precise formula to
define specific point of the PP is specified as follows (Crundwell, 2008):
Y = ax+b
( )
Where :
: Positive cumulative cash flow : Year when the Cumulative cash flow is positive
: Negative cumulative cash flow :Year when the Cumulative cash flow is negative
ROI (Return on Investment) indicates the profitability of the investment and calculate from
figures provided on the accounting statements (Crundwell, 2008).According to Mutschle ( 2008)
the formula of ROI is determined as follow:
NPV (Net Present Value) is by far the most universally accepted of capital budgeting approach
(Harrison et al., 1999).It presents the investment’s value on today’s value of money (Blekas,
2007). The description and limitation of this method is described in Section 2.4.1. The formula
to calculate NPV (Crundwell, 2008)is provided as follow:
NPV = ∑
( )
Where
: The cash flow at period t
k: The effective periodic discount rate
Spann (2008) describes cash flow as the difference between the cash flow and accounting
income. Using NPV calculation, the organization can measure the benefit of the investment
directly. As mentioned in section 2.4.1, one limitation of NPV is that most of the IT investment
decisions are not made based on longer-term cash flows. However, still the organization could
look at its payback in a specific time to evaluate the financial consequence.
IRR (Internal rate of return) represents the value of the discount rate at which the net present
value is zero (Crundwell, 2008). Therefore, the formula is defined as follow:

60
0 = ∑
( )
This section discusses several analysis techniques in addition to Section 2.4.1 with its formula.
The majority techniques to evaluate the financial consequence of a project are NPV, IRR, PP,
and ROI. However, other techniques also could be used to represent this third domain,
depending on the available data.
3.5Calculation contribution to Business and Technology domain
After calculating each score in the business and technology domain, the following step in the
method is calculating the total score for the contribution to business and technology domain.
The score of each factor is multiplied by the weight of this factor. In line with the description in
section 2.4.2 in the Information Economic method, the basis of the weight is different between
organizations. Two parallel questions to be evaluated are: whether the line of business is
currently profitable, considered to be in a good shape, and whether the computer service used
in the line of business is currently effective or colloquially, broken (Parker et al., 1988). Parker
et al (1988), suggest that a self-assessment is carried out by the organizations to determine in
which quadrant they belong to. The detailed weight of each quadrants of corporate value is
given in Appendix 2. Table 21 gives the example of the calculation for both values of the
business and technology domain in the strategic quadrant.
Table 21: Example contribution to business and IT domain
Business Domain Technology Domain
SM CA MI CR OR SA DU TU IR
Weight 4 6 2 4 -1 1 -2 -1 1
Score 5 5 5 5 0 5 0 0 5
Total Score 80 10
The value of the project in the business and technology domain is calculated using formula
equation (3.2):
∑
Where (3.2)
: The score of each factor in its domain
: The weight of each factor in its domain
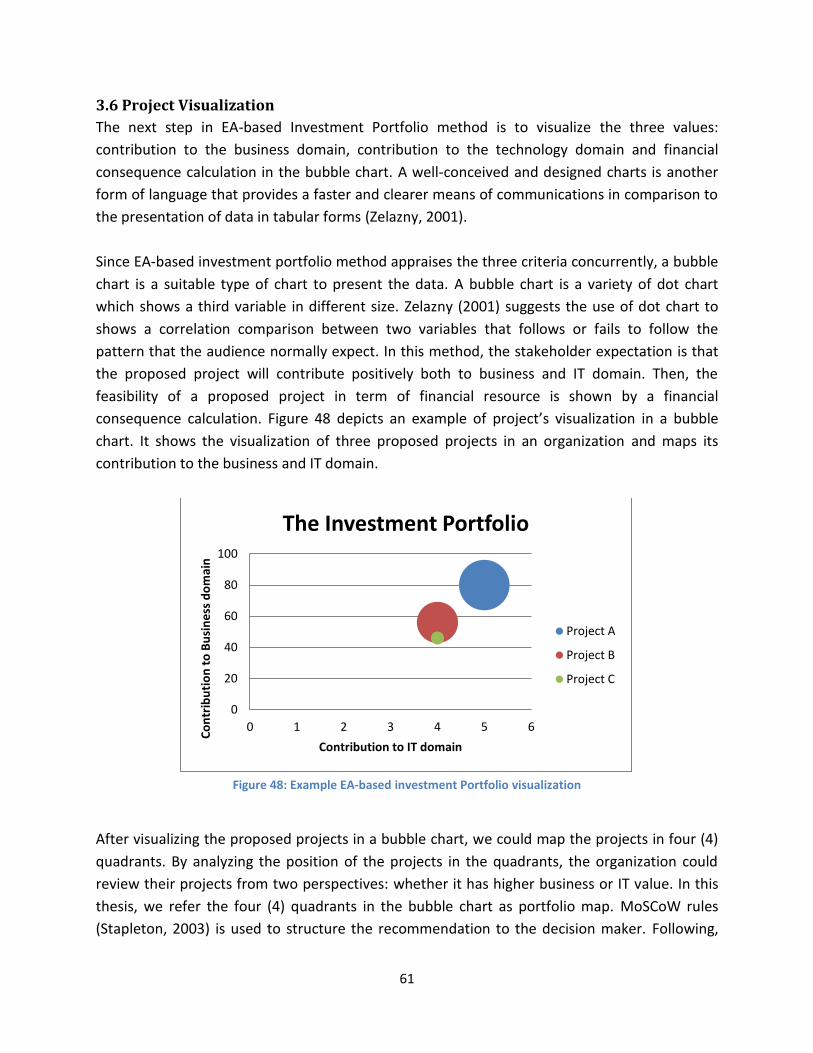
61
3.6 Project Visualization
The next step in EA-based Investment Portfolio method is to visualize the three values:
contribution to the business domain, contribution to the technology domain and financial
consequence calculation in the bubble chart. A well-conceived and designed charts is another
form of language that provides a faster and clearer means of communications in comparison to
the presentation of data in tabular forms (Zelazny, 2001).
Since EA-based investment portfolio method appraises the three criteria concurrently, a bubble
chart is a suitable type of chart to present the data. A bubble chart is a variety of dot chart
which shows a third variable in different size. Zelazny (2001) suggests the use of dot chart to
shows a correlation comparison between two variables that follows or fails to follow the
pattern that the audience normally expect. In this method, the stakeholder expectation is that
the proposed project will contribute positively both to business and IT domain. Then, the
feasibility of a proposed project in term of financial resource is shown by a financial
consequence calculation. Figure 48 depicts an example of project’s visualization in a bubble
chart. It shows the visualization of three proposed projects in an organization and maps its
contribution to the business and IT domain.
Figure 48: Example EA-based investment Portfolio visualization
After visualizing the proposed projects in a bubble chart, we could map the projects in four (4)
quadrants. By analyzing the position of the projects in the quadrants, the organization could
review their projects from two perspectives: whether it has higher business or IT value. In this
thesis, we refer the four (4) quadrants in the bubble chart as portfolio map. MoSCoW rules
(Stapleton, 2003) is used to structure the recommendation to the decision maker. Following,
0
20
40
60
80
100
0 1 2 3 4 5 6
Co
ntr
ibu
tio
n t
o B
usi
ne
ss d
om
ain
Contribution to IT domain
The Investment Portfolio
Project A
Project B
Project C

62
the recommendation description is given to interpret the quadrants in the bubble chart (Figure
49):
- Quadrant A (‘Must Have’)
The projects that belong in this quadrant could be considered as the top prioritized
projects. Following the MoSCoW rules, the organization must carry out the projects here,
because they have high score both for the contribution in Business and IT domain. By
carrying out the project, an organization gets the benefit for the business. It means that
the projects contribute to develop the current business. From the IT perspective, the
projects here are supported by IT facilities in the organization.
- Quadrant B (‘Should have’)
This quadrant indicates the projects that should have by the organization because it
enhances the business value. However, from the IT perspective, the projects has low value
because several possible reason like : the organization’s IT infrastructure is not yet ready to
support the projects, the level of the risk from IT side, it is not belong to the IT roadmap
strategy, etc. Nevertheless, the projects here represents high-priority items that should be
included in the solution of possible(Miranda, 2011) .
- Quadrant C (‘Could have)
The third quadrant depicts the projects that could execute by the organization. The
projects here are considered desirable but not necessary (Miranda, 2011), because it does
not really enhance the business although supported by the IT.
- Quadrant D (‘Won’t have’)
The organization could consider the projects that belong into this quadrant become the
projects that they won’t have for the moment. The projects in this quadrant could be
revisited. There are two possibilities: whether the current IT facility is not support the
proposed projects, or it does not give any contribution to the business.
Figure 49: Portfolio Map
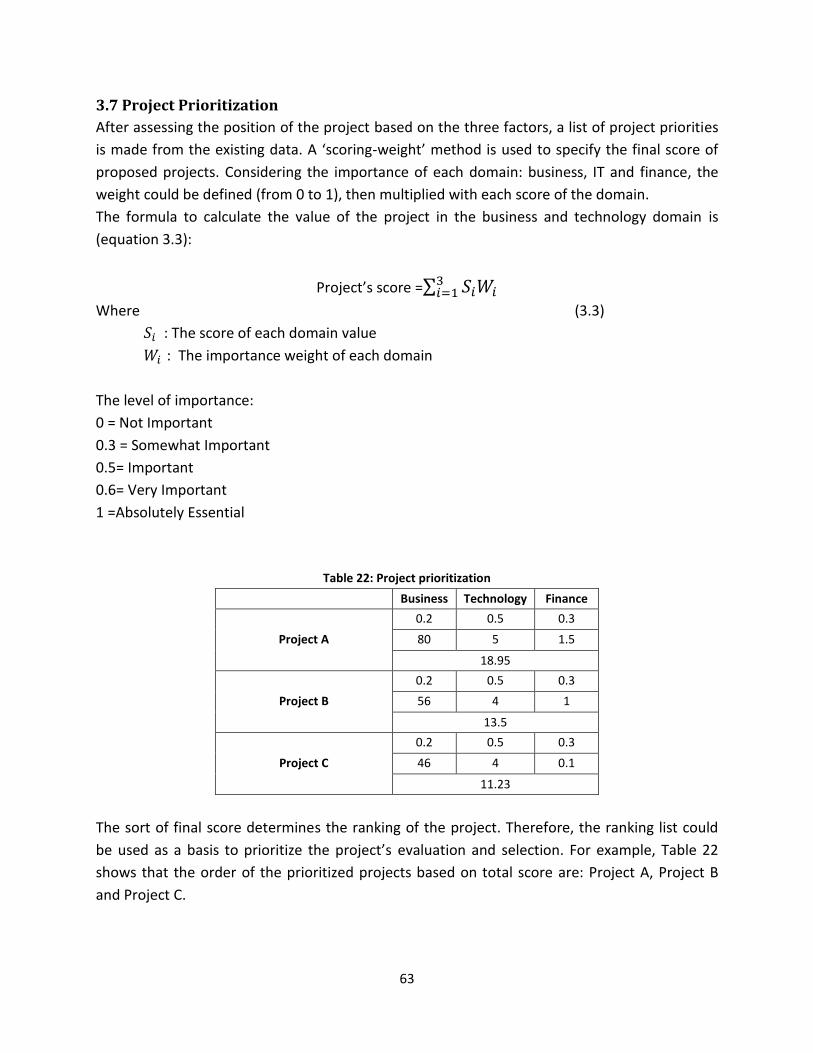
63
3.7 Project Prioritization
After assessing the position of the project based on the three factors, a list of project priorities
is made from the existing data. A ‘scoring-weight’ method is used to specify the final score of
proposed projects. Considering the importance of each domain: business, IT and finance, the
weight could be defined (from 0 to 1), then multiplied with each score of the domain.
The formula to calculate the value of the project in the business and technology domain is
(equation 3.3):
Project’s score =∑
Where (3.3)
: The score of each domain value
: The importance weight of each domain
The level of importance:
0 = Not Important
0.3 = Somewhat Important
0.5= Important
0.6= Very Important
1 =Absolutely Essential
Table 22: Project prioritization
Business Technology Finance
Project A
0.2 0.5 0.3
80 5 1.5
18.95
Project B
0.2 0.5 0.3
56 4 1
13.5
Project C
0.2 0.5 0.3
46 4 0.1
11.23
The sort of final score determines the ranking of the project. Therefore, the ranking list could
be used as a basis to prioritize the project’s evaluation and selection. For example, Table 22
shows that the order of the prioritized projects based on total score are: Project A, Project B
and Project C.

64
3.8 Summary
Detailed description of EA-based investment portfolio method is specified in this chapter.
Starting from the high-level process in the EA-based Investment Portfolio Method (Section 3.1)
and finishing with the project prioritization (Section 3.2.5). To conclude, the steps in the EA-
based Investment Portfolio are described as follows:
1. Define the corporate’s value as a weight basis calculation for IT and business domain
(the detailed weight is given in Appendix 2).
2. Scoring the five factors in the business domain and four factors technology domain,
then multiply the score with the weight based-on 1st step.
3. NPV Calculation.
4. Visualize three subsets of data in a bubble chart.
5. Define the importance weightage of three subset data.
6. Project prioritization by multiplying the weight with the score, and sort the project
score as a suggestion for the decision maker.

65
4. Demonstration ArchiPharma Case
Following the forth step of DSRM that is; to demonstrate the use of the artifact to solve one or
more instance of the problem. This chapter elaborates the utilization of the method in a case
study after developing the proposed EA-based Investment portfolio method in previous
chapter. Section 4.1 illustrates briefly the description of the case study. Afterwards, the
remaining section shows a thorough process of the proposed method in the ArchiPharma case
study.
4.1 Case Study Description
In order to demonstrate the implementation of EA-based information portfolio method, a case
study is used as a research method in this thesis. Using the case study method allows the
investigators or the researcher to retain a holistic and meaningful characteristic of real-life
events (R. K. Yin, 2009). In this research, one case study that being used is the case study on
ArchiPharma. ArchiPharma is a case-study, which is currently also a research topic for
BiZZdesign Enterprise Portfolio Management. The documentation about the case is taken from
BiZZdesign Research and Development department. Some assumptions or additional
information are created by the author to provide necessary information to carry out the EA-
based method developed in the Chapter 3.
Archiparma is a real, but anonymized large international pharmaceutical organization that has
many geographically spread locations. The organization is the result of many mergers and
takeovers. The high level end goal of the organization is to become the leading provider of
healthcare service in the world. Currently, Archipharma faced several challenges both from
external pressure and internal legacy. From the external perspective: there are other
competitors which are highly competitive and eager to become the leader in the industry, the
company also needs to comply with many (governmental) regulations that change regularly.
Internally, Archipharma encounters a large application landscape as a result of the many
mergers and take-overs, which simply patched their landscape together. The external
challenges force the business to be agile in the operation, which is not easy, partly because of
the legacy application landscape.
At the moment, these conditions effect the business interaction with customers. For instance, a
process which is executed slightly differently by each business unit. Especially large and
international customers, who interact with more than one business unit are more likely to get
diverse bills. Their data might appear slightly different in CRM databases managed by different
business unit, which result in the differences in addresses, names, etc. The bill also might look
slightly different in terms of payment due dates, timing of sending, etc. depend on the business
66
unit. This contradicts with the goal of having a professional and coherent image towards the
customers. Therefore, a number of programs and projects are proposed in order to face all the
challenges mentioned above. Their main concern is how to manage and assess all the projects
in accordance with their goals. In the following section, the proposed method is implemented
to show its efficacy of assessing the projects in a company. Section 4.1.1 illustrates the list of
projects to be assessed. Subsequently, section 4.1.2 elaborates the corporate value of
Acrhipharma which will be used as the weight to assess the business and technology domain.
4.1.1 List of projects in Archipharma
There are 8 Programs and 50 projects in Archipharma which will be executed. The list of the
programs and the following projects are:
Application Rationalization
1. Define Valuation Model
2. Develop application rationalization roadmap
3. Identify obsolete applications
4. Install application lifecycle management approach
5. Inventory application
6. Migrate and eliminate identified applications
7. Valuate application
Harmonize billing process
1. Analyze billing process variance
2. Choose, develop, test and run global, test and run global finance
3. Harmonize process variants
4. Phase out Amsterdam billing applications
5. Phase out London billing applications
6. Phase out New York billing applications
Improve global accessibility database
1. Analyze data sources
2. Develop database authentication protocols
3. Develop integrated reporting
4. Install database authentication
5. Install federated database management system (FDMS)
6. Prepare and adapt database
7. Publish database information
Installment of APM process
1. Choose, configure, test and install APM applications
2. Design and populate application portfolios
3. Design enterprise-wide APM process

67
Professionalize marketing
1. Align marketing processes
2. Analyze current marketing processes
3. Consolidate marketing applications
4. Install necessary applications for monitoring competitors
5. Install process for monitoring competitors
6. Integrate marketing processes
Revision of PPM process
1. Choose, develop and install enterprise-wide PPM software
2. Develop real-time portfolio monitoring
3. Develop real-time portfolio reporting
4. Harmonize local PPM approaches
5. Install enterprise-wide PPM approach
6. Inventory all PPM processes
Homogenize info & data
1. Analyze heterogeneous data sources
2. Analyze heterogeneous information sources
3. Consistent data model development
4. Data cleaning
5. Data mapping
6. Design data architecture
7. Information cleaning
8. Information harmonization
9. Information mapping
Product rationalization
1. Analyze current product portfolio
2. Expand customer channels with internet
3. Harmonize ordering process
4. Identify products for termination, migration and consolidation
5. Rationalize product portfolio
6. Redesign portfolio into limited set of highly configurable products
4.1.2 Corporate Value of Archipharma
The current condition of Archipharma shows that the line of business is profitable, competitive,
healthy and strong. With a set of their product as the result of merger and takeovers, they
could build a competitive position among their competitor. The current business also supported
with a strong and effective computer service. The combination of strong line of business and

68
computer support reinforces the position of Archipharma in the Strategic Quadrant (Appendix
2.2) as the base of the relative weight in the business and technology domain.
Table 23: Archipharma Corporate Values
DOMAIN LIKELY VALUE RESULTING WEIGHT
BUSINESS DOMAIN 1. Strategic Match 2. Competitive Advantage 3. Management Information 4. Competitive Response 5. Organizational Risk
TECHNOLOGY DOMAIN
1. Definitional Uncertainty 2. Technical Uncertainty 3. Strategic IS Architecture 4. IS Infrastructure Risk
High
Highest Medium
High Low
Medium Low Low Low
4 6 2 4 -1
-2 -1 1 1
Table 23 shows the resulting weight of Archipharma, which will be used to assess all the factors
in business and technology domain. With this resulting weight, the score of the project would
be varied from -5 to 80 for business domain and -15 to 10 for technology domain. This relative
weight reflects that Archipharma wants to focus on the investment that could give them an
opportunity to strengthen the company in the future. Thus, it emphasizes on the competitive
advantage, strategic match, and competitive response.
4.2 Business Domain Assessment
As described in the previous chapter, five factors will be assessed in the business domain.
Detailed description of the Archipharma’s business domain is carried out in the following
section.
4.2.1 Strategic Match (SM)
Step 1A : Create motivation and program architecture
In order to create a motivation and program architecture of Archipharma, vision and mission
(Figure 50) are used to formulize two strategic goals of Archipharma.

69
Figure 50 : Archiparma’s Vision, Mission and Strategies
Output1A: Motivation and project architecture (Figure 51)
Afterwards, those strategic goals are used to model Archipharma’s strategy implementation,
which relates the strategic goal with a specific program.
Figure 51: Archipharma’s Strategy Implementation
Step 1B: Strategic Match Scoring
In the original SM’s worksheet, the score 5 is given to the project that directly achieves a stated
corporate strategic goal. Using BiZZdesign’s Architect, the direct achievement of the corporate
strategic goal can be translated into a quantitative assessment called the strategic value
project. The general step to calculate the strategic value project is described as follows
(detailed script is given in Appendix 3) :
BiZZdesign’s Strategic value project algorithm:
Step 1Model the strategic implementation in the motivation extension of Archimate.
Step 2 Assign the value of the concept and its relationship on the model.
Step 3 Calculate the bottom-up relationship of each program/project.

70
Output 1B : The list of score for SM (Table 24)
Table 24 shows the list of score of SM’s factor for all the Archipharma’s projects. The score of
strategic value is generated with BiZZdesign’s strategic value project algorithm (Appendix 3).
Afterwards, SM score is calculated by multiplying the weight and the score in this factor.
Table 24: Archipharma SM's score
No Project Name Strategic
Value Score
Weight SM
EA-based
SM
SM-Score
1 Align marketing processes 20 4 4 16
2 Analyze billing process variance
3.9 4 4 16
3 Analyze current marketing processes 20 4 4 16
4 Analyze current product portfolio 8 4 4 16
5 Analyze data sources
5.8 4 4 16
6 Analyze heterogeneous data sources
5.8 4 4 16
7 Analyze heterogeneous information sources
5.8 4 4 16
8 Choose, configure, test and install APM applications 16 4 4 16
9 Choose, develop and install enterprise-wide PPM software
20 4 4 16
10 Choose, develop, test and run global financial application
3.9
4 4 16
11 Consistent data model development
5.8 4 4 16
12 Consolidate marketing applications 20 4 4 16
13 Data cleaning
5.8 4 4 16
14 Data mapping
5.8 4 4 16
15 Define valuation model
20.4 4 5 20
16 Design and populate application portfolios 16 4 4 16
17 Design data architecture
5.8 4 4 16
18 Design enterprise-wide APM process 16 4 4 16
19 Develop application rationalization roadmap
20.4 4 5 20
20 Develop database authentication protocols
5.8 4 4 16
21 Develop integrated reporting
5.8 4 4 16
22 Develop real-time portfolio monitoring 20 4 4 16
23 Develop real-time portfolio reporting 20 4 4 16
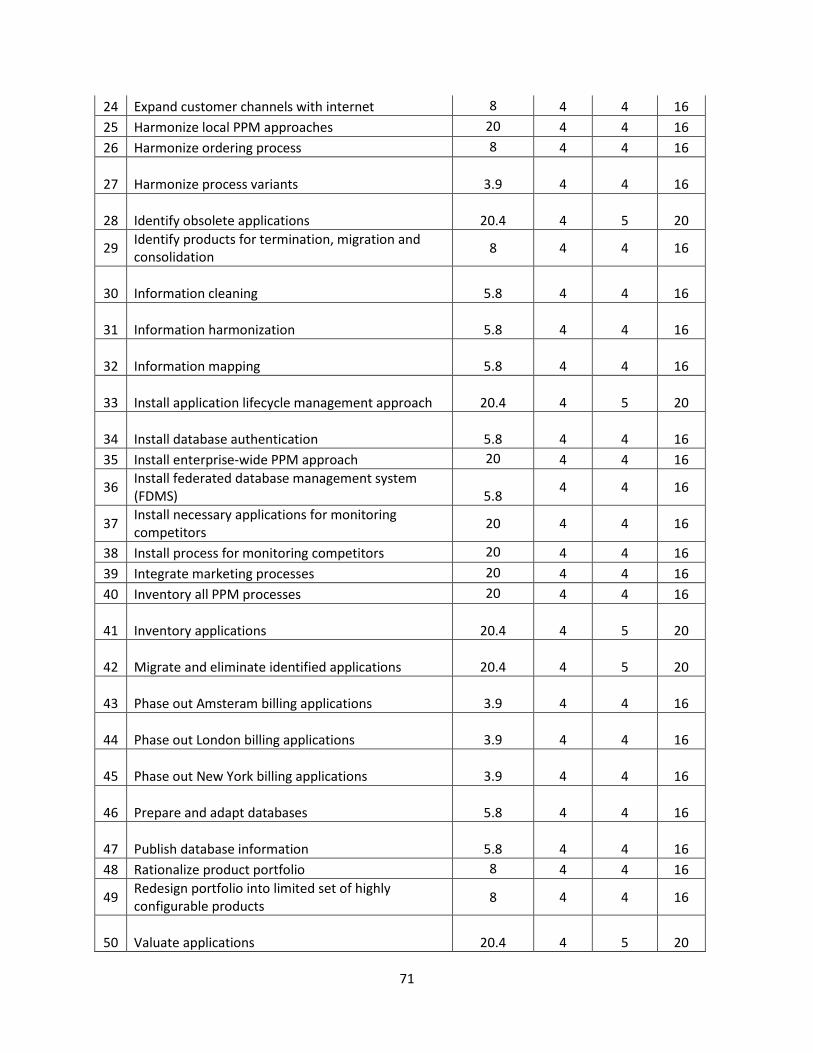
71
24 Expand customer channels with internet 8 4 4 16
25 Harmonize local PPM approaches 20 4 4 16
26 Harmonize ordering process 8 4 4 16
27 Harmonize process variants
3.9 4 4 16
28 Identify obsolete applications
20.4 4 5 20
29 Identify products for termination, migration and consolidation
8 4 4 16
30 Information cleaning
5.8 4 4 16
31 Information harmonization
5.8 4 4 16
32 Information mapping
5.8 4 4 16
33 Install application lifecycle management approach
20.4 4 5 20
34 Install database authentication
5.8 4 4 16
35 Install enterprise-wide PPM approach 20 4 4 16
36 Install federated database management system (FDMS)
5.8
4 4 16
37 Install necessary applications for monitoring competitors
20 4 4 16
38 Install process for monitoring competitors 20 4 4 16
39 Integrate marketing processes 20 4 4 16
40 Inventory all PPM processes 20 4 4 16
41 Inventory applications
20.4 4 5 20
42 Migrate and eliminate identified applications
20.4 4 5 20
43 Phase out Amsteram billing applications
3.9 4 4 16
44 Phase out London billing applications
3.9 4 4 16
45 Phase out New York billing applications
3.9 4 4 16
46 Prepare and adapt databases
5.8 4 4 16
47 Publish database information
5.8 4 4 16
48 Rationalize product portfolio 8 4 4 16
49 Redesign portfolio into limited set of highly configurable products
8 4 4 16
50 Valuate applications
20.4 4 5 20

72
4.2.2 Competitive Advantage (CA)
Step 2: Competitive Advantage scoring
The second step in the business domain assessment is to appraise Archipharma’s competitive
advantage factor. As described in section 3.2.2, in order to assess the competitive advantage
factor, Archipharma should define their competitive strategy. The essence of formulating
competitive strategy is relating a company to its environment (Porter, 1985). Thus, Porter’s five
force model (Figure 52) is used to understand the structure of pharmaceutical industry and
stake out a position that is more profitable and less vulnerable to attack (Porter, 2008).
Figure 52: Five force model(Porter, 2008)
Five force model of Porter for Archipharma:
1. Threat of new entrants (Potential entrants)
The threat of new entrants in the pharmaceutical industry is low. The new entrants need to
have a certain economies of scale. They need to prepare enough economical resources due
to complex processes in the pharmaceutical industry such as: manufacturing, R&D,
marketing, sales, and distribution. Other entry barrier is the regulatory policy, which could
have a certain standard, costly and lengthy approval process.
2. Bargaining power of suppliers (Suppliers)
The power of supplier for Archipharma is low. It is because the sales for pharmaceutical
industry concentrate in a few of large players, which decreases the bargaining power of the
suppliers. Archipharma could be shifted to third party suppliers anywhere along the supply
chain. As a pharmaceutical company that produces their own patent product, Archipharma
does not need specialized product form particular supplier. It produces its own finished
product from several raw materials. However, product quality could become the bargaining
power of the supplier. If Archipharma wants to change the suppliers, the quality of the
product still becomes a major point that needs to be taken into account.
3. Bargaining power of buyer (Buyers)
The bargaining power of buyer could be rated as medium. Hospital and health care
organizations as Archipharma’s main buyer could have a pressure to keep price in check.

73
The buyers have their bargaining power to choose which pharmaceutical company will
provide them the pharmacy service. Generic drugs also could give them a lower price
options.
4. Threat of substitute products or services (Substitute)
The threat from substitute products or services for Archipharma can be assessed as low or
medium. The possibilities of substitute products or services are identified as follows:
- Alternative medicine (e.g. herbal medicine)
- Healthy lifestyle
- Generic drug product
5. Rivalry among existing firms (Industry competitors)
The rivalry among existing firms in the pharmaceutical industry is high. It is because there
are several key players in the industry, which compete closely and strongly in the market.
Afterwards, to cope with the five competitive forces, Archipharma has adopted a strategy of
differentiation (Porter, 1985) as its competitive advantage. The differentiation for Archipharma
is interorganizational system (IOS) between internal organization, customer and supplier. It
emphasizes on: data interchange between business unit inside Archipharma, data interchange
between Archipharma, supplier and customer. Therefore, the assessment of CA factor focuses
on this competitive advantage strategy. CA worksheet in Appendix 1 is used to assess the
proposed projects.
Output 2 : The list of score for CA (Table 25)
After specifying SA’s score, the final score in this factor is calculated by multiplying the weight
and the score (third and fourth column of Table 25). Following table is the result of CA
assessment: Table 25: Archipharma CA’s Score
No Project Name Weight
CA CA
CA-
Score
1 Align marketing processes 6 3 18
2 Analyze billing process variance 6 2 12
3 Analyze current marketing processes 6 3 18
4 Analyze current product portfolio 6 1 6
5 Analyze data sources 6 2 12
6 Analyze heterogeneous data sources 6 2 12
7 Analyze heterogeneous information sources 6 2 12
8 Choose, configure, test and install APM applications 6 3 18
9 Choose, develop and install enterprise-wide PPM software
6 5 30

74
10 Choose, develop, test and run global financial application
6 4 24
11 Consistent data model development 6 3 18
12 Consolidate marketing applications 6 5 30
13 Data cleaning 6 3 18
14 Data mapping 6 3 18
15 Define valuation model 6 2 12
16 Design and populate application portfolios 6 2 12
17 Design data architecture 6 2 12
18 Design enterprise-wide APM process 6 2 12
19 Develop application rationalization roadmap 6 3 18
20 Develop database authentication protocols 6 2 12
21 Develop integrated reporting 6 4 24
22 Develop real-time portfolio monitoring 6 5 30
23 Develop real-time portfolio reporting 6 5 30
24 Expand customer channels with internet 6 5 30
25 Harmonize local PPM approaches 6 4 24
26 Harmonize ordering process 6 4 24
27 Harmonize process variants 6 3 18
28 Identify obsolete applications 6 2 12
29
Identify products for termination, migration and
consolidation 6 3 18
30 Information cleaning 6 3 18
31 Information harmonization 6 3 18
32 Information mapping 6 3 18
33 Install application lifecycle management approach 6 4 24
34 Install database authentication 6 2 12
35 Install enterprise-wide PPM approach 6 5 30
36 Install federated database management system (FDMS)
6 2 12
37 Install necessary applications for monitoring competitors
6 3 18
38 Install process for monitoring competitors 6 3 18
39 Integrate marketing processes 6 4 24
40 Inventory all PPM processes 6 2 12
41 Inventory applications 6 2 12
42 Migrate and eliminate identified applications 6 3 18
43 Phase out Amsterdam billing applications 6 4 24
44 Phase out London billing applications 6 4 24
45 Phase out New York billing applications 6 4 24
46 Prepare and adapt databases 6 2 12

75
47 Publish database information 6 3 18
48 Rationalize product portfolio 6 2 12
49
Redesign portfolio into limited set of highly configurable
products 6 1 6
50 Valuate applications 6 3 18
4.2.3 Management Information (MI)
Step 3A: Create Business Layer Architecture
The core activities in Archipharma are similar with other pharmaceutical companies. Six Main
business functions are formulated in Archipharma :
1. Marketing and sales
Currently, the process of monitoring its competitor becomes core activities in this
business unit. This is a result of realizing Archipharma’s vision. In order to become the
leading provider of pharmaceutical services in the world, Archipharma should increase
its sales and also understand the condition of market competition.
2. Finance
At the moment, the concern of core activities in finance is to manage the billing process.
3. IS/IT Management
The core activity here is to manage the information system and infrastructure.
4. Pharma R&D
Main core activities to develop new medicine based on the market needs that is
approved by medical affairs department
5. Medical affairs
The function of medical affairs in Archipharma is to facilitate the market needs and the
design product development process in the R&D department.
6. Production and distribution
Production and distribution are also quite important functions for Archipharma. The
process of delivering all the products to the customers while maintaining its quality is an
important point here.
Output 3A: Archipharma’s business function view (Figure 53)

76
Figure 53: Archipharma- Business Function view-
Step 3B: Management Information scoring
In this step, Figure 53 is used as the basis to assess MI’s factor. The description of EA-based MI's
worksheet in Section 3.2.3 is used to rate the score of specific project.
Output 3B: Archipharma’s MI score (Table 26)
Using the same mechanism to calculate MI’s score (multiplying the weight and the score), the
following table shows the result of MI assessment: Table 26: Archipharma MI's score
No Project Name Weight
MI MI
MI-
Score
1 Align marketing processes 2 4 8
2 Analyze billing process variance 2 5 10
3 Analyze current marketing processes 2 4 8
4 Analyze current product portfolio 2 2 4
5 Analyze data sources 2 2 4
6 Analyze heterogeneous data sources 2 2 4
7 Analyze heterogeneous information sources 2 2 4
8 Choose, configure, test and install APM applications 2 5 10
9 Choose, develop and install enterprise-wide PPM software
2 2 4
10 Choose, develop, test and run global financial application
2 4 8
11 Consistent data model development 2 2 4

77
12 Consolidate marketing applications 2 4 8
13 Data cleaning 2 3 6
14 Data mapping 2 3 6
15 Define valuation model 2 5 10
16 Design and populate application portfolios 2 5 10
17 Design data architecture 2 2 4
18 Design enterprise-wide APM process 2 4 8
19 Develop application rationalization roadmap 2 4 8
20 Develop database authentication protocols 2 3 6
21 Develop integrated reporting 2 2 4
22 Develop real-time portfolio monitoring 2 3 6
23 Develop real-time portfolio reporting 2 3 6
24 Expand customer channels with internet 2 3 6
25 Harmonize local PPM approaches 2 2 4
26 Harmonize ordering process 2 3 6
27 Harmonize process variants 2 4 8
28 Identify obsolete applications 2 5 10
29
Identify products for termination, migration and
consolidation 2 3 6
30 Information cleaning 2 3 6
31 Information harmonization 2 3 6
32 Information mapping 2 3 6
33 Install application lifecycle management approach 2 4 8
34 Install database authentication 2 3 6
35 Install enterprise-wide PPM approach 2 2 4
36 Install federated database management system (FDMS)
2 2 4
37 Install necessary applications for monitoring competitors
2 5 10
38 Install process for monitoring competitors 2 5 10
39 Integrate marketing processes 2 4 8
40 Inventory all PPM processes 2 2 4
41 Inventory applications 2 5 10
42 Migrate and eliminate identified applications 2 4 8
43 Phase out Amsteram billing applications 2 4 8
44 Phase out London billing applications 2 4 8
45 Phase out New York billing applications 2 4 8
46 Prepare and adapt databases 2 2 4
47 Publish database information 2 2 4
48 Rationalize product portfolio 2 2 4

78
49
Redesign portfolio into limited set of highly configurable
products 2 2 4
50 Valuate applications 2 5 10
4.2.4 Competitive Response (CR)
Step 4: Competitive Response scoring
To conduct the assessment of competitive response for Archipharma, the analysis of
competitive industry in section 4.2.2 (the five force model) is used. By understanding the
condition competitive condition in its industry, Archipharma has more insight on whether the
project could be postponed to support its competitive strategy.
Output 4: Archipharma’s CR score (Table 27)
In order to calculate the final CR’s score, the result of previous step (fourth column of Table 27)
is multiplied by the weight (third column of Table 27).
Table 27: Archipharma CR's score
No Project Name Weight
CR CR CR-Score
1 Align marketing processes 4 3 12
2 Analyze billing process variance 4 1 4
3 Analyze current marketing processes 4 2 8
4 Analyze current product portfolio 4 2 8
5 Analyze data sources 4 1 4
6 Analyze heterogeneous data sources 4 1 4
7 Analyze heterogeneous information sources 4 1 4
8 Choose, configure, test and install APM applications 4 3 12
9 Choose, develop and install enterprise-wide PPM software
4 5 20
10 Choose, develop, test and run global financial application
4 4 16
11 Consistent data model development 4 4 16
12 Consolidate marketing applications 4 4 16
13 Data cleaning 4 2 8
14 Data mapping 4 2 8
15 Define valuation model 4 1 4
16 Design and populate application portfolios 4 2 8
17 Design data architecture 4 3 12
18 Design enterprise-wide APM process 4 2 8
19 Develop application rationalization roadmap 4 2 8
20 Develop database authentication protocols 4 4 16
21 Develop integrated reporting 4 5 20
22 Develop real-time portfolio monitoring 4 4 16
23 Develop real-time portfolio reporting 4 4 16

79
24 Expand customer channels with internet 4 4 16
25 Harmonize local PPM approaches 4 3 12
26 Harmonize ordering process 4 5 20
27 Harmonize process variants 4 3 12
28 Identify obsolete applications 4 1 4
29
Identify products for termination, migration and
consolidation 4 3 12
30 Information cleaning 4 2 8
31 Information harmonization 4 3 12
32 Information mapping 4 2 8
33 Install application lifecycle management approach 4 4 16
34 Install database authentication 4 4 16
35 Install enterprise-wide PPM approach 4 4 16
36 Install federated database management system (FDMS)
4 3 12
37 Install necessary applications for monitoring competitors
4 3 12
38 Install process for monitoring competitors 4 3 12
39 Integrate marketing processes 4 4 16
40 Inventory all PPM processes 4 3 12
41 Inventory applications 4 1 4
42 Migrate and eliminate identified applications 4 2 8
43 Phase out Amsteram billing applications 4 4 16
44 Phase out London billing applications 4 4 16
45 Phase out New York billing applications 4 4 16
46 Prepare and adapt databases 4 3 12
47 Publish database information 4 3 12
48 Rationalize product portfolio 4 2 8
49
Redesign portfolio into limited set of highly configurable
products 4 3 12
50 Valuate applications 4 3 12
4.2.5 Project/Organization Risk (OR)
Step 5: Project / Organization Risk scoring
The last factor in the business domain is assessing the preparedness of the business for the
changes by implementing the proposed project. The ideal condition to assess this factor is by
using the business case document and risk analysis of each proposed project. However, the
available data is the risk analysis of each project in Archipharma which consists of the risk
probability and risk impact (Appendix 4). Thus, a mapping process is carried out to map the
current Archipharma’s risk analysis to the OR’s score.

80
Table 28: Archipharma’s Risk Level matrix
Risk likelihood
Impact
insignificant (10)
minor (30)
moderate (50)
major (70)
extreme (100)
Very likely (1) 10 30 50 70 100
likely (0.7) 7 21 35 49 70
moderate (0.5)
5 15 25 35 50
rare (0.3) 3 9 15 21 30
unlikely (0.1) 1 3 5 7 10
Table 28 shows the scale Archipharma’s risk level matrix (Stoneburner, Goguen, & Alexis, 2002)
at based on the risk likelihood and its impact. Afterwards, Table 29 illustrates the mapping
process from Archipharma’s risk level to OR’s score. So, for example if the score of
Archipharma’s risk level is in the range 1-20, then the OR’s score is 1.
Table 29: Archipharma risk profile mapping
ArchiPharma’s Risk Level OR's score
1-20 1
21-40 2
41-60 3
61-80 4
81-100 5
Output 5 : Archipharma’s OR score (Table 30)
Table 30 shows the result of OR’s assessment using the same formulation to multiply the score
(fourth column of Table 30) and the weight (third column of Table 30). The result is in negative
number, since it represents the risk factor of the project. Table 30: Archipharma’s OR score
No Project Name Weight
OR OR
OR-
Score
1 Align marketing processes -1 2 -2
2 Analyze billing process variance -1 1 -1
3 Analyze current marketing processes -1 2 -2
4 Analyze current product portfolio -1 1 -1
5 Analyze data sources -1 1 -1
6 Analyze heterogeneous data sources -1 2 -2
7 Analyze heterogeneous information sources -1 2 -2
8 Choose, configure, test and install APM applications -1 3 -3

81
9 Choose, develop and install enterprise-wide PPM software
-1 1 -1
10 Choose, develop, test and run global financial application
-1 1 -1
11 Consistent data model development -1 2 -2
12 Consolidate marketing applications -1 3 -3
13 Data cleaning -1 3 -3
14 Data mapping -1 3 -3
15 Define valuation model -1 1 -1
16 Design and populate application portfolios -1 2 -2
17 Design data architecture -1 2 -2
18 Design enterprise-wide APM process -1 2 -2
19 Develop application rationalization roadmap -1 2 -2
20 Develop database authentication protocols -1 4 -4
21 Develop integrated reporting -1 1 -1
22 Develop real-time portfolio monitoring -1 1 -1
23 Develop real-time portfolio reporting -1 2 -2
24 Expand customer channels with internet -1 3 -3
25 Harmonize local PPM approaches -1 1 -1
26 Harmonize ordering process -1 2 -2
27 Harmonize process variants -1 3 -3
28 Identify obsolete applications -1 1 -1
29
Identify products for termination, migration and
consolidation -1 2 -2
30 Information cleaning -1 5 -5
31 Information harmonization -1 3 -3
32 Information mapping -1 2 -2
33 Install application lifecycle management approach -1 2 -2
34 Install database authentication -1 2 -2
35 Install enterprise-wide PPM approach -1 3 -3
36 Install federated database management system (FDMS)
-1 1 -1
37 Install necessary applications for monitoring competitors
-1 2 -2
38 Install process for monitoring competitors -1 1 -1
39 Integrate marketing processes -1 1 -1
40 Inventory all PPM processes -1 2 -2
41 Inventory applications -1 3 -3
42 Migrate and eliminate identified applications -1 2 -2
43 Phase out Amsteram billing applications -1 1 -1
44 Phase out London billing applications -1 1 -1

82
45 Phase out New York billing applications -1 1 -1
46 Prepare and adapt databases -1 2 -2
47 Publish database information -1 1 -1
48 Rationalize product portfolio -1 2 -2
49
Redesign portfolio into limited set of highly configurable
products -1 2 -2
50 Valuate applications -1 4 -4
4.3 Technology Domain Assessment
In the following section, four factors will be assessed in the technology domain.
4.3.1 Strategic IS Architecture (SA)
Step 1A : Create roadmap architecture
Output1A : Roadmap Architecture (Figure 54)
A roadmap view has been already planned by Archipharma to execute its relating program. By
using the list of the projects in the program described in Section 4.1.1, Archipharma could
assess the Strategic IS Architecture factor for each project.
Figure 54: Archipharma Roadmap view
Step 1B : Strategic IS Architecture Scoring
Output1B : SA’s score (Table 31)
In order to scoring SA’s factor, the description of EA-based SA worksheet in Section 3.3.1 is
used. In this assessment step, we do not only use Archipharma roadmap view, but also the
project’s benefit in terms of financial resource to rate the SA’s score. Finally, the final score can
be calculated (shown in Table 31) by multiplying the weight and the score.
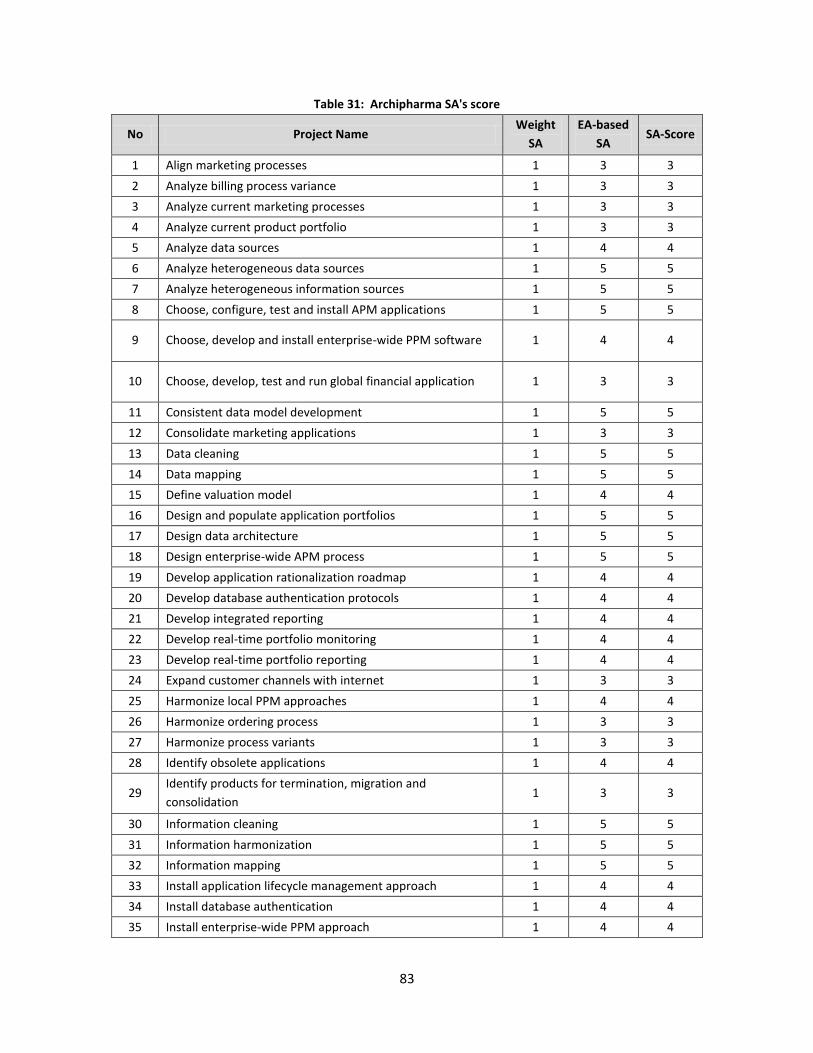
83
Table 31: Archipharma SA's score
No Project Name Weight
SA
EA-based
SA SA-Score
1 Align marketing processes 1 3 3
2 Analyze billing process variance 1 3 3
3 Analyze current marketing processes 1 3 3
4 Analyze current product portfolio 1 3 3
5 Analyze data sources 1 4 4
6 Analyze heterogeneous data sources 1 5 5
7 Analyze heterogeneous information sources 1 5 5
8 Choose, configure, test and install APM applications 1 5 5
9 Choose, develop and install enterprise-wide PPM software 1 4 4
10 Choose, develop, test and run global financial application 1 3 3
11 Consistent data model development 1 5 5
12 Consolidate marketing applications 1 3 3
13 Data cleaning 1 5 5
14 Data mapping 1 5 5
15 Define valuation model 1 4 4
16 Design and populate application portfolios 1 5 5
17 Design data architecture 1 5 5
18 Design enterprise-wide APM process 1 5 5
19 Develop application rationalization roadmap 1 4 4
20 Develop database authentication protocols 1 4 4
21 Develop integrated reporting 1 4 4
22 Develop real-time portfolio monitoring 1 4 4
23 Develop real-time portfolio reporting 1 4 4
24 Expand customer channels with internet 1 3 3
25 Harmonize local PPM approaches 1 4 4
26 Harmonize ordering process 1 3 3
27 Harmonize process variants 1 3 3
28 Identify obsolete applications 1 4 4
29 Identify products for termination, migration and
consolidation 1 3 3
30 Information cleaning 1 5 5
31 Information harmonization 1 5 5
32 Information mapping 1 5 5
33 Install application lifecycle management approach 1 4 4
34 Install database authentication 1 4 4
35 Install enterprise-wide PPM approach 1 4 4

84
36 Install federated database management system (FDMS) 1 4 4
37 Install necessary applications for monitoring competitors 1 3 3
38 Install process for monitoring competitors 1 3 3
39 Integrate marketing processes 1 3 3
40 Inventory all PPM processes 1 4 4
41 Inventory applications 1 4 4
42 Migrate and eliminate identified applications 1 4 4
43 Phase out Amsterdam billing applications 1 3 3
44 Phase out London billing applications 1 3 3
45 Phase out New York billing applications 1 3 3
46 Prepare and adapt databases 1 4 4
47 Publish database information 1 4 4
48 Rationalize product portfolio 1 3 3
49 Redesign portfolio into limited set of highly configurable
products 1 3 3
50 Valuate applications 1 4 4
4.3.2 Definitional Uncertainty (DU)
Step 2 : Definitional Uncertainty Scoring
Output2 : DU’s score (Table 32)
Archipharma’s program motivation view (shown in Figure 55) is used to assess the second
factors in the IT domain. However, due to the limitation of available data, the scoring of DU is
solely based on the architecture (which is enlarged at Appendix 6.1) without the information of
specification of each project or the detailed description from business case document. Hence, a
number of assumptions are made when apprising the score of DU.
The DU’s score for all the ArchiPharma’s projects ranges from 1 to 4, because based on the
architecture, it is assumed that all the projects have the requirements. From the output (Table
30), three projects (project no 43, 44 & 45 in Table 30) are scored 4 in this factor, based on the
opinion that the projects of ‘phase out billing application’ in three offices (Amsterdam, London
and New York) are quite complex projects. The process of phasing out an application especially
a billing application could have some changes even during the project period, depending on the
condition when the project is executed. For scoring 3, 16 projects are considered; that changes
for these projects are almost certain almost immediately. For instance, the changes in the
project of installing FDMS depend on the setting that is the required setting of the system. The
last two score: 1 & 2, are made based on the assumption of the probability of nonroutine
changes that could occur for a specific project. Finally, the final score in this score is shown in
Table 30 by multiplying the weight and the score.

85
Figure 55: Archipharma's Program Motivation View
Table 32: Archipharma DU's score
No Project Name Weight
DU DU
DU-
Score
1 Align marketing processes -2 2 -4
2 Analyze billing process variance -2 1 -2
3 Analyze current marketing processes -2 1 -2
4 Analyze current product portfolio -2 1 -2
5 Analyze data sources -2 1 -2
6 Analyze heterogeneous data sources -2 1 -2
7 Analyze heterogeneous information sources -2 1 -2
8 Choose, configure, test and install APM applications -2 3 -6
9 Choose, develop and install enterprise-wide PPM software
-2 3 -6
10 Choose, develop, test and run global financial application
-2 3 -6
11 Consistent data model development -2 1 -2
12 Consolidate marketing applications -2 3 -6
13 Data cleaning -2 2 -4

86
14 Data mapping -2 2 -4
15 Define valuation model -2 1 -2
16 Design and populate application portfolios -2 2 -4
17 Design data architecture -2 1 -2
18 Design enterprise-wide APM process -2 2 -4
19 Develop application rationalization roadmap -2 1 -2
20 Develop database authentication protocols -2 2 -4
21 Develop integrated reporting -2 2 -4
22 Develop real-time portfolio monitoring -2 2 -4
23 Develop real-time portfolio reporting -2 2 -4
24 Expand customer channels with internet -2 3 -6
25 Harmonize local PPM approaches -2 2 -4
26 Harmonize ordering process -2 3 -6
27 Harmonize process variants -2 3 -6
28 Identify obsolete applications -2 1 -2
29
Identify products for termination, migration and
consolidation -2 1 -2
30 Information cleaning -2 2 -4
31 Information harmonization -2 3 -6
32 Information mapping -2 1 -2
33 Install application lifecycle management approach -2 2 -4
34 Install database authentication -2 3 -6
35 Install enterprise-wide PPM approach -2 3 -6
36 Install federated database management system (FDMS)
-2 3 -6
37 Install necessary applications for monitoring competitors
-2 3 -6
38 Install process for monitoring competitors -2 3 -6
39 Integrate marketing processes -2 3 -6
40 Inventory all PPM processes -2 1 -2
41 Inventory applications -2 1 -2
42 Migrate and eliminate identified applications -2 3 -6
43 Phase out Amsterdam billing applications -2 4 -8
44 Phase out London billing applications -2 4 -8
45 Phase out New York billing applications -2 4 -8
46 Prepare and adapt databases -2 2 -4
47 Publish database information -2 1 -2
48 Rationalize product portfolio -2 2 -4
49
Redesign portfolio into limited set of highly configurable
products -2 3 -6
50 Valuate applications -2 2 -4
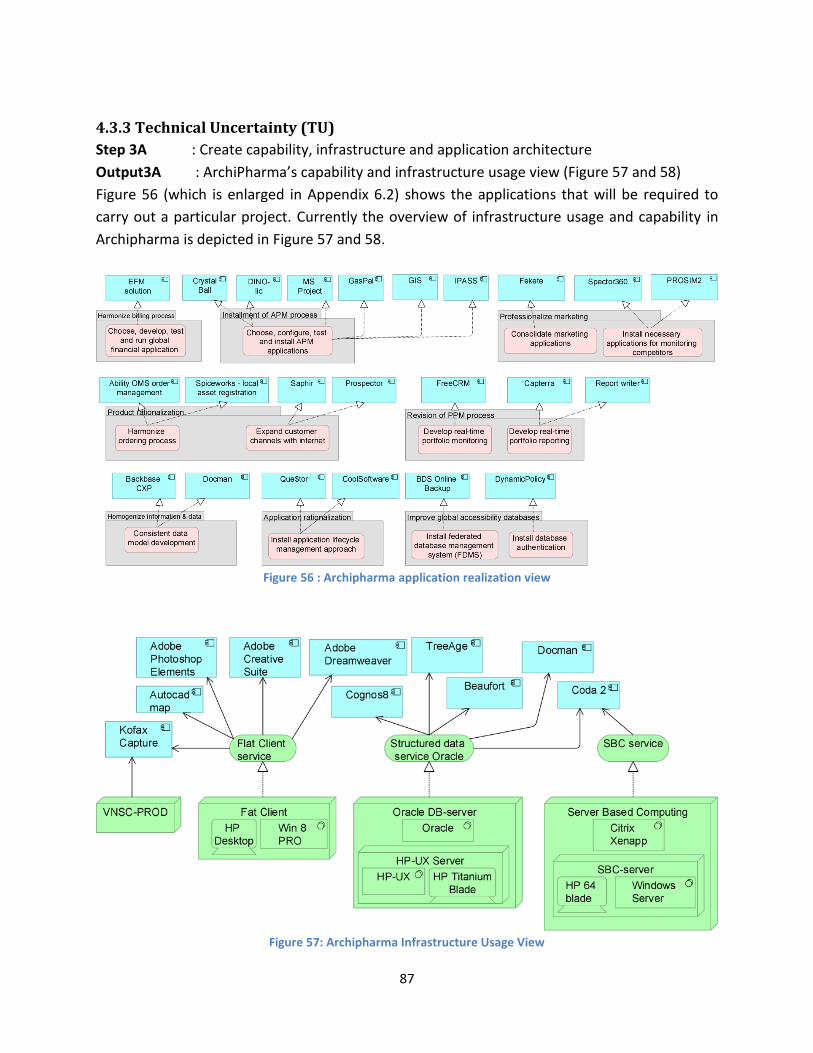
87
4.3.3 Technical Uncertainty (TU)
Step 3A : Create capability, infrastructure and application architecture
Output3A : ArchiPharma’s capability and infrastructure usage view (Figure 57 and 58)
Figure 56 (which is enlarged in Appendix 6.2) shows the applications that will be required to
carry out a particular project. Currently the overview of infrastructure usage and capability in
Archipharma is depicted in Figure 57 and 58.
Figure 56 : Archipharma application realization view
Figure 57: Archipharma Infrastructure Usage View

88
Figure 58: Archipharma Capability View
Step 3B : Technical Uncertainty Scoring
There are four separated component assessment for TU:
1. Skills required
2. Hardware dependencies
3. Software dependencies ( other than application software)
4. Application software
From all the projects, 12 projects are specified having application dependencies (Figure 56).
Therefore, the score for these 12 projects is varied from 1 to 3; depend on the complexity of
related application. Afterwards, the score is calculated using equation 3.1 in Section 3.3.3.
Output3B: Archipharma’s TU score (Table 33)
The last step in this factor is to calculate the final score by multiplying the score (fourth column
of Table 33) and the weight (third column of Table 33). This factor also negative, because it
indicates the uncertainty of the current condition.

89
Table 33: ArchipharmaTU's score
No Project Name Weight
TU
EA-based
TU
TU-
Score
1 Align marketing processes -1 0 0
2 Analyze billing process variance -1 0 0
3 Analyze current marketing processes -1 0 0
4 Analyze current product portfolio -1 0 0
5 Analyze data sources -1 0 0
6 Analyze heterogeneous data sources -1 0 0
7 Analyze heterogeneous information sources -1 0 0
8 Choose, configure, test and install APM applications -1 1 -1
9
Choose, develop and install enterprise-wide PPM
software -1 1 -1
10 Choose, develop, test and run global financial application -1 2 -2
11 Consistent data model development -1 1 -1
12 Consolidate marketing applications -1 0 0
13 Data cleaning -1 0 0
14 Data mapping -1 0 0
15 Define valuation model -1 1 -1
16 Design and populate application portfolios -1 0 0
17 Design data architecture -1 0 0
18 Design enterprise-wide APM process -1 0 0
19 Develop application rationalization roadmap -1 1 -1
20 Develop database authentication protocols -1 0 0
21 Develop integrated reporting -1 0 0
22 Develop real-time portfolio monitoring -1 1 -1
23 Develop real-time portfolio reporting -1 1 -1
24 Expand customer channels with internet -1 2 -2
25 Harmonize local PPM approaches -1 0 0
26 Harmonize ordering process -1 1 -1
27 Harmonize process variants -1 0 0
28 Identify obsolete applications -1 1 -1
29
Identify products for termination, migration and
consolidation -1 0 0
30 Information cleaning -1 0 0
31 Information harmonization -1 0 0
32 Information mapping -1 0 0
33 Install application lifecycle management approach -1 1 -1
34 Install database authentication -1 1 -1
35 Install enterprise-wide PPM approach -1 0 0
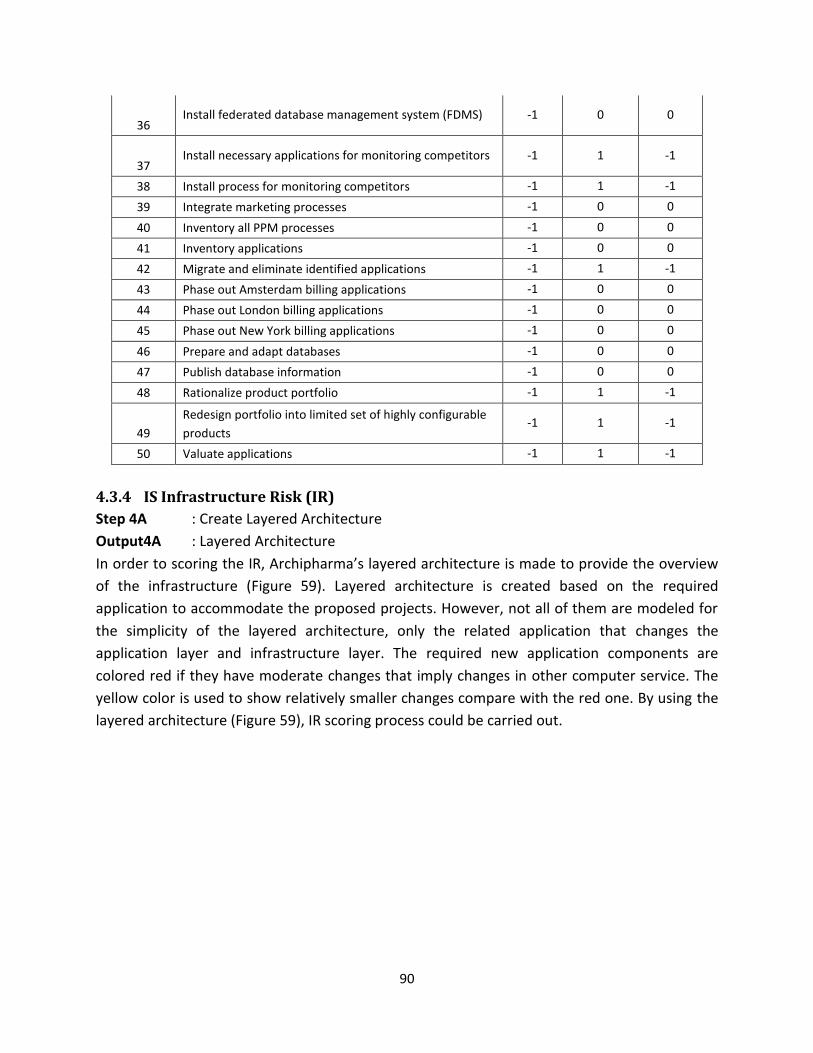
90
36 Install federated database management system (FDMS) -1 0 0
37 Install necessary applications for monitoring competitors -1 1 -1
38 Install process for monitoring competitors -1 1 -1
39 Integrate marketing processes -1 0 0
40 Inventory all PPM processes -1 0 0
41 Inventory applications -1 0 0
42 Migrate and eliminate identified applications -1 1 -1
43 Phase out Amsterdam billing applications -1 0 0
44 Phase out London billing applications -1 0 0
45 Phase out New York billing applications -1 0 0
46 Prepare and adapt databases -1 0 0
47 Publish database information -1 0 0
48 Rationalize product portfolio -1 1 -1
49
Redesign portfolio into limited set of highly configurable
products -1 1 -1
50 Valuate applications -1 1 -1
4.3.4 IS Infrastructure Risk (IR)
Step 4A : Create Layered Architecture
Output4A : Layered Architecture
In order to scoring the IR, Archipharma’s layered architecture is made to provide the overview
of the infrastructure (Figure 59). Layered architecture is created based on the required
application to accommodate the proposed projects. However, not all of them are modeled for
the simplicity of the layered architecture, only the related application that changes the
application layer and infrastructure layer. The required new application components are
colored red if they have moderate changes that imply changes in other computer service. The
yellow color is used to show relatively smaller changes compare with the red one. By using the
layered architecture (Figure 59), IR scoring process could be carried out.
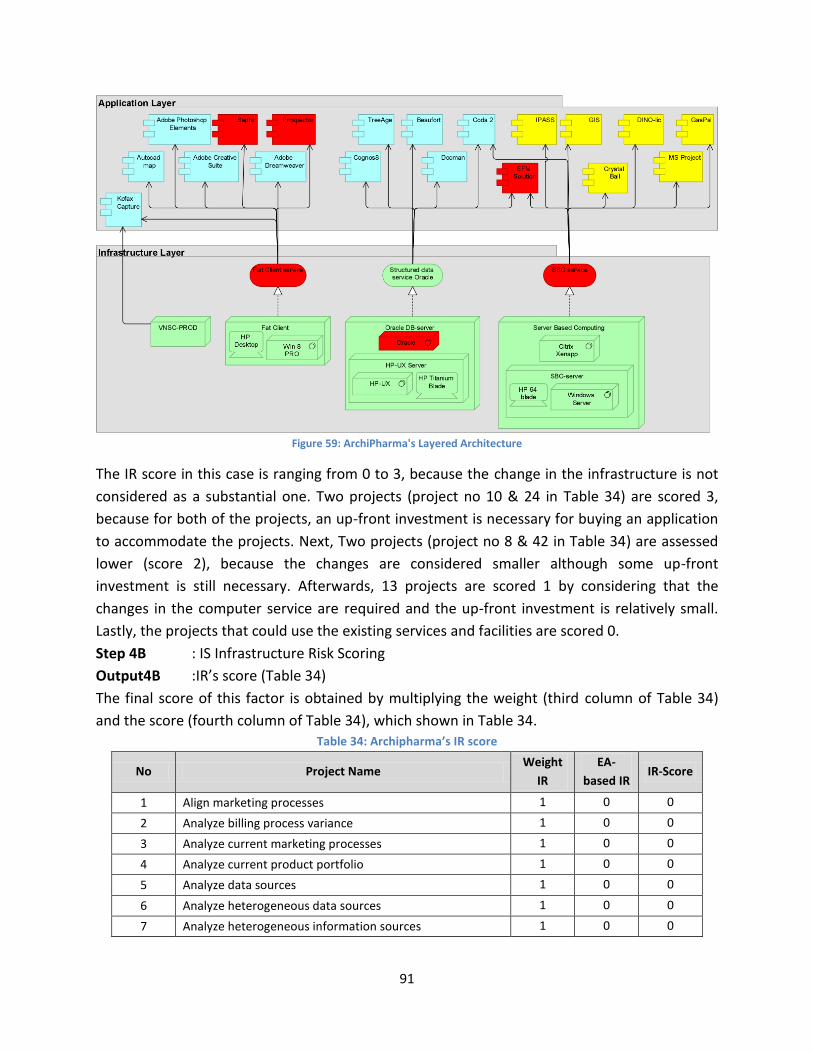
91
Figure 59: ArchiPharma's Layered Architecture
The IR score in this case is ranging from 0 to 3, because the change in the infrastructure is not
considered as a substantial one. Two projects (project no 10 & 24 in Table 34) are scored 3,
because for both of the projects, an up-front investment is necessary for buying an application
to accommodate the projects. Next, Two projects (project no 8 & 42 in Table 34) are assessed
lower (score 2), because the changes are considered smaller although some up-front
investment is still necessary. Afterwards, 13 projects are scored 1 by considering that the
changes in the computer service are required and the up-front investment is relatively small.
Lastly, the projects that could use the existing services and facilities are scored 0.
Step 4B : IS Infrastructure Risk Scoring
Output4B :IR’s score (Table 34)
The final score of this factor is obtained by multiplying the weight (third column of Table 34)
and the score (fourth column of Table 34), which shown in Table 34. Table 34: Archipharma’s IR score
No Project Name Weight
IR
EA-
based IR IR-Score
1 Align marketing processes 1 0 0
2 Analyze billing process variance 1 0 0
3 Analyze current marketing processes 1 0 0
4 Analyze current product portfolio 1 0 0
5 Analyze data sources 1 0 0
6 Analyze heterogeneous data sources 1 0 0
7 Analyze heterogeneous information sources 1 0 0

92
8 Choose, configure, test and install APM applications 1 2 2
9 Choose, develop and install enterprise-wide PPM software 1 1 1
10 Choose, develop, test and run global financial application 1 3 3
11 Consistent data model development 1 1 1
12 Consolidate marketing applications 1 1 1
13 Data cleaning 1 0 0
14 Data mapping 1 0 0
15 Define valuation model 1 0 0
16 Design and populate application portfolios 1 0 0
17 Design data architecture 1 0 0
18 Design enterprise-wide APM process 1 0 0
19 Develop application rationalization roadmap 1 0 0
20 Develop database authentication protocols 1 1 1
21 Develop integrated reporting 1 0 0
22 Develop real-time portfolio monitoring 1 1 1
23 Develop real-time portfolio reporting 1 1 1
24 Expand customer channels with internet 1 3 3
25 Harmonize local PPM approaches 1 0 0
26 Harmonize ordering process 1 1 1
27 Harmonize process variants 1 0 0
28 Identify obsolete applications 1 0 0
29
Identify products for termination, migration and
consolidation 1 0 0
30 Information cleaning 1 0 0
31 Information harmonization 1 0 0
32 Information mapping 1 0 0
33 Install application lifecycle management approach 1 1 1
34 Install database authentication 1 1 1
35 Install enterprise-wide PPM approach 1 1 1
36 Install federated database management system (FDMS) 1 1 1
37 Install necessary applications for monitoring competitors 1 1 1
38 Install process for monitoring competitors 1 0 0
39 Integrate marketing processes 1 1 1
40 Inventory all PPM processes 1 0 0
41 Inventory applications 1 0 0
42 Migrate and eliminate identified applications 1 2 2
43 Phase out Amsterdam billing applications 1 0 0

93
44 Phase out London billing applications 1 0 0
45 Phase out New York billing applications 1 0 0
46 Prepare and adapt databases 1 0 0
47 Publish database information 1 0 0
48 Rationalize product portfolio 1 0 0
49
Redesign portfolio into limited set of highly configurable
products 1 0 0
50 Valuate applications 1 0 0
4.4 Financial Consequence
In the original method, NPV is used to evaluate the financial perspective of the project.
However, in the Archipharma case, the data that could be used to represent the financial
perspective of the proposed projects is its benefit. The list of project’s benefit is presented in
Table 35 and obtained from Archipharma’s module in BiZZdesign :
Table 35: Archiparma's project benefit
No Projects Benefit
1 Align marketing processes 500
2 Analyze billing process variance 1200
3 Analyze current marketing processes 500
4 Analyze current product portfolio 500
5 Analyze data sources 500
6 Analyze heterogeneous data sources 450
7 Analyze heterogeneous information sources 500
8 Choose, configure, test and install APM applications 10000
9 Choose, develop and install enterprise-wide PPM software 2100
10 Choose, develop, test and run global financial application -500
11 Consistent data model development 2300
12 Consolidate marketing applications 5000
13 Data cleaning 1500
14 Data mapping 2900
15 Define valuation model 1000
16 Design and populate application portfolios 2000
17 Design data architecture 750
18 Design enterprise-wide APM process 7000
19 Develop application rationalization roadmap 1200
20 Develop database authentication protocols 1800
21 Develop integrated reporting 8000
22 Develop real-time portfolio monitoring 6000
23 Develop real-time portfolio reporting 2000

94
24 Expand customer channels with internet 1500
25 Harmonize local PPM approaches 1200
26 Harmonize ordering process 10500
27 Harmonize process variants 2600
28 Identify obsolete applications 1750
29 Identify products for termination, migration and consolidation 500
30 Information cleaning 1000
31 Information harmonization 5000
32 Information mapping 400
33 Install application lifecycle management approach 2500
34 Install database authentication 150
35 Install enterprise-wide PPM approach 4000
36 Install federated database management system (FDMS) 250
37 Install necessary applications for monitoring competitors 2000
38 Install process for monitoring competitors 2000
39 Integrate marketing processes 2000
40 Inventory all PPM processes 250
41 Inventory applications 750
42 Migrate and eliminate identified applications 7500
43 Phase out Amsteram billing applications 1700
44 Phase out London billing applications 1500
45 Phase out New York billing applications 2000
46 Prepare and adapt databases 1100
47 Publish database information 1500
48 Rationalize product portfolio 2500
49 Redesign portfolio into limited set of highly configurable products 700
50 Valuate applications 1500
4.5 Project prioritization
After calculating the three-domain assessment, the next step is to calculate the project
prioritization. The importance weight of each domain is set up. For Archipharma, it is set that
the weight for business, technology and financial domain respectively are 0.4, 0.3 and 0.3.
Table 36 shows the summary of each domain assessment score and the project total score. The
score in the business and technology domain (third and fourth column of Table 36) is calculated
using equation 3.2, while the total score (sixth column of Table 36) using equation 3.3.

95
Table 36: Archipharma's Project score
No Project Name Total
Business Total
Technology Financial
Assessment Total Score
1 Harmonize ordering process 64 -3 10500 3174.7
2 Choose, configure, test and install APM applications
53 0 10000 3021.2
3 Develop integrated reporting 63 0 8000 2425.2
4 Migrate and eliminate identified applications 52 -1 7500 2270.5
5 Design enterprise-wide APM process 42 1 7000 2117.1
6 Develop real-time portfolio monitoring 67 0 6000 1826.8
7 Consolidate marketing applications 67 -2 5000 1526.2
8 Information harmonization 49 -1 5000 1519.3
9 Install enterprise-wide PPM approach 63 -1 4000 1224.9
10 Data mapping 45 1 2900 888.3
11 Harmonize process variants 51 -3 2600 799.5
12 Install application lifecycle management approach
66 0 2500 776.4
13 Rationalize product portfolio 38 -2 2500 764.6
14 Consistent data model development 52 3 2300 711.7
15 Choose, develop and install enterprise-wide PPM software
69 -2 2100 657
16 Develop real-time portfolio reporting 66 0 2000 626.4
17 Integrate marketing processes 63 -2 2000 624.6
18 Phase out New York billing applications 63 -5 2000 623.7
19 Install process for monitoring competitors 55 -4 2000 620.8
20 Install necessary applications for monitoring competitors
54 -3 2000 620.7
21 Design and populate application portfolios 44 1 2000 617.9
22 Develop database authentication protocols 46 1 1800 558.7
23 Identify obsolete applications 45 1 1750 543.3
24 Phase out Amsterdam billing applications 63 -5 1700 533.7
25 Expand customer channels with internet 65 -2 1500 475.4
26 Phase out London billing applications 63 -5 1500 473.7
27 Valuate applications 56 -1 1500 472.1
28 Publish database information 49 2 1500 470.2
29 Data cleaning 45 1 1500 468.3
30 Harmonize local PPM approaches 55 0 1200 382
31 Develop application rationalization roadmap 52 1 1200 381.1
32 Analyze billing process variance 41 1 1200 376.7

96
33 Prepare and adapt databases 42 0 1100 346.8
34 Define valuation model 45 1 1000 318.3
35 Information cleaning 43 1 1000 317.5
36 Inventory applications 43 2 750 242.8
37 Design data architecture 42 3 750 242.7
38 Redesign portfolio into limited set of highly configurable products
36 -4 700 223.2
39 Align marketing processes 52 -1 500 170.5
40 Identify products for termination, migration and consolidation
50 1 500 170.3
41 Analyze current marketing processes 48 1 500 169.5
42 Analyze data sources 35 2 500 164.6
43 Analyze heterogeneous information sources 34 3 500 164.5
44 Analyze current product portfolio 33 1 500 163.5
45 Analyze heterogeneous data sources 34 3 450 149.5
46 Information mapping 46 3 400 139.3
47 Inventory all PPM processes 42 2 250 92.4
48 Install federated database management system (FDMS)
43 -1 250 91.9
49 Install database authentication 48 -2 150 63.6
50 Choose, develop, test and run global financial application
63 -2 -500 -125.4
From the result, it can be seen that ‘harmonize ordering process’ is the project with the highest
score, while ‘choose, develop, test and run global financial application’ has the minimum
project’s score. Archipharma needs to take a look at the project with the low score and analyze
the condition that leads to the minimum score. In this case, project no 50 in Table 34 has the
lowest financial assessment and is considered quite risky (negative score) in the technology
domain. By applying the proposed method, Archipharma could analyze the proposed projects
from various perspectives and utilize EA in the assessment process. In addition, Table 37 is
given for the reader to easily interpret the final result. It shows the range of Project’s score that
has a minimum score of -156,5 and the maximum score of 3185. Table 37: Archipharma's project range score
Domain Archipharma's
importance weight
Min Score
Max Score
Total Score
Min Max
Business 0.4 -5 80
-156.5 3185 Technology 0.3 -15 10
Finance 0.3 -500 10500

97
From the project’s score, we could divide the list of the projects into three categories of
prioritization. The first priority is the list of the projects with the total scores of more than 650.
The second priority if the score range is between 300 and 650. For third priority if the projects
have scored lower than 300.
1st Priority: >650
2nd Priority: 300- 650
3rd Priority: <300
We make three priorities to ease the decision maker if they want to analyze further the proposed projects. For example, they should pay more attention to the third priority during the execution / implementation phase of the project, or if there is a budget limitation, the last prioritized projects become the candidates to be eliminated. 4.6 Project Visualization
Figure 60 overviews all Archipharma’s project plotted in a bubble chart that is made using BizzDesign’s Architect tools. Most of the projects in the bubble chart are plotted in the ‘must have’ quadrant. It means that most of the proposed projects have a high score on its contribution to the business and technology domain. Generally, we could conclude that the proposed projects affect both business and technology performance to ultimately achieve their goals. However, Figure 60 shows too many overlaps between the data because of the number of the projects that should be plotted (50 projects). Therefore, in the following paragraph, we illustrate three more bubble charts based on the three priorities categories of the project.

98
Figure 60: Archipharma's projects overview
Another bubble chart is made to plot the projects that belong to the first priority (score > 650). Figure 61 shows most of the projects is plotted in the ‘must have’ quadrant. This picture summarizes a simple explanation for the decision maker that fifteen (15) projects are the top priority, have high score for both contributions to the business and technology domain, and also illustrates its benefit by the size of the circle.

99
Figure 61 : First Priority Project's Overview
For the second priority projects (score between 300 and 650), Figure 62 represents the position
of the proposed projects in ‘Must have’ and ‘Should have’ quadrant. Generally, most of the
projects here are still considered as a top priority. It is because some projects still have a lower
score in the technology domain that could be caused by several reasons such as: the risk to
implement it from the IT perspective, current technology in the company is not yet ready to
support the projects or the alignment with IT strategy.
Figure 62 : Second Prioritize Project's Overview

100
Figure 63 : Third Prioritize Project's Overview
The projects in the third Priority are mostly plotted in the ‘Must have’, ‘Could have’ and ‘Won’t
have’ quadrant. Although the projects are belong to the third priority, but they still have
relatively good position in the quadrant. The projects are considered desirable, but could be
eliminated if another limitation, like budget limitation becomes an obstacle to execute it.
4.7 Summary
This chapter has discussed the use of an EA-based Investment Portfolio method on the
ArchiPharma case study. All the following steps in the three domains of the proposed method is
applied in the case. It shows that the proposed method could facilitate a decision making
process in terms of giving suggestions on the prioritized projects that should be carried out by
an organization. By applying the method, we demonstrate the concrete use of EA to evaluate
the projects as well as to provide a room for the decision maker to give their own justification in
the scoring process.

101
5. Evaluation
This chapter covers the fifth activity in the design science research methodology, which is
evaluation. It measures how well the artifact supports a solution to the problem (Peffers et al.,
2008). An evaluation can be conducted in many ways such as; comparison of the artifact’s
functionality with the solution objectives, objective quantitative performance measures, the
result of satisfaction surveys, client feedback or simulations (Peffers et al., 2008). In order to
evaluate EA-based Investment Portfolio method, which is proposed in this research, qualitative
interviews in IS research (Myers & Newman, 2007) were conducted. Section 5.1 discusses the
evaluation method that is carried out in this research and the interview setting. Afterwards,
Section 5.2 describes the result.
5.1 Evaluation method and interview setting
According to Hevner et al., (2004), IT artifacts can be evaluated in relevant quality attributes
that show the utility, quality, and efficacy of a design artifact. Accordingly, we define five (5)
criteria that are used as a guideline to structure the questions in the interview session (shown
in table 35). The first criterion aims to get the information from the interviewees about the
current practice of project portfolio valuation and the use of EA. It also serves as a starting
point of the interview session so that, the interviewees become familiar with the topic of
discussion.
Afterwards, the ease of understanding, practical use / applicability and usefulness are selected
as the relevant quality attributes in order to evaluate the proposed method. Through this step,
we examined whether or not the proposed method is easy to understand and, which step in the
method that needs to be elaborated further. Due to the final goal of the research which is to
improve the decision making process in an organization, the applicability of the proposed
method was also evaluated as the third criterion. Next, the usefulness of the method was also
investigated.
The last criterion of the interview structure is feedback from the interviewees. It is aimed to
create open discussions with them through which new insights could be obtained such as the
possibility of improvement, the possibility of future work/research or any other comment that
could come up during discussion. Table 38 shows the questions in accordance with the criteria.

102
Table 38 : Evaluation criteria
No Criteria Questions
1. Current practice and an-EA
based method
1. What are methods do you think are often used in practice to prioritize
projects?
2. What do you think about the use of EA to prioritize projects? Do you
think it’s beneficial?
2. Ease of understanding 3. Is the proposed method easy to understand? Is there any step that needs
to be elaborated more?
3. Practical use or
applicability
4. Do you think it is feasible to implement the proposed method in a project
portfolio valuation process?
From your experience, have you ever use a project portfolio valuation
yourself? Is it possible to incorporate the proposed method into it?
4. Usefulness 5. Do you think the method is useful in practice? Why?
5. Discussion /Feedback 6. What measures will you suggest to improve the proposed method?
5.1.1 Interview setting
One of the evaluation forms in the design science research methodology is gathering the client
feedback. As qualitative interview is a powerful research tool of gathering data that is used
extensively in IS research (Myers & Newman, 2007), it thus was applied in this research to
gather feedback from the potential users of the proposed method. Furthermore, as the
research is conducted at the R&D (Research & Development) department of BiZZdesign, the
potential user of the proposed method is the BiZZdesign’s consultants who will use the method
to help the customer.
There are three (3) types of qualitative interviews (Myers & Newman, 2007): Structured
interview, Semi-structured interview and Group interview. In the structured interview, a
complete script is prepared beforehand and no room for improvisation. For semi-structured
interview, some questions are prepared beforehand and potentially have an improvisation.
Lastly, in a group interview, a group of people are interviewed at one time with structured or
unstructured way.
In this study, we conducted semi-structured interviews to carry out the evaluation process. It is
the most widely used in the qualitative research in information systems field (Myers &
Newman, 2007). Moreover, we also could have a room for improvisation because although the
scripts of the questions are prepared beforehand, it is possible to dig up information from the
interviewees. The improvisation is situational and depends on the answer or feedback from the
interviewee.
The participant of the interview session is four practitioners in the fields of project portfolio
management and EA. All of the respondents are the consultants from BiZZdesign. Two of them
103
are research consultants and the other two are business consultants. The interview session
were held separately and lasted approximately an hour. It started with 20-30 minutes of
presentation, then interviewed question script and discussion in the remaining 30 minutes.
5.2 Result and analysis
After conducting four interview sessions, the result is reviewed an analyzed in this section. The
transcript of the interview session is given in Appendix 5. A summary of the interview session is
given in table 39.
From the interview sessions, four different aspects are discussed regarding the following
proposed method:
1. Practice of project portfolio valuation
The common practice of project portfolio valuation according to the four interviewees is by
using gut feeling in the basis of their personal belief and experience. Other common practice
is also by comparing the cost and benefit that the companies will get by undertaking the
projects. This practical analysis is documented in a business case document. A business case
summarizes the estimation of the benefit and cost that the company will get after executing
the projects. The cost and benefit method to evaluate the projects is compared in the
financial term like ROI. Another aspect to prioritize the project is also based on the urgency
of the projects. In addition, a political issue also could be taken when a decision maker has a
specific interest in a specific project or program.
2. Benefit of using EA
All of the interviewees argued that it is beneficial to use EA in the project portfolio valuation.
The companies could get more benefit by having higher maturity level of EA. Iacob et al.
(2012) stated that an EA-mature organization is one that uses EA in multiple ways, from IT
decision making to organizational re-alignments and business redesign and transformation.
Four of the interviewees said that by using the architecture, a company could have better
overview of their current state and future / to-be situation. Afterwards, they could analyze
where and how to prioritize the changes or transformation that needs to be done in order to
reach their to-be situation. Furthermore, it could help to analyze the impact of the project
and its dependency as well.
The second benefit is better traceability. For instance; the companies could check the
contribution of the projects to their actual goals and evaluate which projects that fit within
their roadmap. Thirdly, architecture gives a better cost estimation. By using EA, the
companies could be more specific in their choices and put cost calculation in the
architecture.

104
3. Method’s requirement
By looking the answers of question three to five, most of the interviewees stated that the
proposed method is easy to understand, feasible to implement and useful in practice.
However, they mentioned the requirements or the conditions that should be fulfilled in
order to use the method properly. Firstly, it requires the time and the patient of the user to
do all the steps in the method. The companies should spare some time to carry out all the
scoring process. The second requirement is the knowledge. The user should have the
knowledge of project portfolio management, BPMN and Enterprise Architecture or
Archimate. In this requirement, if the user has knowledge of EA, it could be assumed the
architecture that is used as an input to assess the project is correct. Lastly is the
collaboration between project manager and architect. So, the scoring process is more
accurate in the sense of interpreting the architecture model.
From all of the requirements, the interviewees saw the use of the method is more useful in a
bigger organization. The proposed method is more beneficial for a big organization that
needs to manage a huge number of projects.
4. Improvement and feedback
To simplify the method and provide guidance in the decision-making process are the main
feedback from the interviewees as an improvement for the proposed method. The simplistic
approach of the method could be very beneficial for being used in practice. Theoretically, the
interviewees saw the method is thorough enough, but the complexity needs to be reduced
to be more usable. From the discussion, several mentioned possibilities are automate a
certain step by using tools support, make a scoring form in a tools support, and improve the
flexibility in choosing the factors / criteria which will be assessed. By having a simplify
version, the method could be easier to use and less time consuming.
The second improvement is for the last step of the method when prioritizing the projects. A
guidance on interpreting all the four quadrants in the bubble chart for the decision maker. In
the discussion, the interviewees gave input to make a guidance, for instance; to use
MoSCoW (Must do, should do, Could do, Won’t do) method or to analyze the result by
giving suggestion which project needs to be invested, migrated, tolerated or eliminated.
5.3 Summary
The evaluation of the proposed method is presented in this chapter by means of semi-structured
interviews. In general, positive feedback is obtained from the interviewees. The proposed
method is a comprehensive one and supports the subjective decision that usually used in
practice. Moreover, it also provides the stepwise or thorough guideline to be implemented,
including the scoring illustration using the information obtained from EA. However, practically
there are some improvements that could be made regarding the complexity of the method.

105
Table 39 : Interview session summary
Criteria Research Consultant
Interviewee 1
Research Consultant
Interviewee 2
Business Consultant
Interviewee 3
Business Consultant
Interviewee 4
Current Practice
and an EA-based
method
1. Gut Feeling, Cost & Benefit.
2. It’s beneficial: better
overview, traceability, cost
estimation
1. Gut Feeling, Cost & Benefit,
the urgency of the projects
(type of the projects)
2. It’s beneficial : better
overview (organization),
analyzing process (e.g. project
dependency, impact analysis)
1. Gut Feeling, Cost &
Benefit, the urgency of the
projects (type of the
projects)
2. It’s beneficial : gives extra
logical thing to prioritize
projects, feasible to
encapsulate data, give the
overview (current state
organization)
1. Gut Feeling, Cost &
Benefit.
2. It’s beneficial, if they have
high-maturity level of EA
to see the projects that fit
within their roadmap
Ease of
Understanding
3. The idea is easy to
understand.
Steps are too much.
It gives enough guidelines
from the academic
perspective
It needsexpert to be applied
in practice
3. The method is easy to
understand,
More attention to the
motivation of using three
domains (business, IT and
financial)
Interpretation of the quadrant
in the bubble chart
3.Easy to understand,
Elaborate more on the
explanation of business
and IT domain for
people who do not know
that terms
3. It is not easy to
understand.
The user of the method
needs to know about
ArchiMate, BPMN, and
project portfolio
management.
Practical use or
applicability
4. It is feasible to implement
Could be collaborated with
Capability based planning as
a pre-selection of projects
(what should be
implemented first).
4. It is feasible
Need some time to do the
analysis and scoring.
It could be corporated with
artificial intelligence
(scoring by certain
architecture pattern)
4. The simple version of the
method could feasible to use
for the customer.
4. It is feasible
Possible to implement
the method, do not have
seen method to valuate
project
Could support the
subjective decision
Usefulness 5. It is useful in practice as long
as there’s someone has the
patience,
5. It is useful because:
It’s feasible to
implement
5. Useful, because it’s
necessary. EA could be used
as a basis-information of the
5.Useful, if the company have
high-level maturity of EA
It could give overview

106
knowledge and
time
to do the method properly
Three domain are the factors
that most organization look at.
information, which is
occasionally overlooked by an
organization.
what project fit in their
roadmap.
Discussion/feedback 6. Simplistic approach to use in
practice
It could be with the table
Use it in different kind of
cases to see the problem of
the method implementation
6. Guidance of interpreting the
result of ranking (bubble chart)
6. Guidance in decision-
making process (e.g. MoSCow
method)
6. Simplify the method use
(to make easier and less time
consuming)

107
6. Conclusion
This chapter summarizes all findings in the study. Section 6.1 delivers the answer for all
research questions that have been addressed throughout the study. Afterwards, Section 6.2
reviews both contributions of the research; theoretically and practically. Finally, Section 6.3 and
6.4 discuss the limitation and recommendations of the research.
6.1 Answers to Research Questions
As described in Section 1.2, the goal of this research is to get an approach that improves
decision making in the project portfolio valuation using Enterprise Architecture. Therefore, the
main objective we define as means to meet the goal is:
To Develop an EA-based method for project portfolio valuation
Afterwards, three research questions are formulated to achieve the main objective of the study
in a structured way. The following paragraph presents the answer of each research question as
the finding of the research.
RQ1. Which project portfolio valuation techniques can be the basis for the EA-based method?
RQ1.1. What are the existing techniques for project portfolio valuation?
RQ1.2. What are the criteria for choosing the project portfolio valuation technique?
The first research question is answered by conducting literature studies. The various existing
techniques for project portfolio valuation are discussed in Section 2.4. Three different
approaches are used to categorize the valuation techniques; financial approaches, multi-criteria
approaches, and portfolio approaches.
The financial approaches evaluate the project by seeking the return value of the investment in
terms of financial resource. The second approaches give a mechanism to assess the project
from both financial and non-financial consequences which usually cannot easily expressed in
monetary terms. The last approaches are a well-known decision-making tool in the
management literature (Renkema & Berghout, 1997). Portfolio approaches facilitate the
evaluation of all projects in the organization based on several evaluation criteria. Therefore,
four methods in the portfolio approaches are evaluated to choose a basis method. All of them
are assessed based on three criteria: the evaluation criteria using in the method, the ease of
use, and the possibility of using information from architecture. Table 5 (Section 2.4.4) shows
the analysis of the four portfolio methods. Finally, Investment portfolio method (Berghout &
Meertens, 1992) is chosen as the possible basis / reference method with the use of information
economics method (Parker et al., 1988) for measuring business and technology domain.

108
RQ2. How can EA support the project portfolio valuation?
RQ2.1. What is the relationship between EA and portfolio valuation?
RQ2.2. What information could be taken from EA to support project portfolio valuation?
Two approaches are conducted to address the second research question. Firstly, we seek the
relationship between EA and project portfolio valuation. The concept about related fields gives
the background knowledge about the use of EA in project portfolio valuation. Subsequently, we
describe the concrete form of how EA support the project portfolio valuation.
The relationship concept between EA, portfolio valuation and its related fields is discussed in
Section 2.1. From the literature, we found the ideal concept that should be applied by the
organizations is the use of EA as a driver to achieve their goals. Three fields that should align in
an organization are: Strategy, EA and Project Portfolio Management (PPM). In this context, we
put project portfolio valuation in the field of PPM, since project portfolio valuation is part of the
PPM’s process. The alignment of these three fields in the organization will give the most
beneficial situation. EA gives an overview of the organization from various viewpoints. It could
capture the strategy of the organization in terms of modeling the strategic goals, motivation,
requirements and the to-be situation. Project Portfolio Management realizes the strategy into
concrete projects and programs that should be managed effectively. Op’t Land et al., (2009)
use the term “dashboard” for EA which give the relevant aspects of the current and to-be
situation. The use of dashboard in the PPM will provide benefits for the organization. For
instance: if the goal of the organization changed, then EA could capture it and analyze its
impact related to the projects/programs that also need to be changed or even dismissed.
After understanding the background concept of relating fields, the next step is to explore the
information that could be taken from EA to support project portfolio valuation. Table 2 in
Section 2.3.2 shows the list of viewpoints that gives the information to support project portfolio
valuation depending on the concern of the stakeholder. Focus of this study is the valuation or
assessing process in the PPM, which we called as Project Portfolio Valuation. Thus, the
stakeholder, for instance the project management office should choose the viewpoint that
supporting the valuation process. In practice, the project management office should cooperate
with the architect to interpret the architecture view.
RQ3. How to design an EA-based method for project portfolio valuation?
An EA-based Investment Portfolio method was designed to answer this question. Chapter 3
describes all the domain, factor and step by step procedure as a guidance to apply the
proposed method. The proposed method is designed by studying the characteristic of the
reference method (Investment Portfolio and Information Economics method) combined with
the specification of Enterprise Architecture. A thorough process or step by step that shows

109
what the data input is and what the supposed output should be is also provided to make the
method feasible to use in practice.
In order to validate the proposed method, two activities are carried out. Firstly, we applied EA-
based Investment Portfolio method in the ArchiPharma case study in Chapter 4. By applying in a
case, we could review the feasibility of the method, the assumption that should be made
accordingly and the data required to evaluate the projects in the organization. Secondly,
interview sessions are conducted with the experts and practitioners (Table 39), which is
elaborated in Chapter 5.
Borrowing the conclusion of Information Economic method (Parker et al., 1988), EA based
Investment Portfolio method also helps develop the consensus and enhance each group’s
awareness of the others’ concerns and evaluations. With the use of EA, the management,
specifically the project manager, should collaborate with the architect during the evaluation
process to make a more precise justification to decide the score. Finally, EA-based Investment
portfolio method is proposed to support the decision making process by giving
recommendation from the list of prioritized projects.
6.2 Research Contribution
The study contributes to the area of Project Portfolio Management and Enterprise Architecture
theoretically and practically. Theoretically, the thesis provides a method of combining EA in the
process of project valuation. In Chapter 3, EA-based Investment Portfolio has a thorough
guideline in its steps. It adds more knowledge on EA-based method for project portfolio
valuation that is still lacking in a number of research work and practices. Furthermore, the
proposed method also providing the illustration of scoring process based on EA.
Practically, two points are indicated from the research. Firstly, it reveals the importance of
collaboration between EA and PPM fields that could give a higher benefit for an organization.
Theoretically, this is not a new concept, but practically not many organizations are aware of it.
By giving the argument from relevant literature and taking into account the solution of the
study, the practitioner could improve their ways of working to eventually achieve the goals.
Secondly, it provides a solution for the organization in terms of giving an advice of the
prioritized projects. Most of organizations, especially the big ones, feel difficult to decide the
projects that will give the most value added to the organization with thorough consideration.
The method makes the decision making process less-subjective, while still facilitates the
manager to use their opinion. This also could be seen as an initial research on practical EA-

110
based method for project portfolio valuation. The solution could be adapted by BiZZdesign’s
consultant to help their customers accordingly.
6.3 Research Limitations
Several limitations are identified as follows:
1. The process of project valuation is based on Investment Portfolio method. The selection of
the reference method is based on the evaluation criteria (Table 6) and also considering the
research focus of the BiZZdesign. Thus, the proposed method seems to be complex, yet
comprehensive.
2. In the demonstration phase (Chapter 4), the proposed method is implemented in a case
study (Archipharma case). Some of the input data regarding the case is based on
assumption because the limited information. It is sufficient to prove the efficacy of the
proposed method, however using real requirement’s information could bring more clarity.
3. Due to time limitation, we conducted the interview only with the practitioner from
BiZZdesign. However, we see this is adequate for this study, because both the research and
business consultants also have experience of working with several customers from
different industry sector.
6.4 Recommendations for Future Research
With regard to the finding of the research and evaluation process, four points are highlighted in
this section for future research. First recommendation is to test the method in several real case-
studies to improve the practical guidance. With the time limitation of carrying this research, the
demonstration of the proposed method is only restricted in one anonymous case-study.
Although it is sufficient to show the feasibility of the method, other aspects such as: the
condition of justified decision and the problems that might occur in a specific situation could be
further improved. In addition, a simple version of the method also could be developed.
Secondly, further research to develop the simple version of the method would improve the
applicability of the method. The simplification could be in the form of grouping some factors in
business and technology domain. Furthermore, both of the process of choosing the factors and
scoring process can be automated.
The last two recommendations are associated with the possibility of collaboration between EA-
based Investment Portfolio method and other method to improve its efficacy. Firstly, the
proposed method could corporate EA-based Investment Portfolio method with Capability-
Based Planning method (Anastasios, 2014; The Technical Cooperation Program (TTCP), 2004).

111
The chosen project from the output of CBP method could be used as a ‘pre-selection’ project,
since it should be implemented first. Lastly, if the method has already been used widely, the
possibility of further development by including artificial intelligence (Chan et al., 2002;
Mouzoune, 2012) to generate an automatic scoring process based on a certain pattern of the
architecture.

112
References
Aldea, A., Iacob, M., Van Hillegersberg, J., Quartel, D., Franken, H., & Bodenstaff, L. (2015). Modelling strategy with ArchiMate. Accepted for Publication in the Proceedings of the 30th ACM/SIGAPP Symposium on Applied Computing (SAC).
Anastasios, P. (2014). Capability-based planning with TOGAF ® and ArchiMate ®.
Andresen, J. L. J. (2001). A Framework for Selecting an IT Evaluation Method - in the Context of Construction. Danmarks Tekniske University Phd Thesis. Danmarks Tekniske University. Retrieved from http://www.aquasoft.dk/upload/institutter/byg/publications/rapporter/byg-r012.pdf
Archer, N. ., & Ghasemzadeh, F. (1999). An integrated framework for project portfolio selection. International Journal of Project Management, 17(4), 207–216. doi:10.1016/S0263-7863(98)00032-5
Bjekovic, M., Band, I., Kroese, R., & Else, S. (2014). ArchiMetal Case Study. The Open Group.
Blekas, G. (2007). Corporate Financial Management Evaluating Investment(s): Net Present Value (NPV), Internal Rate of Return (IRR), Risk, Real Options, Capital Rationing, Financing Decision.
Bodenstaff, L., Quartel, D., & Lankhorst, M. (2014). From Strategy to Successful Implementation with Enterprise Portfolio Management.
Chan, M., Wong, C., Tse, W. F., Cheung, B. K., & Tang, G. Y. (2002). Artificial Intelligence in Portfolio Management. In H. Yin, N. Allison, R. Freeman, J. Keane, & S. Hubbard (Eds.), Intelligent Data Engineering and Automated Learning (pp. 403–409). Springer-Verlag Berlin Heidelberg.
Crundwell, F. K. (2008). Finance for Engineers. doi:10.1007/978-1-84800-033-9
Deng, H. P., & Wibowo, S. (2008). A rule-based decision support system for evaluating and selecting IS projects. Imecs 2008: International Multiconference of Engineers and Computer Scientists, Vols I and Ii, II, 1962–1968. Retrieved from <Go to ISI>://WOS:000256665701179
Gartner. (2013). Gartner IT Glossary. Retrieved March 3, 2015, from http://www.gartner.com/it-glossary/portfolio-management
Gronlund, A. (2000). Managing Electronic Services A public sector perspective. Springer Verlag.

113
Handler, R., & Maizlish, B. (2005). IT Portfolio Management Step-By-Step. Hoboken: John Wiley & Sons, Inc. Retrieved from http://scholar.google.com/scholar?hl=en&btnG=Search&q=intitle:Portfolio+Management+Step-by-Step#7
Harrison, W., Raffo, D., Settle, J., & Eickelmann, N. (1999). Adapting Financial Measures: Making a Business Case for Software Process Improvement. Software Quality Journal, 8(3), 211–231.
Harvard Business Review Press. (2010). Developing a business case expert solution to everyday challenges.
Hevner, a. R., March, S. T., & Park, J. (2004). Design Science in Information Systems Research. MIS Quarterly, 28(1), 75–105. doi:10.2307/25148625
Iacob, M.-E., & Jonkers, H. (2006). Quantitative Analysis of Enterprise Architectures. Interoperability of Enterprise Software and Applications, 239–252. doi:10.1007/1-84628-152-0_22
Iacob, M.-E., Jonkers, H., Quartel, D., Franken, H., & van den Berg, H. (2012). Delivering Enterprise Architecture with TOGAF and ArchiMate. BiZZdesign Academy.
Iacob, M.-E., Quartel, D., & Jonkers, H. (2012). Capturing business strategy and value in enterprise architecture to support portfolio valuation. 2012 IEEE 16th International Enterprise Distributed Object Computing Conference, EDOC 2012, 11–20. doi:10.1109/EDOC.2012.12
Irani, Z., & Love, P. E. D. (2002). Developing a frame of reference for ex-ante IT/IS investment evaluation. European Journal of Information System, 11, 74–82.
Jensen, C. T., Cline, O., & Owen, M. (2011). Combining Business Process Management and Enterprise Architecture for Better Business Outcomes. Ibm.Com/Redbooks.
Jonkers, H., Quartel, D., van Gils, B., & Franken, H. (2012). Enterprise Architecture with TOGAF 9.1 and ArchiMate 2.0.
Jonkers, H., van den Berg, H., Iacob, M.-E., & Quartel, D. (2010). Archimate Extension for Modeling the TOGAF Implementation and Migration Phases. White Paper Pubished by The Open Group.
Kleersnijder, B., & Berghout, E. (2012). Portfolio Management in Non-Profit Organizations : The Case of Groningen ’ s Municipality, (March).
Lankhorst, M. (2005). Enterprise Architecture at Work; Modelling, Communication, and Analysis.
114
Miranda, E. (2011). Time boxing planning: Buffered MOSCOW rules. ACM SIGSOFT Software Engineering Notes, 36(6), 1. doi:10.1145/2047414.2047428
Mo A. Mahmood, E. J. S. (1999). Measuring Information Technology Investment Payoff: Contemporary Approach. Idea Group Publishing. doi:10.4018/978-1-878289-42-1
Mouzoune, A. (2012). Contribution to Enterprise Intelligent Systems Architecture: Assumptions, Expectations and a Proposal. Intelligent Information Management, 04(06), 311–318. doi:10.4236/iim.2012.46035
Mutschler, B. (2008). Modeling and simulating causal dependencies on process-aware information systems from a cost perspective. doi:10.3990/1.9789036525787
Myers, M. D., & Newman, M. (2007). The qualitative interview in IS research: Examining the craft. Information and Organization, 17(1), 2–26. doi:10.1016/j.infoandorg.2006.11.001
Op’t Land, M., Proper, E., Waage, M., Cloo, J., & Steghuis, C. (2009). Enterprise Architecture Creating Value by Informed Governance. Springer-Verlag Berlin Heidelberg. doi:10.1007/978-3-540-85232-2 Library
Parker, M. M., Benson, R. J., & Trainor, H. . (1988). Information Economics Linking Business Performance to Information Technology. Prentice-Hall, Inc.
Peffers, K., Tuunanen, T., Rothenberger, M. a., & Chatterjee, S. (2008). A Design Science Research Methodology for Information Systems Research. Journal of Management Information Systems, 24(3), 45–77. doi:10.2753/MIS0742-1222240302
Porter, M. E. (1985). Competitive strategy: Techniques for analyzing industries and competitors. New York.
Porter, M. E. (1998). Competitive advantage : creating and sustaining superior performance ; with a new introduction. Free Press.
Porter, M. E. (2008). The five competitive forces that shape strategy. Harvard Business Review. doi:10.1111/j.0955-6419.2005.00347.x
Project Management Institute. (2006). The Standard for Portfolio Management.
Quartel, D., Steen, M. W. A., & Lankhorst, M. (2010). IT portfolio valuation: Using enterprise architecture and business requirements modeling. 14th IEEE International Enterprise Distributed Object Computing Conference. doi:10.1109/EDOC.2010.24
Rajegopal, S., McGuin, P., & Waller, J. (2007). Project Portfolio Management leading the corporate vision.

115
Renkema, T. J. W., & Berghout, E. W. (1997). Methodologies for information systems investment evaluation at the proposal stage: a comparative review. Information and Software Technology, 39(1), 1–13.
Ring, S. J., Lamar, B., Heim, J., & Goyette, E. (2005). Integrated Architecture-Based Portfolio Investment Strategies Integrated Architecture-Based Portfolio Investment Strategies. Assessment, 1–16.
Roditi, A. (2014). Quantifying the contribution of enterprise architecture to business goals.
Schniederjans, M. J., Hamaker, J. L., & Schniederjans, A. M. (2004). Information technology investment decision-making methodology. World scientific publishing. doi:10.1016/S0143-974X(98)80047-3
Spann, R. (2008). Making Investment Decisions with the Net Present Value Rule, 1–3.
Stapleton, J. (2003). DSDM Business Focused Development, 2nd ed. London: Addison Wesley.
Stoneburner, G., Goguen, A., & Alexis, F. (2002). Risk Management Guide for Information Technology Systems. Recommendations of the National Institute of Standards and Technology. NIST Special Publication, (July).
The Open Group. (2011). TOGAF version 9.1. Van Haren Publishing. Retrieved from http://pubs.opengroup.org/architecture/togaf9-doc/arch
The Open Group. (2012). ArchiMate 2.1 Specification. Van Haren Publishing. Van Haren Publishing. Retrieved from http://pubs.opengroup.org/architecture/archimate2-doc/
The Technical Cooperation Program (TTCP). (2004). TTCP technical report: Guide to Capability-Based Planning, 1–15.
Urbaczewski, L., & Mrdalj, S. (2006). A comparison of enterprise architecture frameworks. Issues in Information Systems, 7(2), 18–23. doi:10.1227/01.neu.0000410082.42657.aa
Walter, S. G., & Spitta, T. (2004). Approaches to the Ex-ante Evaluation of Investments into Information Systems. Wirtschaftsinformatik, 46, 171–180. doi:10.1007/BF03250934
Ward, J., Daniel, E., & Peppard, J. (2007). Building Better Business Cases for IT Investments, (September).
Willcocks, L. (2013). Information management: the evaluation of information systems investments. Springer.

116
Yin, R. K. (2009). Case Study Research Design and Methods Fourth Edition. Applied Social Research Methods Series (Vol. 5). Retrieved from http://cemusstudent.se/wp-content/uploads/2012/02/YIN_K_ROBERT-1.pdf\nISBN 978-1-412296099-1
Zelazny, G. (2001). Say It With Charts: The Executive’s Guide to Visual Communication. McGraw-Hill. Retrieved from http://www.amazon.com/Say-With-Charts-Executives-Communication/dp/007136997X

117
Appendix 1 Information Economic’s Business Domain (Assessment)
1.1 Strategic Match worksheet
1.2 Competitive Advantage worksheet
1.3 Management Information support worksheet
SCORE (0-5) 0. The project has NO direct or indirect relationship to the achievement of stated corporate (or
departmental) strategic goals. 1. The project has no direct or indirect relationship to such goals, but will achieve improved operational
efficiencies 2. The project has no direct relationship to such goals, but the project is prerequisite system (precursor)
to another system that achieves a portion of a corporate strategic goal. 3. The project has no direct relationship to such goals, but the project is a prerequisite system (precursor)
to another system that achieves a corporate strategic goal. 4. The project directly achieves a portion of a stated corporate strategic goal . 5. The project directly achieves a stated corporate strategic goal.
SCORE (0-5) 0. The project does not create data access or interchange between this enterprise and its customers,
suppliers, and collaborative unit. 1. The project does not create data access or interchange, per above, but does improve the competitive
position of the enterprise by improving operating efficiencies that beat on competitive performance. 2. The project does not create data access or interchange, per above, but does improve the competitive
position of the enterprise by improving operating efficiencies in a key strategic area. 3. The project provides some degree of outside access or data exchange and moderately improves the
competitive position of the enterprise. 4. The project provides a moderate degree of outside access or data exchange and substantially improves
the competitive position of the enterprise by providing a level of service beyond most competitors. 5. The project provides a high degree of outside access or data exchange and greatly improves the
competitive position of the enterprise by providing a level of service unmatched by competitors.
SCORE (0-5) 0. The project is unrelated to management information support of core activities (MISCA). 1. The project is unrelated to MISCA, but does provide some data on function that bear support core
activities. 2. The project is unrelated to MISCA, but does provide information on function that directly support core
activities. 3. The project is unrelated to MISCA, but provides essential information on functions identified as core
activities. Such information is operational in character. 4. The project is essential to providing MISCA in the future. 5. The project is essential to providing MISCA in a current period.

118
1.4 Competitive Response worksheet
1.5 Project or organizational risk worksheet
SCORE (0-5) 0. The project can be postpone for at least twelve months without affecting competitive position, or
existing systems and procedures can produce substantially the same result and will not affect competitive position.
1. The postponement of the project does not affect competitive position, and minimal labor costs are expected to be incurred to produce substantially the same result.
2. The postponement of the project does not affect competitive position; however, labor cost may escalate to produce substantially the same result.
3. If the project is postponed, the enterprise remains capable of responding to the needed change without affecting its competitive position; lacking the new system, the enterprise is not substantially hindered in its ability to respond rapidly and effectively to change in the competitive environment.
4. The postponement of the project may result in further competitive disadvantage to the enterprise; or in a loss of competitive opportunity; or existing successful activities in the enterprise may be curtailed because of the lack of the proposed system.
5. The postponement of the project will result in further competitive disadvantage to the enterprise; or in a loss of competitive opportunity; or existing successful activities in the enterprise must be curtailed because of the lack of the proposed system.
SCORE (0-5) 0. The business domain organization has a well-formulated plan for implementing the proposed system.
Management is in place, and processes and procedures are documented. Contingency plans exist for the project, there is a project champion, and the product or competitive value added is well defined for a well-understood market.
1 through 4. Values for 1-4 may be adopted for situations that blend elements of preparedness with element of risk. The following checklist can be used for this purpose.
Yes No Not Known
Well-formulated business domain plan
Business domain management in place
Contingency plans in place
Processes and procedures in place
Training for users planned
Management champion exists
Product is well defined
Well-understood market need
For each “no” or “not known” 0.5 point may be added. 5. The business domain organization has no plan for implementing the proposed system. Management is uncertain
about responsibility. Processes and procedures have not been documented. No contingency plan is in place. There is no defined champion for the initiative. The product or competitive value added is not well defined. There is no well-understood market.
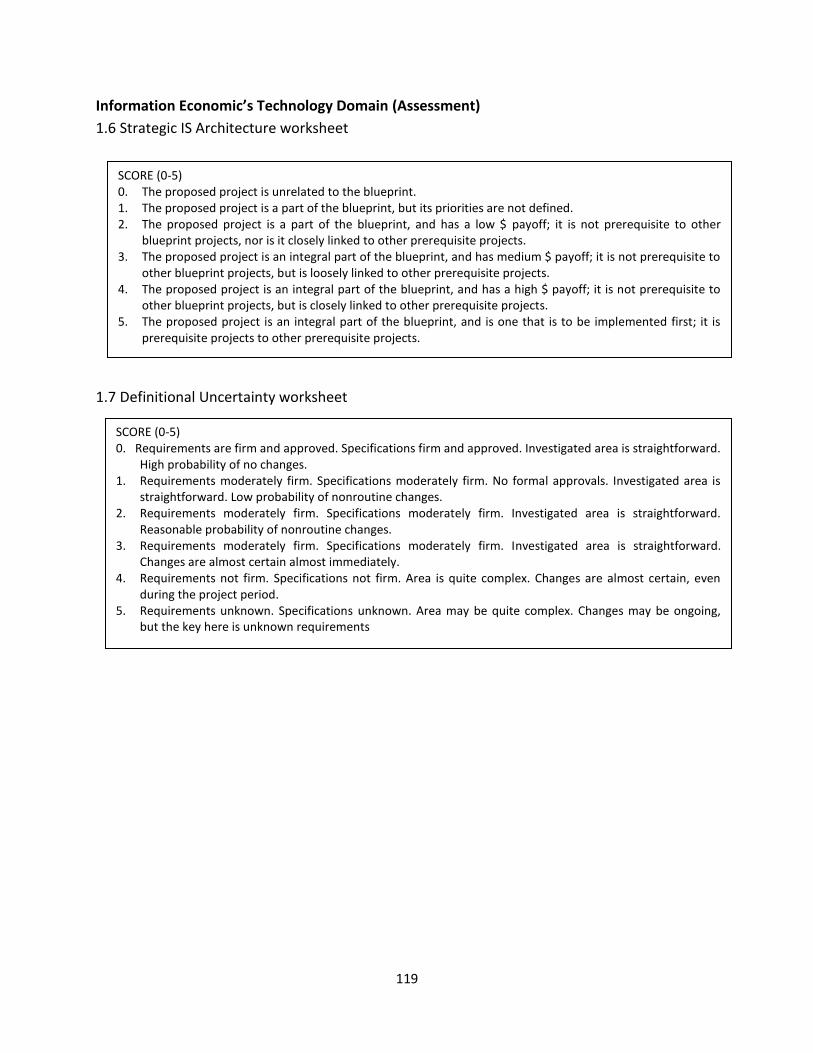
119
Information Economic’s Technology Domain (Assessment)
1.6 Strategic IS Architecture worksheet
1.7 Definitional Uncertainty worksheet
SCORE (0-5) 0. The proposed project is unrelated to the blueprint. 1. The proposed project is a part of the blueprint, but its priorities are not defined. 2. The proposed project is a part of the blueprint, and has a low $ payoff; it is not prerequisite to other
blueprint projects, nor is it closely linked to other prerequisite projects. 3. The proposed project is an integral part of the blueprint, and has medium $ payoff; it is not prerequisite to
other blueprint projects, but is loosely linked to other prerequisite projects. 4. The proposed project is an integral part of the blueprint, and has a high $ payoff; it is not prerequisite to
other blueprint projects, but is closely linked to other prerequisite projects. 5. The proposed project is an integral part of the blueprint, and is one that is to be implemented first; it is
prerequisite projects to other prerequisite projects.
SCORE (0-5) 0. Requirements are firm and approved. Specifications firm and approved. Investigated area is straightforward.
High probability of no changes. 1. Requirements moderately firm. Specifications moderately firm. No formal approvals. Investigated area is
straightforward. Low probability of nonroutine changes. 2. Requirements moderately firm. Specifications moderately firm. Investigated area is straightforward.
Reasonable probability of nonroutine changes. 3. Requirements moderately firm. Specifications moderately firm. Investigated area is straightforward.
Changes are almost certain almost immediately. 4. Requirements not firm. Specifications not firm. Area is quite complex. Changes are almost certain, even
during the project period. 5. Requirements unknown. Specifications unknown. Area may be quite complex. Changes may be ongoing,
but the key here is unknown requirements

120
1.8 Technical Uncertainty worksheet
SCORE (0-5)
A. Skills required are available in the technology domain
B. Dependency on specific hardware not now available
C. Dependency on software capabilities not now available
D. Dependency on application software development
Total (A+B+C+D)/4 = Rating: A. Skills required
0. No new skills for staff, management. Both have experience. 1. Some new skills for staff, none for management. 2. Some new skills required for staff and management. 3. Some new skills required for staff, extensive for management. 4. Extensive (new) skills required for staff, some for management. 5. Extensive (new) skills required for staff, and management.
B. Hardware dependencies 0. Hardware is in use in similar application. 1. Hardware is in use, but this is a different application. 2. Hardware exists, and has been tested, but not operationally. 3. Hardware exists, but not utilized yet within organization. 4. Some key features are not tested or implemented. 5. Key requirements are not now available in MIS configuration.
C. Software dependencies (other than application software) 0. Standard software, or straight-forward or no programming required. 1. Standard software is used, but complex programming is required. 2. Some new interfaces between software are required and complex programming may be required. 3. Some new features are required in operating software, and complexintefaces between software may
be required. 4. Features not now supported are needed, and moderate advance in local state of the art is required. 5. Significant advance in state of the art is required
D. Application Software 0. Programs exist with minimal modification required. 1. Programs are available commercially with minimal modifications or programs available in-house with
moderate modifications, or software will be developed in-house with minimal complexity. 2. Programs are available commercially with moderate modifications, or in-house programs are available
but modifications are extensive, or software will be developed in-house with minimal design complexity but moderate programming complexity.
3. Software is available commercially but the complexity is high, or software will be developed in-house and the difficulty is moderate.
4. No package or current in-house Software exists. Complexity design and programming are required, with moderate difficulty.
5. No package or current in-house Software exists. Complexity design and programming is required, even if contracted outside.

121
1.9 IS infrastructure Risk worksheet
SCORE (0-5) 0. The system use existing services and facilities. No investment in IS prerequisite facilities (e.g., database
management) is required; no up-front costs not directly a part of the project itself are anticipated. 1. Change in one element of the computer service delivery system is required for this project. The
associated up-front investment other than direct project costs is relatively small. 2. Small change in several elements of the computer service delivery system are required. Some up-front
investment is necessary to accommodate this project. Some later investment for subsequent integration of this project into the mainstream of the IS environment may be necessary.
3. Moderate changes in several elements of the computer service delivery system are required. Some up-front investment is necessary to accommodate this project; some later investment for subsequent integration of this project into the mainstream of the IS environment will be necessary.
4. A moderate change in elements of the computer service delivery is required, in multiple areas. Moderate to high up-front investment in staff, software, hardware, and management is necessary to accommodate the project. This investment is not include in the direct project cost, but represents IS facilities investment to create the needed environment will be necessary for the project.
5. Substantial change in elements of the computer service delivery is required, in multiple areas. Considerable up-front investment in staff, software, hardware, and management is necessary to accommodate the project. This investment is not include in the direct project cost, but represents IS facilities investment to create the needed environment for the project.

122
Appendix 2
Corporate Values
2.1 Investment Quadrant
DOMAIN LIKELY VALUE RESULTING WEIGHT
BUSINESS DOMAIN 1. Strategic Match 2. Competitive Advantage 3. Management Information 4. Competitive Response 5. Organizational Risk
TECHNOLOGY DOMAIN 1. Definitional Uncertainty 2. Technical Uncertainty 3. Strategic IS Architecture 4. IS Infrastructure Risk
Low Low
Medium Highest Medium
Medium Medium
High Low
Total Value Total Risk and Uncertainty
0 0 2 8 -2
-4 -4 8 0
18 -10
2.2 Strategic Quadrant
DOMAIN LIKELY VALUE RESULTING WEIGHT
BUSINESS DOMAIN 6. Strategic Match 7. Competitive Advantage 8. Management Information 9. Competitive Response 10. Organizational Risk
TECHNOLOGY DOMAIN 5. Definitional Uncertainty 6. Technical Uncertainty 7. Strategic IS Architecture 8. IS Infrastructure Risk
High
Highest Medium
High Low
Medium
Low Low Low
Total Value Total Risk and Uncertainty
4 6 2 4 -1
-2 -1 1 1
18 -4

123
2.3 Infrastructure Quadrant
DOMAIN LIKELY VALUE RESULTING WEIGHT
BUSINESS DOMAIN 1. Strategic Match 2. Competitive Advantage 3. Management Information 4. Competitive Response 5. Organizational Risk
TECHNOLOGY DOMAIN 1. Definitional Uncertainty 2. Technical Uncertainty 3. Strategic IS Architecture 4. IS Infrastructure Risk
High Low High
Medium High
High
Medium Highest
Low Total Value Total Risk and Uncertainty
4 0 4 2 -4
-4 -2 8 0
18 -10
2.3 Breakthrough Quadrant
DOMAIN LIKELY VALUE RESULTING WEIGHT
BUSINESS DOMAIN 1. Strategic Match 2. Competitive Advantage 3. Management Information 4. Competitive Response 5. Organizational Risk
TECHNOLOGY DOMAIN 1. Definitional Uncertainty 2. Technical Uncertainty 3. Strategic IS Architecture 4. IS Infrastructure Risk
Highest
Low High Low High
Medium Medium Highest Medium
Total Value Total Risk and Uncertainty
6 0 4 0 -4
-2 -2 6 -2 16 -10

124
Appendix 3
Archiparma strategic value project’s script
////////////////////////////////////////////////////////////////////////////////////////// //strategicValueProject calculates for each program/project its strategic value. // This value is determined by the goals it (indirectly) realizes. // // Paths taken into account are any paths where (composed) projects/programs // realize goals/requirements directly or through realizing // plateaus/deliverables/capabilities. // Goals/requirements can realize/influence other goals/requirements // // Cycles are not allowed // // More than one path can connect project and goal. All paths are taken // into account and strategic values are summed up. // ////////////////////////////////////////////////////////////////////////////////////////// functionstrategicValueProject() { forall "ArchiMate:IMWorkpackage" object in modelpackage { currentPath = List(); amount = calculateAssignedValue( object, currentPath, 1 ); if ( ! ( amount == undefined ) ) { result = Structure(); result.add("object", object); result.add("value", amount); output result; } } return undefined; } functioncalculateAssignedValue( concept, currentPath, part ) { // first check whether there is a loop if ( currentPath.contains(concept) ) { error "Cycle found while performing analysis." , concept; stop; } percentage = part; amount = 0; // if the concept is a motivational element for which priority is greater than 0, // then calculate percentage * total cost

125
if ( concept is "ArchiMate:MotivationElement" && ( concept.attrValue("priority") > 0 ) ) { amountTotal = concept.attrValue( "priority" ); amount = amount + amountTotal * percentage; } else { // check whether the concept gets amount assigned from above outgoingRels = outgoingRels( concept ); if ( !outgoingRels.empty() ) { forallrel in outgoingRels { newPercent = percentage; if ( !( rel is "ArchiMate:CompositionRelation" ) ) { // if this is not a composition relation then calculate the new strength/percentage. percent = rel.attrValue( "infStrength" ); // strength of the influence is current percentage times the strength on the relation newPercent = newPercent * percent; } theOtherEnd = rel.relatedTo( concept ); if ( concept is "ArchiMate:IMWorkpackage" || // check whether the related concept "fits" in the predefined allowed paths: it has to be a goal, principle, requirement(, capability), plateau, or workpackage concept is "ArchiMate:MotivationRequirement" || concept is "ArchiMate:MotivationGoal" || concept is "ArchiMate:MotivationPrinciple" || concept is "ArchiMate:IMPlateau" /**|| concept is "ArchiMate:RCCapability"**/) { currentPath.add(concept); subtotal = calculateAssignedValue( theOtherEnd, currentPath, newPercent ); } amount = amount + subtotal; } } } return amount; }

126
Appendix 4
Archiparma Risk Analysis
No Project Name Risk Risk impact Risk probability
1 Align marketing processes high major moderate
2 Analyze billing process variance very low minor rare
3 Analyze current marketing processes high moderate moderate
4 Analyze current product portfolio very low insignificant rare
5 Analyze data sources high extreme unlikely
6 Analyze heterogeneous data sources medium extreme rare
7 Analyze heterogeneous information sources medium minor likely
8 Choose, configure, test and install APM applications high extreme moderate
9 Choose, develop and install enterprise-wide PPM software high extreme unlikely
10 Choose, develop, test and run global financial application medium moderate unlikely
11 Consistent data model development high minor very likely
12 Consolidate marketing applications high moderate very likely
13 Data cleaning high moderate very likely
14 Data mapping high moderate very likely
15 Define valuation model very low insignificant rare
16 Design and populate application portfolios high moderate moderate
17 Design data architecture medium extreme rare
18 Design enterprise-wide APM process medium extreme rare
19 Develop application rationalization roadmap high moderate likely
20 Develop database authentication protocols very high major very likely
21 Develop integrated reporting very low insignificant unlikely
22 Develop real-time portfolio monitoring low insignificant likely
23 Develop real-time portfolio reporting high moderate likely
24 Expand customer channels with internet high extreme moderate
25 Harmonize local PPM approaches very low minor rare
26 Harmonize ordering process high moderate moderate
27 Harmonize process variants high moderate very likely
28 Identify obsolete applications medium major unlikely
29 Identify products for termination, migration and consolidation
high moderate moderate
30 Information cleaning very high extreme very likely
31 Information harmonization high extreme moderate
32 Information mapping medium minor likely
33 Install application lifecycle management approach high moderate likely
34 Install database authentication high moderate moderate
35 Install enterprise-wide PPM approach high major likely
36 Install federated database management system (FDMS) medium moderate unlikely

127
37 Install necessary applications for monitoring competitors medium extreme rare
38 Install process for monitoring competitors medium minor moderate
39 Integrate marketing processes high extreme unlikely
40 Inventory all PPM processes high moderate moderate
41 Inventory applications high major likely
42 Migrate and eliminate identified applications medium minor likely
43 Phase out Amsteram billing applications high extreme unlikely
44 Phase out London billing applications medium moderate unlikely
45 Phase out New York billing applications low insignificant likely
46 Prepare and adapt databases low major rare
47 Publish database information very low minor rare
48 Rationalize product portfolio medium minor likely
49 Redesign portfolio into limited set of highly configurable products
high moderate moderate
50 Valuate applications very high extreme likely

128
Appendix 5
Interview’s Transcript
Interview Session I
Interview role : Bizzdesign’s Research Consultant
Interview date : Thursday, 09/07/2015 (11:00-12:00)
1. What are the methods do you think is often used in practice to prioritize the projects?
People have their own objectives and might prioritize more organically, in the sense that they have a gut
insting that this project needs to be done. I think a lot of research is lacking on how to objectively prioritize. It is
also about goals, how to objectively prioritize goals not only for project.
It is done by trade-off, in the sense that benefit that you expect get from it, compare with cost that you have.
Technically company have budget. If project is part of department, then department has specific budget. For
example you now you have 10 thousand euro, so you need to get as much estimated value out of it, for that
money. So, you will implement project that fit within that.
I don’t know if there’s prioritization. But, Budget is the important aspect that people consider when they select
a project. The one that fit with the budget and deliver the most value in the end. At least these are from what I
read, although I’m not an expert on prioritizing project.
2. What do you think about the use of architecture to prioritize the projects ? Do you think it’s beneficial ?
I think it’s highly beneficial. Because you can see exactly what you will invest money in, you know exactly what
the impact you will have. You can do the traceability of the project to the actual goals, to see the projects are
actually realize the goals that you think.
Usually when you make project proposal, you also make a business case. In most cases you need to say what is
contributing to goals that need to achieve. But, sometimes it might not be correct what they propose in the
business case. Because they think it contributes something, but it might not really. So, by using architecture
you can actually see, that one project actually contributes to realize specific goals. And you can be sure of it.
You know exactly what change need to be done. So, you can get better overview and traceability from using
architecture. And better Cost estimation, I would say as well. Because you know exactly what is to invest
money in to change. So those will be the main three I would say: cost, overview and traceability.
3. Is the method is easy to understand? Is there any step need to elaborate more?
The idea of the method is easy to understand. There are a lot of steps, but it is also to be expected. In any case,
there are two different ways, you either develop something for university project which this is or you develop
something that will be used by companies. If you want do something for the companies, the complexity needs
to be reduce, needs to be more usable. But, from the university point of view, I would say this is a method that
thorough enough, have enough information and enough guidelines for people to be able use.
So, it is easy to understand, but depend on who is looking at it. From practitioners point of view, it might be too
complicated to follow all the steps. But from your explanation, the steps do not really per se need more
elaboration. It was easy to understand, only the name of the factor from the domain, but with explanation it
was fine.
4. Do you think it is feasible to implement the method in the valuation process? From your experience, have
you ever use a project portfolio yourself, is this method could be incorporated with it ?
I think it is feasible to implement it. It could be incorporated with Capability Based Planning method, which
also doing by another student in the BiZZdesign. The idea that you have goals, and you have capability to

129
realize those goals. Capability is specified with architecture. Capability is abstraction of architecture. It says
what you can do, but not specifically how. It’s the same idea with application, but you did not say which
application. Then technically, without looking the architecture, project realize the capability.
So, at the moment, the idea is about dependency, you have main capability and several capabilities that
depend on the main one. Because you made capability based planning and road map, the question of when
each capability will be done is depend on the each project that will be done. So, the idea the dependency its like
a tree, start somewhere and having a branch. The idea if you invest the capability that further away, it means
that you kind of realize what is the need of other capability and so on. By having this reasoning, you need to do
the capability at the edge and works away towards the middle that also could help of at least making pre-
selection of the project. You start choosing the project that responsible for the capabilities that is further away
and then walks away toward the inside. You make the basis with the one in the outside, and the one in the
inside can get benefit from it. So, some sort out dependency idea for that. If we actually manage the link of
these, it will be very useful for both parts. It will be useful for Capability based planning and also useful for you
because you can have pre-selection of the projects should implement first.
5. Do you think the method is useful in practice?why?
I think the method is useful in practice as long as someone has the patient and the time to do it properly and
the knowledge. Because I think in order to do this, because the example is quite a simple example, and I think
organization usually has more complex architecture than that. So, someone really need put quite some time
and you need to assume that the architecture is correct. So, you need to make sure that the architect did a
good job and program manager also, I guess this is the person that responsible. He knows how to interpret the
architecture, and takes the time to do it.
I would say also collaboration with an architect that should be done to get the most benefit. But definitely the
time and the patient to do the step by step not skip anything. It should have benefit but with high investment in
time to do this properly. So, for smaller organization it might not be that useful. I think it more useful if you
have a lot of projects, and you do not really know how to make a choice. It will worth it in a bigger organization
and you have way more choices with still limited resources. For example if you have 500 projects you don’t
know exactly to see which project fit where and which one have the most contribution to an organization. So,
for the bigger organization is more useful than for the smaller one. Because in the smaller organization you do
not have the time and the people to do this. Maybe also do not have the program manager and even do not
have the architecture.
6. What do you think should become the improvement of the method?
For practice maybe more simplistic approach to do it. Some sort of way to simplify; to make a table that can be
filled in easier, just abstract from all these steps and try to make it easier. In a sense maybe, for all the business
things that you group it in one thing and a bit abstract from the steps itself. I do not know how to explain it. For
example is Balance score Card, that they have four perspectives into one table. And other approaches and
combine things into one table. You do not need to do the four steps, since the step is similar except you need to
do in a specific thing, like one step you need to see business layer, and for the other you need to look at
function. So it is different in what you need to look at, but what you need to fill in should be the same. In any
case some sort of simplification of this method could be very beneficial for being used in practice.
From my experience with Capability based planning method, the improvement also could come up when you
talk with someone in the company. Because we see it would be ideal, but in reality could be that they do not
have the information or this is not realistic to score like this. In any case a simplification and testing the method
in a real case, these are the improvement I could see. You also need to use it a few times, to become an expert

130
on it, to make more justified decision in different situation.
Interview Session II
Interview role : Bizzdesign’s Research Consultant
Time : Friday, 10/07/2015
1. What are the methods do you think is often used in practice to prioritize the projects?
I think Business case document is often used. That is the only one I can think of at the moment what is really use in practice. People are asked to define a business case and I think you can find multiple templates for business cases. Based on the business case the decision is made. I think only few organization will also use a business case later on to monitor the project and evaluate it at certain moment. For other method, I expect somehow that’s the method people simply prioritize based upon what they think or what they feel. Personal opinion is the beliefs of the officer also a factor on the prioritization and selection of the projects. Depend on the organization or decision maker. I think usually you will have around information is gathered. People are asked to define business cases or proposal and notify them. Business case are project proposal that will be analyzed and then decision will be made, but I think it could be an objective decision based upon objective but also subjective element will play role. I mean, the personal belief will also play role. So even you have a nice method, I think such a method should always give a room for this subjective. In your method, you come up with a proposal for the decision maker. You don’t say you should do this. But according to, and when analyzing these factors, then we came up with these score and ranking, and of course, it’s up to the decision maker to select some projects. It takes other things may come up and lead to another decision, maybe your chart may suggest. Basically, the only one that is often people used is the business case.
2. What do you think about the use of architecture to prioritize the projects? Do you think it’s beneficial?
If you have an EA which is a bit mature, then it describes your organization, describes how different element in your organization are related. So, in that way it is I would say it easier for impact analysis and prioritize where changes are needed. For example, you know a problem with an application and that application contributes to certain products. Then, if you know that there may be problems with the products, you can analyze the impact. Also the other way around, you can look your architecture, where you can do improvement and focus projects for that. And also to analyze dependency between projects. Architecture very useful. If a project is decided to improve an application and other project to remove server which is running. It is very simplistic example, but from your architecture, this is clear. And you can analyze this. So, I think is beneficial. It helps analyze the impact of the projects and the other way around. It may help you decide where changes improvements are needed in your organization to make a better decision. You also saw the picture about the modeling of the strategy architecture, and then you can analyze which part of your organization will contribute for this strategy. Which project directly contributes to your strategy is. And the other aspects was you can analyze potential dependency or for that between projects, because is common practice to define a projects start architecture and also target architecture by analyzing these architecture you can see if things are overlap or the chance of dependency, finish for example.
3. Is the method is easy to understand? Is there any step need to elaborate more ?
The method, I think is easy to understand. Something that could may give more attention. I notice in your presentation is that you have three aspects that you look at the business contribution, IT contribution and financial. And I think it would be good to provide some motivation why these three. It took me a little while to realize, these also the proposal of the method. For example a question that pop up, I don’t know it is relevant, why they look to business and IT contribution. People say business is in the lead, so business contribution is important. At the other hand, I can imagine if you look at IT. And why look separately at the financial aspect, is that not part of the business and IT aspect. Just question that pop up. These question could answer in the beginning, explain why working on these three aspects, and maybe also implies that the method can be used in certain situation and may not be useful in others situation. I don’t know you analyze or look at it, but whether the method for example suitable for certain of projects or can be generally apply.

131
The step that needs to elaborate is about how I should interpret the quadrant, if the project is in the one of the quadrant. For example, what does it mean if the project is illustrated in certain quadrant. This suggestion is something for the decision maker. For example type of analysis tolerate, invest, migrate or eliminate. How this in your case is. What does it mean. Does this define something different? It would be nice if you give the suggestion. With the ranking the one in the top is the one that you should choose. Maybe some extra help for decision-maker.
4. Do you think it is feasible to implement the method in the valuation process? From your experience, have
you ever use a project portfolio yourself, is this method could be incorporated with it?
Yes, but something I difficult to access is how much time to do it. For the bigger projects, you need some-time to do the evaluation. What I like about this is that you come up with score, what the score means and also the relation with EA. You cannot derive the score most case automatically from the architecture, but It should not be difficult by looking into your architecture to see what scoring should pick. That’s nice, because it’s mean you can use your architecture and at the same time, it does not take so much time to come up with scoring project. What I don’t know is how good the method is. You need benchmarking. And the criteria you look is relevant and it’s based on the information economics method. But for sure it’s feasible to implement the method. For example, the method of Beddel, you could use the method to derive automatically the alignment of the strategy (one of the factor). On the other hand, I doubt it is, because it requires mature architecture. You can define your architecture in different ways. The valuation technique that could combine. We could interpret certain pattern, algorithm could be defined to make the score.
5. Do you think the method is useful in practice?why?
Yes, and then why. The first one is already in the question four, since it’s feasible to implement the method. Second reason is three main factors (business, IT, financial) are among three factors that most organizations look at. Sometimes risk has separate sector, but, you already corporate that in the method. So I think you look at the right things. But the question is always, how much is it to do the method. But on the other hand, you explain how you can interpret your architecture or look at the architecture to provide the score, So you provide that link. So I think that something should be very much doable to do the method. I don’t know how good is the result are of method, but practice will show.
6. What do you think should become the improvement of the method ?
Some additional explanation of the result, on how you interpret the result of the ranking of the method. Some explanation on the philosophy behind the method. Are there any principals or assumptions starting point. Maybe it could be in the thesis. I think it’s good to know this, because it also gives some times more confidence of the method. This applicable for the situation because I believe In that idea. For example, experiment has done with that method.
Interview Session III
Interview role : Bizzdesign’s Junior Consultant
Time : Wednesday, 15/07/2015
1. What are the methods do you think is often used in practice to prioritize the projects ?
I think, they are primarily financial oriented, so based on Cost and benefit. This will cost us 10.000 euro per month but in half year it will generate this and this ten thousand euro of value. It is just black and white, this should go, but this is not. But, I’ve also works on application development projects, realizing part of the application architecture, there they use prioritizing method with an agile/ scrum. They decide together what to build first. What generate the highest business value. For example, they decided first build the front-end of the application. So, ones that live, because they need to go live very soon. They can at least have people registrating their data. It is like minimum viable products method, what should we build in terms of small part functionally , works for just a little bit then build on that further. So, based on financial data and also based on urgency. Not really on maybe also strategic value like we should build this first because this enable to have better customer interaction, but more based on urgency. I think more on the context of application development. And I have not seen so many methods to actually prioritize. It is mostly manager who invent their own project and have a lot of freedom upon which one they should and

132
which one they shouldn’t do. They responsibilities towards their manager. But, it’s very qualitative; a lot of projects also being introduce are quite experimental. So, maybe also the nature of the project is considered when doing it. So, it could Just experiment , they should do this for learn, or just implementation stuff that need to be done. So, type of the project might also effect being used to prioritize projects. So, when stuff really need to change, you might not set your resource on experimental projects, but on project that implementing or executing something. But, if you want to innovative, you might set an experimental project.
2. What do you think about the use of architecture to prioritize the projects ? Do you think it’s beneficial ?
Yes, it will be beneficial. Nowadays, I also started to developing sort of solution; BiZZdesign project portfolio management solution . Of course I think is beneficial, because when you use EA to prioritize projects, you can actually reflect on the current state of your organization and have more of a grip about the changes that will occur that architecture. So, it is like general benefit of EA we all know about multiplied by project portfolio management. It is logical extra thing to do when prioritizing project. Of course you need to do the financial stuff about the benefit and the cost. And also the strategic value stuff about to which extend this is also contribute to business goals. This also part of the architecture when you use motivation extension. You can almost encapsulate almost every factors within architecture even data. So, I think architecture will be very important vehicle or instrument in actually rating the project. You want to know, this is the landscape , these are the changes might occur based on several drivers or internal drivers, then what should we do now. But I’m also still getting into this subject. Manager will already know up-front where the changes actually take place, they already see the bigger picture, that is main benefit that crucial when using EA. That is already selling point in general, but also project portfolio management I guess.. But, it needs a good method like you are working on.
3. Is the method is easy to understand? Is there any step need to elaborate more? I really like the picture in the left bottom of your presentation that you trace every step of the method. So, I aware that you have 5 steps within business domain and 4 steps within technology domain. But, for me for example; what is technology domain actually means. Of course because I know about archimate, probably about application and infrastructure. Most of the time, you see a lot of framework use for example: business layer, information layer or technology layer. But, you just have business domain and technology domain. So, maybe the division; I don’t mean that you should divide the technology domain become two. But, what the domain actually cover, what’s in there. Especially for people who don’t know about EA, I think they won’t understand the word. I assume that you have a mature audience know. For me it’s understandable, yes definitely. I also like the process view you deploy in the whole method. So, that you, for every step you zoom in and out on the process that actually valuating the projects in the different perspective. So, I think, that’s really strong characteristic of the method you introduce. So, keep that focus on the approach, steps/ activities. I also like the fact that you mention the type of data input within the steps, like the corporate goal. That’s also really strong. So, maybe there should be an addition to actually explain the bigger picture.
4. Do you think it is feasible to implement the method in the valuation process? From your experience, have
you ever use a project portfolio yourself, is this method could be incorporated with it?
I do not have experience, but I might actually do it in a while. I have a customer now; we set up foundation for business execution. And we develop an architecture vision; we made a sketch of the business, application and technology domain. Now we’re helping the CIO to define the projects that need to be executed to implement and realize architecture and capability they want to achieve. I really see this working, maybe little for simpler version of this method. But, your first step is defining the project itself. So, depending of the problems you want to solve, you need to think of several projects. For example a new CRM, new customer service process, standardizing a process, or integrating data. But, actually needs a lot of guidance about what is the most urgent thing, what is the most valuable thing. And I think maybe a little bit, simpler version of the method might be really feasible to use for the customer. So, yes, I think it is feasible; actually a lot of companies need this. A lot of companies just using their gut feeling into decide on projects. A lot of projects in organization are dashboard driven, the managers who have the loudest voice, have their projects being implementation. Whether they providing the company with a right strategic value or right capabilities are about dashboard

133
driven.
5. Do you think the method is useful in practice?why? It is useful because it is necessary. But, it should crisp like you have 4 stages, and every stage have several steps. The extra steps might not be necessary, like making better for practice. A lot of potential. Because most of the time from the first question, decide project based on gut feeling, no method at all and financial number supporting whether to do it or not. As long as it is beneficial, the consideration is not the content of the project or the direction of the project. You should think about the content of the project, because often it overlook in a company. So, it is useful, because it is necessary. When you use EA to evaluate and prioritize project you actually use all the information available in the organization to make decision.
6. What do you think should become the improvement of the method? Something about the decision making should be added. In a bubble chart, for example: to kill the project in the left bottom corner, or green light in the top right. What are the criteria when you are not going to do it. For example is the MoSCoW. Put a lot of matrix, have people make decision. For example, one of the dashboards is the business transformation readiness assessment.
Interview Session IV
Interview role : Bizzdesign’s Business Consultant
Time : Thursday, 16/07/2015
1. What are the methods do you think is often used in practice to prioritize the projects? I really think it’s a lot about gut feeling, furthermore I think, in my experience is mostly the financial. So, it’s about what is the project cost and in what way is beneficial to organization. Mostly this benefit are not so strictly to be identified financial, in the sense that this project has an ROI in such number, but mostly is more about gut feeling, what is worth to the company, less mathematical, and more based on feeling or experience. It’s mostly not in monetary term, except for the cost that mostly very important.
2. What do you think about the use of architecture to prioritize the projects? Do you think it’s beneficial? Yes, I think it’s beneficial, but mostly for company with high maturity level in architecture. Because, for example for the organization where I’m working now, has very low maturity level of architecture. They don’t use it, or make it or knew what it is. So, if I would go to them and say how they prioritize the project, do you use architecture, it will not really relevant. But, if an organization does have architecture and does work with the architecture as a way of filling in the future and how to go there, then I think It will be definitely beneficial for them.
3. Is the method is easy to understand? Is there any step need to elaborate more? No, I don’t think it’s easy to understand. It’s a quite vast. I think for people like us as consultant, or people that knew about architecture, and know about archimate, it’s manageable. It is better to understand, but, even then still like theory of everything. Academically, I think it’s really good. I think it’s really vast and probably also could work for most of the organizations. But, a lot of work before you can prioritize your projects. Statistically, it is doing a great job, and could be working for a lot of manager that statistically thinking. But it’s not easy to understand. I think it requires experience with the method. In order to make it easier to understand, you could present it with one example of one real-time project. In the sense that, some easy of understand example will help or maybe you could skip some steps to make it easier or simpler. I think in some cases, like management doesn’t really know how to score these things, if the evaluation like this score, like point 2 and point 3, and point 5. It’s still some sort of gut feeling, although it will make the decision become less-subjective. I also think one important aspect, that not really measurable is like political factors. In my experience, a lot of managers and probably even portfolio manager have some sort of agenda for choosing one or two projects to be prioritized. So, I think a lot of manager, like the fact the decision are subjective, like only personal interest in their choice. I really agree this method make the prioritization more objective, probably the strength of the method. But in some cases in practice, people just want to make a subjective choice. From academic perspective, it’s perfect / superb. The managers probably can make a good subjective choice. So, in addition of subjective opinion it can really work, but to contradictive, then they probably don’t really like the method so much. But, it still gives a

134
room for subjectivity.
4. Do you think it is feasible to implement the method in the valuation process? From your experience, have you ever use a project portfolio yourself, is this method could be incorporated with it? Yes, I think it is possible to implement the method. From previous question’s discussion, I think, it could be incorporated with the subjective opinion of the managers. I have seen some methods, it’s from Chris Pots, I followed his course about mastering enterprise investment, and he has a method to prioritize projects based on several values. But, in practice, I haven’t ever used or seen a particular method. That is also because maybe I’m not yet that experienced, like working with thousand companies. So, in my experience I haven’t seen method that was used for project portfolio.
5. Do you think the method is useful in practice? Why? Yes, if the companies have high level maturity in EA then yes, I think it’s useful. Because, If they have high level maturity in EA, then I would probably think that they have like architecture roadmap for the future, so they know where they want to go based some strategic choices. And I think with this method, we can actually see what projects fit-in to get there. So, architecture is about to design and how we would go there. But, how we would go there in practice, that’s this method is really useful. And also, to see what projects do not really contribute to the roadmap, so we might kill them.
6. What do you think should become the improvement of the method? If you can make it somehow easier or less-time consuming, I think that would be the improvement that I can think of now. Because I can imagine the project portfolio managers don’t have, for instance any experience with architecture or archimate or bpmn. I think in this method, you always need more people. Unless you have manager that also has experience with architecture, archimate, bpmn. Because people that have a lot experience about architecture, they probably don’t know about ROI or NPV.

135
Appendix 6
Archipharma’s Architecture
6.1 Archipharma’s Program Motivation View

136
6.2 Archipharma application realization view