Embed Size (px)
Citation preview

Investment Office ANRS
PROJECT PROFILE ON THE ESPROJECT PROFILE ON THE ESPROJECT PROFILE ON THE ESPROJECT PROFILE ON THE ESTABLISHMENT TABLISHMENT TABLISHMENT TABLISHMENT
OF PHARMACEUTICALSOF PHARMACEUTICALSOF PHARMACEUTICALSOF PHARMACEUTICALS FORMULATING FORMULATING FORMULATING FORMULATING
PLANTPLANTPLANTPLANT
DDDDevelopment Studies Associates (DSA)evelopment Studies Associates (DSA)evelopment Studies Associates (DSA)evelopment Studies Associates (DSA)
October 2008
Addis Ababa

Table of Contents
1. Executive Summary......................................................................................1
2. Product Description and Application .........................................................1
3. Market Study, Plant Capacity and Production Program.........................3
3.1 Market Study .............................................................................................................3
3.1.1 Present Demand and Supply..............................................................................3
3.1.2 Projected Demand .............................................................................................5
3.1.3 Pricing and Distribution ....................................................................................7
3.1.4 Plant Capacity....................................................................................................8
3.2 Production Program...................................................................................................8
4. Raw Materials and Utilities .........................................................................9
4.1 Availability and Source of Raw Materials ................................................................9
4.2 Annual Requirement and Cost of Raw Materials and Utilities .................................9
5. Location and Site ........................................................................................10
6. Technology and Engineering .....................................................................10
6.1 Production Process ..................................................................................................10
6.2 Machinery and Equipment ......................................................................................10
6.3 Civil Engineering Cost ............................................................................................13
7. Human Resource and Training Requirement .........................................13
7.1 Human Resource .....................................................................................................13
7.2 Training Requirement..............................................................................................14
8. Financial Analysis.......................................................................................14
8.1 Underlying Assumption...........................................................................................14
8.2 Investment ...............................................................................................................16
8.3 Production Costs......................................................................................................16
8.4 Financial Evaluation................................................................................................17
9. Economic and Social Benefit and Justification........................................18
ANNEXES..........................................................................................................20

1
1. Executive Summary
This project proposes the establishment of pharmaceutical formulation plant with annual
capacity of 700 mill pcs of tab. 130 mill capsule; 297000 liter syrup mill vials 79 mill ampoules
& 32000 kg ointment at full capacity utilization.
The market study shows that there is sufficient market in the Amhara Region as well as in the
country for the items.
The initial investment cost is planned to be Birr 151.9 million out of which about 74.6% is in
foreign currency.
The plant will create employment opportunities for 580 people.
The finical internal rate of return (IRR) discounted at 18% is 26.4% and the net present value is
Birr 27.2 million.
2. Product Description and Application
Drugs are one of those basic and essential products on which the health and welfare of a people
depend on.
Basic pharmaceutical products are medicines considered essential for meeting the basic health
needs of a community in the context of the health care standard of our country. The list of these
essential medicines or popularly known as essential drugs are usually prepared by the Ministry of
Health. In the importation of pharmaceutical products, priority is given to these essential drugs.
Drugs can be classified on the basis of medicinal uses or on the basis of their sources of origin.
Based on their medicinal use, drugs are classified into twenty-eight groups. On the other hand,
drugs are classified into five groups based on their sources of origin. These are:
(a) Drugs of vegetable and plant origin, (b) Hormones and glandular products
(c) Antibiotics, (d) Synthetic drugs and (e) Vitamins and biological. The essential drugs are
composed of the various groups of drugs just mentioned.
2
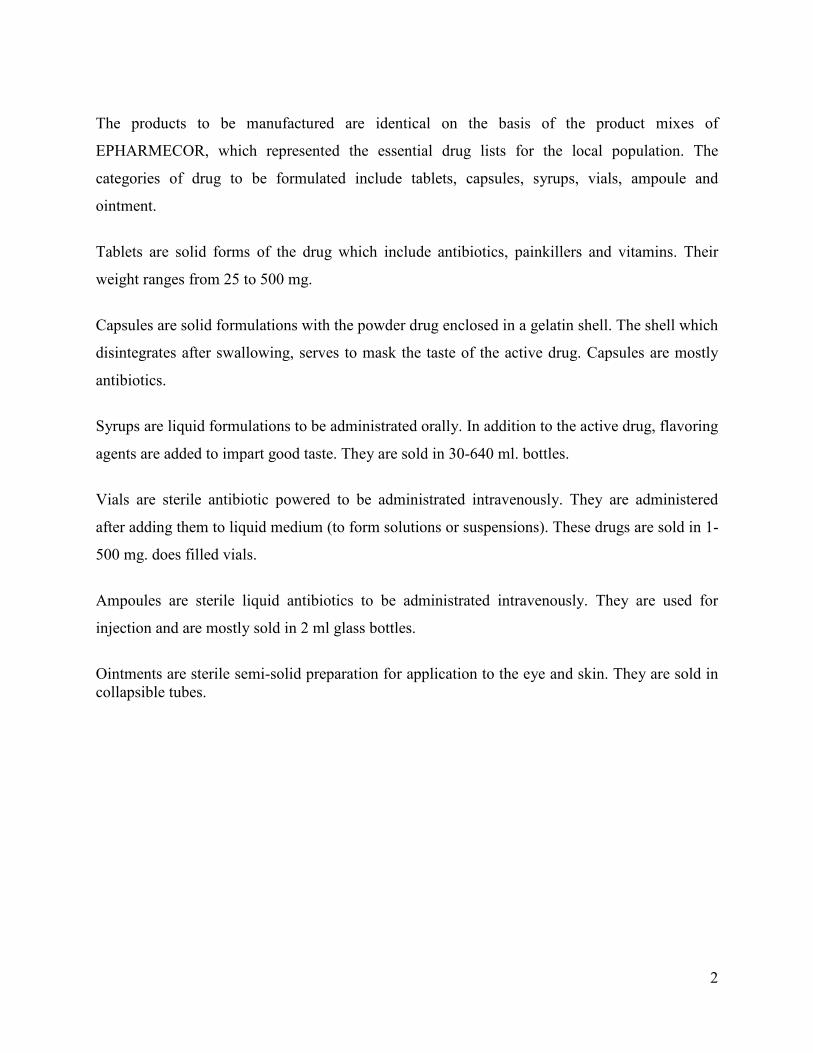
The products to be manufactured are identical on the basis of the product mixes of
EPHARMECOR, which represented the essential drug lists for the local population. The
categories of drug to be formulated include tablets, capsules, syrups, vials, ampoule and
ointment.
Tablets are solid forms of the drug which include antibiotics, painkillers and vitamins. Their
weight ranges from 25 to 500 mg.
Capsules are solid formulations with the powder drug enclosed in a gelatin shell. The shell which
disintegrates after swallowing, serves to mask the taste of the active drug. Capsules are mostly
antibiotics.
Syrups are liquid formulations to be administrated orally. In addition to the active drug, flavoring
agents are added to impart good taste. They are sold in 30-640 ml. bottles.
Vials are sterile antibiotic powered to be administrated intravenously. They are administered
after adding them to liquid medium (to form solutions or suspensions). These drugs are sold in 1-
500 mg. does filled vials.
Ampoules are sterile liquid antibiotics to be administrated intravenously. They are used for
injection and are mostly sold in 2 ml glass bottles.
Ointments are sterile semi-solid preparation for application to the eye and skin. They are sold in
collapsible tubes.

3
3. Market Study, Plant Capacity and Production Program
3.1 Market Study
3.1.1 Present Demand and Supply
There is one old pharmaceutical formulation plant establishment in Addis Ababa in 19541 by
foreigner and now called EPHARMECOR owned by the state. Latter on Addis Pharmaceutical
Factory was established in 1988 in Adigrat town owned by the Tigray Regional state. These are
the two main factories supplying part of the essential drug requirement of the country. In
addition during the last ten years, some other pharmaceutical factories have been established in
the Country, especially in Addis Ababa, this include East Africa, RX- Africa, Fews Pharma,
Sino Ethiopia, Pharma Cure and ETAB Inter. and are producing some of essential drugs.
Currently a relatively big pharmaceutical factory called Cadilla Pharma, is under construction in
Debrezeit town.
There is no data available on the consumption patterns of hospitals or clinics that can be used to
quantify the present consumption of pharmaceutical products. However, compared to the present
population size and the mushrooming of both government and private clinics and hospitals in the
country, it is prevalent that there is high shortage of drug and the prices are growing sky-high. To
meet this growing demand, the country is forced to import these drugs in which case the annual
expenditure on importing drugs is reaching over Birr 200 million.
Like other regions, the Amhara Region was getting its drugs requirements from the Addis
Ababa factories and imports. Since the Amhara Region contains about 26 percent of the
country’s population, one could have expected that at least 25 percent of the local drugs are
produced and consumed in the Region. But this is not the case. This consumption share is
sufficient to absorb the production of a medium scale pharmaceutical factory in the Region.
In this regard the Amhara Region should promote the establishment of a pharmaceutical factory
to make itself self-sufficient in the production of essential drugs.
1 Years in this document are in Ethiopian calendar.
4
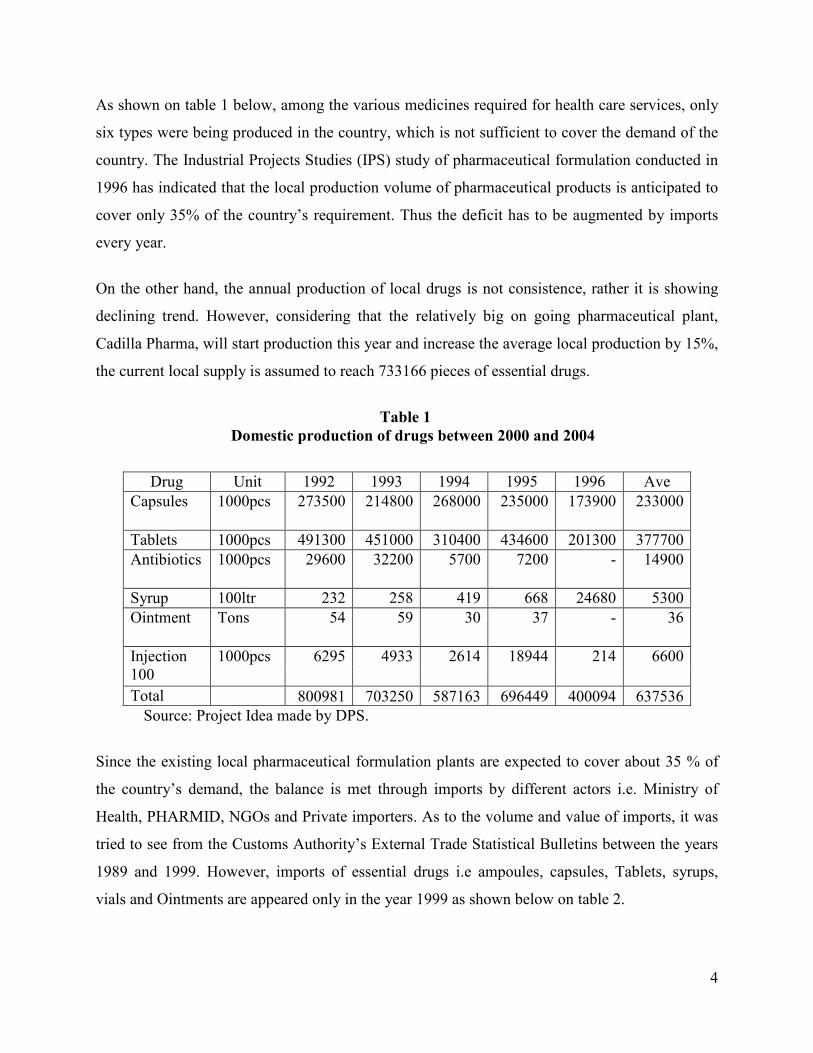
As shown on table 1 below, among the various medicines required for health care services, only
six types were being produced in the country, which is not sufficient to cover the demand of the
country. The Industrial Projects Studies (IPS) study of pharmaceutical formulation conducted in
1996 has indicated that the local production volume of pharmaceutical products is anticipated to
cover only 35% of the country’s requirement. Thus the deficit has to be augmented by imports
every year.
On the other hand, the annual production of local drugs is not consistence, rather it is showing
declining trend. However, considering that the relatively big on going pharmaceutical plant,
Cadilla Pharma, will start production this year and increase the average local production by 15%,
the current local supply is assumed to reach 733166 pieces of essential drugs.
Table 1
Domestic production of drugs between 2000 and 2004
Drug Unit 1992 1993 1994 1995 1996 Ave
Capsules 1000pcs 273500 214800 268000 235000 173900 233000
Tablets 1000pcs 491300 451000 310400 434600 201300 377700
Antibiotics 1000pcs 29600 32200 5700 7200 - 14900
Syrup 100ltr 232 258 419 668 24680 5300
Ointment Tons 54 59 30 37 - 36
Injection
100
1000pcs 6295 4933 2614 18944 214 6600
Total 800981 703250 587163 696449 400094 637536
Source: Project Idea made by DPS.
Since the existing local pharmaceutical formulation plants are expected to cover about 35 % of
the country’s demand, the balance is met through imports by different actors i.e. Ministry of
Health, PHARMID, NGOs and Private importers. As to the volume and value of imports, it was
tried to see from the Customs Authority’s External Trade Statistical Bulletins between the years
1989 and 1999. However, imports of essential drugs i.e ampoules, capsules, Tablets, syrups,
vials and Ointments are appeared only in the year 1999 as shown below on table 2.

5
Table 2
Imports of Drugs between 1996 and 20007
Source: Customs Authority, 1996-2007
3.1.2 Projected Demand
There is no data available on the consumption patterns of hospitals or clinics that can be used to
quantify the present consumption of pharmaceutical products. However it is assumed that he
consumption of drugs grows with the population increase as with all other commodities. Of
course, with the increase of population the health facilities should increase to help the people and
the usage of drugs will then show a parallel increase. According to Industrial Projects Studies
(IPS) of pharmaceutical formulation study, the annual demand for the six essential drugs (Table,
Capsules, Ampoules, Vials, Ointments and Syrups) is assumed to grow by 25%.
There is no other data available to be used in projecting the demand of pharmaceutical products.
Hence, the demand projection made on the basis of IPS’s forecast figure of 1996 on six items
taking the average annual increase of 25% is indicated on Tables 3 below.
Pharmaceutical Drugs Values in Birr Weight in Kg.
Table 8,919598 65,549
Capsules 1,927,939 12,748
Ampoules 23,374,304 134,523
Vials 1,367,769 57,707
Ointments 3,529,678 38,190
Syrups 457,987 11,058
Average 6,596,122 53,292

6
Table 3
IPS’s Forecasts of Local Demand
Based on this assumption, the present demand will be as follows:
� Tablets 166,532,000 (100 tablet boxes)
� Capsules 50,515,000 (1000 capsules boxes)
� Ampoules 29,420,000 (100 ampoules boxes
� Vials 23,592,000 (100 vial boxes)
� Ointments 36,082,000 (1g.tins)
� Syrups 50,515,000 (bottles of different size
The project of demand for pharmaceutical products for the next ten years is shown in Table 4.
Forecasted Production in "000" units Pharmaceutical Drugs
1989 1993 1998
Table (100 tablet boxes) 14,305 34,925 106,581
Capsules (1000 capsules boxes) 4,339 10,594 32,330
Ampoules (100 ampoules boxes 2,527 5,170 18,829
Vials (100 vial boxes) 2,027 4,948 15,099
Ointments(1g.tins) 3,099 7,567 23,093
Syrups (bottles of different size) 4,339 10,594 32,330

7
Table 4 PROJECTION OF DEMAND OF ESSENTIAL DRUGS
In “000” units
The demand of pharmaceutical products is estimated to grow from 2000 to 2010 as demonstrated
above on Table 3 for six categories of products.
3.1.3 Pricing and Distribution
To list the entire price for all tablets, capsulate, ampoule, vials, ointment and syrups will be too
cumbersome. Hence, samples are taken from each group and the average price of this sample is
taken for each group.
a) Tablets- the average price is taken to be Birr 0.15/ tab.
b) Capsules- the average price is taken to be Birr 0.30/cap.
c) Ampoules- the average price is taken to be Birr 1.50/ampoule.
d) Vials- the average price is taken to be Birr 3.50/vial.
e) Ointments- the average price is taken to be Birr 4.00/20mg.
f) Syrup- the average price is taken to be Birr 6.00/bottle.
Year Essential
Drugs 2000 2001 2001 2003 2004 2005 2006 2007 2008 2009 2010
Tablets (1000
tablets boxes) 166,532
208165
260206
325258
406572
508215
635269
794086
992608
1240760
1550950
Capsules (1000
capsules boxes) 50,515
63144
78930
98662
123328
154160
192699
240874
301093
376366
470458
Ampoules
(1000 ampoules
boxes) 29,420
36775
45969
57461
71826
89783
112228
140285
175357
219196
273995
Vials (100 vial
boxes) 23,592
29490
36863
46078
57598
71997
89996
112495
140619
175774
219718
Ointments
(1kg.tins) 36,082
45103
56378
70473
88091
110114
137642
172052
215065
268832
336040
Syrups (bottles
of diff. size 50,515
63144
78930
98662
123328
154160
192699
240874
301093
376366
470458

8
For simplicity, the above six drugs are again regrouped in to three with their respective average
price i.e
a) Price of tablets and capsules: Birr 0.30
b) Price of ampoules and vials: Birr 2.75
c) Price of ointment and syrups: Birr 5.00
It would be necessary to make marketing promotion attempt to attract the wholesalers and
retailer of pharmaceutical products so as use their channel of distribution. In the long run, it is
important to make market research in the neighboring countries to export the products.
3.1.4 Plant Capacity
The economic capacity of the formulation plant and product mix, in terms of the maximum rated
output of the individual products, is assumed as follows:-
Tablets: 700 million tabs/year
Capsules: 130 million caps/year
Vials: 5 million vials/year
Ampoules: 19 million ampoules/year
Ointment: 32,000 kg/year
Syrup: 297,000 syrups/year
3.2 Production Program
The formulation of the above products will be imitated simultaneously with 60%, 80% and 100%
capacity utilization during the first ,second and third year of operation, respectively. The plant
will be run for 275 days annually in a single shift. The low capacity utilization level during the
initial period of project operation is due to the fat that pharmaceutical projects are relatively
complex in terms of meeting quality standards, and therefore it would take long time to develop
operational skill.
Annual over-haul is expected to take about one month, resulting in net available working days of
245.
9
4. Raw Materials and Utilities
4.1 Availability and Source of Raw Materials
The chemical industry is the basis for the development of a pharmaceutical industry. In the
absence of a well- developed chemical industry, the alternative to operate a pharmaceutical
factory is to import the various inputs from abroad.
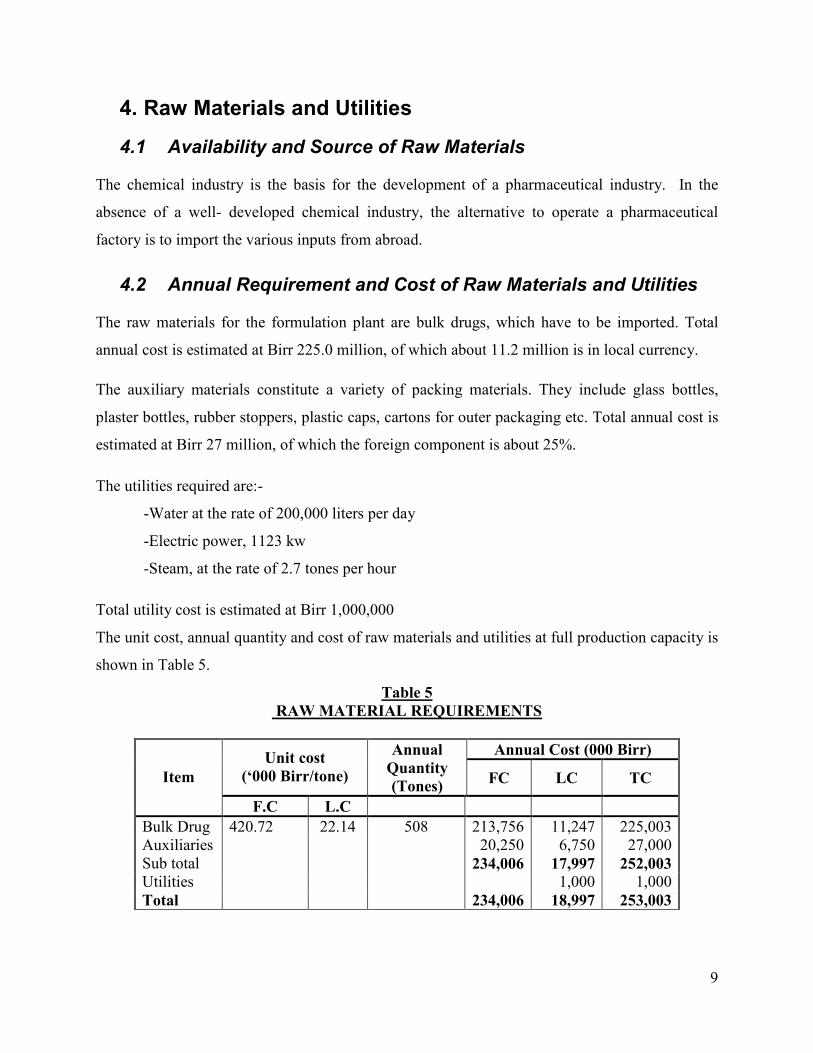
4.2 Annual Requirement and Cost of Raw Materials and Utilities
The raw materials for the formulation plant are bulk drugs, which have to be imported. Total
annual cost is estimated at Birr 225.0 million, of which about 11.2 million is in local currency.
The auxiliary materials constitute a variety of packing materials. They include glass bottles,
plaster bottles, rubber stoppers, plastic caps, cartons for outer packaging etc. Total annual cost is
estimated at Birr 27 million, of which the foreign component is about 25%.
The utilities required are:-
-Water at the rate of 200,000 liters per day
-Electric power, 1123 kw
-Steam, at the rate of 2.7 tones per hour
Total utility cost is estimated at Birr 1,000,000
The unit cost, annual quantity and cost of raw materials and utilities at full production capacity is
shown in Table 5.
Table 5
RAW MATERIAL REQUIREMENTS
Annual Cost (000 Birr) Unit cost
(‘000 Birr/tone)
Annual
Quantity
(Tones) FC LC TC Item
F.C L.C
Bulk Drug 420.72 22.14 508 213,756 11,247 225,003
Auxiliaries 20,250 6,750 27,000
Sub total 234,006 17,997 252,003
Utilities 1,000 1,000
Total 234,006 18,997 253,003

10
5. Location and Site
The ideal location for pharmaceuticals formulation plant is Bahir Dar, Goandar or Dessie towns.
6. Technology and Engineering
6.1 Production Process
The manufacturing processes of drugs differ on the basis of their sources of origin or medium
use. Different approaches of formulations and manufacturing are used for different groups of
drugs.
Basically, the formulation process involves the blending of the different bulk drug constituents in
pre-determined proportions. The production of solid drugs, such as tablets, involves
mixing/milling, drying and table ting. The manufacturing operations of capsules include powder
mixture preparation, filling of powder into gelatin capsule and sealing. A liquid formulation such
as syrup involves basically mixing and filling. The manufacture of sterile drugs like vials and
ampoules includes, in addition to basic formulation operations, sterilization process.
Alternatively, the interested investor can add animal drugs production by careful assessment of
the market.
6.2 Machinery and Equipment
The list of production machinery and equipment are presented in Tables 6.1 to Table 6.6. The
total estimated cost of the machinery and equipment is about Birr 15.0 million, of which about
25 is in local currency.

11
Table 6.1
TABLET PRODUCTION
Type of M/C and Equipment Quantity
- Mixer (250kg) 2
- Multi mill(250 kg) 2
- Tray Dryers (96 Trays) 2
- Fluid bed dryers (120 kg) 2
- Conical Mixer (600 kg) 1
- Table ting M/C 5
- Tablet Inspection Belt 3
- Coating pan 1
- Sifter (20”) 1
- Tablet Degusted 5
- Balance & Lab Equip. set
Table 6.2
CAPSULE PRODUCTION
Type of M/C and Equipment Quantity
- Paddle mixer 2
- Fritz mill 2
- Tray dryer 1
- Sifter 1
- Filling of sealing m/c 3
- Sorting/polishing m/c 2
- Balances SET
Table 6.3
PACKING (FOR TABLET AND CAPSULE)
Type of M/C and Equipment Quantity
- Counter and Filler 2
- Packing conveyor 4
- Turn Table 1
- Strip Packing 4
- Defiler 2
- Carton coding 2

12
Table 6.4
OINTMENT
Type of M/C and Equipment Quantity
- Wax Melting Vessel 2
- Ointment Mixing Vessel 2
- Triple Roll Mill 2
- Ointment Filling/crimping 1
- Laminar Flow 1
- Steam Sterilizer 1
- Dry heat sterilizer 1
- Stat Conveyor 1
Table 6.5
SYRUP
Type of M/C and Equipment Quantity
Hoist 1
Sugar loader 1
Syrup mixing vessel 2
Manufacturing vessel 2
Staging vessel 2
Filter press 2
Colloid mill 1
Bottle washing, drying, filling, labeling line 1
Table 6.6
AMPOULES AND VIALS
Type of M/C and Equipment Quantity
Counter and filler 2
Packing conveyor 4
Turn table 1
Strip packing machine 4
Defiler 2
Carton loading 2

13
Machinery suppler can be reached through the following address:
Charles Ross & Son Co. E-mail this company
710 Old Willets Path
Hauppauge, NY 11788
Phone: 631-234-0500, 800-243-ROSS (toll free)
Fax: 631-234-0691
http://www.mixers.com
Website Links: Online Catalog | Distributor Locator | News Releases | Locations | Site Map
6.3 Civil Engineering Cost
The breakdowns of the estimated areas of the building are as follows:
Production building: 4760 square meters
Office building: 1285 “ “
Store and other 6300 “ “
12345
Total building cost is estimated at Birr 20 million of which about 40% is in foreign exchange.
The total land requirement of the project including provision for space is estimated to be 16,000
square meters.
7. Human Resource and Training Requirement
7.1 Human Resource
The total manpower requirement is 580, of which about 330 persons are skilled and the
remaining are unskilled. The total manpower cost is estimated at Birr 6.4 million per year.

14
Table 7
PHARMACEUTICAL FORMULATION
MANPOWER REQUIREMENT
Category Number Monthly
Salary/person (Birr)
Annual Salary
(Birr)
1. Manager 1 5,000 60,000
2. Skilled worker
2.1 Supervisor 6 3500 252,000
2.2 pharmacist 12 3000 432,000
2.3 Chemist 6 2000 144,000
2.4 Technician 5 1000 60,000
2.5 Operators 300 800 2,880,000
3. Unskilled workers (laborers) 250 500 1,500,000
Total 580 5,328,000
Benefits (20%) 1,065600
Total 6,393,600
7.2 Training Requirement
Foreign training is proposed for key technical personnel. It is envisaged that:
- Two persons shall be trained for one month in the area of manufacturing.
- One man be trained for one month in quality control
- Two men be trained for one month in maintenance
Training cost is estimated at Birr 200,000. In addition, about Birr 4 million will be required for
know how transfer. About Birr 150,000 of the training cost will be in foreign currency.
8. Financial Analysis
8.1 Underlying Assumption
The financial analysis of pharmaceuticals formulating plant is based on the data provided in the
preceding chapters and the following assumptions.

15
A. Construction and Finance
Construction period 2 year
Source of finance 40% equity and 60% loan
Tax holidays 3 years
Bank interest rate 12%
Discount for cash flow 18%
Value of land Based on lease rate of ANRS
Spare Parts, Repair & Maintenance 3% of fixed investment
B. Depreciation
Building 5%
Machinery and equipment 10%
Office furniture 10%
Vehicles 20%
Pre-production (amortization) 20%
C. Working Capital (Minimum Days of Coverage)
Raw Material-Local 30 days
Raw Material-Foreign 120 days
Factory Supplies in Stock 30 days
Spare Parts in Stock and Maintenance 30 days
Work in Progress 10 days
Finished Products 15 days
Accounts Receivable 30 days
Cash in Hand 30 days
Accounts Payable 30 days
16
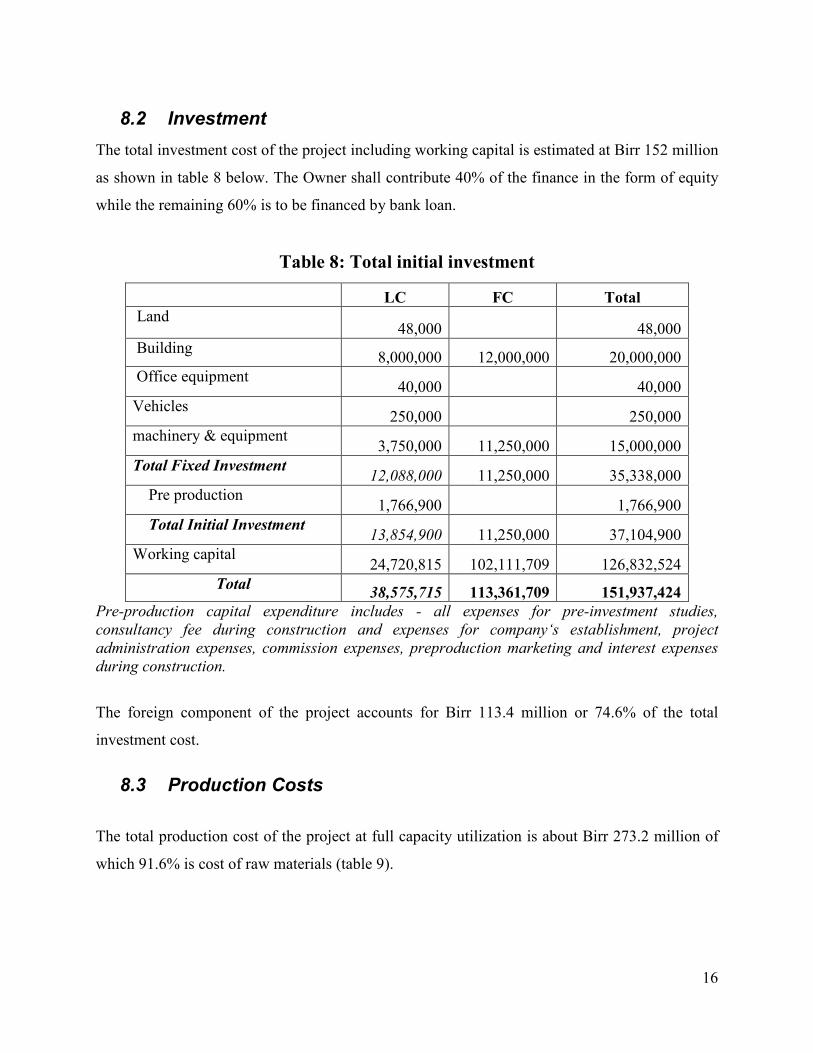
8.2 Investment
The total investment cost of the project including working capital is estimated at Birr 152 million
as shown in table 8 below. The Owner shall contribute 40% of the finance in the form of equity
while the remaining 60% is to be financed by bank loan.
Table 8: Total initial investment
LC FC Total
Land 48,000 48,000
Building 8,000,000 12,000,000 20,000,000
Office equipment 40,000 40,000
Vehicles 250,000 250,000
machinery & equipment 3,750,000 11,250,000 15,000,000
Total Fixed Investment 12,088,000 11,250,000 35,338,000
Pre production 1,766,900 1,766,900
Total Initial Investment 13,854,900 11,250,000 37,104,900
Working capital 24,720,815 102,111,709 126,832,524
Total 38,575,715 113,361,709 151,937,424
Pre-production capital expenditure includes - all expenses for pre-investment studies,
consultancy fee during construction and expenses for company‘s establishment, project
administration expenses, commission expenses, preproduction marketing and interest expenses
during construction.
The foreign component of the project accounts for Birr 113.4 million or 74.6% of the total
investment cost.
8.3 Production Costs
The total production cost of the project at full capacity utilization is about Birr 273.2 million of
which 91.6% is cost of raw materials (table 9).

17
Table 9
Total Production Cost at full Capacity
Items Cost
1. Raw materials 252,003,000
2. Utilities 1,000,000
3. Wages and Salaries 6,393,600
4. Spares and Maintenance 1,060,140
Factory costs 260,456,740
5. Depreciation 2,907,380
6. Financial costs 9,836,245
Total Production Cost 273,200,365
8.4 Financial Evaluation
I. Profitability
According to the projected income statement, the project will generate profit beginning from first
year of operation. Important ratios such as net profit to equity (Return on equity) and net profit
and interest on total investment (return on total investment) are 10% and 26.%, respectively in
the first year and are gradually rising. The income statement and other profitability indicators
show that the project is viable
II. Breakeven Analysis
The breakeven point of the project is estimated by using income statement projection.
Accordingly the project will breakeven at 10.2% of capacity utilization.
III. Payback Period
Investment cost and income statement projection are used in estimating the project payback
period. The project will payback fully the initial investment less working capital in two years
time.

18
IV. Simple Rate of Return
It is a ratio of net profit and interest to the total capital invested for a single year at full capacity
operation. Thus the SRR of the project is calculated to be 23.0%
V. Internal Rate of Return and Net Present Value
Based on the projected cash flow statement, the calculated IRR of the project is 26.4% and the
net present value (NPV) is Birr 27.2 million.
VI. Sensitivity Analysis
The financial viability of the spices processing plant will not be affected if prices of raw
materials are increased by 10%.
9. Economic and Social Benefit and Justification
Based on the foregoing presentation and analysis, we can learn that the proposed project
possesses wide range of benefits that complement the financial feasibility obtained earlier. In
general the envisaged project promotes the socio-economic goals and objectives stated in the
strategic plan of the Amhara National Regional State, promote technology transfer and make the
Region self sufficient in essential drugs production. These benefits are listed as follows
A. Profit Generation
The project is found to be financially viable and earns on average a profit of birr 28.63 million
per year and birr 286.1 million within the project life. Such result induces the project promoters
to reinvest the profit which, therefore, increases the investment magnitude in the region.
B. Tax Revenue
In the project life under consideration, the region will collect about birr 114.9 million from
corporate tax payment alone (i.e. excluding income tax, sales tax and VAT). Such result create
additional fund for the regional government that will be used in expanding social and other basic
services in the region

19
C. Import Substitution and Foreign Exchange Saving
As there is no local production of milk powder in the country, the commencement of this project
relieves a portion of the import burden. That is, based on the projected figure we learn that in the
project life an estimated amount of US Dollar 316.6 million will be saved as a result of the
proposed project. This will create room for the saved hard currency to be allocated on other vital
and strategic sectors
D. Employment and Income Generation
The proposed project is expected to create employment opportunity to several citizens of the
country. That is, it will provide permanent employment to 580 professionals as well as support
stuffs. Consequently the project creates income of birr 6.4 million per year. This would be one of
the commendable accomplishments of the project.
E. Pro Environment Project
The proposed production process is environment friendly.

20
ANNEXES

1
Annex 1: Total Net Working Capital Requirements (in Birr)
CONSTRUCTION PRODUCTION
Year 1 Year 2 1 2 3 4
Capacity Utilization (%) 0.00 0.00 60% 70% 80% 90%
1. Total Inventory 0.00 0.00 138060580.66 161070677.44 184080774.21 207090870.99
Raw Materials in Stock- Total 0.00 0.00 62445010.91 72852512.73 83260014.55 93667516.36
Raw Material-Local 0.00 0.00 1177985.45 1374316.36 1570647.27 1766978.18
Raw Material-Foreign 0.00 0.00 61267025.45 71478196.36 81689367.27 91900538.18
Factory Supplies in Stock 0.00 0.00 172383.79 201114.42 229845.05 258575.68
Spare Parts in Stock and Maintenance 0.00 0.00 69390.98 80956.15 92521.31 104086.47
Work in Progress 0.00 0.00 4309594.69 5027860.47 5746126.25 6464392.04
Finished Products 0.00 0.00 8619189.38 10055720.95 11492252.51 12928784.07
2. Accounts Receivable 0.00 0.00 20725854.55 24180163.64 27634472.73 31088781.82
3. Cash in Hand 0.00 0.00 483944.73 564602.18 645259.64 725917.09
CURRENT ASSETS 0.00 0.00 96825369.02 112962930.53 129100492.03 145238053.54
4. Current Liabilities 0.00 0.00 20725854.55 24180163.64 27634472.73 31088781.82
Accounts Payable 0.00 0.00 20725854.55 24180163.64 27634472.73 31088781.82
TOTAL NET WORKING CAPITAL REQUIRMENTS 0.00 0.00 76099514.48 88782766.89 101466019.30 114149271.72
INCREASE IN NET WORKING CAPITAL 0.00 0.00 76099514.48 12683252.41 12683252.41 12683252.41

2
Annex 1: Total Net Working Capital Requirements (in Birr) (continued)
PRODUCTION
5 6 7 8 9 10
Capacity Utilization (%) 100% 100% 100% 100% 100% 100%
1. Total Inventory 230100967.77 230100967.77 230100967.77 230100967.77 230100967.77 230100967.77
Raw Materials in Stock-Total 104075018.18 104075018.18 104075018.18 104075018.18 104075018.18 104075018.18
Raw Material-Local 1963309.09 1963309.09 1963309.09 1963309.09 1963309.09 1963309.09
Raw Material-Foreign 102111709.09 102111709.09 102111709.09 102111709.09 102111709.09 102111709.09
Factory Supplies in Stock 287306.31 287306.31 287306.31 287306.31 287306.31 287306.31
Spare Parts in Stock and Maintenance 115651.64 115651.64 115651.64 115651.64 115651.64 115651.64
Work in Progress 7182657.82 7182657.82 7182657.82 7182657.82 7182657.82 7182657.82
Finished Products 14365315.64 14365315.64 14365315.64 14365315.64 14365315.64 14365315.64
2. Accounts Receivable 34543090.91 34543090.91 34543090.91 34543090.91 34543090.91 34543090.91
3. Cash in Hand 806574.55 806574.55 806574.55 806574.55 806574.55 806574.55
CURRENT ASSETS 161375615.04 161375615.04 161375615.04 161375615.04 161375615.04 161375615.04
4. Current Liabilities 34543090.91 34543090.91 34543090.91 34543090.91 34543090.91 34543090.91
Accounts Payable 34543090.91 34543090.91 34543090.91 34543090.91 34543090.91 34543090.91
TOTAL NET WORKING CAPITAL REQUIRMENTS 126832524.13 126832524.13 126832524.13 126832524.13 126832524.13 126832524.13
INCREASE IN NET WORKING CAPITAL 12683252.41 0.00 0.00 0.00 0.00 0.00

3
Annex 2: Cash Flow Statement (in Birr)
CONSTRUCTION PRODUCTION
Year 1 Year 2 1 2 3 4
TOTAL CASH INFLOW 18552450.00 145384974.13 210712854.55 225105809.09 256770309.09 288434809.09
1. Inflow Funds 18552450.00 145384974.13 20725854.55 3454309.09 3454309.09 3454309.09
Total Equity 7420980.00 58153989.65 0.00 0.00 0.00 0.00
Total Long Term Loan 11131470.00 87230984.48 0.00 0.00 0.00 0.00
Total Short Term Finances 0.00 0.00 20725854.55 3454309.09 3454309.09 3454309.09
2. Inflow Operation 0.00 0.00 189987000.00 221651500.00 253316000.00 284980500.00
Sales Revenue 0.00 0.00 189987000.00 221651500.00 253316000.00 284980500.00
Interest on Securities 0.00 0.00 0.00 0.00 0.00 0.00
3. Other Income 0.00 0.00 0.00 0.00 0.00 0.00
TOTAL CASH OUTFLOW 18552450.00 18552450.00 277644688.72 228132147.29 261539522.80 288003915.32
4. Increase In Fixed Assets 18552450.00 18552450.00 0.00 0.00 0.00 0.00
Fixed Investments 17669000.00 17669000.00 0.00 0.00 0.00 0.00
Pre-production Expenditures 883450.00 883450.00 0.00 0.00 0.00 0.00
5. Increase in Current Assets 0.00 0.00 96825369.02 16137561.50 16137561.50 16137561.50
6. Operating Costs 0.00 0.00 157594324.72 183797348.84 210000372.96 236203397.08
7. Corporate Tax Paid 0.00 0.00 0.00 0.00 9171600.48 11400217.97
8. Interest Paid 0.00 0.00 23224994.97 11803494.54 9836245.45 7868996.36
9. Loan Repayments 0.00 0.00 0.00 16393742.41 16393742.41 16393742.41
10. Dividends Paid 0.00 0.00 0.00 0.00 0.00 0.00
Surplus(Deficit) 0.00 126832524.13 -66931834.17 -3026338.20 -4769213.71 430893.77
Cumulative Cash Balance 0.00 126832524.13 59900689.96 56874351.75 52105138.04 52536031.81
4
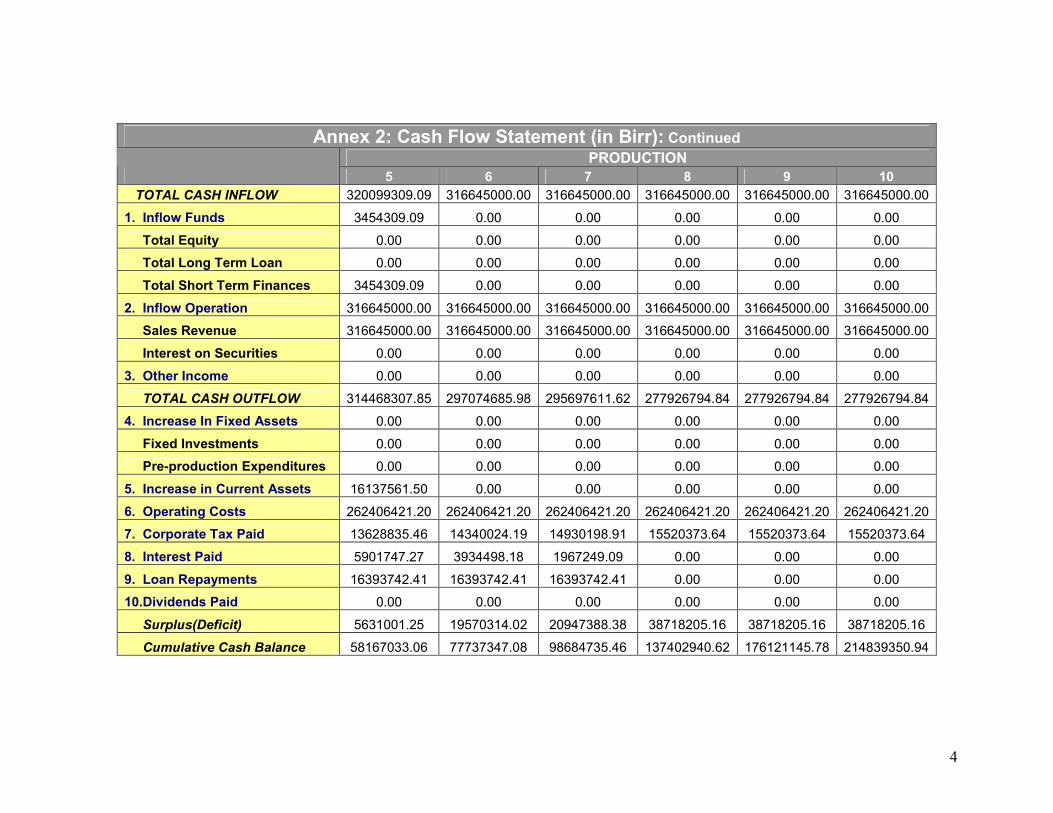
Annex 2: Cash Flow Statement (in Birr): Continued PRODUCTION
5 6 7 8 9 10
TOTAL CASH INFLOW 320099309.09 316645000.00 316645000.00 316645000.00 316645000.00 316645000.00
1. Inflow Funds 3454309.09 0.00 0.00 0.00 0.00 0.00
Total Equity 0.00 0.00 0.00 0.00 0.00 0.00
Total Long Term Loan 0.00 0.00 0.00 0.00 0.00 0.00
Total Short Term Finances 3454309.09 0.00 0.00 0.00 0.00 0.00
2. Inflow Operation 316645000.00 316645000.00 316645000.00 316645000.00 316645000.00 316645000.00
Sales Revenue 316645000.00 316645000.00 316645000.00 316645000.00 316645000.00 316645000.00
Interest on Securities 0.00 0.00 0.00 0.00 0.00 0.00
3. Other Income 0.00 0.00 0.00 0.00 0.00 0.00
TOTAL CASH OUTFLOW 314468307.85 297074685.98 295697611.62 277926794.84 277926794.84 277926794.84
4. Increase In Fixed Assets 0.00 0.00 0.00 0.00 0.00 0.00
Fixed Investments 0.00 0.00 0.00 0.00 0.00 0.00
Pre-production Expenditures 0.00 0.00 0.00 0.00 0.00 0.00
5. Increase in Current Assets 16137561.50 0.00 0.00 0.00 0.00 0.00
6. Operating Costs 262406421.20 262406421.20 262406421.20 262406421.20 262406421.20 262406421.20
7. Corporate Tax Paid 13628835.46 14340024.19 14930198.91 15520373.64 15520373.64 15520373.64
8. Interest Paid 5901747.27 3934498.18 1967249.09 0.00 0.00 0.00
9. Loan Repayments 16393742.41 16393742.41 16393742.41 0.00 0.00 0.00
10.Dividends Paid 0.00 0.00 0.00 0.00 0.00 0.00
Surplus(Deficit) 5631001.25 19570314.02 20947388.38 38718205.16 38718205.16 38718205.16
Cumulative Cash Balance 58167033.06 77737347.08 98684735.46 137402940.62 176121145.78 214839350.94

5
Annex 3: DISCOUNTED CASH FLOW-TOTAL CAPITAL INVESTED
CONSTRUCTION PRODUCTION
Year 1 Year 2 1 2 3 4
TOTAL CASH INFLOW 0.00 0.00 189987000.00 221651500.00 253316000.00 284980500.00
1. Inflow Operation 0.00 0.00 189987000.00 221651500.00 253316000.00 284980500.00
Sales Revenue 0.00 0.00 189987000.00 221651500.00 253316000.00 284980500.00
Interest on Securities 0.00 0.00 0.00 0.00 0.00 0.00
2. Other Income 0.00 0.00 0.00 0.00 0.00 0.00
TOTAL CASH OUTFLOW 18552450.00 18552450.00 233693839.20 196480601.25 231855225.85 260286867.46
3. Increase in Fixed Assets 18552450.00 18552450.00 0.00 0.00 0.00 0.00
Fixed Investments 17669000.00 17669000.00 0.00 0.00 0.00 0.00
Pre-production Expenditures 883450.00 883450.00 0.00 0.00 0.00 0.00
4. Increase in Net Working Capital 0.00 0.00 76099514.48 12683252.41 12683252.41 12683252.41
5. Operating Costs 0.00 0.00 157594324.72 183797348.84 210000372.96 236203397.08
6. Corporate Tax Paid 0.00 0.00 0.00 0.00 9171600.48 11400217.97
NET CASH FLOW -
18552450.00 -
18552450.00 -43706839.20 25170898.75 21460774.15 24693632.54
CUMMULATIVE NET CASH FLOW -
18552450.00 -
37104900.00 -80811739.20 -55640840.45 -34180066.30 -9486433.76
Net Present Value (at 18%) -
18552450.00 -
15722415.25 -31389571.39 15319786.07 11069228.56 10793814.36
Cumulative Net present Value -
18552450.00 -
34274865.25 -65664436.64 -50344650.57 -39275422.01 -28481607.65

6
Annex 3: DISCOUNTED CASH FLOW-TOTAL CAPITAL INVESTED (Continued) PRODUCTION
5 6 7 8 9 10
TOTAL CASH INFLOW 316645000.00 316645000.00 316645000.00 316645000.00 316645000.00 316645000.00
1. Inflow Operation 316645000.00 316645000.00 316645000.00 316645000.00 316645000.00 316645000.00
Sales Revenue 316645000.00 316645000.00 316645000.00 316645000.00 316645000.00 316645000.00
Interest on Securities 0.00 0.00 0.00 0.00 0.00 0.00
2. Other Income 0.00 0.00 0.00 0.00 0.00 0.00
TOTAL CASH OUTFLOW 288718509.07 276746445.39 277336620.11 277926794.84 277926794.84 277926794.84
3. Increase in Fixed Assets 0.00 0.00 0.00 0.00 0.00 0.00
Fixed Investments 0.00 0.00 0.00 0.00 0.00 0.00
Pre-production Expenditures 0.00 0.00 0.00 0.00 0.00 0.00
4. Increase in Net Working Capital 12683252.41 0.00 0.00 0.00 0.00 0.00
5. Operating Costs 262406421.20 262406421.20 262406421.20 262406421.20 262406421.20 262406421.20
6. Corporate Tax Paid 13628835.46 14340024.19 14930198.91 15520373.64 15520373.64 15520373.64
NET CASH FLOW 27926490.93 39898554.61 39308379.89 38718205.16 38718205.16 38718205.16
CUMMULATIVE NET CASH FLOW 18440057.16 58338611.78 97646991.66 136365196.82 175083401.98 213801607.14
Net Present Value (at 18%) 10344853.02 12525155.08 10457529.20 8729254.41 7397673.23 6269214.60
Cumulative Net present Value -18136754.63 -5611599.55 4845929.66 13575184.07 20972857.30 27242071.90
Net Present Value (at 18%) 27,242,071.90
Internal Rate of Return 26.4%
7
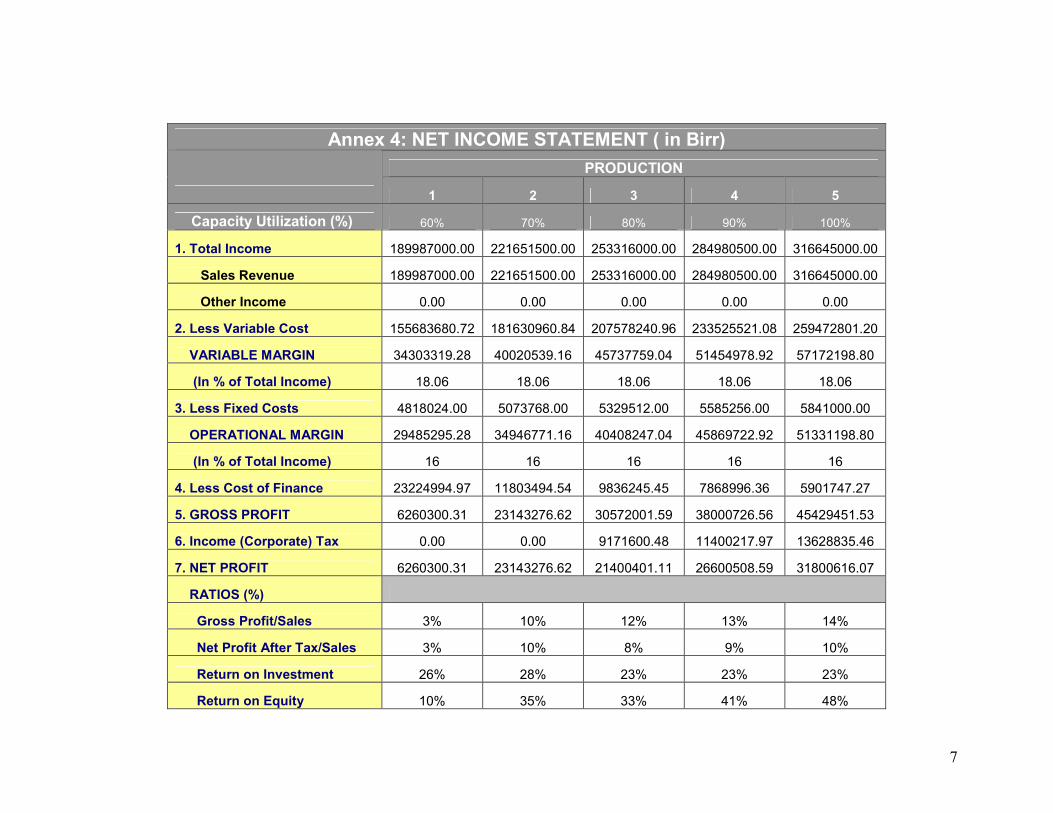
Annex 4: NET INCOME STATEMENT ( in Birr)
PRODUCTION
1 2 3 4 5
Capacity Utilization (%) 60% 70% 80% 90% 100%
1. Total Income 189987000.00 221651500.00 253316000.00 284980500.00 316645000.00
Sales Revenue 189987000.00 221651500.00 253316000.00 284980500.00 316645000.00
Other Income 0.00 0.00 0.00 0.00 0.00
2. Less Variable Cost 155683680.72 181630960.84 207578240.96 233525521.08 259472801.20
VARIABLE MARGIN 34303319.28 40020539.16 45737759.04 51454978.92 57172198.80
(In % of Total Income) 18.06 18.06 18.06 18.06 18.06
3. Less Fixed Costs 4818024.00 5073768.00 5329512.00 5585256.00 5841000.00
OPERATIONAL MARGIN 29485295.28 34946771.16 40408247.04 45869722.92 51331198.80
(In % of Total Income) 16 16 16 16 16
4. Less Cost of Finance 23224994.97 11803494.54 9836245.45 7868996.36 5901747.27
5. GROSS PROFIT 6260300.31 23143276.62 30572001.59 38000726.56 45429451.53
6. Income (Corporate) Tax 0.00 0.00 9171600.48 11400217.97 13628835.46
7. NET PROFIT 6260300.31 23143276.62 21400401.11 26600508.59 31800616.07
RATIOS (%)
Gross Profit/Sales 3% 10% 12% 13% 14%
Net Profit After Tax/Sales 3% 10% 8% 9% 10%
Return on Investment 26% 28% 23% 23% 23%
Return on Equity 10% 35% 33% 41% 48%

8
Annex 4: NET INCOME STATEMENT (in Birr):Continued
PRODUCTION
6 7 8 9 10
Capacity Utilization (%) 100% 100% 100% 100% 100%
1. Total Income 316645000.00 316645000.00 316645000.00 316645000.00 316645000.00
Sales Revenue 316645000.00 316645000.00 316645000.00 316645000.00 316645000.00
Other Income 0.00 0.00 0.00 0.00 0.00
2. Less Variable Cost 259472801.20 259472801.20 259472801.20 259472801.20 259472801.20
VARIABLE MARGIN 57172198.80 57172198.80 57172198.80 57172198.80 57172198.80
(In % of Total Income) 18 18 18 18 18
3. Less Fixed Costs 5437620.00 5437620.00 5437620.00 5437620.00 5437620.00
OPERATIONAL MARGIN 51734578.80 51734578.80 51734578.80 51734578.80 51734578.80
(In % of Total Income) 16 16 16 16 16
4. Less Cost of Finance 3934498.18 1967249.09 0.00 0.00 0.00
5. GROSS PROFIT 47800080.62 49767329.71 51734578.80 51734578.80 51734578.80
6. Income (Corporate) Tax 14340024.19 14930198.91 15520373.64 15520373.64 15520373.64
7. NET PROFIT 33460056.43 34837130.80 36214205.16 36214205.16 36214205.16
RATIOS (%)
Gross Profit/Sales 15% 16% 16% 16% 16%
Net Profit After Tax/Sales 11% 11% 11% 11% 11%
Return on Investment 23% 22% 22% 22% 22%
Return on Equity 51% 53% 55% 55% 55%

9
Annex 5: Projected Balance Sheet (in Birr)
CONSTRUCTION PRODUCTION
Year 1 Year 2 1 2 3 4
TOTAL ASSETS 18552450.00 163937424.13 190923578.98 201127422.28 209588390.07 223249465.35
1. Total Current Assets 0.00 126832524.13 156726058.98 169837282.28 181205630.07 197774085.35
Inventory on Materials and Supplies 0.00 0.00 62686785.68 73134583.29 83582380.90 94030178.52
Work in Progress 0.00 0.00 4309594.69 5027860.47 5746126.25 6464392.04
Finished Products in Stock 0.00 0.00 8619189.38 10055720.95 11492252.51 12928784.07
Accounts Receivable 0.00 0.00 20725854.55 24180163.64 27634472.73 31088781.82
Cash in Hand 0.00 0.00 483944.73 564602.18 645259.64 725917.09
Cash Surplus, Finance Available 0.00 126832524.13 59900689.96 56874351.75 52105138.04 52536031.81
Securities 0.00 0.00 0.00 0.00 0.00 0.00
2. Total Fixed Assets, Net of Depreciation 18552450.00 37104900.00 34197520.00 31290140.00 28382760.00 25475380.00
Fixed Investment 0.00 17669000.00 35338000.00 35338000.00 35338000.00 35338000.00
Construction in Progress 17669000.00 17669000.00 0.00 0.00 0.00 0.00
Pre-Production Expenditure 883450.00 1766900.00 1766900.00 1766900.00 1766900.00 1766900.00
Less Accumulated Depreciation 0.00 0.00 2907380.00 5814760.00 8722140.00 11629520.00
3. Accumulated Losses Brought Forward 0.00 0.00 0.00 0.00 0.00 0.00
4. Loss in Current Year 0.00 0.00 0.00 0.00 0.00 0.00
TOTAL LIABILITIES 18552450.00 163937424.13 190923578.98 201127422.28 209588390.07 223249465.35
5. Total Current Liabilities 0.00 0.00 20725854.55 24180163.64 27634472.73 31088781.82
Accounts Payable 0.00 0.00 20725854.55 24180163.64 27634472.73 31088781.82
Bank Overdraft 0.00 0.00 0.00 0.00 0.00 0.00
6. Total Long-term Debt 11131470.00 98362454.48 98362454.48 81968712.07 65574969.65 49181227.24
Loan A 11131470.00 98362454.48 98362454.48 81968712.07 65574969.65 49181227.24
Loan B 0.00 0.00 0.00 0.00 0.00 0.00
7. Total Equity Capital 7420980.00 65574969.65 65574969.65 65574969.65 65574969.65 65574969.65
Ordinary Capital 7420980.00 65574969.65 65574969.65 65574969.65 65574969.65 65574969.65
Preference Capital 0.00 0.00 0.00 0.00 0.00 0.00
Subsidies 0.00 0.00 0.00 0.00 0.00 0.00
8. Reserves, Retained Profits Brought Forward 0.00 0.00 0.00 6260300.31 29403576.93 50803978.04
9. Net Profit After Tax 0.00 0.00 6260300.31 23143276.62 21400401.11 26600508.59
Dividends Payable 0.00 0.00 0.00 0.00 0.00 0.00
Retained Profits 0.00 0.00 6260300.31 23143276.62 21400401.11 26600508.59

10
Annex 5: Projected Balance Sheet (in Birr): Continued
PRODUCTION
5 6 7 8 9 10
TOTAL ASSETS 242110648.10 259176962.12 277620350.50 313834555.66 350048760.82 386262965.98
1. Total Current Assets 219542648.10 239112962.12 260060350.50 298778555.66 337496760.82 376214965.98
Inventory on Materials and Supplies 104477976.13 104477976.13 104477976.13 104477976.13 104477976.13 104477976.13
Work in Progress 7182657.82 7182657.82 7182657.82 7182657.82 7182657.82 7182657.82
Finished Products in Stock 14365315.64 14365315.64 14365315.64 14365315.64 14365315.64 14365315.64
Accounts Receivable 34543090.91 34543090.91 34543090.91 34543090.91 34543090.91 34543090.91
Cash in Hand 806574.55 806574.55 806574.55 806574.55 806574.55 806574.55
Cash Surplus, Finance Available 58167033.06 77737347.08 98684735.46 137402940.62 176121145.78 214839350.94
Securities 0.00 0.00 0.00 0.00 0.00 0.00
2. Total Fixed Assets, Net of Depreciation 22568000.00 20064000.00 17560000.00 15056000.00 12552000.00 10048000.00
Fixed Investment 35338000.00 35338000.00 35338000.00 35338000.00 35338000.00 35338000.00
Construction in Progress 0.00 0.00 0.00 0.00 0.00 0.00
Pre-Production Expenditure 1766900.00 1766900.00 1766900.00 1766900.00 1766900.00 1766900.00
Less Accumulated Depreciation 14536900.00 17040900.00 19544900.00 22048900.00 24552900.00 27056900.00
3. Accumulated Losses Brought Forward 0.00 0.00 0.00 0.00 0.00 0.00
4. Loss in Current Year 0.00 0.00 0.00 0.00 0.00 0.00
TOTAL LIABILITIES 242110648.10 259176962.12 277620350.50 313834555.66 350048760.82 386262965.98
5. Total Current Liabilities 34543090.91 34543090.91 34543090.91 34543090.91 34543090.91 34543090.91
Accounts Payable 34543090.91 34543090.91 34543090.91 34543090.91 34543090.91 34543090.91
Bank Overdraft 0.00 0.00 0.00 0.00 0.00 0.00
6. Total Long-term Debt 32787484.83 16393742.41 0.00 0.00 0.00 0.00
Loan A 32787484.83 16393742.41 0.00 0.00 0.00 0.00
Loan B 0.00 0.00 0.00 0.00 0.00 0.00
7. Total Equity Capital 65574969.65 65574969.65 65574969.65 65574969.65 65574969.65 65574969.65
Ordinary Capital 65574969.65 65574969.65 65574969.65 65574969.65 65574969.65 65574969.65
Preference Capital 0.00 0.00 0.00 0.00 0.00 0.00
Subsidies 0.00 0.00 0.00 0.00 0.00 0.00
8. Reserves, Retained Profits Brought Forward 77404486.64 109205102.71 142665159.14 177502289.94 213716495.10 249930700.26
9. Net Profit After Tax 31800616.07 33460056.43 34837130.80 36214205.16 36214205.16 36214205.16
Dividends Payable 0.00 0.00 0.00 0.00 0.00 0.00
Retained Profits 31800616.07 33460056.43 34837130.80 36214205.16 36214205.16 36214205.16