Embed Size (px)
Citation preview

PM World Journal Project Quality Management for Project Managers Vol IV Issue VII ndash July 2015 T D Jainendrakumar wwwpmworldjournalnet Advisory
copy 2015 T D Jainendrakumar wwwpmworldlibrarynet Page 1 of 17
Project Quality Management for Project Managers
By Dr T D Jainendrakumar
Quality Management Quality is the degree to which the project fulfills requirements It includes
creating and following policies and procedures in order to ensure that a project meets the defined
needs it was intended to meet
Quality Theorists
Joseph Juanrsquos theory was based on 8020 principle he has told that the top management
involvement is a must to maintain quality Quality is fitness for use
W Edwards Deming has put forward 14 steps of total Quality Management he has described
Plan-Do-Check-Act cycle
Philip Crosbyrsquos theory says Cost of poor quality has to be taken care while producing a product
always prevention is better than cure that is ldquoprevention over inspectionrdquo and zero defects
Quality is ldquoconformance to requirementsrdquo (Just read from other books and have common
understanding about other Quality Gurus also)
Armand V Feigenbaum says Quality is a customer determination not an engineers
determination not a marketing determination [nlor a general management determination It is
based upon the customers actual experience with the product or service measured against his
or her requirements-stated or unstated conscious or merely sensed technically operational or
entirely subjective-and always representing a moving target in a competitive market
Kaoru Ishikawa Ishikawa makes it clear the proof of high quality is the satisfaction of ever
changing consumer expectations Ishikawas essential points are 1 Quality is equivalent to
consumer satisfaction 2 Quality must be defined comprehensively It is not enough to say the
product is of high quality we must focus attention on the quality of every facet of the
organization 3 Consumers needs and requirements change Therefore the definition of
quality is ever changing 4 The price of a product or service is an important part of its quality
Ishikawa writes that no matter how high the quality if the product is overpriced it cannot gain
customer satisfaction In other words one cannot define quality without considering price
ISO Compatibility PMPOKrsquos project quality management has some similarities with the ISOrsquos compatibility some of them
are as follows
Customer Satisfaction ( PMBOK amp ISO focused in Customer Satisfaction)
Prevention over inspection (both says prevention is better than cure)
PM World Journal Project Quality Management for Project Managers Vol IV Issue VII ndash July 2015 T D Jainendrakumar wwwpmworldjournalnet Advisory
copy 2015 T D Jainendrakumar wwwpmworldlibrarynet Page 2 of 17
Continuous improvement (There are always scope for improvements after
improvements)
Management Responsibility ( Quality Consciousness in the management team is
must)
Cost of Quality (COQ) ( To maintain quality we have to spend some money)
Plan Quality Management
This is the first process in this knowledge area which comes under planning process group and this is for Identifying quality requirement and or standards for the project and its deliverables and documenting how the project will demonstrate compliance with the relevant quality requirements
Plan Quality Inputs
1 Project Management Plan includes but not limited to
a Scope baseline
b Work Breakdown Structure
c WBS Dictionary
d Schedule baseline
e Cost baseline
f Other management Plans
2 Stakeholder Register (identified stake holder details)
3 Risk register (details of risk and opportunities and its impact on the project)
4 Requirements Documentation (this contains the details for project team on how quality control
will be implemented on the project)
5 Enterprise environmental factor (Rules and regulations of government agencies)
6 Organizational process assets (Organizational policies procedures historical information
lessons learned etc)
Plan Quality T amp T
1 Cost-benefit Analysis
2 Cost of Quality (COQ)
3 Seven Basic Quality Tools
a) Cause-and-Effect Diagram
b) Flowcharts
c) Check-sheet
d) Pareto Diagram
e) Histograms
f) Control Charts
g) Scatter Diagram
4 Benchmarking
5 Design of Experiments
PM World Journal Project Quality Management for Project Managers Vol IV Issue VII ndash July 2015 T D Jainendrakumar wwwpmworldjournalnet Advisory
copy 2015 T D Jainendrakumar wwwpmworldlibrarynet Page 3 of 17
6 Statistical Sampling
7 Additional Quality Tools
a) Brainstorming
b) Force field analysis (It provides a framework for looking at the factors (forces) that
influence a situation It looks at forces that are either driving movement toward a
goal (helping forces) or blocking movement toward a goal (hindering forces)
c) Nominal Group Technique
d) Quality Management and control tools (There are hundreds of tools one has to
study just in time depending on the need)
8 Meetings
Cost-benefit Analysis Assessing the Cost incurred towards the revenue generated out of the project and other intangible benefits Benefit should have prominence over cost The primary benefit of meeting quality requirements is less rework ie higher productivity lower costs and increased stakeholder satisfaction and the primary cost of meeting quality requirements is the expenses associated with quality management activities
Cost of Quality There are two type of cost of quality are Cost of conformance and the Cost of Non Conformance Cost of Conformance has again divided to two that are prevention cost and appraisal cost Prevention cost is the expenditure made for building a quality product such as training documentation processes and equipments for testing etc Appraisal Cost is the cost incurred for assessing the quality such as Testing Inspection losses incurred in destructive testing etc And the cost of Nonconformance also has two parts first one is internal failure cost and the second is External Failure Cost Internal failure found by quality control department results in rework or scrapping the product similarly failure can be detected by the customers also in the scope validation process that is external failure this costs heavily it can damage the reputation of the company and lost business liabilities like arbitration litigation warranty replacements or re-work etc Cause and Effect Diagram To trace the problemrsquos source back to its ldquoactionable root causerdquo
PM World Journal Project Quality Management for Project Managers Vol IV Issue VII ndash July 2015 T D Jainendrakumar wwwpmworldjournalnet Advisory
copy 2015 T D Jainendrakumar wwwpmworldlibrarynet Page 4 of 17
Effect on the head and causes are on the bones each individual bone or section can then be broken down further into another fishbone of individual items for analysis and suitable action can be initiated In the above diagram the effect edge flaws in production can be due to operators fault machine fault fault in the materials used methods or process fault and each main bourn is further divided to reach in to the exact problems for corrective action
Flowcharting A graphical representation of a process showing the logical relationships among process steps to find out flaws in processes for example process related to supplier input to the processes output delivered to the customer etc can be monitored
Tally Sheets
In the above tally sheet errors are observed and marked the defects in a tally sheet as shown above and can do a research on the problems identified and appropriate measures can be taken to reduce the defects
PM World Journal Project Quality Management for Project Managers Vol IV Issue VII ndash July 2015 T D Jainendrakumar wwwpmworldjournalnet Advisory
copy 2015 T D Jainendrakumar wwwpmworldlibrarynet Page 5 of 17
Pareto Diagram
The left vertical axis (border) shows the frequency of problems for each problem category and the right vertical axis shows the cumulative percentage of each problem of the total problems The horizontal axis (bottom) lists the defective items starting with the most frequent one on the left (unable to download) progressing over to the least frequent occurrence on the right side (doesnrsquot work in open office) Here the reason for failure in a file transaction is analyzed The cumulative points are marked as dots and a line is drawn through those dots as shown in the figure then there is a curve and a dotted line is drawn from the middle of the curve shows that 80 of the problems are due to the 49 of causes like unable to down load canrsquot find file opens as read-only etc Therefore the Pareto diagram visually indicates which problem should be solved first as listed above With this bar graph it is easier to see which problems are most important of the entire problem that exists If we solve all of this 49 of problems other problems will be automatically dissolve or easy to solve
Histogram
PM World Journal Project Quality Management for Project Managers Vol IV Issue VII ndash July 2015 T D Jainendrakumar wwwpmworldjournalnet Advisory
copy 2015 T D Jainendrakumar wwwpmworldlibrarynet Page 6 of 17
Histogram is the bar chart which shows the distribution of data The above histogram It is useful in understanding the number of customers willing to wait against the number of minutes on hold in a call centre From the above histogram we can decide why the customers has to wait more than 3 minutes to 7 minutes and take appropriate action to reduce waiting time to less than 3 minutes Histograms are generated by some of the project management software like primavera while allocating resourcersquos times to the project activities and when the resources are over allocated and over loaded the bar chart in the histogram shows red from that point If we level the resource automatically the software will do it by increasing the project duration Control Charts
Graphic displays of the results over time of a process and it is used to assess whether the
process is ldquoin controlrdquo
Upper control limit (UCL) value is given by the customer and lower control limit is set internally
by the project team
RUN - When several plotted points line up consecutively on one side of a Central Line (CL)
whether it is located above or below the CL it is called a run Rule of Seven if there are 7
points in a row on one side of the CL there is an abnormality in the process and it requires an
adjustment
TREND - If there is a continued rise or fall in a series of points (like an upward or downward
slant) it is considered a trend and usually indicates a process is drifting out of control
Assignable causes ndash Variations may be caused by differences in machines workers overtime
etc Identify the root cause and stream line the process
PM World Journal Project Quality Management for Project Managers Vol IV Issue VII ndash July 2015 T D Jainendrakumar wwwpmworldjournalnet Advisory
copy 2015 T D Jainendrakumar wwwpmworldlibrarynet Page 7 of 17
Scatter Diagram
In the above example you can see that the dots which are actually data points have various relationships The Negative and linear correlation indicates that there is a close relationship between the reliability of the product and the temperature settings as temperature increases reliability of the product decreases
If the dot pattern indicating is in the opposite direction as shown in fig (a) implies that as the temperature increases reliability of the product is also increasing this is a Positive and linear Correlation
If the dots are as in fig (c) it shows negative non-linear relationships
PM World Journal Project Quality Management for Project Managers Vol IV Issue VII ndash July 2015 T D Jainendrakumar wwwpmworldjournalnet Advisory
copy 2015 T D Jainendrakumar wwwpmworldlibrarynet Page 8 of 17
In some cases dots will be scattered as in fig (d) means there is no correlation or no relationship at all between the temperature and reliability of the product
Benchmarking Benchmarking involves comparing actual or planned project practices to those of other projects in order to generate ideas for improvement and to provide a standard by which to measure performance These other projects may be within the performing organization or outside of it and may be within the same or in another application area Design of Experiment Design of experiments is a statistical method that helps identify which factors might influence specific variables It also plays a role in the optimization of products or processes Eg A floor designer might want to determine which combination of materials and equipment will produce reliable tiles at a reasonable cost Appropriately designed experiments will compute various combinations to select and select the most appropriate combination of materials to produce the tile Statistical Sampling Statistical sampling involves choosing part of a population of interest for inspection (eg selecting 10 samples of 75 electronic components) Appropriate sampling can often reduce the cost of quality control There is a substantial body of knowledge on statistical sampling in some application areas it is necessary for the project management team to be familiar with a variety of sampling techniques Plan Quality Management Outputs
1 Quality Management Plan (specifies the application of a quality policy of an organization to a
specific project)
2 Process Improvement Plan There are always scope for improvement in
Process Boundaries(the purpose of the process duration process owner and
stakeholders)
Process Configuration (Process under operations and their interaction levels)
Process Metrics (Analyzes the efficiency of the matrix)
Targets for Improved Performance
3 Quality Metrics (Product quality parameters are generated in a matrix form and ldquowhat gets
measured gets done)
4 Quality Checklist (Quality Check List(To Do List) to verify at the time of Quality Control
Checking)
5 Project Documents Updates (Responsibility assignment matrix WBS WBS dictionary and
Stakeholder register are updated)
PM World Journal Project Quality Management for Project Managers Vol IV Issue VII ndash July 2015 T D Jainendrakumar wwwpmworldjournalnet Advisory
copy 2015 T D Jainendrakumar wwwpmworldlibrarynet Page 9 of 17
Perform Quality Assurance This is the second process in the project Quality management knowledge area which comes under execution process group for auditing the quality requirements and the results from quality control measurement to ensure that appropriate quality standards and operational definitions are used The key benefit of this process is that it facilitates the improvement of quality processes Perform Quality Assurance Input
1 Quality Management Plan (It specifies the quality management approach and process
improvement for the project)
2 Process Improvement Plan (the quality assurance activities and quality management plan
should be in aligned with the organizations process improvement plans0
3 Quality Metrics (These quality metrics parameters should be measured at regular intervals to
assure quality)
4 Quality Control Measurements (The output of quality control process is used as an input for
quality assurance)
5 Project Documents include process improvements procedures and formats
Perform Quality Assurance T amp T
1 Quality Management and Control Tools
Affinity Diagrams
Process Decision Program Charts
Interrelationship Digraphs
Tree Diagrams
Prioritization Matrices
Activity Network Diagram
Matrix Diagrams
2 Quality Audits are conducted to see that the standards are maintained in using the materials
best practices are followed whether any nonconformities are existing etc
3 Process Analysis (Whether the processes are in order and to determine any flows in the process
or to suggest further improvements etc)
PM World Journal Project Quality Management for Project Managers Vol IV Issue VII ndash July 2015 T D Jainendrakumar wwwpmworldjournalnet Advisory
copy 2015 T D Jainendrakumar wwwpmworldlibrarynet Page 10 of 17
Affinity diagram Affinity diagrams are a special kind of brainstorming tool that organize large amounts of disorganized data and information into groupings based on natural relationships Affinity diagram can be in any form like tree structure of the WBS etc in this you can also diagrammatically record the affinity of the customer towards certain requirements at the time of requirement gathering and for quality management and risk management etc and you can show this diagram to the customer at the time of scope validation to make a positive impression about you and your company to build trust and brand
Process Decision Program Charts A useful way of planning is to break down tasks into a hierarchy using a tree diagram The PDPC extends the tree diagram a couple of levels to identify risks and countermeasures for the bottom level tasks Different shaped boxes are used to highlight risks and identify possible countermeasures (often shown as clouds to indicate their uncertain nature) The PDPC is similar to the Failure Modes and Effects Analysis (FMEA) in that both identify risks consequences of failure and contingency actions the FMEA also rates relative risk levels for each potential failure point
PM World Journal Project Quality Management for Project Managers Vol IV Issue VII ndash July 2015 T D Jainendrakumar wwwpmworldjournalnet Advisory
copy 2015 T D Jainendrakumar wwwpmworldlibrarynet Page 11 of 17
Interrelationship Digraphs Process interrelation ship diagram can be drawn as given above to understand the relationships of activities within a complex process This tool displays all the interrelated cause-and-effect relationships and factors involved in a complex problem and describe desired outcomes The process of creating an interrelationship digraph helps a group analyze the natural links between different aspects of a complex situation Example A local physiciansrsquo group is experiencing a relatively high number of patient complaints regarding the lack of returned phone calls following a patient visit where some kind of test was ordered In particular the patients are frustrated that the promised call notifying them of the test results is either delayed or must be initiated by the patient The office manager of the group conducts a brainstorming session to generate potential reasons for the lack of effective and timely follow-up calls The group then takes the brainstormed list and organizes the potential reasons using an interrelationship diagram The basic idea is to count the number of ldquoinrdquo and ldquooutrdquo arrows to and from a particular issue and to use these counts to assist you in prioritizing the issues In the interrelationship diagram above ldquoOverly optimistic promise dates for follow-up callsrdquo is a key issue and of course would cause patients to expect a phone call faster than the group believes it can deliver it However do not summarily ignore or devalue the importance of issues with few ldquoinrdquo and ldquooutrdquo arrows until you have verified empirically the influence of these issues
PM World Journal Project Quality Management for Project Managers Vol IV Issue VII ndash July 2015 T D Jainendrakumar wwwpmworldjournalnet Advisory
copy 2015 T D Jainendrakumar wwwpmworldlibrarynet Page 12 of 17
Tree Diagrams This tool is used to break down broad categories into finer and finer levels of detail eg WBS
Prioritization Matrices Prioritization matrix is used to prioritize items and describe them in terms of weighted criteria It uses a combination of tree and matrix diagramming techniques to do a pair-wise evaluation of items and to narrow down options to the most desired or most effective Popular applications for the Prioritization Matrix include return on investment (ROI) or Costndashbenefit analysis (investment vs return) time management matrix (urgency vs importance) and Risk management etc Activity Network Diagram This tool is used to plan the appropriate sequence or schedule for a set of tasks and related subtasks It is used when subtasks must occur in parallel The diagram helps in determining the critical path (longest sequence of tasks) Matrix Diagrams This tool shows the relationship between items At each intersection a relationship is either absent or present It then gives information about the relationship such as its strength the roles played by various individuals or measurements Six differently shaped matrices are possible L T Y X C R and roof-shaped depending on how many groups must be compared
PM World Journal Project Quality Management for Project Managers Vol IV Issue VII ndash July 2015 T D Jainendrakumar wwwpmworldjournalnet Advisory
copy 2015 T D Jainendrakumar wwwpmworldlibrarynet Page 13 of 17
Perform Quality Assurance Output
1 Change Requests (if there is any variations in the quality management plan change request has
to be raised and this changes has to be approved or rejected through perform integrated
change control process and approved changes has to be given to the perform quality assurance)
2 Project Management Plan Updates (Quality management plan scope schedule management
plan and cost management plan will get updated
3 Project Documents Updates (Audit reports are prone to changes training plans etc may require
an updation )
4 Organizational Process Assets (Quality documents and standards get updated)
Control Quality This is the third and final process in this knowledge area which comes under monitoring and control process groups for Performing Quality Control It is the process of monitoring and recording results of executing the quality activities to assess performance and recommend necessary changes The key benefits of this process include
Identifying the causes of poor quality
Validating that project deliverables and work meet the requirements
Important Quality terms
Prevention (Keeping errors out of the process) vs Inspection (Keeping errors out of the hands
of the customer) The methods used are sampling In Attribute sampling products are checked
and see whether it meets the conformance to requirement or not But in Variables sampling
checks the degree of conformity in terms of the specification and functionalities of the product
PM World Journal Project Quality Management for Project Managers Vol IV Issue VII ndash July 2015 T D Jainendrakumar wwwpmworldjournalnet Advisory
copy 2015 T D Jainendrakumar wwwpmworldlibrarynet Page 14 of 17
Tolerance means range of acceptable results and control limits means threshold which may
indicate out of control
There is a tradeoff between Quality and Grade quality is conformance to requirement let us
take a base model of Honda Car even though this car has lower in grade than Mercedes Benz (S
class) if it meets the functionalities offered to its customers it has quality Benz S class is
higher in grade than base model of Honda if it doesnrsquot fulfill the functionalities offered to the
customer then this car is lacking quality This is the difference between grade and quality
Control Quality Input
1 Project Management Plan
2 Quality Metrics (describes the attributes of product or project and how it is measured)
3 Quality checklists (Checklist of list of requirements )
4 Work Performance Data (Actual work performance details)
5 Approved Change Requests (output of perform integrated change control process)
6 Deliverables (will be checked for correctness in this process)
7 Project Documents (Agreements Quality audit reports change log training plan etc)
8 Organizational Process Assets (Organizational procedures for quality standards work
guidelines issues and defect reporting procedures etc)
Control Quality T amp T
1 Seven Basic Quality Tools (described above0
2 Statistical Sampling (Samples are tested for acceptance or rejection of a lot )
3 Inspection (confirmation of deliverables to exact requirements for keeping errors out of the
hands of customer)
4 Approved Change Request Reviews (all the change requests that are approved will be reviewed
in this process and see that the changes are implemented)
Control Quality Output
1 Quality Control Measurements are the outcome of the quality control process
2 Validated Changes (see that change requests are implemented)
3 Verified Deliverables (confirmation of deliverables to exact requirements)
4 Work Performance Information (Comparing actual work done with the planned work and
decision making information are generated)
5 Change Requests (if the changes are not implemented properly change requests are raised)
PM World Journal Project Quality Management for Project Managers Vol IV Issue VII ndash July 2015 T D Jainendrakumar wwwpmworldjournalnet Advisory
copy 2015 T D Jainendrakumar wwwpmworldlibrarynet Page 15 of 17
6 Project Management Plan Updates (Changes will result in the updation of Quality management
plan and process improvement plans)
7 Project Document Updates (quality related documents and process improvement documents
are updated)
8 Organizational Process Assets Updates (Completed checklists lessons learned documentation
etc)
Follow above processes as and when needed to ensure that a project meets the defined needs it was
intended to meet and thus the project managers can ensure the quality
______________________________
References
1 PMBOK 5th edition
2 Project Management a systems Approach to Planning scheduling and control by HAROLD
KERZNER PHD
3 httpingenieriaudeaeduco~cpatinoGestion20Proces202Que20es20calidad20-
20Clase201pdf
4 httpthequalitywebcomcausehtml
5 httpswwwgooglecoinsearchq=Tally+sheet+diagramampes_sm=93amptbm=ischampimgil=Qptt30
SWGhhwyM253A253BvZ1kNNCUW6ZTmM253Bhttp25253A25252F25252Fsyqueco
m25252Fquality_tools25252Ftools25252FTools27htmampsource=iuamppf=mampfir=Qptt30SWG
hhwyM253A252CvZ1kNNCUW6ZTmM252C_ampusg=__-
lW4DpWdXSeWlrwcNGu4eK35mnY3Dampbiw=1280ampbih=699ampved=0CDMQyjcampei=D-
a3VJ3dMcXHuASZ1oKYCwimgdii=_ampimgrc=Qptt30SWGhhwyM253A3BvZ1kNNCUW6ZTmM
3Bhttp253A252F252Fsyquecom252Fquality_tools252Ftools252FTools27_files252
Fimage001gif3Bhttp253A252F252Fsyquecom252Fquality_tools252Ftools252FTool
s27htm3B3423B262
6 httpswwwgooglecoinsearchq=pareto+diagramampes_sm=93ampbiw=1280ampbih=699amptbm=isc
hampimgil=NZjhs9kd63znSM253A253BYBv_L3DVZEmKqM253Bhttp25253A25252F2525
2Fwwwvertex42com25252FExcelTemplates25252Fpareto-
charthtmlampsource=iuamppf=mampfir=NZjhs9kd63znSM253A252CYBv_L3DVZEmKqM252C_ampus
g=__q7q7k8Ml56mG4uYhdXSZa7SagoA3Dampved=0CD4Qyjcampei=2-a3VPufDM-
IuAS99IDoDQimgdii=_ampimgrc=NZjhs9kd63znSM253A3BYBv_L3DVZEmKqM3Bhttp253A
252F252Fwwwvertex42com252FExcelTemplates252FImages252Fpareto-
chart_largegif3Bhttp253A252F252Fwwwvertex42com252FExcelTemplates252Fpar
eto-charthtml3B5403B361
7 httpswwwgooglecoinsearchq=Scatter+Diagramampes_sm=93amptbm=ischampimgil=TdYFI3kF08
TjNM253A253BuvWDyQPL60_QuM253Bhttp25253A25252F25252Fwwwemathzone
com25252Ftutorials25252Fbasic-statistics25252Fscatter-
diagramhtmlampsource=iuamppf=mampfir=TdYFI3kF08TjNM253A252CuvWDyQPL60_QuM252C_
ampusg=__mInaeJbZ-
PM World Journal Project Quality Management for Project Managers Vol IV Issue VII ndash July 2015 T D Jainendrakumar wwwpmworldjournalnet Advisory
copy 2015 T D Jainendrakumar wwwpmworldlibrarynet Page 16 of 17
qtEjotk13LB6X5PBT83Dampbiw=1280ampbih=699ampved=0CCUQyjcampei=lLS4VLa4I9GOuATl74GICgi
mgdii=_ampimgrc=TdYFI3kF08TjNM253A3BuvWDyQPL60_QuM3Bhttp253A252F252Fw
wwemathzonecom252Fbasic-stat252Fscatter-
diagram252Fclip_image003jpg3Bhttp253A252F252Fwwwemathzonecom252Ftutor
ials252Fbasic-statistics252Fscatter-diagramhtml3B6003B445
8 httpswwwgooglecoinsearchq=affinity+diagramsampes_sm=93amptbm=ischampimgil=sFsYxC7a5s
FhhM253A253B04mnepnN7hsCJM253Bhttp25253A25252F25252Fwww2mitreorg
25252Fwork25252Fsepo25252Ftoolkits25252Frisk25252Fprocedures25252FAffinityDia
gramshtmlampsource=iuamppf=mampfir=sFsYxC7a5sFhhM253A252C04mnepnN7hsCJM252C_ampu
sg=__ogFM5PALQnm7mwPc9g6BYgHWSgU3Dampbiw=1280ampbih=699ampved=0CDEQyjcampei=ZhC6
VKC-
MpCjugT10oHgDgimgdii=_ampimgrc=sFsYxC7a5sFhhM253A3B04mnepnN7hsCJM3Bhttp2
53A252F252Fwww2mitreorg252Fwork252Fsepo252Ftoolkits252Frisk252Fprocedu
res252Fimages252Faffinity_diagramjpg3Bhttp253A252F252Fwww2mitreorg252F
work252Fsepo252Ftoolkits252Frisk252Fprocedures252FAffinityDiagramshtml3B546
3B347
9 httpsyquecomquality_toolstoolsTOOLS12htm
10 httpwwwsixsigmadailycommethodologyinterrelationship-diagram
11 httpsinsearchyahoocomyhssearchp=Tree+Diagrams+amphspart=tataamphsimp=yhs-
photon_001amptype=tatafp
PM World Journal Project Quality Management for Project Managers Vol IV Issue VII ndash July 2015 T D Jainendrakumar wwwpmworldjournalnet Advisory
copy 2015 T D Jainendrakumar wwwpmworldlibrarynet Page 17 of 17
About the Author
Dr T D Jainendrakumar
Dr T D Jainendrakumar PhD MCA PMP is an international PMP trainer EX-ScientistPrincipal ScientistJoint Director NIC
Ministry of Information and Communication Technology Government of India Madhyapradesh He has over 25 yearsrsquo of extensive experience in the areas of IT Project management in e-governance at Ernakulam District Collectorate District Courts of Kerala Central Administrative Tribunal Ernakulam Rajeev Gandhi National Drinking Water Mission (400 crore project) New Delhi and Principal Systems Analyst in National Informatics Centre Madhya Pradesh State Centre especially in the following areas of specialization IT practice management (Project Management Methodologies Tools and techniques Standards amp Knowledge)IT Infrastructure Management (Project Governance Assessment Organisational Instructions amp Facilities and Equipments) IT-Resource Integration Management (Resource Management Training amp Education Career Development amp Team Development)IT-Technical Support (Project Mentoring Project Planning Project Auditing and Project Recovery) and Business Alignment Management (Project Portfolio management Customer Relationship Management Vendor Management amp Business performance management) Teaching Project Management amp ICT Subjects for professionals and post graduates Master of Computer Applications (MCA) a 3 year post graduate course dealing with software Engineering and Project Management from a premier institute Anna University Campus He is a PMP of PMI USA since 2008 Resource person of PMI you can see his name in the PMBOK 4th edition and 5th edition published by PMI USA under the list of contributors for project management Scored 411 out of 5 in the project management (2005) examination conducted by brainbenchcom secured a Masters Certificate in Project Management and is one among the top scorers (First in India and 3rd position in the world in the experienced category) Published many international journal papers in PM World Today having cumulative index factors more than 2 in the areas of specialization of Project Management amp Information Technology Holding a Honrsquo Doctorate from Cosmopolitan University USA in Project Management amp Information Technology Presently working as an independent project management consultant and an International Project Management (PMP) trainer Provided PMP training to the senior officials of big MNCs like MS Earnest amp Young and He is a visiting professor and sharing his knowledge and experience and to handle classes in Management Information Systems Quality Management Project Management and Software Engineering to some of the big universities He can be contacted at jainendrakumartdymailcom

PM World Journal Project Quality Management for Project Managers Vol IV Issue VII ndash July 2015 T D Jainendrakumar wwwpmworldjournalnet Advisory
copy 2015 T D Jainendrakumar wwwpmworldlibrarynet Page 3 of 17
6 Statistical Sampling
7 Additional Quality Tools
a) Brainstorming
b) Force field analysis (It provides a framework for looking at the factors (forces) that
influence a situation It looks at forces that are either driving movement toward a
goal (helping forces) or blocking movement toward a goal (hindering forces)
c) Nominal Group Technique
d) Quality Management and control tools (There are hundreds of tools one has to
study just in time depending on the need)
8 Meetings
Cost-benefit Analysis Assessing the Cost incurred towards the revenue generated out of the project and other intangible benefits Benefit should have prominence over cost The primary benefit of meeting quality requirements is less rework ie higher productivity lower costs and increased stakeholder satisfaction and the primary cost of meeting quality requirements is the expenses associated with quality management activities
Cost of Quality There are two type of cost of quality are Cost of conformance and the Cost of Non Conformance Cost of Conformance has again divided to two that are prevention cost and appraisal cost Prevention cost is the expenditure made for building a quality product such as training documentation processes and equipments for testing etc Appraisal Cost is the cost incurred for assessing the quality such as Testing Inspection losses incurred in destructive testing etc And the cost of Nonconformance also has two parts first one is internal failure cost and the second is External Failure Cost Internal failure found by quality control department results in rework or scrapping the product similarly failure can be detected by the customers also in the scope validation process that is external failure this costs heavily it can damage the reputation of the company and lost business liabilities like arbitration litigation warranty replacements or re-work etc Cause and Effect Diagram To trace the problemrsquos source back to its ldquoactionable root causerdquo
PM World Journal Project Quality Management for Project Managers Vol IV Issue VII ndash July 2015 T D Jainendrakumar wwwpmworldjournalnet Advisory
copy 2015 T D Jainendrakumar wwwpmworldlibrarynet Page 4 of 17
Effect on the head and causes are on the bones each individual bone or section can then be broken down further into another fishbone of individual items for analysis and suitable action can be initiated In the above diagram the effect edge flaws in production can be due to operators fault machine fault fault in the materials used methods or process fault and each main bourn is further divided to reach in to the exact problems for corrective action
Flowcharting A graphical representation of a process showing the logical relationships among process steps to find out flaws in processes for example process related to supplier input to the processes output delivered to the customer etc can be monitored
Tally Sheets
In the above tally sheet errors are observed and marked the defects in a tally sheet as shown above and can do a research on the problems identified and appropriate measures can be taken to reduce the defects
PM World Journal Project Quality Management for Project Managers Vol IV Issue VII ndash July 2015 T D Jainendrakumar wwwpmworldjournalnet Advisory
copy 2015 T D Jainendrakumar wwwpmworldlibrarynet Page 5 of 17
Pareto Diagram
The left vertical axis (border) shows the frequency of problems for each problem category and the right vertical axis shows the cumulative percentage of each problem of the total problems The horizontal axis (bottom) lists the defective items starting with the most frequent one on the left (unable to download) progressing over to the least frequent occurrence on the right side (doesnrsquot work in open office) Here the reason for failure in a file transaction is analyzed The cumulative points are marked as dots and a line is drawn through those dots as shown in the figure then there is a curve and a dotted line is drawn from the middle of the curve shows that 80 of the problems are due to the 49 of causes like unable to down load canrsquot find file opens as read-only etc Therefore the Pareto diagram visually indicates which problem should be solved first as listed above With this bar graph it is easier to see which problems are most important of the entire problem that exists If we solve all of this 49 of problems other problems will be automatically dissolve or easy to solve
Histogram
PM World Journal Project Quality Management for Project Managers Vol IV Issue VII ndash July 2015 T D Jainendrakumar wwwpmworldjournalnet Advisory
copy 2015 T D Jainendrakumar wwwpmworldlibrarynet Page 6 of 17
Histogram is the bar chart which shows the distribution of data The above histogram It is useful in understanding the number of customers willing to wait against the number of minutes on hold in a call centre From the above histogram we can decide why the customers has to wait more than 3 minutes to 7 minutes and take appropriate action to reduce waiting time to less than 3 minutes Histograms are generated by some of the project management software like primavera while allocating resourcersquos times to the project activities and when the resources are over allocated and over loaded the bar chart in the histogram shows red from that point If we level the resource automatically the software will do it by increasing the project duration Control Charts
Graphic displays of the results over time of a process and it is used to assess whether the
process is ldquoin controlrdquo
Upper control limit (UCL) value is given by the customer and lower control limit is set internally
by the project team
RUN - When several plotted points line up consecutively on one side of a Central Line (CL)
whether it is located above or below the CL it is called a run Rule of Seven if there are 7
points in a row on one side of the CL there is an abnormality in the process and it requires an
adjustment
TREND - If there is a continued rise or fall in a series of points (like an upward or downward
slant) it is considered a trend and usually indicates a process is drifting out of control
Assignable causes ndash Variations may be caused by differences in machines workers overtime
etc Identify the root cause and stream line the process
PM World Journal Project Quality Management for Project Managers Vol IV Issue VII ndash July 2015 T D Jainendrakumar wwwpmworldjournalnet Advisory
copy 2015 T D Jainendrakumar wwwpmworldlibrarynet Page 7 of 17
Scatter Diagram
In the above example you can see that the dots which are actually data points have various relationships The Negative and linear correlation indicates that there is a close relationship between the reliability of the product and the temperature settings as temperature increases reliability of the product decreases
If the dot pattern indicating is in the opposite direction as shown in fig (a) implies that as the temperature increases reliability of the product is also increasing this is a Positive and linear Correlation
If the dots are as in fig (c) it shows negative non-linear relationships
PM World Journal Project Quality Management for Project Managers Vol IV Issue VII ndash July 2015 T D Jainendrakumar wwwpmworldjournalnet Advisory
copy 2015 T D Jainendrakumar wwwpmworldlibrarynet Page 8 of 17
In some cases dots will be scattered as in fig (d) means there is no correlation or no relationship at all between the temperature and reliability of the product
Benchmarking Benchmarking involves comparing actual or planned project practices to those of other projects in order to generate ideas for improvement and to provide a standard by which to measure performance These other projects may be within the performing organization or outside of it and may be within the same or in another application area Design of Experiment Design of experiments is a statistical method that helps identify which factors might influence specific variables It also plays a role in the optimization of products or processes Eg A floor designer might want to determine which combination of materials and equipment will produce reliable tiles at a reasonable cost Appropriately designed experiments will compute various combinations to select and select the most appropriate combination of materials to produce the tile Statistical Sampling Statistical sampling involves choosing part of a population of interest for inspection (eg selecting 10 samples of 75 electronic components) Appropriate sampling can often reduce the cost of quality control There is a substantial body of knowledge on statistical sampling in some application areas it is necessary for the project management team to be familiar with a variety of sampling techniques Plan Quality Management Outputs
1 Quality Management Plan (specifies the application of a quality policy of an organization to a
specific project)
2 Process Improvement Plan There are always scope for improvement in
Process Boundaries(the purpose of the process duration process owner and
stakeholders)
Process Configuration (Process under operations and their interaction levels)
Process Metrics (Analyzes the efficiency of the matrix)
Targets for Improved Performance
3 Quality Metrics (Product quality parameters are generated in a matrix form and ldquowhat gets
measured gets done)
4 Quality Checklist (Quality Check List(To Do List) to verify at the time of Quality Control
Checking)
5 Project Documents Updates (Responsibility assignment matrix WBS WBS dictionary and
Stakeholder register are updated)
PM World Journal Project Quality Management for Project Managers Vol IV Issue VII ndash July 2015 T D Jainendrakumar wwwpmworldjournalnet Advisory
copy 2015 T D Jainendrakumar wwwpmworldlibrarynet Page 9 of 17
Perform Quality Assurance This is the second process in the project Quality management knowledge area which comes under execution process group for auditing the quality requirements and the results from quality control measurement to ensure that appropriate quality standards and operational definitions are used The key benefit of this process is that it facilitates the improvement of quality processes Perform Quality Assurance Input
1 Quality Management Plan (It specifies the quality management approach and process
improvement for the project)
2 Process Improvement Plan (the quality assurance activities and quality management plan
should be in aligned with the organizations process improvement plans0
3 Quality Metrics (These quality metrics parameters should be measured at regular intervals to
assure quality)
4 Quality Control Measurements (The output of quality control process is used as an input for
quality assurance)
5 Project Documents include process improvements procedures and formats
Perform Quality Assurance T amp T
1 Quality Management and Control Tools
Affinity Diagrams
Process Decision Program Charts
Interrelationship Digraphs
Tree Diagrams
Prioritization Matrices
Activity Network Diagram
Matrix Diagrams
2 Quality Audits are conducted to see that the standards are maintained in using the materials
best practices are followed whether any nonconformities are existing etc
3 Process Analysis (Whether the processes are in order and to determine any flows in the process
or to suggest further improvements etc)
PM World Journal Project Quality Management for Project Managers Vol IV Issue VII ndash July 2015 T D Jainendrakumar wwwpmworldjournalnet Advisory
copy 2015 T D Jainendrakumar wwwpmworldlibrarynet Page 10 of 17
Affinity diagram Affinity diagrams are a special kind of brainstorming tool that organize large amounts of disorganized data and information into groupings based on natural relationships Affinity diagram can be in any form like tree structure of the WBS etc in this you can also diagrammatically record the affinity of the customer towards certain requirements at the time of requirement gathering and for quality management and risk management etc and you can show this diagram to the customer at the time of scope validation to make a positive impression about you and your company to build trust and brand
Process Decision Program Charts A useful way of planning is to break down tasks into a hierarchy using a tree diagram The PDPC extends the tree diagram a couple of levels to identify risks and countermeasures for the bottom level tasks Different shaped boxes are used to highlight risks and identify possible countermeasures (often shown as clouds to indicate their uncertain nature) The PDPC is similar to the Failure Modes and Effects Analysis (FMEA) in that both identify risks consequences of failure and contingency actions the FMEA also rates relative risk levels for each potential failure point
PM World Journal Project Quality Management for Project Managers Vol IV Issue VII ndash July 2015 T D Jainendrakumar wwwpmworldjournalnet Advisory
copy 2015 T D Jainendrakumar wwwpmworldlibrarynet Page 11 of 17
Interrelationship Digraphs Process interrelation ship diagram can be drawn as given above to understand the relationships of activities within a complex process This tool displays all the interrelated cause-and-effect relationships and factors involved in a complex problem and describe desired outcomes The process of creating an interrelationship digraph helps a group analyze the natural links between different aspects of a complex situation Example A local physiciansrsquo group is experiencing a relatively high number of patient complaints regarding the lack of returned phone calls following a patient visit where some kind of test was ordered In particular the patients are frustrated that the promised call notifying them of the test results is either delayed or must be initiated by the patient The office manager of the group conducts a brainstorming session to generate potential reasons for the lack of effective and timely follow-up calls The group then takes the brainstormed list and organizes the potential reasons using an interrelationship diagram The basic idea is to count the number of ldquoinrdquo and ldquooutrdquo arrows to and from a particular issue and to use these counts to assist you in prioritizing the issues In the interrelationship diagram above ldquoOverly optimistic promise dates for follow-up callsrdquo is a key issue and of course would cause patients to expect a phone call faster than the group believes it can deliver it However do not summarily ignore or devalue the importance of issues with few ldquoinrdquo and ldquooutrdquo arrows until you have verified empirically the influence of these issues
PM World Journal Project Quality Management for Project Managers Vol IV Issue VII ndash July 2015 T D Jainendrakumar wwwpmworldjournalnet Advisory
copy 2015 T D Jainendrakumar wwwpmworldlibrarynet Page 12 of 17
Tree Diagrams This tool is used to break down broad categories into finer and finer levels of detail eg WBS
Prioritization Matrices Prioritization matrix is used to prioritize items and describe them in terms of weighted criteria It uses a combination of tree and matrix diagramming techniques to do a pair-wise evaluation of items and to narrow down options to the most desired or most effective Popular applications for the Prioritization Matrix include return on investment (ROI) or Costndashbenefit analysis (investment vs return) time management matrix (urgency vs importance) and Risk management etc Activity Network Diagram This tool is used to plan the appropriate sequence or schedule for a set of tasks and related subtasks It is used when subtasks must occur in parallel The diagram helps in determining the critical path (longest sequence of tasks) Matrix Diagrams This tool shows the relationship between items At each intersection a relationship is either absent or present It then gives information about the relationship such as its strength the roles played by various individuals or measurements Six differently shaped matrices are possible L T Y X C R and roof-shaped depending on how many groups must be compared
PM World Journal Project Quality Management for Project Managers Vol IV Issue VII ndash July 2015 T D Jainendrakumar wwwpmworldjournalnet Advisory
copy 2015 T D Jainendrakumar wwwpmworldlibrarynet Page 13 of 17
Perform Quality Assurance Output
1 Change Requests (if there is any variations in the quality management plan change request has
to be raised and this changes has to be approved or rejected through perform integrated
change control process and approved changes has to be given to the perform quality assurance)
2 Project Management Plan Updates (Quality management plan scope schedule management
plan and cost management plan will get updated
3 Project Documents Updates (Audit reports are prone to changes training plans etc may require
an updation )
4 Organizational Process Assets (Quality documents and standards get updated)
Control Quality This is the third and final process in this knowledge area which comes under monitoring and control process groups for Performing Quality Control It is the process of monitoring and recording results of executing the quality activities to assess performance and recommend necessary changes The key benefits of this process include
Identifying the causes of poor quality
Validating that project deliverables and work meet the requirements
Important Quality terms
Prevention (Keeping errors out of the process) vs Inspection (Keeping errors out of the hands
of the customer) The methods used are sampling In Attribute sampling products are checked
and see whether it meets the conformance to requirement or not But in Variables sampling
checks the degree of conformity in terms of the specification and functionalities of the product
PM World Journal Project Quality Management for Project Managers Vol IV Issue VII ndash July 2015 T D Jainendrakumar wwwpmworldjournalnet Advisory
copy 2015 T D Jainendrakumar wwwpmworldlibrarynet Page 14 of 17
Tolerance means range of acceptable results and control limits means threshold which may
indicate out of control
There is a tradeoff between Quality and Grade quality is conformance to requirement let us
take a base model of Honda Car even though this car has lower in grade than Mercedes Benz (S
class) if it meets the functionalities offered to its customers it has quality Benz S class is
higher in grade than base model of Honda if it doesnrsquot fulfill the functionalities offered to the
customer then this car is lacking quality This is the difference between grade and quality
Control Quality Input
1 Project Management Plan
2 Quality Metrics (describes the attributes of product or project and how it is measured)
3 Quality checklists (Checklist of list of requirements )
4 Work Performance Data (Actual work performance details)
5 Approved Change Requests (output of perform integrated change control process)
6 Deliverables (will be checked for correctness in this process)
7 Project Documents (Agreements Quality audit reports change log training plan etc)
8 Organizational Process Assets (Organizational procedures for quality standards work
guidelines issues and defect reporting procedures etc)
Control Quality T amp T
1 Seven Basic Quality Tools (described above0
2 Statistical Sampling (Samples are tested for acceptance or rejection of a lot )
3 Inspection (confirmation of deliverables to exact requirements for keeping errors out of the
hands of customer)
4 Approved Change Request Reviews (all the change requests that are approved will be reviewed
in this process and see that the changes are implemented)
Control Quality Output
1 Quality Control Measurements are the outcome of the quality control process
2 Validated Changes (see that change requests are implemented)
3 Verified Deliverables (confirmation of deliverables to exact requirements)
4 Work Performance Information (Comparing actual work done with the planned work and
decision making information are generated)
5 Change Requests (if the changes are not implemented properly change requests are raised)
PM World Journal Project Quality Management for Project Managers Vol IV Issue VII ndash July 2015 T D Jainendrakumar wwwpmworldjournalnet Advisory
copy 2015 T D Jainendrakumar wwwpmworldlibrarynet Page 15 of 17
6 Project Management Plan Updates (Changes will result in the updation of Quality management
plan and process improvement plans)
7 Project Document Updates (quality related documents and process improvement documents
are updated)
8 Organizational Process Assets Updates (Completed checklists lessons learned documentation
etc)
Follow above processes as and when needed to ensure that a project meets the defined needs it was
intended to meet and thus the project managers can ensure the quality
______________________________
References
1 PMBOK 5th edition
2 Project Management a systems Approach to Planning scheduling and control by HAROLD
KERZNER PHD
3 httpingenieriaudeaeduco~cpatinoGestion20Proces202Que20es20calidad20-
20Clase201pdf
4 httpthequalitywebcomcausehtml
5 httpswwwgooglecoinsearchq=Tally+sheet+diagramampes_sm=93amptbm=ischampimgil=Qptt30
SWGhhwyM253A253BvZ1kNNCUW6ZTmM253Bhttp25253A25252F25252Fsyqueco
m25252Fquality_tools25252Ftools25252FTools27htmampsource=iuamppf=mampfir=Qptt30SWG
hhwyM253A252CvZ1kNNCUW6ZTmM252C_ampusg=__-
lW4DpWdXSeWlrwcNGu4eK35mnY3Dampbiw=1280ampbih=699ampved=0CDMQyjcampei=D-
a3VJ3dMcXHuASZ1oKYCwimgdii=_ampimgrc=Qptt30SWGhhwyM253A3BvZ1kNNCUW6ZTmM
3Bhttp253A252F252Fsyquecom252Fquality_tools252Ftools252FTools27_files252
Fimage001gif3Bhttp253A252F252Fsyquecom252Fquality_tools252Ftools252FTool
s27htm3B3423B262
6 httpswwwgooglecoinsearchq=pareto+diagramampes_sm=93ampbiw=1280ampbih=699amptbm=isc
hampimgil=NZjhs9kd63znSM253A253BYBv_L3DVZEmKqM253Bhttp25253A25252F2525
2Fwwwvertex42com25252FExcelTemplates25252Fpareto-
charthtmlampsource=iuamppf=mampfir=NZjhs9kd63znSM253A252CYBv_L3DVZEmKqM252C_ampus
g=__q7q7k8Ml56mG4uYhdXSZa7SagoA3Dampved=0CD4Qyjcampei=2-a3VPufDM-
IuAS99IDoDQimgdii=_ampimgrc=NZjhs9kd63znSM253A3BYBv_L3DVZEmKqM3Bhttp253A
252F252Fwwwvertex42com252FExcelTemplates252FImages252Fpareto-
chart_largegif3Bhttp253A252F252Fwwwvertex42com252FExcelTemplates252Fpar
eto-charthtml3B5403B361
7 httpswwwgooglecoinsearchq=Scatter+Diagramampes_sm=93amptbm=ischampimgil=TdYFI3kF08
TjNM253A253BuvWDyQPL60_QuM253Bhttp25253A25252F25252Fwwwemathzone
com25252Ftutorials25252Fbasic-statistics25252Fscatter-
diagramhtmlampsource=iuamppf=mampfir=TdYFI3kF08TjNM253A252CuvWDyQPL60_QuM252C_
ampusg=__mInaeJbZ-
PM World Journal Project Quality Management for Project Managers Vol IV Issue VII ndash July 2015 T D Jainendrakumar wwwpmworldjournalnet Advisory
copy 2015 T D Jainendrakumar wwwpmworldlibrarynet Page 16 of 17
qtEjotk13LB6X5PBT83Dampbiw=1280ampbih=699ampved=0CCUQyjcampei=lLS4VLa4I9GOuATl74GICgi
mgdii=_ampimgrc=TdYFI3kF08TjNM253A3BuvWDyQPL60_QuM3Bhttp253A252F252Fw
wwemathzonecom252Fbasic-stat252Fscatter-
diagram252Fclip_image003jpg3Bhttp253A252F252Fwwwemathzonecom252Ftutor
ials252Fbasic-statistics252Fscatter-diagramhtml3B6003B445
8 httpswwwgooglecoinsearchq=affinity+diagramsampes_sm=93amptbm=ischampimgil=sFsYxC7a5s
FhhM253A253B04mnepnN7hsCJM253Bhttp25253A25252F25252Fwww2mitreorg
25252Fwork25252Fsepo25252Ftoolkits25252Frisk25252Fprocedures25252FAffinityDia
gramshtmlampsource=iuamppf=mampfir=sFsYxC7a5sFhhM253A252C04mnepnN7hsCJM252C_ampu
sg=__ogFM5PALQnm7mwPc9g6BYgHWSgU3Dampbiw=1280ampbih=699ampved=0CDEQyjcampei=ZhC6
VKC-
MpCjugT10oHgDgimgdii=_ampimgrc=sFsYxC7a5sFhhM253A3B04mnepnN7hsCJM3Bhttp2
53A252F252Fwww2mitreorg252Fwork252Fsepo252Ftoolkits252Frisk252Fprocedu
res252Fimages252Faffinity_diagramjpg3Bhttp253A252F252Fwww2mitreorg252F
work252Fsepo252Ftoolkits252Frisk252Fprocedures252FAffinityDiagramshtml3B546
3B347
9 httpsyquecomquality_toolstoolsTOOLS12htm
10 httpwwwsixsigmadailycommethodologyinterrelationship-diagram
11 httpsinsearchyahoocomyhssearchp=Tree+Diagrams+amphspart=tataamphsimp=yhs-
photon_001amptype=tatafp
PM World Journal Project Quality Management for Project Managers Vol IV Issue VII ndash July 2015 T D Jainendrakumar wwwpmworldjournalnet Advisory
copy 2015 T D Jainendrakumar wwwpmworldlibrarynet Page 17 of 17
About the Author
Dr T D Jainendrakumar
Dr T D Jainendrakumar PhD MCA PMP is an international PMP trainer EX-ScientistPrincipal ScientistJoint Director NIC
Ministry of Information and Communication Technology Government of India Madhyapradesh He has over 25 yearsrsquo of extensive experience in the areas of IT Project management in e-governance at Ernakulam District Collectorate District Courts of Kerala Central Administrative Tribunal Ernakulam Rajeev Gandhi National Drinking Water Mission (400 crore project) New Delhi and Principal Systems Analyst in National Informatics Centre Madhya Pradesh State Centre especially in the following areas of specialization IT practice management (Project Management Methodologies Tools and techniques Standards amp Knowledge)IT Infrastructure Management (Project Governance Assessment Organisational Instructions amp Facilities and Equipments) IT-Resource Integration Management (Resource Management Training amp Education Career Development amp Team Development)IT-Technical Support (Project Mentoring Project Planning Project Auditing and Project Recovery) and Business Alignment Management (Project Portfolio management Customer Relationship Management Vendor Management amp Business performance management) Teaching Project Management amp ICT Subjects for professionals and post graduates Master of Computer Applications (MCA) a 3 year post graduate course dealing with software Engineering and Project Management from a premier institute Anna University Campus He is a PMP of PMI USA since 2008 Resource person of PMI you can see his name in the PMBOK 4th edition and 5th edition published by PMI USA under the list of contributors for project management Scored 411 out of 5 in the project management (2005) examination conducted by brainbenchcom secured a Masters Certificate in Project Management and is one among the top scorers (First in India and 3rd position in the world in the experienced category) Published many international journal papers in PM World Today having cumulative index factors more than 2 in the areas of specialization of Project Management amp Information Technology Holding a Honrsquo Doctorate from Cosmopolitan University USA in Project Management amp Information Technology Presently working as an independent project management consultant and an International Project Management (PMP) trainer Provided PMP training to the senior officials of big MNCs like MS Earnest amp Young and He is a visiting professor and sharing his knowledge and experience and to handle classes in Management Information Systems Quality Management Project Management and Software Engineering to some of the big universities He can be contacted at jainendrakumartdymailcom
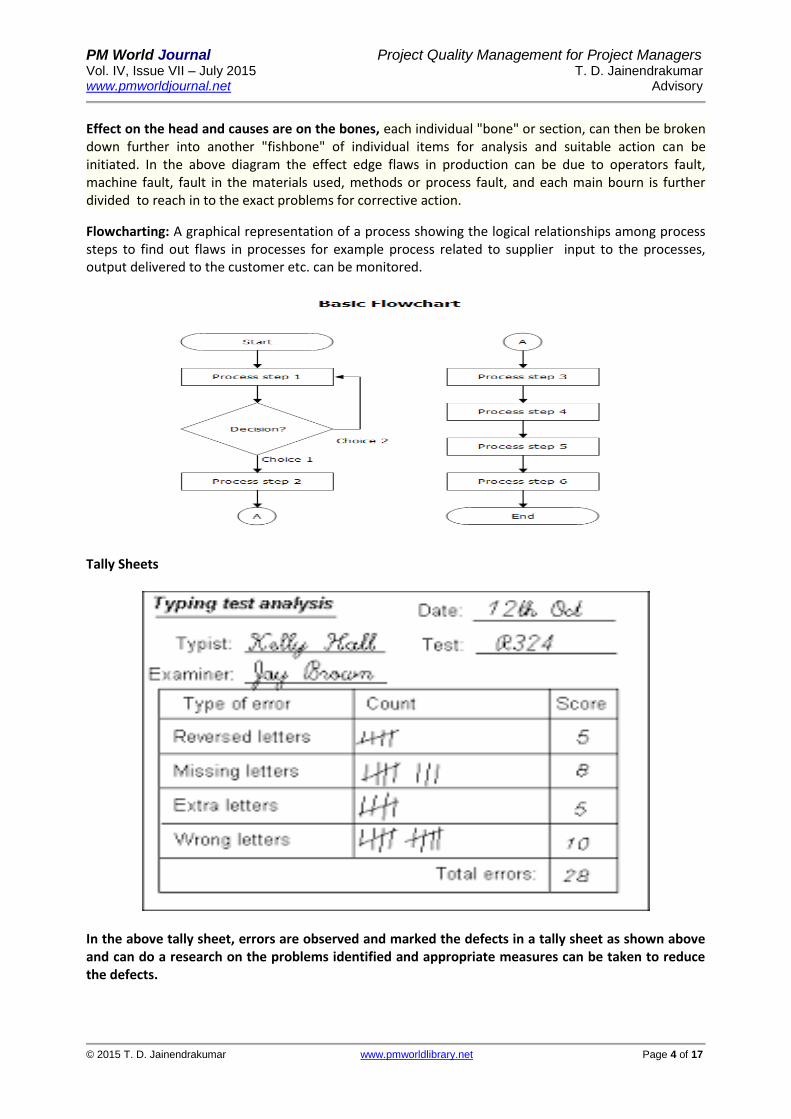
PM World Journal Project Quality Management for Project Managers Vol IV Issue VII ndash July 2015 T D Jainendrakumar wwwpmworldjournalnet Advisory
copy 2015 T D Jainendrakumar wwwpmworldlibrarynet Page 16 of 17
qtEjotk13LB6X5PBT83Dampbiw=1280ampbih=699ampved=0CCUQyjcampei=lLS4VLa4I9GOuATl74GICgi
mgdii=_ampimgrc=TdYFI3kF08TjNM253A3BuvWDyQPL60_QuM3Bhttp253A252F252Fw
wwemathzonecom252Fbasic-stat252Fscatter-
diagram252Fclip_image003jpg3Bhttp253A252F252Fwwwemathzonecom252Ftutor
ials252Fbasic-statistics252Fscatter-diagramhtml3B6003B445
8 httpswwwgooglecoinsearchq=affinity+diagramsampes_sm=93amptbm=ischampimgil=sFsYxC7a5s
FhhM253A253B04mnepnN7hsCJM253Bhttp25253A25252F25252Fwww2mitreorg
25252Fwork25252Fsepo25252Ftoolkits25252Frisk25252Fprocedures25252FAffinityDia
gramshtmlampsource=iuamppf=mampfir=sFsYxC7a5sFhhM253A252C04mnepnN7hsCJM252C_ampu
sg=__ogFM5PALQnm7mwPc9g6BYgHWSgU3Dampbiw=1280ampbih=699ampved=0CDEQyjcampei=ZhC6
VKC-
MpCjugT10oHgDgimgdii=_ampimgrc=sFsYxC7a5sFhhM253A3B04mnepnN7hsCJM3Bhttp2
53A252F252Fwww2mitreorg252Fwork252Fsepo252Ftoolkits252Frisk252Fprocedu
res252Fimages252Faffinity_diagramjpg3Bhttp253A252F252Fwww2mitreorg252F
work252Fsepo252Ftoolkits252Frisk252Fprocedures252FAffinityDiagramshtml3B546
3B347
9 httpsyquecomquality_toolstoolsTOOLS12htm
10 httpwwwsixsigmadailycommethodologyinterrelationship-diagram
11 httpsinsearchyahoocomyhssearchp=Tree+Diagrams+amphspart=tataamphsimp=yhs-
photon_001amptype=tatafp
PM World Journal Project Quality Management for Project Managers Vol IV Issue VII ndash July 2015 T D Jainendrakumar wwwpmworldjournalnet Advisory
copy 2015 T D Jainendrakumar wwwpmworldlibrarynet Page 17 of 17
About the Author
Dr T D Jainendrakumar
Dr T D Jainendrakumar PhD MCA PMP is an international PMP trainer EX-ScientistPrincipal ScientistJoint Director NIC
Ministry of Information and Communication Technology Government of India Madhyapradesh He has over 25 yearsrsquo of extensive experience in the areas of IT Project management in e-governance at Ernakulam District Collectorate District Courts of Kerala Central Administrative Tribunal Ernakulam Rajeev Gandhi National Drinking Water Mission (400 crore project) New Delhi and Principal Systems Analyst in National Informatics Centre Madhya Pradesh State Centre especially in the following areas of specialization IT practice management (Project Management Methodologies Tools and techniques Standards amp Knowledge)IT Infrastructure Management (Project Governance Assessment Organisational Instructions amp Facilities and Equipments) IT-Resource Integration Management (Resource Management Training amp Education Career Development amp Team Development)IT-Technical Support (Project Mentoring Project Planning Project Auditing and Project Recovery) and Business Alignment Management (Project Portfolio management Customer Relationship Management Vendor Management amp Business performance management) Teaching Project Management amp ICT Subjects for professionals and post graduates Master of Computer Applications (MCA) a 3 year post graduate course dealing with software Engineering and Project Management from a premier institute Anna University Campus He is a PMP of PMI USA since 2008 Resource person of PMI you can see his name in the PMBOK 4th edition and 5th edition published by PMI USA under the list of contributors for project management Scored 411 out of 5 in the project management (2005) examination conducted by brainbenchcom secured a Masters Certificate in Project Management and is one among the top scorers (First in India and 3rd position in the world in the experienced category) Published many international journal papers in PM World Today having cumulative index factors more than 2 in the areas of specialization of Project Management amp Information Technology Holding a Honrsquo Doctorate from Cosmopolitan University USA in Project Management amp Information Technology Presently working as an independent project management consultant and an International Project Management (PMP) trainer Provided PMP training to the senior officials of big MNCs like MS Earnest amp Young and He is a visiting professor and sharing his knowledge and experience and to handle classes in Management Information Systems Quality Management Project Management and Software Engineering to some of the big universities He can be contacted at jainendrakumartdymailcom
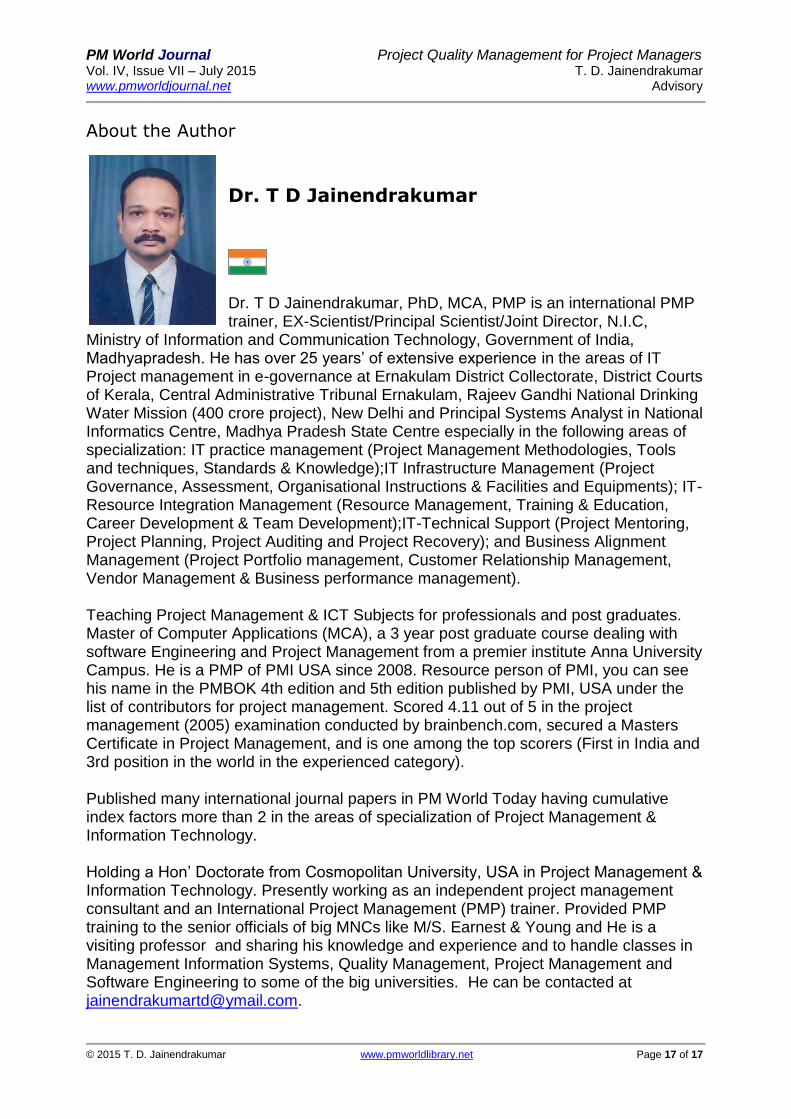
PM World Journal Project Quality Management for Project Managers Vol IV Issue VII ndash July 2015 T D Jainendrakumar wwwpmworldjournalnet Advisory
copy 2015 T D Jainendrakumar wwwpmworldlibrarynet Page 17 of 17
About the Author
Dr T D Jainendrakumar
Dr T D Jainendrakumar PhD MCA PMP is an international PMP trainer EX-ScientistPrincipal ScientistJoint Director NIC
Ministry of Information and Communication Technology Government of India Madhyapradesh He has over 25 yearsrsquo of extensive experience in the areas of IT Project management in e-governance at Ernakulam District Collectorate District Courts of Kerala Central Administrative Tribunal Ernakulam Rajeev Gandhi National Drinking Water Mission (400 crore project) New Delhi and Principal Systems Analyst in National Informatics Centre Madhya Pradesh State Centre especially in the following areas of specialization IT practice management (Project Management Methodologies Tools and techniques Standards amp Knowledge)IT Infrastructure Management (Project Governance Assessment Organisational Instructions amp Facilities and Equipments) IT-Resource Integration Management (Resource Management Training amp Education Career Development amp Team Development)IT-Technical Support (Project Mentoring Project Planning Project Auditing and Project Recovery) and Business Alignment Management (Project Portfolio management Customer Relationship Management Vendor Management amp Business performance management) Teaching Project Management amp ICT Subjects for professionals and post graduates Master of Computer Applications (MCA) a 3 year post graduate course dealing with software Engineering and Project Management from a premier institute Anna University Campus He is a PMP of PMI USA since 2008 Resource person of PMI you can see his name in the PMBOK 4th edition and 5th edition published by PMI USA under the list of contributors for project management Scored 411 out of 5 in the project management (2005) examination conducted by brainbenchcom secured a Masters Certificate in Project Management and is one among the top scorers (First in India and 3rd position in the world in the experienced category) Published many international journal papers in PM World Today having cumulative index factors more than 2 in the areas of specialization of Project Management amp Information Technology Holding a Honrsquo Doctorate from Cosmopolitan University USA in Project Management amp Information Technology Presently working as an independent project management consultant and an International Project Management (PMP) trainer Provided PMP training to the senior officials of big MNCs like MS Earnest amp Young and He is a visiting professor and sharing his knowledge and experience and to handle classes in Management Information Systems Quality Management Project Management and Software Engineering to some of the big universities He can be contacted at jainendrakumartdymailcom


![Guidelines Project Managers[1]](https://img.pdfslide.net/doc/110x75/577d24af1a28ab4e1e9d19f5/guidelines-project-managers1.jpg)