Embed Size (px)
Citation preview
DOCKETED
Docket Number: 17-BSTD-02
Project Title: 2019 Title 24, Part 6, Building Energy Efficiency Standards Rulemaking
TN #: 222345
Document Title: Energy Implications of In-Line Filtration in California
Description: Document relied upon (indoor air quality).
Filer: Adrian Ownby
Organization: California Energy Commission
Submitter Role: Commission Staff
Submission Date: 1/23/2018 3:47:45 PM
Docketed Date: 1/23/2018
Energy Research and Development Div is ion FINAL PROJECT REPORT
ENERGY IMPLICATIONS OF IN‐LINE FILTRATION IN CALIFORNIA
JUNE 2012CEC ‐500 ‐2013 ‐081
Prepared for: California Energy Commission Prepared by: Lawrence Berkeley National Laboratory
PREPARED BY: Primary Author(s): Iain Walker Darryl Dickerhoff David Faulkner Will Turner Lawrence Berkeley National Laboratory 1 Cyclotron Rd. Berkeley, CA 94720 Contract Number: PIR-08-014 Prepared for: California Energy Commission Chris Scruton Contract Manager Virginia Lew Office Manager Energy Efficiency Research Office Laurie ten Hope Deputy Director ENERGY RESEARCH AND DEVELOPMENT DIVISION Rob Oglesby Executive Director
DISCLAIMER This report was prepared as the result of work sponsored by the California Energy Commission. It does not necessarily represent the views of the Energy Commission, its employees or the State of California. The Energy Commission, the State of California, its employees, contractors and subcontractors make no warranty, express or implied, and assume no legal liability for the information in this report; nor does any party represent that the uses of this information will not infringe upon privately owned rights. This report has not been approved or disapproved by the California Energy Commission nor has the California Energy Commission passed upon the accuracy or adequacy of the information in this report.
i
ACKNOWLEDGEMENTS
The authors would like to thank the homeowners who allowed us to instrument their homes and change their filters as well as the field assistance of other LBNL staff: Chris Stratton, Erin Hult and Tin Shu. We would also like to thank Woody Delp and Chris Stratton of LBNL who provided thoughtful and insightful review of this report.

ii
PREFACE
The California Energy Commission Energy Research and Development Division supports public interest energy research and development that will help improve the quality of life in California by bringing environmentally safe, affordable, and reliable energy services and products to the marketplace.
The Energy Research and Development Division conducts public interest research, development, and demonstration (RD&D) projects to benefit California.
The Energy Research and Development Division strives to conduct the most promising public interest energy research by partnering with RD&D entities, including individuals, businesses, utilities, and public or private research institutions.
Energy Research and Development Division funding efforts are focused on the following RD&D program areas:
• Buildings End‐Use Energy Efficiency
• Energy Innovations Small Grants
• Energy‐Related Environmental Research
• Energy Systems Integration
• Environmentally Preferred Advanced Generation
• Industrial/Agricultural/Water End‐Use Energy Efficiency
• Renewable Energy Technologies
• Transportation
Energy Implications of In‐Line Filtration in California is the final report for the Energy Implications of In‐Line Filtration in California project (contract number PIR‐08‐014) conducted by Lawrence Berkeley National Laboratory. The information from this project contributes to Energy Research and Development Division’s Energy‐Related Environmental Research Program.
For more information about the Energy Research and Development Division, please visit the Energy Commission’s website at www.energy.ca.gov/research/ or contact the Energy Commission at 916‐327‐1551.
iii
ABSTRACT
Concern about indoor air quality issues has led to the use of more effective air filters in residential heating and cooling systems. This study performed measurements in 10 California houses to determine the effects of filter performance on the energy use of the heating and cooling systems. Multiple filters were evaluated covering a range of filter effectiveness from simple low filtration fiberglass filters up to high efficiency filters used by occupants concerned about indoor air quality. Analytical and simulation tools used the field testing results to determine filter impacts for a wide range of parameters and California climates. Filters were ranked from 1 to 16 based on their ability to arrest particles of various sizes according to the Minimum Efficiency Reporting Value system. The results indicate that for filters ranked 10/11/13 the effects on energy use are moderate (<5 percent) over a wide range of performance conditions and climates. Using filters ranked 16 can lead to increased energy use (>5 percent) and the high airflow resistance of these filters led to excess noise in some test houses. Filter loading rates varied more from house to house than by the Minimum Efficiency Reporting Value ranking and overall were quite low in many homes. Filter related energy use does not need to be addressed for filters ranked 10/11/13. The filters ranked 16 should only be used with low leakage tested ducts unless the filter is mounted at the blower compartment, if the filter area is sufficient to prevent noise, and if the duct system has low air flow resistance and low leakage. Filters should be labeled for their air flow resistance, or static pressure at a particular flow rate, which would allow codes and standards to reference a particular performance specification and allow contractors and homeowners to make informed purchases.
Keywords: Filters, fan power, filter loading, field monitoring, MERV, residential, duct leakage, blower, California Energy Commission
Please use the following citation for this report:
Wlaker, Iain, Dickerhoff, Darryl, Faulkner, David, Turner, Will. (Lawrence Berkeley National Laboratory). 2012. Energy Implications of In‐Line Filtration in California. California Energy Commission. Publication number: CEC‐500‐2013‐081.
iv
TABLE OF CONTENTS
ACKNOWLEDGEMENTS ....................................................................................................................... i
PREFACE ................................................................................................................................................... ii
ABSTRACT .............................................................................................................................................. iii
TABLE OF CONTENTS ......................................................................................................................... iv
LIST OF FIGURES .................................................................................................................................. vi
LIST OF TABLES ..................................................................................................................................... ix
EXECUTIVE SUMMARY ........................................................................................................................ 1
Introduction ............................................................................................................................................ 1
Project Purpose ....................................................................................................................................... 1
Project Results ......................................................................................................................................... 2
Project Benefits ....................................................................................................................................... 3
CHAPTER 1: Introduction to Residential Air Filtration .................................................................. 5
1.1 Filter Ratings ..................................................................................................................................... 5
1.2 Envelope filtration ........................................................................................................................... 7
1.3 Ozone ................................................................................................................................................. 8
1.4 Energy ................................................................................................................................................ 8
1.5 Filter Fouling .................................................................................................................................. 11
1.6 Peak Demand .................................................................................................................................. 14
1.7 Labels ............................................................................................................................................... 15
CHAPTER 2: Field Testing of Filter Impacts on HVAC System Performance ............................ 18
2.1 Diagnostic Testing .......................................................................................................................... 18
2.1.1 Air Flow .................................................................................................................................... 18
2.1.2 Duct Leakage ........................................................................................................................... 19
2.1.3 Envelope Leakage ................................................................................................................... 19
2.1.4 Other Information ................................................................................................................... 20
2.2 Long‐Term Testing......................................................................................................................... 20
2.2.1 Duct System Pressures ........................................................................................................... 20
v
2.2.2 Power Consumption of System Blower ............................................................................... 21
2.2.3 Other data collected ................................................................................................................ 21
2.2.4 Initial Filters ............................................................................................................................. 21
2.2.5 House Summary ...................................................................................................................... 21
CHAPTER 3: Field Test Results ........................................................................................................... 24
3.1 House 1 Filters ................................................................................................................................ 26
3.2 House 2 Filters ................................................................................................................................ 28
3.3 House 3 Filters ................................................................................................................................ 31
3.4 House 4 Filters ................................................................................................................................ 35
3.5 House 5 Filters ................................................................................................................................ 38
3.6 House 6 Filters ................................................................................................................................ 41
3.7 House 7 Filters ................................................................................................................................ 44
3.8 House 8 Filters ................................................................................................................................ 48
3.9 House 9 Filters ................................................................................................................................ 52
3.10 House 10 Filters ............................................................................................................................ 55
3.11 Measurement Result Summary .................................................................................................. 57
CHAPTER 4: Energy Use Estimates and Simulations ...................................................................... 66
4.1 Climates ........................................................................................................................................... 67
4.2 Weather ........................................................................................................................................... 68
4.3 House Characteristics .................................................................................................................... 69
4.4 Mechanical Ventilation .................................................................................................................. 71
4.4.1 Source Control Ventilation .................................................................................................... 71
4.5 Internal Loads ................................................................................................................................. 72
4.6 Modeling Filter Effects on HVAC performance ........................................................................ 74
4.7 REGCAP Simulation Outputs ...................................................................................................... 78
4.8 Modeling Results and Discussion ................................................................................................ 79
4.8.1 Heating and Cooling System Operation Times .................................................................. 79
4.8.2 Heating and Cooling System Energy Performance ............................................................ 82
vi
4.8.3 Simulation Results Summary ................................................................................................ 92
CHAPTER 5: Summary of Filtration Issues ....................................................................................... 94
5.1 What are typical filter pressure drops? ....................................................................................... 94
5.2 What are the changes in airflow rates when better filters are used and as filters become loaded? ................................................................................................................................................... 95
5.3 How do changes in filter pressure drops impact blower performance in terms of airflow and energy use? .................................................................................................................................... 96
5.4 How do the pressure drops in the rest of the system impact filter pressure drop effects? . 96
5.5 How fast do filters foul and what effect does this have on system performance ................. 97
5.6 How do the filters change the energy performance of heating and cooling systems? ......... 98
CHAPTER 6: Recommendations .......................................................................................................... 99
6.1 Codes, standards and utility programs ...................................................................................... 99
6.2 Consumers and Contractors ......................................................................................................... 99
REFERENCES ........................................................................................................................................ 101
FURNACE FIELD TESING BIBLIOGRAPHY ................................................................................ 106
APPENDIX A: Field‐Test Protocol for Filter Testing ..................................................................... A‐1
APPENDIX B: Further Simulation Results ...................................................................................... B‐1
LIST OF FIGURES
Figure 1: Example of EUROVENT Filter Label from EN 779 ............................................................ 15 Figure 2: Comparison of EN 799 to ASHRAE MERV Ratings (by permission of Bob Burkhead) 17 Figure 3: Original Filter from House 1, MERV 8, 4 in. (100 mm) Deep ............................................ 26 Figure 4: House 1 MERV 16 Filter ......................................................................................................... 26 Figure 5: Fan Flow and Power Changes from House 1 ...................................................................... 27 Figure 6: Pressure Across the Filter for House 1 ................................................................................. 27 Figure 7: Pressure Across the Fan for House 1 .................................................................................... 27 Figure 8: Supply Plenum Pressure (relative to inside the house) for House 1 ................................ 28 Figure 9: Return Plenum Pressure (relative to inside the house) for House 1 ................................ 28 Figure 10: Supply Side Leakage for House 1........................................................................................ 28 Figure 11: Return Side Leakage for House 1 ........................................................................................ 28 Figure 12: House 2 Initial Filter that was Very Dirty at the Start of Data Collection ..................... 29 Figure 13: MERV 16 Filter for House 2 ................................................................................................. 29 Figure 14: Fan Flow and Power Changes from House 2 .................................................................... 30 Figure 15: Pressure Across the Filter for House 2 ............................................................................... 30 Figure 16: Pressure Across the Fan for House 2. ................................................................................. 30
vii
Figure 17: Supply Plenum Pressure (relative to inside the house) for House 2 .............................. 31 Figure 18: Return Plenum Pressure (relative to inside the house) for House 2 .............................. 31 Figure 19: Supply Side Leakage for House 2........................................................................................ 31 Figure 20: Return Side Leakage for House 2 ........................................................................................ 31 Figure 21: Original Filter Found in Furnace at House 3 ..................................................................... 32 Figure 22: MERV 16 Filter Installed in House 3 ................................................................................... 32 Figure 23: Low Quality Filter Installed in House 3 after MERV 16 Filter was Removed .............. 33 Figure 24: Gaps in Data before the MERV 16 Filter are from a Few Days with New MERV 11 Filters Which Look Slimilar to the Longer Time Periods Shown. ..................................................... 34 Figure 25: Pressure Across the Filter for House 3 ............................................................................... 34 Figure 26: Pressure Across the Fan for House 3 .................................................................................. 34 Figure 27: Supply Plenum Pressure for House 3 ................................................................................. 35 Figure 28: Return Plenum Pressure for House 3 ................................................................................. 35 Figure 29: Supply Side Leakage for House 3........................................................................................ 35 Figure 30: Return Side Leakage for House 3 ........................................................................................ 35 Figure 31: Washable Filter Used in House 4 ‐ Photo shows Some Dust Accumulation ................ 36 Figure 33: Fan Flow and Power Changes from House 4 .................................................................... 37 Figure 34: Pressure Across the Filter for House 4 ............................................................................... 37 Figure 35: Pressure Across the Fan for House 4 .................................................................................. 37 Figure 36 Supply Plenum Pressure (relative to inside the house) for House 4 ............................... 38 Figure 37: Return Plenum Pressure (relative to inside the house) for House 4 .............................. 38 Figure 38: Supply Side Leakage for House 4........................................................................................ 38 Figure 39: Return Side Leakage for House 4 ........................................................................................ 38 Figure 41: MERV 16 Filter from House 5. ............................................................................................. 39 Figure 42: Fan Flow and Power changes from House 5 ..................................................................... 40 Figure 43: Pressure Across the Filter for House 5 ............................................................................... 40 Figure 44: Pressure Across the Fan for House 5 .................................................................................. 40 Figure 45: Supply Plenum Pressure (relative to inside the house) for House 5 .............................. 41 Figure 46: Return Plenum Pressure (relative to inside the house) for House5 ............................... 41 Figure 47: Supply Side Leakage for House 5........................................................................................ 41 Figure 48: Return Side Leakage for House 5 ........................................................................................ 41 Figure 49: Original Filter Used in House 6 ........................................................................................... 42 Figure 50: MERV 16 Filter for House 6 ................................................................................................. 42 Figure 51: Fan Flow and Power Changes from House 6 .................................................................... 43 Figure 52: Pressure Across Filter for House 6 ...................................................................................... 43 Figure 53: Pressure Across the Fan for House 6 .................................................................................. 43 Figure 54: Supply Plenum Pressure (relative to inside the house) for House 6 .............................. 44 Figure 55: Return Plenum Pressure (relative to inside the house) for House 6 .............................. 44 Figure 56: Supply Side Leakage for House 6........................................................................................ 44 Figure 57: Return Side Leakage for House 6 ........................................................................................ 44 Figure 58: Original Furnace Filter Installed in House 7 ..................................................................... 45 Figure 59: Ceiling Return Filter Used in House 7 ................................................................................ 45 Figure 60: Fan Flow and Power Changes from House 7 .................................................................... 46
viii
Figure 61: Pressure Across the Ceiling Filter for House 7 .................................................................. 46 Figure 62: Pressure across the plenum filter for House 7 ................................................................... 46 Figure 63 Pressure Across the Fan for House 7 ................................................................................... 47 Figure 64: Supply Plenum Pressure (relative to inside the house) for House 7 .............................. 47 Figure 65: Return Plenum Pressure (relative to inside the house) for House 7 .............................. 47 Figure 66: Supply‐Side Leakage for House 7 ....................................................................................... 48 Figure 67: Return‐Side Leakage for House 7 ........................................................................................ 48 Figure 68: New Flexible Pleated Filter in House 8 .............................................................................. 48 Figure 69: Dirt Accumulation on Flexible Pleated Filter in House 8 ................................................ 49 Figure 70: MERV 16 Filter at House 8 ................................................................................................... 49 Figure 71: Fan Flow and Power Changes from House 8 .................................................................... 50 Figure 72: Pressure Across the Filter for House 8 ............................................................................... 50 Figure 73: Pressure Across the Fan for House 8 .................................................................................. 50 Figure 74: Supply Plenum Pressure (relative to inside the house) for House 8 .............................. 51 Figure 75: Return Plenum Pressure (relative to inside the house) for House 8 .............................. 51 Figure 76: Supply‐Side Leakage for House 8 ....................................................................................... 51 Figure 77: Return‐Side Leakage for House 8 ........................................................................................ 51 Figure 78: Original Washable Filter for House 9. ................................................................................ 52 Figure 79: MERV 16 Filter after Removal from House 9 .................................................................... 52 Figure 80: Fan Flow and Power Changes from House 9 .................................................................... 53 Figure 81: Pressure Across the Filter for House 9 ............................................................................... 53 Figure 82: Pressure Across the Fan for House 9 .................................................................................. 53 Figure 83: Supply Plenum Pressure (relative to inside the house) for House 9 .............................. 54 Figure 84: Return Plenum Pressure (relative to inside the house) for House 9 .............................. 54 Figure 85: Supply‐Side Leakage for House 9 ....................................................................................... 54 Figure 86: Return‐Side Leakage for House 9 ........................................................................................ 54 Figure 87: Original 4 in. Deep Pleated Filter Installed in House 10 at the Start of the Study ....... 55 Figure 88: MERV 16 Filter Installed at House 10 ................................................................................. 55 Figure 89: Fan Flow and Power Changes from House 10 .................................................................. 56 Figure 90: Pressure Across the Filter for House 10 ............................................................................. 56 Figure 91: Pressure Across the Fan for House 10 ................................................................................ 56 Figure 92: Supply Plenum Pressure (relative to inside the house) for House 10 ............................ 57 Figure 93: Return Plenum Pressure (relative to inside the house) for House 10 ............................ 57 Figure 94: Supply‐Side Leakage for House 10 ..................................................................................... 57 Figure 95: Return‐Side Leakage for House 10 ...................................................................................... 57 Figure 96: California Climate Zones (CEC) .......................................................................................... 68 Figure 97: CEC Prototype C House Used in the Simulations ............................................................ 69 Figure 98: Filter Loading Effects on System Performance for A PSC Motor under No, Low and High Loading Conditions, with a Change in Filter from MERV 5 to MERV 11 after 106 Kg of Cumulative Air Mass Flow ..................................................................................................................... 77 Figure 99: Filter Loading Effects on System Performance for A BPM Motor under No, Low and High Loading Conditions, with a Change in Filter from MERV 5 to MERV 11 after 106 Kg of Cumulative Air Mass Flow ..................................................................................................................... 78
ix
Figure 101: Annual Air Handler Operation Time (H) For BPM Motor with 28% Duct Leakage . 81 Figure 102: Annual Energy Use of the System Components for the Baseline Case with A MERV 5, No Loading Effects and Duct Leakage Of 6% .................................................................................. 82 Figure 103: Annual Energy Use of the System Components for the Baseline Case with A MERV 5, No Loading Effects and Duct Leakage of 28% ................................................................................. 83 Figure 104: Filter Loading and Increasing MERV Effects on System Energy Performance in Climate Zone 1 Arcata. PSC and BPM Motors in Both New (6% Duct Leakage) and Old (28% Duct Leakage) Construction ................................................................................................................... 86 Figure 105: Filter Loading and Increasing MERV Effects on System Energy Performance in Climate Zone 6 LA. PSC and BPM Motors in Both New (6% Duct Leakage) and Old (28% Duct Leakage) Construction ............................................................................................................................ 87 Figure 106: Filter Loading and Increasing MERV Effects on System Energy Performance in Climate Zone 10 Riverside. PSC and BPM Motors in Both New (6% Duct Leakage) and Old (28% Duct Leakage) Construction ......................................................................................................... 88 Figure 107: Filter Loading and Increasing MERV Effects on System Energy Performance in Climate Zone 12 Sacramento. PSC and BPM Motors in Both New (6% Duct Leakage) and Old (28% Duct Leakage) Construction ......................................................................................................... 89 Figure 108: Filter Loading and Increasing MERV Effects on System Energy Performance In Climate Zone 13 Fresno. PSC and BPM Motors in Both New (6% Duct Leakage) and Old (28% Duct Leakage) Construction. (Note the Scale Change for the BPM Motor ...................................... 90 Figure 109: Filter Loading and Increasing MERV Effects on System Energy Performance in Climate Zone 13 Fresno. PSC and BPM Motors in Both New (6% Duct Leakage) and Old (28% Duct Leakage) Construction. (Note the Scale Change for the BPM Motor) .................................... 91 Figure 110: Fan Flow and Filter Pressure Changes with a Change in MERV Rating for PSC and BPM Motors. ............................................................................................................................................. 95 Figure 111: Fan Flow and Power Changes When Changing To A MERV 16 Filter for PSC and BPM Motors. ............................................................................................................................................. 96 Figure 112: Changes In Filter Pressure By Switching To A MERV 16 Filter. ................................... 97
LIST OF TABLES
Table 1: California Duct System Pressure Component Breakdown ................................................. 11 Table 2: Requirements for EUROVENT Filter Classes ....................................................................... 16 Table 3: Filter Classifications from EN 779 ........................................................................................... 16 Table 4: Initial Fan Flows for Each Filter/Furnace Operational Mode for Each House. ................ 19 Table 5: Summary of House Characteristics ........................................................................................ 22 Table 6: Summary of HVAC System Characteristics .......................................................................... 23 Table 7: Motor Type, House Cumulative Flow Rate and Filter Pressure, Changes with Time and Filter Type. ................................................................................................................................................ 58 Table 8: Fan Flow and Fan Power Changes with Time and Filter Type ......................................... 60 Table 9 Effects of Changing Filters and Filter Loading on the Plenum Pressures. ......................... 62 Table 10: Duct Leakage Changes with Time and Filter Type ........................................................... 64
x
Table 11: California Climate Zone Summary ....................................................................................... 67 Table 12: House Insulation Levels ......................................................................................................... 70 Table 13: Fenestration .............................................................................................................................. 71 Table 14: Thermostat Settings (°F) [°C] ................................................................................................. 73 Table 15: Heating And Cooling System Capacity ............................................................................... 74 Table 16: Cooling Fan Power And Air Flow ........................................................................................ 74 Table 17: Heating Fan Power And Air Flow ........................................................................................ 74 Table 18: PSC Motor A Coefficients, Fractional Change in Performance from Filter Installation 76 Table 19: BPM Motor A Coefficients, Fractional Change in Performance from Filter Installation .................................................................................................................................................................... 76 Table 20: PSC Motor K Coefficients, Fractional Change after 106 Kg of Air Mass Flow through Filter ........................................................................................................................................................... 76 Table 21: BPM Motor K Coefficients, Fractional Change after 106 Kg of Air Mass Flow through Filter ........................................................................................................................................................... 76 Table 22: Energy Penalty (Kwh and Fraction of Baseline HVAC Energy Consumption) For MERV Changes ........................................................................................................................................ 92
1
EXECUTIVE SUMMARY
Introduction
Occupant concern about indoor air quality (IAQ) issues has led to the increased use of more effective air filters in residential heating and cooling systems. A drawback of improved filtration is that the better filters tend to have more flow resistance. This can lead to lower system airflows that reduce heat exchanger efficiency, increased duct pressure causing increased air leakage for ducts and, for Brushless Permanent Motor (BPM) blowers, increased electricity consumption. There is currently little knowledge on the magnitude of these effects due to a lack of measured data and analysis of energy and performance consequences. There is also no guidance for consumers or contractors who purchase filters or for utility programs and building code authorities regarding the related energy impacts.
Filters are tested for particulate removal efficacy with standard laboratory methods and there are several ratings resulting from these laboratory tests. The most prevalent rating method is the Minimum Efficiency Rating Value or MERV. A higher MERV rating means that the filter removes more particles and particles of smaller size. All other things being equal, the researchers expected higher MERV ratings to lead to greater airflow resistance. However, this was complicated by geometry issues and the filtration method and medium selected. Filters come in common depths of 1, 2, and 4 inches with consequent increases in filter media surface area and decreases in airflow resistance for the same filter medium. Another complication is that the two kinds of electric motor used in residential blowers, Permanent Split Capacitor (PSC) and BPM, have different responses to system air flow resistance. In general, PSC driven blowers tend to decrease flow and power with increased pressure difference, whereas BPM blowers maintain flow and increase power.
This study performed measurements in California houses to determine the effects of changing filter performance and related characteristics on the energy use of the heating and cooling systems. Multiple filters were evaluated in 10 homes covering a wide range of filter effectiveness from simple low filtration fiberglass filters (less than MERV 6) up to high efficiency filters that might be used by occupants concerned about IAQ (MERV 10 or higher). This included filter designs that are intended to reduce filter pressure drop such as pleated filters and 4‐inch deep filters. In addition, sophisticated analysis and simulation tools were used to determine filter impacts for a wide range of parameters and California climates in order to extend the filtration impacts estimates beyond the 10 homes that were field tested.
Project Purpose
The goals of this project were to provide recommendations for contractors, installers, home owners and utilities on the energy implications of filter selection and to provide information that the California Energy Commission could potentially use in developing or revising building energy codes.
The technical objectives included determining the energy use associated with filtration for residential blowers and equipment for heating, cooling and ventilating California homes and
2
developing metrics and performance results that could be used for market education and code input.
Project Results
The test results from this study (and similar results from related studies by other researchers) indicated that for filters with a MERV value of 11 or less, the effects on energy use are moderate (<5 percent) over a wide range of performance conditions and climates. Using MERV 16 filters could potentially result in significantly increased energy use (>5 percent) and usability. In some test houses the high airflow resistance of MERV 16 filters led to excess noise from the blower motor and air bypassing the filter. This noise was so loud that the occupants removed the MERV 16 filters within a matter of days.
In systems that were already close to blower performance limits with low MERV (less than MERV 6) filters, adding a MERV 16 filter pushed the blowers to their limits. In two cases even BPM driven blowers were unable to maintain airflow because the motors were operating at maximum output before the required air flow rate was met. It was difficult to predict how the performance of a system with a BPM driven blower would change when a MERV 16 filter was installed. In one house, the BPM control algorithm increased the flow when a MERV 16 filter was installed. Overall, the filter pressure increased somewhat for low MERV filters and more substantially for MERV 16 filters. For a typical home this means the filter would need to be replaced more than once per year, but filters would need to be replaced at least two or three times a year in homes located in areas with high particulate levels.
Filter loading rates varied more from house to house than by MERV rating and overall were quite low in many of the homes. The impacts of filter loading were reduced if 4‐inch deep rather than the more typical 1‐inch or 2‐inch deep filters were used. Given the small sample size, the researchers could only make generalizations about how often filter fouling was a serious issue. The study results showed that seven of the homes had very low fouling rates and therefore that fouling had a negligible effect. Two houses had moderate fouling rates and only one home in a rural setting with two large dogs had a high filter loading rate. The researchers found no correlation between the filter loading rate and the filter grille location – the fastest loading filters were ceiling mounted in the rural home. This indicated that high particulate concentrations in the rural environment ambient air may require more regular filter changes.
The effects of duct system leakage were found to be significant because the leakage depends on the pressure in the ducts that are affected by filter air flow resistance. The changes in duct pressures due to changing filters are not straightforward. In general, with reduced airflow for higher airflow resistance filters, the pressures in supply ducts were decreased, leading to lower supply leakage. For returns the change depended on the filter location. The return ducts would also be at lower pressures for filters at the furnace/blower compartment, and would be expected to have lower leakage, similar to the supply ducts. However, most California duct systems have filters at the grilles so the whole return system would have increased pressure differences and increased duct leakage. The blower compartment itself would have larger pressures and more leakage no matter which filter location was used.
3
The authors recommended that filter‐related energy use does not need to be addressed for filters of MERV 11 or less, and that MERV 16 filters should only be used with low leakage duct systems (based on the 6 percent level used in the California Building Standard Code) for the California Building Standard Code (Title 24) and the ASHRAE residential ventilation standard. For contractors, high MERV filters should only be used if the filter area is sufficient to prevent noise issues and if the duct system has low air flow resistance and low leakage. In addition, occupants need information on filter performance. The researchers recommended that filters should be labeled for their air flow resistance, or static pressure at a particular flow rate.
Project Benefits
The results of this study can be used by codes and standards bodies for balancing air filtration needs to improve health with the cost to provide this service. In addition, rating labels that provide information on air flow resistance or static pressure at a particular flow rate would allow codes and standards to reference a particular performance specification and allow contractors and homeowners to make informed purchases.


5
CHAPTER 1: Introduction to Residential Air Filtration 1.1 Filter Ratings There are national standards that exist to determine degree of air cleaning provided by a filter. ASHRAE Standards 52.2 (1999) and 52.1 (1992) provide test methods that can be used by engineers to specify filters and determine their pressure drop but do not discuss any of the implications of filter air flow resistance. Standard 52.2 is used to produce a Minimum Efficiency Reporting Value, or MERV rating. This rating is determined by testing filters in a laboratory and measuring upstream and downstream particle concentrations.
In residences it is very rare that specific chemicals need to be scrubbed from the air so the ratings are based on particles. The particles are divided into three size categories: 3‐10 μm, 1‐3 μm and 0.3‐1 μm. The two smallest categories are the most critical for human health issues. The MERV ratings of filters readily available for use in residential HVAC systems range from a low of around 3 to a high of 16 – with higher ratings removing more particles at smaller sizes. A MERV 3 filter will capture large particles including clothing fibers, pollen and dust mites but none of the smaller category particles. A MERV 16 filter captures more than 95 percent of all three particle sizes, including bacteria and tobacco smoke. A good discussion providing more detail relating MERV ratings to particle size and examples of particles can be found in Newell (2006). The minimum MERV rating to remove 50 percent of the 1‐3 μm size range is MERV 10. Inexpensive glass fiber filters that are very common and most people are familiar with, are about MERV 3 and remove essentially zero of the particles of concern for health.
At the extreme high end of filtration there are High‐Efficiency Particulate Arresting (HEPA) and Ultra‐Low Penetration Air (ULPA) filters that can trap things as small as viruses and are used in clean rooms and hospital surgeries. Although these are sometimes found in residences for very sensitive members of the population, they are beyond the scope of this study as they are usually installed in air cleaning systems that are deliberately designed with air cleaning in mind, and would not be considered normal or typical in residences. Because they are used in extremely critical environments, their cost of operation is something that the users are expecting to pay and will already be aware of. In this study, a range of filters from MERV 5 (approximate – many filters in the low range are unrated) to MERV 16 were used. It should be noted that not all commercially available residential air filters are MERV rated, nor do they uniformly display a MERV rating on their packaging or on the filter itself.
Another rating method for residential air filters is AHRI Standard 680 (2009). This standard uses the same particle size categories and test procedures as the ASHRAE 52.2 standard and, like 52.2, includes initial and final airflow resistance; however it does not consolidate the test results into a single rating value, like MERV. Addendum e to ASHRAE Standard 62.2 requires ventilation systems be designed to accommodate the clean‐filter pressure drop rating from AHRI Standard 680. However, as no filters currently have this information available, this new part of ASHRAE 62.2 does not come into force until 2014. Because no filters with an AHRI label could be found for this study, the focus will be on MERV rated filters.
6
Recommendations for minimum MERV ratings are made by several organizations:
• LEED® for Homes (USGBC 2008) includes three levels: minimum: MERV 8, better: MERV 10, and best: MERV 13. It also specifies that filter housings must be airtight to prevent bypass or leakage
• EPA home retrofit protocols1 (EPA 2011) recommend MERV 11. • EPA Indoor Air Plus2 (EPA 2011b) specifies a minimum of MERV 8 • US DOE Building America Builders Challenge specifies meeting the EPA Indoor Air
Plus criteria – i.e., MERV 8 minimum • ASHRAE Standards 62.2 & 62.1 require a minimum of MERV 6 • American Lung Association recommends or MERV 10 or higher (ALA 2006)
While the current study is focused on the impacts on HVAC system performance and energy use, research is continuing on the filtration (particle removal) performance of filters, and how it changes with time. One specific complementary project is ASHRAE Research Project 1360 “How do pressure drop, efficiency, weight gain and loaded dust composition change throughout filter lifetime”. This work is being performed by RTI International. In the interests of collaboration, several filters from the Energy Commission study have been examined by RTI. Unfortunately, this ASHRAE research project will not be complete until the end of 2012; however the results will be useful for future decisions by the Energy Commission when combined with the results of the current project. In particular, the field measurements of changes in filter pressure should be added to those measured in this project.
Traditionally, residential forced air heating and cooling systems used in‐line filters to clean air flowing through the systems to protect the heat exchangers, electric motors and fan blades from dust and debris. It also reduced build‐up on the inside surface of the ducts. More recently, the filtration of air in houses to serve the occupants better is rising in importance due to greater awareness of the impact of clean air on health, for example in the reduction of childhood asthma. In general, the occupants of residential buildings are becoming more aware of a need to provide adequate filtration of indoor air and the places that people look to for guidance ‐ such as the American Lung Association ‐ are recommending the use of high efficiency air filters. In addition, the current U.S. national standard on Indoor Air Quality in homes (ASHRAE Standard 62.2 – 2010), requires the use of at least a MERV 6 filter. Standard 62.2 has been adopted in the 2008 California State Building Energy Code (Title 24). MERV 13 filters or better are also recommended for mold control. Therefore, it is likely that we will see an increased use of higher MERV filters in California residences. As well as increasing filter performance, it is becoming more common to use central forced air system blowers continuously (also as recommended by the ALA) to filter and circulate air in homes, rather than only operating when heating or cooling.
1 http://www.epa.gov/iaq/pdfs/epa_retrofit_protocols.pdf
2 http://www.epa.gov/indoorairplus/pdfs/construction_specifications.pdf
7
1.2 Envelope filtration The building envelope itself can act as a filter for outdoor pollutants. A review by Chen et al. (2011) looked at several published sources of measured ratios of indoor to outdoor particle concentration. For PM2.5 and smaller particles there is a large range of penetration factors from a low of 0.12 to a high of 0.88, but overall highly significant filtration. If we take a middle value of 50 percent of sub 2.5 micron particles being removed, the envelope acts like a MERV 10 filter. For smaller, sub‐micron, particles (that may have different health impacts compared to PM2.5) the penetration factors reported by Chen et al. are close to 1. Other studies in climates where building envelopes are not closed and usually have open doors and windows, such as India (Massey et al. 2012), have found that the indoor concentrations are very similar to outdoor concentrations. This shows that the outdoor air must flow through the envelope to remove the particulates. Other work by MacIntosh et al. (2010) also showed evidence (using CONTAM models3) that homes whose envelopes are closed for air conditioning have lower indoor/outdoor particle ratios (for PM2.5): “The median 24‐h average indoor–outdoor ratio of ambient PM2.5 was 0.57 for homes with natural ventilation, 0.35 for homes with central air conditioning (AC) with conventional filtration, and 0.1 for homes with central AC with high efficiency in‐duct air cleaner”, again showing the impact of envelope air filtration (and, in this case, the effect of deliberate filtration of the house space conditioning system. Stephens and Siegel (2012) measured envelope penetration factors for non‐size‐resolved sub‐micron particles in 19 non‐mechanically ventilated homes. They found a range of penetration factors from 0.17 to 0.72 with a mean of 0.45 again indicating that the building envelope can be an effective filter for these small particles. Their results also showed that tighter homes had less particle penetration.
A Canadian study by Bowser and Fugler (2004) showed how switching from supply only ventilation to exhaust only ventilation dropped the indoor/outdoor PM1.0 ratio from 55 percent to 32 percent, again illustrating the filtering effect of the building envelope (an unfiltered balanced system was between these two results). This same study also looked at adding HEPA filters to balanced and supply‐only systems that further reduced indoor PM1.0 to about 22 percent and 17 percent of outdoor concentrations, respectively. More details of this study in Bowser (1999) and Fugler et al. (2000) showed that indoor particle exposure was dominated by indoor activities for Canadian homes in the winter and cautioned that this may not be the case for homes with regular window opening. The filter in the central forced air heating system had little effect on exposures during active periods (reduction in PM10 of 9‐31 percent), but did have a greater impact on the decay rate after the activity was completed (reduction in PM10 of 13‐71 percent). The study estimated costs of upgraded filters of different types in the range of C$200‐500/year including the operating cost and cost of filters. Roughly half of this additional cost was due to continuous fan operation at a low flow rate to filter the air and the other half due to heating operation.
3 Assuming 14 percent efficiency for one‐inch pleated media (corresponding to the 0.35 ratio above), 90 percent efficiency for electrostatic filter and 70 percent for a portable HEPA filter.
8
Wallace et al. (2004) performed detailed measurements of particulates in an occupied townhouse with continuous fan operation using an electrostatic precipitator (ESP) and mechanical filter (93 percent arrestance according to ASHRAE 52.1). The results showed that over a period of about 800 hours the ESP performance was severely reduced with filtration efficiency dropping from greater than 90 percent for both coarse and fine (<PM2.5) particles to less than 90 percent and 50 percent respectively. For the mechanical filter there was a small change in filtration efficiency (from essentially zero up to about 2 percent) for fine (<PM2.5) particles and a large change from about 55 percent to 75 percent for coarse particles over about 1750 hours of operation. No fan power or pressure measurements were reported.
1.3 Ozone Walker et al. (2009) and Walker and Sherman (2012) modeled ozone penetration for typical building leaks based on laboratory and field estimates of model parameters and found that ozone levels indoors were a few percent higher for supply compared to exhaust mechanical ventilation and that overall penetration rates were in the 5 to 10 percent range – consistent with field data measured in other studies: Stephens et al. (2011), Lee et al. (1999 and 2004) and Stock et al. (1985). Opening windows essentially bypasses the envelope filtration with indoor deposition being the only removal mechanism and the ozone concentrations in Walker et al (2009) and Walker and Sherman (2012) rose to almost 50 percent indoors – again consistent with measured field data (see the bibliography in Walker et al. (2009). Stephens et al. (2011) also showed that the building envelope accounted for 21 percent (+/‐ 13 percent over eight homes) of the ozone removal.
1.4 Energy While better filters will tend to result in improved indoor air quality, there is a cost associated with their improved performance. The key issue is that the improved filtration generally results in filters with greater airflow resistance (Kowalski and Bahnfleth 2002). Four‐inch pleated filters can reduce filter pressure drops by factors of four to seven compared with one‐inch filters of the same MERV rating4 . However, the filter geometry in terms of pleating, filter depth and filter area are all strong enough effects that MERV rating (or equivalent filter efficiency rating) alone is not sufficient to estimate filter pressure drop. Springer (2009) tested clean filters rated from MERV 2 (approximately) to MERV 13 and found that filter pressure drop (that ranged from 0.13 in. water to 0.52 in water at a face velocity of 492 fpm) was not highly correlated with MERV ratings at a fixed air flow. The airflow reduced by 10 percent for a PSC motor and did not change for a BPM powered blower as MERV increased – but the BPM motor used 10 percent more power to maintain the airflow. This expected because a BPM uses a control system to maintain flow whereas a PSC blower has no controls. In contrast to conventional wisdom, this study also reported that extra depth (going from 1 in. to 2 in. deep, or 2 in. to 4 in. deep) only had a marginal effect on clean filter pressure drop. This seems to indicate that other factors such as pleating geometry and filtration media have a strong influence on air flow resistance and
4 http://homes.cerias.purdue.edu/~pmeunier/filters/filters.html
9
pressure drop. More testing of filters would be helpful in determining more general relationships between MERV ratings and air flow resistance and pressure drop.
For commercial HVAC systems there has been work showing how these changes in system pressure drop lead to extra fan power requirements (e.g., Fisk et al. 2002). However, these highly simplified approaches for commercial systems assumed constant blower efficiencies and airflow. In residential systems the blower performance is strongly dependent on system pressures. Previous studies (Walker 2005, Walker 2006a, Walker 2006b, and Lutz et al. 2006)) have shown that residential furnace airflow and power consumption can change significantly by changing system static pressures. These flow changes result in lower air conditioner efficiencies. A simple method of estimating these changes is given in ASHRAE Standard 152 (ASHRAE 2007) and is also accounted for in Title 24 in the ACM Appendix RE and Section 4 that have a 7.5 percent Seasonal Energy Efficiency Ratio (SEER) adjustment for low airflow. Furthermore, the two current motor technologies available in residential HVAC systems have very different reactions to increased system pressures. The Permanent Split Capacitor (PSC) motors (which represent about 90 percent of the market) show reduced airflow and power draw with increasing system pressures. Conversely, brushless permanent magnet (BPM) motors maintain airflow but have increases in power with increased system pressures. Therefore the impact of filtration is different for these two motor types. Another issue is variable capacity systems that operate for most of the time in a low‐fire/low‐speed mode. This further complicates the impact of filtration because in low speed operation the system airflows are much lower (typically half) of the full speed flows. This leads to much lower system pressure differences and the impact of filters on energy use will be altered. In particular, when BPM motors are used for these applications they have significant performance gains because their performance increases as static pressure goes down. So it is possible that high efficiency filters could be used with relatively little energy use in these applications. These impacts of blower technology have not been investigated in previous studies that usually assume constant blower efficiency.
The power and energy requirements for furnace and air conditioner blowers have been investigated in several field studies (see Field Testing Bibliography) that have shown that existing fans in residential air handlers typically consume about 500W, supply about 2 cfm/W and have efficiencies on the order of 10 to 15 percent (combined electric motor and aerodynamic blower wheel efficiency). In particular, California homes showed a higher than average consumption of about 570 W (Proctor and Parker 2000 and Proctor et al. 2011) and use 510 W/1000 cfm or about 2 cfm/W. The results of the recent California Energy Commission field survey (Chitwood 2005 – personal communication) that focuses on new construction in California show similar results, with an average of about 700W per system and 2 cfm/W.
A Canada Mortgage and Housing Corporation (CMHC 1993) study that measured blower performance in homes showed that typical furnace fan efficiencies are on the order of 15 percent, but poor cabinet and duct design that lead to high system static pressures can reduce this to about 7 percent. The spread from best to worst systems was about a factor of ten, indicating that it is possible to have much better performance using existing technologies.
10
Another Canadian study by Phillips (1998 & 1995) performed field tests on 71 houses and found air handler efficiencies in the range of 10‐15 percent.
Some studies have looked at the cost of using furnace blowers to continuously filter indoor air and distribute ventilation air. These studies have shown energy savings of factors of five or more for BPM motors compared to PSC motors when operated at low speed. For example, the Energy Center of Wisconsin (Pigg (2003) and Pigg and Talerico (2004)) tested 31 houses with new (less than three years old) furnaces during the heating season. Almost all the BPM furnaces used more electricity in these real installations than their DOE test procedure ratings suggest: with a median of 82 percent above rated values. This was attributed to the static pressures in these field installations being much higher than those used in rating procedures. Test procedure external static pressures are typically 0.20 or 0.23 inches of water (50 or 57.5 Pa) depending on the capacity (DOE Furnace Test procedure5 and ARI (2003)). The measured field data showed a range of 0.24 to 1.9 inches of water (60 to 475 Pa) with an average of 0.5 inches of water (125 Pa) at the high fire rate. Natural Resources Canada (Gusdorf et al. (2003)) have tested two side‐by‐side calibrated test houses to evaluate the change in energy for using a BPM rather than a PSC motor for continuous fan operation as required in many Canadian houses. Laboratory tests of the air handlers used in the study showed PSC efficiencies in the range of 10 to 15 percent with BPM efficiencies of 17 to 18 percent over the range of flows used for heating and cooling. The biggest differences were for continuous operation where the BPM was six times more efficient than the PSC by being able to operate at about half the flow rate of the PSC during continuous operation. The results of this study showed that for a continuously operating fan in the heating season there was a 74 percent reduction in electricity use for using a BPM (26 percent of the whole‐house electricity use). There is a corresponding increase in natural gas usage in the heating season of 14 percent to account for the reduction in waste heat from the electric motor. For cooling the savings were 48 percent of fan energy and 21 percent of all air conditioner use.
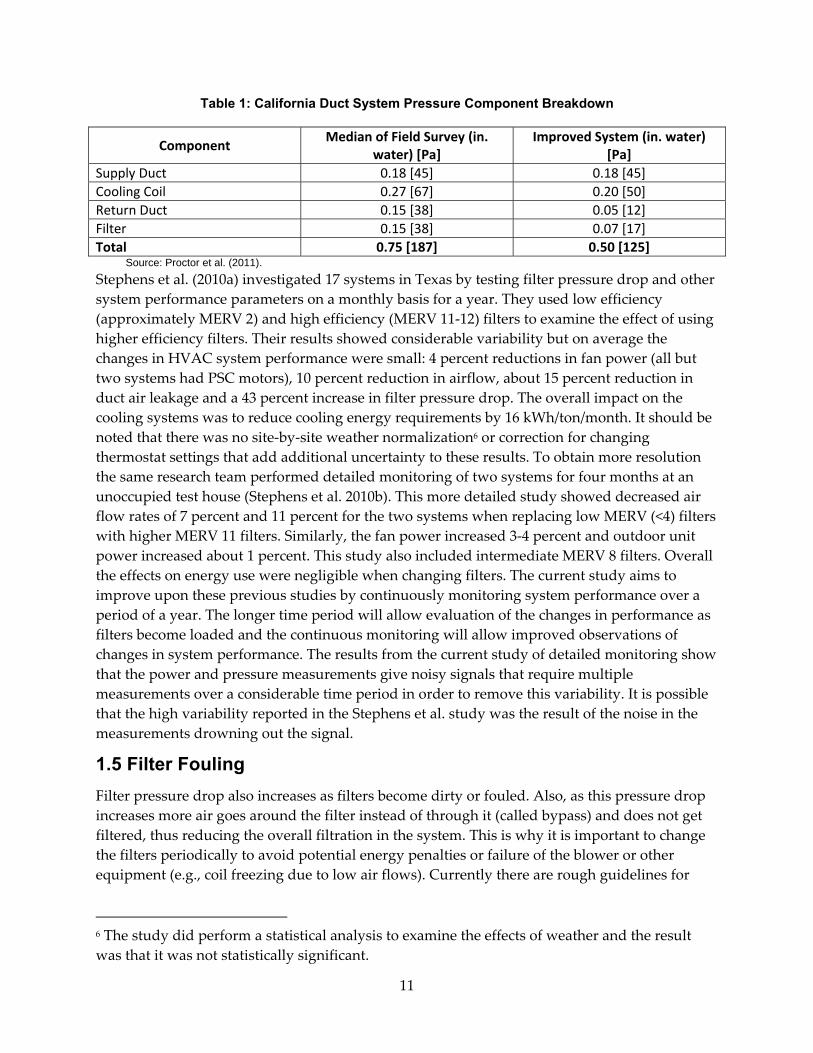
As well as air flows, these and other (see Furnace Field Testing Bibliography) field studies concurred on the external static pressure differences of 0.5 in. of water (125 Pa) for heating only and 0.8 in. of water (200 Pa) for systems with cooling coils. The external static pressure does not include pressure drops across internal heat exchangers and airflow paths inside a furnace or the blower compartment. External static pressure is used because it is practical to measure and is something that can be changed by system design and selection of appropriate filters. Internal pressures can only be altered in the design and manufacture of the equipment. Filters contribute 0.15 in. of water (37.5 Pa) to this total. A field survey in California homes (Chitwood 2005 – personal communication) broke down the elements of system static pressure as shown in Table 1. This table also shows the pressure drop breakdown for improved systems with larger cooling coils, multiple large returns and large (four inch) pleated filters (Proctor et al. 2011). For most systems the simplest way of reducing system static pressures is by changing filters.
5 Code of Federal Regulations, Title 10, Part 430, Subpart B, Appendix N, Uniform Test Method for Measuring the Energy Consumption of Furnaces and Boilers.
11
Table 1: California Duct System Pressure Component Breakdown
Component Median of Field Survey (in.
water) [Pa] Improved System (in. water)
[Pa] Supply Duct 0.18 [45] 0.18 [45] Cooling Coil 0.27 [67] 0.20 [50] Return Duct 0.15 [38] 0.05 [12] Filter 0.15 [38] 0.07 [17] Total 0.75 [187] 0.50 [125]
Source: Proctor et al. (2011).
Stephens et al. (2010a) investigated 17 systems in Texas by testing filter pressure drop and other system performance parameters on a monthly basis for a year. They used low efficiency (approximately MERV 2) and high efficiency (MERV 11‐12) filters to examine the effect of using higher efficiency filters. Their results showed considerable variability but on average the changes in HVAC system performance were small: 4 percent reductions in fan power (all but two systems had PSC motors), 10 percent reduction in airflow, about 15 percent reduction in duct air leakage and a 43 percent increase in filter pressure drop. The overall impact on the cooling systems was to reduce cooling energy requirements by 16 kWh/ton/month. It should be noted that there was no site‐by‐site weather normalization6 or correction for changing thermostat settings that add additional uncertainty to these results. To obtain more resolution the same research team performed detailed monitoring of two systems for four months at an unoccupied test house (Stephens et al. 2010b). This more detailed study showed decreased air flow rates of 7 percent and 11 percent for the two systems when replacing low MERV (<4) filters with higher MERV 11 filters. Similarly, the fan power increased 3‐4 percent and outdoor unit power increased about 1 percent. This study also included intermediate MERV 8 filters. Overall the effects on energy use were negligible when changing filters. The current study aims to improve upon these previous studies by continuously monitoring system performance over a period of a year. The longer time period will allow evaluation of the changes in performance as filters become loaded and the continuous monitoring will allow improved observations of changes in system performance. The results from the current study of detailed monitoring show that the power and pressure measurements give noisy signals that require multiple measurements over a considerable time period in order to remove this variability. It is possible that the high variability reported in the Stephens et al. study was the result of the noise in the measurements drowning out the signal.
1.5 Filter Fouling Filter pressure drop also increases as filters become dirty or fouled. Also, as this pressure drop increases more air goes around the filter instead of through it (called bypass) and does not get filtered, thus reducing the overall filtration in the system. This is why it is important to change the filters periodically to avoid potential energy penalties or failure of the blower or other equipment (e.g., coil freezing due to low air flows). Currently there are rough guidelines for
6 The study did perform a statistical analysis to examine the effects of weather and the result was that it was not statistically significant.
12
changing filters that are usually time based, e.g., the filtrete.com website recommends changing at least every three months with a few caveats:
“For maximum effectiveness, we recommend you change filters every three months. However, the life of a filter can depend on the individual conditions in your home. You may need to change your filter more often if your home has:
• Unusually dirty ductwork • Construction work in progress • Furniture or drywall sanding in progress • Pets • Smokers • A fan running continuously
In these cases, you may want to change the filter more frequently.” Some thermostats track system runtime and provide a visual reminder on the thermostat display for filter changing. Some fairly detailed academic models for rate of fouling of coils and filters have been developed by Lui et al. (2003) and Siegel and Nazaroff (2002). However, these models all require extensive input data that are generally unknown; in particular, the quantity and size distribution of particulates in the air entering the filter are difficult to predict. For this study we plan to make some long‐term measurements of filter pressure drop changes in real houses to get a better understanding of fouling in real‐life situations. Although these tests will not control the particles fouling the filters they will provide baseline fouling information that can be used in future modeling efforts. Siegel et al. 2002 performed some simple calculations to estimate the effects on system performance of fouled coils and found changes of about 5 percent. For fouled coils the primary change in performance is due to lower airflows rather than the fouling reducing heat transfer. However, the method of calculating blower performance changes used by Siegel et al. assumed constant efficiencies and the work discussed above has shown that much of the performance change comes from changes in efficiency rather than increases in air power requirements assuming constant airflow. These models have not addressed the combined airflow rate, duct leakage changes, blower type interactions, etc. that are proposed in this study.
A detailed laboratory study by Yang et al. (2004) has shown that the energy implications from fouling of coils is all due to lower air flows and in some cases initial fouling can actually increase heat transfer rates. In addition, their work showed that higher MERV filters resulted in lower Energy Efficiency Ratios (EERs) for air conditioners. E.g., clean MERV 14 filters reduced EER by 9 percent. The higher MERV filters also showed greater changes in EER as they became loaded. A MERV 4 filter only dropped 2 percent in EER, but a fouled MERV 14 filter dropped 9 percent of EER. Finally, this work also showed that lower efficiency fans were more sensitive to filter changes and that using real fan curves (rather than fixed efficiency) gave bigger changes in EER.
Although energy use associated with air filtration is a recognized issue that is mentioned in filter manufacturers’ sales literature7, there is little information on the magnitude of impacts in 7 http://www.allergybuyersclubshopping.com/as‐ap‐aircleen‐furnace‐filters.html
13
typical residential systems, the sensitivity of these impacts to system specifications (e.g., use of different blowers) or how these impacts can be reduced or controlled.
Work by Walker (2006a) and Lutz et al. (2006) on the energy and power consumption of residential central forced air system blowers has shown in detail the dependence of blower performance on system pressures. BPM motors are able to maintain system airflows and heat exchanger performance at higher pressures at the expense of additional motor power. BPM motors perform significantly better at low airflows – by factors of two or more in terms of power consumption. Conversely, PSC motors have reduced airflows at higher pressures leading to reduced air conditioner performance. Thus, the impacts of filter pressure drop depend on the specific motor technology being utilized. Because BPM motors are much more efficient at lower system pressures, low pressure drop filters can contribute significantly to the energy savings potential of variable speed motor technologies. Combining these results with the information in Table 1, it is clear that filter performance has the potential to significantly change blower and heating/cooling equipment energy and power use.
There is a Standard for rating blowers that recognizes these sensitivities to airflow and external static pressure. CSA C823‐11 Performance of Air Handlers in Residential Space Conditioning Systems (CSA 2011) requires testing of blowers under various conditions and then combines the results into a single number that accounts for the fraction of time the blower operates in each condition. The testing is performed by creating a system air flow resistance that meets target external static pressure difference targets for both recommended practice (0.3 in. water (75 Pa)) and common practice (0.6 in. water (150 Pa) with the system operating in full‐load space heating mode. This same airflow resistance is then used for all other modes of operation: higher flows and pressures for cooling or lower flows and pressures for multi‐speed systems (including lowest speed recirculation mode that is popular in Canadian homes). This standard was developed with input from manufacturers, utilities, contractors, designers and researchers (including LBNL). In the future the Energy Commission could set performance standards for blowers, air handlers and furnaces that use this standard for rating.
The Energy Commission has shown concern about the longevity and durability of performance credits in the California Residential Building Energy Code (referred to as “Title 24” for the rest of this report). The issue of different filters changing system performance should be of additional concern to the Commission for Title 24 compliance issues. A system tested with a low pressure drop filter may meet the airflow requirements for obtaining credit for full SEER rating. If the occupant later switch filters and reduces the airflow, the house can become non‐compliant and will use more energy. Therefore it is important to determine the potential magnitudes of these performance changes and to provide information to the Commission and home occupants on the energy and performance impacts of filter selection.
In addition to the energy use implications of filtration there can be catastrophic consequences of filter changing that are poorly understood. Most HVAC systems in existing homes were designed and installed for use with simple glass fiber filters that have low airflow resistance. The change to higher MERV filtration and its associated greater filter pressure drop and system airflow reduction can result in premature blower failure, operation of furnaces on high limit switches and increase the potential for coil icing and premature compressor failure in cooling
14
systems. For cooling systems, the performance reductions change rapidly below about 200 cfm/ton (Rodriguez (1995) and Parker et al. (1997)). Systems that are close to this limit may be pushed over the edge with the addition of increased pressure drop filters.
1.6 Peak Demand In addition to energy use the electricity used by blower motors contributes to peak power demand. The definition of peak demand period used in this study comes from the CPUC Energy Efficiency Policy Manual Version 2, and is noon to 7:00 p.m. Monday through Friday, June 1 through September 30. The peak demand saving is therefore not just the change in power consumption during system operation but includes the cycling effects of air conditioning at part load.
To obtain statewide peak savings estimates, the power savings for an individual system need to be multiplied by the number of houses with air conditioning and the fraction of time the air conditioning operates during the peak period. There are roughly 8 million homes in California with about 1/3 of them (or 2.67 million) having central air conditioning that would operate during the peak demand period. The fractional operating time in the peak period is highly variable depending on the climate. Previous work by LBNL for the Energy Commission (Walker and Sherman 2006) included sophisticated modeling of energy use of houses in California. Data from the modeling shows that in central valley (Climate Zones 11,12 and 13) that fractional operating time for the peak demand period varies from 13 percent in CZ 12 to 25 percent in CZ 13.
The question, then, is what geographical areas are of interest for the Commission? If it is the whole state, then a lower fractional operating time might be appropriate. If the Commission wishes to focus on high‐use areas with rapid growth, then the Central Valley results would be appropriate. For the purposes of these estimates, a fractional operating time of 25 percent will be used, recognizing that this will be on the high‐end of potential impacts. The 25 percent is not a measure of the number of hours of operation per year – but is the fractional on time at peak demand conditions. The CPUC peak definition covers three months totaling 121 days. Because the peak only applies on weekdays the total number there are 87 peak days. At 7 hours per day this is 610 hours a year of peak. The 25 percent value indicates that air conditioners operate for 152.5 hours at CPUC defined peak conditions.
The definition of peak demand period restrains the peak electricity reductions to those during air conditioning operation. This means that the blowers are most likely to be at high speed. The peak demand implications will be evaluated for two scenarios:
The first assumes that variable speed BPMs are used together with typical California duct systems.
The second scenario assumes that duct systems are improved to be as good as we can reasonably expect for California systems with low pressure drop filters (half of typical pressure drop) and cooling coils.
For a typical California system of 3.5 Tons, combining the blower performance together with changes in air conditioner performance (due to changes in air flow with system pressures) and
15
using a fractional on‐time of 25 percent during the peak demand period results in a net peak demand reduction for a variable speed motor of 48 W per house. If this were applied to all 2.7 million systems in the state it would be a peak demand reduction of 0.13 GW. This probably represents an upper bound as some climates will have less fractional on time on peak, and other studies have shown that not all air conditioning systems are operational. For good duct systems with reduced pressures results in a net peak demand reduction for a variable speed motor of 67 W per house. If this were applied to all 2.7million systems in the state, it would be a peak demand reduction of 0.18 GW. Again, this represents an upper bound.
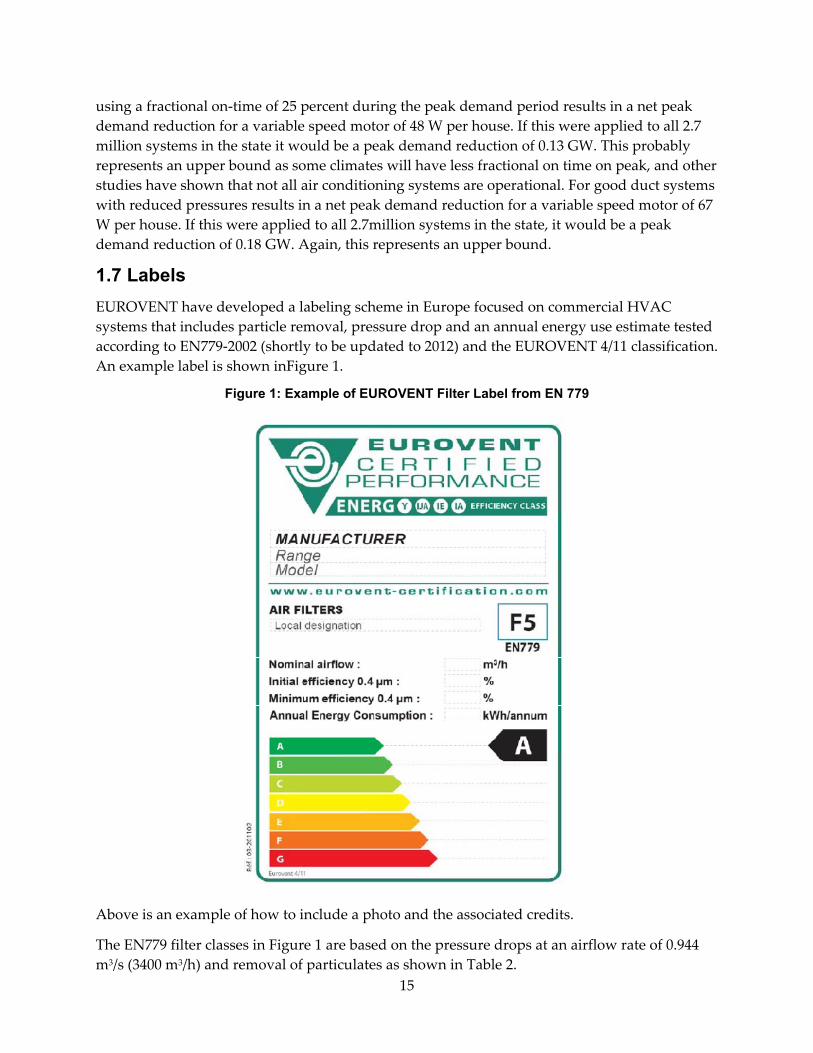
1.7 Labels EUROVENT have developed a labeling scheme in Europe focused on commercial HVAC systems that includes particle removal, pressure drop and an annual energy use estimate tested according to EN779‐2002 (shortly to be updated to 2012) and the EUROVENT 4/11 classification. An example label is shown inFigure 1.
Figure 1: Example of EUROVENT Filter Label from EN 779
Above is an example of how to include a photo and the associated credits.
The EN779 filter classes in Figure 1 are based on the pressure drops at an airflow rate of 0.944 m3/s (3400 m3/h) and removal of particulates as shown in Table 2.
16
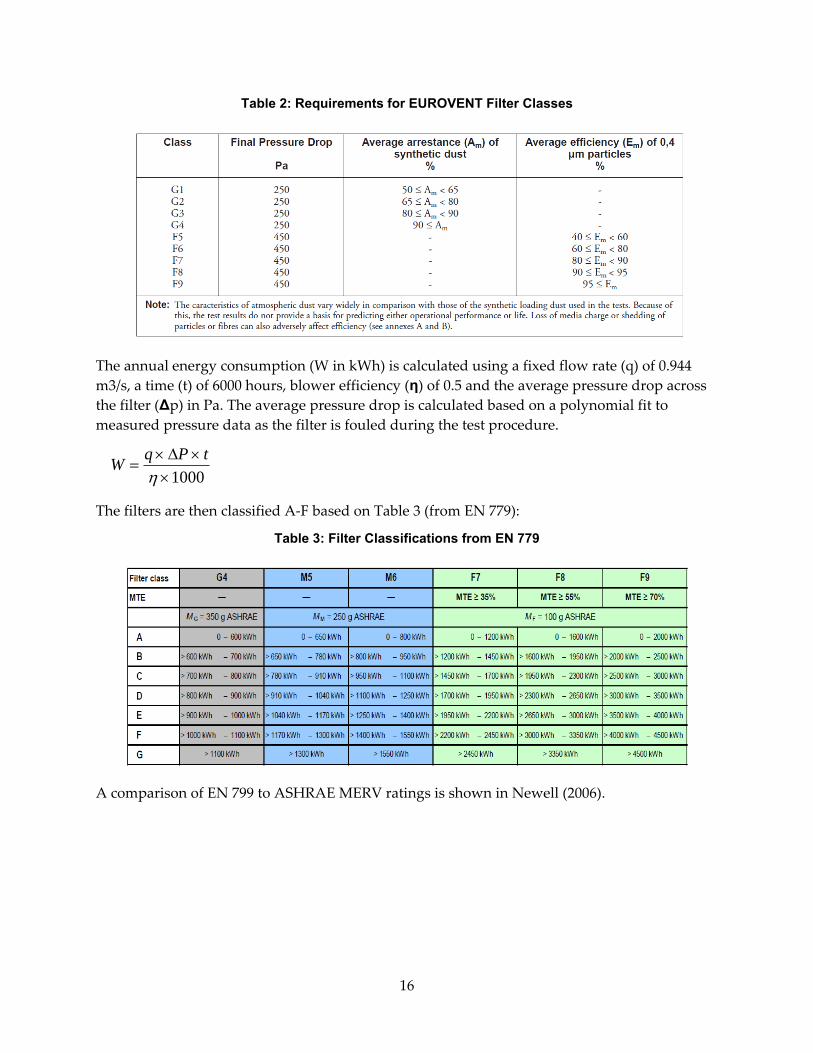
Table 2: Requirements for EUROVENT Filter Classes
The annual energy consumption (W in kWh) is calculated using a fixed flow rate (q) of 0.944 m3/s, a time (t) of 6000 hours, blower efficiency (η) of 0.5 and the average pressure drop across the filter (Δp) in Pa. The average pressure drop is calculated based on a polynomial fit to measured pressure data as the filter is fouled during the test procedure.
W =q × ΔP × tη ×1000
The filters are then classified A‐F based on Table 3 (from EN 779):
Table 3: Filter Classifications from EN 779
A comparison of EN 799 to ASHRAE MERV ratings is shown in Newell (2006).
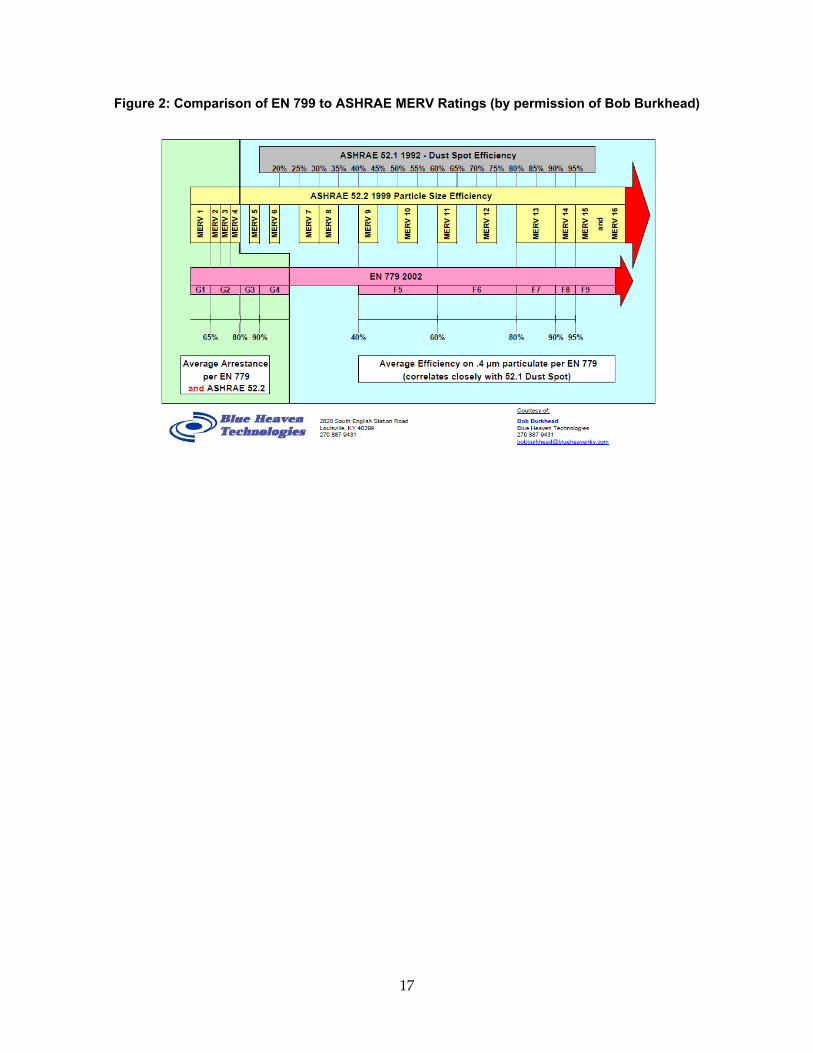
17
Figure 2: Comparison of EN 799 to ASHRAE MERV Ratings (by permission of Bob Burkhead)
18
CHAPTER 2: Field Testing of Filter Impacts on HVAC System Performance This is an example of a Chapter break. Each Chapter should start on a separate page.
Ten homes were tested for this study. They were selected to cover a range of parameters of interest: different filter thicknesses including large four‐inch pleated filters, variable speed motors, single speed motors, filters at return grilles, filters at the furnace/blower, filters in both locations, systems with heat only, a multispeed heating system, and systems with both heating and cooling. The houses were located in several California climates including San Francisco Bay Area (including both mild coastal and less mild inland), northern California coast, and the California Central valley. The limited nature of this study means that the test houses were not necessarily a statistically valid sample from the point of view of inferring statewide implications with great precision. However, these homes provide baseline sample data on filter energy implications that does not currently exist.
The field testing has two parts. The first part was diagnostic testing to characterize the home and HVAC system(s). The second part is long‐term testing over approximately one year. The long‐term testing was used to observe rates of filter fouling, changes in filter pressure drop and associated system performance changes.
2.1 Diagnostic Testing For each house/system the following diagnostic tests were performed:
2.1.1 Air Flow The system airflow was measured using the supply plenum pressure‐matching techniques in ASTM Standard E1554‐07 (ASTM 2007) and ASHRAE Standard 152 (ASHRAE 2007). In this method, the pressure difference between the supply plenum and house was measured with the system operating normally. The return airflow path was blocked and an Energy Conservatory Duct Blaster connected at the blower access. The combination of furnace blower and duct blaster fan were used to recreate the same supply plenum to house pressure difference and the resulting airflow through the duct blaster is the system operating flow. Additional tests were performed for systems that had different airflows for heating or cooling, or had multi‐speed/multi‐capacity systems. One home had a zoned system and further tests were performed to determine air flows in each zoning mode. In order to estimate the duct system airflow characteristics in more detail, data were recorded over a range of pressure differences and air flows.
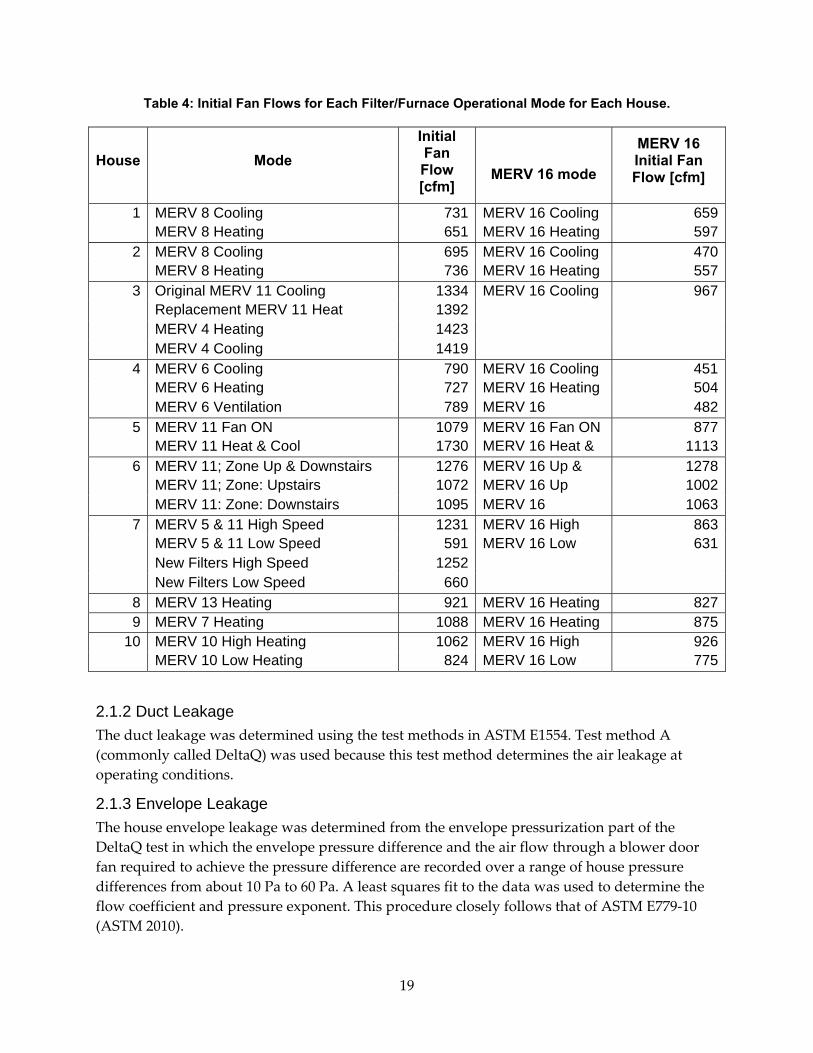
19
Table 4: Initial Fan Flows for Each Filter/Furnace Operational Mode for Each House.
House Mode Initial Fan Flow [cfm]
MERV 16 mode
MERV 16 Initial Fan Flow [cfm]
1 MERV 8 Cooling 731 MERV 16 Cooling 659 MERV 8 Heating 651 MERV 16 Heating 597
2 MERV 8 Cooling 695 MERV 16 Cooling 470 MERV 8 Heating 736 MERV 16 Heating 557
3 Original MERV 11 Cooling 1334 MERV 16 Cooling 967 Replacement MERV 11 Heat 1392 MERV 4 Heating 1423 MERV 4 Cooling 1419
4 MERV 6 Cooling 790 MERV 16 Cooling 451 MERV 6 Heating 727 MERV 16 Heating 504 MERV 6 Ventilation 789 MERV 16 482
5 MERV 11 Fan ON 1079 MERV 16 Fan ON 877 MERV 11 Heat & Cool 1730 MERV 16 Heat & 1113
6 MERV 11; Zone Up & Downstairs 1276 MERV 16 Up & 1278 MERV 11; Zone: Upstairs 1072 MERV 16 Up 1002 MERV 11: Zone: Downstairs 1095 MERV 16 1063
7 MERV 5 & 11 High Speed 1231 MERV 16 High 863 MERV 5 & 11 Low Speed 591 MERV 16 Low 631 New Filters High Speed 1252 New Filters Low Speed 660
8 MERV 13 Heating 921 MERV 16 Heating 8279 MERV 7 Heating 1088 MERV 16 Heating 875
10 MERV 10 High Heating 1062 MERV 16 High 926 MERV 10 Low Heating 824 MERV 16 Low 775
2.1.2 Duct Leakage The duct leakage was determined using the test methods in ASTM E1554. Test method A (commonly called DeltaQ) was used because this test method determines the air leakage at operating conditions.
2.1.3 Envelope Leakage The house envelope leakage was determined from the envelope pressurization part of the DeltaQ test in which the envelope pressure difference and the air flow through a blower door fan required to achieve the pressure difference are recorded over a range of house pressure differences from about 10 Pa to 60 Pa. A least squares fit to the data was used to determine the flow coefficient and pressure exponent. This procedure closely follows that of ASTM E779‐10 (ASTM 2010).
20
2.1.4 Other Information For each system the following information was recorded: duct locations, duct dimensions including number of supply and return grilles, duct insulation, air conditioner control, nameplate information for heating and cooling, age of heating/cooling equipment and ducts.
For each home the following information was recorded: age of house, house characteristics (floor area, number of stories, presence of insulation, window type, roof type), dust generation characteristics (presence of carpet, number of occupants, number of pets, type of furnishings, geographical location (for outdoor particle issues, e.g., near California central valley agriculture), presence of smokers, cooking, and health issues for occupants (e.g., asthma).
2.2 Long-Term Testing The long term testing was over a period of approximately one year and covered both heating and cooling seasons to observe the changes in both heating and cooling system performance. The long sampling period also allowed the evaluation of both high and low MERV filters for each individual system. The rate of filter loading was determined by the air in the homes and there was no additional loading during the experiments. Although the small sample size of homes means that it is not necessarily a statistically rigorous sample of homes, they were located in different locations (both rural and urban) and covered a range of occupancies – including the presence of pets in several homes. Therefore, the results can give some guidance on filter loading rates in homes. These are the only continuous measurements of filter loading in existence; previous research Stephens et al. (2011) and current research (ASHRAE RP‐1360) performed monthly observations in which it is difficult to observe the gradual changes in pressures and other system performance parameters with time.
The original plan was to visit each home once a month and perform a diagnostic evaluation on each visit. However, upon consultation with other researchers and the development of improved data acquisition capabilities the decision was made to take much more detailed data. Each house was equipped with a set of instruments to monitor the HVAC system that communicated wirelessly to a central computer. This computer recorded all the data and communicated via the internet so that it was possible to remotely check on the progress of the experiments as well as get access to the data at any time. This allowed for data to be recorded in fine time increments and gave us the ability to estimate changes in filter performance as a function of operating time and airflow. It also helped to troubleshoot homes remotely so that very little data was lost during the experiments. The following data were recorded every 10 seconds:
2.2.1 Duct System Pressures The pressure drop across the filter as well as at supply and return plenums and at selected locations in the supply and return duct system were measured using static pressure probes and digital manometers (Energy Conservatory, DG‐700 with a pressure resolution of 0.1 Pa and an accuracy of ± 1 percent). These measurements isolated the components of total system pressure into filter, supply ducts, return ducts, and the cooling coil.
21
2.2.2 Power Consumption of System Blower This was measured using true power meters (WattNode Power and Energy meters in conjunction with current transformers and voltage readings) to avoid errors associated with low power factor operation (particularly for BPM motors). The uncertainty of the power measurements ± 4.5 percent of the reading but the precision is about ± 0.5 percent.
2.2.3 Other data collected In addition to the pressures and energy usage, we also measured the temperature in the supply and return plenum as well as the occupied space. The temperature in the occupied space was usually at the thermostat and if there were two floors, then on both floors. The temperature sensors were wireless (Point Six Wireless) and the temperatures were recorded by the same computer that recorded all of the data. The accuracy of the temperature measurements was +/‐ 0.5°C.
2.2.4 Initial Filters Most homes had a new filter installed at the beginning of the monitoring project, while others started with filters installed earlier by homeowners, depending on the state and MERV rating of the filter in place at the start of the experiments (if the original filter was higher MERV we left it in place). House 2 had a dirty filter at the start of the measurements. House 1 started with a dirty filter then changed to a new filter about 1 month after start of measurements. House 5 started with filters that were 2 months old. Roughly halfway through each year of testing the filters were changed. The intent was to have part of a heating season and part of a cooling season for each filter. In most cases a MERV 16 filter was used as a replacement. In homes 3 and 7 the MERV 16 filter created too much noise and was replaced with a less restrictive filter after a few days of operation.
2.2.5 House Summary Table 5 summarizes the age, floor are and volume of each home. Table 6 summarizes details of the heating and cooling systems and the filters as found in each home. In addition to these summaries, the following points were noted:
• Houses 1, 2, 3, 4, 5, and 6 had both heating and cooling. • Houses 7, 8, 9 and 10 had heating only. • House 1 had two systems – only one of which was monitored. The furnace was located
in a closet inside the house and the return grille mounted filter was located in the ceiling just outside the closet housing the furnace. There were three occupants (during summer a fourth college student) in the house.
• House 2 had a single system installed in the attic and the return grille and filter were in the ceiling on the second floor. This house had four occupants.
• House 3 had a single system with the furnace located in the attic. There were two return grilles and filters on the second floor, a small one in the ceiling of the master bedroom and a large one in the ceiling just outside the door of the master bedroom. One couple occupied the house as well as one cat that lived indoors and did not go outside.
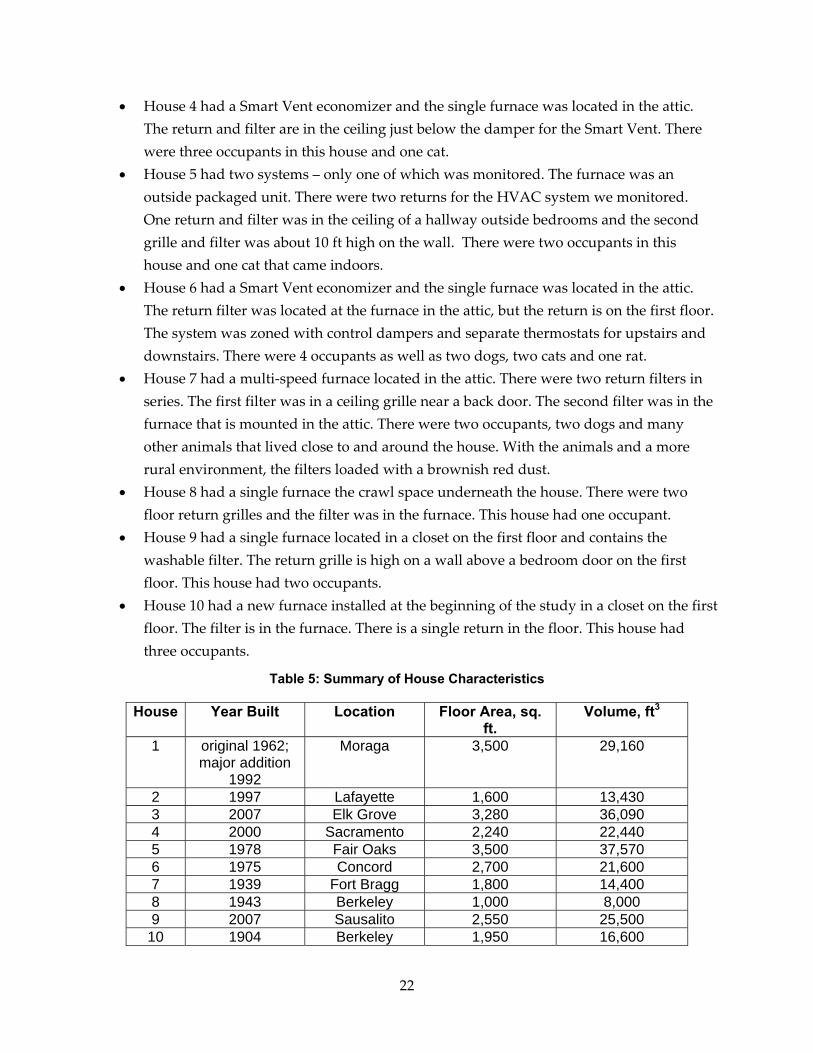
22
• House 4 had a Smart Vent economizer and the single furnace was located in the attic. The return and filter are in the ceiling just below the damper for the Smart Vent. There were three occupants in this house and one cat.
• House 5 had two systems – only one of which was monitored. The furnace was an outside packaged unit. There were two returns for the HVAC system we monitored. One return and filter was in the ceiling of a hallway outside bedrooms and the second grille and filter was about 10 ft high on the wall. There were two occupants in this house and one cat that came indoors.
• House 6 had a Smart Vent economizer and the single furnace was located in the attic. The return filter was located at the furnace in the attic, but the return is on the first floor. The system was zoned with control dampers and separate thermostats for upstairs and downstairs. There were 4 occupants as well as two dogs, two cats and one rat.
• House 7 had a multi‐speed furnace located in the attic. There were two return filters in series. The first filter was in a ceiling grille near a back door. The second filter was in the furnace that is mounted in the attic. There were two occupants, two dogs and many other animals that lived close to and around the house. With the animals and a more rural environment, the filters loaded with a brownish red dust.
• House 8 had a single furnace the crawl space underneath the house. There were two floor return grilles and the filter was in the furnace. This house had one occupant.
• House 9 had a single furnace located in a closet on the first floor and contains the washable filter. The return grille is high on a wall above a bedroom door on the first floor. This house had two occupants.
• House 10 had a new furnace installed at the beginning of the study in a closet on the first floor. The filter is in the furnace. There is a single return in the floor. This house had three occupants.
Table 5: Summary of House Characteristics
House Year Built Location Floor Area, sq. ft.
Volume, ft3
1 original 1962; major addition
1992
Moraga 3,500 29,160
2 1997 Lafayette 1,600 13,430 3 2007 Elk Grove 3,280 36,090 4 2000 Sacramento 2,240 22,440 5 1978 Fair Oaks 3,500 37,570 6 1975 Concord 2,700 21,600 7 1939 Fort Bragg 1,800 14,400 8 1943 Berkeley 1,000 8,000 9 2007 Sausalito 2,550 25,500
10 1904 Berkeley 1,950 16,600
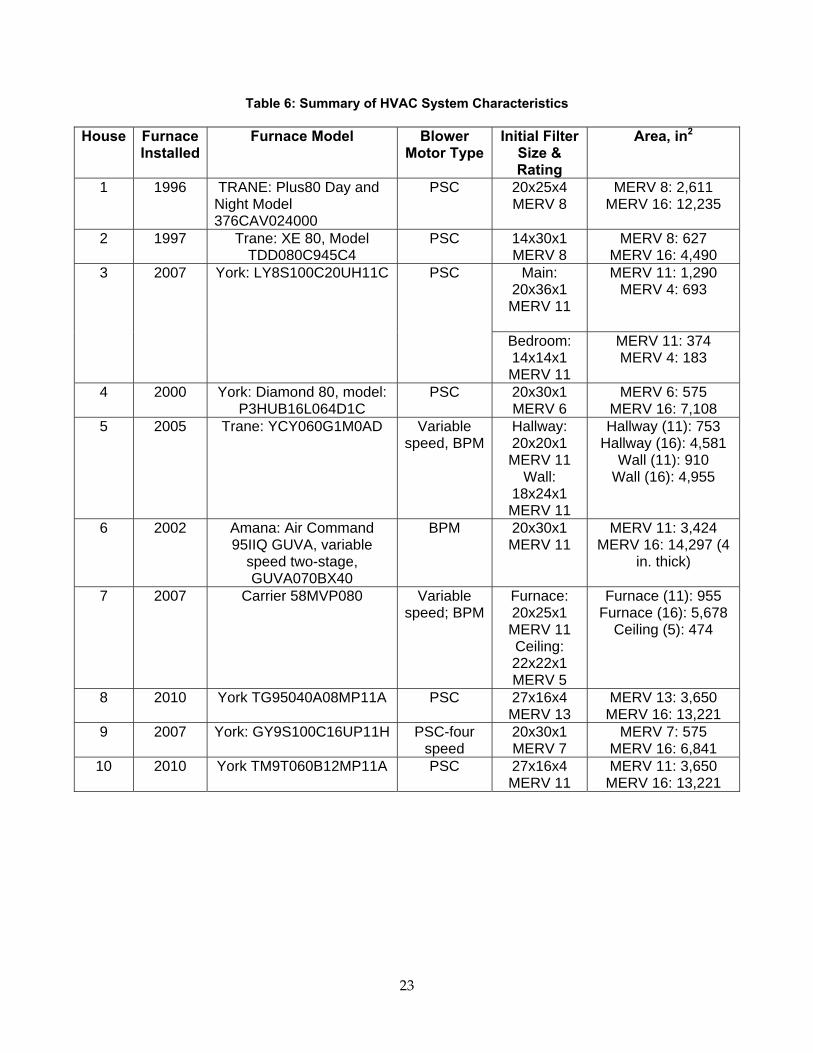
23
Table 6: Summary of HVAC System Characteristics
House Furnace Installed
Furnace Model Blower Motor Type
Initial Filter Size & Rating
Area, in2
1 1996 TRANE: Plus80 Day and Night Model 376CAV024000
PSC 20x25x4 MERV 8
MERV 8: 2,611 MERV 16: 12,235
2 1997 Trane: XE 80, Model TDD080C945C4
PSC 14x30x1 MERV 8
MERV 8: 627 MERV 16: 4,490
3 2007 York: LY8S100C20UH11C PSC Main: 20x36x1 MERV 11
MERV 11: 1,290 MERV 4: 693
Bedroom: 14x14x1 MERV 11
MERV 11: 374 MERV 4: 183
4 2000 York: Diamond 80, model: P3HUB16L064D1C
PSC 20x30x1 MERV 6
MERV 6: 575 MERV 16: 7,108
5 2005 Trane: YCY060G1M0AD Variable speed, BPM
Hallway: 20x20x1 MERV 11
Wall: 18x24x1 MERV 11
Hallway (11): 753 Hallway (16): 4,581
Wall (11): 910 Wall (16): 4,955
6 2002 Amana: Air Command 95IIQ GUVA, variable
speed two-stage, GUVA070BX40
BPM 20x30x1 MERV 11
MERV 11: 3,424 MERV 16: 14,297 (4
in. thick)
7 2007 Carrier 58MVP080 Variable speed; BPM
Furnace: 20x25x1 MERV 11 Ceiling: 22x22x1 MERV 5
Furnace (11): 955 Furnace (16): 5,678
Ceiling (5): 474
8 2010 York TG95040A08MP11A PSC 27x16x4 MERV 13
MERV 13: 3,650 MERV 16: 13,221
9 2007 York: GY9S100C16UP11H PSC-four speed
20x30x1 MERV 7
MERV 7: 575 MERV 16: 6,841
10 2010 York TM9T060B12MP11A PSC 27x16x4 MERV 11
MERV 11: 3,650 MERV 16: 13,221
24
CHAPTER 3: Field Test Results To determine trends of pressure, power and flow as filters become loaded it is not sufficient to look at time since installation because it is the quantity of particles that have entered the filter that is the parameter of interest. For simplicity, it is assumed that the particle concentrations do not change significantly with time so that the cumulative mass flow through the filter can be used as a surrogate for particle mass. For multi‐speed systems, or those with different airflow for heating and cooling, time of operation is itself not sufficient. Instead the sum of the mass flow is used (in kg), where the mass flow changes depending on system operation mode. The mode of operation was determined by observations of measured system pressures and fan power.
One of the first results of this study was to observe the status of the filters that existed in the homes when we arrived. As other researchers have found, filters are often installed incorrectly or very dirty and in need of changing.
The first data recorded in each house was with the filter type that the homeowner had installed. In most homes, new filters of this type were installed. After about 6 months of data collection, the filters were replaced with MERV 16 filters. In some of the houses, the MERV 16 filters the pressure drop was so high that a whistling sound was produced when the furnace fan was on. This whistling was annoying to some homeowners, and at Houses 3 and 7 they were removed after a few days. They were replaced with the previous model of filter. In House 3, some very low quality filters (about MERV 4) were installed so that we could record data with two different filter qualities. At House 7, there were two filters in series. After MERV 16 filters were installed in both locations for a few days, the one at the ceiling was changed back to a low quality filter.
Photos of the filters and plots of the recorded data for each house are presented below. The horizontal axis of each plot is in units of the accumulated mass of air that flowed through the filters. This is expressed in units of 106kg. Cumulative mass flow is used because the values monitored ‐ filter, fan, and plenum pressures, and fan power ‐ appear to change in a linear fashion when plotted against cumulative 106kg. This simple linear relationship has physical limits because at a low enough flow the fan motor overheats and stops. Others have suggested an exponential decay to model these changes but we have decided to use a linear model as this fits the data for the time periods we observed. We also note that a linear relationship for both the supply plenum pressure and the fan flow rate and supply leakage cannot all be correct, but over the limited range of the values that we observed, a linear relationship describes the data well and is simpler to model.
A study by Liu et al. (2003) combined an air filter pressure loss model with laboratory testing to estimate how filter pressure drop (airflow resistance) changes as filters become loaded. Their model showed exponential changes in pressure difference relative to initial pressure with time that we did not observe in our measured data.
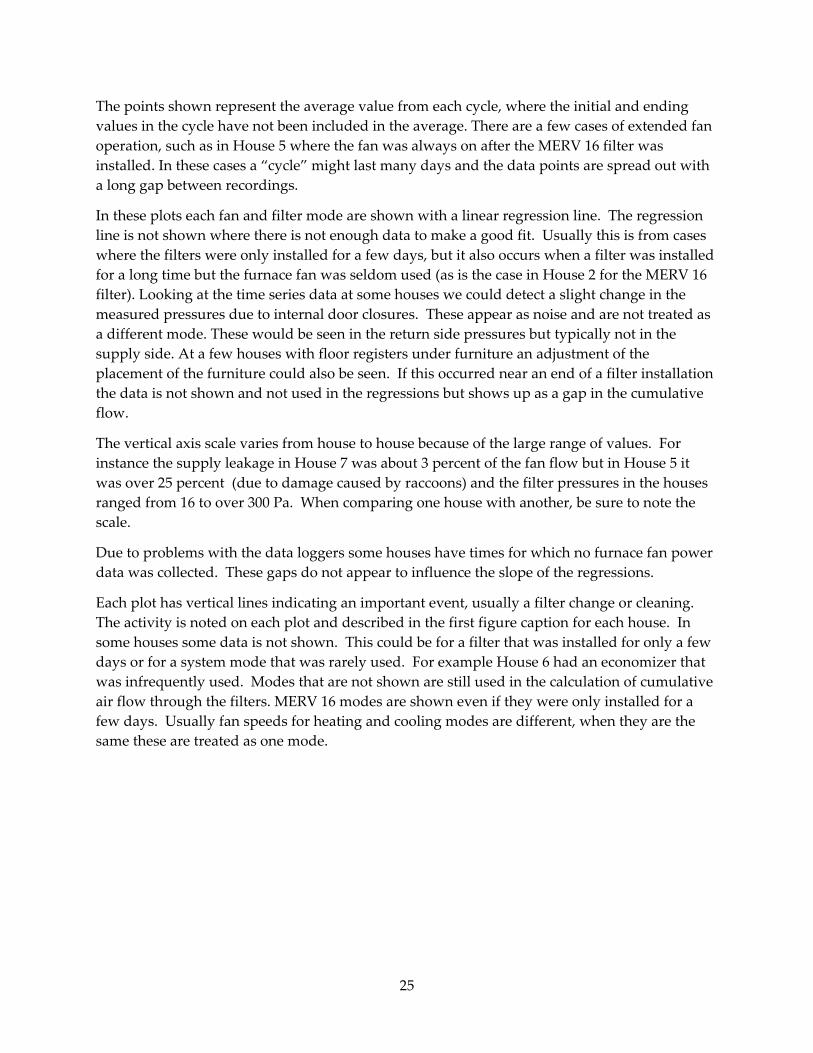
25
The points shown represent the average value from each cycle, where the initial and ending values in the cycle have not been included in the average. There are a few cases of extended fan operation, such as in House 5 where the fan was always on after the MERV 16 filter was installed. In these cases a “cycle” might last many days and the data points are spread out with a long gap between recordings.
In these plots each fan and filter mode are shown with a linear regression line. The regression line is not shown where there is not enough data to make a good fit. Usually this is from cases where the filters were only installed for a few days, but it also occurs when a filter was installed for a long time but the furnace fan was seldom used (as is the case in House 2 for the MERV 16 filter). Looking at the time series data at some houses we could detect a slight change in the measured pressures due to internal door closures. These appear as noise and are not treated as a different mode. These would be seen in the return side pressures but typically not in the supply side. At a few houses with floor registers under furniture an adjustment of the placement of the furniture could also be seen. If this occurred near an end of a filter installation the data is not shown and not used in the regressions but shows up as a gap in the cumulative flow.
The vertical axis scale varies from house to house because of the large range of values. For instance the supply leakage in House 7 was about 3 percent of the fan flow but in House 5 it was over 25 percent (due to damage caused by raccoons) and the filter pressures in the houses ranged from 16 to over 300 Pa. When comparing one house with another, be sure to note the scale.
Due to problems with the data loggers some houses have times for which no furnace fan power data was collected. These gaps do not appear to influence the slope of the regressions.
Each plot has vertical lines indicating an important event, usually a filter change or cleaning. The activity is noted on each plot and described in the first figure caption for each house. In some houses some data is not shown. This could be for a filter that was installed for only a few days or for a system mode that was rarely used. For example House 6 had an economizer that was infrequently used. Modes that are not shown are still used in the calculation of cumulative air flow through the filters. MERV 16 modes are shown even if they were only installed for a few days. Usually fan speeds for heating and cooling modes are different, when they are the same these are treated as one mode.
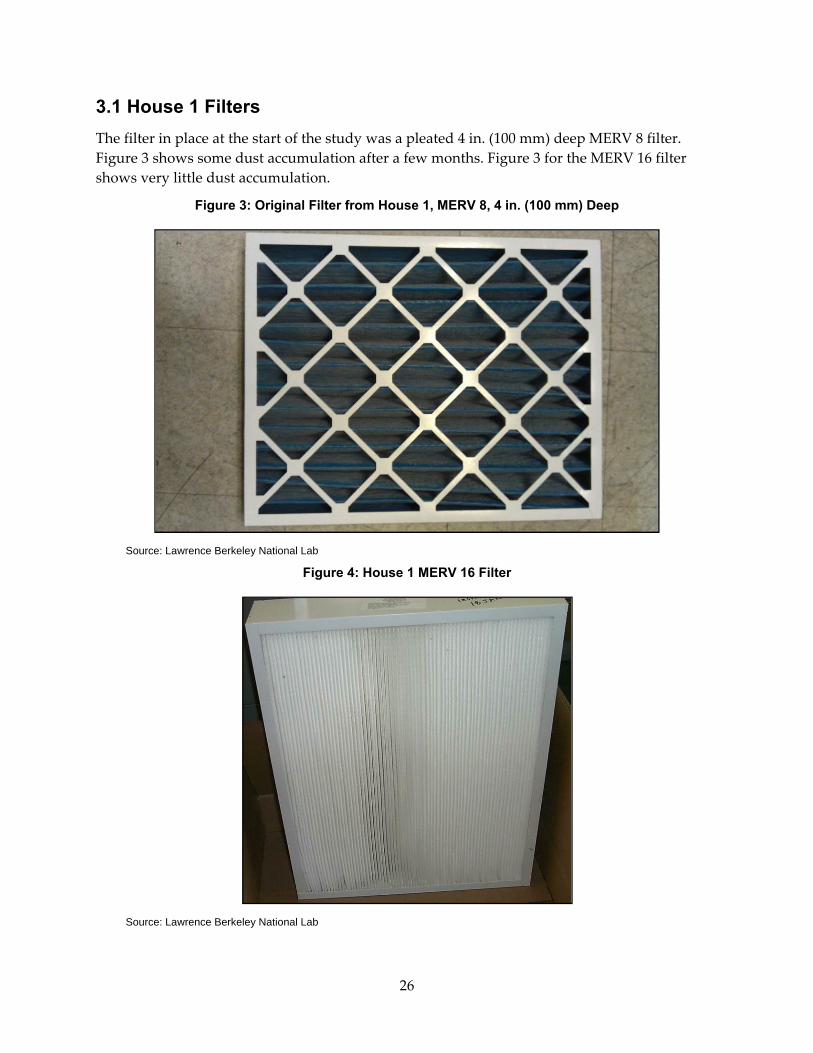
26
3.1 House 1 Filters The filter in place at the start of the study was a pleated 4 in. (100 mm) deep MERV 8 filter. Figure 3 shows some dust accumulation after a few months. Figure 3 for the MERV 16 filter shows very little dust accumulation.
Figure 3: Original Filter from House 1, MERV 8, 4 in. (100 mm) Deep
Source: Lawrence Berkeley National Lab
Figure 4: House 1 MERV 16 Filter
Source: Lawrence Berkeley National Lab
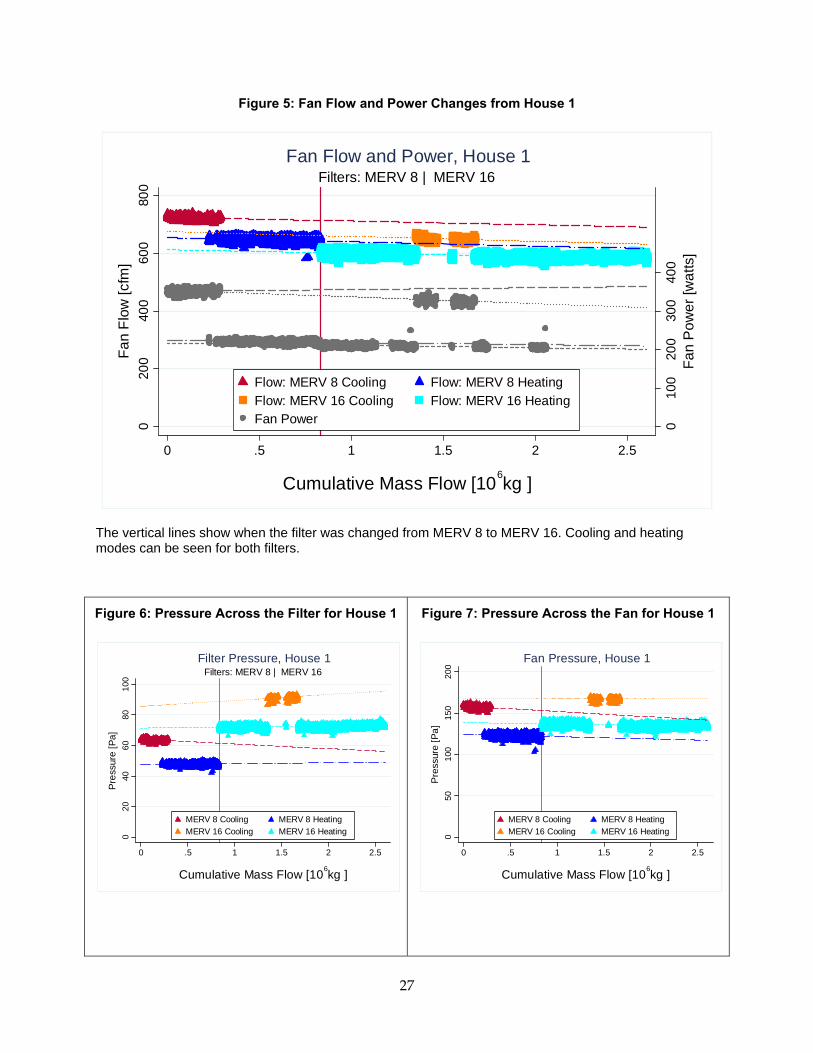
27
Figure 5: Fan Flow and Power Changes from House 1
The vertical lines show when the filter was changed from MERV 8 to MERV 16. Cooling and heating modes can be seen for both filters.
Figure 6: Pressure Across the Filter for House 1
Figure 7: Pressure Across the Fan for House 1
010
020
030
040
0
020
040
060
080
0
0 .5 1 1.5 2 2.5
Flow: MERV 8 Cooling Flow: MERV 8 HeatingFlow: MERV 16 Cooling Flow: MERV 16 HeatingFan Power
Fan
Pow
er [w
atts
]
Fan
Flow
[cfm
]
Cumulative Mass Flow [10 6kg ]
Filters: MERV 8 | MERV 16Fan Flow and Power, House 1
020
4060
8010
0
0 .5 1 1.5 2 2.5
MERV 8 Cooling MERV 8 HeatingMERV 16 Cooling MERV 16 Heating
Pre
ssur
e [P
a]
Cumulative Mass Flow [10 6kg ]
Filters: MERV 8 | MERV 16Filter Pressure, House 1
050
100
150
200
0 .5 1 1.5 2 2.5
MERV 8 Cooling MERV 8 HeatingMERV 16 Cooling MERV 16 Heating
Pre
ssur
e [P
a]
Cumulative Mass Flow [10 6kg ]
Fan Pressure, House 1
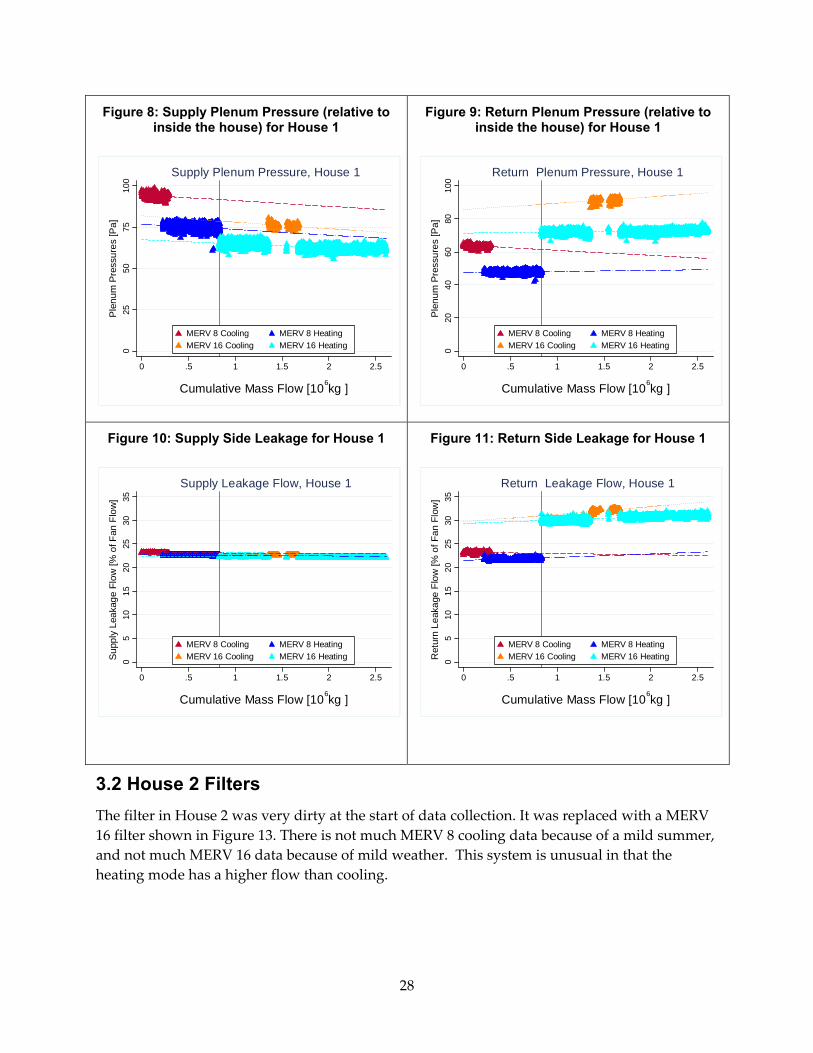
28
Figure 8: Supply Plenum Pressure (relative to inside the house) for House 1
Figure 9: Return Plenum Pressure (relative to inside the house) for House 1
Figure 10: Supply Side Leakage for House 1
Figure 11: Return Side Leakage for House 1
3.2 House 2 Filters The filter in House 2 was very dirty at the start of data collection. It was replaced with a MERV 16 filter shown in Figure 13. There is not much MERV 8 cooling data because of a mild summer, and not much MERV 16 data because of mild weather. This system is unusual in that the heating mode has a higher flow than cooling.
025
5075
100
0 .5 1 1.5 2 2.5
MERV 8 Cooling MERV 8 HeatingMERV 16 Cooling MERV 16 Heating
Ple
num
Pre
ssur
es [P
a]
Cumulative Mass Flow [10 6kg ]
Supply Plenum Pressure, House 1
020
4060
8010
0
0 .5 1 1.5 2 2.5
MERV 8 Cooling MERV 8 HeatingMERV 16 Cooling MERV 16 Heating
Ple
num
Pre
ssur
es [P
a]
Cumulative Mass Flow [10 6kg ]
Return Plenum Pressure, House 1
05
1015
2025
3035
0 .5 1 1.5 2 2.5
MERV 8 Cooling MERV 8 HeatingMERV 16 Cooling MERV 16 HeatingS
uppl
y Le
akag
e Fl
ow [%
of F
an F
low
]
Cumulative Mass Flow [10 6kg ]
Supply Leakage Flow, House 1
05
1015
2025
3035
0 .5 1 1.5 2 2.5
MERV 8 Cooling MERV 8 HeatingMERV 16 Cooling MERV 16 HeatingR
etur
n Le
akag
e Fl
ow [%
of F
an F
low
]
Cumulative Mass Flow [10 6kg ]
Return Leakage Flow, House 1
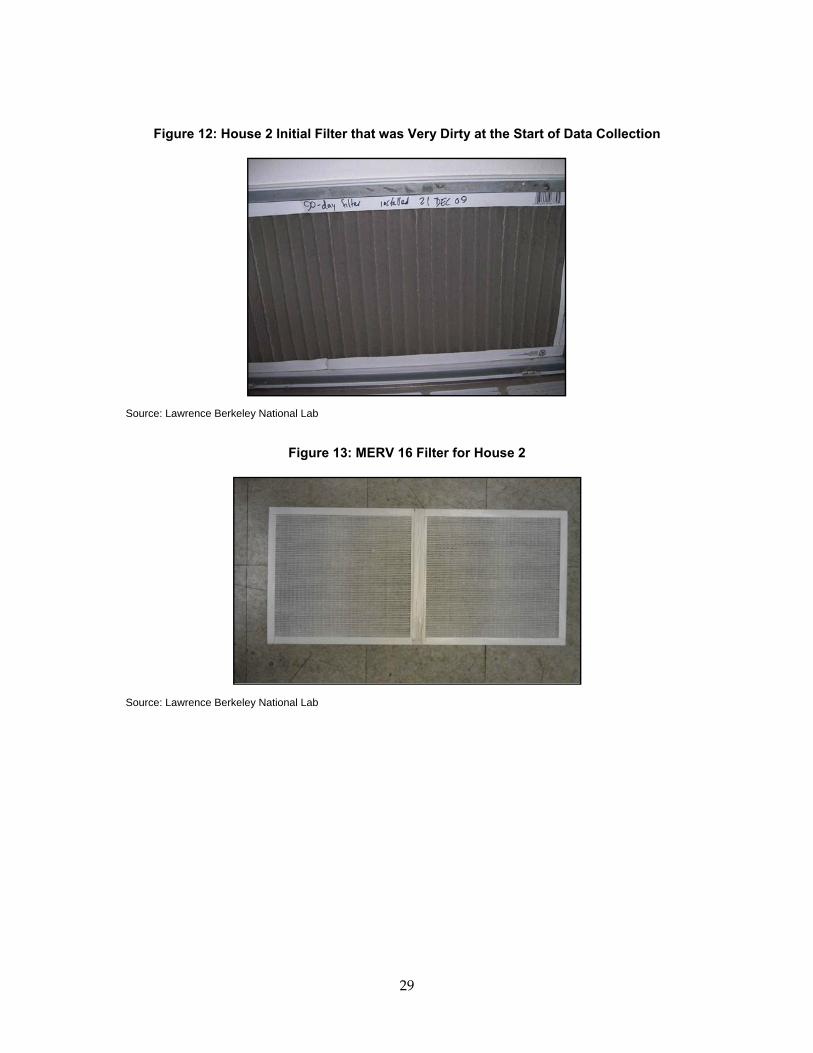
29
Figure 12: House 2 Initial Filter that was Very Dirty at the Start of Data Collection
Source: Lawrence Berkeley National Lab
Figure 13: MERV 16 Filter for House 2
Source: Lawrence Berkeley National Lab
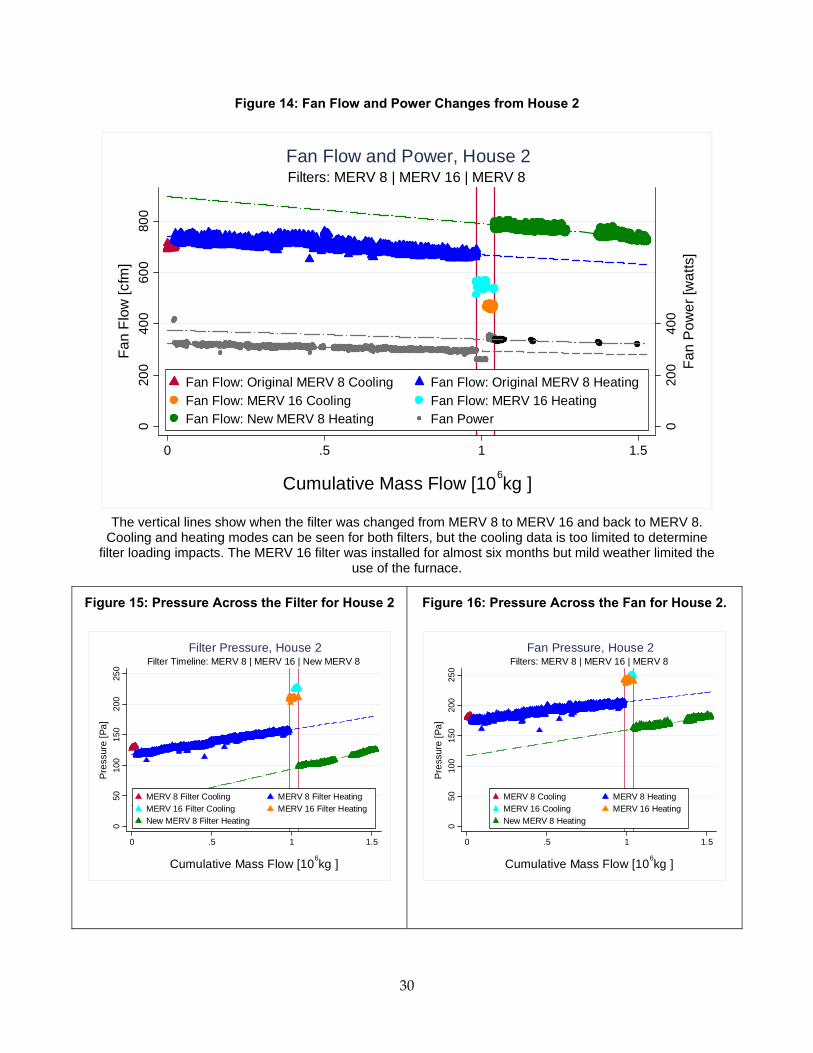
30
Figure 14: Fan Flow and Power Changes from House 2
The vertical lines show when the filter was changed from MERV 8 to MERV 16 and back to MERV 8. Cooling and heating modes can be seen for both filters, but the cooling data is too limited to determine
filter loading impacts. The MERV 16 filter was installed for almost six months but mild weather limited the use of the furnace.
Figure 15: Pressure Across the Filter for House 2
Figure 16: Pressure Across the Fan for House 2.
020
040
0
020
040
060
080
0
0 .5 1 1.5
Fan Flow: Original MERV 8 Cooling Fan Flow: Original MERV 8 HeatingFan Flow: MERV 16 Cooling Fan Flow: MERV 16 HeatingFan Flow: New MERV 8 Heating Fan Power
Fan
Pow
er [w
atts
]
Fan
Flow
[cfm
]
Cumulative Mass Flow [10 6kg ]
Filters: MERV 8 | MERV 16 | MERV 8Fan Flow and Power, House 2
050
100
150
200
250
0 .5 1 1.5
MERV 8 Filter Cooling MERV 8 Filter HeatingMERV 16 Filter Cooling MERV 16 Filter HeatingNew MERV 8 Filter Heating
Pre
ssur
e [P
a]
Cumulative Mass Flow [10 6kg ]
Filter Timeline: MERV 8 | MERV 16 | New MERV 8Filter Pressure, House 2
050
100
150
200
250
0 .5 1 1.5
MERV 8 Cooling MERV 8 HeatingMERV 16 Cooling MERV 16 HeatingNew MERV 8 Heating
Pre
ssur
e [P
a]
Cumulative Mass Flow [10 6kg ]
Filters: MERV 8 | MERV 16 | MERV 8Fan Pressure, House 2
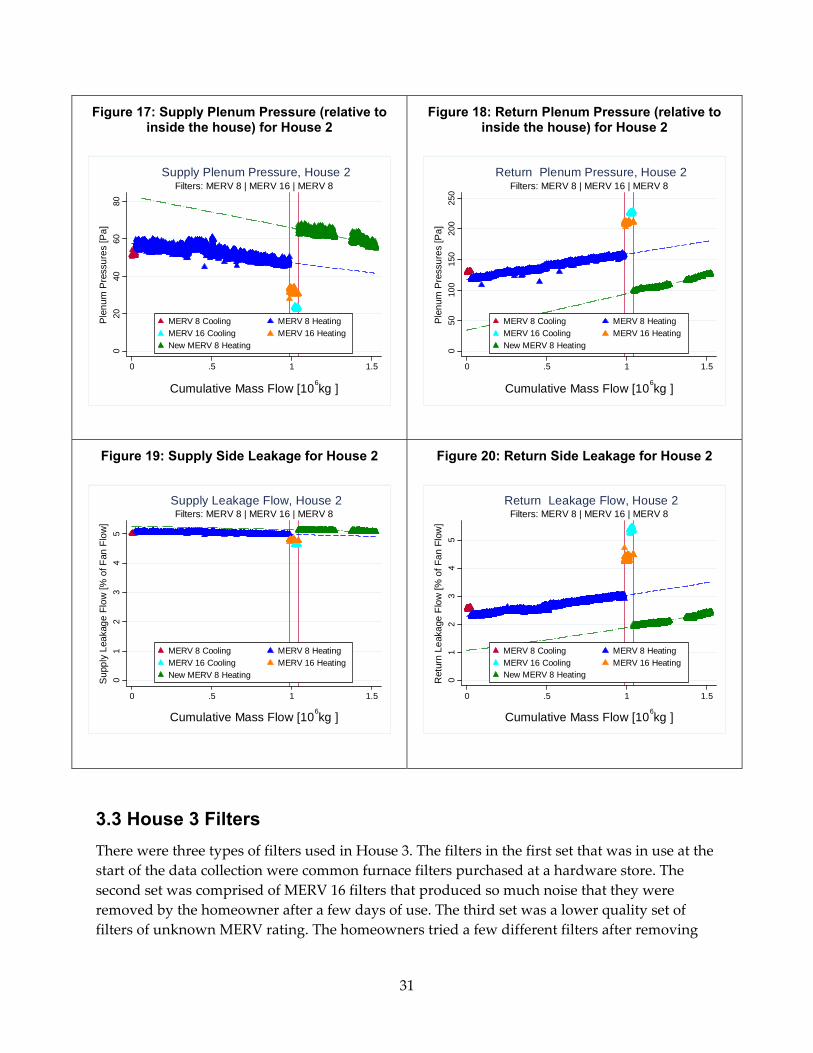
31
Figure 17: Supply Plenum Pressure (relative to inside the house) for House 2
Figure 18: Return Plenum Pressure (relative to inside the house) for House 2
Figure 19: Supply Side Leakage for House 2
Figure 20: Return Side Leakage for House 2
3.3 House 3 Filters There were three types of filters used in House 3. The filters in the first set that was in use at the start of the data collection were common furnace filters purchased at a hardware store. The second set was comprised of MERV 16 filters that produced so much noise that they were removed by the homeowner after a few days of use. The third set was a lower quality set of filters of unknown MERV rating. The homeowners tried a few different filters after removing
020
4060
80
0 .5 1 1.5
MERV 8 Cooling MERV 8 HeatingMERV 16 Cooling MERV 16 HeatingNew MERV 8 Heating
Ple
num
Pre
ssur
es [P
a]
Cumulative Mass Flow [10 6kg ]
Filters: MERV 8 | MERV 16 | MERV 8Supply Plenum Pressure, House 2
050
100
150
200
250
0 .5 1 1.5
MERV 8 Cooling MERV 8 HeatingMERV 16 Cooling MERV 16 HeatingNew MERV 8 Heating
Ple
num
Pre
ssur
es [P
a]
Cumulative Mass Flow [10 6kg ]
Filters: MERV 8 | MERV 16 | MERV 8Return Plenum Pressure, House 2
01
23
45
0 .5 1 1.5
MERV 8 Cooling MERV 8 HeatingMERV 16 Cooling MERV 16 HeatingNew MERV 8 HeatingS
uppl
y Le
akag
e Fl
ow [%
of F
an F
low
]
Cumulative Mass Flow [10 6kg ]
Filters: MERV 8 | MERV 16 | MERV 8Supply Leakage Flow, House 2
01
23
45
0 .5 1 1.5
MERV 8 Cooling MERV 8 HeatingMERV 16 Cooling MERV 16 HeatingNew MERV 8 HeatingR
etur
n Le
akag
e Fl
ow [%
of F
an F
low
]
Cumulative Mass Flow [10 6kg ]
Filters: MERV 8 | MERV 16 | MERV 8Return Leakage Flow, House 2
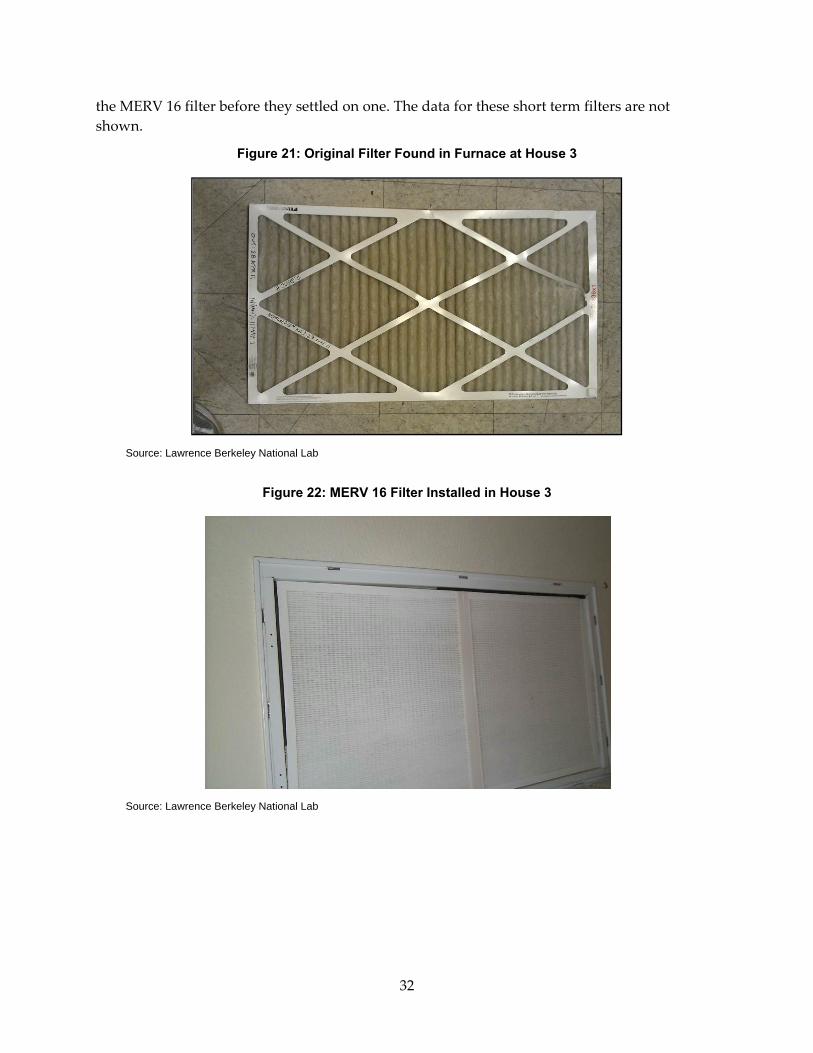
32
the MERV 16 filter before they settled on one. The data for these short term filters are not shown.
Figure 21: Original Filter Found in Furnace at House 3
Source: Lawrence Berkeley National Lab
Figure 22: MERV 16 Filter Installed in House 3
Source: Lawrence Berkeley National Lab
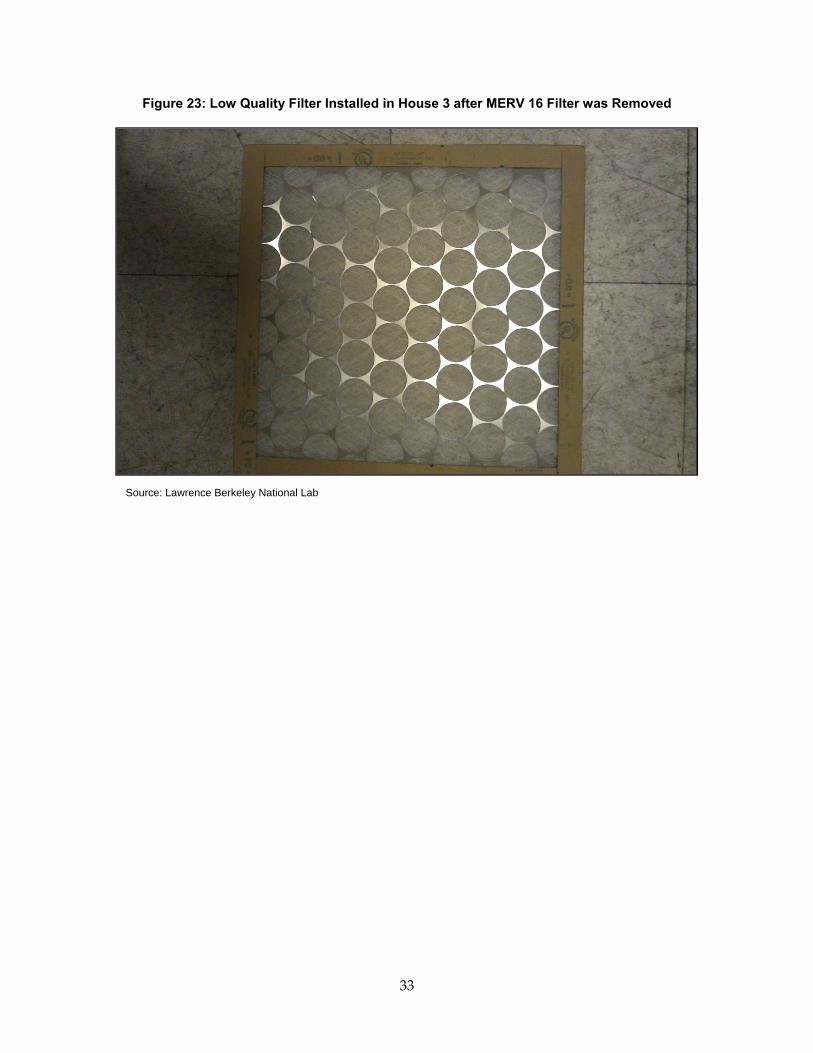
33
Figure 23: Low Quality Filter Installed in House 3 after MERV 16 Filter was Removed
Source: Lawrence Berkeley National Lab
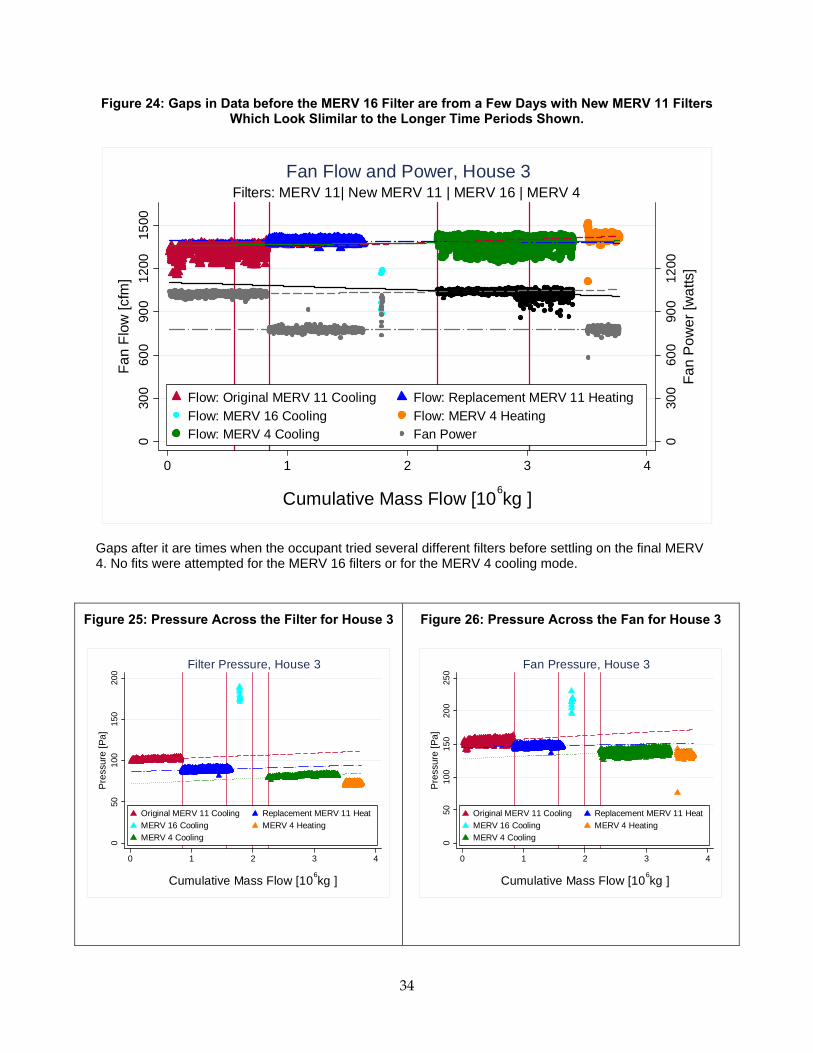
34
Figure 24: Gaps in Data before the MERV 16 Filter are from a Few Days with New MERV 11 Filters Which Look Slimilar to the Longer Time Periods Shown.
Gaps after it are times when the occupant tried several different filters before settling on the final MERV 4. No fits were attempted for the MERV 16 filters or for the MERV 4 cooling mode.
Figure 25: Pressure Across the Filter for House 3
Figure 26: Pressure Across the Fan for House 3
030
060
090
012
00
030
060
090
012
0015
00
0 1 2 3 4
Flow: Original MERV 11 Cooling Flow: Replacement MERV 11 HeatingFlow: MERV 16 Cooling Flow: MERV 4 HeatingFlow: MERV 4 Cooling Fan Power
Fan
Pow
er [w
atts
]
Fan
Flow
[cfm
]
Cumulative Mass Flow [10 6kg ]
Filters: MERV 11| New MERV 11 | MERV 16 | MERV 4Fan Flow and Power, House 3
050
100
150
200
0 1 2 3 4
Original MERV 11 Cooling Replacement MERV 11 HeatMERV 16 Cooling MERV 4 HeatingMERV 4 Cooling
Pre
ssur
e [P
a]
Cumulative Mass Flow [10 6kg ]
Filter Pressure, House 3
050
100
150
200
250
0 1 2 3 4
Original MERV 11 Cooling Replacement MERV 11 HeatMERV 16 Cooling MERV 4 HeatingMERV 4 Cooling
Pre
ssur
e [P
a]
Cumulative Mass Flow [10 6kg ]
Fan Pressure, House 3
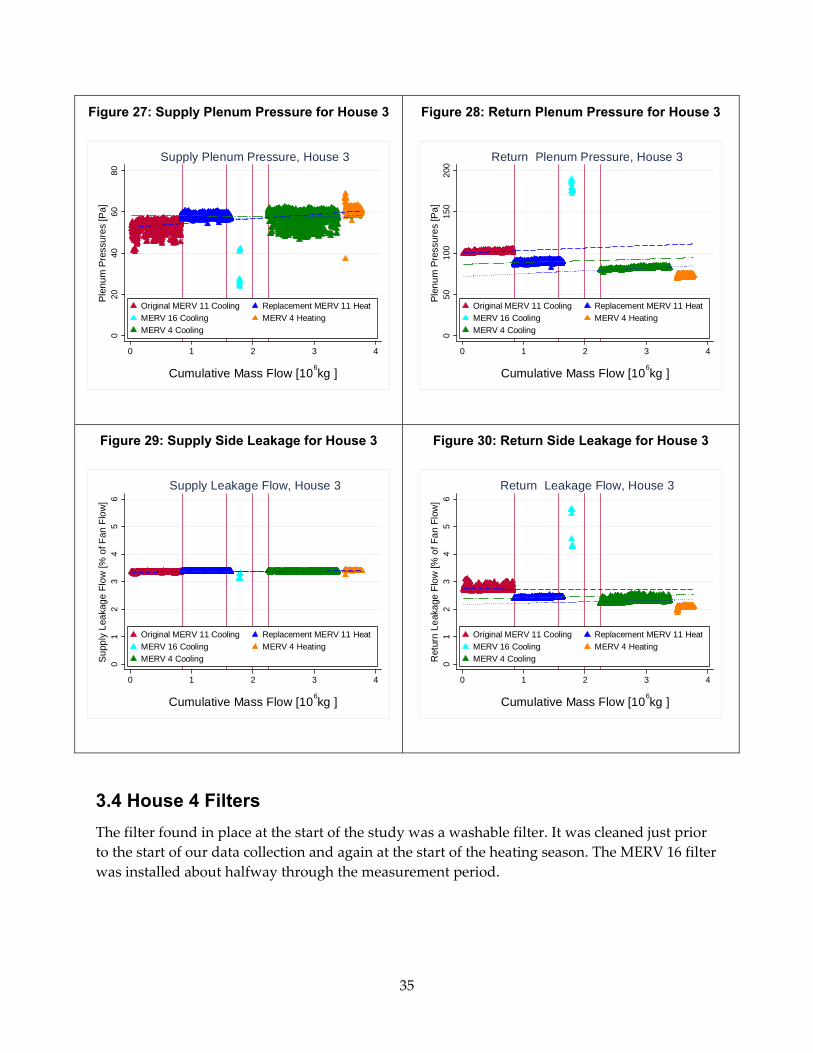
35
Figure 27: Supply Plenum Pressure for House 3
Figure 28: Return Plenum Pressure for House 3
Figure 29: Supply Side Leakage for House 3
Figure 30: Return Side Leakage for House 3
3.4 House 4 Filters The filter found in place at the start of the study was a washable filter. It was cleaned just prior to the start of our data collection and again at the start of the heating season. The MERV 16 filter was installed about halfway through the measurement period.
020
4060
80
0 1 2 3 4
Original MERV 11 Cooling Replacement MERV 11 HeatMERV 16 Cooling MERV 4 HeatingMERV 4 Cooling
Ple
num
Pre
ssur
es [P
a]
Cumulative Mass Flow [10 6kg ]
Supply Plenum Pressure, House 3
050
100
150
200
0 1 2 3 4
Original MERV 11 Cooling Replacement MERV 11 HeatMERV 16 Cooling MERV 4 HeatingMERV 4 Cooling
Ple
num
Pre
ssur
es [P
a]
Cumulative Mass Flow [10 6kg ]
Return Plenum Pressure, House 3
01
23
45
6
0 1 2 3 4
Original MERV 11 Cooling Replacement MERV 11 HeatMERV 16 Cooling MERV 4 HeatingMERV 4 CoolingS
uppl
y Le
akag
e Fl
ow [%
of F
an F
low
]
Cumulative Mass Flow [10 6kg ]
Supply Leakage Flow, House 3
01
23
45
6
0 1 2 3 4
Original MERV 11 Cooling Replacement MERV 11 HeatMERV 16 Cooling MERV 4 HeatingMERV 4 CoolingR
etur
n Le
akag
e Fl
ow [%
of F
an F
low
]
Cumulative Mass Flow [10 6kg ]
Return Leakage Flow, House 3
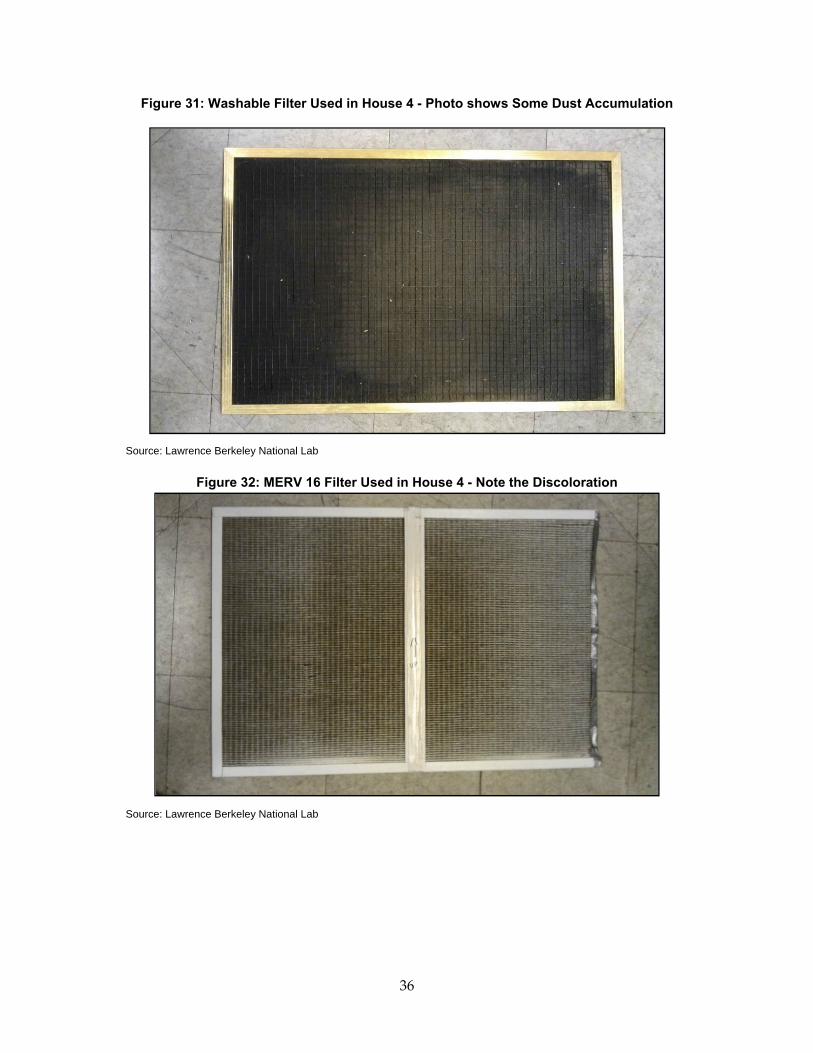
36
Figure 31: Washable Filter Used in House 4 - Photo shows Some Dust Accumulation
Source: Lawrence Berkeley National Lab
Figure 32: MERV 16 Filter Used in House 4 - Note the Discoloration
Source: Lawrence Berkeley National Lab
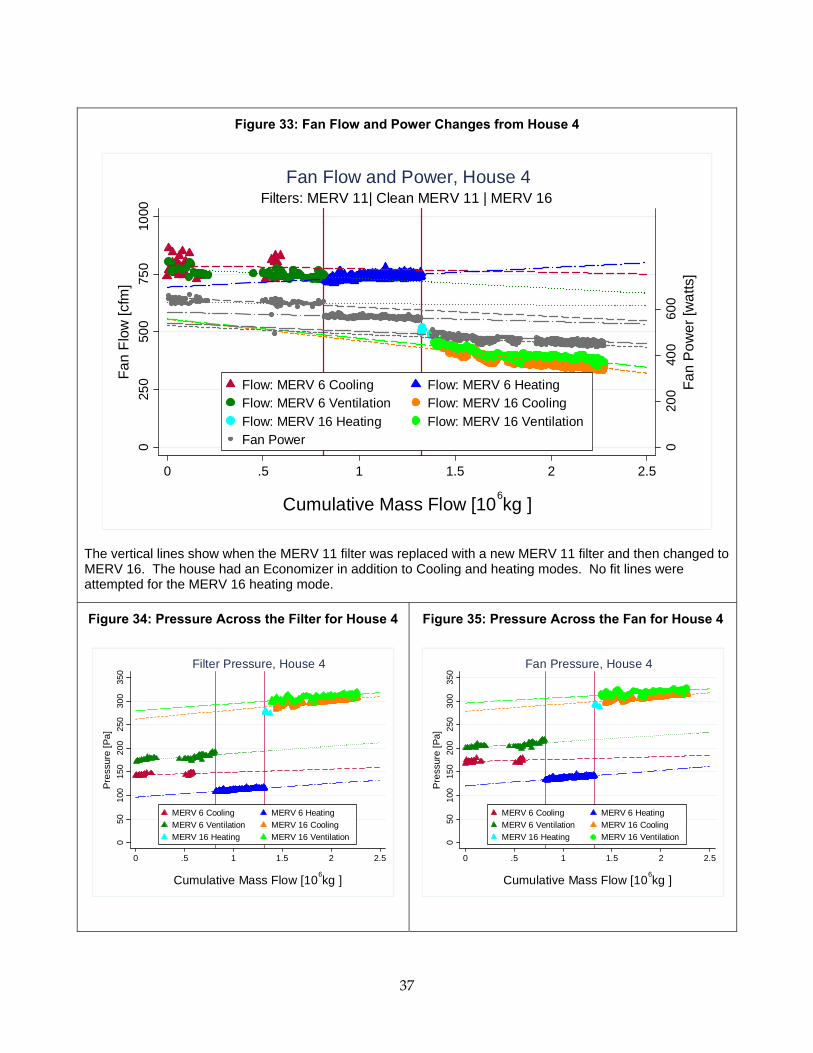
37
Figure 33: Fan Flow and Power Changes from House 4
The vertical lines show when the MERV 11 filter was replaced with a new MERV 11 filter and then changed to MERV 16. The house had an Economizer in addition to Cooling and heating modes. No fit lines were attempted for the MERV 16 heating mode.
Figure 34: Pressure Across the Filter for House 4
Figure 35: Pressure Across the Fan for House 4
020
040
060
0
025
050
075
010
00
0 .5 1 1.5 2 2.5
Flow: MERV 6 Cooling Flow: MERV 6 HeatingFlow: MERV 6 Ventilation Flow: MERV 16 CoolingFlow: MERV 16 Heating Flow: MERV 16 VentilationFan Power
Fan
Pow
er [w
atts
]
Fan
Flow
[cfm
]
Cumulative Mass Flow [10 6kg ]
Filters: MERV 11| Clean MERV 11 | MERV 16Fan Flow and Power, House 4
050
100
150
200
250
300
350
0 .5 1 1.5 2 2.5
MERV 6 Cooling MERV 6 HeatingMERV 6 Ventilation MERV 16 CoolingMERV 16 Heating MERV 16 Ventilation
Pre
ssur
e [P
a]
Cumulative Mass Flow [10 6kg ]
Filter Pressure, House 4
050
100
150
200
250
300
350
0 .5 1 1.5 2 2.5
MERV 6 Cooling MERV 6 HeatingMERV 6 Ventilation MERV 16 CoolingMERV 16 Heating MERV 16 Ventilation
Pre
ssur
e [P
a]
Cumulative Mass Flow [10 6kg ]
Fan Pressure, House 4
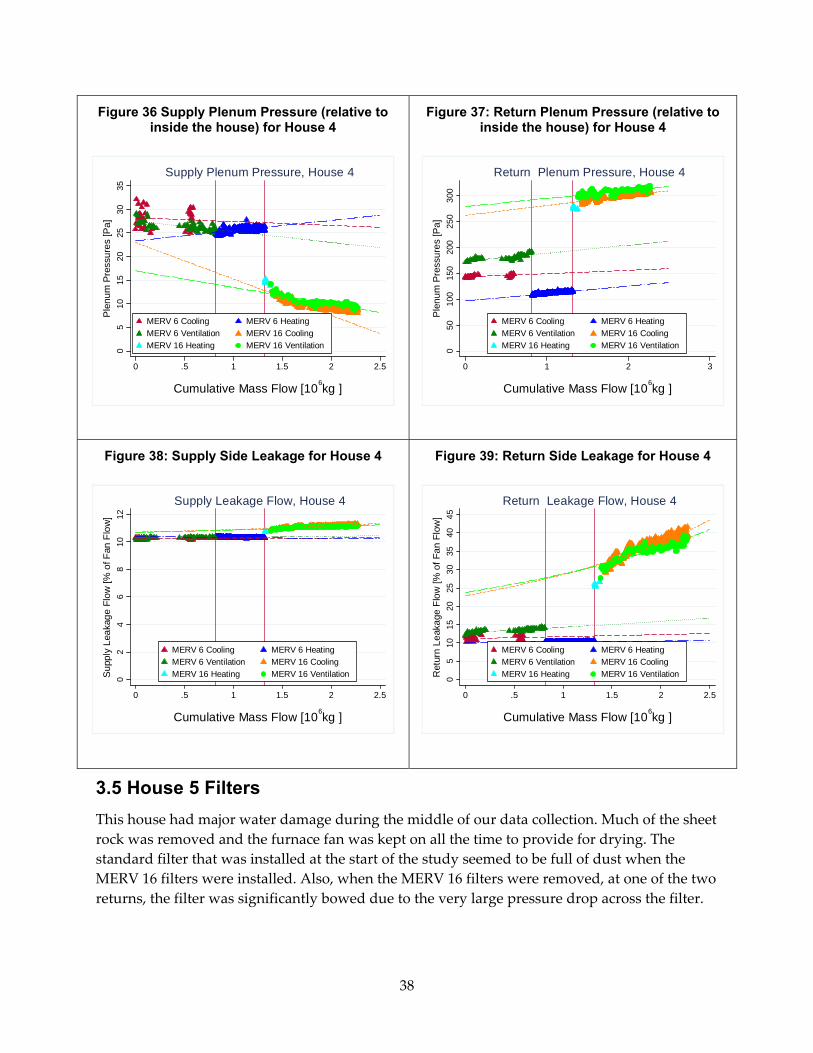
38
Figure 36 Supply Plenum Pressure (relative to inside the house) for House 4
Figure 37: Return Plenum Pressure (relative to inside the house) for House 4
Figure 38: Supply Side Leakage for House 4
Figure 39: Return Side Leakage for House 4
3.5 House 5 Filters This house had major water damage during the middle of our data collection. Much of the sheet rock was removed and the furnace fan was kept on all the time to provide for drying. The standard filter that was installed at the start of the study seemed to be full of dust when the MERV 16 filters were installed. Also, when the MERV 16 filters were removed, at one of the two returns, the filter was significantly bowed due to the very large pressure drop across the filter.
05
1015
2025
3035
0 .5 1 1.5 2 2.5
MERV 6 Cooling MERV 6 HeatingMERV 6 Ventilation MERV 16 CoolingMERV 16 Heating MERV 16 Ventilation
Ple
num
Pre
ssur
es [P
a]
Cumulative Mass Flow [10 6kg ]
Supply Plenum Pressure, House 4
050
100
150
200
250
300
0 1 2 3
MERV 6 Cooling MERV 6 HeatingMERV 6 Ventilation MERV 16 CoolingMERV 16 Heating MERV 16 Ventilation
Ple
num
Pre
ssur
es [P
a]
Cumulative Mass Flow [10 6kg ]
Return Plenum Pressure, House 4
02
46
810
12
0 .5 1 1.5 2 2.5
MERV 6 Cooling MERV 6 HeatingMERV 6 Ventilation MERV 16 CoolingMERV 16 Heating MERV 16 VentilationS
uppl
y Le
akag
e Fl
ow [%
of F
an F
low
]
Cumulative Mass Flow [10 6kg ]
Supply Leakage Flow, House 4
05
1015
2025
3035
4045
0 .5 1 1.5 2 2.5
MERV 6 Cooling MERV 6 HeatingMERV 6 Ventilation MERV 16 CoolingMERV 16 Heating MERV 16 VentilationR
etur
n Le
akag
e Fl
ow [%
of F
an F
low
]
Cumulative Mass Flow [10 6kg ]
Return Leakage Flow, House 4
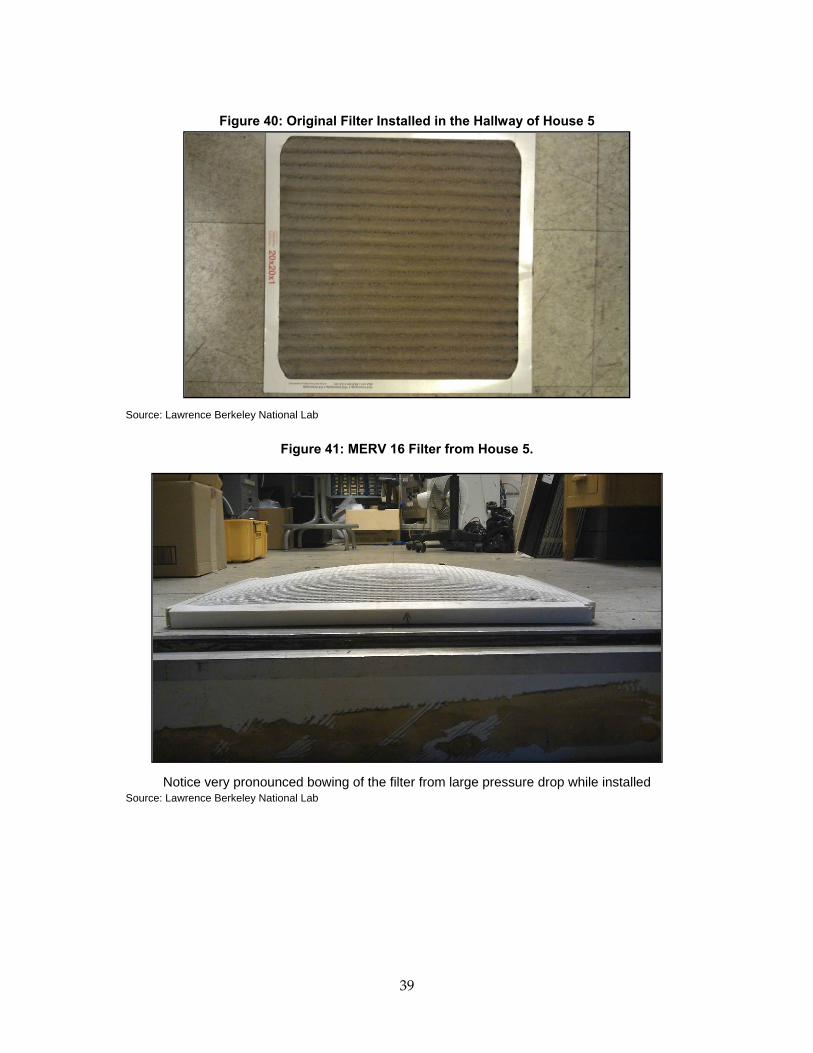
39
Figure 40: Original Filter Installed in the Hallway of House 5
Source: Lawrence Berkeley National Lab
Figure 41: MERV 16 Filter from House 5.
Notice very pronounced bowing of the filter from large pressure drop while installed
Source: Lawrence Berkeley National Lab
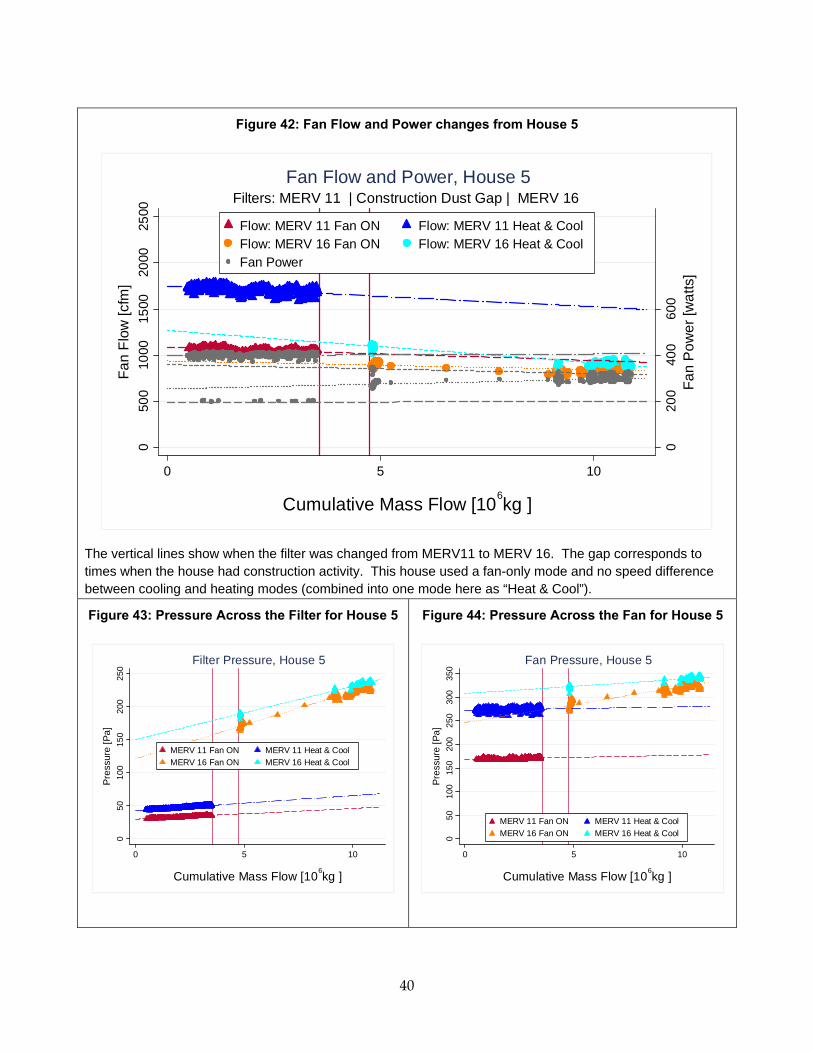
40
Figure 42: Fan Flow and Power changes from House 5
The vertical lines show when the filter was changed from MERV11 to MERV 16. The gap corresponds to times when the house had construction activity. This house used a fan-only mode and no speed difference between cooling and heating modes (combined into one mode here as “Heat & Cool”).
Figure 43: Pressure Across the Filter for House 5
Figure 44: Pressure Across the Fan for House 5
020
040
060
0
050
010
0015
0020
0025
00
0 5 10
Flow: MERV 11 Fan ON Flow: MERV 11 Heat & CoolFlow: MERV 16 Fan ON Flow: MERV 16 Heat & CoolFan Power
Fan
Pow
er [w
atts
]
Fan
Flow
[cfm
]
Cumulative Mass Flow [10 6kg ]
Filters: MERV 11 | Construction Dust Gap | MERV 16Fan Flow and Power, House 5
050
100
150
200
250
0 5 10
MERV 11 Fan ON MERV 11 Heat & CoolMERV 16 Fan ON MERV 16 Heat & Cool
Pre
ssur
e [P
a]
Cumulative Mass Flow [10 6kg ]
Filter Pressure, House 5
050
100
150
200
250
300
350
0 5 10
MERV 11 Fan ON MERV 11 Heat & CoolMERV 16 Fan ON MERV 16 Heat & Cool
Pre
ssur
e [P
a]
Cumulative Mass Flow [10 6kg ]
Fan Pressure, House 5
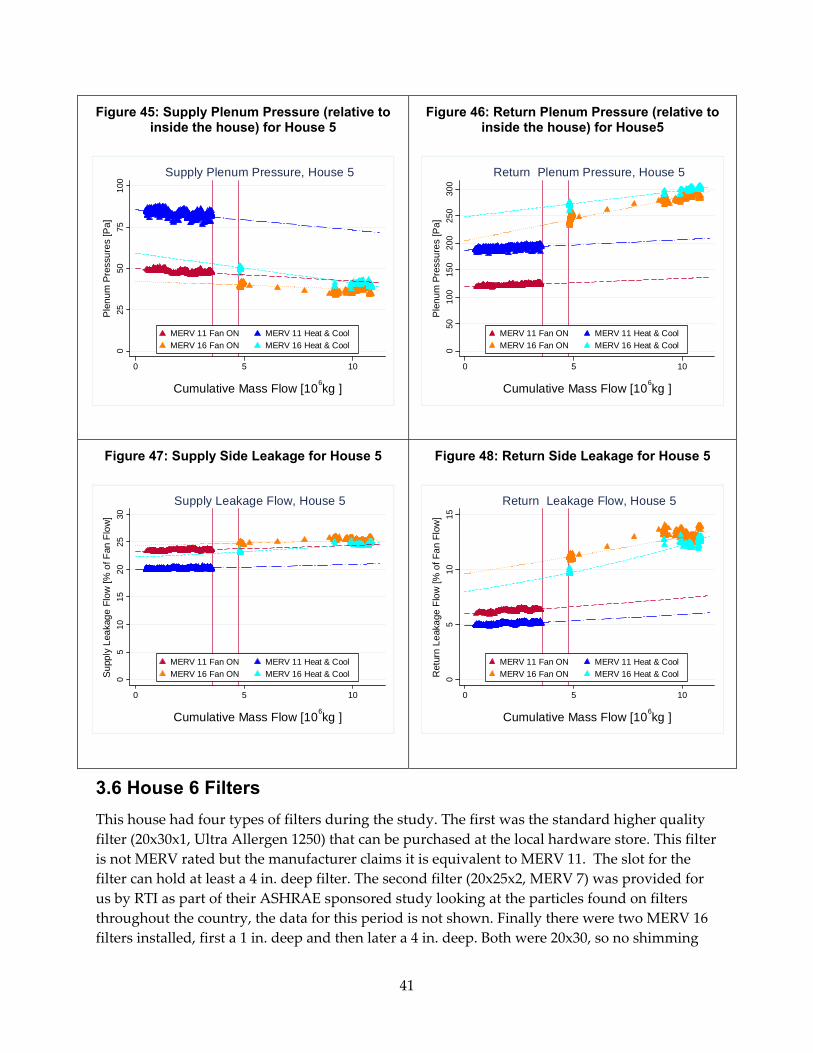
41
Figure 45: Supply Plenum Pressure (relative to inside the house) for House 5
Figure 46: Return Plenum Pressure (relative to inside the house) for House5
Figure 47: Supply Side Leakage for House 5
Figure 48: Return Side Leakage for House 5
3.6 House 6 Filters This house had four types of filters during the study. The first was the standard higher quality filter (20x30x1, Ultra Allergen 1250) that can be purchased at the local hardware store. This filter is not MERV rated but the manufacturer claims it is equivalent to MERV 11. The slot for the filter can hold at least a 4 in. deep filter. The second filter (20x25x2, MERV 7) was provided for us by RTI as part of their ASHRAE sponsored study looking at the particles found on filters throughout the country, the data for this period is not shown. Finally there were two MERV 16 filters installed, first a 1 in. deep and then later a 4 in. deep. Both were 20x30, so no shimming
025
5075
100
0 5 10
MERV 11 Fan ON MERV 11 Heat & CoolMERV 16 Fan ON MERV 16 Heat & Cool
Ple
num
Pre
ssur
es [P
a]
Cumulative Mass Flow [10 6kg ]
Supply Plenum Pressure, House 5
050
100
150
200
250
300
0 5 10
MERV 11 Fan ON MERV 11 Heat & CoolMERV 16 Fan ON MERV 16 Heat & Cool
Ple
num
Pre
ssur
es [P
a]
Cumulative Mass Flow [10 6kg ]
Return Plenum Pressure, House 5
05
1015
2025
30
0 5 10
MERV 11 Fan ON MERV 11 Heat & CoolMERV 16 Fan ON MERV 16 Heat & CoolS
uppl
y Le
akag
e Fl
ow [%
of F
an F
low
]
Cumulative Mass Flow [10 6kg ]
Supply Leakage Flow, House 5
05
1015
0 5 10
MERV 11 Fan ON MERV 11 Heat & CoolMERV 16 Fan ON MERV 16 Heat & CoolR
etur
n Le
akag
e Fl
ow [%
of F
an F
low
]
Cumulative Mass Flow [10 6kg ]
Return Leakage Flow, House 5
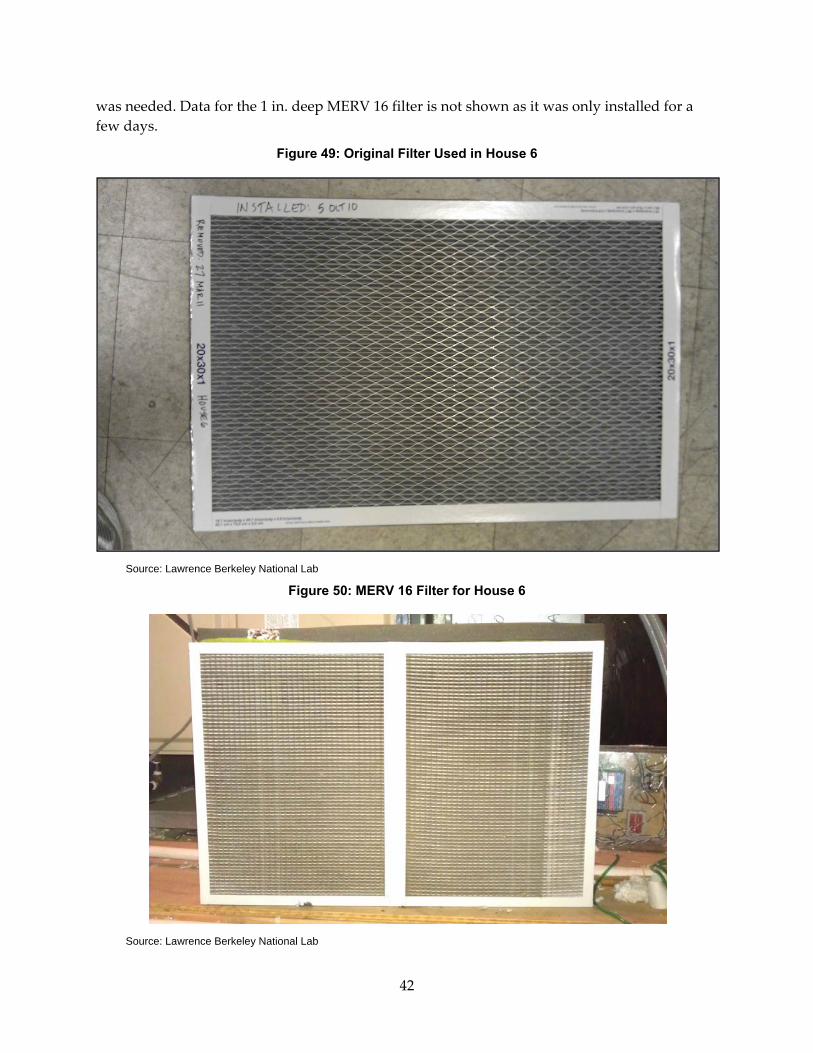
42
was needed. Data for the 1 in. deep MERV 16 filter is not shown as it was only installed for a few days.
Figure 49: Original Filter Used in House 6
Source: Lawrence Berkeley National Lab
Figure 50: MERV 16 Filter for House 6
Source: Lawrence Berkeley National Lab
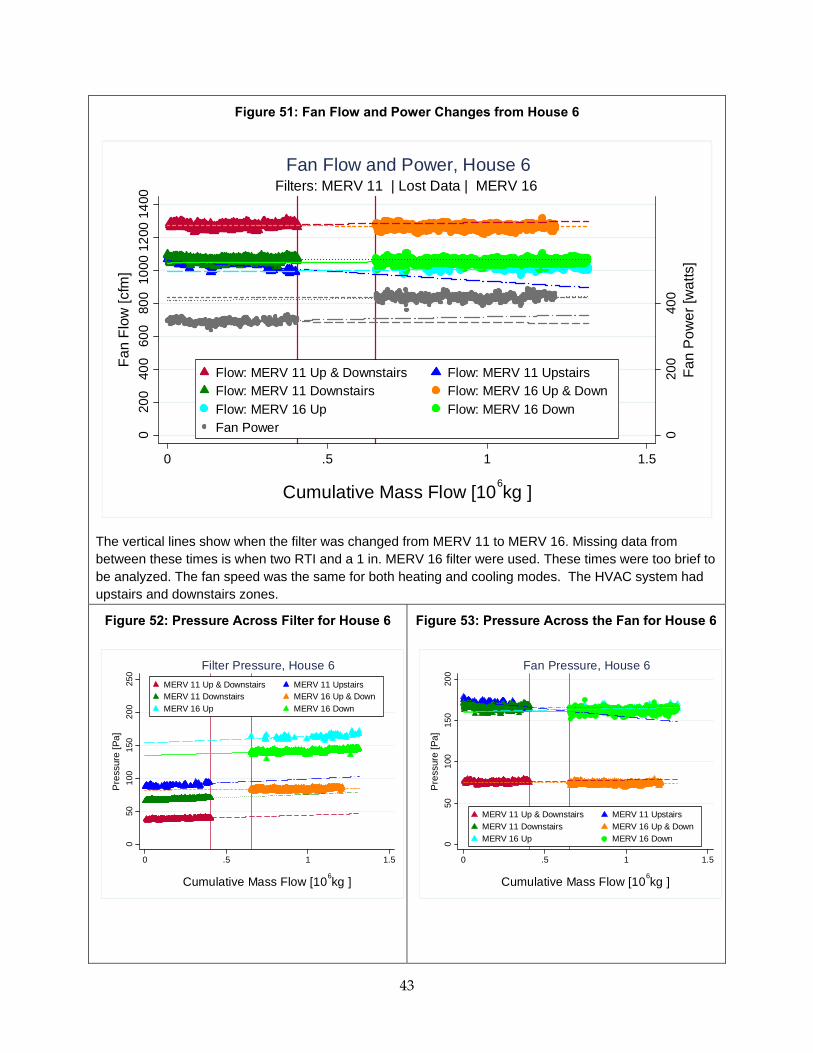
43
Figure 51: Fan Flow and Power Changes from House 6
The vertical lines show when the filter was changed from MERV 11 to MERV 16. Missing data from between these times is when two RTI and a 1 in. MERV 16 filter were used. These times were too brief to be analyzed. The fan speed was the same for both heating and cooling modes. The HVAC system had upstairs and downstairs zones.
Figure 52: Pressure Across Filter for House 6
Figure 53: Pressure Across the Fan for House 6
020
040
0
020
040
060
080
010
0012
0014
00
0 .5 1 1.5
Flow: MERV 11 Up & Downstairs Flow: MERV 11 UpstairsFlow: MERV 11 Downstairs Flow: MERV 16 Up & DownFlow: MERV 16 Up Flow: MERV 16 DownFan Power
Fan
Pow
er [w
atts
]
Fan
Flow
[cfm
]
Cumulative Mass Flow [10 6kg ]
Filters: MERV 11 | Lost Data | MERV 16Fan Flow and Power, House 6
050
100
150
200
250
0 .5 1 1.5
MERV 11 Up & Downstairs MERV 11 UpstairsMERV 11 Downstairs MERV 16 Up & DownMERV 16 Up MERV 16 Down
Pre
ssur
e [P
a]
Cumulative Mass Flow [10 6kg ]
Filter Pressure, House 6
050
100
150
200
0 .5 1 1.5
MERV 11 Up & Downstairs MERV 11 UpstairsMERV 11 Downstairs MERV 16 Up & DownMERV 16 Up MERV 16 Down
Pre
ssur
e [P
a]
Cumulative Mass Flow [10 6kg ]
Fan Pressure, House 6
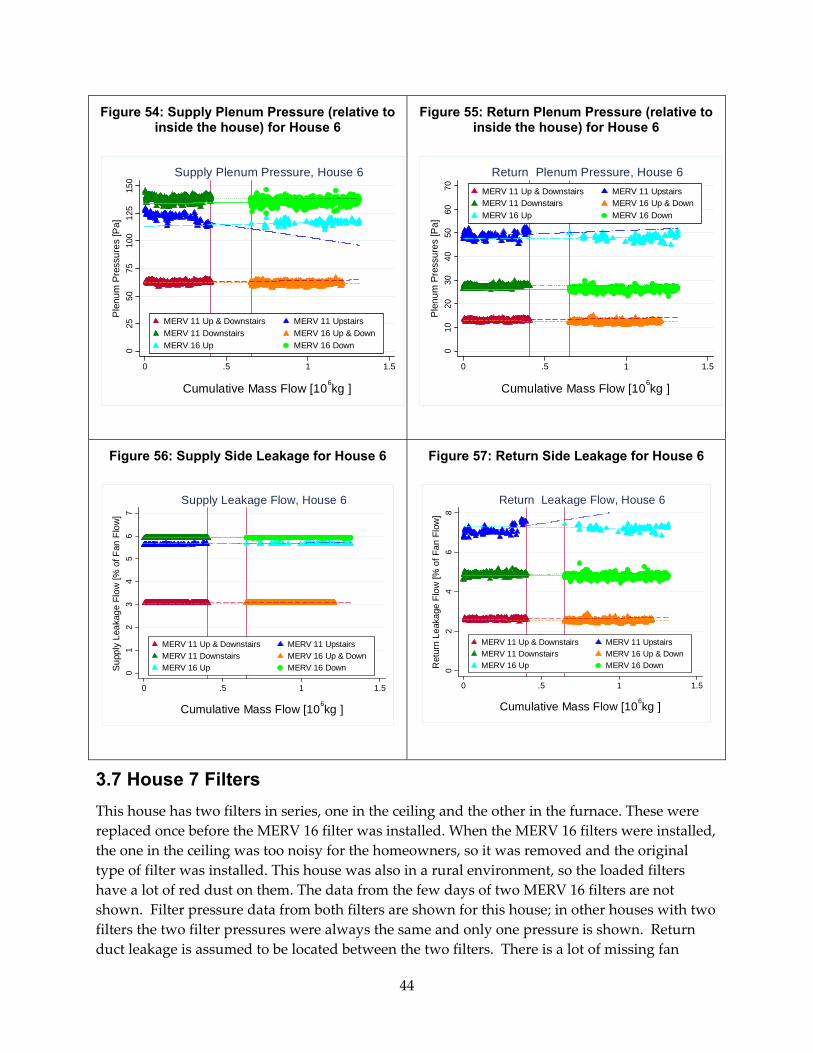
44
Figure 54: Supply Plenum Pressure (relative to inside the house) for House 6
Figure 55: Return Plenum Pressure (relative to inside the house) for House 6
Figure 56: Supply Side Leakage for House 6
Figure 57: Return Side Leakage for House 6
3.7 House 7 Filters This house has two filters in series, one in the ceiling and the other in the furnace. These were replaced once before the MERV 16 filter was installed. When the MERV 16 filters were installed, the one in the ceiling was too noisy for the homeowners, so it was removed and the original type of filter was installed. This house was also in a rural environment, so the loaded filters have a lot of red dust on them. The data from the few days of two MERV 16 filters are not shown. Filter pressure data from both filters are shown for this house; in other houses with two filters the two filter pressures were always the same and only one pressure is shown. Return duct leakage is assumed to be located between the two filters. There is a lot of missing fan
025
5075
100
125
150
0 .5 1 1.5
MERV 11 Up & Downstairs MERV 11 UpstairsMERV 11 Downstairs MERV 16 Up & DownMERV 16 Up MERV 16 Down
Ple
num
Pre
ssur
es [P
a]
Cumulative Mass Flow [10 6kg ]
Supply Plenum Pressure, House 6
010
2030
4050
6070
0 .5 1 1.5
MERV 11 Up & Downstairs MERV 11 UpstairsMERV 11 Downstairs MERV 16 Up & DownMERV 16 Up MERV 16 Down
Ple
num
Pre
ssur
es [P
a]
Cumulative Mass Flow [10 6kg ]
Return Plenum Pressure, House 6
01
23
45
67
0 .5 1 1.5
MERV 11 Up & Downstairs MERV 11 UpstairsMERV 11 Downstairs MERV 16 Up & DownMERV 16 Up MERV 16 DownSu
pply
Lea
kage
Flo
w [%
of F
an F
low
]
Cumulative Mass Flow [10 6kg ]
Supply Leakage Flow, House 6
02
46
8
0 .5 1 1.5
MERV 11 Up & Downstairs MERV 11 UpstairsMERV 11 Downstairs MERV 16 Up & DownMERV 16 Up MERV 16 DownR
etur
n Le
akag
e Fl
ow [%
of F
an F
low
]
Cumulative Mass Flow [10 6kg ]
Return Leakage Flow, House 6
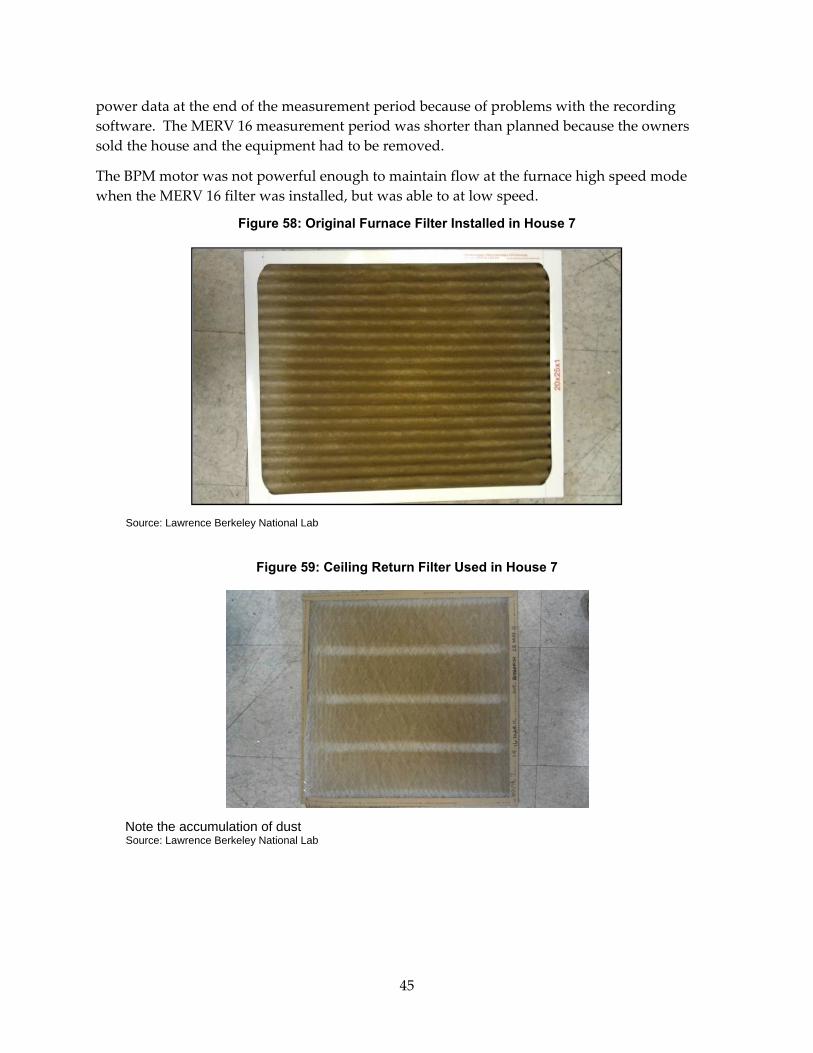
45
power data at the end of the measurement period because of problems with the recording software. The MERV 16 measurement period was shorter than planned because the owners sold the house and the equipment had to be removed.
The BPM motor was not powerful enough to maintain flow at the furnace high speed mode when the MERV 16 filter was installed, but was able to at low speed.
Figure 58: Original Furnace Filter Installed in House 7
Source: Lawrence Berkeley National Lab
Figure 59: Ceiling Return Filter Used in House 7
Note the accumulation of dust
Source: Lawrence Berkeley National Lab
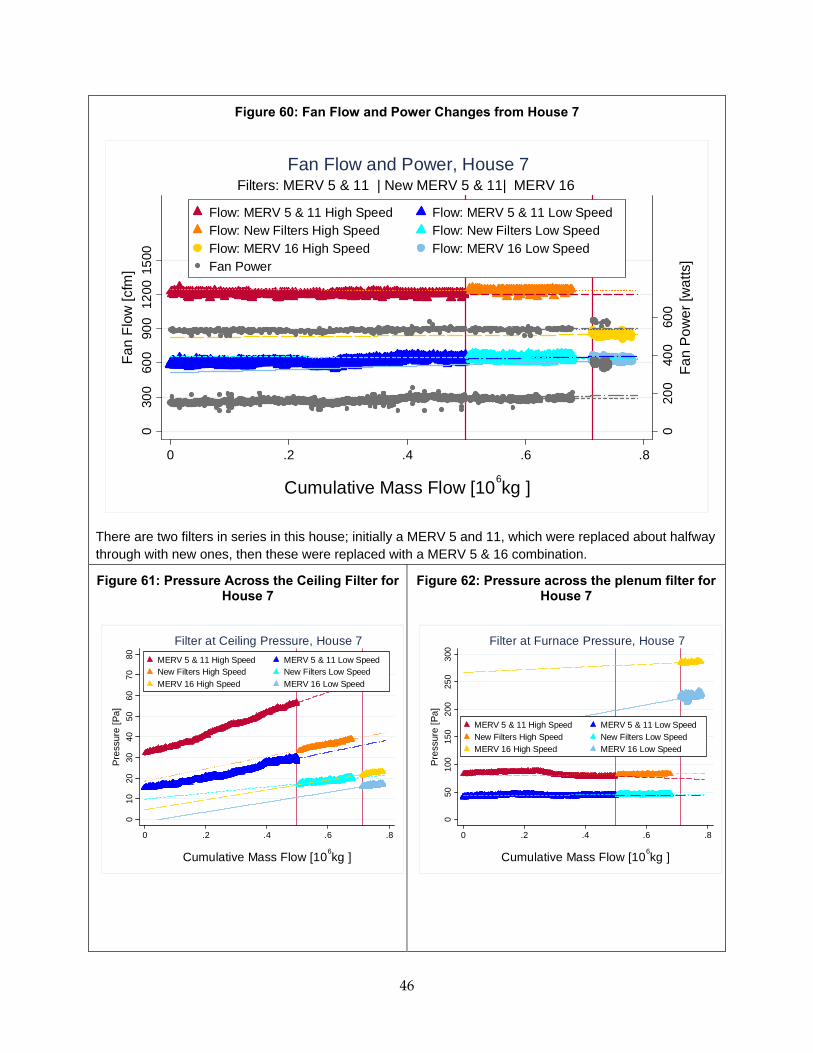
46
Figure 60: Fan Flow and Power Changes from House 7
There are two filters in series in this house; initially a MERV 5 and 11, which were replaced about halfway through with new ones, then these were replaced with a MERV 5 & 16 combination.
Figure 61: Pressure Across the Ceiling Filter for House 7
Figure 62: Pressure across the plenum filter for House 7
020
040
060
0
030
060
090
012
0015
00
0 .2 .4 .6 .8
Flow: MERV 5 & 11 High Speed Flow: MERV 5 & 11 Low SpeedFlow: New Filters High Speed Flow: New Filters Low SpeedFlow: MERV 16 High Speed Flow: MERV 16 Low SpeedFan Power
Fan
Pow
er [w
atts
]
Fan
Flow
[cfm
]
Cumulative Mass Flow [10 6kg ]
Filters: MERV 5 & 11 | New MERV 5 & 11| MERV 16Fan Flow and Power, House 7
010
2030
4050
6070
80
0 .2 .4 .6 .8
MERV 5 & 11 High Speed MERV 5 & 11 Low SpeedNew Filters High Speed New Filters Low SpeedMERV 16 High Speed MERV 16 Low Speed
Pre
ssur
e [P
a]
Cumulative Mass Flow [10 6kg ]
Filter at Ceiling Pressure, House 7
050
100
150
200
250
300
0 .2 .4 .6 .8
MERV 5 & 11 High Speed MERV 5 & 11 Low SpeedNew Filters High Speed New Filters Low SpeedMERV 16 High Speed MERV 16 Low Speed
Pre
ssur
e [P
a]
Cumulative Mass Flow [10 6kg ]
Filter at Furnace Pressure, House 7
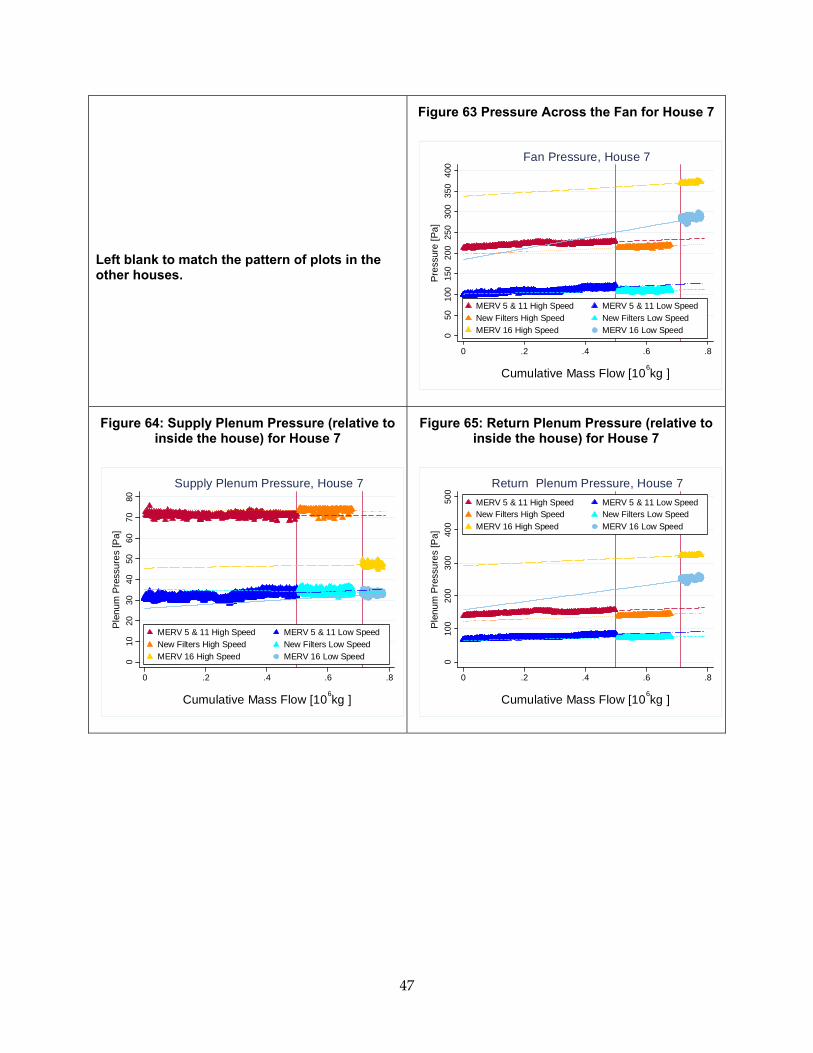
47
Left blank to match the pattern of plots in the other houses.
Figure 63 Pressure Across the Fan for House 7
Figure 64: Supply Plenum Pressure (relative to inside the house) for House 7
Figure 65: Return Plenum Pressure (relative to inside the house) for House 7
050
100
150
200
250
300
350
400
0 .2 .4 .6 .8
MERV 5 & 11 High Speed MERV 5 & 11 Low SpeedNew Filters High Speed New Filters Low SpeedMERV 16 High Speed MERV 16 Low Speed
Pre
ssur
e [P
a]
Cumulative Mass Flow [10 6kg ]
Fan Pressure, House 7
010
2030
4050
6070
80
0 .2 .4 .6 .8
MERV 5 & 11 High Speed MERV 5 & 11 Low SpeedNew Filters High Speed New Filters Low SpeedMERV 16 High Speed MERV 16 Low Speed
Ple
num
Pre
ssur
es [P
a]
Cumulative Mass Flow [10 6kg ]
Supply Plenum Pressure, House 7
010
020
030
040
050
0
0 .2 .4 .6 .8
MERV 5 & 11 High Speed MERV 5 & 11 Low SpeedNew Filters High Speed New Filters Low SpeedMERV 16 High Speed MERV 16 Low Speed
Ple
num
Pre
ssur
es [P
a]
Cumulative Mass Flow [10 6kg ]
Return Plenum Pressure, House 7
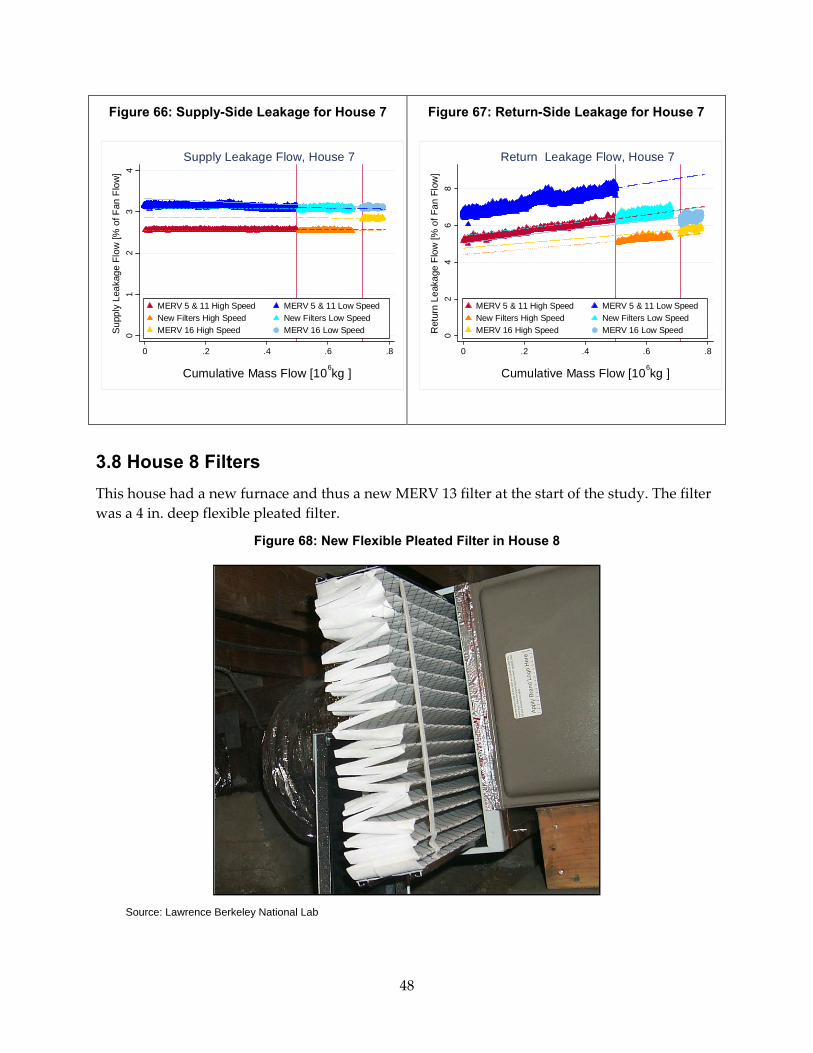
48
Figure 66: Supply-Side Leakage for House 7
Figure 67: Return-Side Leakage for House 7
3.8 House 8 Filters This house had a new furnace and thus a new MERV 13 filter at the start of the study. The filter was a 4 in. deep flexible pleated filter.
Figure 68: New Flexible Pleated Filter in House 8
Source: Lawrence Berkeley National Lab
01
23
4
0 .2 .4 .6 .8
MERV 5 & 11 High Speed MERV 5 & 11 Low SpeedNew Filters High Speed New Filters Low SpeedMERV 16 High Speed MERV 16 Low SpeedS
uppl
y Le
akag
e Fl
ow [%
of F
an F
low
]
Cumulative Mass Flow [10 6kg ]
Supply Leakage Flow, House 7
02
46
8
0 .2 .4 .6 .8
MERV 5 & 11 High Speed MERV 5 & 11 Low SpeedNew Filters High Speed New Filters Low SpeedMERV 16 High Speed MERV 16 Low SpeedR
etur
n Le
akag
e Fl
ow [%
of F
an F
low
]
Cumulative Mass Flow [10 6kg ]
Return Leakage Flow, House 7
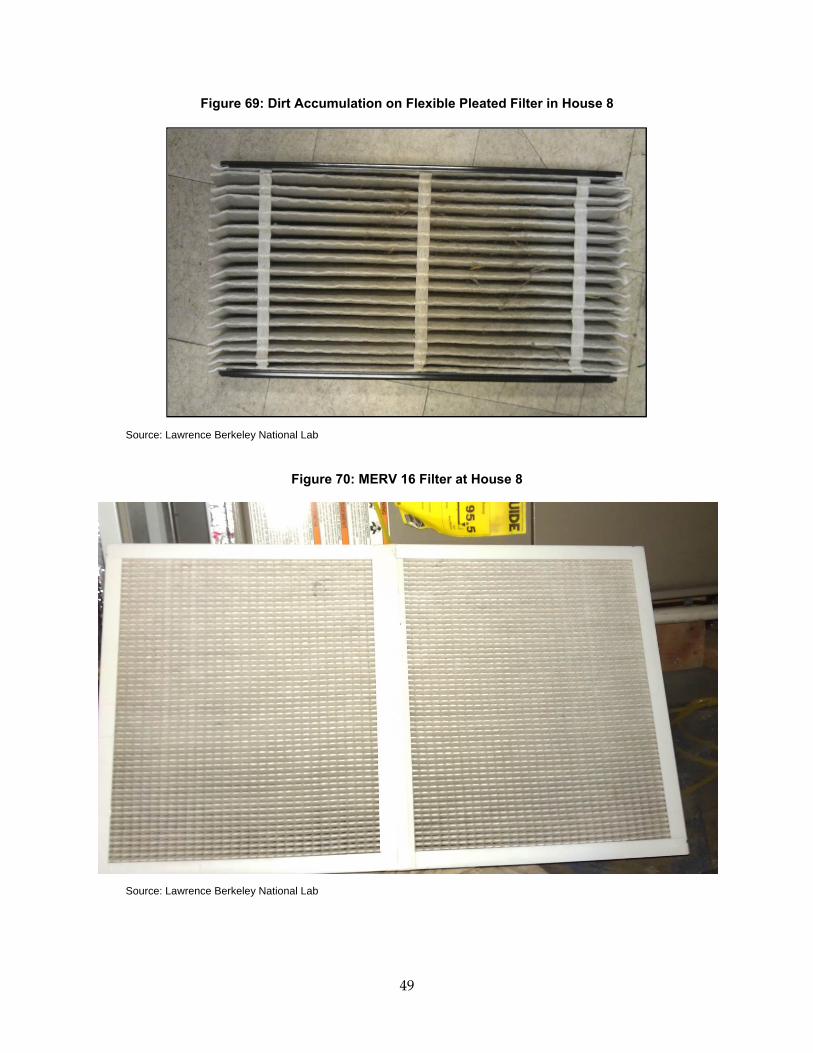
49
Figure 69: Dirt Accumulation on Flexible Pleated Filter in House 8
Source: Lawrence Berkeley National Lab
Figure 70: MERV 16 Filter at House 8
Source: Lawrence Berkeley National Lab
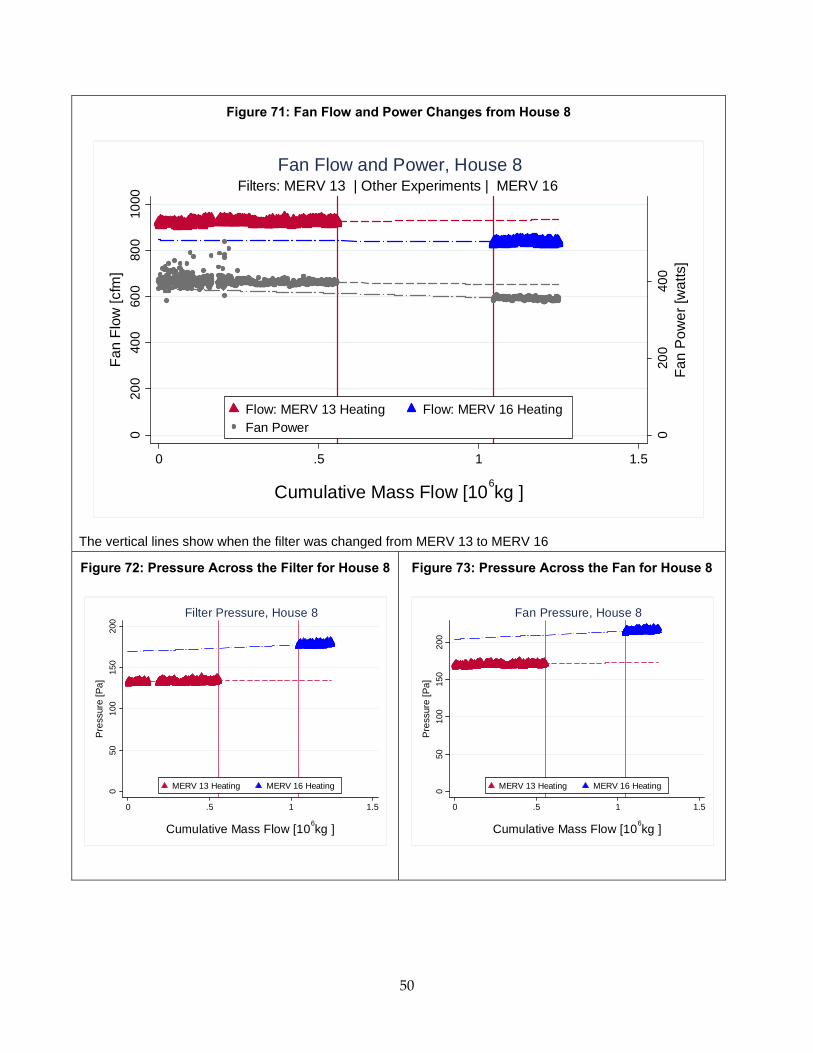
50
Figure 71: Fan Flow and Power Changes from House 8
The vertical lines show when the filter was changed from MERV 13 to MERV 16
Figure 72: Pressure Across the Filter for House 8
Figure 73: Pressure Across the Fan for House 8
020
040
0
020
040
060
080
010
00
0 .5 1 1.5
Flow: MERV 13 Heating Flow: MERV 16 HeatingFan Power
Fan
Pow
er [w
atts
]
Fan
Flow
[cfm
]
Cumulative Mass Flow [10 6kg ]
Filters: MERV 13 | Other Experiments | MERV 16Fan Flow and Power, House 8
050
100
150
200
0 .5 1 1.5
MERV 13 Heating MERV 16 Heating
Pre
ssur
e [P
a]
Cumulative Mass Flow [10 6kg ]
Filter Pressure, House 8
050
100
150
200
0 .5 1 1.5
MERV 13 Heating MERV 16 Heating
Pre
ssur
e [P
a]
Cumulative Mass Flow [10 6kg ]
Fan Pressure, House 8
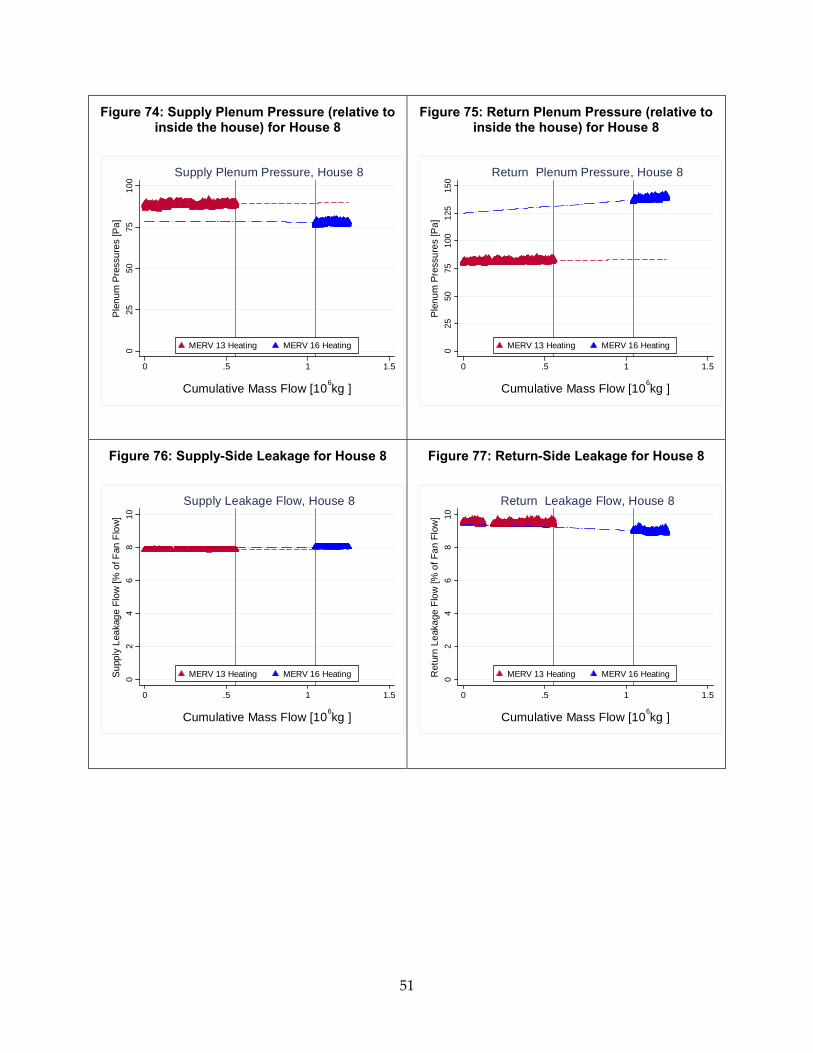
51
Figure 74: Supply Plenum Pressure (relative to inside the house) for House 8
Figure 75: Return Plenum Pressure (relative to inside the house) for House 8
Figure 76: Supply-Side Leakage for House 8
Figure 77: Return-Side Leakage for House 8
025
5075
100
0 .5 1 1.5
MERV 13 Heating MERV 16 Heating
Ple
num
Pre
ssur
es [P
a]
Cumulative Mass Flow [10 6kg ]
Supply Plenum Pressure, House 8
025
5075
100
125
150
0 .5 1 1.5
MERV 13 Heating MERV 16 Heating
Ple
num
Pre
ssur
es [P
a]
Cumulative Mass Flow [10 6kg ]
Return Plenum Pressure, House 8
02
46
810
0 .5 1 1.5
MERV 13 Heating MERV 16 HeatingSup
ply
Leak
age
Flow
[% o
f Fan
Flo
w]
Cumulative Mass Flow [10 6kg ]
Supply Leakage Flow, House 8
02
46
810
0 .5 1 1.5
MERV 13 Heating MERV 16 HeatingRet
urn
Leak
age
Flow
[% o
f Fan
Flo
w]
Cumulative Mass Flow [10 6kg ]
Return Leakage Flow, House 8
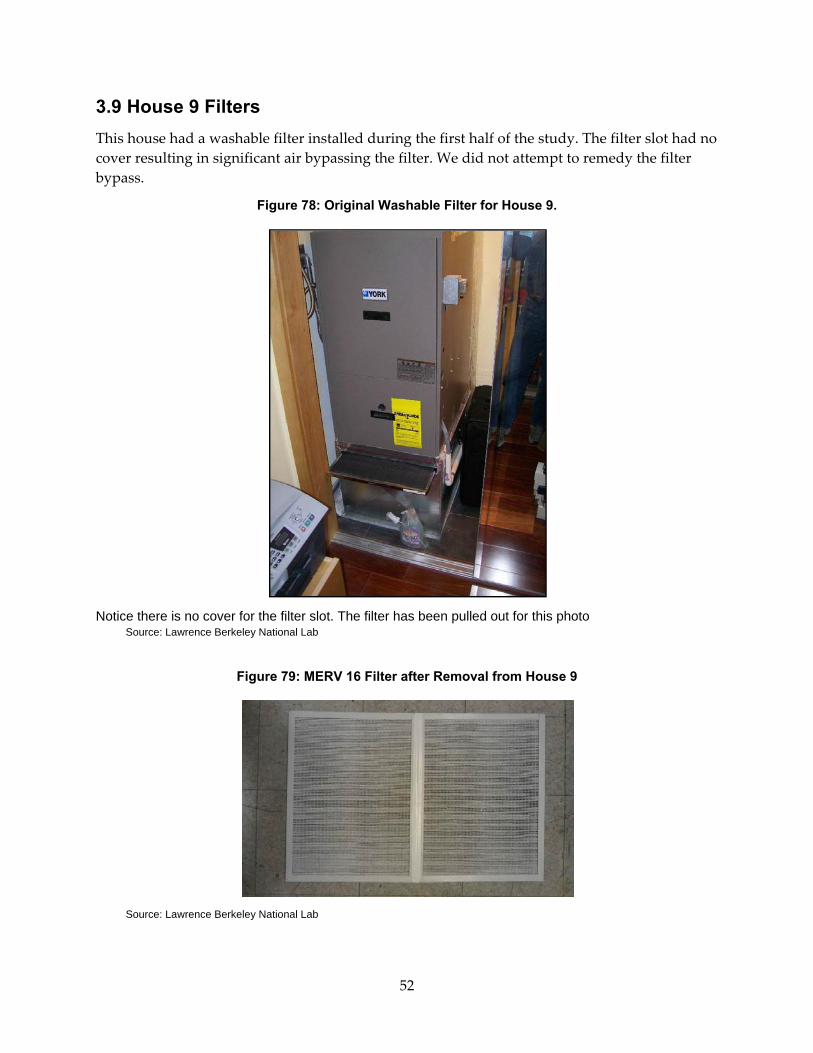
52
3.9 House 9 Filters This house had a washable filter installed during the first half of the study. The filter slot had no cover resulting in significant air bypassing the filter. We did not attempt to remedy the filter bypass.
Figure 78: Original Washable Filter for House 9.
Notice there is no cover for the filter slot. The filter has been pulled out for this photo
Source: Lawrence Berkeley National Lab
Figure 79: MERV 16 Filter after Removal from House 9
Source: Lawrence Berkeley National Lab
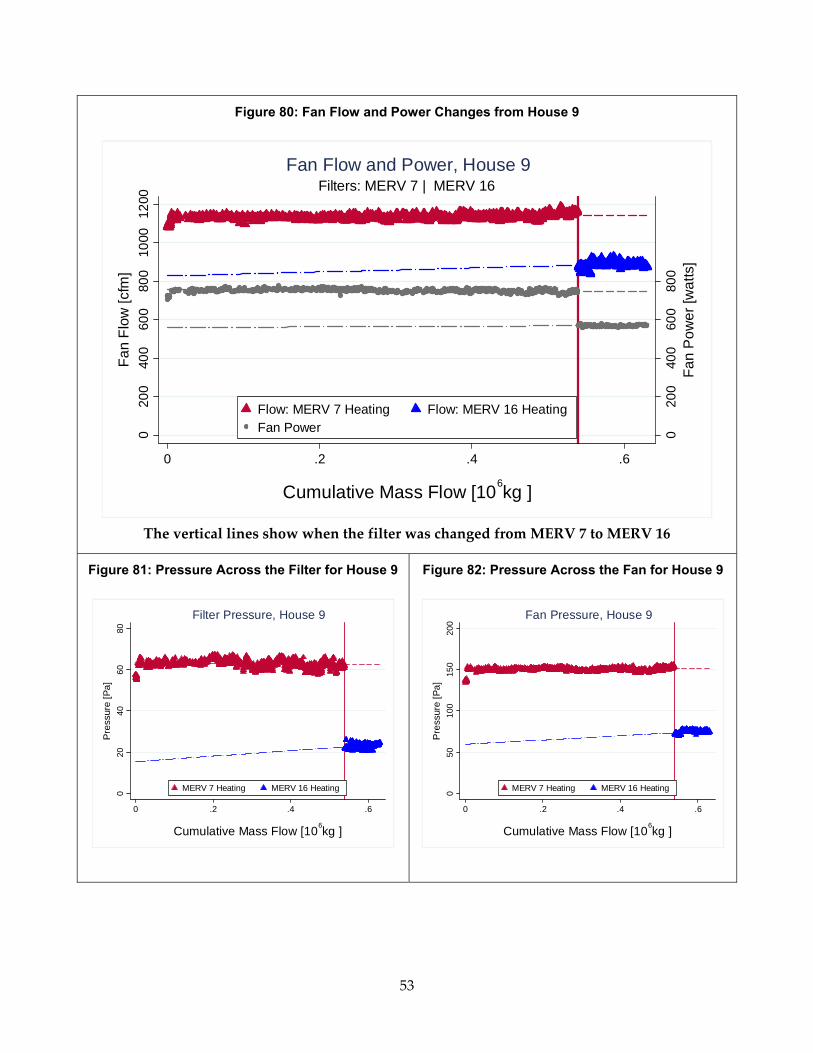
53
Figure 80: Fan Flow and Power Changes from House 9
The vertical lines show when the filter was changed from MERV 7 to MERV 16
Figure 81: Pressure Across the Filter for House 9
Figure 82: Pressure Across the Fan for House 9
020
040
060
080
0
020
040
060
080
010
0012
00
0 .2 .4 .6
Flow: MERV 7 Heating Flow: MERV 16 HeatingFan Power
Fan
Pow
er [w
atts
]
Fan
Flow
[cfm
]
Cumulative Mass Flow [10 6kg ]
Filters: MERV 7 | MERV 16Fan Flow and Power, House 9
020
4060
80
0 .2 .4 .6
MERV 7 Heating MERV 16 Heating
Pre
ssur
e [P
a]
Cumulative Mass Flow [10 6kg ]
Filter Pressure, House 9
050
100
150
200
0 .2 .4 .6
MERV 7 Heating MERV 16 Heating
Pre
ssur
e [P
a]
Cumulative Mass Flow [10 6kg ]
Fan Pressure, House 9
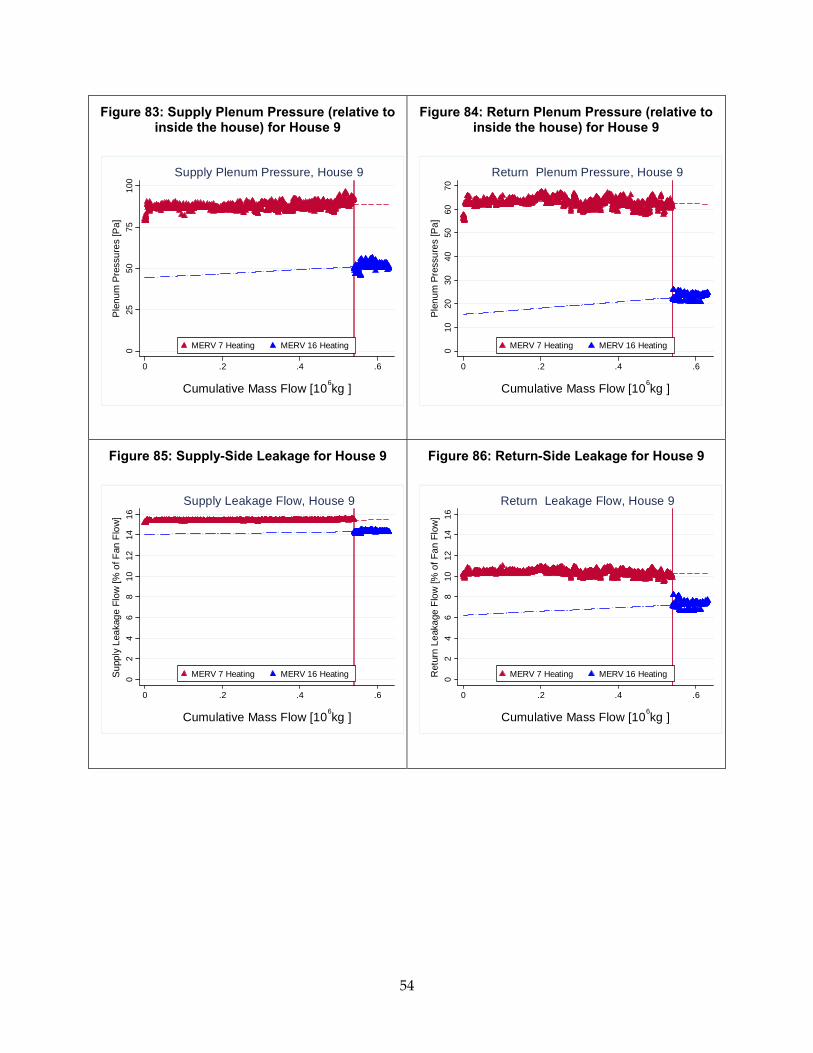
54
Figure 83: Supply Plenum Pressure (relative to inside the house) for House 9
Figure 84: Return Plenum Pressure (relative to inside the house) for House 9
Figure 85: Supply-Side Leakage for House 9
Figure 86: Return-Side Leakage for House 9
025
5075
100
0 .2 .4 .6
MERV 7 Heating MERV 16 Heating
Ple
num
Pre
ssur
es [P
a]
Cumulative Mass Flow [10 6kg ]
Supply Plenum Pressure, House 9
010
2030
4050
6070
0 .2 .4 .6
MERV 7 Heating MERV 16 Heating
Ple
num
Pre
ssur
es [P
a]
Cumulative Mass Flow [10 6kg ]
Return Plenum Pressure, House 9
02
46
810
1214
16
0 .2 .4 .6
MERV 7 Heating MERV 16 HeatingSup
ply
Leak
age
Flow
[% o
f Fan
Flo
w]
Cumulative Mass Flow [10 6kg ]
Supply Leakage Flow, House 9
02
46
810
1214
16
0 .2 .4 .6
MERV 7 Heating MERV 16 HeatingRet
urn
Leak
age
Flow
[% o
f Fan
Flo
w]
Cumulative Mass Flow [10 6kg ]
Return Leakage Flow, House 9
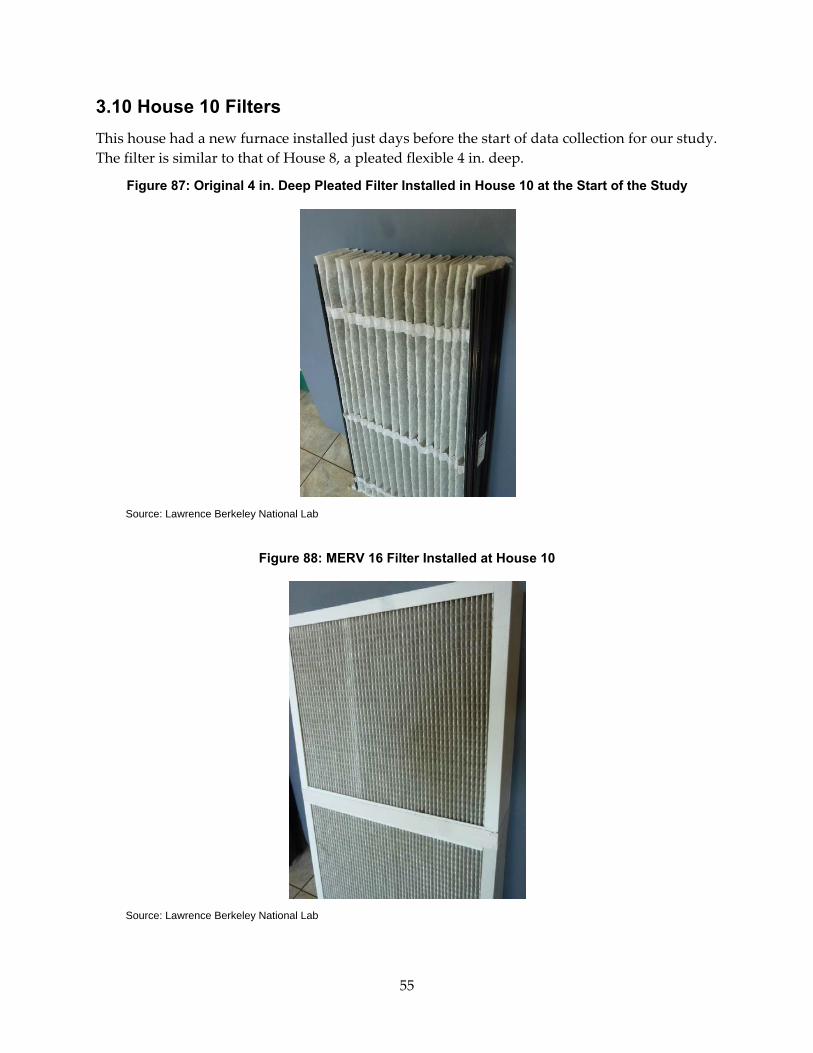
55
3.10 House 10 Filters This house had a new furnace installed just days before the start of data collection for our study. The filter is similar to that of House 8, a pleated flexible 4 in. deep.
Figure 87: Original 4 in. Deep Pleated Filter Installed in House 10 at the Start of the Study
Source: Lawrence Berkeley National Lab
Figure 88: MERV 16 Filter Installed at House 10
Source: Lawrence Berkeley National Lab
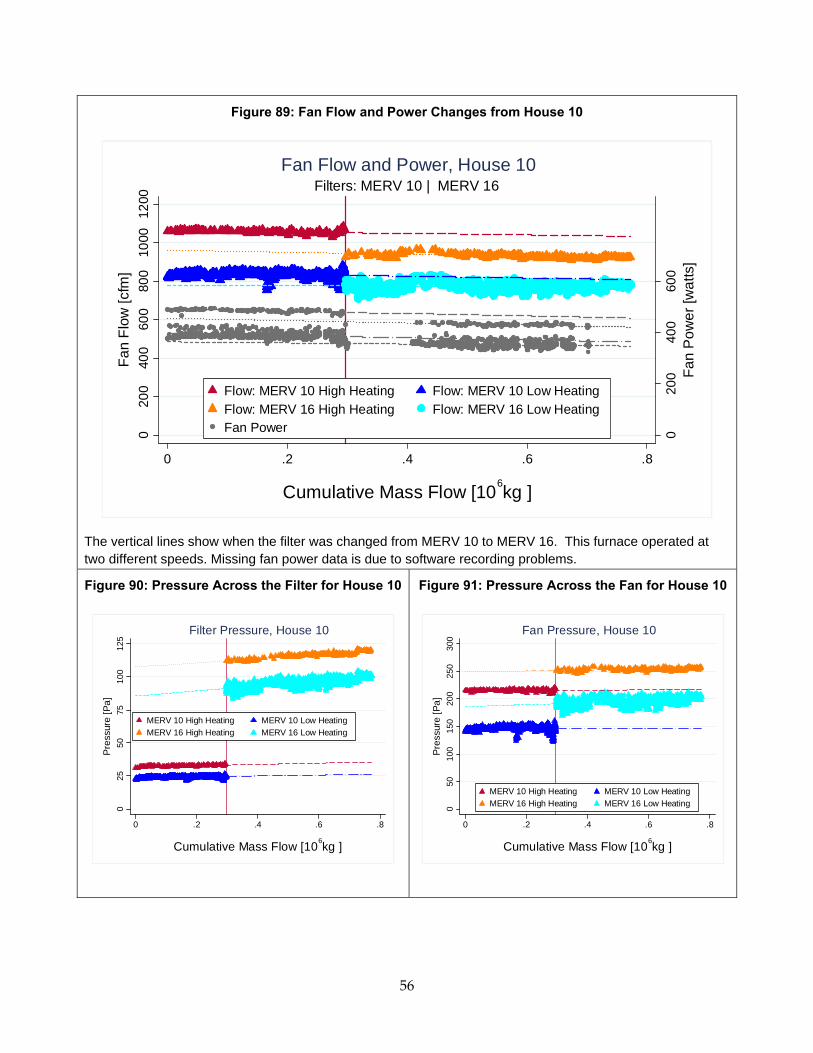
56
Figure 89: Fan Flow and Power Changes from House 10
The vertical lines show when the filter was changed from MERV 10 to MERV 16. This furnace operated at two different speeds. Missing fan power data is due to software recording problems.
Figure 90: Pressure Across the Filter for House 10
Figure 91: Pressure Across the Fan for House 10
020
040
060
0
020
040
060
080
010
0012
00
0 .2 .4 .6 .8
Flow: MERV 10 High Heating Flow: MERV 10 Low HeatingFlow: MERV 16 High Heating Flow: MERV 16 Low HeatingFan Power
Fan
Pow
er [w
atts
]
Fan
Flow
[cfm
]
Cumulative Mass Flow [10 6kg ]
Filters: MERV 10 | MERV 16Fan Flow and Power, House 10
025
5075
100
125
0 .2 .4 .6 .8
MERV 10 High Heating MERV 10 Low HeatingMERV 16 High Heating MERV 16 Low Heating
Pre
ssur
e [P
a]
Cumulative Mass Flow [10 6kg ]
Filter Pressure, House 10
050
100
150
200
250
300
0 .2 .4 .6 .8
MERV 10 High Heating MERV 10 Low HeatingMERV 16 High Heating MERV 16 Low Heating
Pre
ssur
e [P
a]
Cumulative Mass Flow [10 6kg ]
Fan Pressure, House 10
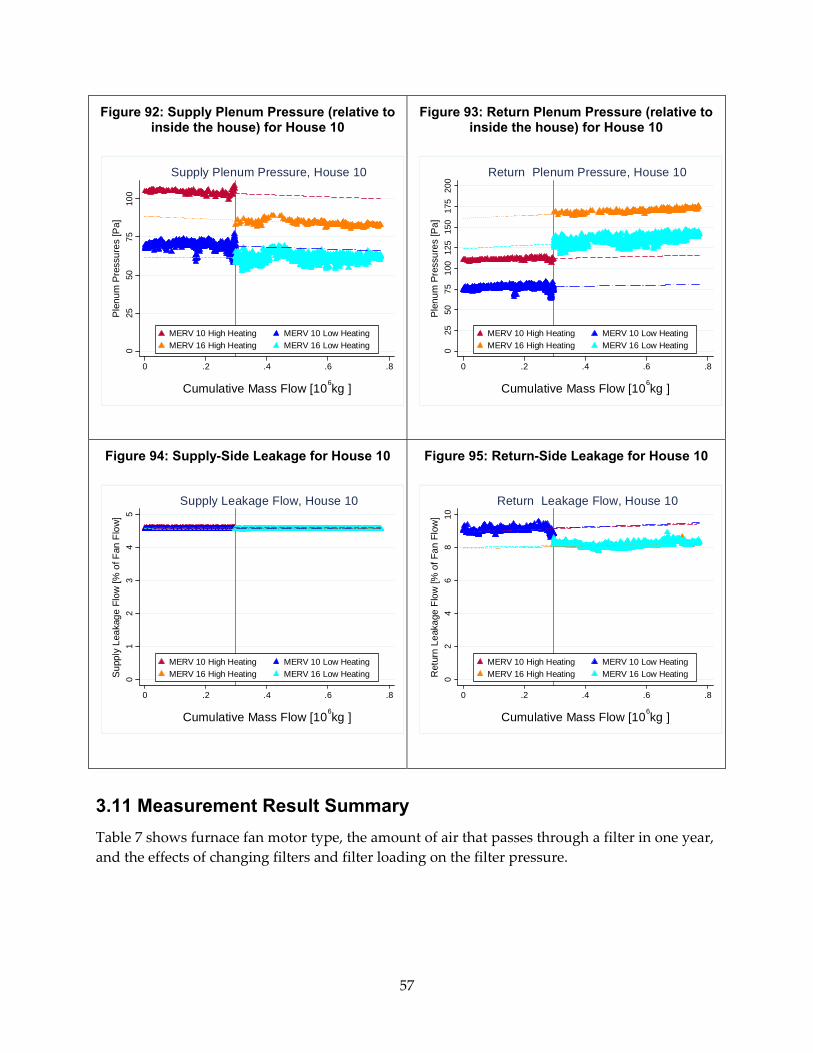
57
Figure 92: Supply Plenum Pressure (relative to inside the house) for House 10
Figure 93: Return Plenum Pressure (relative to inside the house) for House 10
Figure 94: Supply-Side Leakage for House 10
Figure 95: Return-Side Leakage for House 10
3.11 Measurement Result Summary Table 7 shows furnace fan motor type, the amount of air that passes through a filter in one year, and the effects of changing filters and filter loading on the filter pressure.
025
5075
100
0 .2 .4 .6 .8
MERV 10 High Heating MERV 10 Low HeatingMERV 16 High Heating MERV 16 Low Heating
Ple
num
Pre
ssur
es [P
a]
Cumulative Mass Flow [10 6kg ]
Supply Plenum Pressure, House 10
025
5075
100
125
150
175
200
0 .2 .4 .6 .8
MERV 10 High Heating MERV 10 Low HeatingMERV 16 High Heating MERV 16 Low Heating
Ple
num
Pre
ssur
es [P
a]
Cumulative Mass Flow [10 6kg ]
Return Plenum Pressure, House 10
01
23
45
0 .2 .4 .6 .8
MERV 10 High Heating MERV 10 Low HeatingMERV 16 High Heating MERV 16 Low HeatingS
uppl
y Le
akag
e Fl
ow [%
of F
an F
low
]
Cumulative Mass Flow [10 6kg ]
Supply Leakage Flow, House 10
02
46
810
0 .2 .4 .6 .8
MERV 10 High Heating MERV 10 Low HeatingMERV 16 High Heating MERV 16 Low HeatingR
etur
n Le
akag
e Fl
ow [%
of F
an F
low
]
Cumulative Mass Flow [10 6kg ]
Return Leakage Flow, House 10
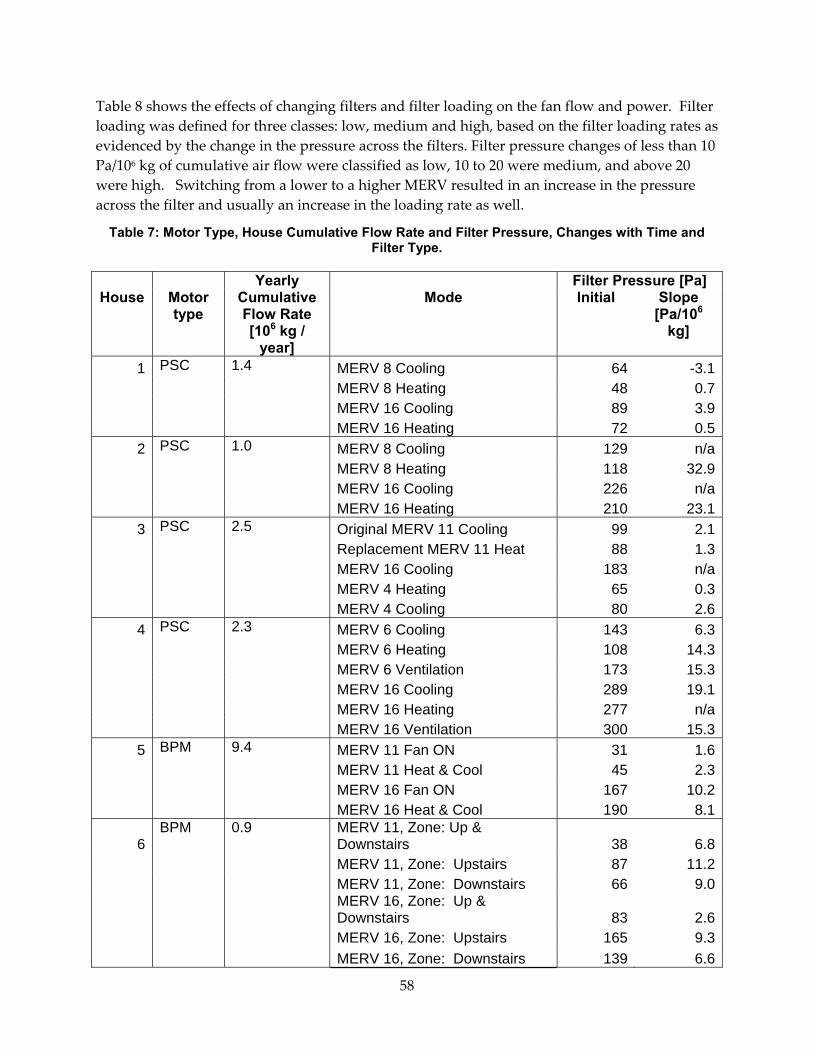
58
Table 8 shows the effects of changing filters and filter loading on the fan flow and power. Filter loading was defined for three classes: low, medium and high, based on the filter loading rates as evidenced by the change in the pressure across the filters. Filter pressure changes of less than 10 Pa/106 kg of cumulative air flow were classified as low, 10 to 20 were medium, and above 20 were high. Switching from a lower to a higher MERV resulted in an increase in the pressure across the filter and usually an increase in the loading rate as well.
Table 7: Motor Type, House Cumulative Flow Rate and Filter Pressure, Changes with Time and Filter Type.
Yearly Cumulative Flow Rate [106 kg /
year]
Filter Pressure [Pa] House Motor
type Mode Initial Slope
[Pa/106 kg]
1 PSC 1.4 MERV 8 Cooling 64 -3.1 MERV 8 Heating 48 0.7
MERV 16 Cooling 89 3.9 MERV 16 Heating 72 0.5
2 PSC 1.0 MERV 8 Cooling 129 n/a MERV 8 Heating 118 32.9
MERV 16 Cooling 226 n/a MERV 16 Heating 210 23.1
3 PSC 2.5 Original MERV 11 Cooling 99 2.1 Replacement MERV 11 Heat 88 1.3
MERV 16 Cooling 183 n/a MERV 4 Heating 65 0.3 MERV 4 Cooling 80 2.6
4 PSC 2.3 MERV 6 Cooling 143 6.3 MERV 6 Heating 108 14.3
MERV 6 Ventilation 173 15.3 MERV 16 Cooling 289 19.1 MERV 16 Heating 277 n/a MERV 16 Ventilation 300 15.3
5 BPM 9.4 MERV 11 Fan ON 31 1.6 MERV 11 Heat & Cool 45 2.3
MERV 16 Fan ON 167 10.2 MERV 16 Heat & Cool 190 8.1
6 BPM 0.9 MERV 11, Zone: Up &
Downstairs 38 6.8 MERV 11, Zone: Upstairs 87 11.2
MERV 11, Zone: Downstairs 66 9.0
MERV 16, Zone: Up &
Downstairs 83 2.6 MERV 16, Zone: Upstairs 165 9.3 MERV 16, Zone: Downstairs 139 6.6
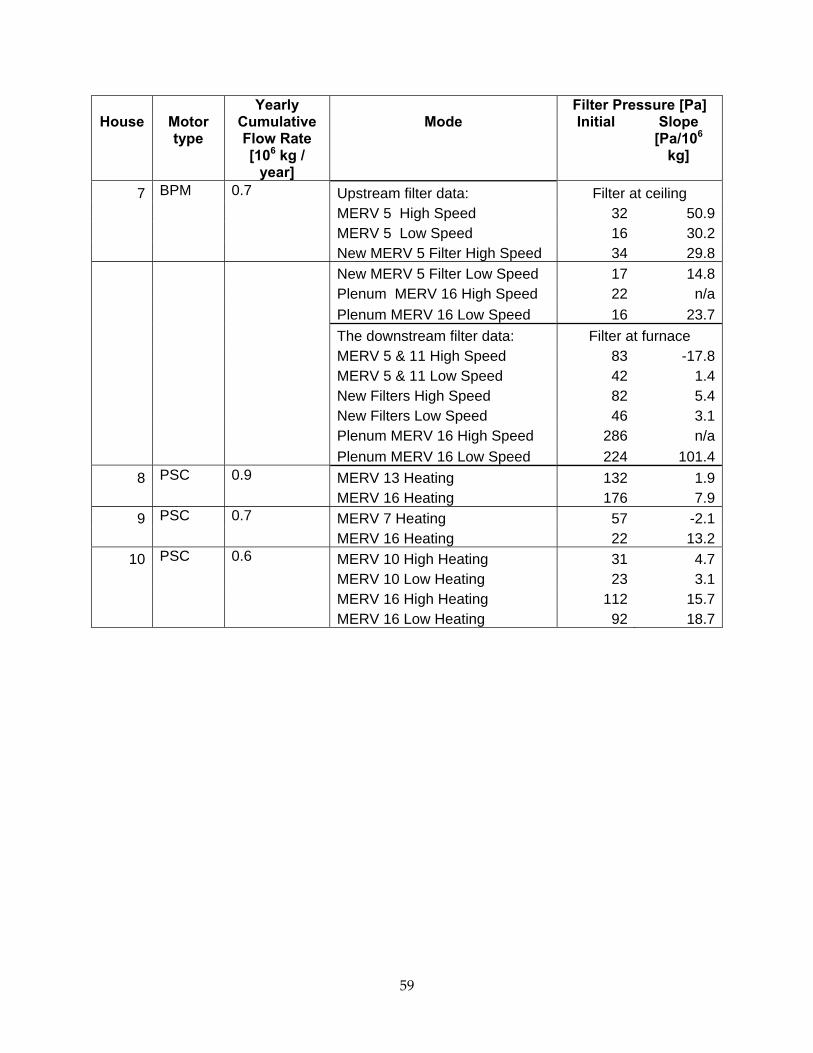
59
Yearly Cumulative Flow Rate [106 kg /
year]
Filter Pressure [Pa] House Motor
type Mode Initial Slope
[Pa/106 kg]
7 BPM 0.7 Upstream filter data: Filter at ceiling MERV 5 High Speed 32 50.9
MERV 5 Low Speed 16 30.2 New MERV 5 Filter High Speed 34 29.8 New MERV 5 Filter Low Speed 17 14.8 Plenum MERV 16 High Speed 22 n/a Plenum MERV 16 Low Speed 16 23.7 The downstream filter data: Filter at furnace MERV 5 & 11 High Speed 83 -17.8
MERV 5 & 11 Low Speed 42 1.4 New Filters High Speed 82 5.4 New Filters Low Speed 46 3.1 Plenum MERV 16 High Speed 286 n/a Plenum MERV 16 Low Speed 224 101.4
8 PSC 0.9 MERV 13 Heating 132 1.9 MERV 16 Heating 176 7.9
9 PSC 0.7 MERV 7 Heating 57 -2.1 MERV 16 Heating 22 13.2
10 PSC 0.6 MERV 10 High Heating 31 4.7 MERV 10 Low Heating 23 3.1
MERV 16 High Heating 112 15.7 MERV 16 Low Heating 92 18.7
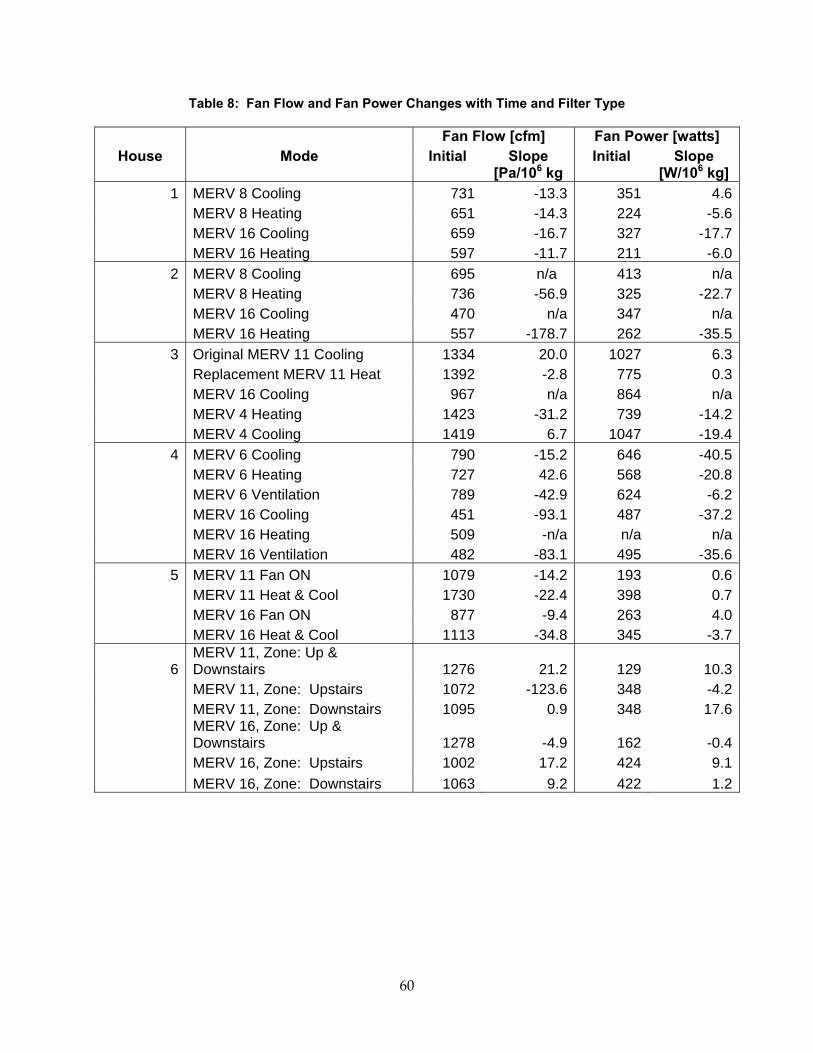
60
Table 8: Fan Flow and Fan Power Changes with Time and Filter Type
Fan Flow [cfm] Fan Power [watts] House Mode Initial Slope
[Pa/106 kg Initial Slope
[W/106 kg] 1 MERV 8 Cooling 731 -13.3 351 4.6
MERV 8 Heating 651 -14.3 224 -5.6 MERV 16 Cooling 659 -16.7 327 -17.7 MERV 16 Heating 597 -11.7 211 -6.0
2 MERV 8 Cooling 695 n/a 413 n/a MERV 8 Heating 736 -56.9 325 -22.7
MERV 16 Cooling 470 n/a 347 n/a MERV 16 Heating 557 -178.7 262 -35.5
3 Original MERV 11 Cooling 1334 20.0 1027 6.3 Replacement MERV 11 Heat 1392 -2.8 775 0.3
MERV 16 Cooling 967 n/a 864 n/a MERV 4 Heating 1423 -31.2 739 -14.2 MERV 4 Cooling 1419 6.7 1047 -19.4
4 MERV 6 Cooling 790 -15.2 646 -40.5 MERV 6 Heating 727 42.6 568 -20.8
MERV 6 Ventilation 789 -42.9 624 -6.2 MERV 16 Cooling 451 -93.1 487 -37.2 MERV 16 Heating 509 -n/a n/a n/a MERV 16 Ventilation 482 -83.1 495 -35.6
5 MERV 11 Fan ON 1079 -14.2 193 0.6 MERV 11 Heat & Cool 1730 -22.4 398 0.7
MERV 16 Fan ON 877 -9.4 263 4.0 MERV 16 Heat & Cool 1113 -34.8 345 -3.7
6 MERV 11, Zone: Up & Downstairs 1276 21.2 129 10.3
MERV 11, Zone: Upstairs 1072 -123.6 348 -4.2 MERV 11, Zone: Downstairs 1095 0.9 348 17.6
MERV 16, Zone: Up & Downstairs 1278 -4.9 162 -0.4
MERV 16, Zone: Upstairs 1002 17.2 424 9.1 MERV 16, Zone: Downstairs 1063 9.2 422 1.2
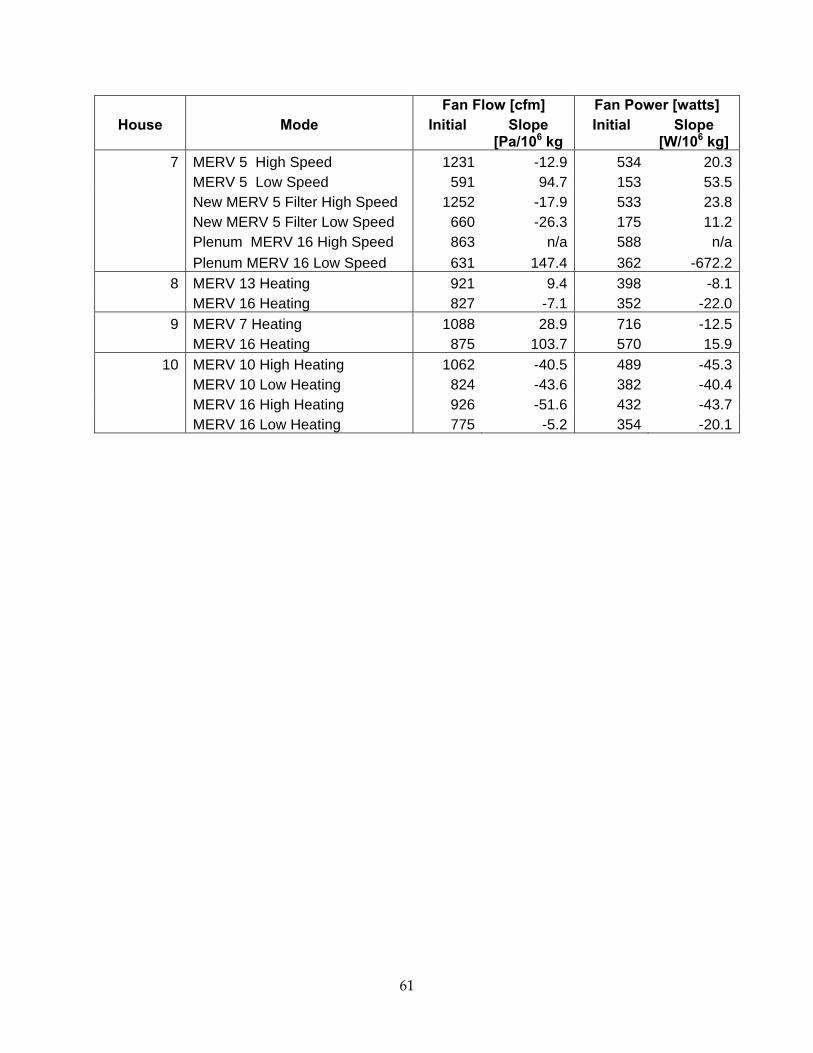
61
Fan Flow [cfm] Fan Power [watts] House Mode Initial Slope
[Pa/106 kg Initial Slope
[W/106 kg] 7 MERV 5 High Speed 1231 -12.9 534 20.3
MERV 5 Low Speed 591 94.7 153 53.5 New MERV 5 Filter High Speed 1252 -17.9 533 23.8 New MERV 5 Filter Low Speed 660 -26.3 175 11.2 Plenum MERV 16 High Speed 863 n/a 588 n/a Plenum MERV 16 Low Speed 631 147.4 362 -672.2
8 MERV 13 Heating 921 9.4 398 -8.1MERV 16 Heating 827 -7.1 352 -22.0
9 MERV 7 Heating 1088 28.9 716 -12.5MERV 16 Heating 875 103.7 570 15.9
10 MERV 10 High Heating 1062 -40.5 489 -45.3 MERV 10 Low Heating 824 -43.6 382 -40.4
MERV 16 High Heating 926 -51.6 432 -43.7 MERV 16 Low Heating 775 -5.2 354 -20.1
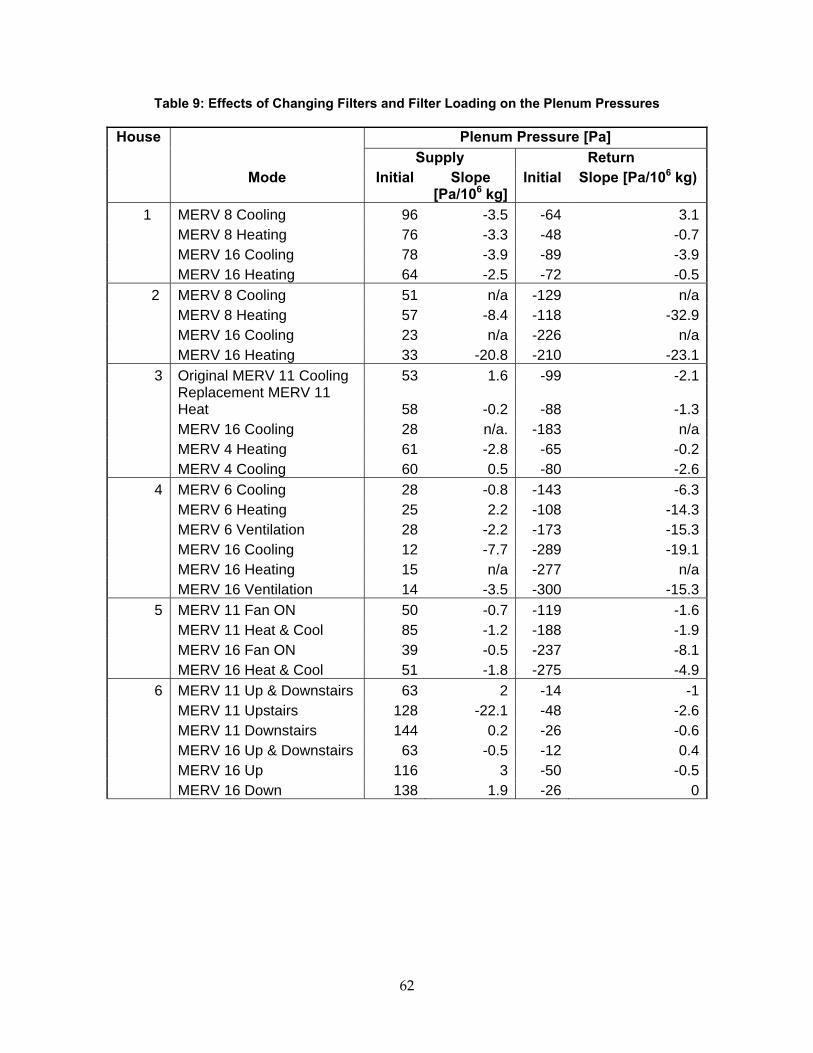
62
Table 9: Effects of Changing Filters and Filter Loading on the Plenum Pressures
House Plenum Pressure [Pa] Supply Return
Mode Initial Slope [Pa/106 kg]
Initial Slope [Pa/106 kg)
1 MERV 8 Cooling 96 -3.5 -64 3.1MERV 8 Heating 76 -3.3 -48 -0.7
MERV 16 Cooling 78 -3.9 -89 -3.9 MERV 16 Heating 64 -2.5 -72 -0.5 2 MERV 8 Cooling 51 n/a -129 n/a
MERV 8 Heating 57 -8.4 -118 -32.9 MERV 16 Cooling 23 n/a -226 n/a MERV 16 Heating 33 -20.8 -210 -23.1
3 Original MERV 11 Cooling 53 1.6 -99 -2.1Replacement MERV 11 Heat 58 -0.2 -88 -1.3
MERV 16 Cooling 28 n/a. -183 n/a MERV 4 Heating 61 -2.8 -65 -0.2 MERV 4 Cooling 60 0.5 -80 -2.6
4 MERV 6 Cooling 28 -0.8 -143 -6.3MERV 6 Heating 25 2.2 -108 -14.3
MERV 6 Ventilation 28 -2.2 -173 -15.3 MERV 16 Cooling 12 -7.7 -289 -19.1 MERV 16 Heating 15 n/a -277 n/a MERV 16 Ventilation 14 -3.5 -300 -15.3
5 MERV 11 Fan ON 50 -0.7 -119 -1.6MERV 11 Heat & Cool 85 -1.2 -188 -1.9
MERV 16 Fan ON 39 -0.5 -237 -8.1 MERV 16 Heat & Cool 51 -1.8 -275 -4.9
6 MERV 11 Up & Downstairs 63 2 -14 -1MERV 11 Upstairs 128 -22.1 -48 -2.6
MERV 11 Downstairs 144 0.2 -26 -0.6 MERV 16 Up & Downstairs 63 -0.5 -12 0.4 MERV 16 Up 116 3 -50 -0.5 MERV 16 Down 138 1.9 -26 0
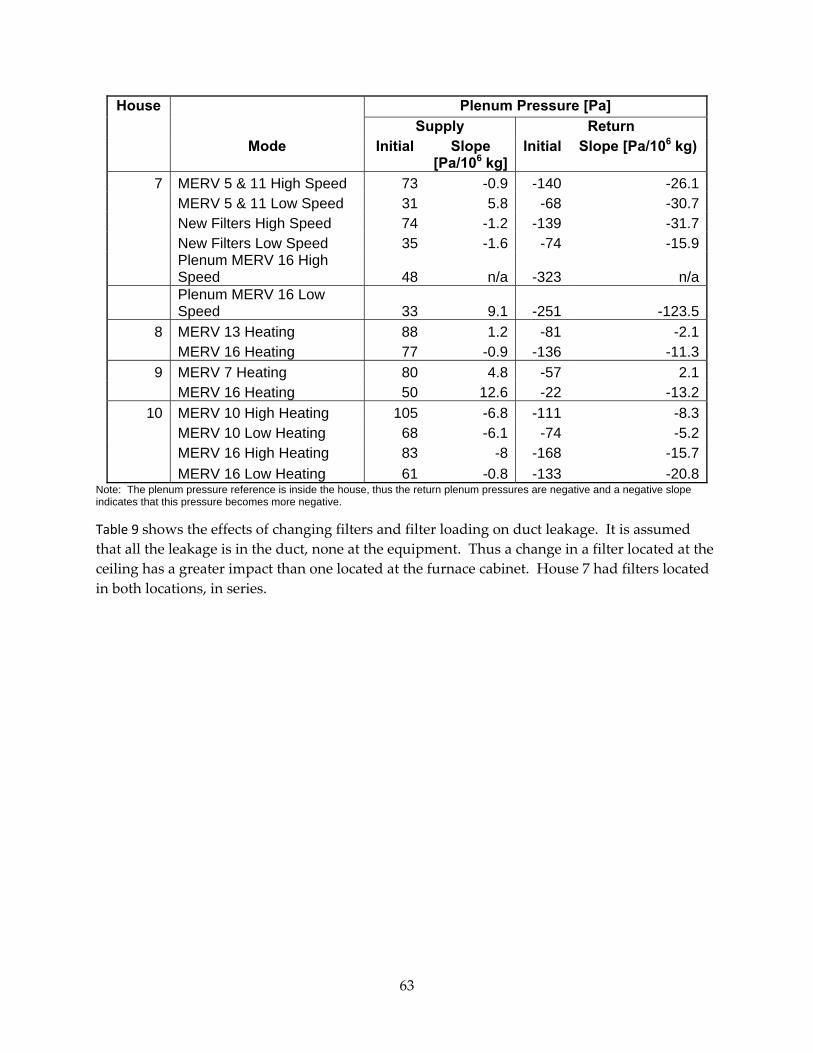
63
House Plenum Pressure [Pa] Supply Return
Mode Initial Slope [Pa/106 kg]
Initial Slope [Pa/106 kg)
7 MERV 5 & 11 High Speed 73 -0.9 -140 -26.1MERV 5 & 11 Low Speed 31 5.8 -68 -30.7
New Filters High Speed 74 -1.2 -139 -31.7 New Filters Low Speed 35 -1.6 -74 -15.9
Plenum MERV 16 High Speed 48 n/a -323 n/a
Plenum MERV 16 Low Speed 33 9.1 -251 -123.5
8 MERV 13 Heating 88 1.2 -81 -2.1MERV 16 Heating 77 -0.9 -136 -11.3
9 MERV 7 Heating 80 4.8 -57 2.1MERV 16 Heating 50 12.6 -22 -13.2
10 MERV 10 High Heating 105 -6.8 -111 -8.3MERV 10 Low Heating 68 -6.1 -74 -5.2
MERV 16 High Heating 83 -8 -168 -15.7 MERV 16 Low Heating 61 -0.8 -133 -20.8
Note: The plenum pressure reference is inside the house, thus the return plenum pressures are negative and a negative slope indicates that this pressure becomes more negative.
Table 9 shows the effects of changing filters and filter loading on duct leakage. It is assumed that all the leakage is in the duct, none at the equipment. Thus a change in a filter located at the ceiling has a greater impact than one located at the furnace cabinet. House 7 had filters located in both locations, in series.
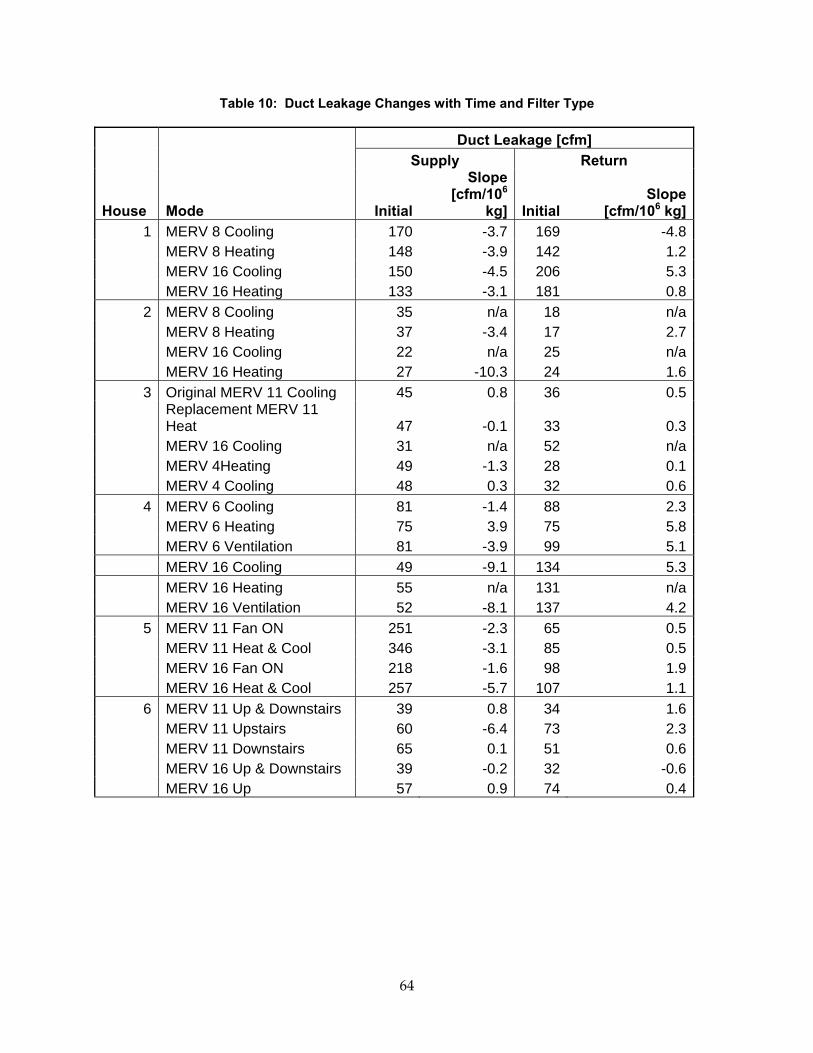
64
Table 10: Duct Leakage Changes with Time and Filter Type
Duct Leakage [cfm] Supply Return
House Mode Initial
Slope [cfm/106
kg] InitialSlope
[cfm/106 kg]1 MERV 8 Cooling 170 -3.7 169 -4.8
MERV 8 Heating 148 -3.9 142 1.2 MERV 16 Cooling 150 -4.5 206 5.3 MERV 16 Heating 133 -3.1 181 0.8
2 MERV 8 Cooling 35 n/a 18 n/a MERV 8 Heating 37 -3.4 17 2.7 MERV 16 Cooling 22 n/a 25 n/a MERV 16 Heating 27 -10.3 24 1.6
3 Original MERV 11 Cooling 45 0.8 36 0.5Replacement MERV 11 Heat 47 -0.1 33 0.3
MERV 16 Cooling 31 n/a 52 n/a MERV 4Heating 49 -1.3 28 0.1 MERV 4 Cooling 48 0.3 32 0.6
4 MERV 6 Cooling 81 -1.4 88 2.3 MERV 6 Heating 75 3.9 75 5.8 MERV 6 Ventilation 81 -3.9 99 5.1 MERV 16 Cooling 49 -9.1 134 5.3 MERV 16 Heating 55 n/a 131 n/a MERV 16 Ventilation 52 -8.1 137 4.2
5 MERV 11 Fan ON 251 -2.3 65 0.5 MERV 11 Heat & Cool 346 -3.1 85 0.5 MERV 16 Fan ON 218 -1.6 98 1.9 MERV 16 Heat & Cool 257 -5.7 107 1.1
6 MERV 11 Up & Downstairs 39 0.8 34 1.6 MERV 11 Upstairs 60 -6.4 73 2.3 MERV 11 Downstairs 65 0.1 51 0.6 MERV 16 Up & Downstairs 39 -0.2 32 -0.6 MERV 16 Up 57 0.9 74 0.4
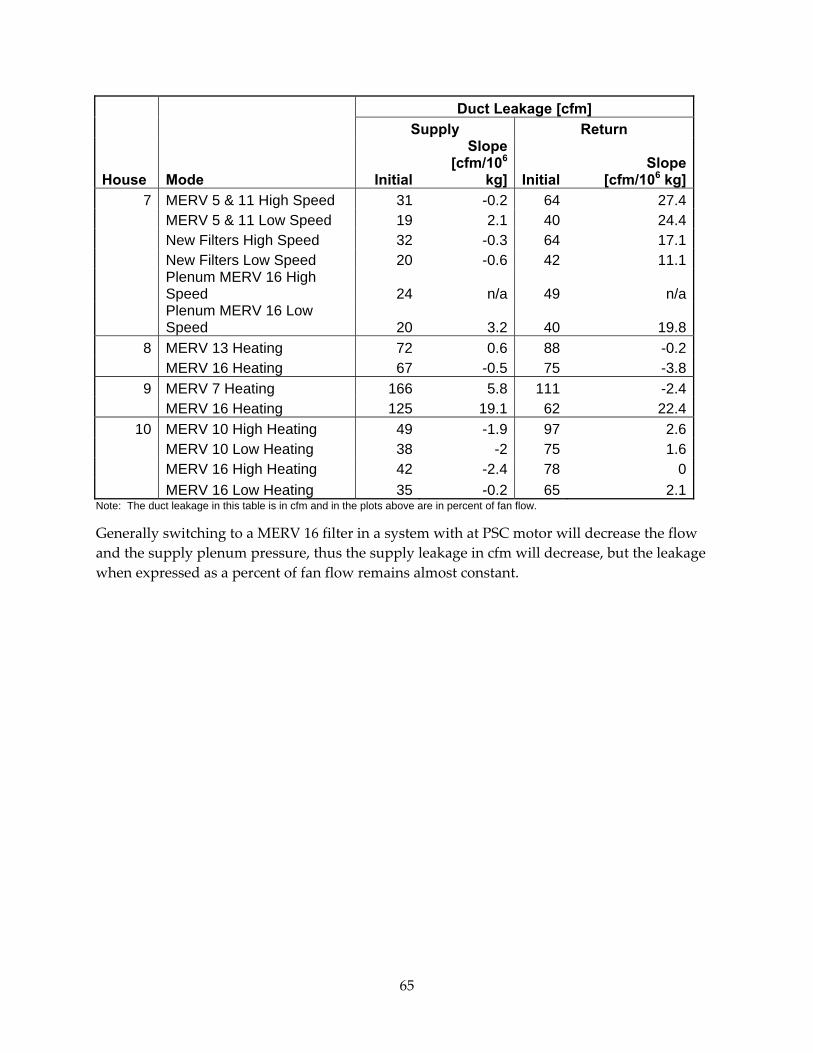
65
Duct Leakage [cfm] Supply Return
House Mode Initial
Slope [cfm/106
kg] InitialSlope
[cfm/106 kg]7 MERV 5 & 11 High Speed 31 -0.2 64 27.4
MERV 5 & 11 Low Speed 19 2.1 40 24.4 New Filters High Speed 32 -0.3 64 17.1 New Filters Low Speed 20 -0.6 42 11.1
Plenum MERV 16 High Speed 24 n/a 49 n/a
Plenum MERV 16 Low Speed 20 3.2 40 19.8
8 MERV 13 Heating 72 0.6 88 -0.2 MERV 16 Heating 67 -0.5 75 -3.8
9 MERV 7 Heating 166 5.8 111 -2.4MERV 16 Heating 125 19.1 62 22.4
10 MERV 10 High Heating 49 -1.9 97 2.6 MERV 10 Low Heating 38 -2 75 1.6 MERV 16 High Heating 42 -2.4 78 0 MERV 16 Low Heating 35 -0.2 65 2.1
Note: The duct leakage in this table is in cfm and in the plots above are in percent of fan flow.
Generally switching to a MERV 16 filter in a system with at PSC motor will decrease the flow and the supply plenum pressure, thus the supply leakage in cfm will decrease, but the leakage when expressed as a percent of fan flow remains almost constant.
66
CHAPTER 4: Energy Use Estimates and Simulations Only a limited sample of California homes was tested in the field measurements. It is important to be able to extrapolate the test results to a wider range of houses, climates and possible systems. To accomplish this, an energy model specifically focused on HVAC system performance was used. The model is called REGCAP and has been validated and used in many previous studies – including studies for the Energy Commission (Walker and Sherman 2006). REGCAP is a minute‐by‐minute simulation tool that accounts for interactions between airflow, ventilation and equipment performance in homes. It has a two‐zone model for including furnaces and duct systems in attics and to account for attic heat transfer on home energy loads. It contains an airflow model that combines natural ventilation, mechanical ventilation and heating and cooling system air flows. The airflow model is coupled to a heat transfer model that includes solar loads and attic‐house interactions. For this study a new calculation procedure was added to REGCAP to account for changes in airflow, fan power and duct leakage for different MERV filters and to account for changing performance over time. Using the results of the field testing, three scenarios were developed:
• Low change in performance. This corresponds to homes in the study that exhibited small loading effects.
• Moderate change in performance. This corresponds to homes in the middle of the range of responses observed in the field data.
• Large changes in performance. This corresponds to a worst case of very fast loading from the fastest‐loading house in the study.
The simulations were performed for MERV 8, 11 and 16 filters using MERV 5 with no loading effects as a baseline for reference.
The model included the following calculations:
• Blower power changes with system pressure for both PSC and BPM motors
• Airflow changes with system pressure
• Duct leakage changes with system pressure
• Air conditioner performance changes with air flow
A matrix of model runs was created based on 6 representative California climate zones, the use of PSC or BPM blower motors, three different filters/fouling rates, and two duct systems (a 28 percent leaky typical system and a 6 percent duct‐credit‐compliant system.). The majority of house and climate parameters were taken from the Title 24 Alternative Calculation Manual (ACM) (CEC, 2008) that is used for determining compliance with California residential building energy code.
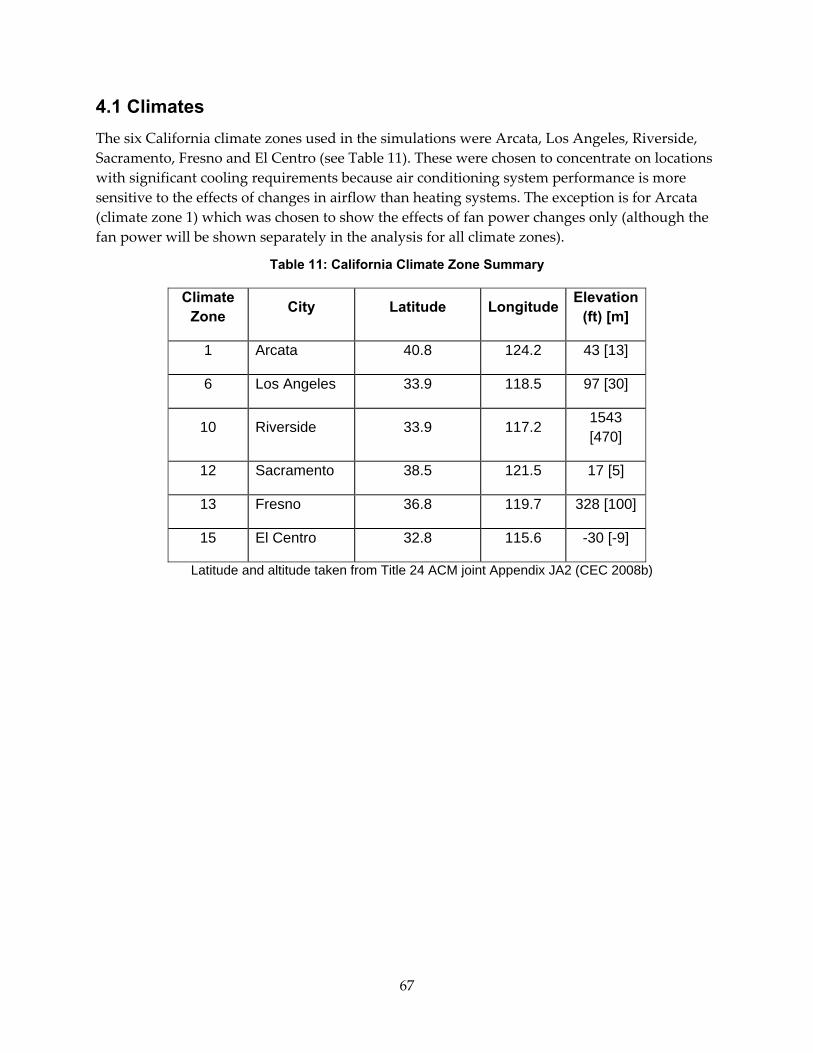
67
4.1 Climates The six California climate zones used in the simulations were Arcata, Los Angeles, Riverside, Sacramento, Fresno and El Centro (see Table 11). These were chosen to concentrate on locations with significant cooling requirements because air conditioning system performance is more sensitive to the effects of changes in airflow than heating systems. The exception is for Arcata (climate zone 1) which was chosen to show the effects of fan power changes only (although the fan power will be shown separately in the analysis for all climate zones).
Table 11: California Climate Zone Summary
Climate Zone City Latitude Longitude Elevation
(ft) [m]
1 Arcata 40.8 124.2 43 [13]
6 Los Angeles 33.9 118.5 97 [30]
10 Riverside 33.9 117.2 1543 [470]
12 Sacramento 38.5 121.5 17 [5]
13 Fresno 36.8 119.7 328 [100]
15 El Centro 32.8 115.6 -30 [-9]
Latitude and altitude taken from Title 24 ACM joint Appendix JA2 (CEC 2008b)
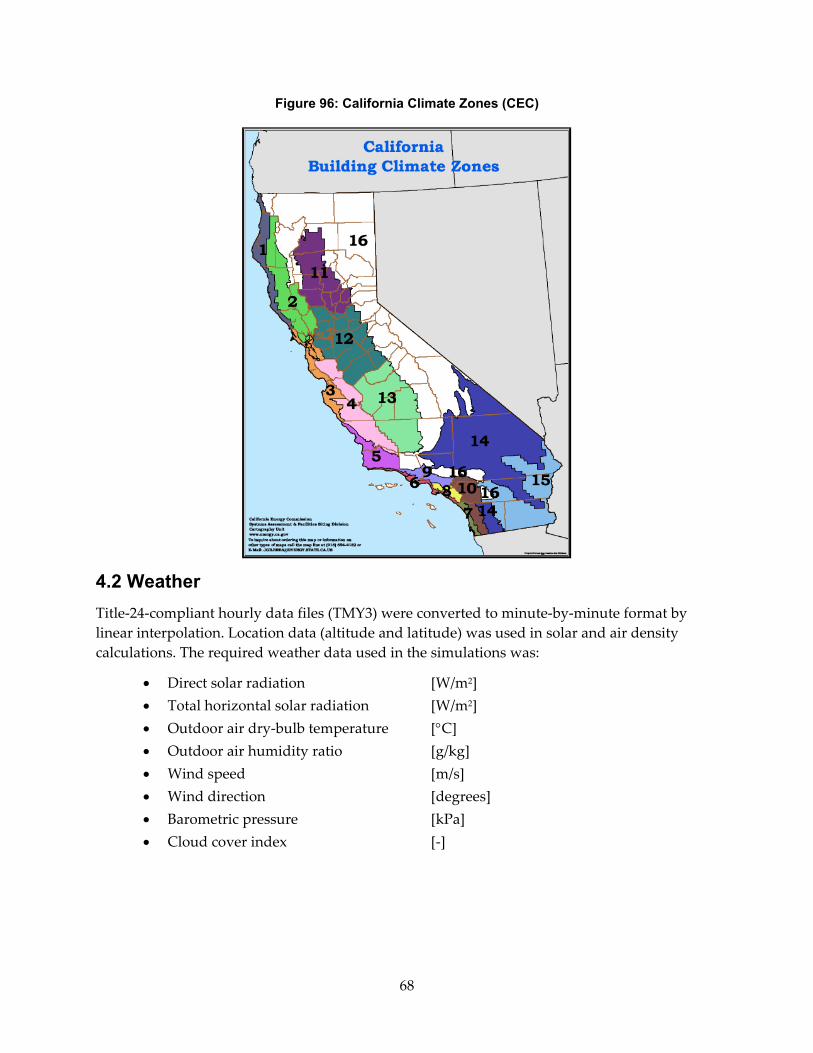
68
Figure 96: California Climate Zones (CEC)
4.2 Weather Title‐24‐compliant hourly data files (TMY3) were converted to minute‐by‐minute format by linear interpolation. Location data (altitude and latitude) was used in solar and air density calculations. The required weather data used in the simulations was:
• Direct solar radiation [W/m2] • Total horizontal solar radiation [W/m2] • Outdoor air dry‐bulb temperature [°C] • Outdoor air humidity ratio [g/kg] • Wind speed [m/s] • Wind direction [degrees] • Barometric pressure [kPa] • Cloud cover index [‐]
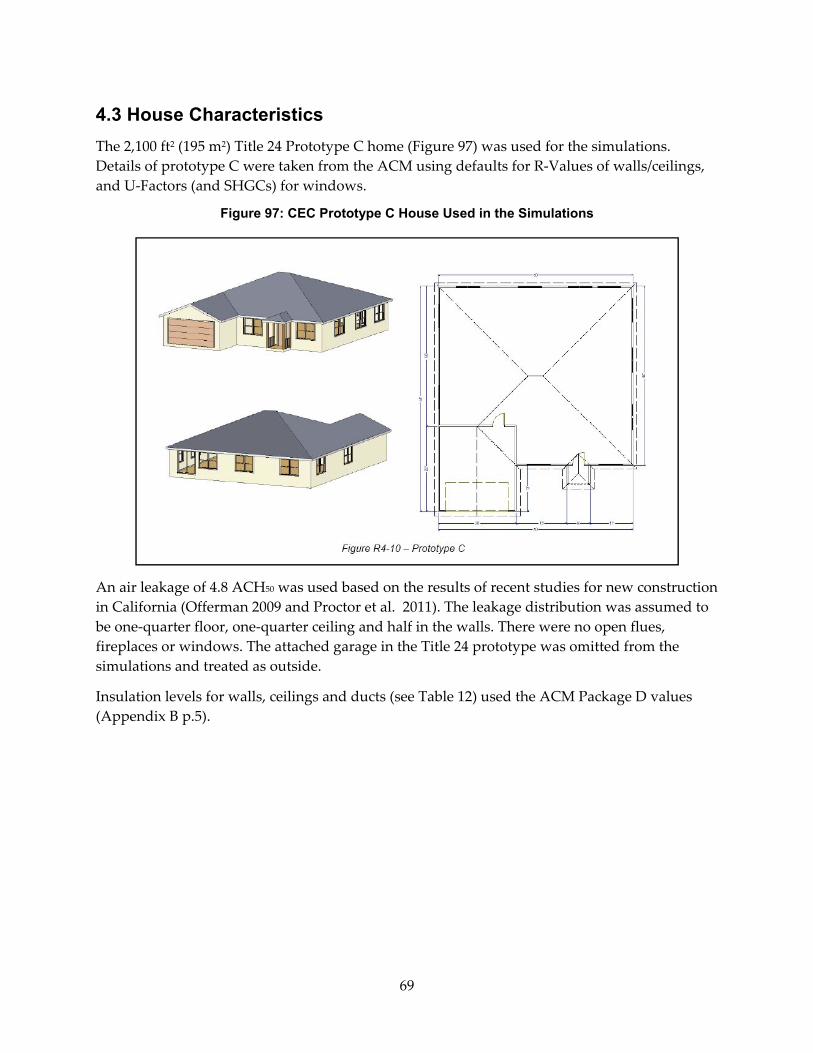
69
4.3 House Characteristics The 2,100 ft2 (195 m2) Title 24 Prototype C home (Figure 97) was used for the simulations. Details of prototype C were taken from the ACM using defaults for R‐Values of walls/ceilings, and U‐Factors (and SHGCs) for windows.
Figure 97: CEC Prototype C House Used in the Simulations
An air leakage of 4.8 ACH50 was used based on the results of recent studies for new construction in California (Offerman 2009 and Proctor et al. 2011). The leakage distribution was assumed to be one‐quarter floor, one‐quarter ceiling and half in the walls. There were no open flues, fireplaces or windows. The attached garage in the Title 24 prototype was omitted from the simulations and treated as outside.
Insulation levels for walls, ceilings and ducts (see Table 12) used the ACM Package D values (Appendix B p.5).
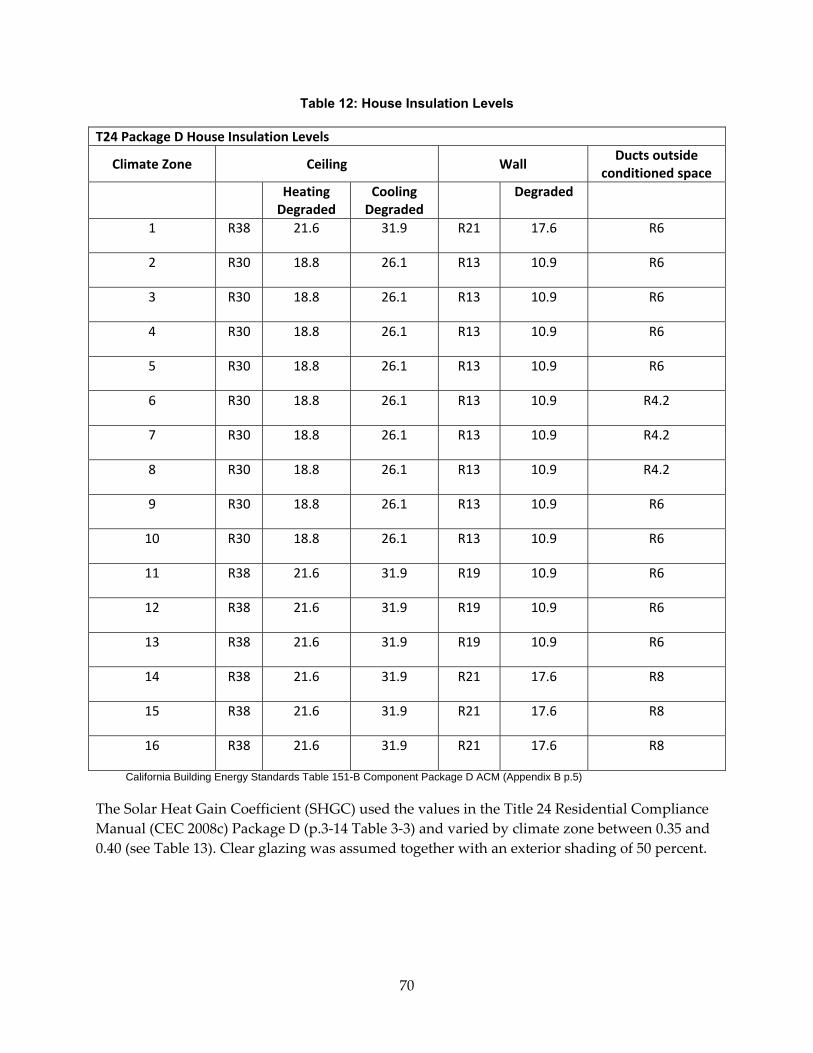
70
Table 12: House Insulation Levels
T24 Package D House Insulation Levels
Climate Zone Ceiling Wall Ducts outside
conditioned space Heating
Degraded Cooling Degraded
Degraded
1 R38 21.6 31.9 R21 17.6 R6
2 R30 18.8 26.1 R13 10.9 R6
3 R30 18.8 26.1 R13 10.9 R6
4 R30 18.8 26.1 R13 10.9 R6
5 R30 18.8 26.1 R13 10.9 R6
6 R30 18.8 26.1 R13 10.9 R4.2
7 R30 18.8 26.1 R13 10.9 R4.2
8 R30 18.8 26.1 R13 10.9 R4.2
9 R30 18.8 26.1 R13 10.9 R6
10 R30 18.8 26.1 R13 10.9 R6
11 R38 21.6 31.9 R19 10.9 R6
12 R38 21.6 31.9 R19 10.9 R6
13 R38 21.6 31.9 R19 10.9 R6
14 R38 21.6 31.9 R21 17.6 R8
15 R38 21.6 31.9 R21 17.6 R8
16 R38 21.6 31.9 R21 17.6 R8
California Building Energy Standards Table 151-B Component Package D ACM (Appendix B p.5)
The Solar Heat Gain Coefficient (SHGC) used the values in the Title 24 Residential Compliance Manual (CEC 2008c) Package D (p.3‐14 Table 3‐3) and varied by climate zone between 0.35 and 0.40 (see Table 13). Clear glazing was assumed together with an exterior shading of 50 percent.
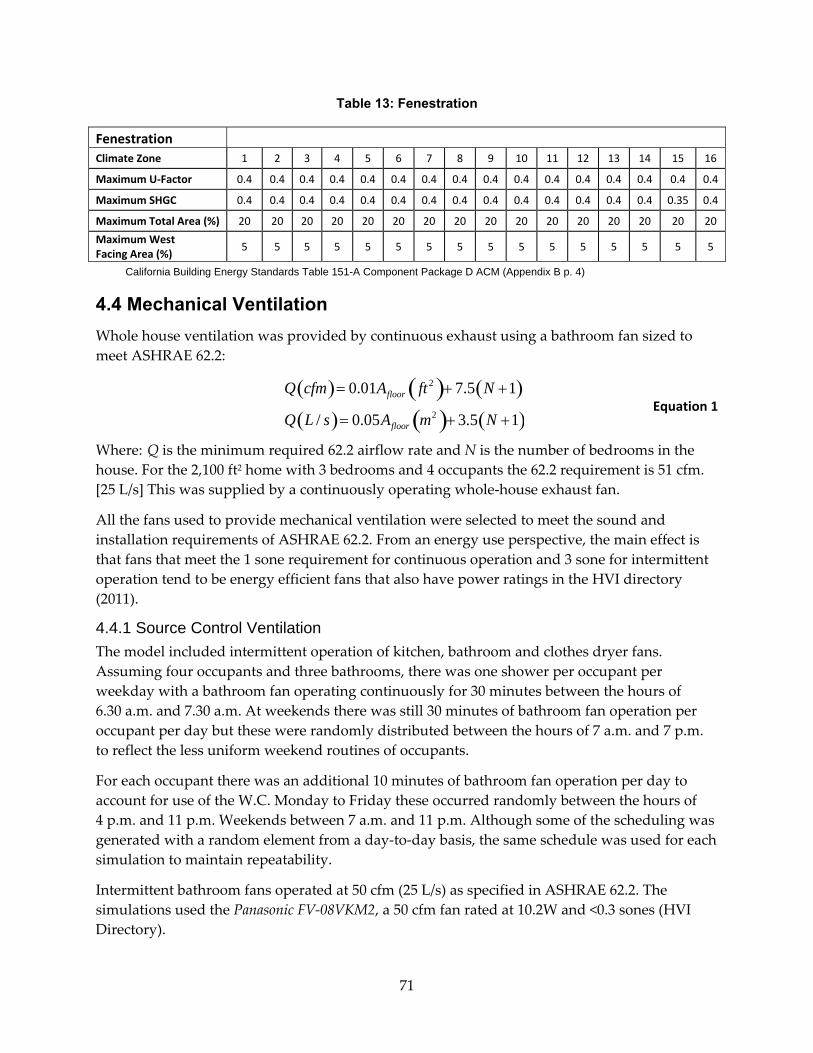
71
Table 13: Fenestration
Fenestration Climate Zone 1 2 3 4 5 6 7 8 9 10 11 12 13 14 15 16
Maximum U‐Factor 0.4 0.4 0.4 0.4 0.4 0.4 0.4 0.4 0.4 0.4 0.4 0.4 0.4 0.4 0.4 0.4
Maximum SHGC 0.4 0.4 0.4 0.4 0.4 0.4 0.4 0.4 0.4 0.4 0.4 0.4 0.4 0.4 0.35 0.4
Maximum Total Area (%) 20 20 20 20 20 20 20 20 20 20 20 20 20 20 20 20
Maximum West Facing Area (%)
5 5 5 5 5 5 5 5 5 5 5 5 5 5 5 5
California Building Energy Standards Table 151-A Component Package D ACM (Appendix B p. 4)
4.4 Mechanical Ventilation Whole house ventilation was provided by continuous exhaust using a bathroom fan sized to meet ASHRAE 62.2:
( ) ( ) ( )( ) ( ) ( )
2
2
0.01 7.5 1
/ 0.05 3.5 1
floor
floor
Q cfm A ft N
Q L s A m N
= + +
= + +Equation 1
Where: Q is the minimum required 62.2 airflow rate and N is the number of bedrooms in the house. For the 2,100 ft2 home with 3 bedrooms and 4 occupants the 62.2 requirement is 51 cfm. [25 L/s] This was supplied by a continuously operating whole‐house exhaust fan.
All the fans used to provide mechanical ventilation were selected to meet the sound and installation requirements of ASHRAE 62.2. From an energy use perspective, the main effect is that fans that meet the 1 sone requirement for continuous operation and 3 sone for intermittent operation tend to be energy efficient fans that also have power ratings in the HVI directory (2011).
4.4.1 Source Control Ventilation The model included intermittent operation of kitchen, bathroom and clothes dryer fans. Assuming four occupants and three bathrooms, there was one shower per occupant per weekday with a bathroom fan operating continuously for 30 minutes between the hours of 6.30 a.m. and 7.30 a.m. At weekends there was still 30 minutes of bathroom fan operation per occupant per day but these were randomly distributed between the hours of 7 a.m. and 7 p.m. to reflect the less uniform weekend routines of occupants.
For each occupant there was an additional 10 minutes of bathroom fan operation per day to account for use of the W.C. Monday to Friday these occurred randomly between the hours of 4 p.m. and 11 p.m. Weekends between 7 a.m. and 11 p.m. Although some of the scheduling was generated with a random element from a day‐to‐day basis, the same schedule was used for each simulation to maintain repeatability.
Intermittent bathroom fans operated at 50 cfm (25 L/s) as specified in ASHRAE 62.2. The simulations used the Panasonic FV‐08VKM2, a 50 cfm fan rated at 10.2W and <0.3 sones (HVI Directory).
72
All simulations had some kitchen range hood operation. Based on input from ASHRAE Standard 62.2 members and an ARTI project monitoring committee, the kitchen fans operated for one hour per day from 5.30 p.m. to 6.30 p.m. There was an additional 30 minutes of operation between 9.30 a.m. and 10 a.m. at weekends. These kitchen fans were sized to meet the ASHRAE 62.2 requirements for intermittent kitchen fans of 100 cfm (50 L/s). The Venmar ESV1030BL is a 100 cfm fan rated at 37.2 W and 0.8 sone (HVI Directory).
Clothes dryer fans are 150 cfm (75 L/s) exhaust fans. The schedule for the dryer fan assumed two days of laundry each week on Sundays and Wednesdays. The dryer operated continuously for three hours per laundry day between 11 a.m. and 2 p.m.
4.5 Internal Loads The daily sensible gain from lights, appliances, people and other sources used the ACM value of 20,000 Btu/day for each dwelling unit plus 15 Btu/day for each square foot of conditioned floor area (ACM 2008 3.2.6 p.3‐5). Loads were delivered to the occupied zone at a constant rate throughout the day and did not use the seasonal adjustments.
The daily latent gain from moisture generation followed the approach used previously by Walker and Sherman (2006 & 2007) in which the moisture generation rates were based on ASHRAE Standard 160 (2009) with reductions for venting of kitchen and bathrooms taken from Emmerich et al. (2005). For four occupants the resulting sensible load was 629 W and the latent load was (21.6 lb/day) 9.8 kg/day.
Heating and cooling equipment was controlled by an automatic thermostat that switched between heating and cooling as required. Set‐up and set‐back thermostat settings were taken from the Title 24 ACM.
The heating system was an 80 percent AFUE natural gas furnace and a SEER 13 EER 11 split‐system air conditioner with a TXV refrigerant flow control. The system capacity (Table 14) was based on field measurements of systems in California performed for the CEC by Rick Chitwood (personal communication) for climate zones 10, 12, 13, and 15. For climate zones 1 and 6 Manual J (ACCA, 2011) system sizing was used and then oversized using the same ratio between climate zone 12 from the Manual J calculations and the Chitwood data.
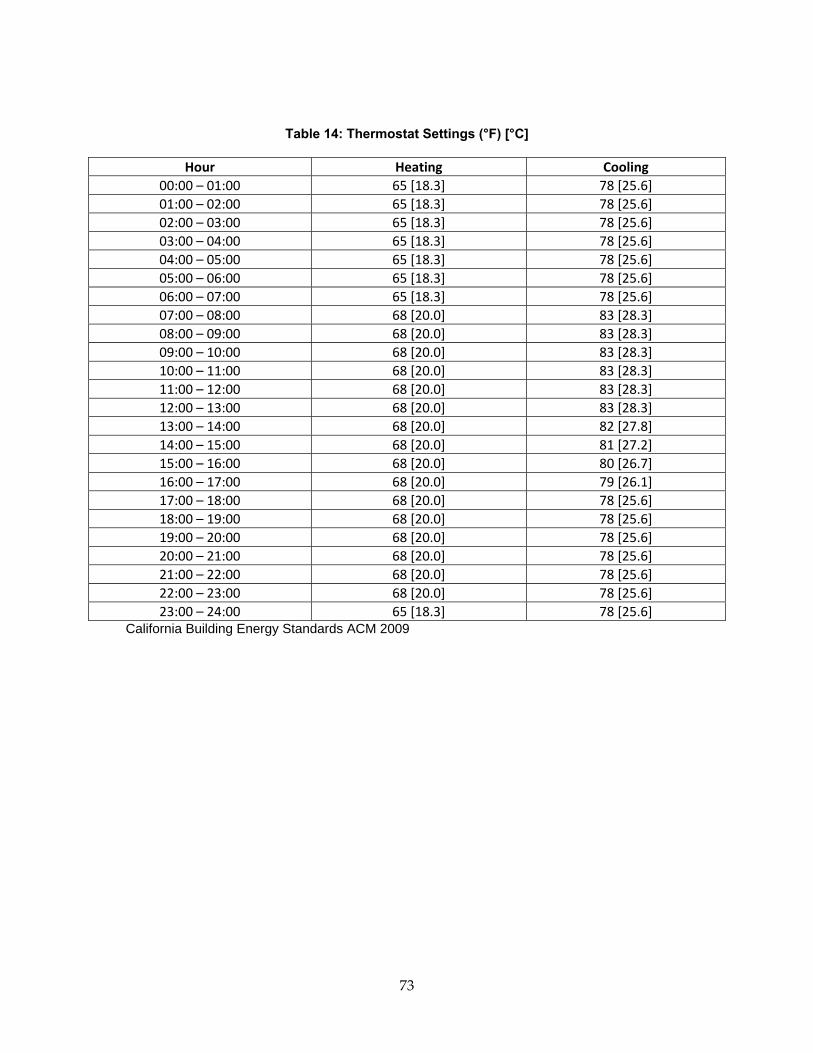
73
Table 14: Thermostat Settings (°F) [°C]
Hour Heating Cooling 00:00 – 01:00 65 [18.3] 78 [25.6] 01:00 – 02:00 65 [18.3] 78 [25.6] 02:00 – 03:00 65 [18.3] 78 [25.6] 03:00 – 04:00 65 [18.3] 78 [25.6] 04:00 – 05:00 65 [18.3] 78 [25.6] 05:00 – 06:00 65 [18.3] 78 [25.6] 06:00 – 07:00 65 [18.3] 78 [25.6] 07:00 – 08:00 68 [20.0] 83 [28.3] 08:00 – 09:00 68 [20.0] 83 [28.3] 09:00 – 10:00 68 [20.0] 83 [28.3] 10:00 – 11:00 68 [20.0] 83 [28.3] 11:00 – 12:00 68 [20.0] 83 [28.3] 12:00 – 13:00 68 [20.0] 83 [28.3] 13:00 – 14:00 68 [20.0] 82 [27.8] 14:00 – 15:00 68 [20.0] 81 [27.2] 15:00 – 16:00 68 [20.0] 80 [26.7] 16:00 – 17:00 68 [20.0] 79 [26.1] 17:00 – 18:00 68 [20.0] 78 [25.6] 18:00 – 19:00 68 [20.0] 78 [25.6] 19:00 – 20:00 68 [20.0] 78 [25.6] 20:00 – 21:00 68 [20.0] 78 [25.6] 21:00 – 22:00 68 [20.0] 78 [25.6] 22:00 – 23:00 68 [20.0] 78 [25.6] 23:00 – 24:00 65 [18.3] 78 [25.6]
California Building Energy Standards ACM 2009
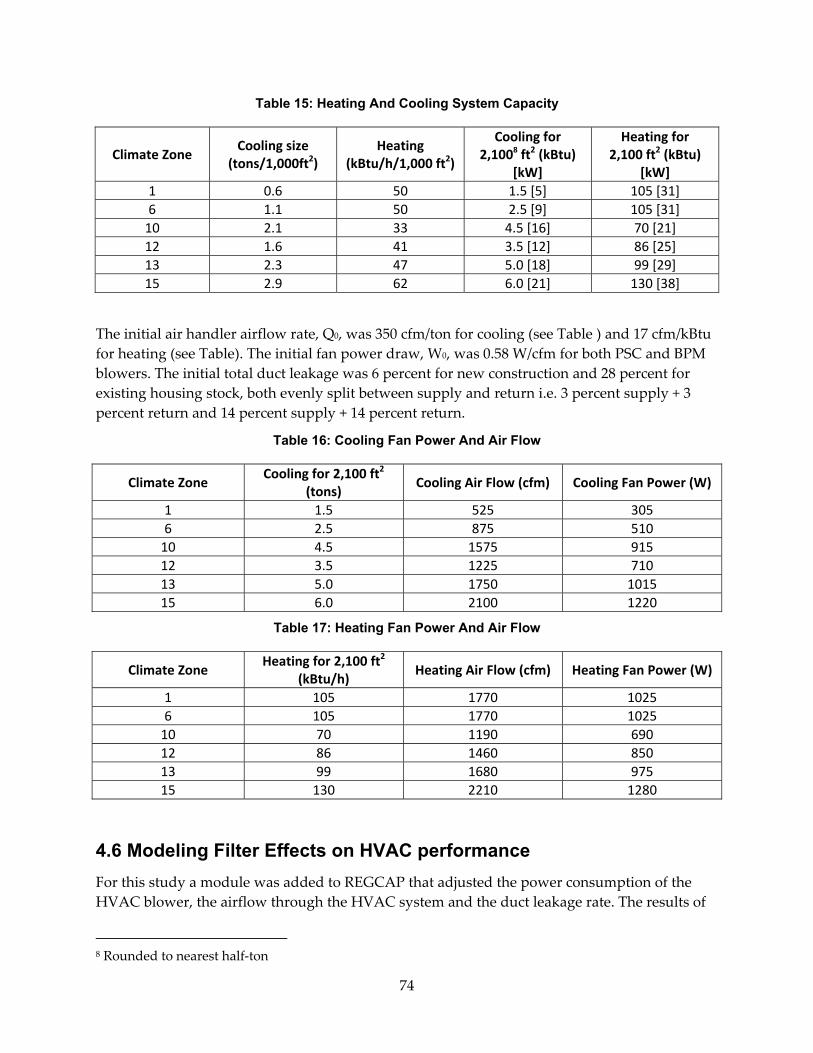
74
Table 15: Heating And Cooling System Capacity
Climate Zone Cooling size
(tons/1,000ft2) Heating
(kBtu/h/1,000 ft2)
Cooling for 2,1008 ft2 (kBtu)
[kW]
Heating for 2,100 ft2 (kBtu)
[kW] 1 0.6 50 1.5 [5] 105 [31] 6 1.1 50 2.5 [9] 105 [31] 10 2.1 33 4.5 [16] 70 [21] 12 1.6 41 3.5 [12] 86 [25] 13 2.3 47 5.0 [18] 99 [29] 15 2.9 62 6.0 [21] 130 [38]
The initial air handler airflow rate, Q0, was 350 cfm/ton for cooling (see Table ) and 17 cfm/kBtu for heating (see Table). The initial fan power draw, W0, was 0.58 W/cfm for both PSC and BPM blowers. The initial total duct leakage was 6 percent for new construction and 28 percent for existing housing stock, both evenly split between supply and return i.e. 3 percent supply + 3 percent return and 14 percent supply + 14 percent return.
Table 16: Cooling Fan Power And Air Flow
Climate Zone Cooling for 2,100 ft2
(tons) Cooling Air Flow (cfm) Cooling Fan Power (W)
1 1.5 525 305 6 2.5 875 510 10 4.5 1575 915 12 3.5 1225 710 13 5.0 1750 1015 15 6.0 2100 1220
Table 17: Heating Fan Power And Air Flow
Climate Zone Heating for 2,100 ft2
(kBtu/h) Heating Air Flow (cfm) Heating Fan Power (W)
1 105 1770 1025 6 105 1770 1025 10 70 1190 690 12 86 1460 850 13 99 1680 975 15 130 2210 1280
4.6 Modeling Filter Effects on HVAC performance For this study a module was added to REGCAP that adjusted the power consumption of the HVAC blower, the airflow through the HVAC system and the duct leakage rate. The results of
8 Rounded to nearest half‐ton
75
the field measurements were used to estimate the changes in these parameters as filters fouled and different filters were used.
REGCAP already includes an air conditioner performance model that includes the effects of system airflow that uses the relationships in ASHRAE Standard 152 (ASHRAE 2004). It distinguishes between TXV and non‐TXV equipped systems. TXVs have less sensitivity to airflow than non‐TXV systems. New equipment in California is highly likely to be TXV equipped so the simulations assumed a TXV controller. This means that the simulation results will be good for new homes but will be conservative for existing homes with non‐TXV systems.
For TXV systems the following correction term is applied to the system capacity and EER to give the corrected airflow Qcorr:
1.62 0.62 0.647 lncorr
ref ref
Q QQQ Q
⎛ ⎞= − + ⎜ ⎟⎜ ⎟
⎝ ⎠Equation 2
Where Qref is the reference system airflow and is set equal to 350 cfm/ton and Q is the actual system airflow that is reduced by increased airflow resistance.
The fouling rates were estimated based on the cumulative mass flow through the filter. This assumed that the particles that load filters did not change concentration in indoor air with time, and that the filtration efficiency did not change as filters become more loaded. These simplifying assumptions were made for several reasons. The first is that the information required to account for these effects is not available generally, and was not evaluated in this study. There is no such thing as a typical particulate profile for a home because it depends strongly on outdoor conditions and occupant activities. There are some laboratory data on changes infiltration efficiency with loading, but we were unable to detect this effect in our measured data and so were unable to generate an algorithm that could account for this effect. We also lacked sufficient data to completely populate the parameter space of three fouling rates, two motor types, and three MERV ratings so some values were determined by interpolation and extrapolation. Finally, the analysis of the measured field data showed that a linear model fit the data well, indicating that these assumptions are reasonable.
Baseline simulations were run assuming no filter loading and a MERV 5 filter that is common to most systems. The following equations were used to determine how system performance changed with cumulative mass flow through the filter, m:
( ) , 0 , 0n nfAH Q M Q MQ m A Q Q mκ= + ⋅ Equation 3
, 0 , 0( )n nfAH W M W MW m A W W mκ= + ⋅ Equation 4
, ,0 , ,0( )leak n leak nfleak Q M leak Q M leakQ m A Q Q mκ= + ⋅ Equation 5
Where:
QAH = Airflow rate of air handler
WAH = Power draw of air handler
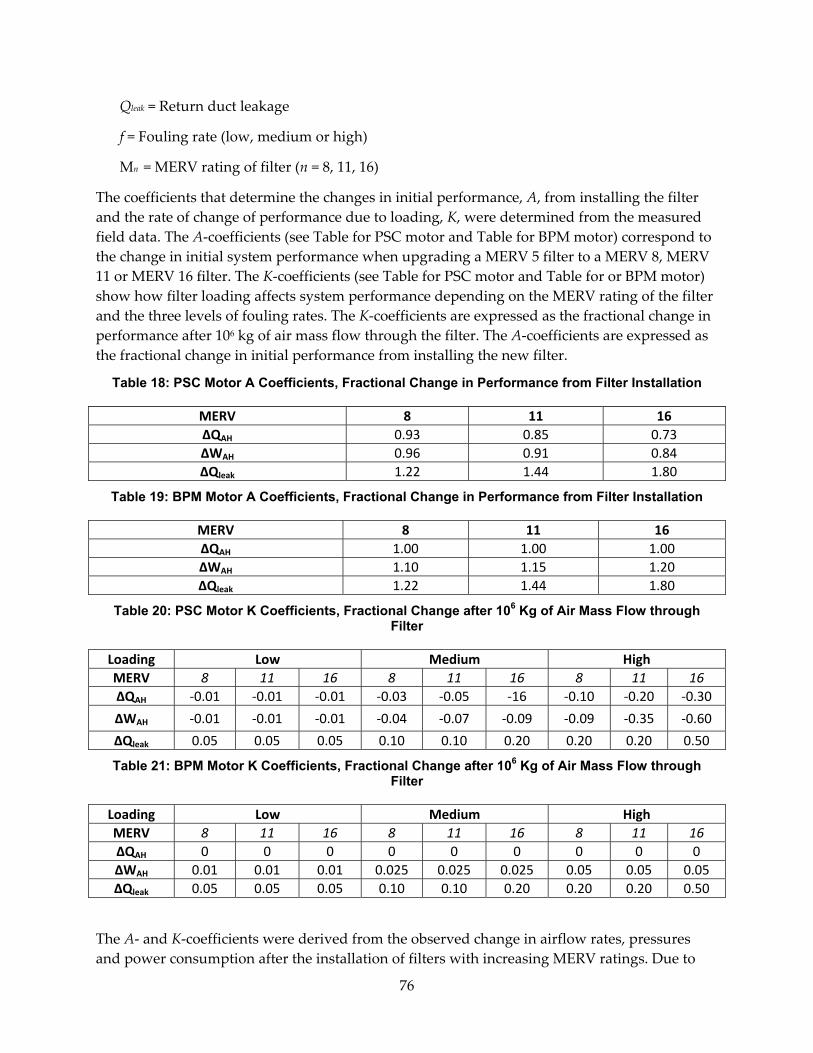
76
Qleak = Return duct leakage
f = Fouling rate (low, medium or high)
Mn = MERV rating of filter (n = 8, 11, 16)
The coefficients that determine the changes in initial performance, A, from installing the filter and the rate of change of performance due to loading, K, were determined from the measured field data. The A‐coefficients (see Table for PSC motor and Table for BPM motor) correspond to the change in initial system performance when upgrading a MERV 5 filter to a MERV 8, MERV 11 or MERV 16 filter. The K‐coefficients (see Table for PSC motor and Table for or BPM motor) show how filter loading affects system performance depending on the MERV rating of the filter and the three levels of fouling rates. The K‐coefficients are expressed as the fractional change in performance after 106 kg of air mass flow through the filter. The A‐coefficients are expressed as the fractional change in initial performance from installing the new filter.
Table 18: PSC Motor A Coefficients, Fractional Change in Performance from Filter Installation
MERV 8 11 16 ΔQAH 0.93 0.85 0.73 ΔWAH 0.96 0.91 0.84 ΔQleak 1.22 1.44 1.80
Table 19: BPM Motor A Coefficients, Fractional Change in Performance from Filter Installation
MERV 8 11 16 ΔQAH 1.00 1.00 1.00 ΔWAH 1.10 1.15 1.20 ΔQleak 1.22 1.44 1.80
Table 20: PSC Motor K Coefficients, Fractional Change after 106 Kg of Air Mass Flow through Filter
Loading Low Medium High MERV 8 11 16 8 11 16 8 11 16 ΔQAH ‐0.01 ‐0.01 ‐0.01 ‐0.03 ‐0.05 ‐16 ‐0.10 ‐0.20 ‐0.30
ΔWAH ‐0.01 ‐0.01 ‐0.01 ‐0.04 ‐0.07 ‐0.09 ‐0.09 ‐0.35 ‐0.60
ΔQleak 0.05 0.05 0.05 0.10 0.10 0.20 0.20 0.20 0.50
Table 21: BPM Motor K Coefficients, Fractional Change after 106 Kg of Air Mass Flow through Filter
Loading Low Medium High MERV 8 11 16 8 11 16 8 11 16 ΔQAH 0 0 0 0 0 0 0 0 0 ΔWAH 0.01 0.01 0.01 0.025 0.025 0.025 0.05 0.05 0.05 ΔQleak 0.05 0.05 0.05 0.10 0.10 0.20 0.20 0.20 0.50
The A‐ and K‐coefficients were derived from the observed change in airflow rates, pressures and power consumption after the installation of filters with increasing MERV ratings. Due to
77
limited BPM motor data, the K‐coefficients for power increase were deduced from looking at the change in filter pressure after loading (and hence change in total system pressure), under the assumption of constant airflow rate.
Simulated air handler flow rates were allowed to drop to 50 percent of the highest airflow rate setting (heating or cooling mode, whichever was highest), then the filter was changed and the system performance reset to the initial values with no filter loading.
Figure 98 and
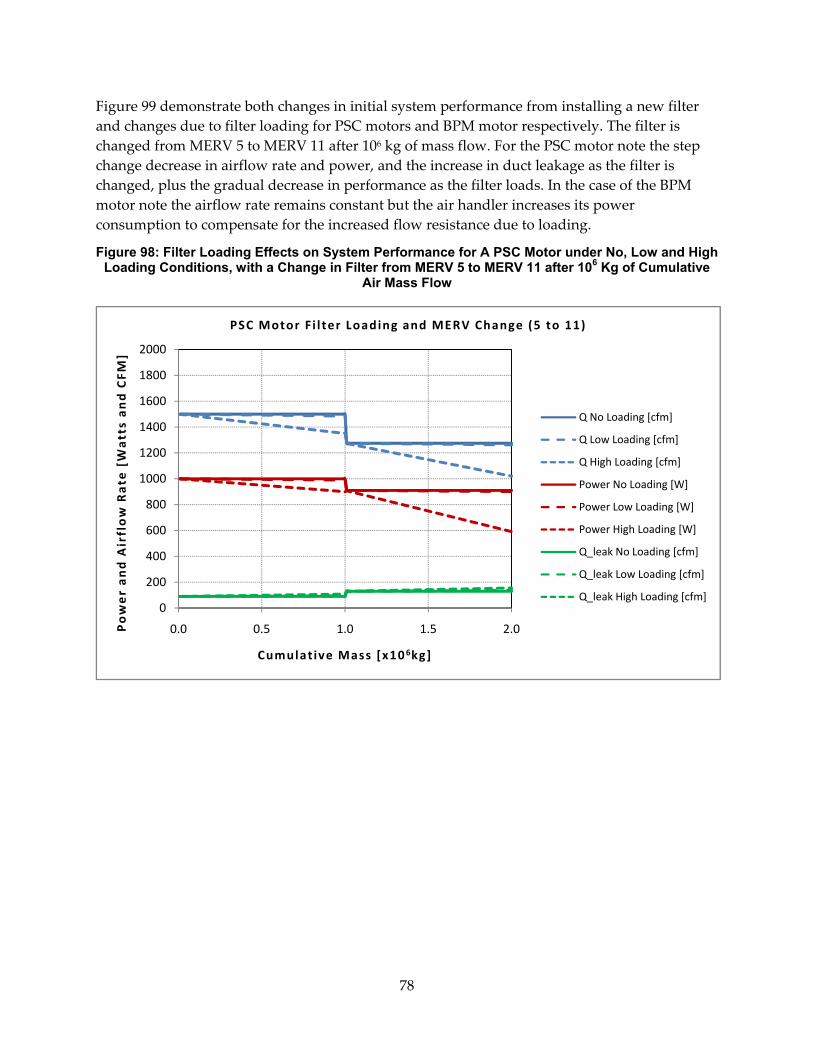
78
Figure 99 demonstrate both changes in initial system performance from installing a new filter and changes due to filter loading for PSC motors and BPM motor respectively. The filter is changed from MERV 5 to MERV 11 after 106 kg of mass flow. For the PSC motor note the step change decrease in airflow rate and power, and the increase in duct leakage as the filter is changed, plus the gradual decrease in performance as the filter loads. In the case of the BPM motor note the airflow rate remains constant but the air handler increases its power consumption to compensate for the increased flow resistance due to loading.
Figure 98: Filter Loading Effects on System Performance for A PSC Motor under No, Low and High Loading Conditions, with a Change in Filter from MERV 5 to MERV 11 after 106 Kg of Cumulative
Air Mass Flow
0
200
400
600
800
1000
1200
1400
1600
1800
2000
0.0 0.5 1.0 1.5 2.0Power and A
irflow Rate
[Watts and CFM
]
Cumulat ive Mass [x106kg]
PSC Motor Fi l ter Loading and MERV Change (5 to 11)
Q No Loading [cfm]
Q Low Loading [cfm]
Q High Loading [cfm]
Power No Loading [W]
Power Low Loading [W]
Power High Loading [W]
Q_leak No Loading [cfm]
Q_leak Low Loading [cfm]
Q_leak High Loading [cfm]
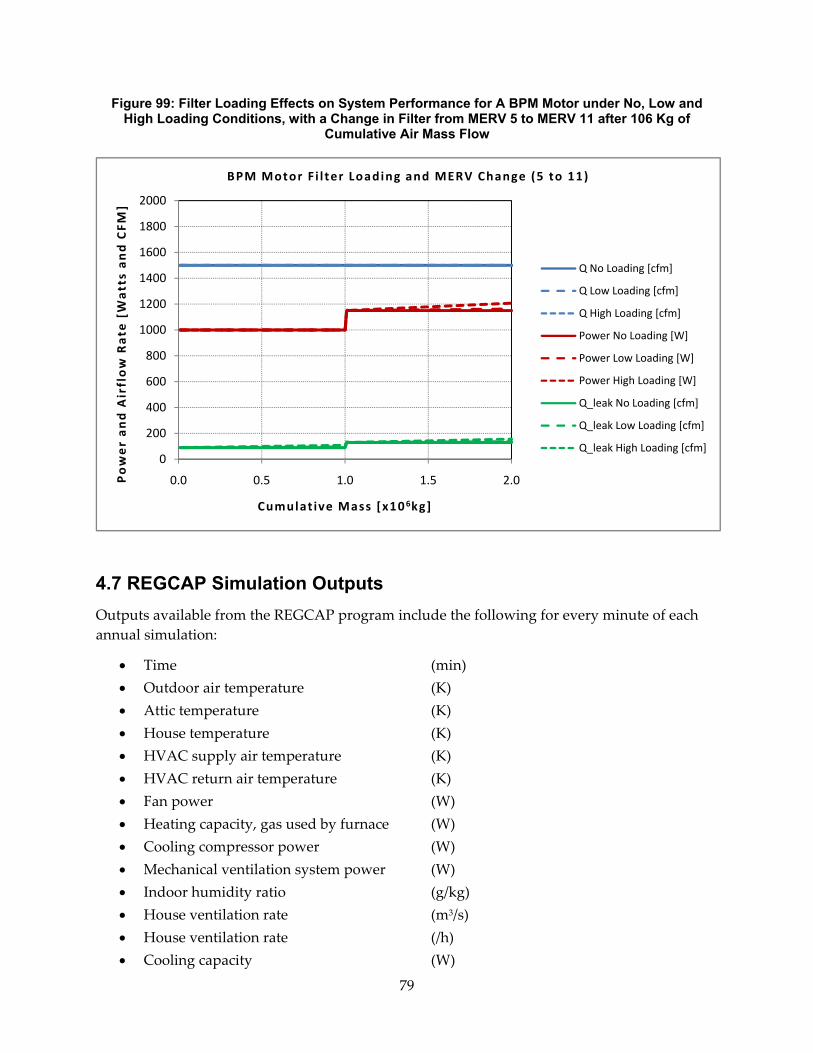
79
Figure 99: Filter Loading Effects on System Performance for A BPM Motor under No, Low and High Loading Conditions, with a Change in Filter from MERV 5 to MERV 11 after 106 Kg of
Cumulative Air Mass Flow
4.7 REGCAP Simulation Outputs Outputs available from the REGCAP program include the following for every minute of each annual simulation:
• Time (min) • Outdoor air temperature (K) • Attic temperature (K) • House temperature (K) • HVAC supply air temperature (K) • HVAC return air temperature (K) • Fan power (W) • Heating capacity, gas used by furnace (W) • Cooling compressor power (W) • Mechanical ventilation system power (W) • Indoor humidity ratio (g/kg) • House ventilation rate (m3/s) • House ventilation rate (/h) • Cooling capacity (W)
0
200
400
600
800
1000
1200
1400
1600
1800
2000
0.0 0.5 1.0 1.5 2.0Power and A
irflow Rate
[Watts and CFM
]
Cumulat ive Mass [x106kg]
BPM Motor Fi l ter Loading and MERV Change (5 to 11)
Q No Loading [cfm]
Q Low Loading [cfm]
Q High Loading [cfm]
Power No Loading [W]
Power Low Loading [W]
Power High Loading [W]
Q_leak No Loading [cfm]
Q_leak Low Loading [cfm]
Q_leak High Loading [cfm]
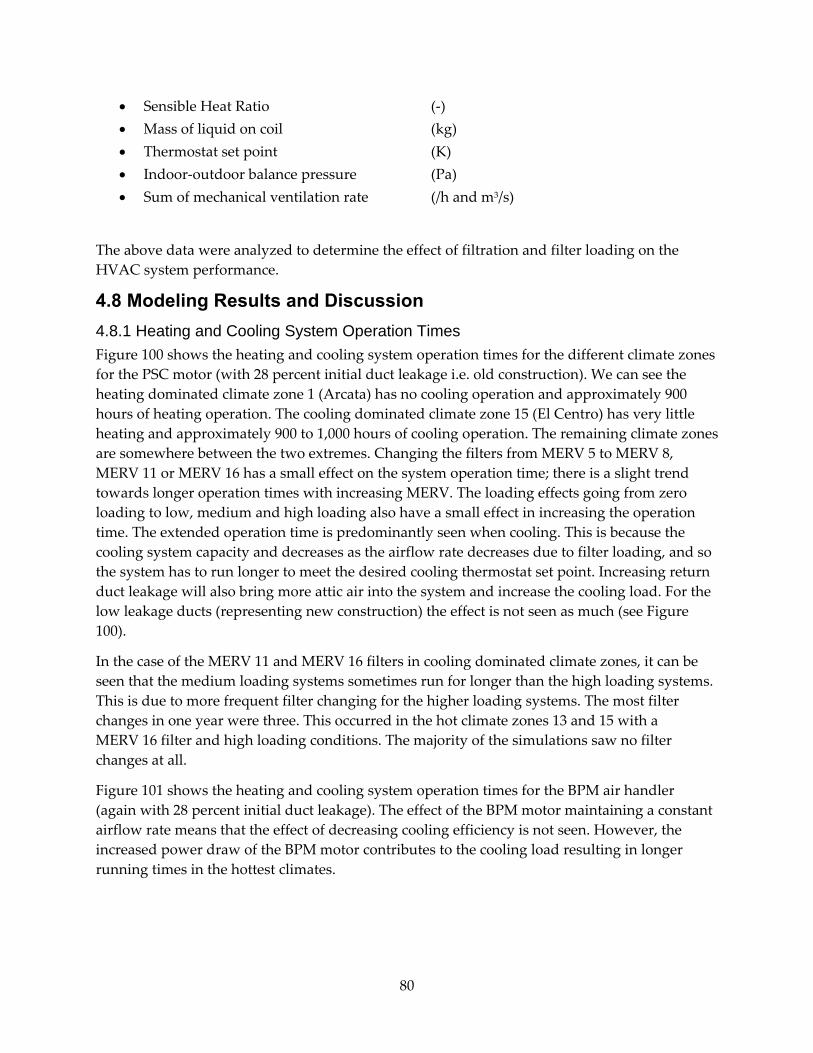
80
• Sensible Heat Ratio (‐) • Mass of liquid on coil (kg) • Thermostat set point (K) • Indoor‐outdoor balance pressure (Pa) • Sum of mechanical ventilation rate (/h and m3/s)
The above data were analyzed to determine the effect of filtration and filter loading on the HVAC system performance.
4.8 Modeling Results and Discussion 4.8.1 Heating and Cooling System Operation Times Figure 100 shows the heating and cooling system operation times for the different climate zones for the PSC motor (with 28 percent initial duct leakage i.e. old construction). We can see the heating dominated climate zone 1 (Arcata) has no cooling operation and approximately 900 hours of heating operation. The cooling dominated climate zone 15 (El Centro) has very little heating and approximately 900 to 1,000 hours of cooling operation. The remaining climate zones are somewhere between the two extremes. Changing the filters from MERV 5 to MERV 8, MERV 11 or MERV 16 has a small effect on the system operation time; there is a slight trend towards longer operation times with increasing MERV. The loading effects going from zero loading to low, medium and high loading also have a small effect in increasing the operation time. The extended operation time is predominantly seen when cooling. This is because the cooling system capacity and decreases as the airflow rate decreases due to filter loading, and so the system has to run longer to meet the desired cooling thermostat set point. Increasing return duct leakage will also bring more attic air into the system and increase the cooling load. For the low leakage ducts (representing new construction) the effect is not seen as much (see Figure 100).
In the case of the MERV 11 and MERV 16 filters in cooling dominated climate zones, it can be seen that the medium loading systems sometimes run for longer than the high loading systems. This is due to more frequent filter changing for the higher loading systems. The most filter changes in one year were three. This occurred in the hot climate zones 13 and 15 with a MERV 16 filter and high loading conditions. The majority of the simulations saw no filter changes at all.
Figure 101 shows the heating and cooling system operation times for the BPM air handler (again with 28 percent initial duct leakage). The effect of the BPM motor maintaining a constant airflow rate means that the effect of decreasing cooling efficiency is not seen. However, the increased power draw of the BPM motor contributes to the cooling load resulting in longer running times in the hottest climates.
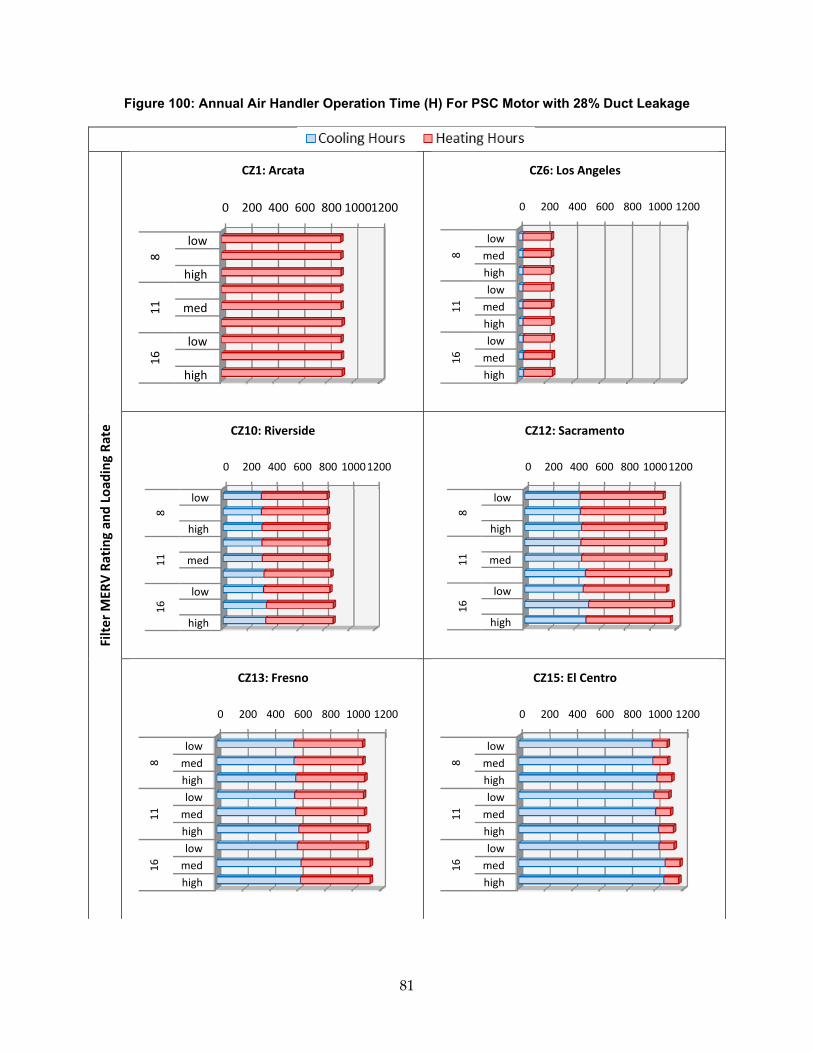
81
Figure 100: Annual Air Handler Operation Time (H) For PSC Motor with 28% Duct Leakage
Filter M
ERV Rating an
d Load
ing Ra
te
0 200 400 600 800 10001200
low
high
med
low
high
811
16CZ1: Arcata
0 200 400 600 800 1000 1200
lowmedhighlowmedhighlowmedhigh
811
16
CZ6: Los Angeles
0 200 400 600 800 10001200
low
high
med
low
high
811
16
CZ10: Riverside
0 200 400 600 800 10001200
low
high
med
low
high
811
16
CZ12: Sacramento
0 200 400 600 800 1000 1200
lowmedhighlowmedhighlowmedhigh
811
16
CZ13: Fresno
0 200 400 600 800 1000 1200
lowmedhighlowmedhighlowmedhigh
811
16
CZ15: El Centro
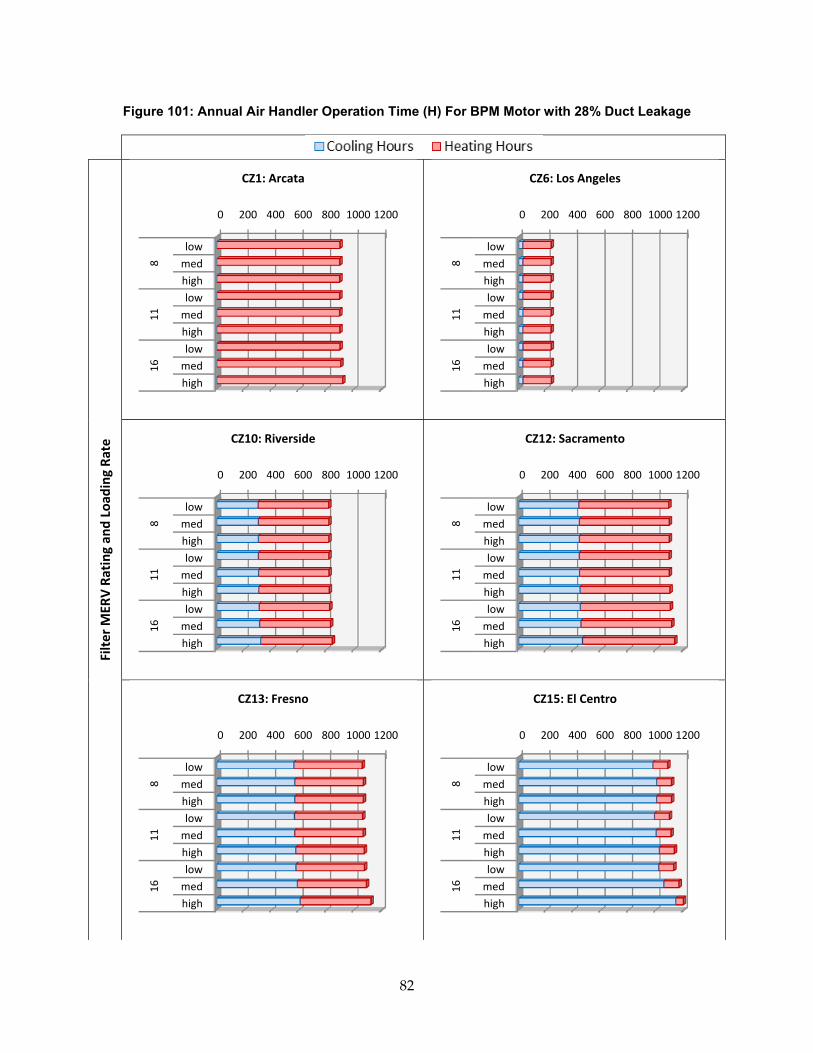
82
Figure 101: Annual Air Handler Operation Time (H) For BPM Motor with 28% Duct Leakage
Filter M
ERV Rating an
d Load
ing Ra
te
0 200 400 600 800 1000 1200
lowmedhighlowmedhighlowmedhigh
811
16
CZ1: Arcata
0 200 400 600 800 1000 1200
lowmedhighlowmedhighlowmedhigh
811
16
CZ6: Los Angeles
0 200 400 600 800 1000 1200
lowmedhighlowmedhighlowmedhigh
811
16
CZ10: Riverside
0 200 400 600 800 1000 1200
lowmedhighlowmedhighlowmedhigh
811
16CZ12: Sacramento
0 200 400 600 800 1000 1200
lowmedhighlowmedhighlowmedhigh
811
16
CZ13: Fresno
0 200 400 600 800 1000 1200
lowmedhighlowmedhighlowmedhigh
811
16
CZ15: El Centro
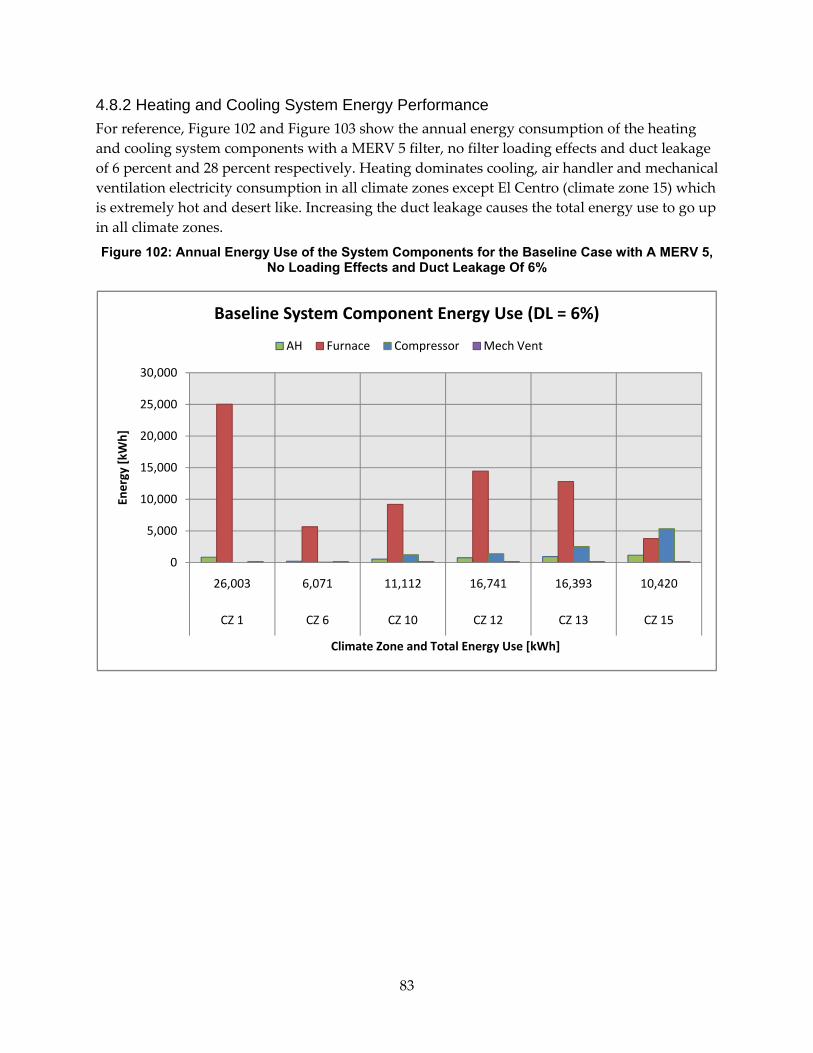
83
4.8.2 Heating and Cooling System Energy Performance For reference, Figure 102 and Figure 103 show the annual energy consumption of the heating and cooling system components with a MERV 5 filter, no filter loading effects and duct leakage of 6 percent and 28 percent respectively. Heating dominates cooling, air handler and mechanical ventilation electricity consumption in all climate zones except El Centro (climate zone 15) which is extremely hot and desert like. Increasing the duct leakage causes the total energy use to go up in all climate zones.
Figure 102: Annual Energy Use of the System Components for the Baseline Case with A MERV 5, No Loading Effects and Duct Leakage Of 6%
0
5,000
10,000
15,000
20,000
25,000
30,000
26,003 6,071 11,112 16,741 16,393 10,420
CZ 1 CZ 6 CZ 10 CZ 12 CZ 13 CZ 15
Energy [k
Wh]
Climate Zone and Total Energy Use [kWh]
Baseline System Component Energy Use (DL = 6%)
AH Furnace Compressor Mech Vent
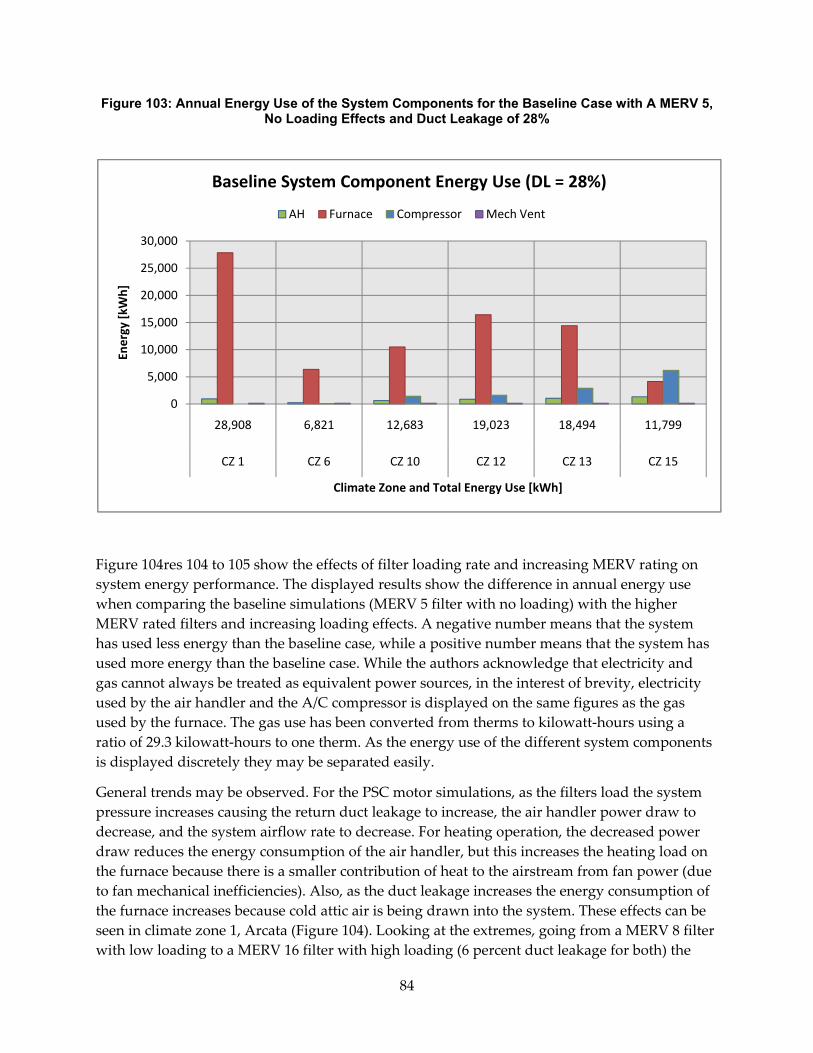
84
Figure 103: Annual Energy Use of the System Components for the Baseline Case with A MERV 5, No Loading Effects and Duct Leakage of 28%
Figure 104res 104 to 105 show the effects of filter loading rate and increasing MERV rating on system energy performance. The displayed results show the difference in annual energy use when comparing the baseline simulations (MERV 5 filter with no loading) with the higher MERV rated filters and increasing loading effects. A negative number means that the system has used less energy than the baseline case, while a positive number means that the system has used more energy than the baseline case. While the authors acknowledge that electricity and gas cannot always be treated as equivalent power sources, in the interest of brevity, electricity used by the air handler and the A/C compressor is displayed on the same figures as the gas used by the furnace. The gas use has been converted from therms to kilowatt‐hours using a ratio of 29.3 kilowatt‐hours to one therm. As the energy use of the different system components is displayed discretely they may be separated easily.
General trends may be observed. For the PSC motor simulations, as the filters load the system pressure increases causing the return duct leakage to increase, the air handler power draw to decrease, and the system airflow rate to decrease. For heating operation, the decreased power draw reduces the energy consumption of the air handler, but this increases the heating load on the furnace because there is a smaller contribution of heat to the airstream from fan power (due to fan mechanical inefficiencies). Also, as the duct leakage increases the energy consumption of the furnace increases because cold attic air is being drawn into the system. These effects can be seen in climate zone 1, Arcata (Figure 104). Looking at the extremes, going from a MERV 8 filter with low loading to a MERV 16 filter with high loading (6 percent duct leakage for both) the
0
5,000
10,000
15,000
20,000
25,000
30,000
28,908 6,821 12,683 19,023 18,494 11,799
CZ 1 CZ 6 CZ 10 CZ 12 CZ 13 CZ 15
Energy [k
Wh]
Climate Zone and Total Energy Use [kWh]
Baseline System Component Energy Use (DL = 28%)
AH Furnace Compressor Mech Vent
85
difference in the air handler energy consumption compared with the baseline decreases from ‐45 kWh to ‐315 kWh. Yet the furnace energy use increases from 8 kWh to 323 kWh. Essentially the electrical power of the heat exchanger is being swapped for the combustion of more gas by the furnace. The net change in energy over the year goes from ‐37 kWh to 8 kWh.
When the duct leakage is increased to 28 percent the furnace energy use actually goes down compared to the baseline case. This is because the increased return duct leakage with the higher MERV filters is large enough that it pressurizes the whole house with attic air. Because the attic is warmer than outside (by about 3°C) all the air entering the house is at a higher temperature than the air entering the house for the baseline case with balanced supply and return leakage. This higher entering‐air temperature significantly reduces the ventilation related loads (by about 200 W).
In the case of El Centro (climate zone 15); the hottest climate with the largest cooling demand; the air handler energy drops from ‐64 kWh to ‐394 kWh. The furnace gas consumption decreases but is negligible due to the very low heating demand of the climate. The compressor electricity use, however, increases from 37 kWh to 486 kWh over the year. This is because of two reasons: the reduced airflow rate over the air conditioning coil reduces the cooling efficiency, and the increased duct leakage brings more hot air from the attic into the cooling system thus increasing the cooling load. Comparing the two worst cases between the 6 percent duct leakage house and the 28 percent duct leakage house (MERV 16 with medium loading), the air conditioning energy increases from 535 kWh up to 763 kWh annually. The extra filter change in the high loading house means it performs better over a calendar year compared with the medium loading house.
For the BPM motor the effects of filter loading are different. If again we consider first the heating dominated climate zone 1, Arcata (Figure 104), the BPM motor increases its power draw to maintain the airflow rate with increasing system pressure. As the filter loads, the system pressure increases, the return duct leakage increases, but the power draw of the BPM motor also increases and so the system airflow rate remains constant. Consequentially we see the very opposite effect displayed from the PSC motor simulations. The electricity used by the air handler increases and the heating load on the furnace decreases. The increased power draw of the fan motor is now contributing excess heat to the airstream and reducing the heating burden on the furnace. The net effect on the net energy consumption of the system is small. Going from the low loading MERV 8 filter to the high loading MERV 16 filter the net energy difference from the baseline case is ‐7 kWh to ‐13 kWh. The system actually uses less energy than the baseline of MERV 5 with no loading in both cases.
Now considering the cooling dominated climate zone 15, El Centro,the BPM motor does not perform very well. The increased power draw of the BPM motor increases the load on the air conditioner. In the 6 percent duct leakage house the low loading MERV 8 system increased the net annual energy consumption by 160 kWh. The high loading MERV 16 system increased the net annual energy consumption by 535 kWh. For the 28 percent duct leakage case, the high loading MERV 16 system increases net annual energy use by 2,385 kWh suggesting that when using a BPM motor in a cooling dominated climate (where the system airflow rates are high) the
86
homeowner should ensure that they use a low‐pressure system with tight ducts unless they want to pay a heavy energy penalty for filtration.
The other climate zones display changes in system performance somewhere between the two extreme climate zones 1 and 15. Climate zone 6, Los Angeles (Figure 105) has very little heating or cooling operation (approximately 200 hours per year) and so filter loading and increasing MERV have very little effect in terms of energy. Climate zones 10 (Riverside, see Figure 106) 12 (Sacramento, see Figure 107) and 13 (Fresno, see Figure 109) all require a mixture of heating and cooling operation. The PSC motors continue to cause power swapping between the furnace and the air handler, but with the addition of increased cooling demand due to reduced air conditioner efficiency. The BPM motor‐driven systems exhibit less energy use dependence on filter MERV and loading rate. The energy penalty from filtration increases with cooling load (and hence system airflow rate) for both PSC and BPM motors.
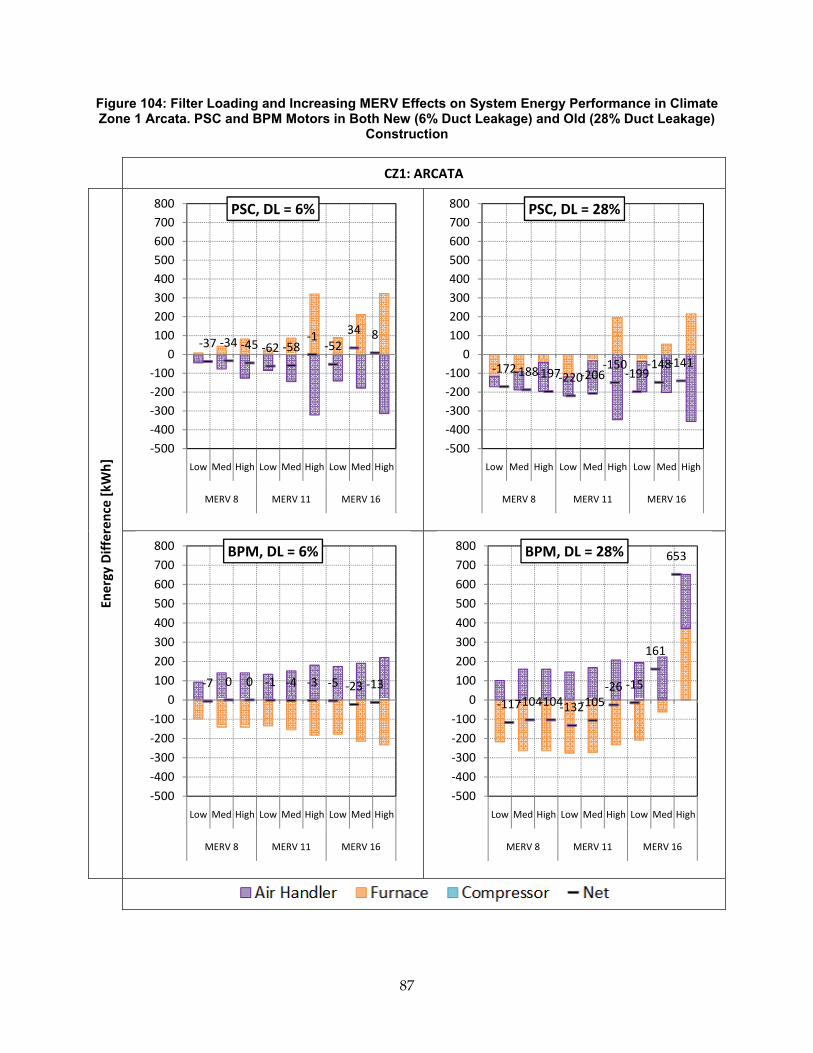
87
Figure 104: Filter Loading and Increasing MERV Effects on System Energy Performance in Climate Zone 1 Arcata. PSC and BPM Motors in Both New (6% Duct Leakage) and Old (28% Duct Leakage)
Construction
CZ1: ARCATA
Energy Differen
ce [k
Wh]
‐37 ‐34 ‐45 ‐62 ‐58‐1
‐5234 8
‐500‐400‐300‐200‐100
0100200300400500600700800
Low Med High Low Med High Low Med High
MERV 8 MERV 11 MERV 16
PSC, DL = 6%
‐172‐188‐197‐220‐206‐150
‐199‐148‐141
‐500‐400‐300‐200‐100
0100200300400500600700800
Low Med High Low Med High Low Med High
MERV 8 MERV 11 MERV 16
PSC, DL = 28%
‐7 0 0 ‐1 ‐4 ‐3 ‐5 ‐23 ‐13
‐500
‐400
‐300
‐200
‐100
0
100
200
300
400
500
600
700
800
Low Med High Low Med High Low Med High
MERV 8 MERV 11 MERV 16
BPM, DL = 6%
‐117‐104‐104‐132‐105‐26 ‐15
161
653
‐500
‐400
‐300
‐200
‐100
0
100
200
300
400
500
600
700
800
Low Med High Low Med High Low Med High
MERV 8 MERV 11 MERV 16
BPM, DL = 28%
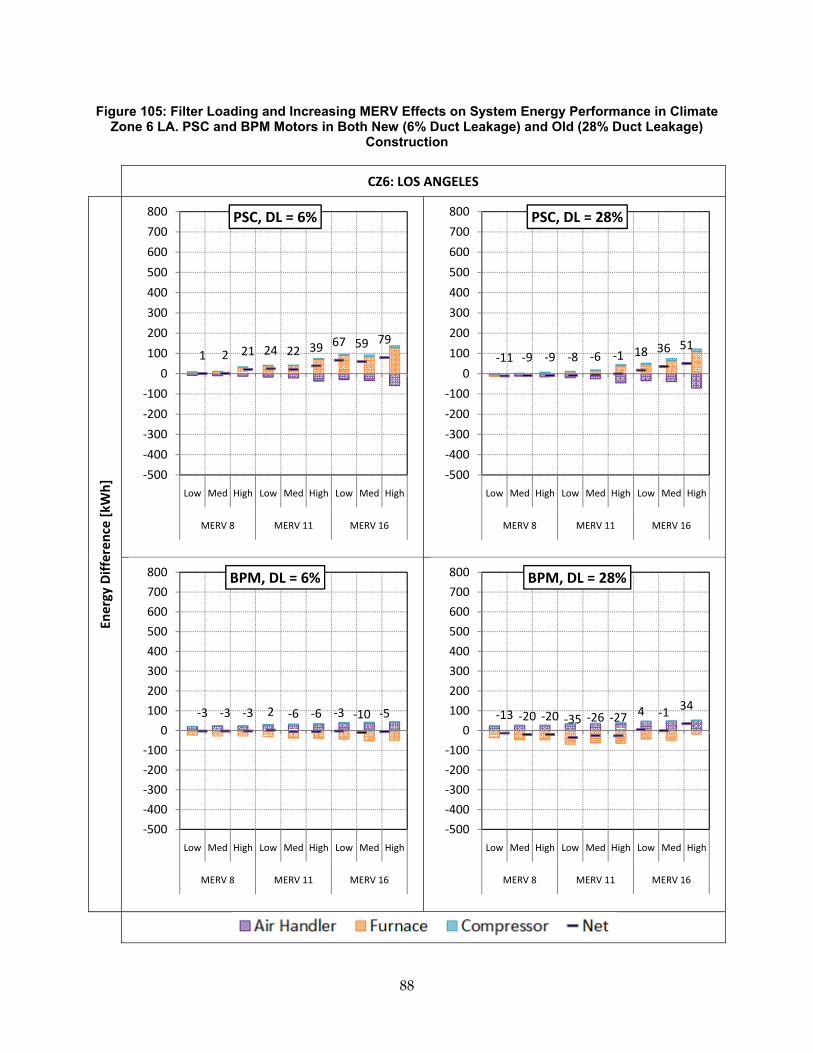
88
Figure 105: Filter Loading and Increasing MERV Effects on System Energy Performance in Climate Zone 6 LA. PSC and BPM Motors in Both New (6% Duct Leakage) and Old (28% Duct Leakage)
Construction
CZ6: LOS ANGELES
Energy Differen
ce [k
Wh]
1 2 21 24 22 39 67 59 79
‐500
‐400
‐300
‐200
‐100
0
100
200
300
400
500
600
700
800
Low Med High Low Med High Low Med High
MERV 8 MERV 11 MERV 16
PSC, DL = 6%
‐11 ‐9 ‐9 ‐8 ‐6 ‐1 18 36 51
‐500
‐400
‐300
‐200
‐100
0
100
200
300
400
500
600
700
800
Low Med High Low Med High Low Med High
MERV 8 MERV 11 MERV 16
PSC, DL = 28%
‐3 ‐3 ‐3 2 ‐6 ‐6 ‐3 ‐10 ‐5
‐500
‐400
‐300
‐200
‐100
0
100
200
300
400
500
600
700
800
Low Med High Low Med High Low Med High
MERV 8 MERV 11 MERV 16
BPM, DL = 6%
‐13 ‐20 ‐20 ‐35 ‐26 ‐27 4 ‐1 34
‐500
‐400
‐300
‐200
‐100
0
100
200
300
400
500
600
700
800
Low Med High Low Med High Low Med High
MERV 8 MERV 11 MERV 16
BPM, DL = 28%
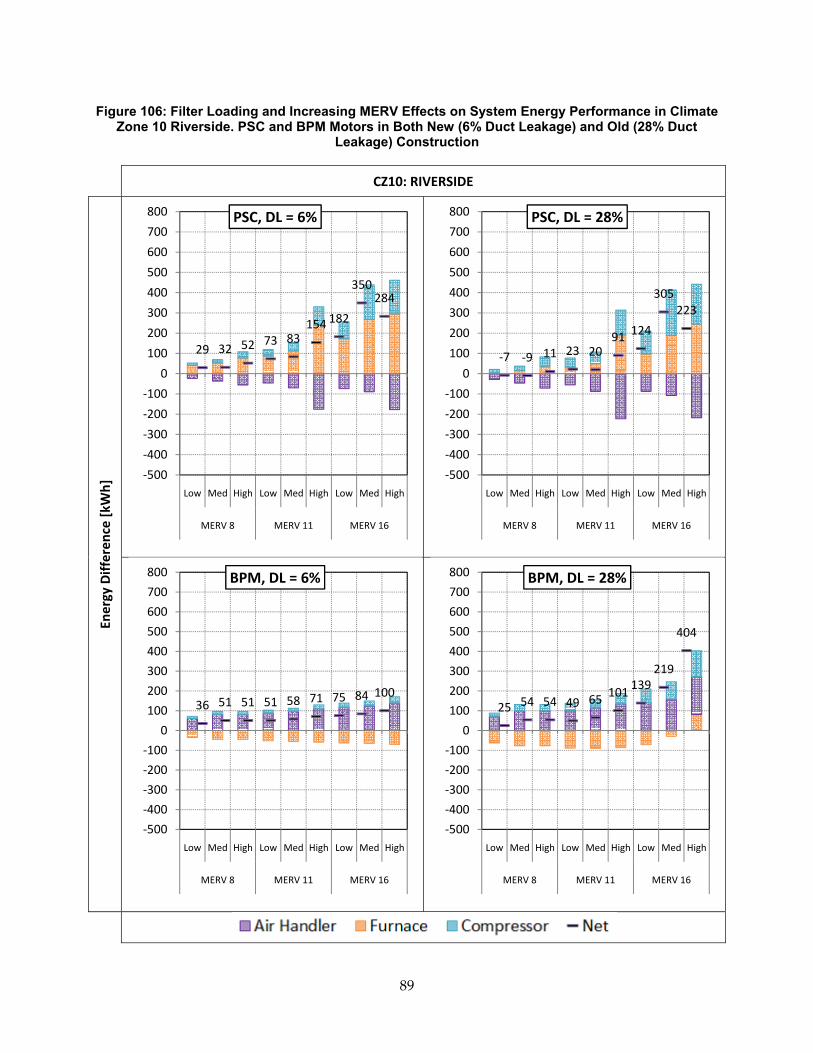
89
Figure 106: Filter Loading and Increasing MERV Effects on System Energy Performance in Climate Zone 10 Riverside. PSC and BPM Motors in Both New (6% Duct Leakage) and Old (28% Duct
Leakage) Construction
CZ10: RIVERSIDE
Energy Differen
ce [k
Wh]
29 32 52 73 83154 182
350284
‐500
‐400
‐300
‐200
‐100
0
100
200
300
400
500
600
700
800
Low Med High Low Med High Low Med High
MERV 8 MERV 11 MERV 16
PSC, DL = 6%
‐7 ‐9 11 23 2091 124
305223
‐500
‐400
‐300
‐200
‐100
0
100
200
300
400
500
600
700
800
Low Med High Low Med High Low Med High
MERV 8 MERV 11 MERV 16
PSC, DL = 28%
36 51 51 51 58 71 75 84 100
‐500
‐400
‐300
‐200
‐100
0
100
200
300
400
500
600
700
800
Low Med High Low Med High Low Med High
MERV 8 MERV 11 MERV 16
BPM, DL = 6%
25 54 54 49 65 101 139219
404
‐500
‐400
‐300
‐200
‐100
0
100
200
300
400
500
600
700
800
Low Med High Low Med High Low Med High
MERV 8 MERV 11 MERV 16
BPM, DL = 28%
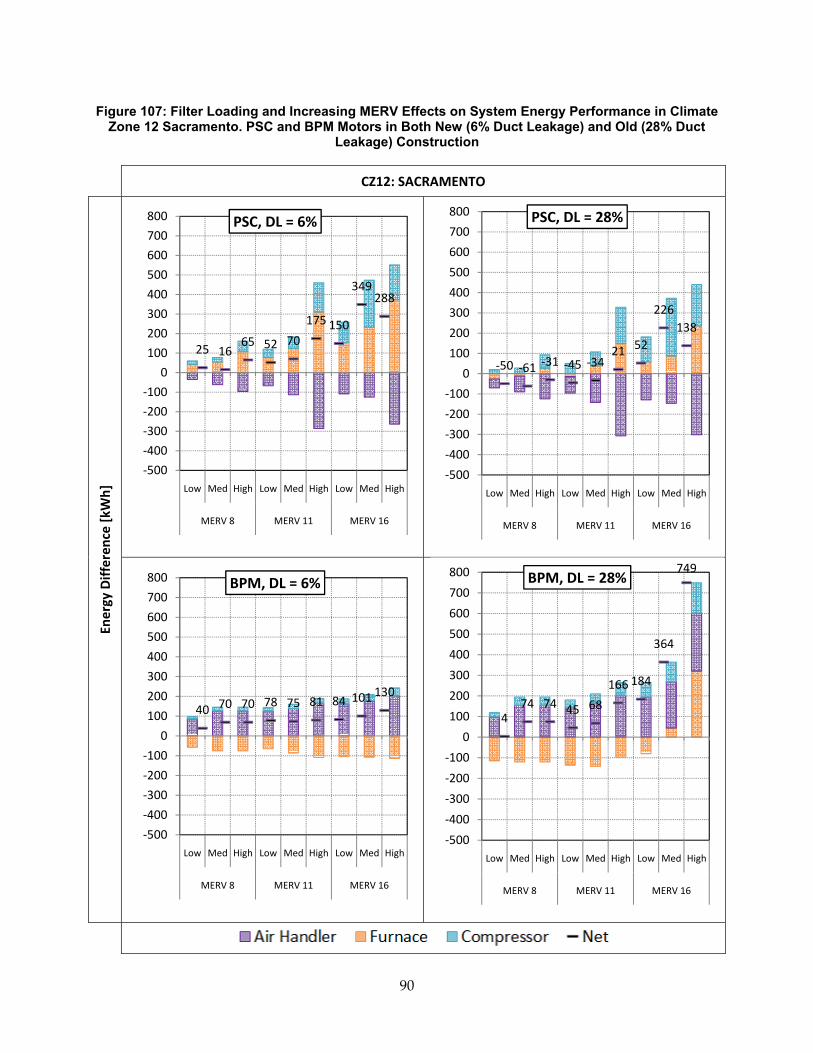
90
Figure 107: Filter Loading and Increasing MERV Effects on System Energy Performance in Climate Zone 12 Sacramento. PSC and BPM Motors in Both New (6% Duct Leakage) and Old (28% Duct
Leakage) Construction
CZ12: SACRAMENTO
Energy Differen
ce [k
Wh]
25 1665 52 70
175 150
349288
‐500
‐400
‐300
‐200
‐100
0
100
200
300
400
500
600
700
800
Low Med High Low Med High Low Med High
MERV 8 MERV 11 MERV 16
PSC, DL = 6%
‐50 ‐61 ‐31 ‐45 ‐3421 52
226138
‐500
‐400
‐300
‐200
‐100
0
100
200
300
400
500
600
700
800
Low Med High Low Med High Low Med High
MERV 8 MERV 11 MERV 16
PSC, DL = 28%
40 70 70 78 75 81 84 101 130
‐500
‐400
‐300
‐200
‐100
0
100
200
300
400
500
600
700
800
Low Med High Low Med High Low Med High
MERV 8 MERV 11 MERV 16
BPM, DL = 6%
474 74 45 68
166 184
364
749
‐500
‐400
‐300
‐200
‐100
0
100
200
300
400
500
600
700
800
Low Med High Low Med High Low Med High
MERV 8 MERV 11 MERV 16
BPM, DL = 28%
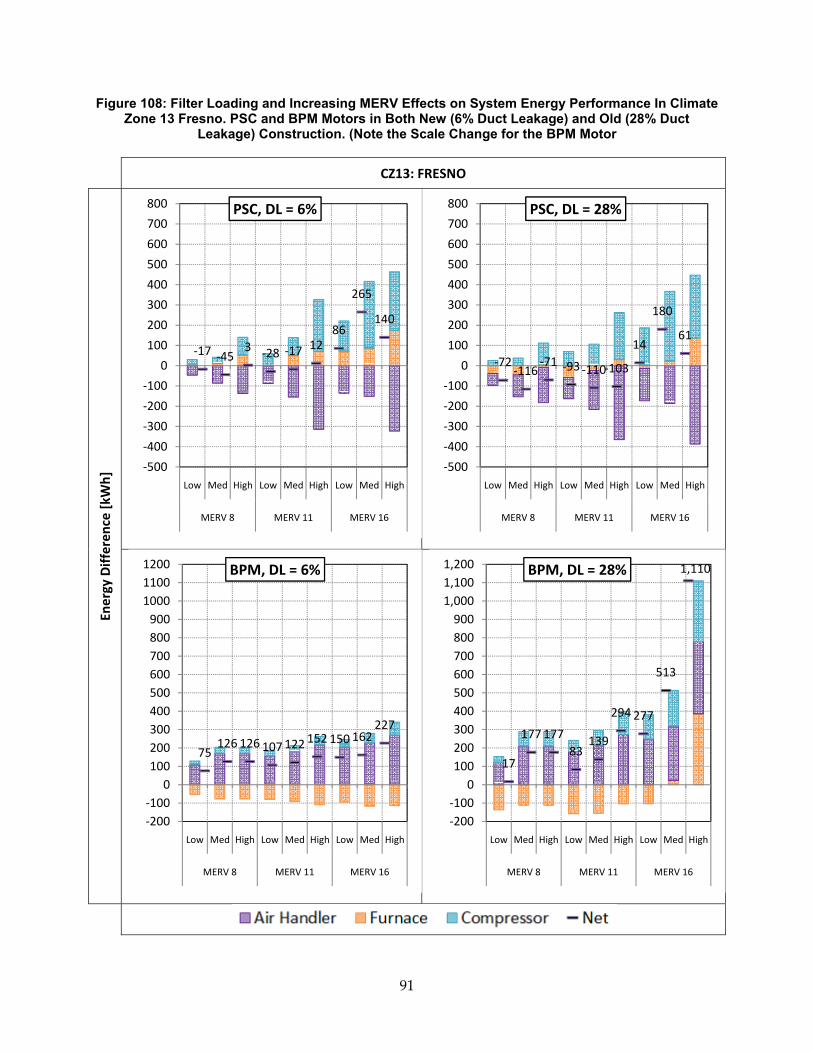
91
Figure 108: Filter Loading and Increasing MERV Effects on System Energy Performance In Climate Zone 13 Fresno. PSC and BPM Motors in Both New (6% Duct Leakage) and Old (28% Duct
Leakage) Construction. (Note the Scale Change for the BPM Motor
CZ13: FRESNO
Energy Differen
ce [k
Wh]
‐17 ‐453 ‐28 ‐17 12
86
265
140
‐500
‐400
‐300
‐200
‐100
0
100
200
300
400
500
600
700
800
Low Med High Low Med High Low Med High
MERV 8 MERV 11 MERV 16
PSC, DL = 6%
‐72‐116
‐71 ‐93 ‐110‐103
14
180
61
‐500
‐400
‐300
‐200
‐100
0
100
200
300
400
500
600
700
800
Low Med High Low Med High Low Med High
MERV 8 MERV 11 MERV 16
PSC, DL = 28%
75126 126 107 122
152 150 162227
‐200‐100
0100200300400500600700800900
100011001200
Low Med High Low Med High Low Med High
MERV 8 MERV 11 MERV 16
BPM, DL = 6%
17
177 17783
139
294 277
513
1,110
‐200‐100
0100200300400500600700800900
1,0001,1001,200
Low Med High Low Med High Low Med High
MERV 8 MERV 11 MERV 16
BPM, DL = 28%
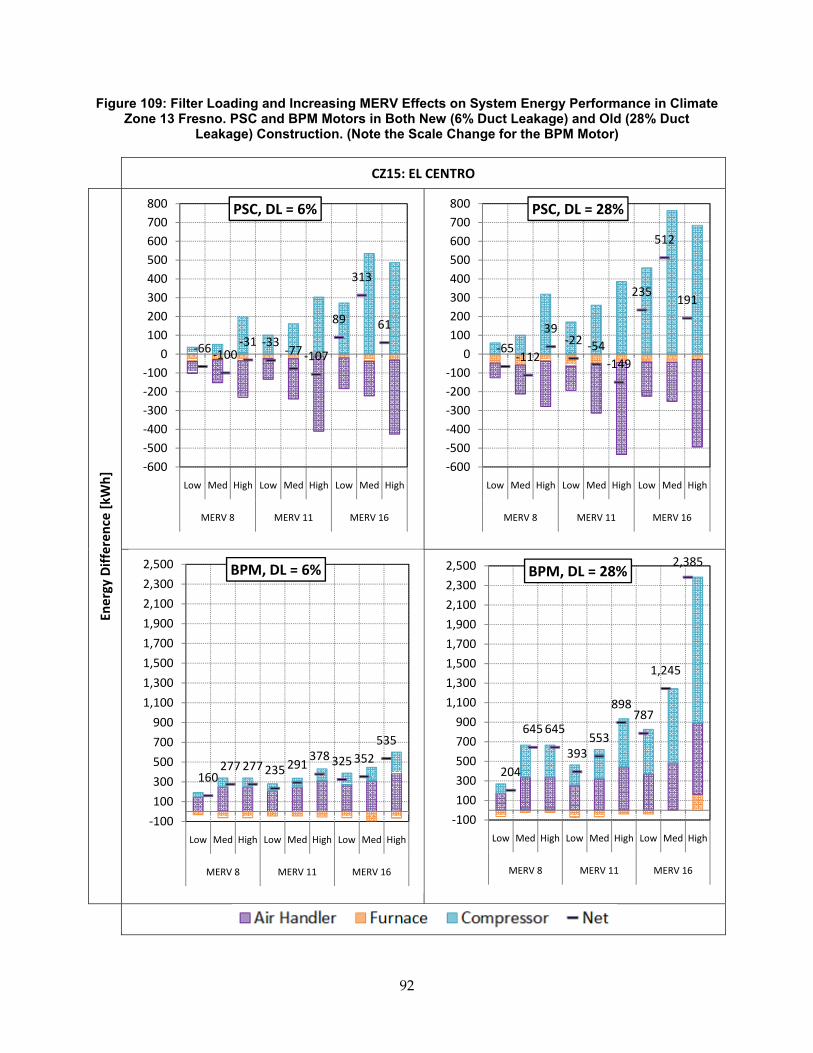
92
Figure 109: Filter Loading and Increasing MERV Effects on System Energy Performance in Climate Zone 13 Fresno. PSC and BPM Motors in Both New (6% Duct Leakage) and Old (28% Duct
Leakage) Construction. (Note the Scale Change for the BPM Motor)
CZ15: EL CENTRO
Energy Differen
ce [k
Wh]
‐66 ‐100‐31 ‐33
‐77 ‐107
89
313
61
‐600‐500‐400‐300‐200‐100
0100200300400500600700800
Low Med High Low Med High Low Med High
MERV 8 MERV 11 MERV 16
PSC, DL = 6%
‐65‐112
39‐22 ‐54
‐149
235
512
191
‐600‐500‐400‐300‐200‐100
0100200300400500600700800
Low Med High Low Med High Low Med High
MERV 8 MERV 11 MERV 16
PSC, DL = 28%
160277277235291
378325352535
‐100
100
300
500
700
900
1,100
1,300
1,500
1,700
1,900
2,100
2,300
2,500
Low Med High Low Med High Low Med High
MERV 8 MERV 11 MERV 16
BPM, DL = 6%
204
645645
393553
898787
1,245
2,385
‐100
100
300
500
700
900
1,100
1,300
1,500
1,700
1,900
2,100
2,300
2,500
Low Med High Low Med High Low Med High
MERV 8 MERV 11 MERV 16
BPM, DL = 28%
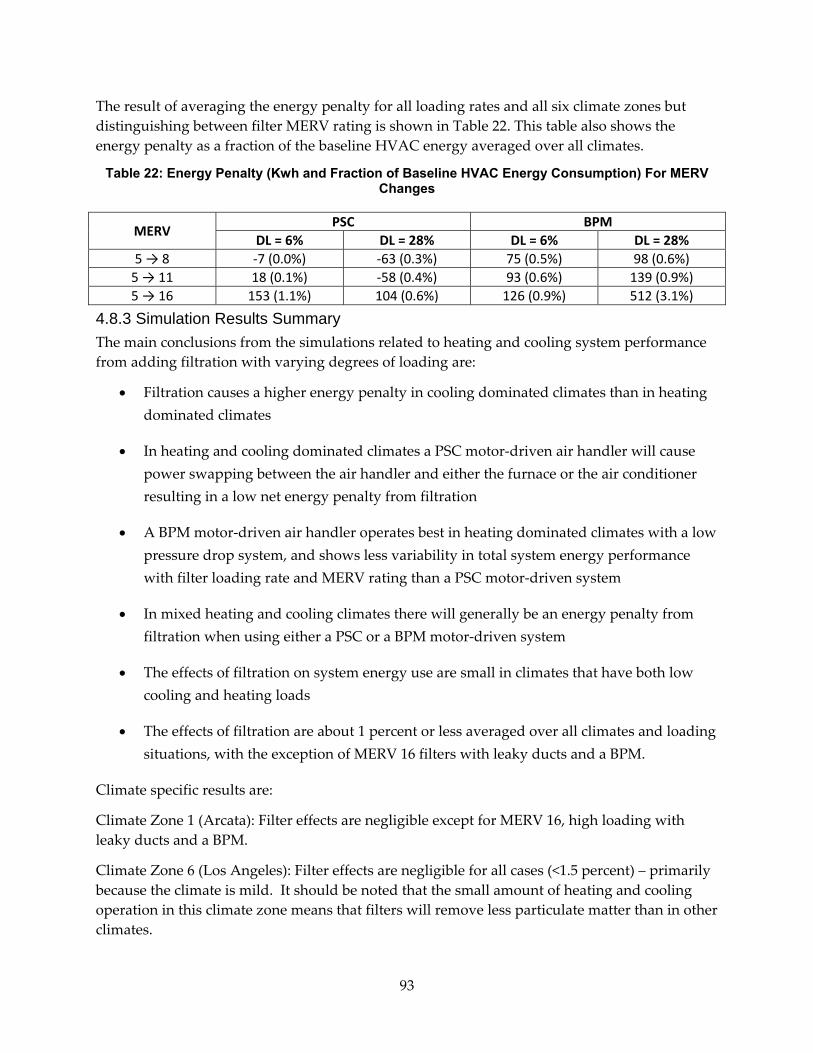
93
The result of averaging the energy penalty for all loading rates and all six climate zones but distinguishing between filter MERV rating is shown in Table 22. This table also shows the energy penalty as a fraction of the baseline HVAC energy averaged over all climates.
Table 22: Energy Penalty (Kwh and Fraction of Baseline HVAC Energy Consumption) For MERV Changes
MERV PSC BPM
DL = 6% DL = 28% DL = 6% DL = 28% 5 → 8 ‐7 (0.0%) ‐63 (0.3%) 75 (0.5%) 98 (0.6%) 5 → 11 18 (0.1%) ‐58 (0.4%) 93 (0.6%) 139 (0.9%) 5 → 16 153 (1.1%) 104 (0.6%) 126 (0.9%) 512 (3.1%)
4.8.3 Simulation Results Summary The main conclusions from the simulations related to heating and cooling system performance from adding filtration with varying degrees of loading are:
• Filtration causes a higher energy penalty in cooling dominated climates than in heating dominated climates
• In heating and cooling dominated climates a PSC motor‐driven air handler will cause power swapping between the air handler and either the furnace or the air conditioner resulting in a low net energy penalty from filtration
• A BPM motor‐driven air handler operates best in heating dominated climates with a low pressure drop system, and shows less variability in total system energy performance with filter loading rate and MERV rating than a PSC motor‐driven system
• In mixed heating and cooling climates there will generally be an energy penalty from filtration when using either a PSC or a BPM motor‐driven system
• The effects of filtration on system energy use are small in climates that have both low cooling and heating loads
• The effects of filtration are about 1 percent or less averaged over all climates and loading situations, with the exception of MERV 16 filters with leaky ducts and a BPM.
Climate specific results are:
Climate Zone 1 (Arcata): Filter effects are negligible except for MERV 16, high loading with leaky ducts and a BPM.
Climate Zone 6 (Los Angeles): Filter effects are negligible for all cases (<1.5 percent) – primarily because the climate is mild. It should be noted that the small amount of heating and cooling operation in this climate zone means that filters will remove less particulate matter than in other climates.
94
Climate Zones 10, 12 and 13 (Riverside, Sacramento and Fresno): The impact of cooling operation is significant and makes the BPM perform better than the PSC (because waste motor heat is additional cooling load). Filter effects are generally only significant (>2 percent) for MERV 16 filters with the PSC motor or BPM with high duct leakage. As the climate gets hotter the effects become greater. The worst case is a 6 percent penalty in Fresno for a high filter loading, leaky ducts and a BPM. This combination needs to be avoided.
Climate Zone 15 (El Centro): This climate had the most sensitivity of all. The cooling load being larger than the heating load, the energy penalties were higher for the BPM and for leaky ducts. The BPM with MERV 11 in this climate, had energy penalties of about 3.5 percent. The worst case was the high filter loading, leaky ducts with a BPM where the penalty was 20 percent. This climate requires the most care when selecting filters.
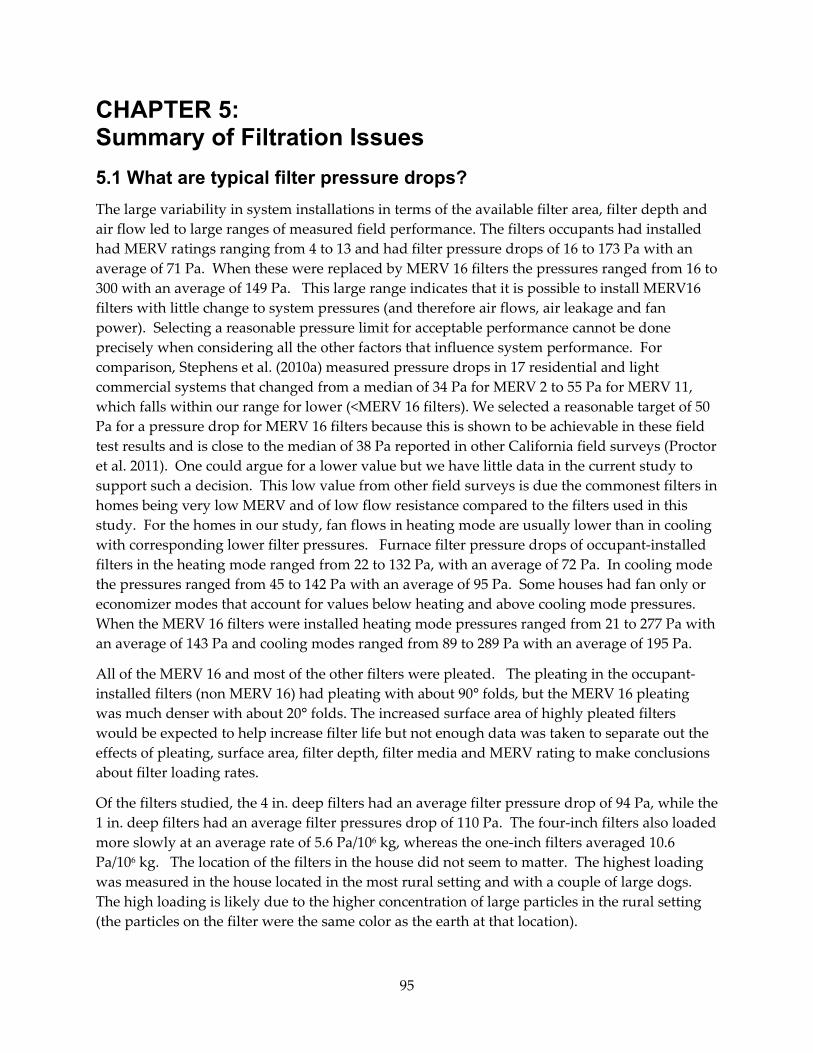
95
CHAPTER 5: Summary of Filtration Issues 5.1 What are typical filter pressure drops? The large variability in system installations in terms of the available filter area, filter depth and air flow led to large ranges of measured field performance. The filters occupants had installed had MERV ratings ranging from 4 to 13 and had filter pressure drops of 16 to 173 Pa with an average of 71 Pa. When these were replaced by MERV 16 filters the pressures ranged from 16 to 300 with an average of 149 Pa. This large range indicates that it is possible to install MERV16 filters with little change to system pressures (and therefore air flows, air leakage and fan power). Selecting a reasonable pressure limit for acceptable performance cannot be done precisely when considering all the other factors that influence system performance. For comparison, Stephens et al. (2010a) measured pressure drops in 17 residential and light commercial systems that changed from a median of 34 Pa for MERV 2 to 55 Pa for MERV 11, which falls within our range for lower (<MERV 16 filters). We selected a reasonable target of 50 Pa for a pressure drop for MERV 16 filters because this is shown to be achievable in these field test results and is close to the median of 38 Pa reported in other California field surveys (Proctor et al. 2011). One could argue for a lower value but we have little data in the current study to support such a decision. This low value from other field surveys is due the commonest filters in homes being very low MERV and of low flow resistance compared to the filters used in this study. For the homes in our study, fan flows in heating mode are usually lower than in cooling with corresponding lower filter pressures. Furnace filter pressure drops of occupant‐installed filters in the heating mode ranged from 22 to 132 Pa, with an average of 72 Pa. In cooling mode the pressures ranged from 45 to 142 Pa with an average of 95 Pa. Some houses had fan only or economizer modes that account for values below heating and above cooling mode pressures. When the MERV 16 filters were installed heating mode pressures ranged from 21 to 277 Pa with an average of 143 Pa and cooling modes ranged from 89 to 289 Pa with an average of 195 Pa.
All of the MERV 16 and most of the other filters were pleated. The pleating in the occupant‐installed filters (non MERV 16) had pleating with about 90° folds, but the MERV 16 pleating was much denser with about 20° folds. The increased surface area of highly pleated filters would be expected to help increase filter life but not enough data was taken to separate out the effects of pleating, surface area, filter depth, filter media and MERV rating to make conclusions about filter loading rates.
Of the filters studied, the 4 in. deep filters had an average filter pressure drop of 94 Pa, while the 1 in. deep filters had an average filter pressures drop of 110 Pa. The four‐inch filters also loaded more slowly at an average rate of 5.6 Pa/106 kg, whereas the one‐inch filters averaged 10.6 Pa/106 kg. The location of the filters in the house did not seem to matter. The highest loading was measured in the house located in the most rural setting and with a couple of large dogs. The high loading is likely due to the higher concentration of large particles in the rural setting (the particles on the filter were the same color as the earth at that location).
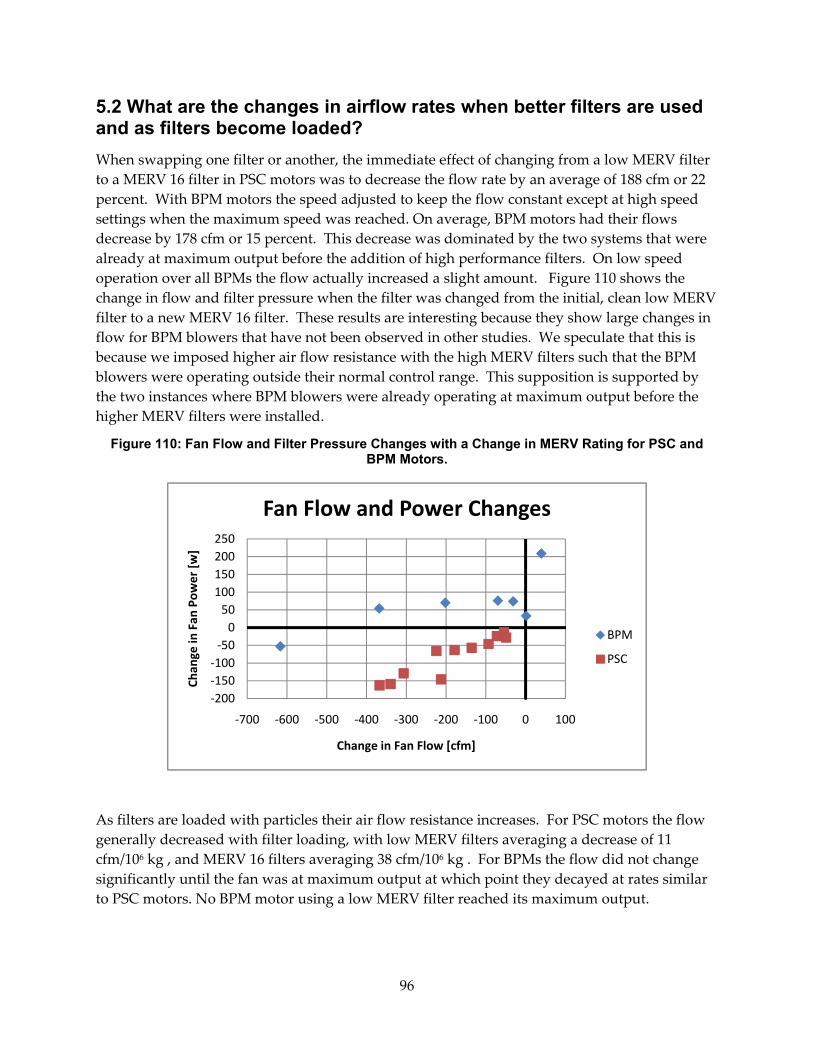
96
5.2 What are the changes in airflow rates when better filters are used and as filters become loaded? When swapping one filter or another, the immediate effect of changing from a low MERV filter to a MERV 16 filter in PSC motors was to decrease the flow rate by an average of 188 cfm or 22 percent. With BPM motors the speed adjusted to keep the flow constant except at high speed settings when the maximum speed was reached. On average, BPM motors had their flows decrease by 178 cfm or 15 percent. This decrease was dominated by the two systems that were already at maximum output before the addition of high performance filters. On low speed operation over all BPMs the flow actually increased a slight amount. Figure 110 shows the change in flow and filter pressure when the filter was changed from the initial, clean low MERV filter to a new MERV 16 filter. These results are interesting because they show large changes in flow for BPM blowers that have not been observed in other studies. We speculate that this is because we imposed higher air flow resistance with the high MERV filters such that the BPM blowers were operating outside their normal control range. This supposition is supported by the two instances where BPM blowers were already operating at maximum output before the higher MERV filters were installed.
Figure 110: Fan Flow and Filter Pressure Changes with a Change in MERV Rating for PSC and BPM Motors.
As filters are loaded with particles their air flow resistance increases. For PSC motors the flow generally decreased with filter loading, with low MERV filters averaging a decrease of 11 cfm/106 kg , and MERV 16 filters averaging 38 cfm/106 kg . For BPMs the flow did not change significantly until the fan was at maximum output at which point they decayed at rates similar to PSC motors. No BPM motor using a low MERV filter reached its maximum output.
‐200‐150‐100‐50050
100150200250
‐700 ‐600 ‐500 ‐400 ‐300 ‐200 ‐100 0 100
Chan
ge in
Fan
Pow
er [w
]
Change in Fan Flow [cfm]
Fan Flow and Power Changes
BPM
PSC
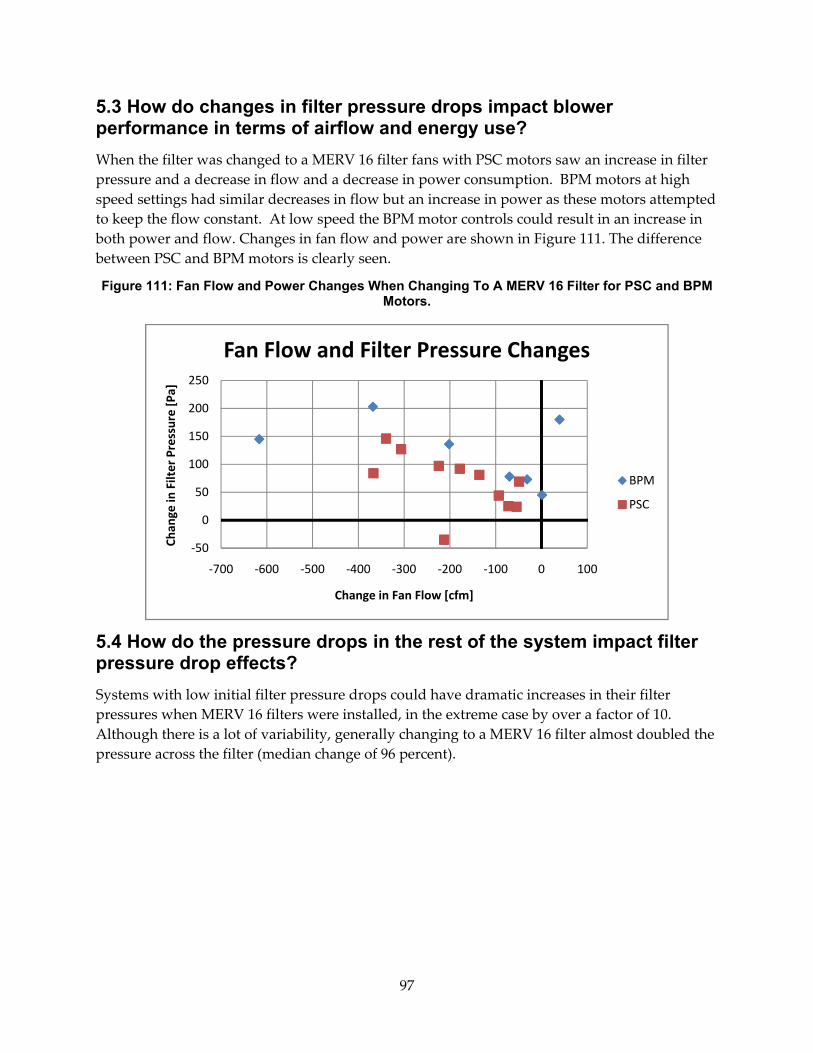
97
5.3 How do changes in filter pressure drops impact blower performance in terms of airflow and energy use? When the filter was changed to a MERV 16 filter fans with PSC motors saw an increase in filter pressure and a decrease in flow and a decrease in power consumption. BPM motors at high speed settings had similar decreases in flow but an increase in power as these motors attempted to keep the flow constant. At low speed the BPM motor controls could result in an increase in both power and flow. Changes in fan flow and power are shown in Figure 111. The difference between PSC and BPM motors is clearly seen.
Figure 111: Fan Flow and Power Changes When Changing To A MERV 16 Filter for PSC and BPM Motors.
5.4 How do the pressure drops in the rest of the system impact filter pressure drop effects? Systems with low initial filter pressure drops could have dramatic increases in their filter pressures when MERV 16 filters were installed, in the extreme case by over a factor of 10. Although there is a lot of variability, generally changing to a MERV 16 filter almost doubled the pressure across the filter (median change of 96 percent).
‐50
0
50
100
150
200
250
‐700 ‐600 ‐500 ‐400 ‐300 ‐200 ‐100 0 100
Chan
ge in
Filter Pressure [Pa]
Change in Fan Flow [cfm]
Fan Flow and Filter Pressure Changes
BPM
PSC
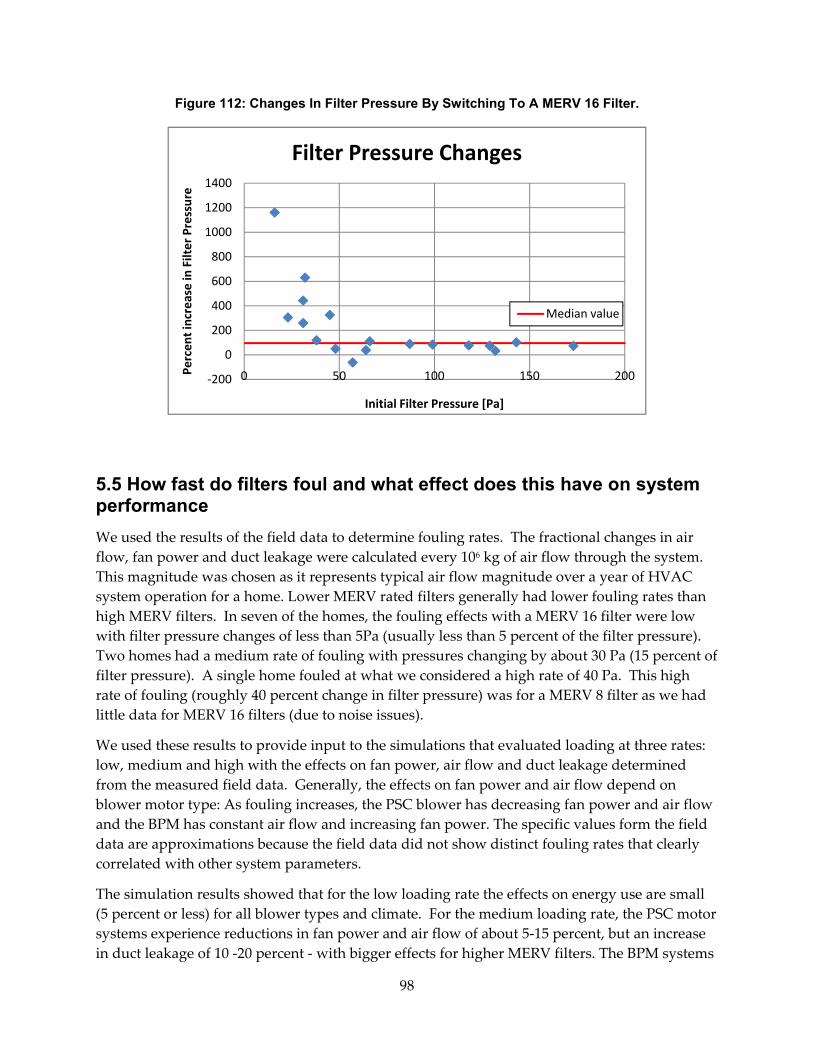
98
Figure 112: Changes In Filter Pressure By Switching To A MERV 16 Filter.
5.5 How fast do filters foul and what effect does this have on system performance We used the results of the field data to determine fouling rates. The fractional changes in air flow, fan power and duct leakage were calculated every 106 kg of air flow through the system. This magnitude was chosen as it represents typical air flow magnitude over a year of HVAC system operation for a home. Lower MERV rated filters generally had lower fouling rates than high MERV filters. In seven of the homes, the fouling effects with a MERV 16 filter were low with filter pressure changes of less than 5Pa (usually less than 5 percent of the filter pressure). Two homes had a medium rate of fouling with pressures changing by about 30 Pa (15 percent of filter pressure). A single home fouled at what we considered a high rate of 40 Pa. This high rate of fouling (roughly 40 percent change in filter pressure) was for a MERV 8 filter as we had little data for MERV 16 filters (due to noise issues).
We used these results to provide input to the simulations that evaluated loading at three rates: low, medium and high with the effects on fan power, air flow and duct leakage determined from the measured field data. Generally, the effects on fan power and air flow depend on blower motor type: As fouling increases, the PSC blower has decreasing fan power and air flow and the BPM has constant air flow and increasing fan power. The specific values form the field data are approximations because the field data did not show distinct fouling rates that clearly correlated with other system parameters.
The simulation results showed that for the low loading rate the effects on energy use are small (5 percent or less) for all blower types and climate. For the medium loading rate, the PSC motor systems experience reductions in fan power and air flow of about 5‐15 percent, but an increase in duct leakage of 10 ‐20 percent ‐ with bigger effects for higher MERV filters. The BPM systems
‐200
0
200
400
600
800
1000
1200
1400
0 50 100 150 200Percen
t increase in Filter Pressure
Initial Filter Pressure [Pa]
Filter Pressure Changes
Median value
99
have small (2.5 percent or less) changes in fan flow and power consumption and the same increases in duct leakage as the PSC blowers. The high filter loading scenario for the PSC blower had very large changes in flow and power (up 60 percent for MERV 16) as well as duct leakage (up to 50 percent for MERV 16). For the BPM the effects on flow and power were still less than 5 percent but the duct leakage showed the same large changes for the PSC blowers. These results indicate that performance is a strong function of fouling rates and that changing filters more often in high fouling situations is essential.
5.6 How do the filters change the energy performance of heating and cooling systems? The general trend is that climates with more cooling had bigger impacts. This is because cooling systems are adversely affected by lowering the system air flow and because any increase in lost motor heat increases the cooling load (it displaces furnace gas use in heating and has little net effect). In most situations MERV 10/11/13 filters had a negligible (<1 percent) effect on energy use and energy use only became an issue for MERV16 filters. In the hottest climates it becomes essential to avoid using MERV 16 filters with leaky ducts and a BPM blower because the energy penalties can get as high as 20 percent. In many climates the high filter loading cases stood out as having significantly worse performance. This suggests the need for some sort of indictor that a filter is fouled that can be observed by home occupants.
These overall results are comparable with previous studies. For example, Parker et al. (1997) used modeling of air flow reduction effects to estimate about a 2 percent change in energy use. Stephens et al. (2010a) used periodic field measurements of air conditioner use to examine the change in air conditioner performance when going from low MERV filters to MERV 11/12 filters. Taking their median energy reduction of 0.26 kWh/ton/day and the air conditioner capacities and energy use from the current study implies a change of about 1 percent. However, it should be noted that the Stephens et al. study found large variations of +/‐ 4.4 kWh/ton/day (or a variability of about +/‐ 15 percent using the same conversion as above) making comparisons difficult. Despite the differences in methodology and MERV ratings of filters it seems like there is a fair consensus that energy changes are not large on average and depend very much on individual system characteristics such as duct leakage, starting system air flow resistance, etc. More detailed monitoring of two systems by Stephens et al. 2010b again showed very small overall impacts for MERV 11 filters that is similar to the results of the current study. It appears that the extension to MERV 16 filters in the current study has shown that energy use issues may only be significant at these higher filtration levels given the relative agreement between this and previous studies at lower MERV 11 levels.
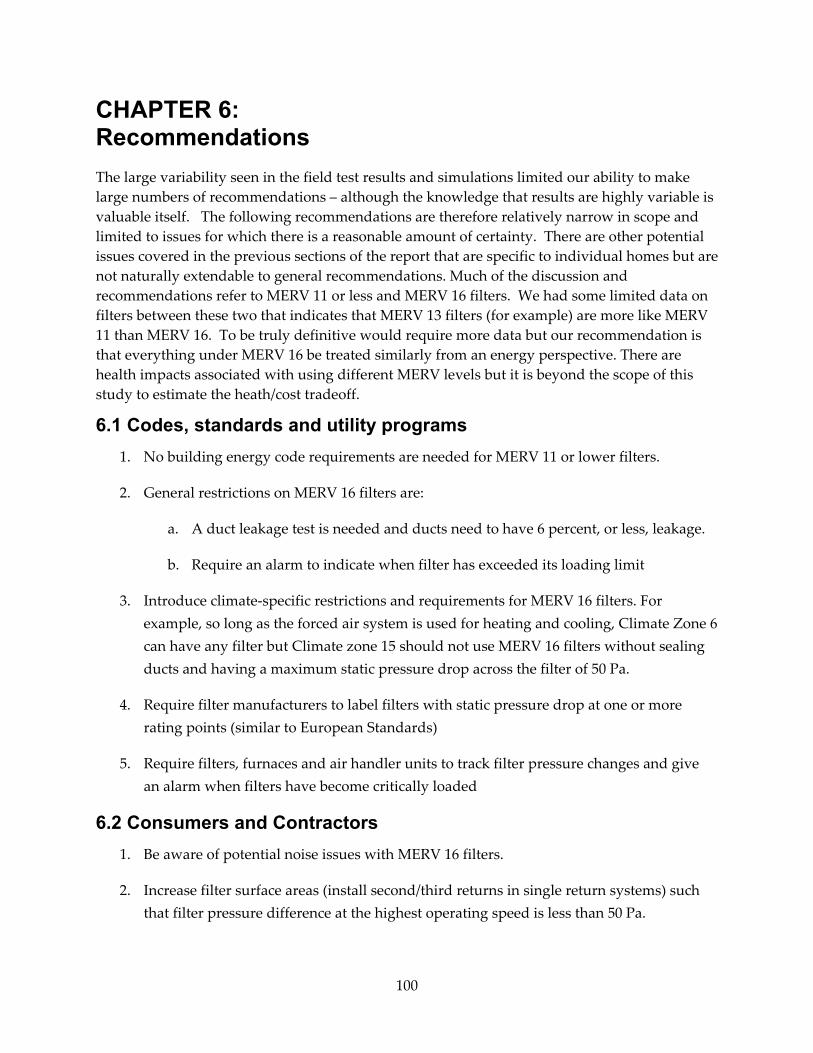
100
CHAPTER 6: Recommendations The large variability seen in the field test results and simulations limited our ability to make large numbers of recommendations – although the knowledge that results are highly variable is valuable itself. The following recommendations are therefore relatively narrow in scope and limited to issues for which there is a reasonable amount of certainty. There are other potential issues covered in the previous sections of the report that are specific to individual homes but are not naturally extendable to general recommendations. Much of the discussion and recommendations refer to MERV 11 or less and MERV 16 filters. We had some limited data on filters between these two that indicates that MERV 13 filters (for example) are more like MERV 11 than MERV 16. To be truly definitive would require more data but our recommendation is that everything under MERV 16 be treated similarly from an energy perspective. There are health impacts associated with using different MERV levels but it is beyond the scope of this study to estimate the heath/cost tradeoff.
6.1 Codes, standards and utility programs 1. No building energy code requirements are needed for MERV 11 or lower filters.
2. General restrictions on MERV 16 filters are:
a. A duct leakage test is needed and ducts need to have 6 percent, or less, leakage.
b. Require an alarm to indicate when filter has exceeded its loading limit
3. Introduce climate‐specific restrictions and requirements for MERV 16 filters. For example, so long as the forced air system is used for heating and cooling, Climate Zone 6 can have any filter but Climate zone 15 should not use MERV 16 filters without sealing ducts and having a maximum static pressure drop across the filter of 50 Pa.
4. Require filter manufacturers to label filters with static pressure drop at one or more rating points (similar to European Standards)
5. Require filters, furnaces and air handler units to track filter pressure changes and give an alarm when filters have become critically loaded
6.2 Consumers and Contractors 1. Be aware of potential noise issues with MERV 16 filters.
2. Increase filter surface areas (install second/third returns in single return systems) such that filter pressure difference at the highest operating speed is less than 50 Pa.
101
3. Only install MERV 16 filters after reducing the system air flow resistance and check that the addition of a MERV 16 filter will not exceed the system allowed static pressure.
102
REFERENCES
AHRI Standard 680. 2009. 2009 Standard for Performance Rating of Residential Air Filter Equipment. Air-Conditioning, Heating, and Refrigerating Institute, Arlington, VA.
ALA. 2006. American Lung Association® Health House®. Tips about your furnace filter. http://www.healthhouse.org/tipsheets/TS_FurnaceFilters.pdf
ARI. 2003. Standard for Unitary Air Conditioning and Air-source Heat Pump Equipment. Standard 210/240-2003. Air-conditioning and Refrigeration Institute, Arlington, VA.
ASHRAE Standard 52.2. 1999. Method of testing General Ventilation Air-Cleaning Devices for Removal Efficiency by Particle Size. American Society of Heating, refrigerating and Air-conditioning Engineers, Atlanta, GA.
ASHRAE Standard 52.1. 1992. Gravimetric and Dust-Spot Procedures for Testing Air-Cleaning Devices Used in General Ventilation for Removing Particulate Matter. American Society of Heating, refrigerating and Air-conditioning Engineers, Atlanta, GA.
ASHRAE Standard 62.2. 2004. Ventilation and Acceptable Indoor Air Quality in Low-Rise Residential Buildings. American Society of Heating, refrigerating and Air-conditioning Engineers, Atlanta, GA.
ASHRAE Standard 152. 2007. Method of Test for Determining the Design and Seasonal Efficiencies of Residential Thermal Distribution Systems. American Society Heating, Refrigerating and Air-conditioning Engineers, Atlanta, GA.
ASHRAE Standard 160. 2009. Design Criteria for Moisture Control in Buildings, American Society of Heating, Refrigerating and Air conditioning Engineers.
ASTM E1554-2007. Standard Test Method for Determining the Air Leakage of Air Distribution Systems by Fan Pressurization. American Society for Testing and Materials, West Conshohocken, PA.
ASTM E779-2010. Standard Test Method for Determining Air Leakage by Fan Pressurization. American Society for Testing and Materials, West Conshohocken, PA.
Bowser, D. and Fugler, D. 2004. Preventing Particle Penetration. Home Energy Magazine. March/April 2004.
Bowser, D. 1999. Evaluation of Residential Furnace Filters. Canada Mortgage and Housing Report. ISBN 0‐660‐17813‐3
CEC. 2008. Residential Alternative Calculation Manual (ACM) Approval Method. 2008 Building Energy Efficiency Standards. California Energy Commission. CEC-400-2008-002-CMF.
CEC. 2008b. Reference Appendixes for the 2008 Building Energy Efficiency Standards for Residential and Non-Residential Buildings. California Energy Commission. CEC-400-2008-004-CMF.
CEC. 2008c. 2008 Building Energy Efficiency Standards Residential Compliance Manual. California Energy Commission. CEC-400-2008-016-CMD.
103
Chen, C., Zhao, B., Zhou, W., Jiang, X and Tan, Z. 2012. Building and Environment; 47 339‐348: 12‐16.
CMHC. 1993. Efficient and Effective Residential Air Handling Devices. Research Division, Canada Mortgage and Housing Corporation. Ottawa, Ontario, Canada.
CSA. 2011. C823-11 Performance of air handlers in residential space conditioning systems. Canadian Standards Association.
Emmerich, S., Howard‐Reed, C, and Gupte, A. 2005. Modeling the IAQ Impact of HHI Interventions in Inner‐city Housing. NISTR 7212. National Institute of Standards and Technology.
EN779‐2012. Particulate Air Filters for General Ventilation. Determination of the filtration performance. BSI (EN). ISBN 978 0 580 67231 6
EPA. 2011. Healthy Indoor Environment Protocols for Home Energy Upgrades. US Environmental Protection Agency. http://www.epa.gov/iaq/pdfs/epa_retrofit_protocols.pdf
EPA. 2001b. Indoor Air Plus construction specifications. US EPA. http://www.epa.gov/indoorairplus/pdfs/construction_specifications.pdf
EUROVENT 4/11. Energy Efficiency Classification of Air Filters for General Ventilation Purposes. 2011. EUROVENT. Paris. France.
Fugler, D. Bowser, D. and Kwan. W. 2000. The Effects of Improved Residential Furnace Filtration on Airborne Particles. ASHRAE Trans. 106 (1); 317-326
Kowalski WJ and Bahnfleth W.P.2002. Airborne-microbe filtration in indoor environments. HPAC Engineering, January 2002: 57-69
Fisk, W.J., Faulkner, D., Palonen, J. and Seppanen, O. 2002. Performance and costs of particle air filtration technologies. Indoor Air, Vol. 12., pp 223-234.
Gusdorf, J., Swinton, M., Entchev, E., Simpson, C., and Castellan, B. 2002. The Impact of ECM furnace motors on natural gas use and overall energy use during the heating season of the CCHT research facility. National Research Council Canada report No. NRCC-38443.
Gusdorf, J., Swinton, M., Simpson, C., Entchev, E., Hayden, S., and Castellan, B. 2003. Effects of ECM furnace motors on electricity and gas use: Results from the CCHT research facility and projections. National Research Council Canada report.
HVI. 2011. Certified Home Ventilating Products Directory, Home Ventilating Institute.
Kowalkski, W., Bahnfleth, W. and Whittam, T. 1999. Filtration of airborne microorganisms: modeling and prediction. ASHRAE Trans. 105(2): 4-17.
Lee K, Vallarino J, Dumyahn T, Özkaynak H, Spengler JD. 1999. Ozone decay rates in residences. Journal of the Air & Waste Management Association; 49: 1238‐1244.
Lee K, Parkhurst WJ, Xue JP, Özkaynak AH, Neuberg D, Spengler JD. 2004.
Outdoor/indoor/personal ozone exposures of children in Nashville, Tenessee. Journal of the Air & Waste Management Association; 54: 352‐359.
104
Lui, M., Claridge, D., and Deng, S. 2003. An air filter pressure loss model for fan energy calculation in air handling units. International Journal of Energy Research. 27(6): 589-600.
Lutz, J., Franco, V. and Wong-Parodi, G. 2006. ECM motors in Residential Furnaces: What are the Savings. Proc. ACEEE Summer Study 2006, ACEEE, Washington, DC.
MacIntosh, D.L., Minegishi, T., Kaufman, M., Baker, B., Alen, J., Levy, J. and Myatt, T. 2010. The benefits of whole‐house in‐duct air cleaning in reducing exposure to particulate matter of outdoor origin: A modeling analysis. Journal of Exposure science and Environmental Epidemiology; 20: 213‐224.
Massey, D., Kulshrestha, A., Masih, J. and Taneja, A. 2012. Seasonal Trends of PM10, PM5.0, PM2.5 and PM1.0 in indoor and outdoor environments of residential homes located in North-Central India. Building and Environment; 47: 223-231.
Newell, D.A. 2006. Interpreting Filter Performance – The meaning behind the terminology of ASHRAE standards 52.1 and 52.2. HPAC Engineering, February 2006, pp. 44-51.
Offerman, F.J. 2009. Ventilation and Indoor Air Quality in New Homes. PIER Collaborative Report, California Energy Commission & California Environmental Protection Agency Air Resources Board report CEC-500-2009-085.
Parker, D., Sherwin, J., and Shirey, D. 1997. Impact of Evaporator Coil Air Flow in Residential Air Conditioning Systems. ASHRAE Trans., 103(2): 395-405. ASHRAE, Atlanta, GA.
Pigg, S. 2003. Electricity use by New Furnaces. Energy Center of Wisconsin, Madison, WI.
Pigg, S. and Talerico, T. 2004. Electricity Savings from Variable-Speed Furnaces in Cold Climates. Proc. ACEEE Summer Study 2004, pp. 1-264 – 1.278. American Council for an Energy Efficient Economy, Washington, DC.
Phillips, B.G. 1995. Blower Efficiency in Domestic Heating Systems. UNIES Ltd., Winnipeg, Manitoba CEA 9202 U 921.
Phillips, B.G. 1998. Impact of Blower Performance on Residential Forced-Air Heating System Performance. ASHRAE Trans. 104(1). American Society of Heating, Refrigeration and Air-conditioning Engineers, Atlanta, GA.
Proctor, J. and Parker, D. 2000. Hidden Power Drains: Residential Heating and Cooling Fan Power Demand. Proc. ACEEE Summer Study 2000. pp. 1.225-1.234. American Council for an Energy Efficient Economy, Washington, D.C.
Proctor, J., Wilcox, B. and Chitwood, R. 2011. Efficiency Characteristics and Opportunities for New California Homes. California Energy Commission, Public Interest Energy Research Program Report.
Rodriguez, A. 1995. Effect of Refrigerant Charge, Duct Leakage, and Evaporator Air Flow on the High Temperature Performance of Air Conditioners and Heat Pumps. Master of Science Thesis, Energy Systems Laboratory, University of Texas.
105
Siegel, Jeffrey A. and Nazaroff, W. W. 2002. Modeling Particle Deposition on HVAC Heat Exchangers. LBNL-49339. http://epb.lbl.gov/Publications/lbnl-49339.pdf
Seigel, J., Walker, I., and Sherman, M. 2002. Dirty Air Conditioners: Energy Implications of Coil Fouling. Proc. 2002 ACEEE Summer Study, Vol. 1, pp. 287-300. American Council for an Energy Efficient Economy, Washington, DC. LBNL-49757. http://epb.lbl.gov/Publications/lbnl-49757.pdf
Springer, D. 2009. Is there a downside to high-MERV filters? Home Energy Magazine, Nov/Dec 2009.
Stephens, B., Siegel, J.A., and Novoselac, A. 2010a. Energy Implications of Filtration in Residential and Light‐Commercial Buildings. ASHRAE Trans. 116. Pt. 1:346‐357.
Stephens, B., Novoselac, A. and Seigel, J.A. 2010b. The Effects of Filtration on Pressure Drop and Energy Consumption in Residential HVAC Systems (RP‐1299). ASHRAE HVAC&R Research Journal Vol. 16, No.3, 273‐294.
Stephens, B., Gall, E.T. and Siegel, J.A. 2011. Measuring the Penetration of Ambient Ozone into Residential Buildings. Environ. Sci. Technol. 46, 929-936.
Stephens, B. and Siegel, J.A. 2012. Penetration of ambient sub-micron particles into single-family residences and associations with building characteristics. Indoor Air. Vol. 22. No. 5. DOI: 10.1111/j.1600-0668.2012.00779.x
Stock TH, Kotchmar DJ, Contant CF, Buffler PA, Holguin AH, Gehan BM, Noel LM. 1985. The estimation of personal exposures to air pollutants for a community-based study of health effects in asthmatics – design and results of air monitoring. Journal of the Air Pollution Control Association; 35: 1266-1273.
USGBC. 2008. LEED® for Homes Rating System. U.S. Green Building Council.
Walker, I.S., Mingee, D, and Brenner, D. 2004. Improving Air Handler Efficiency in Residential Applications, Proc. ACEEE summer study 2004, American Council for an Energy Efficient Economy, Washington, DC. LBNL 53606.
Walker. 2006a. Residential Furnace Blower Performance. LBNL 61467. http://epb.lbl.gov/Publications/lbnl-61467.pdf
Walker 2006b. Laboratory Evaluation of Furnace Blower Performance. LBNL 58742. http://epb.lbl.gov/Publications/lbnl-58742.pdf
Walker 2005. State-of-the-art in Residential and Small Commercial Air Handler Performance. LBNL 57730. http://epb.lbl.gov/Publications/lbnl-57330plus.pdf
Walker, I. S. and M. H. Sherman. 2006. Evaluation of Existing Technologies for Meeting Residential Ventilation Requirements. LBNL-59998. http://epb.lbl.gov/Publications/lbnl-59998.pdf
Walker, I.S. and Sherman, M.H. 2006. Ventilation Requirements in Hot Humid Climates. Proc. 15th Symposium on Improving Building Systems in Hot Humid Climates. Florida Solar Energy Center and Texas A&M University. LBNL-59889.
106
Walker, I.S. and Sherman, M.H. 2007. Humidity Implications for meeting residential ventilation requirements. Proc. ASHRAE/DOE/BTECC Thermal Performance of the Exterior Envelopes of Buildings X. LBNL 62182.
Walker, I.S. and Sherman, M.H. 2012. Ozone Filtration Effects of Residential Building Envelopes. Submitted to Building and Environment.
Walker, I.S., Sherman, M.H. and Nazaroff, W.W. 2009. Ozone Reductions using Residential Building Envelopes. LBNL report 1563E.
Wallace, L.A., Emmerich, S.J. and Howard‐Reed, C. 2004. Effect of fans and in‐duct filters on deposition rates of ultrafine and fine particles in an occupied townhouse. Atmospheric Environment 38; 405‐413.
Yang, L, Braun, J. and Groll, E. 2004. The Role of Filtration in Maintaining Clean Air Conditioner Coils. Air Conditioning and Refrigeration Technology Institute, Arlington, VA. http://www.arti‐research.org/research/completed/finalreports/40050‐final.pdf
107
FURNACE FIELD TESING BIBLIOGRAPHY
CEC. 1998. private communication with Bill Pennington– field surveys of large number (>100) homes.
CMHC. 1993. Efficient and Effective Residential Air Handling Devices. Research Division, Canada Mortgage and Housing Corporation. Ottawa, Ontario, Canada.
Davis, B., Siegel, J., Francisco, P. and Palmiter, L. 1998. Measured and Modeled Heating Efficiency of Eight Natural Gas-Heated Homes. ECOTOPE, Inc. , Seattle, WA.
Olson, J., Palmiter, L., Davis, B., Geffon, M., Bond, T., 1993. Field Measurements of the Heating Efficiency of Electric Forced-Air Systems in 24 Homes. Ecotope, Inc., Seattle, WA.
Phillips, B.G. 1998. Impact of Blower Performance on Residential Forced-Air Heating System Performance. ASHRAE Trans. V. 104, Pt.1, American Society of Heating, Refrigeration and Air-conditioning Engineers, Atlanta, GA.
Phillips, B.G. 1995. Blower Efficiency in Domestic Heating Systems/ UNIES Ltd., Winnipeg, Manitoba CEA 9202 U 921.
Pigg, S. 2003. Electricity Use by New Furnaces: A Wisconsin Field Study, Appendices. Energy Center of Wisconsin, Madison October 2003. http://www.ecw.org/ecw/productdetail.jsp?productId=500&numPerPage=1000&sortAttribute=initiative.title&sortOrder=ASC.
Proctor, J. and Parker, D. 2000. Hidden Power Drains: Residential Heating and Cooling Fan Power Demand. Proc. ACEEE Summer Study 2000 pp. 1.225-1.234. American Council for an Energy Efficient Economy, Washington, D.C.
Jump, D.A., Walker, I.S. and Modera, M.P., 1996. Field Measurements of Efficiency and Duct Retrofit Effectiveness in Residential Forced Air Distribution Systems. Proc. 1996 ACEEE Summer Study, pp.1.147-1.156. ACEEE, Washington, D.C., (LBNL 38537).
Walker, I.S., Sherman, M.H., Modera, M.P. and Siegel, J. 1998. Leakage Diagnostics, Sealant Longevity, Sizing and Technology Transfer in Residential Thermal Distribution Systems. LBNL 41118.
Walker, I., Sherman, M., Siegel, J., Wang, D., Buchanan, C., and Modera, M. 1999. Leakage Diagnostics, Sealant Longevity, Sizing and Technology Transfer in Residential Thermal Distribution Systems: Part II., LBNL 42691.
Walker, I.S., Modera, M.P., Tuluca, A. and Graham, I. 1996. Energy Effectiveness of Duct Sealing and Insulation in Two Multifamily Buildings. Proc. 1996 ACEEE Summer Study, pp.1.247‐1.254. ACEEE, Washington, D.C. (LBNL 38538).

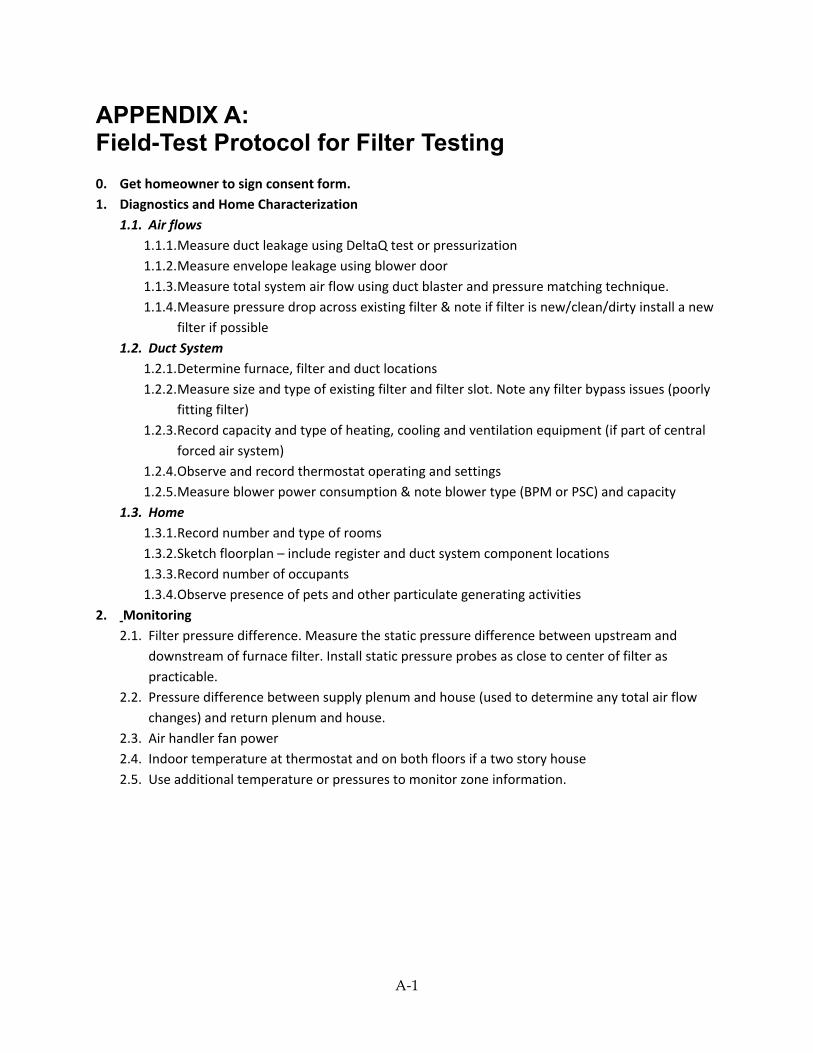
A‐1
APPENDIX A: Field-Test Protocol for Filter Testing 0. Get homeowner to sign consent form. 1. Diagnostics and Home Characterization
1.1. Air flows 1.1.1. Measure duct leakage using DeltaQ test or pressurization 1.1.2. Measure envelope leakage using blower door 1.1.3. Measure total system air flow using duct blaster and pressure matching technique. 1.1.4. Measure pressure drop across existing filter & note if filter is new/clean/dirty install a new
filter if possible 1.2. Duct System
1.2.1. Determine furnace, filter and duct locations 1.2.2. Measure size and type of existing filter and filter slot. Note any filter bypass issues (poorly
fitting filter) 1.2.3. Record capacity and type of heating, cooling and ventilation equipment (if part of central
forced air system) 1.2.4. Observe and record thermostat operating and settings 1.2.5. Measure blower power consumption & note blower type (BPM or PSC) and capacity
1.3. Home 1.3.1. Record number and type of rooms 1.3.2. Sketch floorplan – include register and duct system component locations 1.3.3. Record number of occupants 1.3.4. Observe presence of pets and other particulate generating activities
2. Monitoring 2.1. Filter pressure difference. Measure the static pressure difference between upstream and
downstream of furnace filter. Install static pressure probes as close to center of filter as practicable.
2.2. Pressure difference between supply plenum and house (used to determine any total air flow changes) and return plenum and house.
2.3. Air handler fan power 2.4. Indoor temperature at thermostat and on both floors if a two story house 2.5. Use additional temperature or pressures to monitor zone information.

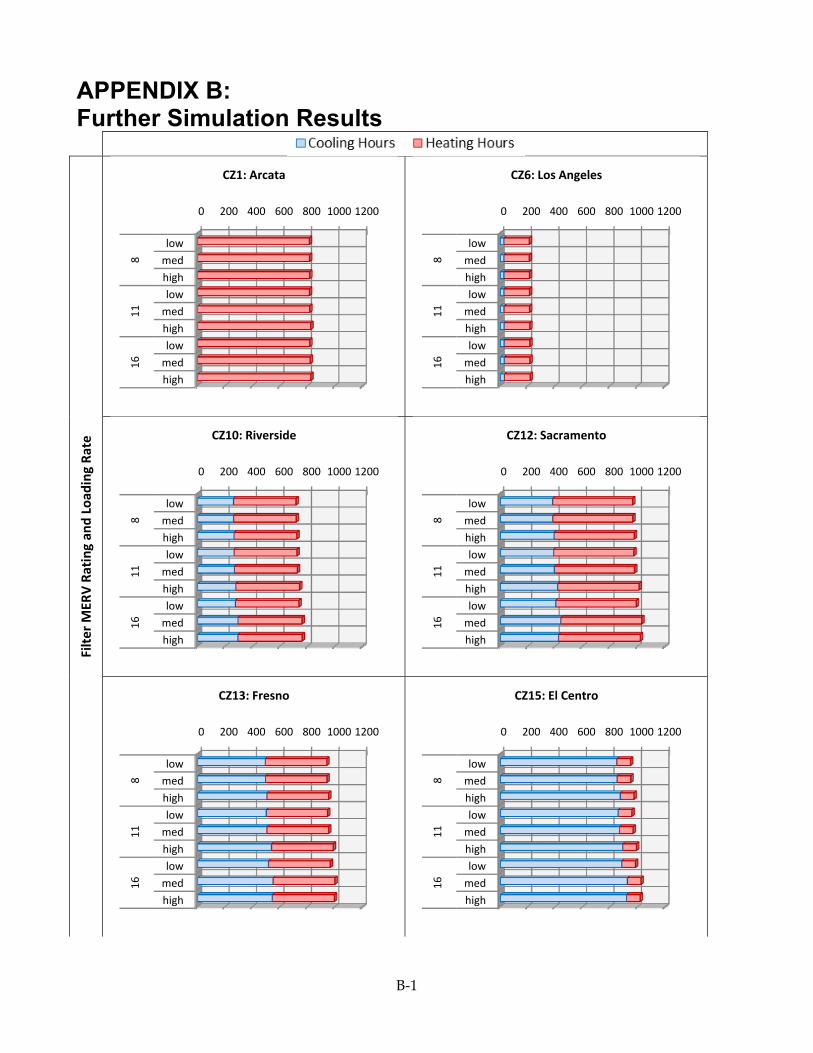
B‐1
APPENDIX B: Further Simulation Results
Filter M
ERV Rating an
d Load
ing Ra
te
0 200 400 600 800 1000 1200
lowmedhighlowmedhighlowmedhigh
811
16
CZ1: Arcata
0 200 400 600 800 1000 1200
lowmedhighlowmedhighlowmedhigh
811
16
CZ6: Los Angeles
0 200 400 600 800 1000 1200
lowmedhighlowmedhighlowmedhigh
811
16
CZ10: Riverside
0 200 400 600 800 1000 1200
lowmedhighlowmedhighlowmedhigh
811
16CZ12: Sacramento
0 200 400 600 800 1000 1200
lowmedhighlowmedhighlowmedhigh
811
16
CZ13: Fresno
0 200 400 600 800 1000 1200
lowmedhighlowmedhighlowmedhigh
811
16
CZ15: El Centro