Embed Size (px)
Citation preview
Project Report Economic Impact Study of the Green Bay Packers and the Redeveloped Lambeau Field Prepared for The Green Bay/Brown County Professional Football Stadium District
Submitted by
AECOM Technical Services, Inc (AECOM)
September 22, 2010
Project No. 18300

F
AECOM Project No. 18300 Page 1
Table of Contents I. Introduction and Executive Summary ..................................................................................... 6
Introduction .................................................................................................................................. 6 Executive Summary ..................................................................................................................... 6
II. Economic Impact Approach ................................................................................................... 10 Methodology .............................................................................................................................. 10 Overview .................................................................................................................................... 10 Economic Multipliers .................................................................................................................. 11 Analysis Framework................................................................................................................... 12
III. Economic and Fiscal Impacts of the Green Bay Packers to Brown County ...................... 14 Packers and Lambeau Field Football Operations ...................................................................... 14 Packers Training Camp and Regular Season ............................................................................ 16 Lambeau Field Atrium ................................................................................................................ 18 Incremental Operational Economic and Fiscal Impacts Resulting from Stadium Redevelopment ................................................................................................................................................... 20 Stadium Redevelopment Construction Impacts ......................................................................... 21 Summary ................................................................................................................................... 24
IV. Land Use Analysis ................................................................................................................... 25 Land Use near Lambeau Field ................................................................................................... 25 Land Values near Lambeau Field .............................................................................................. 26 Assessed vs. Market Value ........................................................................................................ 28 Business Sales near Lambeau Field and throughout Brown County ......................................... 29 Hotel Development .................................................................................................................... 30
V. Surveys of Businesses near Lambeau Field ......................................................................... 33 General Business Information .................................................................................................... 33 Impact of Lambeau Field Redevelopment ................................................................................. 34 Overall Satisfaction with the Redeveloped Lambeau Field ........................................................ 36 Other Input ................................................................................................................................. 38
VI. Surveys of Local Attractions .................................................................................................. 39 General Business Information .................................................................................................... 39 Impact of Lambeau Field Redevelopment ................................................................................. 40 Overall Satisfaction .................................................................................................................... 42 Other Input ................................................................................................................................. 42
VII. Surveys of Local Hotels and Meetings Facilities .................................................................. 43 General Business Information .................................................................................................... 43 Impact of Lambeau Field Redevelopment ................................................................................. 44 Impact of Redeveloped Stadium on Events and Attendance ..................................................... 45 Overall Satisfaction .................................................................................................................... 47 Other Input ................................................................................................................................. 47
VIII. Other Local Impacts Related to Business Growth, Attraction, Retention, and Marketing 48 Survey Results ........................................................................................................................... 48 Other Associated Impacts .......................................................................................................... 51
IX. Other Potential Impact-Generating Events ............................................................................ 53 Past Non-Packers and Non-Atrium Events at Lambeau Field ................................................... 53 Events Held at Other Similar Stadiums ...................................................................................... 53 Other Relevant Considerations .................................................................................................. 70 Conclusions ............................................................................................................................... 70
X. Capital Improvements for Additional Potential Impacts ...................................................... 74 Events’ Needs and Capabilities of Lambeau Field and the Atrium ............................................ 74 Recent and Planned Capital Improvement Projects at NFL Stadiums ....................................... 76 Facilities at Other NFL Stadiums ............................................................................................... 77

F
AECOM Project No. 18300 Page 2
XI. Estimated Value of Earned Media .......................................................................................... 79 Packers’ Media Coverage .......................................................................................................... 79 Impact of Other Coverage on Fans and Attendees .................................................................... 80
XII. Other Community Impacts ...................................................................................................... 82 The Packers’ Community Activities and Contributions ............................................................... 82

F
AECOM Project No. 18300 Page 3
Tables Table 1: Summary of Impacts ............................................................................................................. 7 Table 2: Packers 2009 Team and Stadium Expenses (thousands) ................................................... 14 Table 3: Total Economic Impacts – Packers and Lambeau Field Football Operations (thousands) .. 15 Table 4: Total Fiscal Impacts – Packers and Lambeau Field Football Operations (thousands) ........ 15 Table 5: Results from Visitor Surveys ............................................................................................... 16 Table 6: Off-Site Visitor Spending – Per Visitor Party, Per Day ........................................................ 16 Table 7: Off-Site Visitor Spending in Brown County (thousands) ...................................................... 17 Table 8: Total Economic Impacts – Off-Site Visitor Spending at Training Camp and Games
(thousands) ................................................................................................................................ 17 Table 9: Total Fiscal Impacts – Training Camp and Games (thousands) .......................................... 18 Table 10: Atrium Attendance, Visitor Characteristics, and Spending ................................................ 19 Table 11: Atrium Visitor Spending (thousands) ................................................................................. 19 Table 12: Total Economic Impacts – Atrium (thousands) .................................................................. 20 Table 13: Total Fiscal Impacts – Atrium (thousands) ........................................................................ 20 Table 14: Pre- and Post-Expansion Impacts Comparison (in 2010 dollars) ...................................... 21 Table 15: Stadium Redevelopment Costs (thousands) ..................................................................... 22 Table 16: Labor Costs from Stadium Redevelopment ....................................................................... 23 Table 17: Lambeau Field Redevelopment Construction Impacts (thousands) .................................. 23 Table 18: Incremental Economic and Fiscal Impacts of Green Bay Packers and Lambeau Field
(thousands) ................................................................................................................................ 24 Table 19: Parcel Data for the Area Surrounding Lambeau Field, 2009 ............................................. 26 Table 20: Housing Units by Year Built and Proximity to Lambeau Field, 2000.................................. 26 Table 21: Residential and Commercial Parcels near Lambeau Field, 2009 ...................................... 28 Table 22: Select Businesses near Lambeau Field, 2008 .................................................................. 29 Table 23: Hotels in the Green Bay Area, 2009 .................................................................................. 32 Table 24: Surrounding Businesses – Satisfaction with Lambeau Field Redevelopment ................... 34 Table 25: Surrounding Businesses – Game/Event Days’ Impacts on Sales ..................................... 35 Table 26: Local Attractions – Satisfaction with Lambeau Field Redevelopment ............................... 40 Table 27: Hotels and Meetings Facilities –Satisfaction with Lambeau Field Redevelopment ........... 44 Table 28: Hotels and Meetings Facilities – Loss of Events to the Atrium .......................................... 45 Table 29: Hotels and Meetings Facilities – Visitation/Attendance Impact by Type of Lambeau Field
Event ......................................................................................................................................... 46 Table 30: Ticket Demand and Sales from Concerts at Selected NFL Stadiums ............................... 56 Table 31: Top Outdoor Stadium and Festival Sites by Ticket Sales, 2009 ........................................ 58 Table 32: 2009 Neutral-Site NCAA FBS Games ............................................................................... 60 Table 33: 2009 NCAA Conference Championship Games in NFL Stadiums .................................... 63 Table 34: 2009-10 NCAA Bowl Game Locations .............................................................................. 64 Table 35: High School Football Championships at NFL Stadiums .................................................... 66 Table 36: Fans’ Most Enjoyable Aspects of Training Camp .............................................................. 75 Table 37: Regular Season Pre-Game Activities ................................................................................ 76 Table 38: Packers Media Coverage .................................................................................................. 80
F
AECOM Project No. 18300 Page 4
Figures Figure 1: Average Sales per Business (thousands), 2008 ................................................................ 30 Figure 2: Surrounding Businesses – Type of Business ..................................................................... 33 Figure 3: Surrounding Businesses – Estimated Annual Sales .......................................................... 34 Figure 4: Surrounding Businesses – Composition of Customers ...................................................... 35 Figure 5: Surrounding Businesses – Redevelopment’s Impact on Business Investment .................. 36 Figure 6: Surrounding Businesses – Overall Satisfaction with Proximity to Redeveloped Stadium .. 37 Figure 7: Surrounding Businesses – Preferred Game Time .............................................................. 37 Figure 8: Local Attractions – Type of Business ................................................................................. 39 Figure 9: Local Attractions – Length of Operation ............................................................................. 40 Figure 10: Local Attractions – Changes in Composition of Clientele ................................................. 41 Figure 11: Local Attractions – Game/Event Days’ Impacts on Visitation and Attendance ................. 41 Figure 12: Local Attractions – Overall Satisfaction with Redevelopment .......................................... 42 Figure 13: Hotels and Meetings Facilities – Type of Business .......................................................... 43 Figure 14: Hotels and Meetings Facilities – Length of Operation ...................................................... 43 Figure 15: Hotels and Meetings Facilities – Composition of Customers ........................................... 45 Figure 16: Hotels and Meetings Facilities – Game/Event Days’ Impacts on Visitation and Attendance
.................................................................................................................................................. 46 Figure 17: Hotels and Meetings Facilities – Overall Satisfaction with Redevelopment ..................... 47 Figure 18: Business Attraction – Type of Business ........................................................................... 48 Figure 19: Business Attraction – Number of Employees ................................................................... 49 Figure 20: Business Attraction – Benefits from Redeveloped Lambeau ........................................... 49 Figure 21: Business Attraction – Specific Benefits Received ............................................................ 50 Figure 22: Business Attraction – Impact of Packers and Lambeau in Location Decision .................. 51
F
AECOM Project No. 18300 Page 5
General & Limiting Conditions
Every reasonable effort has been made to ensure that the data contained in this report are accurate as of
the date of this study; however, factors exist that are outside the control of AECOM and that may affect
the estimates and/or projections noted herein. This study is based on estimates, assumptions and other
information developed by AECOM from its independent research effort, general knowledge of the
industry, and information provided by and consultations with the client and the client's representatives. No
responsibility is assumed for inaccuracies in reporting by the client, the client's agent and representatives,
or any other data source used in preparing or presenting this study.
This report is based on information that was current as of September 2010 and AECOM has not
undertaken any update of its research effort since such date.
Because future events and circumstances, many of which are not known as of the date of this study, may
affect the estimates contained therein, no warranty or representation is made by AECOM that any of the
projected values or results contained in this study will actually be achieved.
Possession of this study does not carry with it the right of publication thereof or to use the name of
"AECOM" in any manner without first obtaining the prior written consent of AECOM. No abstracting,
excerpting or summarization of this study may be made without first obtaining the prior written consent of
AECOM. Further, AECOM has served solely in the capacity of consultant and has not rendered any
expert opinions. This report is not to be used in conjunction with any public or private offering of
securities, debt, equity, or other similar purpose where it may be relied upon to any degree by any person
other than the client, nor is any third party entitled to rely upon this report, without first obtaining the prior
written consent of AECOM. Any changes made to this study, or any use of the study not specifically
prescribed under agreement between the parties or otherwise expressly approved by AECOM, shall be at
the sole risk of the party making such changes or adopting such use.
This study is qualified in its entirety by, and should be considered in light of, these limitations, conditions
and considerations.
F
AECOM Project No. 18300 Page 6
I. Introduction and Executive Summary Introduction AECOM was retained by the Green Bay/Brown County Professional Football Stadium District to analyze
the economic impact of the Packers and the redeveloped Lambeau Field to Brown County, Wisconsin.
Major tasks of this study included identifying and quantifying the following:
• The economic impacts of the Packers’ training camp and home games, and Lambeau Field,
• The impacts attributable to the redevelopment of Lambeau Field,
• The impact of the redeveloped stadium on:
o Surrounding property values,
o Surrounding businesses,
o Local attractions,
o Business attraction, and
o Local entertainment and meetings facilities.
• The potential for Lambeau Field to host other types of events,
• The need for future capital improvements that would generate impacts, and
• The value of earned media that is generated by the Packers and Lambeau Field, and other
community-based impacts.
Executive Summary The following briefly summarizes major estimates, analyses, and conclusions that appear in our full
report.
Estimated Incremental Economic and Fiscal Impacts of the Packers and Redeveloped Lambeau Field We have estimated the economic and fiscal impacts associated with the operations of the Packers and
Lambeau Field for 2009 (including training camp, preseason and regular-season games, and Atrium
events), as well as the impacts generated by the redevelopment construction project. Also, the Packers
had previously commissioned a study to estimate their impacts in 2000. The incremental impacts – from
the construction of the redeveloped stadium and the increased impacts from 2009 compared to 2000 –
are summarized below.
F
AECOM Project No. 18300 Page 7
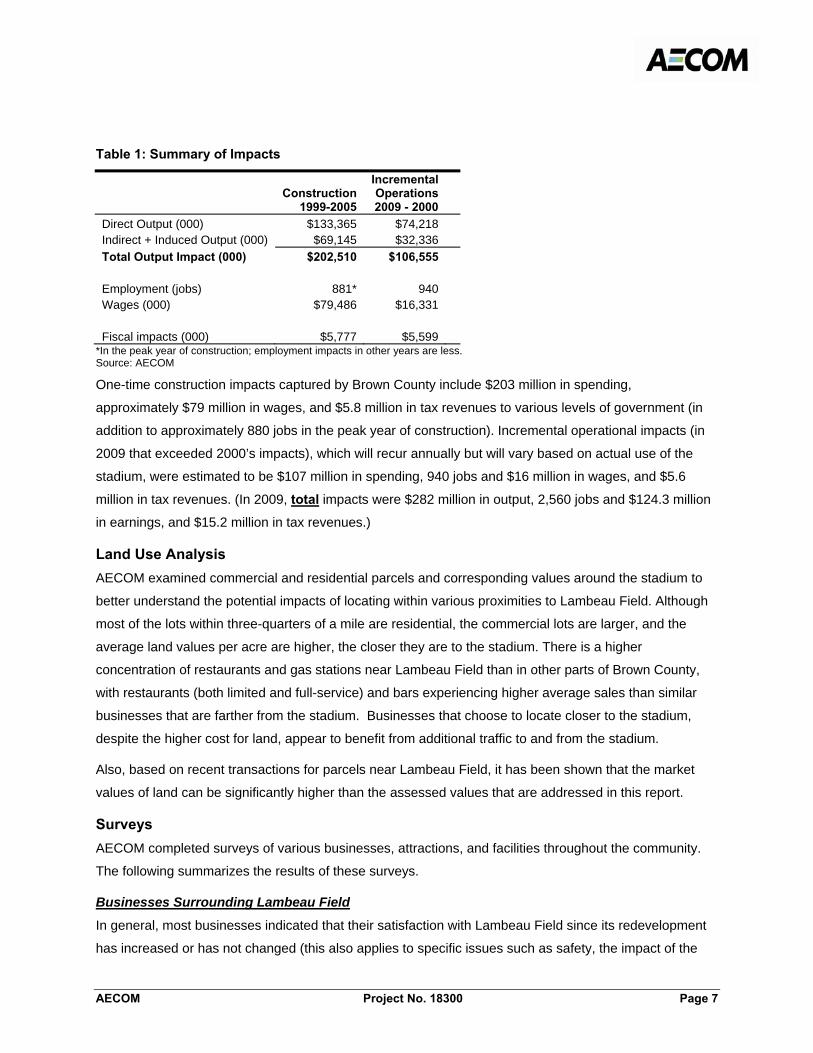
Table 1: Summary of Impacts
Construction1999-2005
Incremental Operations2009 - 2000
Direct Output (000) $133,365 $74,218 Indirect + Induced Output (000) $69,145 $32,336 Total Output Impact (000) $202,510 $106,555
Employment (jobs) 881* 940 Wages (000) $79,486 $16,331
Fiscal impacts (000) $5,777 $5,599
*In the peak year of construction; employment impacts in other years are less. Source: AECOM
One-time construction impacts captured by Brown County include $203 million in spending,
approximately $79 million in wages, and $5.8 million in tax revenues to various levels of government (in
addition to approximately 880 jobs in the peak year of construction). Incremental operational impacts (in
2009 that exceeded 2000’s impacts), which will recur annually but will vary based on actual use of the
stadium, were estimated to be $107 million in spending, 940 jobs and $16 million in wages, and $5.6
million in tax revenues. (In 2009, total impacts were $282 million in output, 2,560 jobs and $124.3 million
in earnings, and $15.2 million in tax revenues.)
Land Use Analysis AECOM examined commercial and residential parcels and corresponding values around the stadium to
better understand the potential impacts of locating within various proximities to Lambeau Field. Although
most of the lots within three-quarters of a mile are residential, the commercial lots are larger, and the
average land values per acre are higher, the closer they are to the stadium. There is a higher
concentration of restaurants and gas stations near Lambeau Field than in other parts of Brown County,
with restaurants (both limited and full-service) and bars experiencing higher average sales than similar
businesses that are farther from the stadium. Businesses that choose to locate closer to the stadium,
despite the higher cost for land, appear to benefit from additional traffic to and from the stadium.
Also, based on recent transactions for parcels near Lambeau Field, it has been shown that the market
values of land can be significantly higher than the assessed values that are addressed in this report.
Surveys AECOM completed surveys of various businesses, attractions, and facilities throughout the community.
The following summarizes the results of these surveys.
Businesses Surrounding Lambeau Field
In general, most businesses indicated that their satisfaction with Lambeau Field since its redevelopment
has increased or has not changed (this also applies to specific issues such as safety, the impact of the
F
AECOM Project No. 18300 Page 8
stadium on their sales, and the ability of customers to access the business). Many businesses have
experienced increased sales on Lambeau Field game/event days, and many have expanded or
renovated their business as a result of the stadium redevelopment. However, it was noted that the
redeveloped stadium now captures some of the spending that formerly took place off-site.
Local Attractions
In general, most survey respondents indicated that they are satisfied with the redevelopment of Lambeau
Field, or have experienced no change in their satisfaction since the redevelopment. This also applies to
its impact on attendance and sales. The one exception to respondents’ satisfaction is their ability to book
events, as the Atrium now hosts many events that were formerly held at other local facilities.
Local Hotels and Meetings Facilities
According to hoteliers and meetings facilities that responded to the survey, the greatest satisfaction
related to the redeveloped stadium’s impact on event/game day and -weekend visitation, as well as
increased room-night demand. However, room-night demand was also cited as one of the main
characteristics that respondents were least satisfied with, in addition to their ability to book events.
However, when asked to quantify the number of events that hotels and meetings facilities have lost to the
Atrium, the most common responses were no more than two events, indicating that many Atrium events
are in fact new to Green Bay and Brown County.
Business Growth, Attraction, Retention, and Marketing
A separate survey also addressed the role that the Packers and Lambeau Field play in business
attraction, retention, and local marketing efforts. Seventy-five percent of respondents indicated that the
benefits they receive from the presence of the team and stadium have increased since the redevelopment
(in the form of increased sales, improved quality of life, and use of the team or stadium for marketing,
entertainment, and other similar purposes). The remaining 25 percent indicated that their benefits have
decreased significantly. In addition, 84 percent of respondents indicated that the presence of the team
and stadium were a minor or significant positive factor in deciding to locate their business in Brown
County, and none considered it to be a negative factor. In terms of marketing, public officials responded
that the Packers are the area’s top asset and are responsible for creating the area’s brand and image.
Other Potential Events for Economic Impacts
In addition to meetings, exhibitions, and other similar events that are held in facilities similar to the Atrium,
other major stadiums often host events that use the playing field. However, the number and type of these
events can be affected by a wide range of variables, such as climate, facility design and technology,
ownership/management, the local market, and others. These events can include concerts (a limited
number of stadium acts are generally available), college football games (particularly neutral-site regular-
season games), high school football games (which may generate more limited impacts), and other sports
and entertainment events.
F
AECOM Project No. 18300 Page 9
An increase in training camp and Atrium event attendance would create additional impacts to Brown
County, as 82 percent of training camp attendees and 60 percent of Atrium event attendees in 2009 were
non-local. However, the scale of additional impacts from an expansion of Lambeau Field for additional
game-day capacity would likely be the greatest, as demand clearly exists for additional seating and this
would bring the highest number of visitors to Brown County. Other stadium events, such as concerts, high
school and college football, and other sports and entertainment events could also generate significant
impacts, which would all be “new” to the County since these events are not currently being held locally.
Capital Improvements for Additional Impacts
Across the NFL, teams and facilities are planning and implementing major capital improvements in order
to remain competitive and generate revenues; this includes both in-stadium improvements as well as new
developments and amenities on surrounding land. From interviews with industry professionals, Lambeau
Field appears adequate to host typical and potential stadium events with the exception of professional
soccer, due to its small playing surface.
Aside from the size of the field, two other areas stand out as needing improvements that could generate
additional economic impacts. First, demand for Packers tickets clearly exceeds supply, and due to the
high share of non-local attendees of Packers games (more than 85 percent), an increase in the stadium’s
seating capacity would lead to greater impacts. Also, the fact that most of Lambeau Field’s premium
seating is located behind inoperable windows essentially makes the seats unusable for events such as
concerts, which limits the profitability and viability of an event for a promoter. With a reduced seating
capacity and the loss of high-priced tickets, an event’s ability to generate sufficient revenue is decreased.
Estimated Value of Earned Media
Measuring the impact or value of media coverage is difficult to do, and generally inexact. However, the
Packers monitor their coverage on television network and cable outlets, as well as radio, on weekdays.
During the 2009-10 NFL season, the Packers received an estimated $14.2 million worth of media
coverage across the country (the value is based on advertising rates for an equivalent amount of time)
that reached more than 271 million people. (These values are clearly conservative since they only include
TV and radio, and do not measure coverage on weekends.)
Other Community Impacts
In addition to the impacts attracted to Brown County based on the presence of the Packers and Lambeau
Field, the team also makes direct contributions throughout the community in various ways. According to
the team, the Packers had a “charity impact” of more than $4 million in 2008. The team’s community
involvement included personal appearances, donations of signed memorabilia, cash donations, volunteer
time, organizing fundraising events, grants from the Green Bay Packers Foundation and individual
players’ foundations, and participating in other outreach programs through various community
organizations and the NFL.

F
AECOM Project No. 18300 Page 10
II. Economic Impact Approach This economic impact analysis evaluates the share of economic activity within Brown County, Wisconsin
attributable to the operations of the Green Bay Packers and Lambeau Field, as well as the redevelopment
of Lambeau Field. We also focus on the estimated impacts created by the team and facility before
Lambeau Field’s redevelopment, and the resulting incremental post-redevelopment impacts.
Methodology This section presents the methodology for evaluating total economic impacts to Brown County. A general
explanation of economic impacts and description of the components of economic impact are provided,
followed by a description of the economic impact multipliers used for this study and other key
assumptions. AECOM then describes the economic impact approaches used for team and stadium
operations as well as the separation of pre-redevelopment impacts and post- redevelopment impacts.
Overview Economic impacts can be described as the sum of economic activity within a defined geographic region
resulting from an initial change in the economy. This initial change spurs a series of subsequent indirect
and induced activities as a result of interconnected economic relationships.
Economic impacts only consider activity that would not have taken place in Brown County but for the
presence of the team and stadium. For example, only operational and construction spending on local
firms and spending by non-local residents are considered to generate impacts, rather than payments to
non-local businesses and spending in Brown County by Brown County residents. This approach, while
standard in estimating economic impacts, is likely conservative for a market such as Brown County in that
the Packers are such an important part of the local sports and entertainment scene; without the Packers,
it is likely that some of the spending related to the team by local residents would leave the market and be
spent on items outside of Brown County. Nevertheless, no spending by local residents is included in this
analysis.
Economic impact is composed of:
• Direct Impacts: Direct impacts represent the initial change in an economy attributed to the
development under consideration. Direct impacts are measured in terms of direct output,
earnings, and employment.
• Indirect and Induced Impacts (commonly referred to as the “multiplier effect”):
o Indirect Impacts: Additional output, earnings, and employment generated as a result of the
purchases in the industries which supply goods and services to the development under
consideration.
F
AECOM Project No. 18300 Page 11
o Induced Impacts: Additional output, earnings, and employment generated as a result of
household purchases by employees.
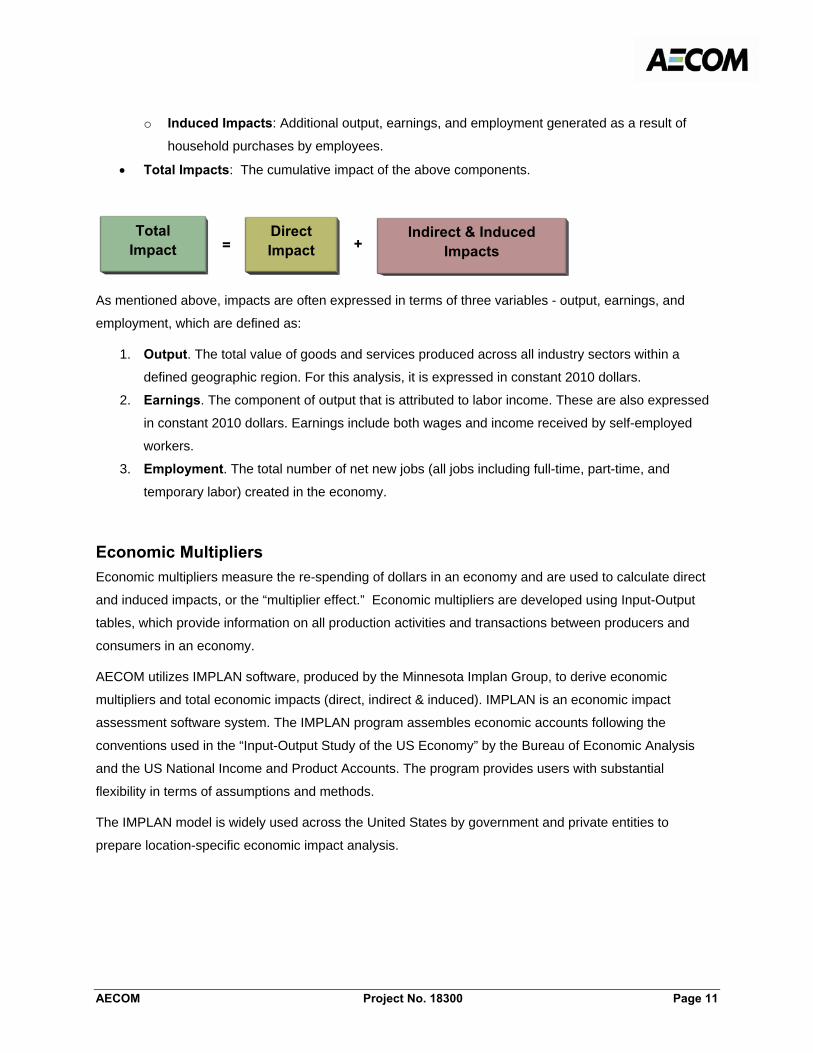
• Total Impacts: The cumulative impact of the above components.
As mentioned above, impacts are often expressed in terms of three variables - output, earnings, and
employment, which are defined as:
1. Output. The total value of goods and services produced across all industry sectors within a
defined geographic region. For this analysis, it is expressed in constant 2010 dollars.
2. Earnings. The component of output that is attributed to labor income. These are also expressed
in constant 2010 dollars. Earnings include both wages and income received by self-employed
workers.
3. Employment. The total number of net new jobs (all jobs including full-time, part-time, and
temporary labor) created in the economy.
Economic Multipliers Economic multipliers measure the re-spending of dollars in an economy and are used to calculate direct
and induced impacts, or the “multiplier effect.” Economic multipliers are developed using Input-Output
tables, which provide information on all production activities and transactions between producers and
consumers in an economy.
AECOM utilizes IMPLAN software, produced by the Minnesota Implan Group, to derive economic
multipliers and total economic impacts (direct, indirect & induced). IMPLAN is an economic impact
assessment software system. The IMPLAN program assembles economic accounts following the
conventions used in the “Input-Output Study of the US Economy” by the Bureau of Economic Analysis
and the US National Income and Product Accounts. The program provides users with substantial
flexibility in terms of assumptions and methods.
The IMPLAN model is widely used across the United States by government and private entities to
prepare location-specific economic impact analysis.
Indirect & Induced Impacts
Direct Impact
Total Impact = +
F
AECOM Project No. 18300 Page 12
Analysis Framework For each new economic activity resulting from the new development, direct impacts are determined first
and, using IMPLAN, multipliers are then applied to determine indirect, induced, and the resulting total
economic impacts.
There are a number of alternative techniques in approaching impact analysis. The preferred approach is
termed the “expenditure approach,” also known as the “analysis-by-parts” approach. Here we use the
operating expenditures of each program element as the source of primary input. These “purchases” of
goods, services and labor are then regionally adjusted to derive direct impacts, and appropriate
multipliers are applied to provide indirect, induced and total impacts. This method allows for a greater
level of detail for the particular program element analyzed. The alternative to this is the ”revenue
approach,” which instead of using operating expenditures uses program revenues as the input, and we
apply broader industry multipliers to derive total impacts.
Given the fact that detailed expense data is available for the stadium component, the “analysis-by-parts”
method is used to estimate the economic impact of stadium operations, and the revenue approach is
used to estimate the economic impacts resulting from all other developments.
Derivation of the direct impacts depends on the nature of the activity under consideration and the
economic approach taken. The revenue approach is used to calculate the economic impacts from all
other sources including stadium visitors’ offsite spending. Under the revenue approach, direct impacts are
generated from either sales revenue or employment and employment to output ratios.
Once AECOM determined the direct, indirect, and induced economic impacts, we compared like parts to
the 2000 Impact Study completed by another firm. For comparison, we inflated the 2000 estimates to
2010 dollars using the US Consumer Price Index. We then subtracted the 2000 estimate from our 2010
estimate, in order to arrive at the net new impacts resulting from stadium redevelopment. While this
approach can highlight the general incremental level of benefits generated, it should be noted that there
are likely additional impact drivers that are also responsible for the increase. Also, some “noise” in the
2000 and 2009 estimates make a completely apples-to-apples comparison difficult, as 2000’s impacts
were likely increased by the recent Super Bowl victory and the rising popularity of marquee players, while
2009’s impacts were likely hurt by the current economic conditions that have slowed tourism and
associated spending. As a result, were 2000 and 2009 more similar to “typical” years, the incremental
impacts between the two years would likely be greater than those estimated in this report.
Expenditure Approach In the expenditure approach, the purchases of goods and services (operating expenditures) are used to
calculate economic impacts, instead of total revenues. Using operating expenditures instead of total

F
AECOM Project No. 18300 Page 13
stadium revenues accounts for the actual dollars spent in the local economy and disregards stadium
profits and other items that may often be invested elsewhere. Though the approach provides conservative
results, it allows for a more detailed analysis to determine “net” impacts to the local economy.
The directly purchased goods and services (including labor) are considered the direct impact in output in
the local economy resulting from stadium operations. Total direct impacts are then adjusted by applying
appropriate factors to account for production and distribution cost components (for manufactured items)
and direct expenditures made within the County.
Next, economic multipliers are applied to the adjusted purchases. Using the expenditure approach results
in the induced and indirect impacts to the local economy. The direct impacts are then added to the
indirect and induced impacts to obtain the total economic impacts.
Revenue Approach The revenue approach is used to calculate the economic impacts from all other sources, including
stadium visitors’ offsite spending and the impacts of visitation to the Atrium. Under the revenue approach,
direct impacts are the net new total output/revenues generated within the local economy. While the
revenue approach could be derived from a base estimate of new employment creation, AECOM uses
estimated sales revenue to derive impact estimates using this method. For the retail and other off-site
spending, sales revenues are used as direct output impacts. Total sales are adjusted to account for only
the sales amount that is new in the County. Then, using these revenues as the direct output, the IMPLAN
model estimates the direct employment and earnings for each element based on regional data. Economic
multipliers are applied to the direct impacts to produce total economic impacts from each activity.
F
AECOM Project No. 18300 Page 14
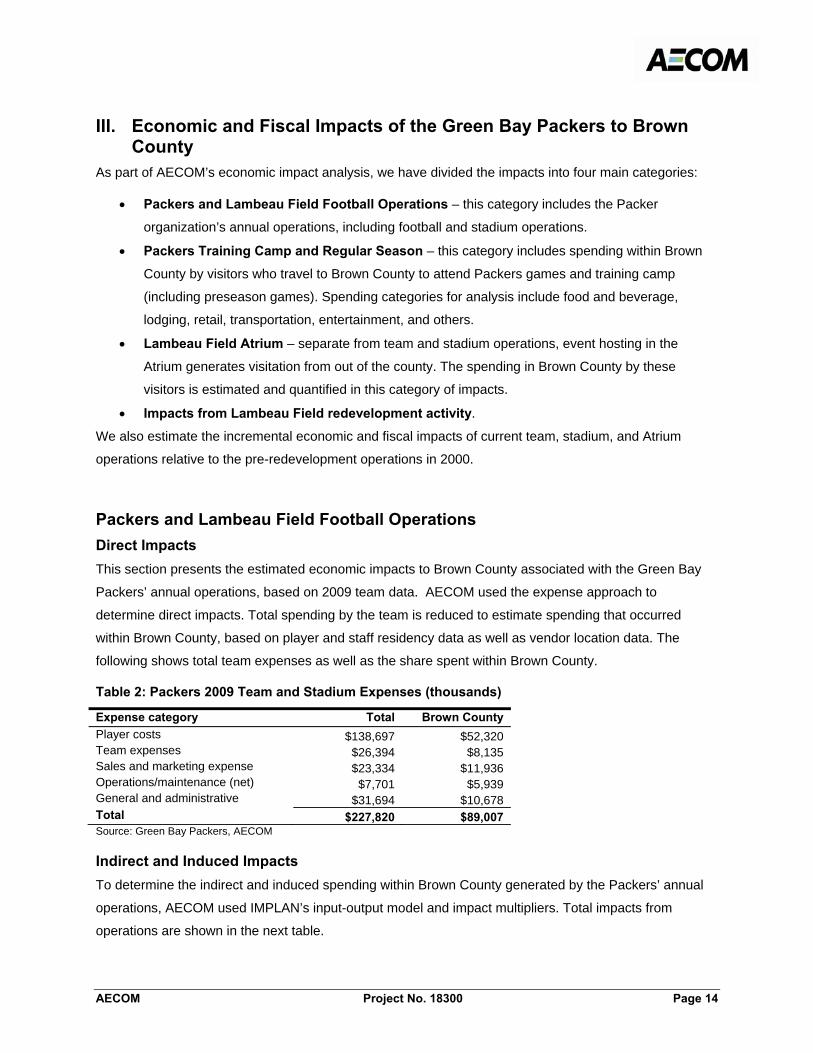
III. Economic and Fiscal Impacts of the Green Bay Packers to Brown County
As part of AECOM’s economic impact analysis, we have divided the impacts into four main categories:
• Packers and Lambeau Field Football Operations – this category includes the Packer
organization’s annual operations, including football and stadium operations.
• Packers Training Camp and Regular Season – this category includes spending within Brown
County by visitors who travel to Brown County to attend Packers games and training camp
(including preseason games). Spending categories for analysis include food and beverage,
lodging, retail, transportation, entertainment, and others.
• Lambeau Field Atrium – separate from team and stadium operations, event hosting in the
Atrium generates visitation from out of the county. The spending in Brown County by these
visitors is estimated and quantified in this category of impacts.
• Impacts from Lambeau Field redevelopment activity.
We also estimate the incremental economic and fiscal impacts of current team, stadium, and Atrium
operations relative to the pre-redevelopment operations in 2000.
Packers and Lambeau Field Football Operations Direct Impacts This section presents the estimated economic impacts to Brown County associated with the Green Bay
Packers’ annual operations, based on 2009 team data. AECOM used the expense approach to
determine direct impacts. Total spending by the team is reduced to estimate spending that occurred
within Brown County, based on player and staff residency data as well as vendor location data. The
following shows total team expenses as well as the share spent within Brown County.
Table 2: Packers 2009 Team and Stadium Expenses (thousands)
Expense category Total Brown CountyPlayer costs $138,697 $52,320 Team expenses $26,394 $8,135 Sales and marketing expense $23,334 $11,936 Operations/maintenance (net) $7,701 $5,939 General and administrative $31,694 $10,678 Total $227,820 $89,007 Source: Green Bay Packers, AECOM
Indirect and Induced Impacts To determine the indirect and induced spending within Brown County generated by the Packers’ annual
operations, AECOM used IMPLAN’s input-output model and impact multipliers. Total impacts from
operations are shown in the next table.
F
AECOM Project No. 18300 Page 15
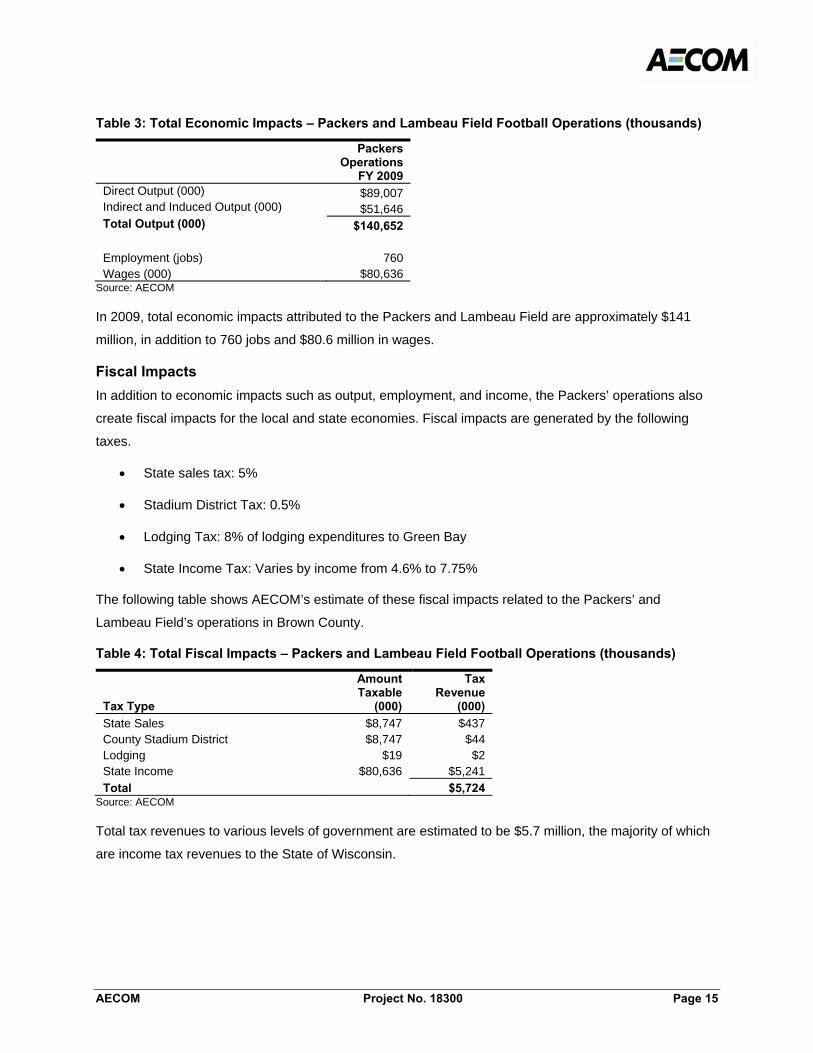
Table 3: Total Economic Impacts – Packers and Lambeau Field Football Operations (thousands)
PackersOperations
FY 2009 Direct Output (000) $89,007 Indirect and Induced Output (000) $51,646 Total Output (000) $140,652
Employment (jobs) 760 Wages (000) $80,636
Source: AECOM
In 2009, total economic impacts attributed to the Packers and Lambeau Field are approximately $141
million, in addition to 760 jobs and $80.6 million in wages.
Fiscal Impacts In addition to economic impacts such as output, employment, and income, the Packers’ operations also
create fiscal impacts for the local and state economies. Fiscal impacts are generated by the following
taxes.
• State sales tax: 5%
• Stadium District Tax: 0.5%
• Lodging Tax: 8% of lodging expenditures to Green Bay
• State Income Tax: Varies by income from 4.6% to 7.75%
The following table shows AECOM’s estimate of these fiscal impacts related to the Packers’ and
Lambeau Field’s operations in Brown County.
Table 4: Total Fiscal Impacts – Packers and Lambeau Field Football Operations (thousands)
Tax Type
Amount Taxable
(000)
Tax Revenue
(000) State Sales $8,747 $437 County Stadium District $8,747 $44 Lodging $19 $2 State Income $80,636 $5,241 Total $5,724
Source: AECOM
Total tax revenues to various levels of government are estimated to be $5.7 million, the majority of which
are income tax revenues to the State of Wisconsin.
F
AECOM Project No. 18300 Page 16
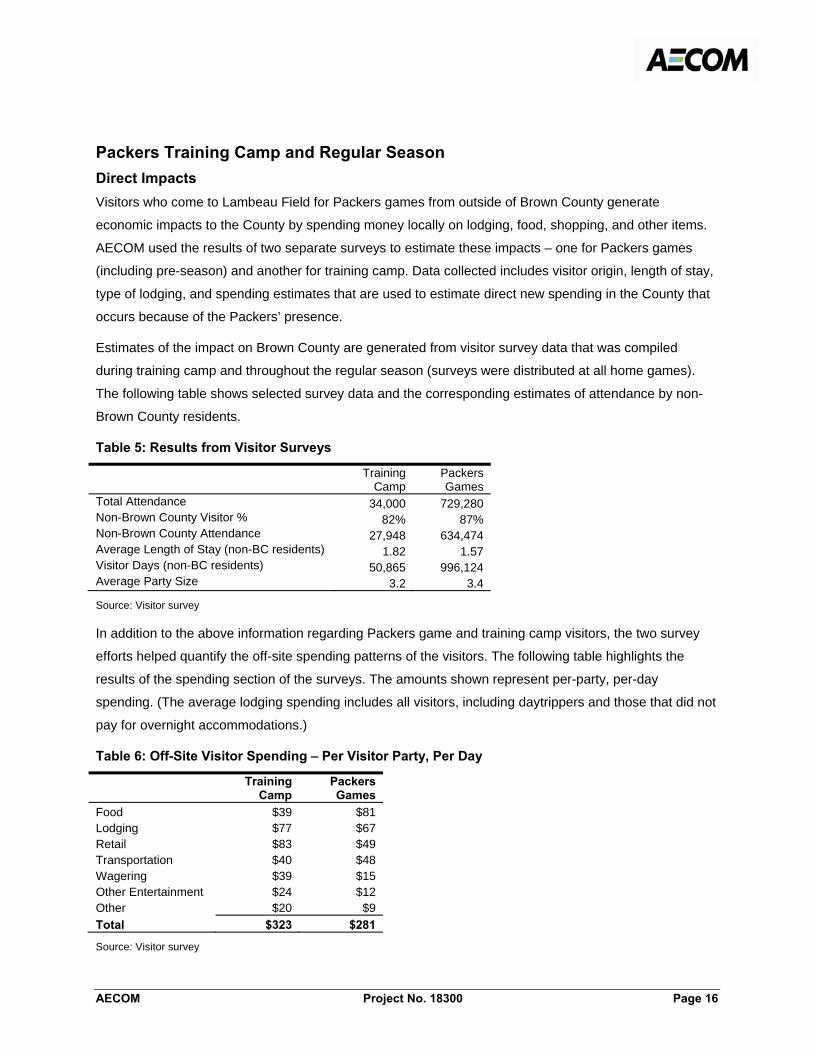
Packers Training Camp and Regular Season Direct Impacts Visitors who come to Lambeau Field for Packers games from outside of Brown County generate
economic impacts to the County by spending money locally on lodging, food, shopping, and other items.
AECOM used the results of two separate surveys to estimate these impacts – one for Packers games
(including pre-season) and another for training camp. Data collected includes visitor origin, length of stay,
type of lodging, and spending estimates that are used to estimate direct new spending in the County that
occurs because of the Packers’ presence.
Estimates of the impact on Brown County are generated from visitor survey data that was compiled
during training camp and throughout the regular season (surveys were distributed at all home games).
The following table shows selected survey data and the corresponding estimates of attendance by non-
Brown County residents.
Table 5: Results from Visitor Surveys
Training Camp
Packers Games
Total Attendance 34,000 729,280 Non-Brown County Visitor % 82% 87% Non-Brown County Attendance 27,948 634,474 Average Length of Stay (non-BC residents) 1.82 1.57 Visitor Days (non-BC residents) 50,865 996,124 Average Party Size 3.2 3.4
Source: Visitor survey
In addition to the above information regarding Packers game and training camp visitors, the two survey
efforts helped quantify the off-site spending patterns of the visitors. The following table highlights the
results of the spending section of the surveys. The amounts shown represent per-party, per-day
spending. (The average lodging spending includes all visitors, including daytrippers and those that did not
pay for overnight accommodations.)
Table 6: Off-Site Visitor Spending – Per Visitor Party, Per Day
Training Camp
PackersGames
Food $39 $81 Lodging $77 $67 Retail $83 $49 Transportation $40 $48 Wagering $39 $15 Other Entertainment $24 $12 Other $20 $9 Total $323 $281
Source: Visitor survey
F
AECOM Project No. 18300 Page 17
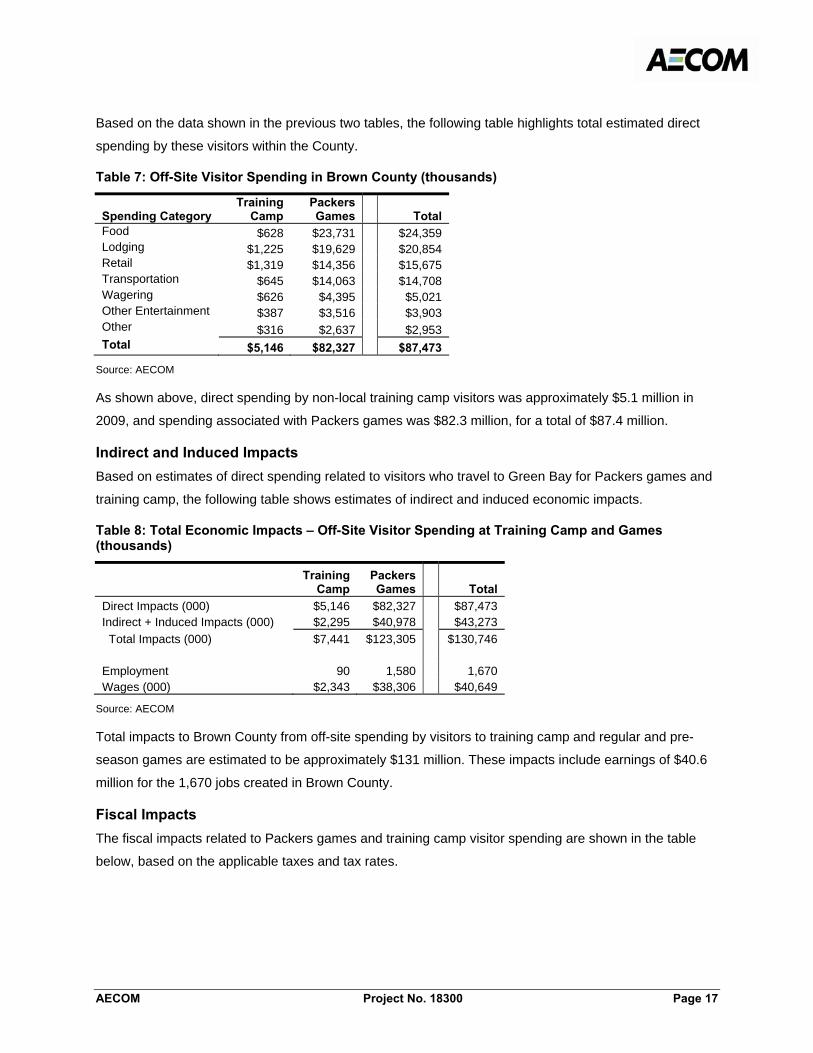
Based on the data shown in the previous two tables, the following table highlights total estimated direct
spending by these visitors within the County.
Table 7: Off-Site Visitor Spending in Brown County (thousands)
Spending Category
Training Camp
Packers Games Total
Food $628 $23,731 $24,359 Lodging $1,225 $19,629 $20,854 Retail $1,319 $14,356 $15,675 Transportation $645 $14,063 $14,708 Wagering $626 $4,395 $5,021 Other Entertainment $387 $3,516 $3,903 Other $316 $2,637 $2,953 Total $5,146 $82,327 $87,473
Source: AECOM
As shown above, direct spending by non-local training camp visitors was approximately $5.1 million in
2009, and spending associated with Packers games was $82.3 million, for a total of $87.4 million.
Indirect and Induced Impacts Based on estimates of direct spending related to visitors who travel to Green Bay for Packers games and
training camp, the following table shows estimates of indirect and induced economic impacts.
Table 8: Total Economic Impacts – Off-Site Visitor Spending at Training Camp and Games (thousands)
Training Camp
Packers Games Total
Direct Impacts (000) $5,146 $82,327 $87,473 Indirect + Induced Impacts (000) $2,295 $40,978 $43,273 Total Impacts (000) $7,441 $123,305 $130,746
Employment 90 1,580 1,670 Wages (000) $2,343 $38,306 $40,649
Source: AECOM
Total impacts to Brown County from off-site spending by visitors to training camp and regular and pre-
season games are estimated to be approximately $131 million. These impacts include earnings of $40.6
million for the 1,670 jobs created in Brown County.
Fiscal Impacts The fiscal impacts related to Packers games and training camp visitor spending are shown in the table
below, based on the applicable taxes and tax rates.

F
AECOM Project No. 18300 Page 18
Table 9: Total Fiscal Impacts – Training Camp and Games (thousands)
Tax Revenue (000) Training
Camp Packers Games Total
State Sales $242 $3,705 $3,947 County Stadium District $24 $371 $395 Lodging $98 $1,572 $1,670 State Income $152 $2,490 $2,642 Total Taxes $517 $8,138 $8,654
Source: AECOM
Total fiscal impacts (to various levels of government) were approximately $517,000 from visitors to
training camp, and $8.1 million by visitors to Packers games, for a total of approximately $8.7 million.
Lambeau Field Atrium Direct Impacts Similar to off-site spending estimates for visitors to Lambeau Field for Packers games, the Atrium draws
visitors for events who travel to Brown County from outside of the area, utilizing local restaurants, shops,
and hotels. The Packers provided data on Atrium events including the type of event and visitor origin.
AECOM then filtered total visitation estimates, removing Brown County residents from the analysis as
their spending is not considered new to the County. As previously described, only spending by non-Brown
County residents is considered in this analysis. While other surveys (in Section VII) indicate that much of
the Atrium’s events would not have otherwise been held in Brown County but for the presence of the
Atrium, we nevertheless do not include local attendees’ spending.
Once we estimated the number of visitors who traveled to Brown County, we used information from the
Greater Green Bay Convention and Visitors Bureau, as well as fan survey data, to estimate visitor
characteristics such as length of stay and spending amounts. The following table summarizes the
estimated characteristics of attendees to the Atrium.
F
AECOM Project No. 18300 Page 19
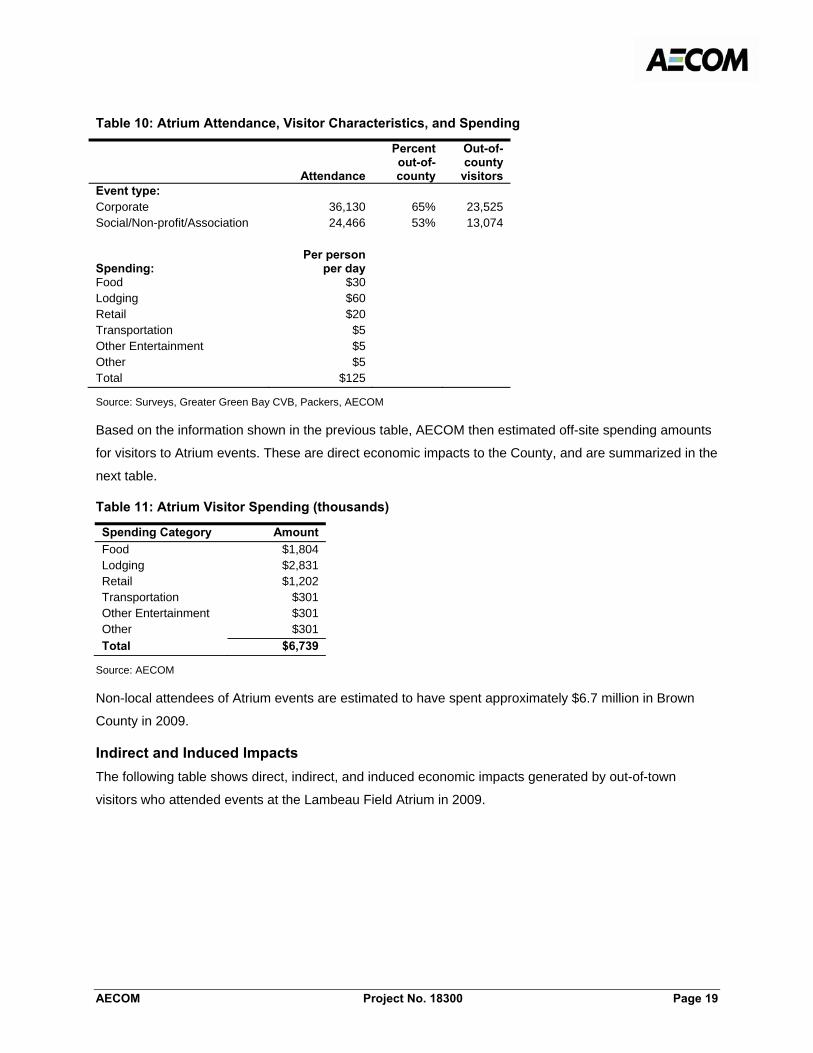
Table 10: Atrium Attendance, Visitor Characteristics, and Spending
Attendance
Percent out-of-county
Out-of-county
visitors Event type: Corporate 36,130 65% 23,525 Social/Non-profit/Association 24,466 53% 13,074
Spending: Per person
per day
Food $30 Lodging $60 Retail $20 Transportation $5 Other Entertainment $5 Other $5 Total $125
Source: Surveys, Greater Green Bay CVB, Packers, AECOM
Based on the information shown in the previous table, AECOM then estimated off-site spending amounts
for visitors to Atrium events. These are direct economic impacts to the County, and are summarized in the
next table.
Table 11: Atrium Visitor Spending (thousands)
Spending Category Amount Food $1,804 Lodging $2,831 Retail $1,202 Transportation $301 Other Entertainment $301 Other $301 Total $6,739
Source: AECOM
Non-local attendees of Atrium events are estimated to have spent approximately $6.7 million in Brown
County in 2009.
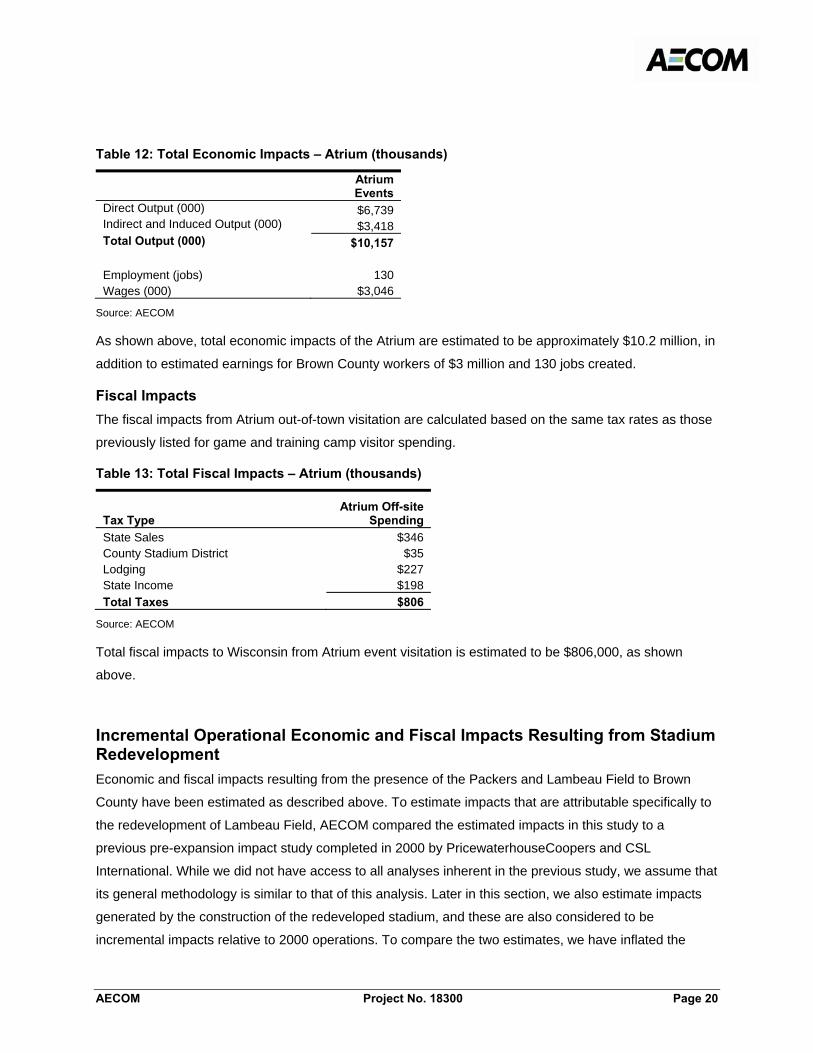
Indirect and Induced Impacts The following table shows direct, indirect, and induced economic impacts generated by out-of-town
visitors who attended events at the Lambeau Field Atrium in 2009.
F
AECOM Project No. 18300 Page 20
Table 12: Total Economic Impacts – Atrium (thousands)
Atrium Events
Direct Output (000) $6,739 Indirect and Induced Output (000) $3,418 Total Output (000) $10,157
Employment (jobs) 130 Wages (000) $3,046
Source: AECOM
As shown above, total economic impacts of the Atrium are estimated to be approximately $10.2 million, in
addition to estimated earnings for Brown County workers of $3 million and 130 jobs created.
Fiscal Impacts The fiscal impacts from Atrium out-of-town visitation are calculated based on the same tax rates as those
previously listed for game and training camp visitor spending.
Table 13: Total Fiscal Impacts – Atrium (thousands)
Tax Type Atrium Off-site
Spending State Sales $346 County Stadium District $35 Lodging $227 State Income $198 Total Taxes $806
Source: AECOM
Total fiscal impacts to Wisconsin from Atrium event visitation is estimated to be $806,000, as shown
above.
Incremental Operational Economic and Fiscal Impacts Resulting from Stadium Redevelopment Economic and fiscal impacts resulting from the presence of the Packers and Lambeau Field to Brown
County have been estimated as described above. To estimate impacts that are attributable specifically to
the redevelopment of Lambeau Field, AECOM compared the estimated impacts in this study to a
previous pre-expansion impact study completed in 2000 by PricewaterhouseCoopers and CSL
International. While we did not have access to all analyses inherent in the previous study, we assume that
its general methodology is similar to that of this analysis. Later in this section, we also estimate impacts
generated by the construction of the redeveloped stadium, and these are also considered to be
incremental impacts relative to 2000 operations. To compare the two estimates, we have inflated the
F
AECOM Project No. 18300 Page 21
impacts from both study efforts using the US Consumer Price Index to 2010 dollar amounts. This allows
for a comparison between amounts in consistent price levels.
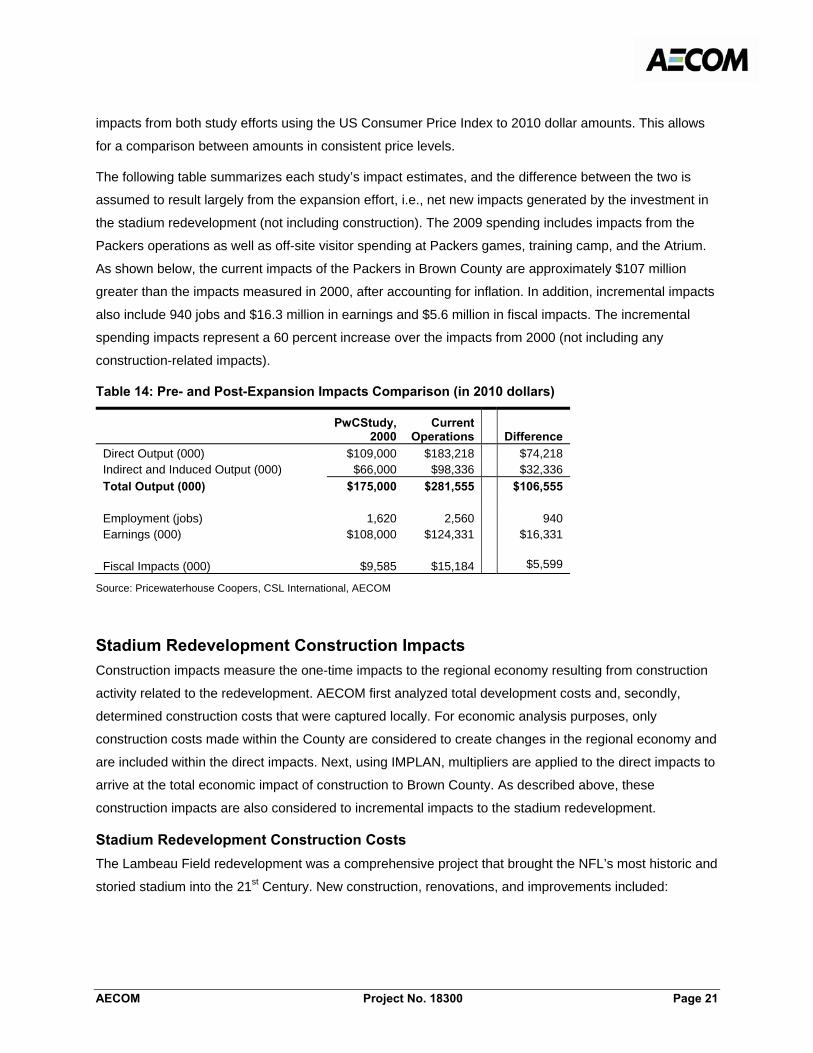
The following table summarizes each study’s impact estimates, and the difference between the two is
assumed to result largely from the expansion effort, i.e., net new impacts generated by the investment in
the stadium redevelopment (not including construction). The 2009 spending includes impacts from the
Packers operations as well as off-site visitor spending at Packers games, training camp, and the Atrium.
As shown below, the current impacts of the Packers in Brown County are approximately $107 million
greater than the impacts measured in 2000, after accounting for inflation. In addition, incremental impacts
also include 940 jobs and $16.3 million in earnings and $5.6 million in fiscal impacts. The incremental
spending impacts represent a 60 percent increase over the impacts from 2000 (not including any
construction-related impacts).
Table 14: Pre- and Post-Expansion Impacts Comparison (in 2010 dollars)
PwCStudy, 2000
Current Operations Difference
Direct Output (000) $109,000 $183,218 $74,218 Indirect and Induced Output (000) $66,000 $98,336 $32,336 Total Output (000) $175,000 $281,555 $106,555
Employment (jobs) 1,620 2,560 940 Earnings (000) $108,000 $124,331 $16,331
Fiscal Impacts (000) $9,585 $15,184 $5,599
Source: Pricewaterhouse Coopers, CSL International, AECOM
Stadium Redevelopment Construction Impacts Construction impacts measure the one-time impacts to the regional economy resulting from construction
activity related to the redevelopment. AECOM first analyzed total development costs and, secondly,
determined construction costs that were captured locally. For economic analysis purposes, only
construction costs made within the County are considered to create changes in the regional economy and
are included within the direct impacts. Next, using IMPLAN, multipliers are applied to the direct impacts to
arrive at the total economic impact of construction to Brown County. As described above, these
construction impacts are also considered to incremental impacts to the stadium redevelopment.
Stadium Redevelopment Construction Costs The Lambeau Field redevelopment was a comprehensive project that brought the NFL’s most historic and
storied stadium into the 21st Century. New construction, renovations, and improvements included:
F
AECOM Project No. 18300 Page 22
• The Lambeau Field Atrium – a 336,000-square foot, five-story, year-round events facility that
includes a 25,000-square foot Packers Hall of Fame, meeting/convention space, restaurants and
pubs, and a Packers Pro Shop.
• Expanded seating – an addition of more than 11,600 seats.
• Football facilities – including new home and visitors’ locker rooms, new and improved training
facilities, meeting rooms, an auditorium, dining room and lounge, and other facilities.
• Interior spaces – include a new upper concourse, wider existing concourses, improved
concessions and restrooms, and a club level for premium seat holders.
• Robert E. Harlan Plaza – which includes bronze statues of Curly Lambeau and Vince Lombardi.
• Scoreboards – new full-color LED video and score boards in the north and south end zones.
• Other improvements – including lighting and an improved press box.
The project began September 2000 with the approval of a half-cent sales tax increase in Brown County,
which jointly funded the redevelopment along with the City of Green Bay, the Packers, and the NFL. This
section estimates the various economic and fiscal impacts captured in Brown County from the
construction project, based on actual construction and spending data provided by the District and the
Hammes Company (the project developer), actual tax rates, and other estimates.
Impacts from Stadium Redevelopment Construction The redevelopment of the stadium represented a one-time economic activity that created additional
impacts to Brown County, based on spending on construction-related items such as labor and materials.
This spending that was captured by local firms and workers is considered to be an economic impact to
Brown County, and resulting tax revenues are the fiscal impacts. Because the redevelopment is a past
event, actual data related to the construction project is available, and this forms the basis of our estimates
of construction impacts.
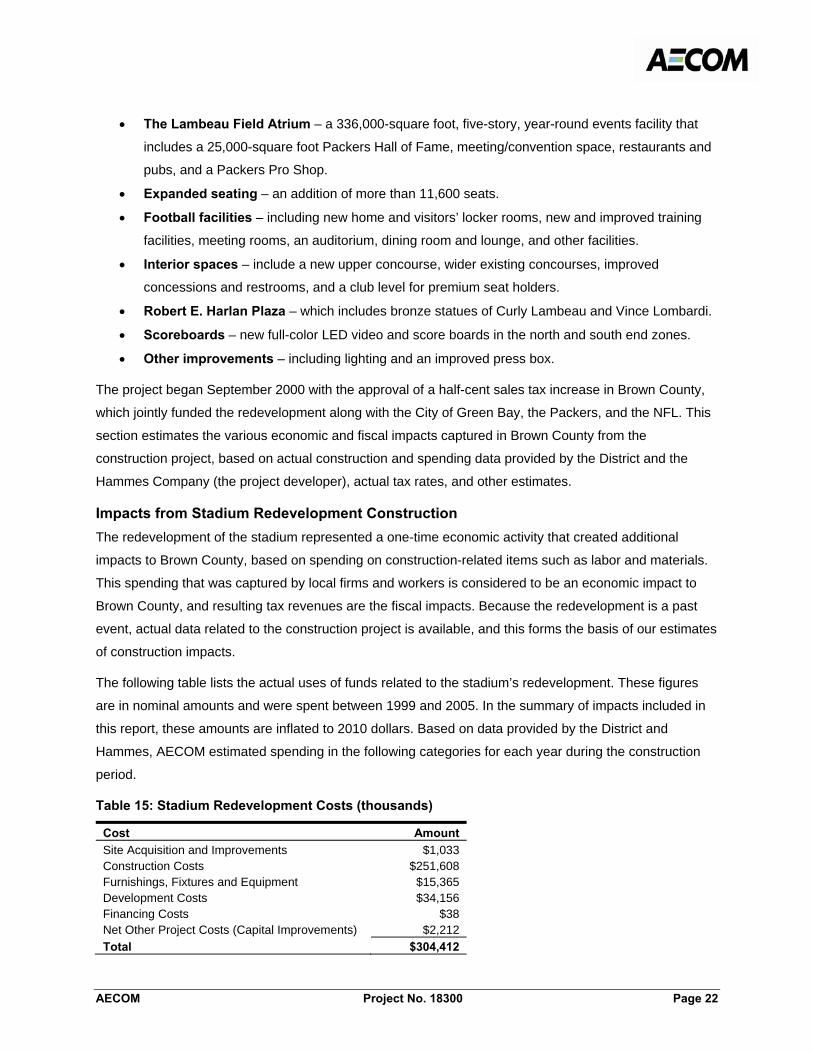
The following table lists the actual uses of funds related to the stadium’s redevelopment. These figures
are in nominal amounts and were spent between 1999 and 2005. In the summary of impacts included in
this report, these amounts are inflated to 2010 dollars. Based on data provided by the District and
Hammes, AECOM estimated spending in the following categories for each year during the construction
period.
Table 15: Stadium Redevelopment Costs (thousands)
Cost Amount Site Acquisition and Improvements $1,033 Construction Costs $251,608 Furnishings, Fixtures and Equipment $15,365 Development Costs $34,156 Financing Costs $38 Net Other Project Costs (Capital Improvements) $2,212 Total $304,412

F
AECOM Project No. 18300 Page 23
Source: GBBCPFSD, Hammes Co., AECOM
The following table summarizes the use of local labor, according to Hammes Co. construction documents.
Table 16: Labor Costs from Stadium Redevelopment
Spending on Brown County Firms 37.0% Hours by Brown County Workers 30.1%
Source: Hammes Co.
In addition to construction labor, AECOM also estimated local spending for each of the additional
spending categories. These assumptions are based on schedule of payments data from the Client, and
are shown below.
• Furniture, Fixtures, and Equipment: 62% within Brown County.
• Development Soft Costs: 29% within Brown County.
• Site Acquisition: 100% within Brown County.
• Financing Costs: 0% within Brown County.
Lambeau Field Expansion and Redevelopment Economic and Fiscal Impacts Summary The following table estimates economic impacts from the redevelopment of Lambeau Field from 1999 to
2005. These estimates are shown in 2010 dollars.
Table 17: Lambeau Field Redevelopment Construction Impacts (thousands)
1999 2000 2001 2002 2003 2004 2005 Total Output (2010 $, thousands) Direct $54 $2,449 $27,196 $71,330 $29,139 $3,120 $77 $133,365 Indirect + Induced $32 $1,448 $14,297 $36,720 $14,989 $1,619 $40 $69,145 Total Output Impact $87 $3,897 $41,493 $108,050 $44,127 $4,738 $118 $202,510
Employment (jobs) Direct 0.5 21.5 218.2 558.1 227.9 23.6 0.6 Indirect + Induced 0.3 14.1 128.2 323.0 132.1 14.1 0.4 Total Employment Impact 0.8 35.6 346.4 881.1 360.0 37.7 1.0
Wages (2010 $, thousands) Direct $33 $1,454 $11,880 $28,650 $11,650 $1,170 $31 $54,868 Indirect + Induced $11 $502 $5,099 $13,100 $5,322 $570 $14 $24,617 Total Wage Impact $44 $1,956 $16,979 $41,750 $16,972 $1,740 $45 $79,486
Fiscal impacts (2010 $, thousands) State Sales Tax $0.2 $10.6 $113.2 $294.9 $120.4 $12.9 $0.3 $552.7 County Stadium District $0.0 $1.1 $11.3 $29.5 $12.0 $1.3 $0.0 $55.3 Lodging $0.0 $0.0 $0.4 $1.1 $0.5 $0.0 $0.0 $2.1 State Income $2.8 $127.1 $1,103.6 $2,713.7 $1,103.2 $113.1 $2.9 $5,166.6 Total Fiscal Impact $3.1 $138.9 $1,228.6 $3,039.2 $1,236.1 $127.4 $3.3 $5,776.6
Source: AECOM
F
AECOM Project No. 18300 Page 24
The construction activity for the redevelopment effort generated over $202 million in new economic output
for Brown County over the construction period. This included roughly $80 million in wages, resulting in
more than 880 new jobs in the peak year of construction. In addition, total fiscal impacts were
approximately $5.8 million.
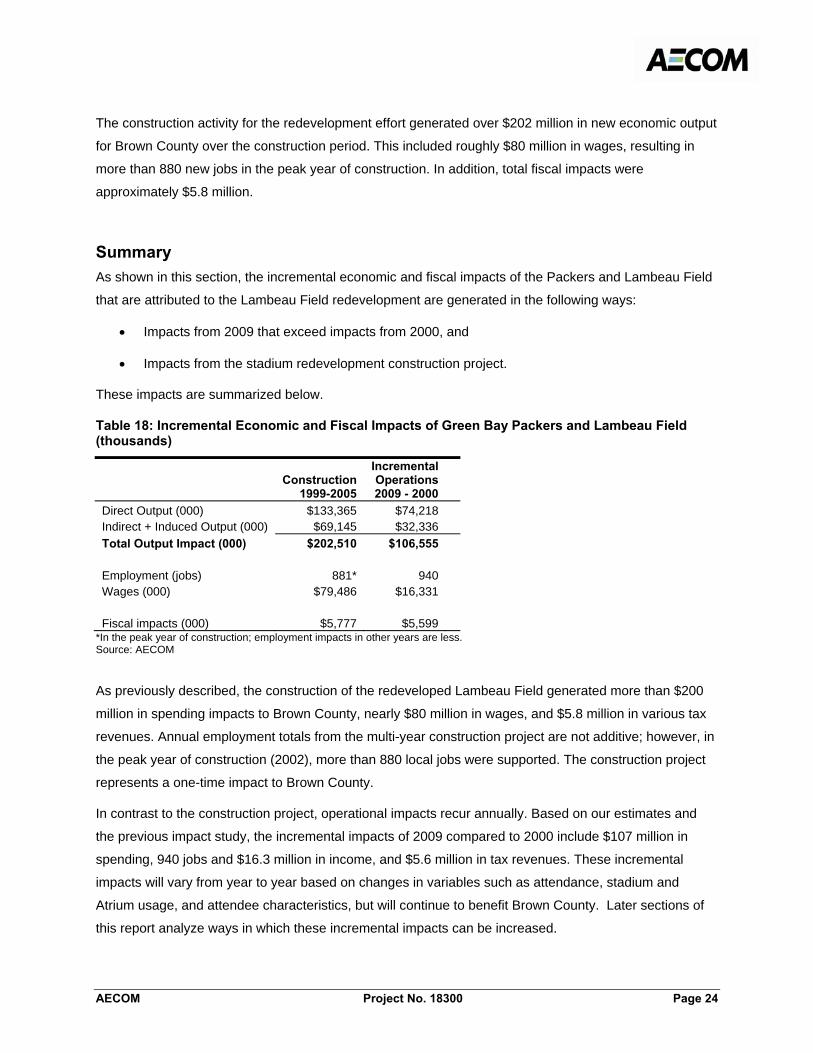
Summary As shown in this section, the incremental economic and fiscal impacts of the Packers and Lambeau Field
that are attributed to the Lambeau Field redevelopment are generated in the following ways:
• Impacts from 2009 that exceed impacts from 2000, and
• Impacts from the stadium redevelopment construction project.
These impacts are summarized below.
Table 18: Incremental Economic and Fiscal Impacts of Green Bay Packers and Lambeau Field (thousands)
Construction1999-2005
Incremental Operations2009 - 2000
Direct Output (000) $133,365 $74,218 Indirect + Induced Output (000) $69,145 $32,336 Total Output Impact (000) $202,510 $106,555
Employment (jobs) 881* 940 Wages (000) $79,486 $16,331
Fiscal impacts (000) $5,777 $5,599
*In the peak year of construction; employment impacts in other years are less. Source: AECOM
As previously described, the construction of the redeveloped Lambeau Field generated more than $200
million in spending impacts to Brown County, nearly $80 million in wages, and $5.8 million in various tax
revenues. Annual employment totals from the multi-year construction project are not additive; however, in
the peak year of construction (2002), more than 880 local jobs were supported. The construction project
represents a one-time impact to Brown County.
In contrast to the construction project, operational impacts recur annually. Based on our estimates and
the previous impact study, the incremental impacts of 2009 compared to 2000 include $107 million in
spending, 940 jobs and $16.3 million in income, and $5.6 million in tax revenues. These incremental
impacts will vary from year to year based on changes in variables such as attendance, stadium and
Atrium usage, and attendee characteristics, but will continue to benefit Brown County. Later sections of
this report analyze ways in which these incremental impacts can be increased.
F
AECOM Project No. 18300 Page 25
IV. Land Use Analysis AECOM used data from available sources to examine land use around the stadium. In selecting their
sites, businesses in Green Bay evaluate many factors including access to highways, location of nearest
competitor, and many others. Here, AECOM was interested in learning more about those businesses
located in the immediate vicinity of Lambeau Field to understand potential impacts related to the proximity
to Lambeau Field.
Land Use near Lambeau Field AECOM examined current parcel data from local assessors’ offices for the immediate area surrounding
Lambeau Field to better understand land use and value. There are more than 2,700 parcels within three-
quarters of a mile of the stadium located in Green Bay and Ashwaubenon. As is addressed later in this
section, the actual market values of many properties near the stadium are significantly higher than the
assessed values, based on recent transactions. While similar data for previous assessment values (pre-
renovation) was not available for a time-series analysis, we were able to derive the following information:
• According to the assessors’ office, these parcels encompass a total of 840.7 acres, valued at
approximately $101 million. This includes industrial, public, and other parcels that are not
analyzed in this section.
• The majority of the 2,704 parcels are residential lots located 0.5 to 0.75 miles from the stadium.
• The average lot size for commercial lots is higher as they get closer to the stadium, suggesting
that:
o Larger businesses could be attracted to proximity from the stadium,
o Businesses can be larger because they are benefitting from demand associated with
traffic to and from the stadium, and/or
o Within 0.25 miles, the average commercial lot size is 1.25 acres. The opposite is true for
residential parcels, as size is slightly larger as they move away from the stadium. This
could be because the original neighborhood within the immediate vicinity of the stadium
is older and has smaller parcels, compared to newer neighborhoods that may have
created larger lots for residential development.
• There is a much higher ratio of commercial to residential acres closer to the stadium. Within ¼
mile of the stadium, approximately 20 percent of the total land area is commercial. This falls to
about 7 percent in the next ¼ mile. This suggests that commercial development closer to the
stadium may not otherwise be in business or may not be in the Green Bay area were it not for the
existence of Lambeau Field.
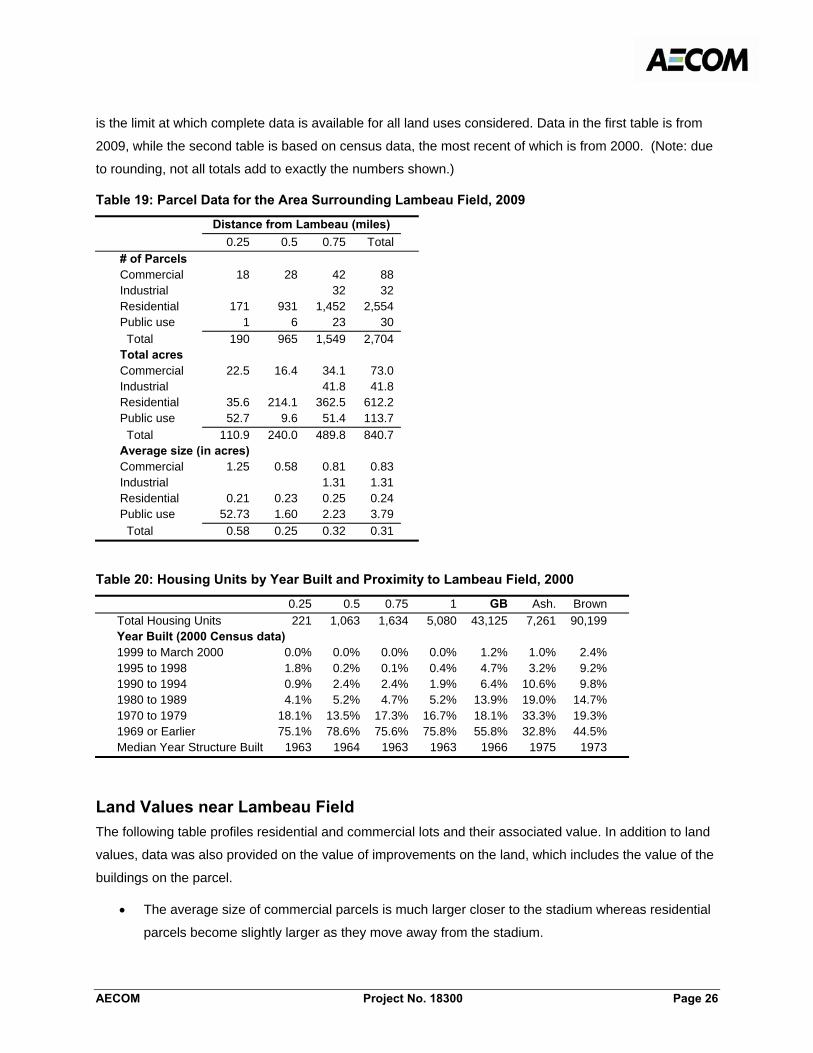
The following tables summarize characteristics of land uses near Lambeau Field. The following two tables
analyze parcels within one mile of Lambeau Field, and parcels within ¾ of a mile from the stadium, as this
F
AECOM Project No. 18300 Page 26
is the limit at which complete data is available for all land uses considered. Data in the first table is from
2009, while the second table is based on census data, the most recent of which is from 2000. (Note: due
to rounding, not all totals add to exactly the numbers shown.)
Table 19: Parcel Data for the Area Surrounding Lambeau Field, 2009
Distance from Lambeau (miles) 0.25 0.5 0.75 Total
# of Parcels Commercial 18 28 42 88 Industrial 32 32 Residential 171 931 1,452 2,554 Public use 1 6 23 30 Total 190 965 1,549 2,704 Total acres Commercial 22.5 16.4 34.1 73.0 Industrial 41.8 41.8 Residential 35.6 214.1 362.5 612.2 Public use 52.7 9.6 51.4 113.7 Total 110.9 240.0 489.8 840.7 Average size (in acres) Commercial 1.25 0.58 0.81 0.83 Industrial 1.31 1.31 Residential 0.21 0.23 0.25 0.24 Public use 52.73 1.60 2.23 3.79 Total 0.58 0.25 0.32 0.31
Table 20: Housing Units by Year Built and Proximity to Lambeau Field, 2000
0.25 0.5 0.75 1 GB Ash. Brown Total Housing Units 221 1,063 1,634 5,080 43,125 7,261 90,199 Year Built (2000 Census data) 1999 to March 2000 0.0% 0.0% 0.0% 0.0% 1.2% 1.0% 2.4% 1995 to 1998 1.8% 0.2% 0.1% 0.4% 4.7% 3.2% 9.2% 1990 to 1994 0.9% 2.4% 2.4% 1.9% 6.4% 10.6% 9.8% 1980 to 1989 4.1% 5.2% 4.7% 5.2% 13.9% 19.0% 14.7% 1970 to 1979 18.1% 13.5% 17.3% 16.7% 18.1% 33.3% 19.3% 1969 or Earlier 75.1% 78.6% 75.6% 75.8% 55.8% 32.8% 44.5% Median Year Structure Built 1963 1964 1963 1963 1966 1975 1973
Land Values near Lambeau Field The following table profiles residential and commercial lots and their associated value. In addition to land
values, data was also provided on the value of improvements on the land, which includes the value of the
buildings on the parcel.
• The average size of commercial parcels is much larger closer to the stadium whereas residential
parcels become slightly larger as they move away from the stadium.
F
AECOM Project No. 18300 Page 27
• The average value of commercial parcels is significantly higher closer in, with $406,000 in land
value and $425,000 in improvements per parcel. For residential parcels, there is less
differentiation by distance for both land value and improvements per parcel – a total of $114,000
for parcels within ¼ mile and $122,000 for residential parcels ½ to ¾ miles from the stadium.
To control for differences in parcel size, AECOM computed the average value of the land and
improvements per acre:
• The average land value per acre for commercial land is significantly higher closer to the stadium.
Within ¼ mile of the stadium, the average value per commercial acre is $325,000 compared to
$248,000 within ½ mile and $273,000 within ¾ mile. Residential land value per acre was slightly
lower in the ¼ mile ring than in the outer areas – $100,000 per acre compared to $115,000 and
$103,000 per acre. For commercial land, proximity to the stadium appears to have positively
impacted land values.
• The average value of improvements per acre for commercial is slightly lower closer to the
stadium, an average of $339,000 per acre within 0.25 miles. This may be due to the fact that
commercial parcels are larger (more parking than building, etc.) and more big-box style
development than more elaborate types of commercial building improvements. The average
value of improvements per acre on the residential parcels is much higher closer to the field than
those farther out ($448,000 compared to $385,000).

F
AECOM Project No. 18300 Page 28
Table 21: Residential and Commercial Parcels near Lambeau Field, 2009
Distance from Lambeau Field (miles)0.25 0.5 0.75
Commercial Total parcels 18 28 42 Average size (in acres) 1.25 0.58 0.81 Total land value $7,313,000 $4,060,000 $9,325,000 Average per parcel $406,000 $145,000 $222,000 Average per acre $325,000 $248,000 $273,000 Total improvement value $7,643,000 $6,091,000 $16,129,000 Average per parcel $425,000 $218,000 $384,000 Average per acre $339,000 $372,000 $473,000 Total land value + improvements $14,956,000 $10,151,000 $25,454,000 Average per parcel $831,000 $363,000 $606,000 Average per acre $664,000 $620,000 $746,000 Residential Total parcels 171 931 1,452 Average size (in acres) 0.21 0.23 0.25 Total land value $3,552,000 $24,543,000 $37,191,000 Average per parcel $21,000 $26,000 $26,000 Average per acre $100,000 $115,000 $103,000 Total improvement value $15,962,000 $94,801,000 $139,625,000 Average per parcel $93,000 $102,000 $96,000 Average per acre $448,000 $443,000 $385,000 Total land value + improvements $19,515,000 $119,344,000 $176,815,000 Average per parcel $114,000 $128,000 $122,000 Average per acre $548,000 $558,000 $488,000
Assessed vs. Market Value Over the past five years, the Packers have purchased 21 parcels near Lambeau Field totaling
approximately 28 acres. According to a report by the Green Bay Press-Gazette, which reviewed local
land records, the Packers have spent more than $27 million to acquire these parcels, which is estimated
to be approximately $10 million over the assessed value. This higher cost may be attributed in part to
speculation about future development; however, these transactions have shown that the true market
values of parcels, particularly surrounding Lambeau Field, are in many cases higher than the assessed
values.
Based on the analyses presented in this section that generally indicate the positive benefits of proximity
to the stadium, combined with the stadium’s draw of more than 750,000 people per year (for training
camp and regular-season games), it appears as though surrounding land could be leveraged for further
development that serves both visitors as well as local residents.
F
AECOM Project No. 18300 Page 29
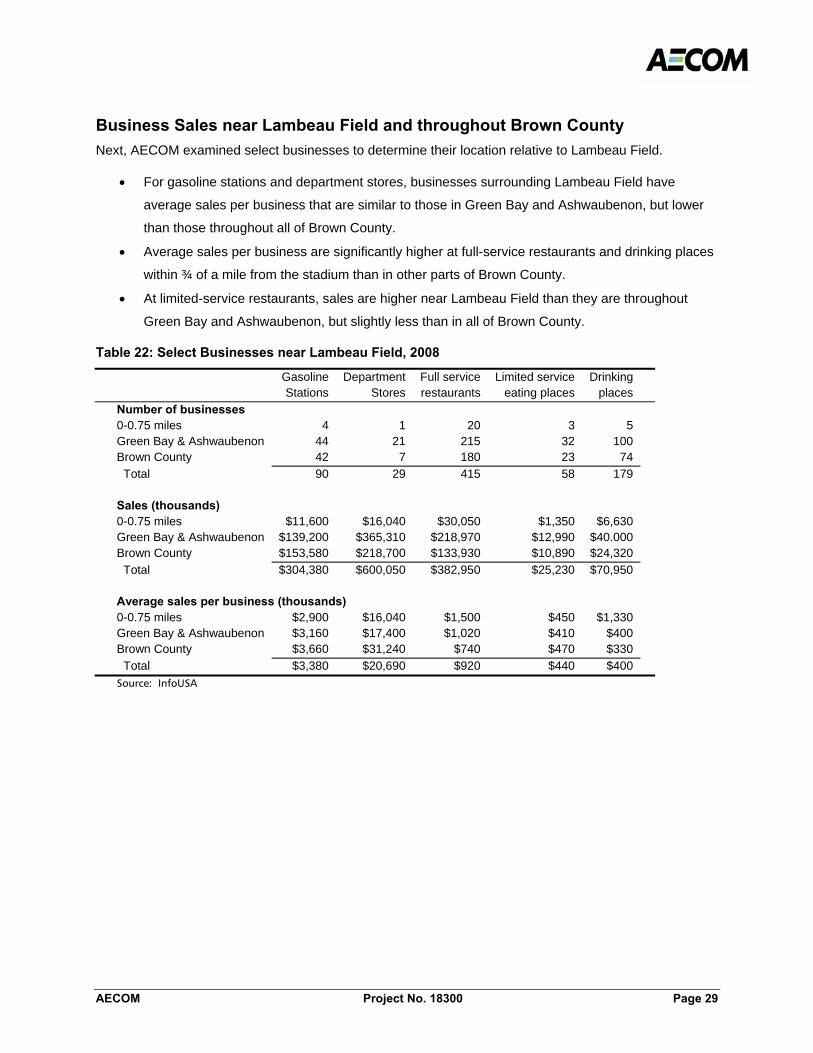
Business Sales near Lambeau Field and throughout Brown County Next, AECOM examined select businesses to determine their location relative to Lambeau Field.
• For gasoline stations and department stores, businesses surrounding Lambeau Field have
average sales per business that are similar to those in Green Bay and Ashwaubenon, but lower
than those throughout all of Brown County.
• Average sales per business are significantly higher at full-service restaurants and drinking places
within ¾ of a mile from the stadium than in other parts of Brown County.
• At limited-service restaurants, sales are higher near Lambeau Field than they are throughout
Green Bay and Ashwaubenon, but slightly less than in all of Brown County.
Table 22: Select Businesses near Lambeau Field, 2008
Gasoline Stations
DepartmentStores
Full service restaurants
Limited service eating places
Drinking places
Number of businesses 0-0.75 miles 4 1 20 3 5 Green Bay & Ashwaubenon 44 21 215 32 100 Brown County 42 7 180 23 74 Total 90 29 415 58 179 Sales (thousands) 0-0.75 miles $11,600 $16,040 $30,050 $1,350 $6,630 Green Bay & Ashwaubenon $139,200 $365,310 $218,970 $12,990 $40.000 Brown County $153,580 $218,700 $133,930 $10,890 $24,320 Total $304,380 $600,050 $382,950 $25,230 $70,950 Average sales per business (thousands) 0-0.75 miles $2,900 $16,040 $1,500 $450 $1,330 Green Bay & Ashwaubenon $3,160 $17,400 $1,020 $410 $400 Brown County $3,660 $31,240 $740 $470 $330
Total $3,380 $20,690 $920 $440 $400 Source: InfoUSA

F
AECOM Project No. 18300 Page 30
Figure 1: Average Sales per Business (thousands), 2008
When looking at the ratio of businesses to population, there is a much higher ratio of these profiled
businesses near the stadium than in other parts of Brown County. For example, the four gasoline stations
with three-quarters of a mile of the stadium represent 0.6 gas stations for every 1,000 residents living in
that area. This compares to a county average of 0.4 gas stations for every 1,000 residents. Within ¾ of a
mile of Lambeau Field, there are three full-service restaurants for every 1,000 residents. This compares to
1.7 for all of Brown County. For all of the profiled businesses above, there is a much higher per-capita
relationship close to the stadium than in other parts of Green Bay and Ashwaubenon, and throughout
Brown County, indicating that these businesses are likely benefiting from additional business resulting
from visitors to Lambeau Field.
AECOM estimated what the potential loss in sales would be for a full-service restaurant located near the
stadium if it generated sales at the same ratio as other Brown County restaurants. Currently, each full-
service restaurant outside the Lambeau area and within Brown County generates an average of $890,000
in sales annually. Those closer to the stadium generate $1.5 million on average. The difference is
$610,000 per restaurant, or over $12 million in sales across all full-service restaurants near Lambeau.
Combined with the difference in Lambeau-area drinking place revenues, the difference by total sales is
between $15 million and $20 million.
Hotel Development
AECOM examined data from STR Global (formerly Smith Travel Research), a leading provider of hotel
industry data, to examine the location of hotel rooms throughout Green Bay.
$0 $500 $1,000 $1,500 $2,000 $2,500 $3,000 $3,500 $4,000
Limited service eating places
Gasoline stations
Full service restaurants
Drinking places
0‐.75 miles Green Bay & Ashwaubenon Brown County
F
AECOM Project No. 18300 Page 31
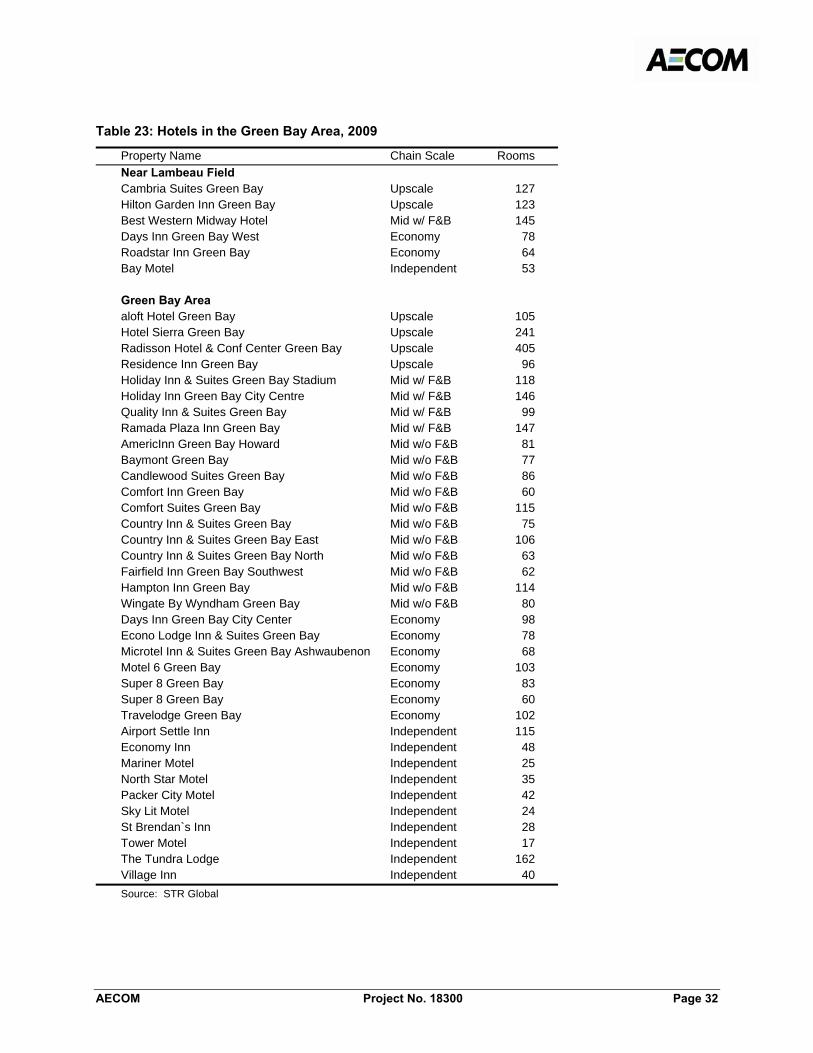
• According to STR Global, there are 42 hotels in Green Bay, 6 of which are located within a mile of
Lambeau Field. Combined, these six hotels provide 590 rooms, or approximately 15 percent of
the total rooms in the area.
• The two upscale hotels near Lambeau Field offer 250 rooms, representing nearly one-quarter
(22.8%) of upscale rooms in Green Bay. Although there is only one mid-scale hotel with a full-
service restaurant near the stadium, it provides more than one-fifth (22.1%) of equivalent hotel
rooms in the city. These types of hotels typically have higher average daily room rates and will
therefore generate higher sales tax and hotel tax revenues.
F
AECOM Project No. 18300 Page 32
Table 23: Hotels in the Green Bay Area, 2009
Property Name Chain Scale Rooms Near Lambeau Field Cambria Suites Green Bay Upscale 127 Hilton Garden Inn Green Bay Upscale 123 Best Western Midway Hotel Mid w/ F&B 145 Days Inn Green Bay West Economy 78 Roadstar Inn Green Bay Economy 64 Bay Motel Independent 53
Green Bay Area aloft Hotel Green Bay Upscale 105 Hotel Sierra Green Bay Upscale 241 Radisson Hotel & Conf Center Green Bay Upscale 405 Residence Inn Green Bay Upscale 96 Holiday Inn & Suites Green Bay Stadium Mid w/ F&B 118 Holiday Inn Green Bay City Centre Mid w/ F&B 146 Quality Inn & Suites Green Bay Mid w/ F&B 99 Ramada Plaza Inn Green Bay Mid w/ F&B 147 AmericInn Green Bay Howard Mid w/o F&B 81 Baymont Green Bay Mid w/o F&B 77 Candlewood Suites Green Bay Mid w/o F&B 86 Comfort Inn Green Bay Mid w/o F&B 60 Comfort Suites Green Bay Mid w/o F&B 115 Country Inn & Suites Green Bay Mid w/o F&B 75 Country Inn & Suites Green Bay East Mid w/o F&B 106 Country Inn & Suites Green Bay North Mid w/o F&B 63 Fairfield Inn Green Bay Southwest Mid w/o F&B 62 Hampton Inn Green Bay Mid w/o F&B 114 Wingate By Wyndham Green Bay Mid w/o F&B 80 Days Inn Green Bay City Center Economy 98 Econo Lodge Inn & Suites Green Bay Economy 78 Microtel Inn & Suites Green Bay Ashwaubenon Economy 68 Motel 6 Green Bay Economy 103 Super 8 Green Bay Economy 83 Super 8 Green Bay Economy 60 Travelodge Green Bay Economy 102 Airport Settle Inn Independent 115 Economy Inn Independent 48 Mariner Motel Independent 25 North Star Motel Independent 35 Packer City Motel Independent 42 Sky Lit Motel Independent 24 St Brendan`s Inn Independent 28 Tower Motel Independent 17 The Tundra Lodge Independent 162 Village Inn Independent 40 Source: STR Global
F
AECOM Project No. 18300 Page 33
V. Surveys of Businesses near Lambeau Field Businesses identified as those located in the immediate area of Lambeau Field, as well as taverns
throughout Brown County, were surveyed in order to better understand their overall satisfaction with the
redeveloped stadium and other thoughts related to the redevelopment and Lambeau’s ongoing operation.
(Earlier in this report, we address property values of these surrounding businesses.) A total of 428
businesses were successfully contacted by the Packers and the District and were asked to complete an
online survey, and 48 responses were received (for a response rate of over 11 percent). The following
summarizes and analyzes the overall results of the responses.
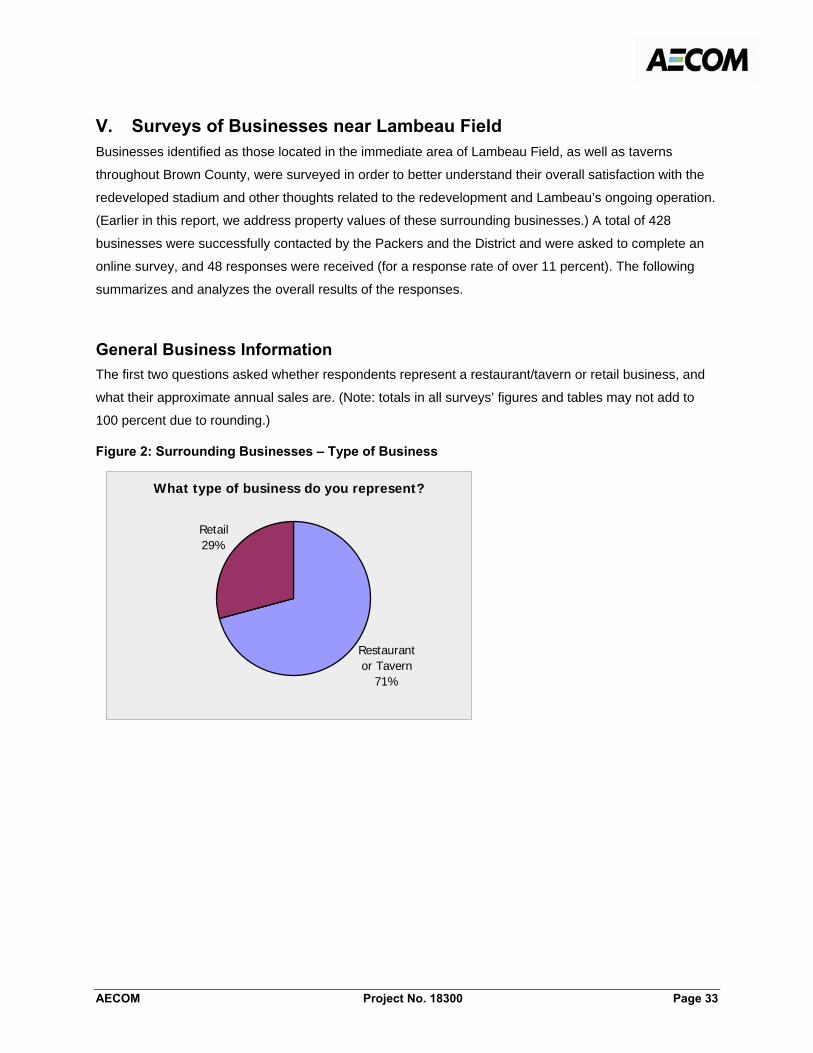
General Business Information The first two questions asked whether respondents represent a restaurant/tavern or retail business, and
what their approximate annual sales are. (Note: totals in all surveys’ figures and tables may not add to
100 percent due to rounding.)
Figure 2: Surrounding Businesses – Type of Business
What type of business do you represent?
Restaurant or Tavern
71%
Retail29%

F
AECOM Project No. 18300 Page 34
Figure 3: Surrounding Businesses – Estimated Annual Sales
As the graphs show, more than 70 percent of the respondents are restaurants or taverns, and nearly half
of respondents have annual sales of $500,000 to $1 million.
Impact of Lambeau Field Redevelopment For those businesses that are still in the same location they were in in 2002 (prior to the redevelopment),
we attempted to measure how the redevelopment has affected their business.
First, we measured businesses’ current satisfaction in various areas compared to their satisfaction with
the stadium prior to redevelopment, without considering broader economic factors that may currently be
impacting business.
Table 24: Surrounding Businesses – Satisfaction with Lambeau Field Redevelopment
In all categories, the majority of respondents indicated that they are satisfied in regard to the
redevelopment, or have experienced no change. The most positive change in businesses’ satisfaction is
related to the safety of the area, while at least 40 percent of respondents also indicated satisfaction with
the impact on year-round sales, and sales on Packers game days and during training camp.
What are your business' estimated annual sales?
$500,000 to $1 million46%
$1 million to $2 million
17% $250,000 to $500,000
10%
$100,000 to $250,000
20%
More than $2 million
7%
Less than $100,000
0%
Very Satisfied Satisfied Neutral/No
Change Dissatisfied Very Dissatisfied
Ability of customers to access your business 7% 33% 48% 4% 7%Safety of the immediate area 19% 37% 41% 4% 0%The impact of the redeveloped stadium on year-round sales 4% 37% 30% 19% 11%The impact on sales during training camp 4% 41% 37% 7% 11%The impact on sales on Packers home weekends 4% 41% 41% 11% 4%The impact on sales on Atrium event days 0% 26% 56% 7% 11%
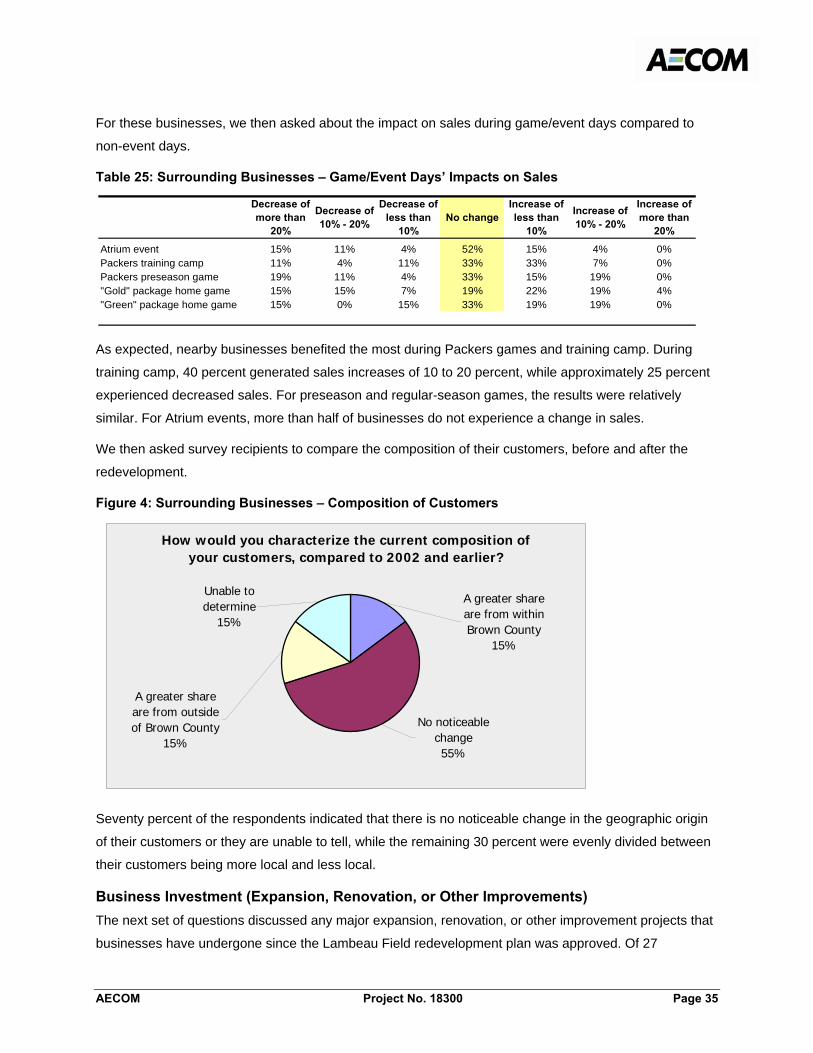
F
AECOM Project No. 18300 Page 35
For these businesses, we then asked about the impact on sales during game/event days compared to
non-event days.
Table 25: Surrounding Businesses – Game/Event Days’ Impacts on Sales
As expected, nearby businesses benefited the most during Packers games and training camp. During
training camp, 40 percent generated sales increases of 10 to 20 percent, while approximately 25 percent
experienced decreased sales. For preseason and regular-season games, the results were relatively
similar. For Atrium events, more than half of businesses do not experience a change in sales.
We then asked survey recipients to compare the composition of their customers, before and after the
redevelopment.
Figure 4: Surrounding Businesses – Composition of Customers
Seventy percent of the respondents indicated that there is no noticeable change in the geographic origin
of their customers or they are unable to tell, while the remaining 30 percent were evenly divided between
their customers being more local and less local.
Business Investment (Expansion, Renovation, or Other Improvements) The next set of questions discussed any major expansion, renovation, or other improvement projects that
businesses have undergone since the Lambeau Field redevelopment plan was approved. Of 27
Decrease of more than
20%
Decrease of 10% - 20%
Decrease of less than
10%No change
Increase of less than
10%
Increase of 10% - 20%
Increase of more than
20%
Atrium event 15% 11% 4% 52% 15% 4% 0%Packers training camp 11% 4% 11% 33% 33% 7% 0%Packers preseason game 19% 11% 4% 33% 15% 19% 0%"Gold" package home game 15% 15% 7% 19% 22% 19% 4%"Green" package home game 15% 0% 15% 33% 19% 19% 0%
How would you characterize the current composition of your customers, compared to 2002 and earlier?
No noticeable change55%
Unable to determine
15%
A greater share are from outside of Brown County
15%
A greater share are from within Brown County
15%
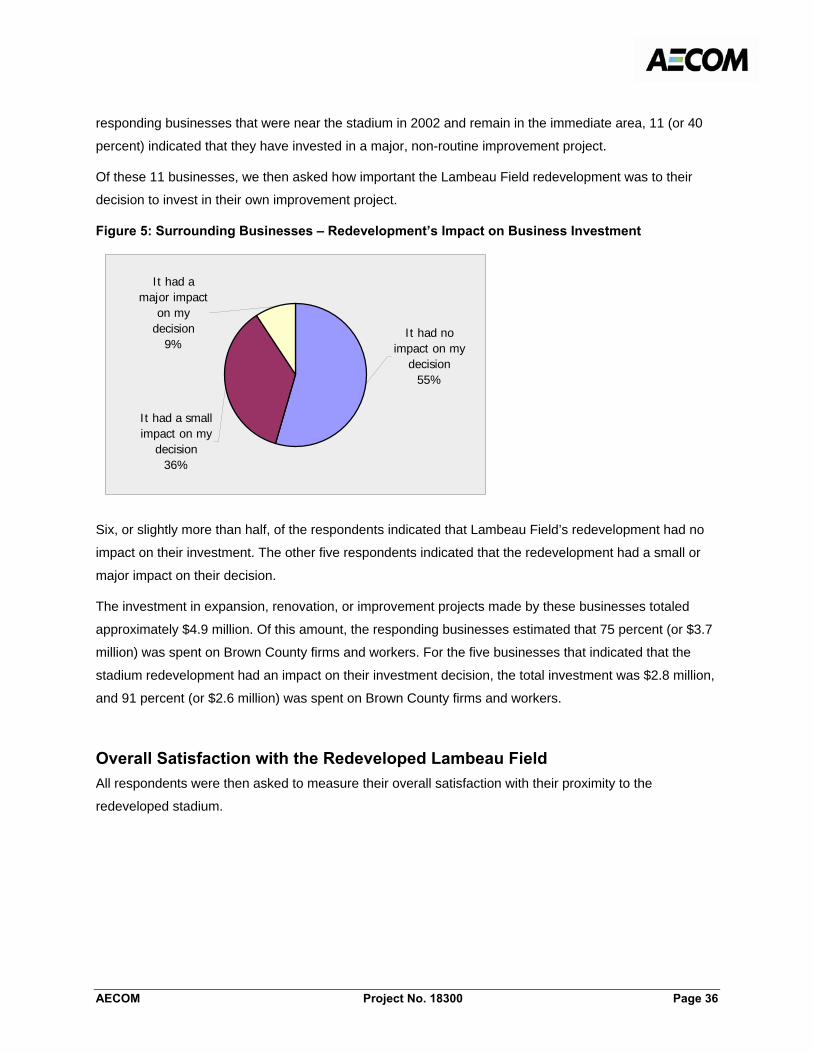
F
AECOM Project No. 18300 Page 36
responding businesses that were near the stadium in 2002 and remain in the immediate area, 11 (or 40
percent) indicated that they have invested in a major, non-routine improvement project.
Of these 11 businesses, we then asked how important the Lambeau Field redevelopment was to their
decision to invest in their own improvement project.
Figure 5: Surrounding Businesses – Redevelopment’s Impact on Business Investment
Six, or slightly more than half, of the respondents indicated that Lambeau Field’s redevelopment had no
impact on their investment. The other five respondents indicated that the redevelopment had a small or
major impact on their decision.
The investment in expansion, renovation, or improvement projects made by these businesses totaled
approximately $4.9 million. Of this amount, the responding businesses estimated that 75 percent (or $3.7
million) was spent on Brown County firms and workers. For the five businesses that indicated that the
stadium redevelopment had an impact on their investment decision, the total investment was $2.8 million,
and 91 percent (or $2.6 million) was spent on Brown County firms and workers.
Overall Satisfaction with the Redeveloped Lambeau Field All respondents were then asked to measure their overall satisfaction with their proximity to the
redeveloped stadium.
It had a small impact on my
decision36%
It had a major impact
on my decision
9%It had no
impact on my decision
55%
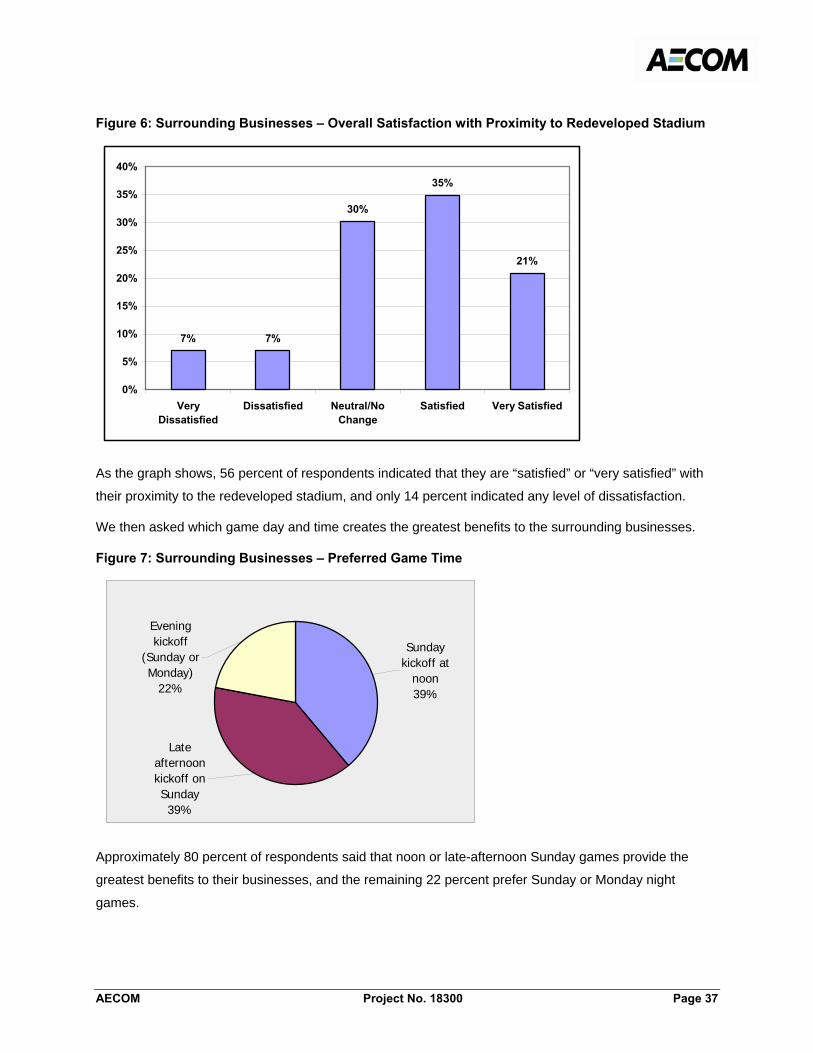
F
AECOM Project No. 18300 Page 37
Figure 6: Surrounding Businesses – Overall Satisfaction with Proximity to Redeveloped Stadium
As the graph shows, 56 percent of respondents indicated that they are “satisfied” or “very satisfied” with
their proximity to the redeveloped stadium, and only 14 percent indicated any level of dissatisfaction.
We then asked which game day and time creates the greatest benefits to the surrounding businesses.
Figure 7: Surrounding Businesses – Preferred Game Time
Approximately 80 percent of respondents said that noon or late-afternoon Sunday games provide the
greatest benefits to their businesses, and the remaining 22 percent prefer Sunday or Monday night
games.
7% 7%
30%
35%
21%
0%
5%
10%
15%
20%
25%
30%
35%
40%
VeryDissatisfied
Dissatisfied Neutral/NoChange
Satisfied Very Satisfied
Late afternoon kickoff on Sunday39%
Sunday kickoff at
noon39%
Evening kickoff
(Sunday or Monday)
22%
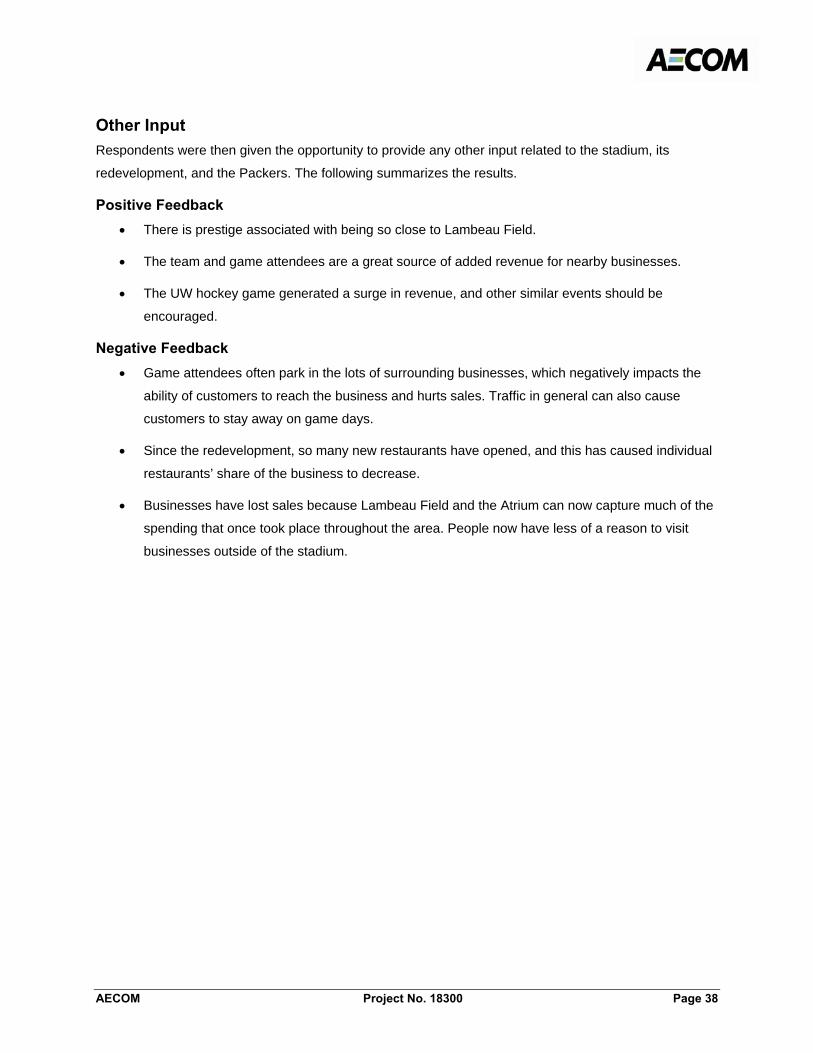
F
AECOM Project No. 18300 Page 38
Other Input Respondents were then given the opportunity to provide any other input related to the stadium, its
redevelopment, and the Packers. The following summarizes the results.
Positive Feedback • There is prestige associated with being so close to Lambeau Field.
• The team and game attendees are a great source of added revenue for nearby businesses.
• The UW hockey game generated a surge in revenue, and other similar events should be
encouraged.
Negative Feedback • Game attendees often park in the lots of surrounding businesses, which negatively impacts the
ability of customers to reach the business and hurts sales. Traffic in general can also cause
customers to stay away on game days.
• Since the redevelopment, so many new restaurants have opened, and this has caused individual
restaurants’ share of the business to decrease.
• Businesses have lost sales because Lambeau Field and the Atrium can now capture much of the
spending that once took place throughout the area. People now have less of a reason to visit
businesses outside of the stadium.
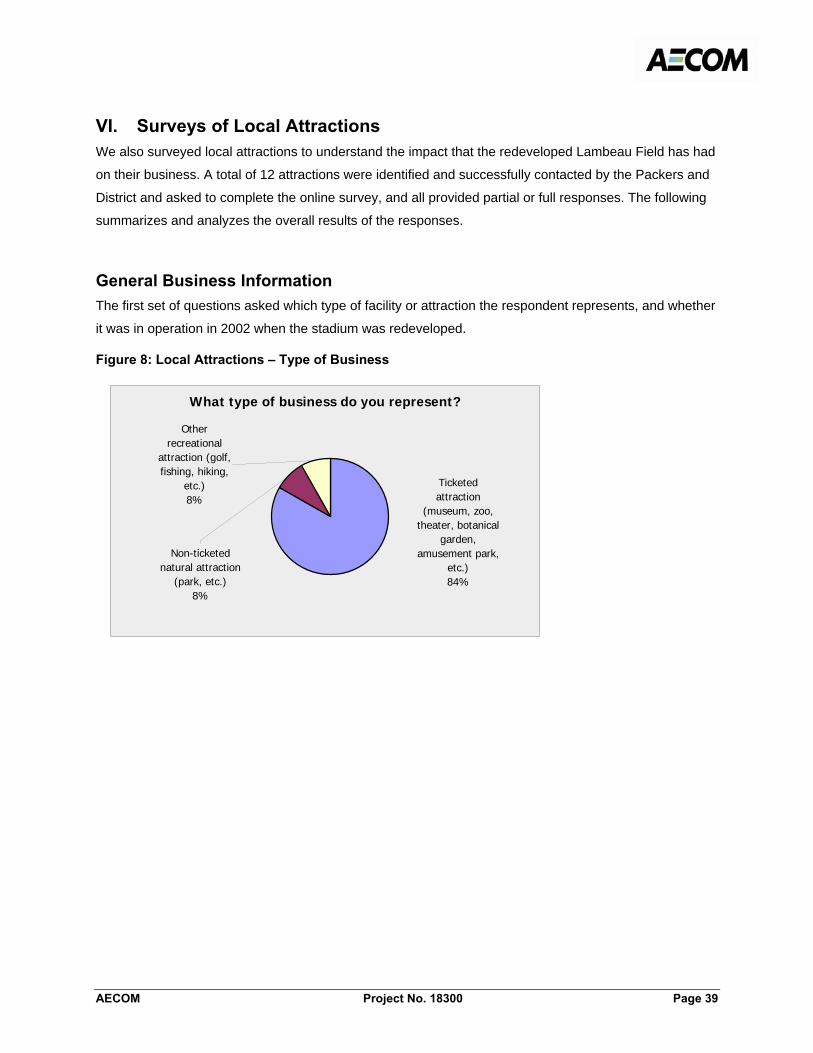
F
AECOM Project No. 18300 Page 39
VI. Surveys of Local Attractions We also surveyed local attractions to understand the impact that the redeveloped Lambeau Field has had
on their business. A total of 12 attractions were identified and successfully contacted by the Packers and
District and asked to complete the online survey, and all provided partial or full responses. The following
summarizes and analyzes the overall results of the responses.
General Business Information The first set of questions asked which type of facility or attraction the respondent represents, and whether
it was in operation in 2002 when the stadium was redeveloped.
Figure 8: Local Attractions – Type of Business
What type of business do you represent?
Other recreational
attraction (golf, fishing, hiking,
etc.)8%
Non-ticketed natural attraction
(park, etc.)8%
Ticketed attraction
(museum, zoo, theater, botanical
garden, amusement park,
etc.)84%

F
AECOM Project No. 18300 Page 40
Figure 9: Local Attractions – Length of Operation
As the charts show, most respondents represent ticketed attractions, and most were open in 2002.
Impact of Lambeau Field Redevelopment For those attractions that were in operation in 2002 (prior to the redevelopment), we attempted to
measure how the redevelopment has affected their business.
First, we measured businesses’ current satisfaction in various areas compared to their satisfaction with
the stadium prior to redevelopment, without considering broader economic factors that may currently be
impacting business.
Table 26: Local Attractions – Satisfaction with Lambeau Field Redevelopment
As the table shows, the vast majority of respondents indicated that they are neutral, satisfied, or very
satisfied with the redeveloped stadium’s impact on their business. Forty percent or more of respondents
said they were at least “satisfied” with the impact on year-round attendance and sales, as well as the
impact on attendance during training camp and on Packers home weekends.
We then asked survey recipients to compare the composition of their clientele, before and after the
redevelopment.
Was your business in operation in 2002?
Yes83%
No17%
Very Satisfied Satisfied Neutral/No
Change Dissatisfied Very Dissatisfied I don't know
The impact on year-round attendance 22% 22% 33% 0% 0% 22%The impact on year-round sales 33% 11% 33% 0% 0% 22%The impact on visitation/attendance during training camp 22% 33% 33% 0% 0% 11%The impact on visitation/attendance on Packers home weekends 33% 22% 33% 0% 0% 11%The impact on visitation/attendance on Atrium event days 11% 11% 44% 11% 0% 22%The impact on your ability to book events (such as social or entertainment events) 11% 0% 78% 0% 0% 11%
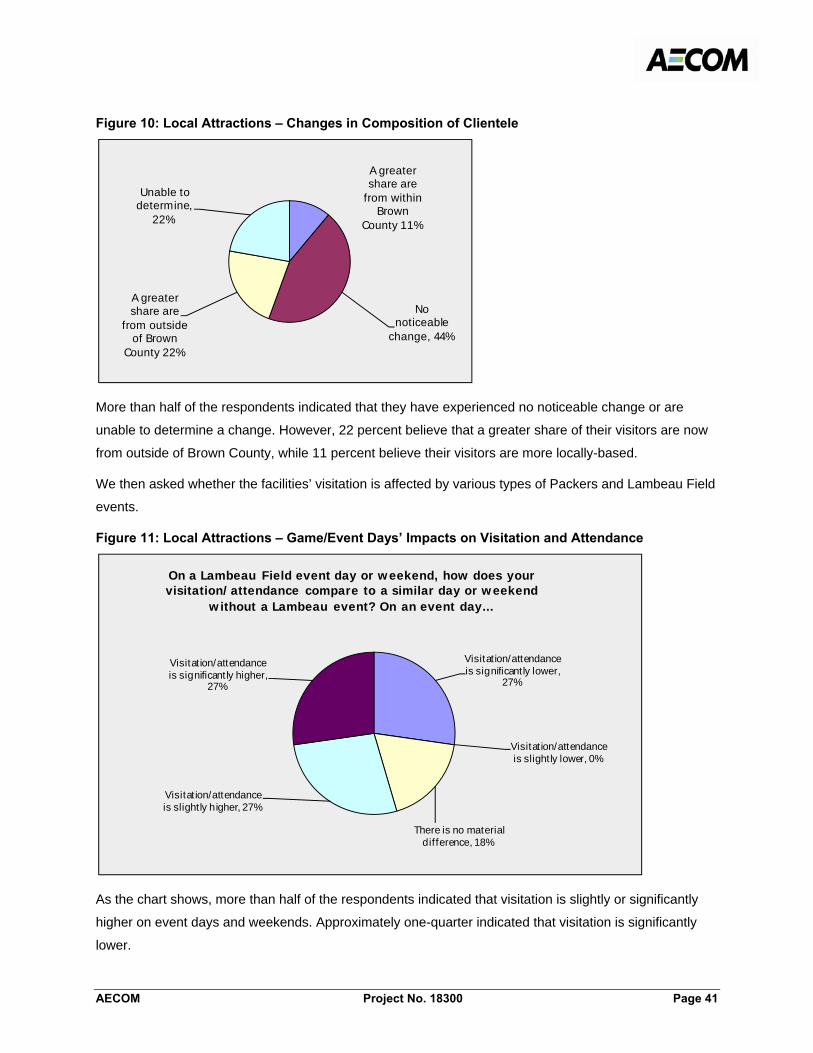
F
AECOM Project No. 18300 Page 41
Figure 10: Local Attractions – Changes in Composition of Clientele
More than half of the respondents indicated that they have experienced no noticeable change or are
unable to determine a change. However, 22 percent believe that a greater share of their visitors are now
from outside of Brown County, while 11 percent believe their visitors are more locally-based.
We then asked whether the facilities’ visitation is affected by various types of Packers and Lambeau Field
events.
Figure 11: Local Attractions – Game/Event Days’ Impacts on Visitation and Attendance
As the chart shows, more than half of the respondents indicated that visitation is slightly or significantly
higher on event days and weekends. Approximately one-quarter indicated that visitation is significantly
lower.
A greater share are
from within Brown
County 11%
No noticeable
change, 44%
A greater share are
from outside of Brown
County 22%
Unable to determine,
22%
Visitation/attendance is s ignificantly lower,
27%
Visitation/attendance is s lightly lower, 0%
There is no material difference, 18%
Visitation/attendance is slightly higher, 27%
Visitation/attendance is s ignificantly higher,
27%
On a Lambeau Field event day or weekend, how does your visitation/attendance compare to a similar day or weekend
without a Lambeau event? On an event day...
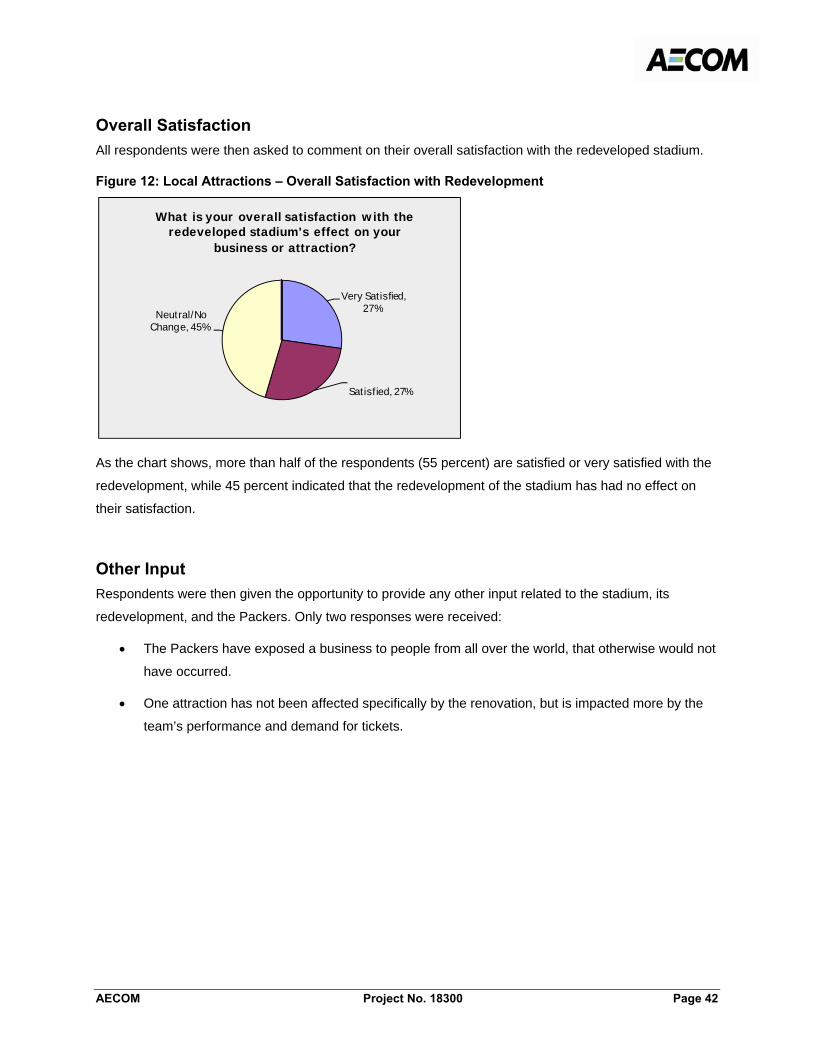
F
AECOM Project No. 18300 Page 42
Overall Satisfaction All respondents were then asked to comment on their overall satisfaction with the redeveloped stadium.
Figure 12: Local Attractions – Overall Satisfaction with Redevelopment
As the chart shows, more than half of the respondents (55 percent) are satisfied or very satisfied with the
redevelopment, while 45 percent indicated that the redevelopment of the stadium has had no effect on
their satisfaction.
Other Input Respondents were then given the opportunity to provide any other input related to the stadium, its
redevelopment, and the Packers. Only two responses were received:
• The Packers have exposed a business to people from all over the world, that otherwise would not
have occurred.
• One attraction has not been affected specifically by the renovation, but is impacted more by the
team’s performance and demand for tickets.
Very Satisfied, 27%
Satisfied, 27%
Neutral/No Change, 45%
What is your overall satisfaction with the redeveloped stadium's effect on your
business or attraction?
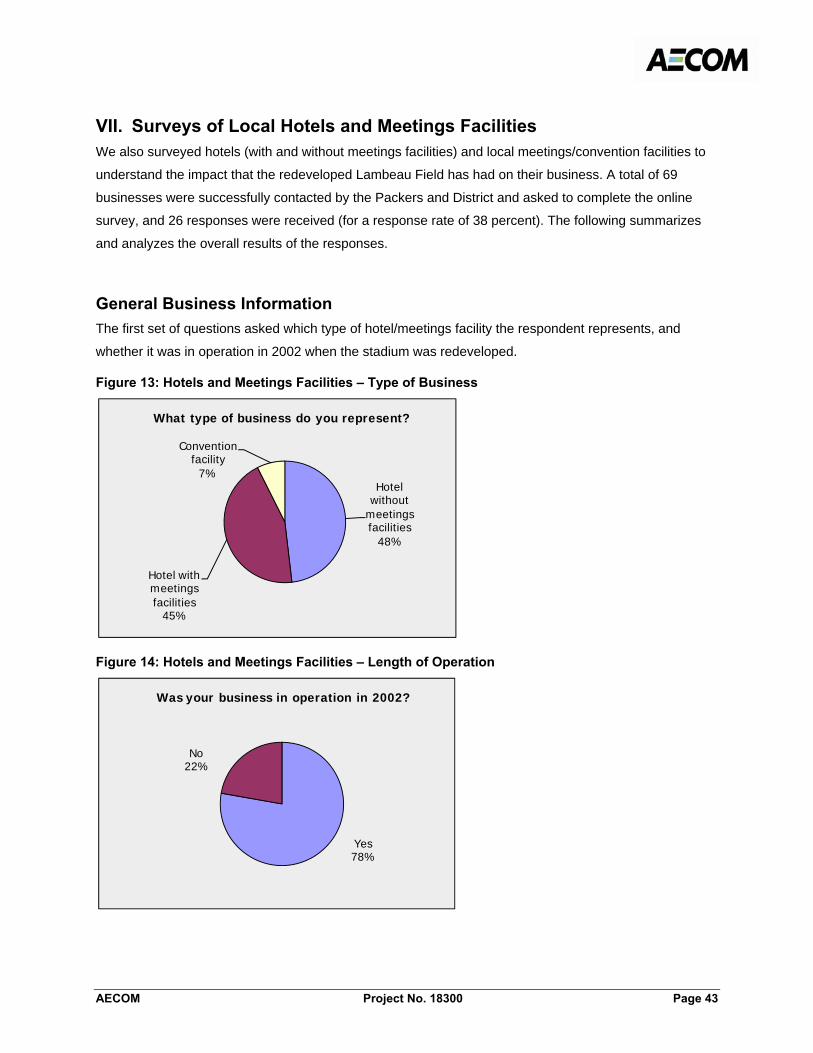
F
AECOM Project No. 18300 Page 43
VII. Surveys of Local Hotels and Meetings Facilities We also surveyed hotels (with and without meetings facilities) and local meetings/convention facilities to
understand the impact that the redeveloped Lambeau Field has had on their business. A total of 69
businesses were successfully contacted by the Packers and District and asked to complete the online
survey, and 26 responses were received (for a response rate of 38 percent). The following summarizes
and analyzes the overall results of the responses.
General Business Information The first set of questions asked which type of hotel/meetings facility the respondent represents, and
whether it was in operation in 2002 when the stadium was redeveloped.
Figure 13: Hotels and Meetings Facilities – Type of Business
Figure 14: Hotels and Meetings Facilities – Length of Operation
Hotel without
meetings facilities
48%
Hotel with meetings facilities
45%
Convention facility
7%
What type of business do you represent?
Yes78%
No22%
Was your business in operation in 2002?
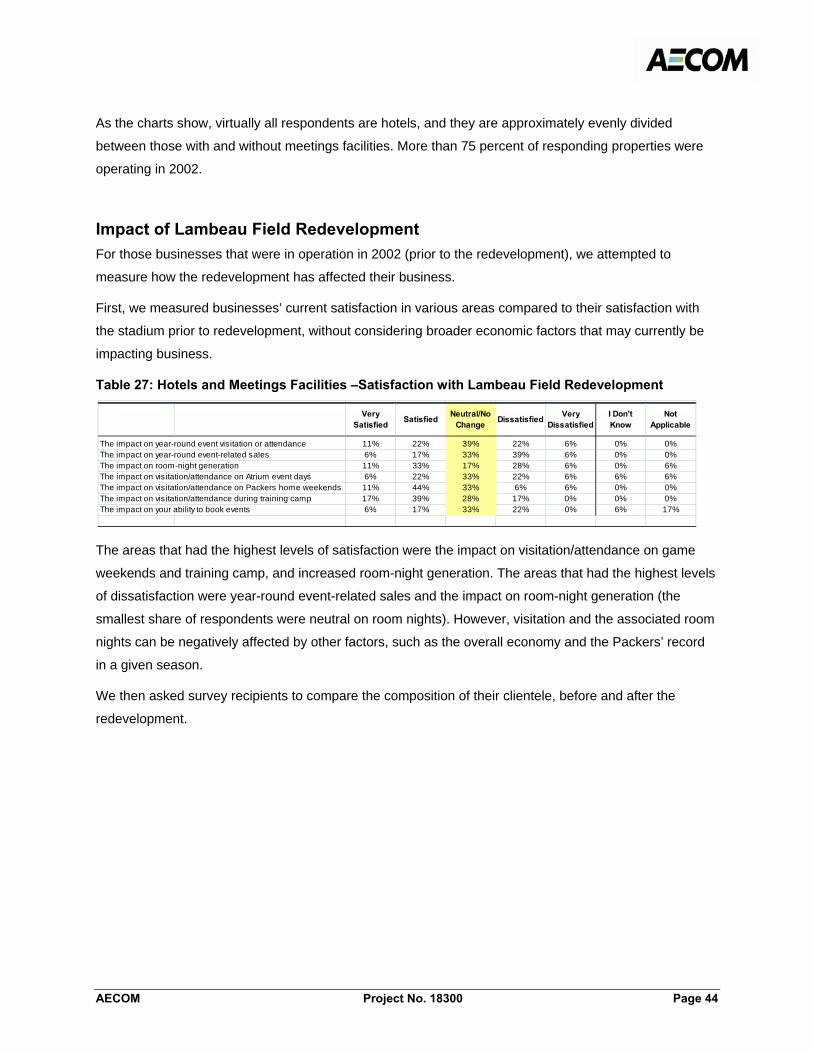
F
AECOM Project No. 18300 Page 44
As the charts show, virtually all respondents are hotels, and they are approximately evenly divided
between those with and without meetings facilities. More than 75 percent of responding properties were
operating in 2002.
Impact of Lambeau Field Redevelopment For those businesses that were in operation in 2002 (prior to the redevelopment), we attempted to
measure how the redevelopment has affected their business.
First, we measured businesses’ current satisfaction in various areas compared to their satisfaction with
the stadium prior to redevelopment, without considering broader economic factors that may currently be
impacting business.
Table 27: Hotels and Meetings Facilities –Satisfaction with Lambeau Field Redevelopment
The areas that had the highest levels of satisfaction were the impact on visitation/attendance on game
weekends and training camp, and increased room-night generation. The areas that had the highest levels
of dissatisfaction were year-round event-related sales and the impact on room-night generation (the
smallest share of respondents were neutral on room nights). However, visitation and the associated room
nights can be negatively affected by other factors, such as the overall economy and the Packers’ record
in a given season.
We then asked survey recipients to compare the composition of their clientele, before and after the
redevelopment.
Very Satisfied Satisfied Neutral/No
Change Dissatisfied Very Dissatisfied
I Don't Know
Not Applicable
The impact on year-round event visitation or attendance 11% 22% 39% 22% 6% 0% 0%The impact on year-round event-related sales 6% 17% 33% 39% 6% 0% 0%The impact on room-night generation 11% 33% 17% 28% 6% 0% 6%The impact on visitation/attendance on Atrium event days 6% 22% 33% 22% 6% 6% 6%The impact on visitation/attendance on Packers home weekends 11% 44% 33% 6% 6% 0% 0%The impact on visitation/attendance during training camp 17% 39% 28% 17% 0% 0% 0%The impact on your ability to book events 6% 17% 33% 22% 0% 6% 17%
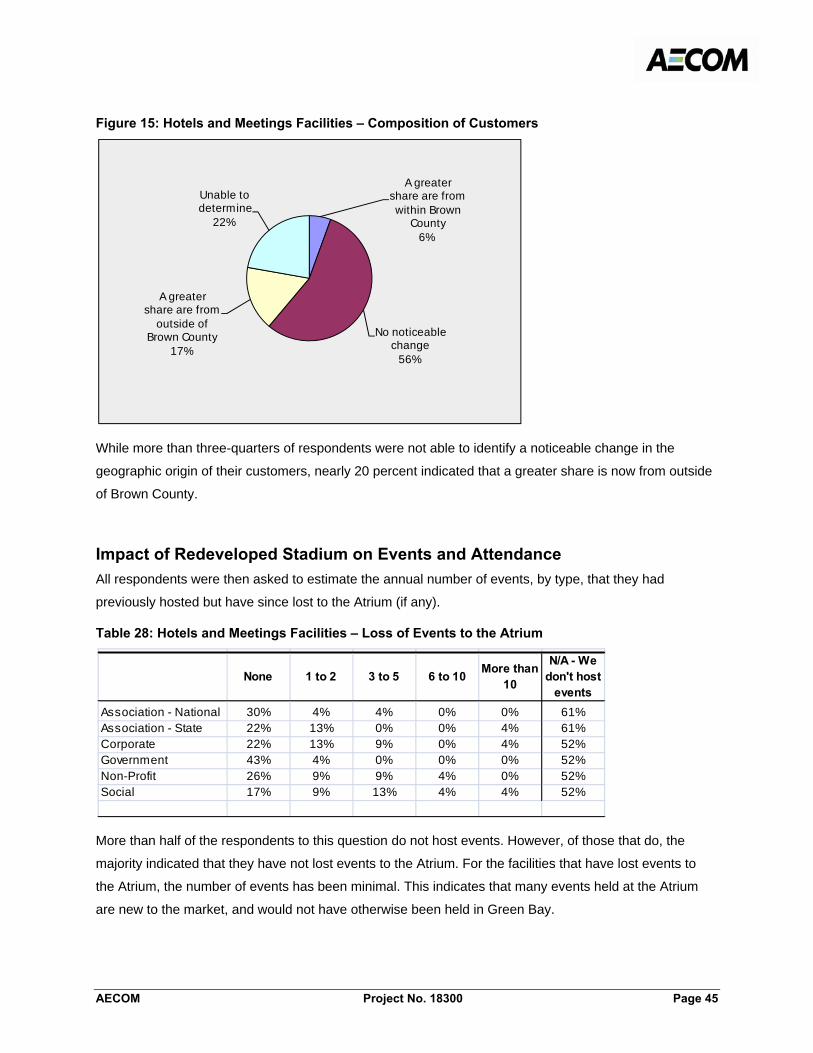
F
AECOM Project No. 18300 Page 45
Figure 15: Hotels and Meetings Facilities – Composition of Customers
While more than three-quarters of respondents were not able to identify a noticeable change in the
geographic origin of their customers, nearly 20 percent indicated that a greater share is now from outside
of Brown County.
Impact of Redeveloped Stadium on Events and Attendance All respondents were then asked to estimate the annual number of events, by type, that they had
previously hosted but have since lost to the Atrium (if any).
Table 28: Hotels and Meetings Facilities – Loss of Events to the Atrium
More than half of the respondents to this question do not host events. However, of those that do, the
majority indicated that they have not lost events to the Atrium. For the facilities that have lost events to
the Atrium, the number of events has been minimal. This indicates that many events held at the Atrium
are new to the market, and would not have otherwise been held in Green Bay.
A greater share are from within Brown
County6%
No noticeable change
56%
A greater share are from
outside of Brown County
17%
Unable to determine
22%
None 1 to 2 3 to 5 6 to 10 More than 10
N/A - We don't host
eventsAssociation - National 30% 4% 4% 0% 0% 61%Association - State 22% 13% 0% 0% 4% 61%Corporate 22% 13% 9% 0% 4% 52%Government 43% 4% 0% 0% 0% 52%Non-Profit 26% 9% 9% 4% 0% 52%Social 17% 9% 13% 4% 4% 52%
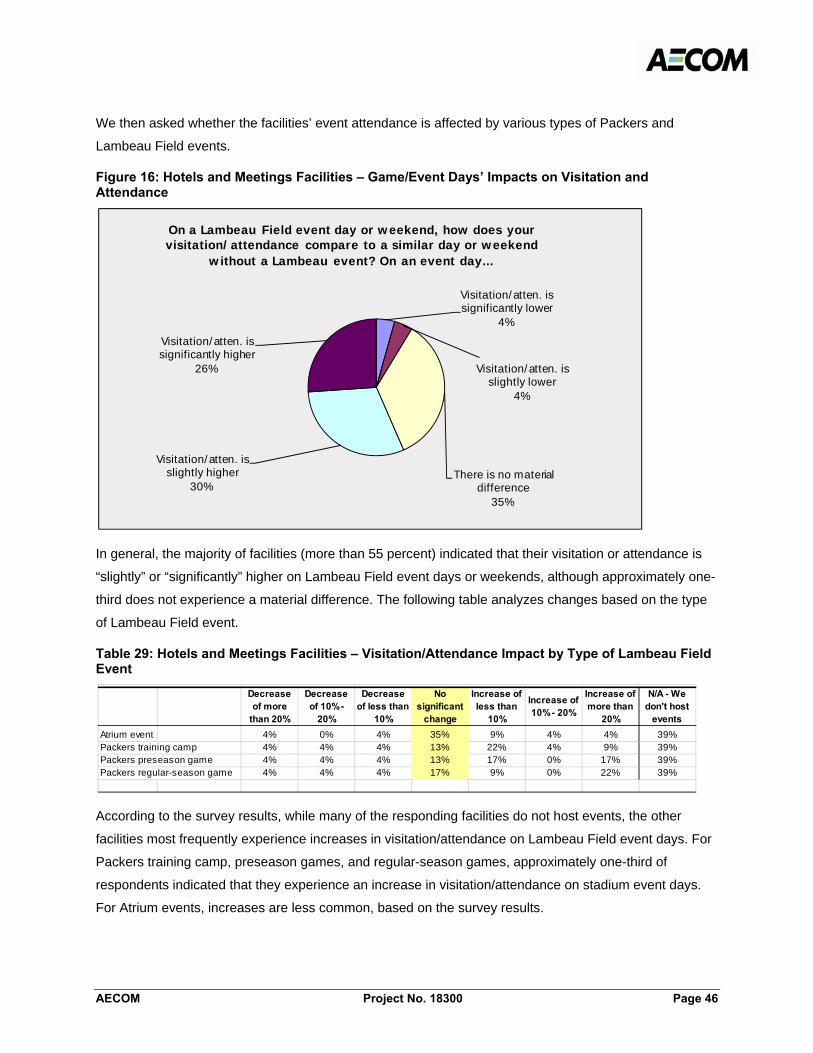
F
AECOM Project No. 18300 Page 46
We then asked whether the facilities’ event attendance is affected by various types of Packers and
Lambeau Field events.
Figure 16: Hotels and Meetings Facilities – Game/Event Days’ Impacts on Visitation and Attendance
In general, the majority of facilities (more than 55 percent) indicated that their visitation or attendance is
“slightly” or “significantly” higher on Lambeau Field event days or weekends, although approximately one-
third does not experience a material difference. The following table analyzes changes based on the type
of Lambeau Field event.
Table 29: Hotels and Meetings Facilities – Visitation/Attendance Impact by Type of Lambeau Field Event
According to the survey results, while many of the responding facilities do not host events, the other
facilities most frequently experience increases in visitation/attendance on Lambeau Field event days. For
Packers training camp, preseason games, and regular-season games, approximately one-third of
respondents indicated that they experience an increase in visitation/attendance on stadium event days.
For Atrium events, increases are less common, based on the survey results.
Visitation/atten. is significantly lower
4%
Visitation/atten. is slightly lower
4%
There is no material difference
35%
Visitation/atten. is slightly higher
30%
Visitation/atten. is significantly higher
26%
On a Lambeau Field event day or weekend, how does your visitation/attendance compare to a similar day or weekend
without a Lambeau event? On an event day...
Decrease of more
than 20%
Decrease of 10% -
20%
Decrease of less than
10%
No significant
change
Increase of less than
10%
Increase of 10% - 20%
Increase of more than
20%
N/A - We don't host
eventsAtrium event 4% 0% 4% 35% 9% 4% 4% 39%Packers training camp 4% 4% 4% 13% 22% 4% 9% 39%Packers preseason game 4% 4% 4% 13% 17% 0% 17% 39%Packers regular-season game 4% 4% 4% 17% 9% 0% 22% 39%
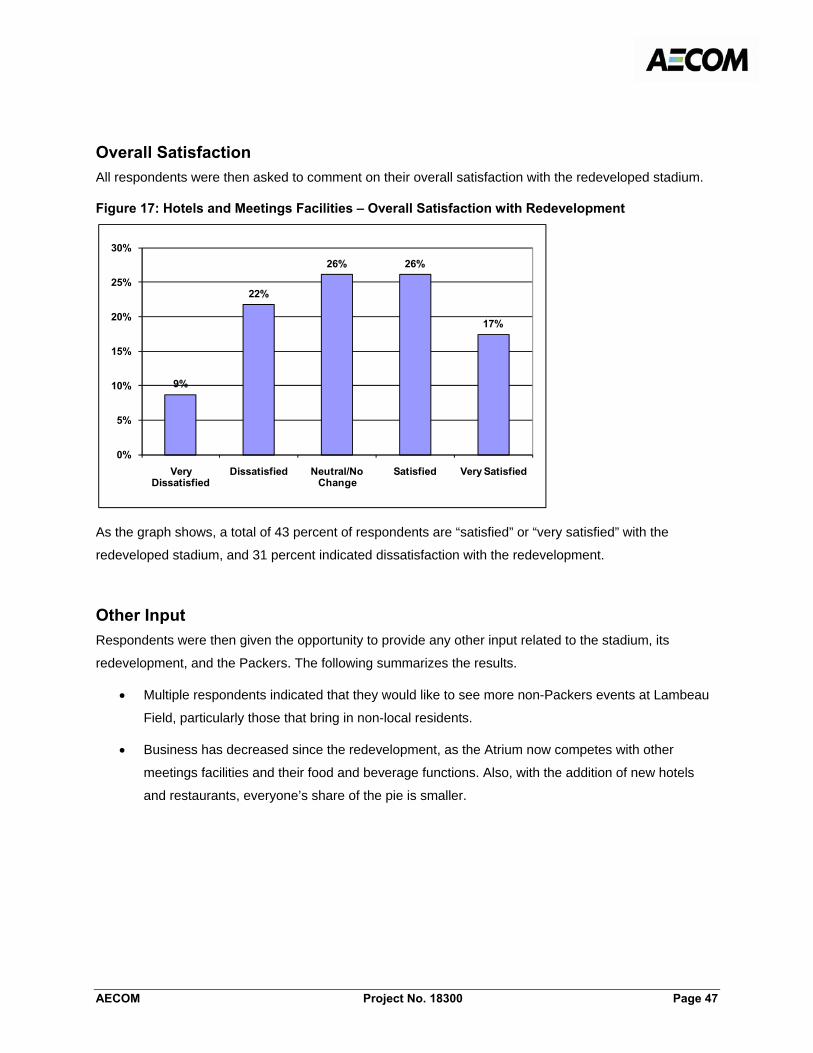
F
AECOM Project No. 18300 Page 47
Overall Satisfaction All respondents were then asked to comment on their overall satisfaction with the redeveloped stadium.
Figure 17: Hotels and Meetings Facilities – Overall Satisfaction with Redevelopment
As the graph shows, a total of 43 percent of respondents are “satisfied” or “very satisfied” with the
redeveloped stadium, and 31 percent indicated dissatisfaction with the redevelopment.
Other Input Respondents were then given the opportunity to provide any other input related to the stadium, its
redevelopment, and the Packers. The following summarizes the results.
• Multiple respondents indicated that they would like to see more non-Packers events at Lambeau
Field, particularly those that bring in non-local residents.
• Business has decreased since the redevelopment, as the Atrium now competes with other
meetings facilities and their food and beverage functions. Also, with the addition of new hotels
and restaurants, everyone’s share of the pie is smaller.
9%
22%
26% 26%
17%
0%
5%
10%
15%
20%
25%
30%
Very Dissatisfied
Dissatisfied Neutral/No Change
Satisfied Very Satisfied
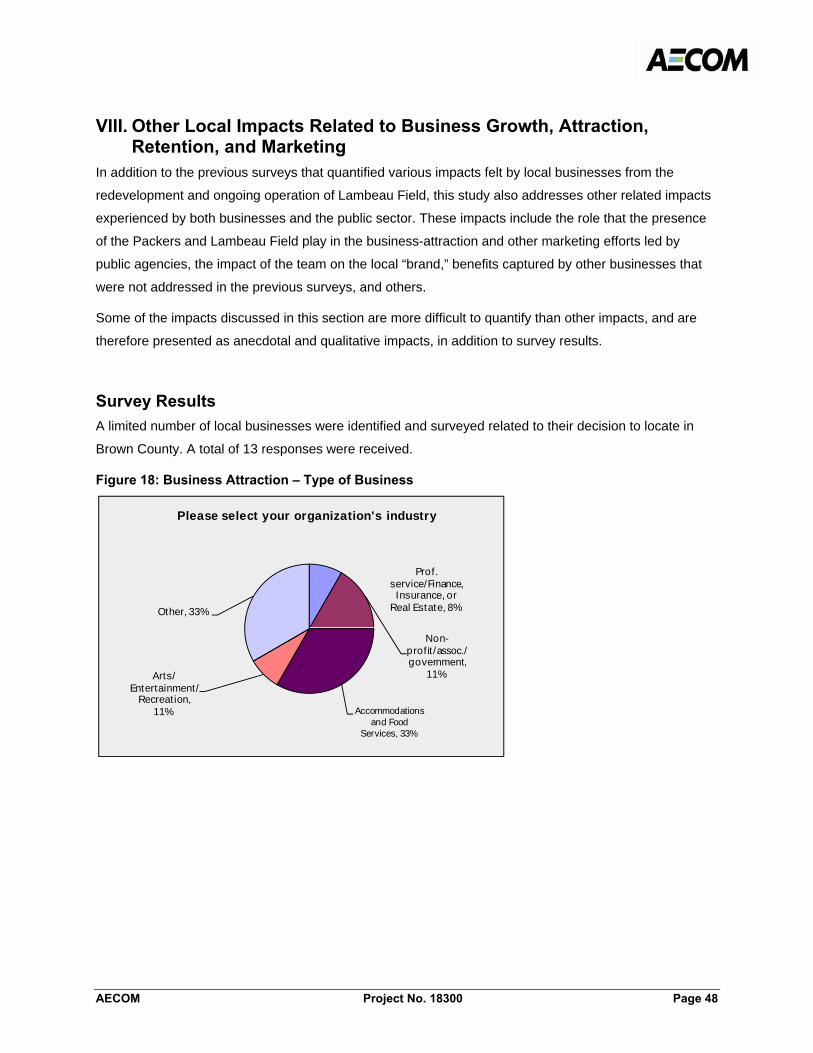
F
AECOM Project No. 18300 Page 48
VIII. Other Local Impacts Related to Business Growth, Attraction, Retention, and Marketing
In addition to the previous surveys that quantified various impacts felt by local businesses from the
redevelopment and ongoing operation of Lambeau Field, this study also addresses other related impacts
experienced by both businesses and the public sector. These impacts include the role that the presence
of the Packers and Lambeau Field play in the business-attraction and other marketing efforts led by
public agencies, the impact of the team on the local “brand,” benefits captured by other businesses that
were not addressed in the previous surveys, and others.
Some of the impacts discussed in this section are more difficult to quantify than other impacts, and are
therefore presented as anecdotal and qualitative impacts, in addition to survey results.
Survey Results A limited number of local businesses were identified and surveyed related to their decision to locate in
Brown County. A total of 13 responses were received.
Figure 18: Business Attraction – Type of Business
Prof. service/Finance, Insurance, or
Real Estate, 8%
Non-profit/assoc./ government,
11%
Accommodations and Food
Services, 33%
Arts/ Entertainment/
Recreation, 11%
Other, 33%
Please select your organization's industry
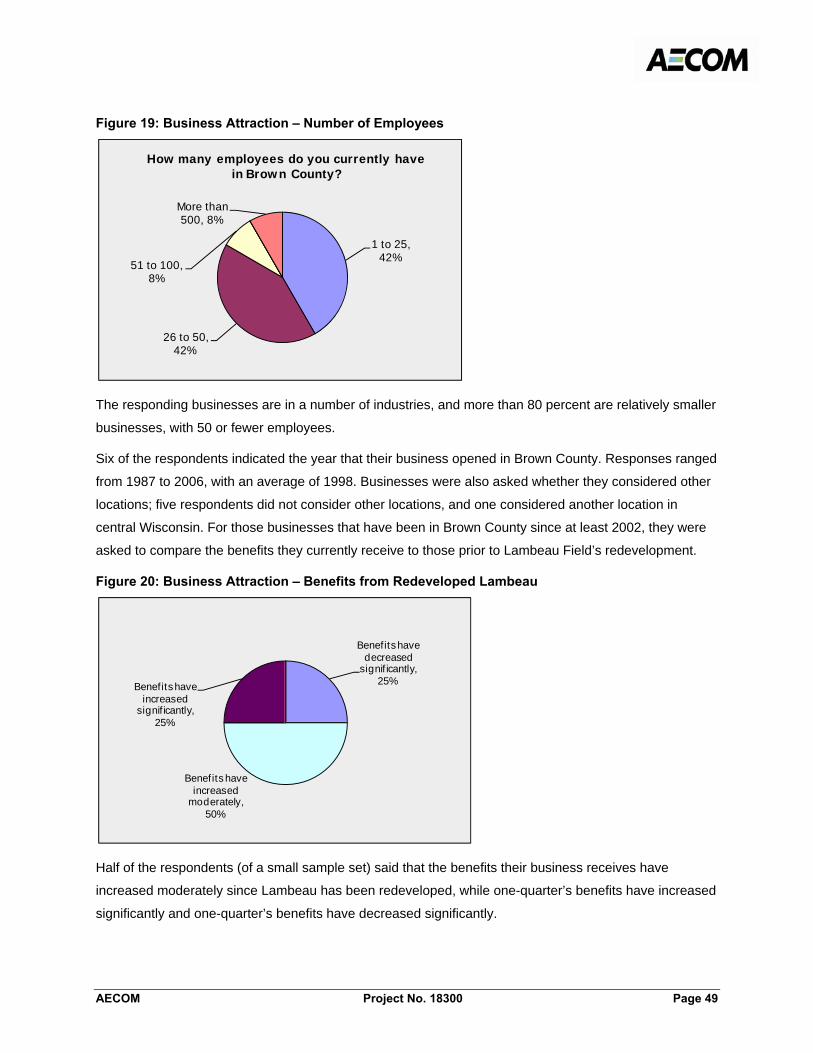
F
AECOM Project No. 18300 Page 49
Figure 19: Business Attraction – Number of Employees
The responding businesses are in a number of industries, and more than 80 percent are relatively smaller
businesses, with 50 or fewer employees.
Six of the respondents indicated the year that their business opened in Brown County. Responses ranged
from 1987 to 2006, with an average of 1998. Businesses were also asked whether they considered other
locations; five respondents did not consider other locations, and one considered another location in
central Wisconsin. For those businesses that have been in Brown County since at least 2002, they were
asked to compare the benefits they currently receive to those prior to Lambeau Field’s redevelopment.
Figure 20: Business Attraction – Benefits from Redeveloped Lambeau
Half of the respondents (of a small sample set) said that the benefits their business receives have
increased moderately since Lambeau has been redeveloped, while one-quarter’s benefits have increased
significantly and one-quarter’s benefits have decreased significantly.
1 to 25, 42%
26 to 50, 42%
51 to 100, 8%
More than 500, 8%
How many employees do you currently have in Brown County?
Benefits have decreased
s ignificantly, 25%
Benefits have increased
moderately, 50%
Benefits have increased
s ignificantly, 25%
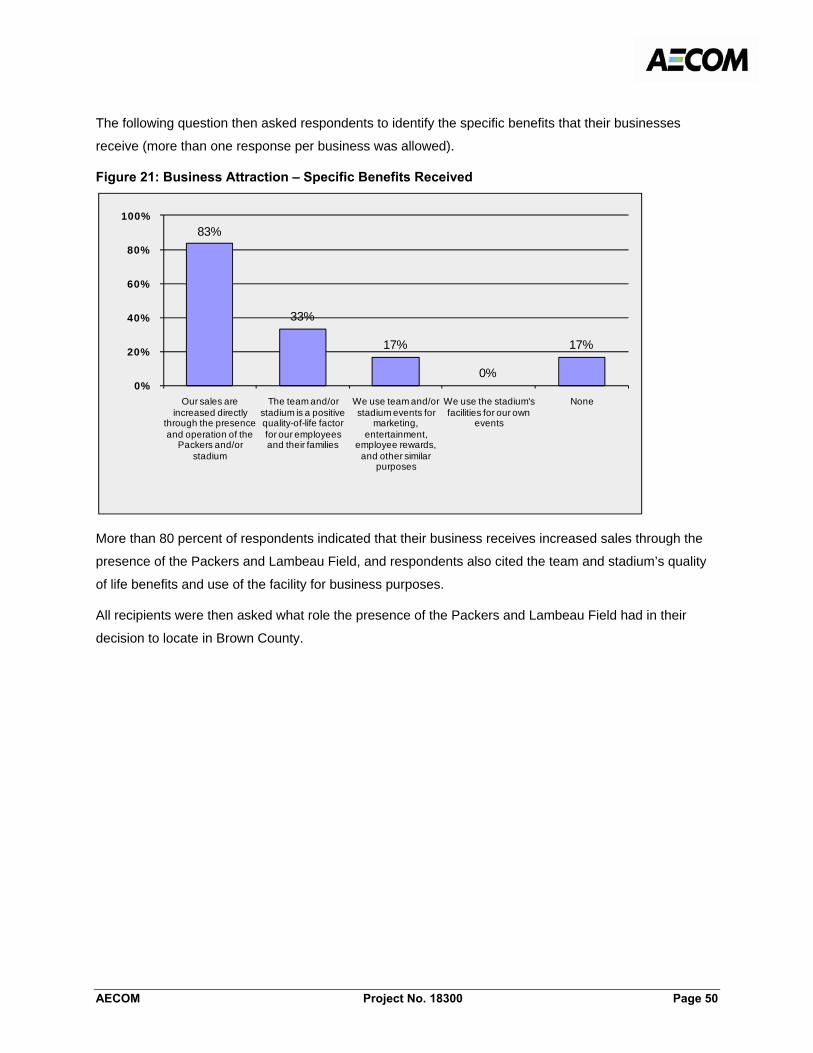
F
AECOM Project No. 18300 Page 50
The following question then asked respondents to identify the specific benefits that their businesses
receive (more than one response per business was allowed).
Figure 21: Business Attraction – Specific Benefits Received
More than 80 percent of respondents indicated that their business receives increased sales through the
presence of the Packers and Lambeau Field, and respondents also cited the team and stadium’s quality
of life benefits and use of the facility for business purposes.
All recipients were then asked what role the presence of the Packers and Lambeau Field had in their
decision to locate in Brown County.
83%
33%
17%
0%
17%
0%
20%
40%
60%
80%
100%
Our sales are increased directly
through the presence and operation of the
Packers and/or stadium
The team and/or stadium is a positive quality-of-life factor for our employees and their families
We use team and/or stadium events for
marketing, entertainment,
employee rewards, and other similar
purposes
We use the stadium's facilities for our own
events
None
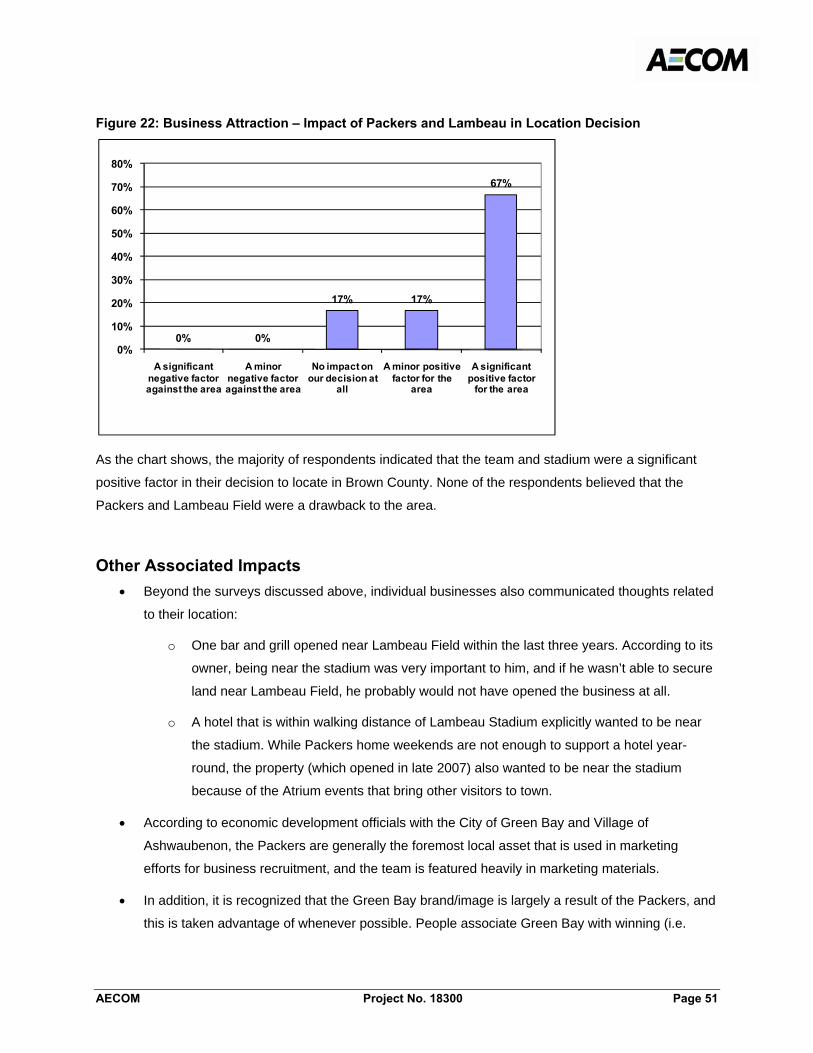
F
AECOM Project No. 18300 Page 51
Figure 22: Business Attraction – Impact of Packers and Lambeau in Location Decision
As the chart shows, the majority of respondents indicated that the team and stadium were a significant
positive factor in their decision to locate in Brown County. None of the respondents believed that the
Packers and Lambeau Field were a drawback to the area.
Other Associated Impacts
• Beyond the surveys discussed above, individual businesses also communicated thoughts related
to their location:
o One bar and grill opened near Lambeau Field within the last three years. According to its
owner, being near the stadium was very important to him, and if he wasn’t able to secure
land near Lambeau Field, he probably would not have opened the business at all.
o A hotel that is within walking distance of Lambeau Stadium explicitly wanted to be near
the stadium. While Packers home weekends are not enough to support a hotel year-
round, the property (which opened in late 2007) also wanted to be near the stadium
because of the Atrium events that bring other visitors to town.
• According to economic development officials with the City of Green Bay and Village of
Ashwaubenon, the Packers are generally the foremost local asset that is used in marketing
efforts for business recruitment, and the team is featured heavily in marketing materials.
• In addition, it is recognized that the Green Bay brand/image is largely a result of the Packers, and
this is taken advantage of whenever possible. People associate Green Bay with winning (i.e.
0% 0%
17% 17%
67%
0%
10%
20%
30%
40%
50%
60%
70%
80%
A significant negative factor against the area
A minor negative factor against the area
No impact on our decision at
all
A minor positive factor for the
area
A significant positive factor
for the area
F
AECOM Project No. 18300 Page 52
“Titletown”), and the image and association brings opportunities to the Green Bay area that
markets of similar size don’t have.
• The team and stadium have led to increased investment in local hotels and restaurants, and the
Atrium has provided a unique event space for both local residents and visitors that did not
previously exist (many of these benefits are captured in the survey results).
The impacts generated by the Packers and Lambeau Field are primarily felt in the hospitality industry,
due to the visitors that come to town for games and other team/stadium events. Businesses that serve the
visitor and hospitality industry have reported various benefits, in addition to those quantified in the
surveys. For example, one company provides transportation for Packers games and Atrium events, and
many of its groups originate from out of town. Other businesses in the visitor industry also capture
increased business due to the use of Lambeau Field.

F
AECOM Project No. 18300 Page 53
IX. Other Potential Impact-Generating Events This section reviews non-Packers events that have been held at Lambeau Field in the past, events that
have been held at other similar stadiums, and potential opportunities for the stadium to generate
additional economic impacts from other events.
Past Non-Packers and Non-Atrium Events at Lambeau Field Previous sections of this report analyzed in detail the events held at Lambeau Field in 2009 (training
camp, Packers’ preseason and regular-season games, and Atrium events) and their associated impacts.
The construction of the Atrium has allowed the stadium to host a wider range of events on a year-round
basis; however, the stadium field has not hosted many non-Packers events over the years. Examples of
on-field events include a University of Wisconsin-Ohio State University hockey game (with approximately
41,000 attendees) and snowmobile racing, which was held in the parking lot in 2004 and inside the
stadium in 2005 and 2006. Also, and a religious conference (Leap of Faith) used the stadium seating but
not the field. This May, “LZ Lambeau” was billed as the redeveloped stadium’s biggest non- Packers and
non-sports event, and attracted approximately 70,000 people to the Green Bay area over three days,
including more than 26,000 at the keynote ceremony at Lambeau Field. LZ Lambeau’s Honor Ride
included 1,244 motorcycles that traversed the state (beginning in La Crosse) and ended at Lambeau
Field.
A limited amount of information related to the economic impacts of these events is available. The Greater
Green Bay CVB estimated the impact of a Snocross race as approximately $400,000, and $4.5 to $5
million for LZ Lambeau (in addition to approximately 5,300 local hotel room nights). In addition, according
to event representatives, the UW hockey game had a “regional” draw with attendees coming from
throughout Wisconsin, and a limited number from Ohio.
Events Held at Other Similar Stadiums Across the country, many football and baseball stadiums focus on hosting events other than their tenants’
games, both on and off the field. The ability to host events throughout the year is partially dependent on
climate and the presence of indoor facilities (such as the Atrium or a domed stadium), as well as variables
such as ownership/management structure and market characteristics; however, many facilities have been
aggressive and successful in hosting events such as college and high school football games, concerts,
other sporting events, and other events.
Multiuse Stadiums In the NFL, a number of new stadiums have recently been built with the explicit intent of being year-
round, multipurpose facilities. Prime examples are University of Phoenix Stadium in Glendale, Ford Field
F
AECOM Project No. 18300 Page 54
in Detroit, Lucas Oil Stadium in Indianapolis, Cowboys Stadium in Arlington, and Reliant Stadium in
Houston. Similar to Lambeau Field’s Atrium, these stadiums all have indoor, off-the-field facilities that can
host events such as meetings, banquets, and conventions. Their fields have also hosted a wide range of
events, such as concerts and family shows, basketball and hockey games, and truck rallies.
However, most importantly, these newer venues have a number of advantages that Green Bay and
Lambeau Field do not have, including technology that allows the playing field to be removed from the
stadium floor or the ability to scale down to a smaller capacity, private management that benefits from its
industry connections and greater interest in taking financial risk, and design plans that specifically
considered the needs of other event types. In addition, each of these facilities is domed. Despite the
many differences between Lambeau Field and these recently-built NFL stadiums, there are still many
potential opportunities to host other events, as other stadiums (many of which are older, open-air facilities
and/or located in cold-weather climates) have shown.
Event Promotion
An additional factor in a facility’s willingness to host additional events is its ownership and management
structure. In Green Bay, Lambeau Field is publicly owned by the District and City, and is leased by the
Packers. The City/District have the right to use the seating bowl, common areas, and playing field.
Although the City/District have scheduling priority from February 1 to May 15 and can use the complex
from February 1 through June 30, the Packers have the right to deny use of the stadium if they determine
that usage:
1. Presents an unacceptable public safety risk or an unacceptable risk of damage to the Lambeau
Field complex, including the playing field,
2. Is incompatible or inconsistent with any sponsorship or promotional arrangement of the Packers,
3. Would violate NFL rules relating to the public image of a team, or
4. Would interfere with the preparation for, set up, or conduct of other team uses and events or
special events at the Lambeau Field complex.
In the past, the Packers have been flexible in this area and have allowed the District to use the stadium
bowl outside of its priority scheduling period (the Leap of Faith was held in July and LZ Lambeau was in
late May).
Also, under the terms of the lease, the District does not have the right to use of premium seating (i.e.
indoor/ outdoor club seats and private boxes). Revenue from these seats would help to make an event
more financially viable for the District and/or a promoter. However, the Packers have also been flexible
regarding this issue. For example, for the Snocross event, the team and District agreed to share club seat
and private box revenues with the promoter.
F
AECOM Project No. 18300 Page 55
Under a number of ownership/management structures, facilities have been able to host major non-tenant
events on the playing field – most often when the risk-taking entity is a private company such as the team
or private facility manager. (The Packers served as promoter of the Wisconsin hockey game.) Rather than
simply rent a facility to a promoter, a number of teams have begun to act as the promoter by purchasing
an event and becoming the promoter (or sharing risk by being a co-promoter). Examples include Kenny
Chesney concerts in 2008 that were promoted by team or facility owners at M&T Bank Stadium, Browns
Stadium, University of Phoenix Stadium, AT&T Park, Heinz Field, Lincoln Financial Field, Gillette
Stadium, and Ford Field. In recent years, Chesney has been perhaps the most consistent stadium act,
having also played at NFL stadiums such as Qwest Field, Raymond James Stadium, Soldier Field, LP
Field, FedEx Field, and Lucas Oil Stadium, as well as major college football stadiums (in Louisville,
Columbia [South Carolina], and Baton Rouge), motor speedways, and MLS and MLB stadiums.
While the potential to generate profits increases by promoting a show, so does the potential to lose
money if ticket sales don’t reach anticipated levels. In Glendale, the public-sector Arizona Sports and
Tourism Authority promoted its Chesney concert but relied on stadium manager Global Spectrum for
marketing, and in Indianapolis, the Capital Improvement Board that owns Lucas Oil Stadium decided not
to take any risk and simply rented the stadium to Chesney’s promoter. (An additional incentive for NFL
teams to host these events is their ability to keep the associated revenues out of the leaguewide revenue-
sharing pool.)
Event Demand at Other Stadiums In this section, we discuss events that have recently been held at other current and former NFL stadiums,
NCAA stadiums, and Major League Baseball (MLB) stadiums, with a focus on major, on-field events that
could potentially be held at Lambeau Field (not including events such as basketball games that would be
infeasible in Green Bay).
Concerts
Concerts are among the most common events held on stadium fields, although the number of stadium
concerts is limited, as most acts are not able to sell 40,000 to 90,000 tickets for a single show. Based on
a review of event demand at current and past NFL stadiums, the vast majority of facilities have hosted
concerts, although some more than others. Due to factors such as their market, climate, aggressiveness
of ownership/management, and facility design, NFL stadiums such as Sun Life Stadium, the former
Giants Stadium, Gillette Stadium, and Heinz Field have been particularly active in the concert market,
with multiple concerts in a typical year. Demand at other selected NFL stadiums that may be more
relevant to Green Bay and Lambeau Field is as follows:
• Open-air stadiums in colder climates (such as Gillette Stadium, Heinz Field, Invesco Field,
Soldier Field, FedEx Field, and Paul Brown Stadium) have all hosted 10 or more concerts in the
last 10 years. Former NFL stadiums that are still in operation, such as RFK Stadium and the Los

F
AECOM Project No. 18300 Page 56
Angeles Memorial Coliseum, have also hosted a limited number of concerts. The performers at
these facilities were primarily top-tier acts such as U2, the Rolling Stones, the Dave Matthews
Band, Kenny Chesney, Paul McCartney, and Bruce Springsteen, or festivals with a number of
bands. (In the summer of 2010, multiple NFL stadiums, including Soldier Field, Paul Brown
Stadium, and Gillette Stadium, are hosting festivals.)
• At these facilities, ticket demand has generally been significant. According to Pollstar, concerts at
NFL stadiums (for which data is available) have had the following characteristics (as of June
2010):
Table 30: Ticket Demand and Sales from Concerts at Selected NFL Stadiums
MLB stadiums have also become popular destinations for major concerts in recent years (often during
baseball season); the majority of its facilities have hosted concerts, including Miller Park and older
stadiums such as Wrigley Field and Fenway Park. Wrigley Field and Fenway Park, in particular, have
become active in the summer concert market in recent years, in order to help generate revenues at older
stadiums that have relatively limited options in other areas. However, the two facilities are among MLB’s
smallest. Acts that have toured MLB stadiums in recent years are often the same that have played at
football stadiums, and include Bruce Springsteen, Jimmy Buffett, the Rolling Stones, The Police, the
Dave Matthews Band, Paul McCartney, Madonna, and Kenny Chesney.
Stadium MarketYear
Stadium Opened
Type of Stadium
# of Concerts
Average Atten.
Avg. Gross Ticket Sales
Sun Life Stadium Miami 1997 Open Air 35 47,051 $5,615,890Gillette Stadium Boston 2002 Open Air 34 55,614 $5,010,565Louisiana Superdome New Orleans 1975 Dome 30 n/a n/aHeinz Field Pittsburgh 2001 Open Air 22 46,640 $4,097,581LP Field Nashville 1999 Open Air 17 19,493 $1,181,358Invesco Field at Mile High Denver 2001 Open Air 14 20,127 $613,284Soldier Field Chicago 2003* Open Air 13 42,840 $3,756,271FedEx Field Washington DC 1997 Open Air 12 84,754 $6,718,314HHH Metrodome Minneapolis 1982 Dome 12 n/a n/aGeorgia Dome Atlanta 1992 Dome 12 61,419 $5,746,429Paul Brown Stadium Cincinnati 2000 Open Air 11 n/a n/aRaymond James Stadium Tampa 1998 Open Air 10 38,829 $3,305,144Cowboys Stadium Dallas 2009 Retractable 10 53,122 $4,863,790Qwest Field Seattle 2002 Open Air 9 33,535 $2,327,372Candlestick Park San Francisco 1960 Open Air 8 n/a n/aFord Field Detroit 2002 Dome 8 43,418 $3,570,956Lincoln Financial Field Philadelphia 2003 Open Air 6 51,083 $4,306,721Oakland-Alameda County Coliseum Oakland 1966 Open Air 6 44,970 $4,256,643Lucas Oil Stadium Indianapolis 2008 Retractable 6 47,853 $3,425,986Meadowlands Stadium New York 2010 Open Air 6 49,048 $4,186,932Arrowhead Stadium Kansas City 1972 Open Air 5 n/a n/aRaplh Wilson Stadium Buffalo 1973 Open Air 4 n/a n/aBrowns Stadium Cleveland 1999 Open Air 3 44,785 $3,446,988
* Renovation.Source: Pollstar, AECOM

F
AECOM Project No. 18300 Page 57
Other relevant information related to major concerts at football and baseball stadiums is as follows:
• The US legs of U2’s 2009 and 2010 tours were primarily scheduled at NFL and NCAA football
stadiums. (This May, the 2010 shows were rescheduled for 2011 due to an injury to Bono, the
band’s lead singer.) The NCAA stadiums included older facilities in relatively smaller markets
such as Charlottesville, Virginia; Raleigh, North Carolina; Norman, Oklahoma; and East Lansing,
Michigan. The Norman concert, at the University of Oklahoma, reportedly generated $500,000 to
the facility in rent. Shows in Charlottesville and Raleigh were sellouts in 2009, with 52,000 to
55,000 tickets sold. (East Lansing’s Spartan Stadium was scheduled to host U2 in June 2010.)
U2’s Fall 2009 shows in the US included 14 performances at nine NFL stadiums across the
country; all shows were sold out, with per-show ticket sales ranging from 58,000 to 85,000.
• In addition to the canceled U2 shows, NFL and MLB stadium tours in the summer of 2010 include
the Eagles with the Dixie Chicks and Keith Urban (Toronto, the Meadowlands, Boston,
Philadelphia, Chicago, and St. Louis), Bon Jovi (Toronto, Boston, Chicago, and the
Meadowlands), Jay-Z and Eminem (Detroit and New York), and the Dave Matthews Band (New
York, Pittsburgh, Chicago, and Washington DC).
• In terms of economic impacts, last year’s opening of Cowboys Stadium was kicked off by a
number of concerts, including a George Strait show in June. According to local officials, at least
80 percent of Arlington’s hotel rooms were booked the weekend of his show, for a total of 4,000
room nights.
• Two new outdoor stadiums – TCF Bank Stadium and Target Field – are expected to attract major
outdoor concerts to Minneapolis for the first time in many years, which could help similar facilities
in Wisconsin to host the events as they tour the region. TCF Bank Stadium, at the University of
Minnesota, was to host U2 this June (prior to the East Lansing show), and the show was an
immediate sellout (approximately 58,000 tickets).
Other concerts are expected at the two stadiums in the future. According to reports, the university
has been contacted by numerous promoters who are interested in using TCF Bank Stadium, and
according to the Twins, they plan to begin attempting to book concerts at Target Field after 2010,
the stadium’s first year.
For additional context on concert demand at major stadiums, the following table lists US and Canadian
stadiums that were among the top 100 worldwide outdoor stadiums and festival sites for concert ticket
sales in 2009 (including stadiums with retractable roofs).

F
AECOM Project No. 18300 Page 58
Table 31: Top Outdoor Stadium and Festival Sites by Ticket Sales, 2009
As the table shows, a number of NFL stadiums are among the top 100. Some stadiums on the list (such
as Carter-Finley Stadium, Scott Stadium, and Oklahoma Memorial Stadium) made the list on the basis of
one U2 show.
Stadiums have also hosted a number of smaller concerts and festivals that use parts of the seating bowl
or other elements of the facility site, such as parking lots, tailgate areas, practice fields, and others. In
addition, Soldier Field has a “Stadium Green” that is used for events such as smaller concerts. Also, in
April 2010, the MLB San Diego Padres announced plans for a summer (in-season) concert series at its
Petco Park. The 43,000-seat stadium would be reduced to approximately 6,000 seats located on the
playing field and in the historic Western Metals Building that was incorporated into the stadium’s seating
design, and the team is considering using temporary “fog” walls to frame the stage and seating area. In
Rank Facility City Primary Pro Sports Tenant
# of Tickets
Sold2 Meadowlands Sports Complex* E. Rutherford, NJ NFL 585,28210 Rogers Centre** Toronto, ON, CA MLB 261,03311 Gillette Stadium Foxborough, MA NFL 248,70219 Soldier Field Chicago, IL NFL 184,63523 Fenway Park Boston, MA MLB 168,74724 Reliant Stadium** Houston, TX NFL 168,04325 Cowboys Stadium** Arlington, TX NFL 166,85730 Hersheypark Stadium Hershey, PA n/a 133,26539 Wrigley Field Chicago, IL MLB 114,02041 Citi Field New York, NY MLB 109,54142 Crew Stadium Columbus, OH MLS 103,56646 Comerica Park Detroit, MI MLB 98,18748 Rose Bowl Pasadena, CA NCAA 97,01453 Commonwealth Stadium Edmonton, AL, CA CFL 89,74854 Citizens Bank Park Philadelphia, PA MLB 89,69059 FedEx Field Landover, MD NFL 84,75466 Raymond James Stadium Tampa, FL NFL 72,68868 Pizza Hut Park Frisco, TX MLS 71,65072 Toyota Park Bridgeview, IL MLS 66,00978 Carter-Finley Stadium Raleigh, NC NCAA 55,02783 Scott Stadium Charlottesville, VA NCAA 52,43384 Lincoln Financial Field Philadelphia, PA NFL 52,34385 Oklahoma Memorial Stadium Norman, OK NCAA 50,95186 University of Phoenix Stadium** Glendale, AZ NFL 50,77591 Rio Tinto Stadium Sandy, UT MLS 49,10692 Heinz Field Pittsburgh, PA NFL 47,51098 Lucas Oil Stadium** Indianapolis, IN NFL 45,178
* Includes Giants Stadium (NFL) and IZOD Center (NBA).** Facility has a retractable roof.Source: Pollstar
F
AECOM Project No. 18300 Page 59
the past, Petco Park has hosted full-stadium acts such as Madonna and the Rolling Stones, with the
Padres assuming no financial risk. For the concert series, the team hired its own talent buyer and will act
as promoter.
According to interviews with event promoters and other industry professionals, major concert acts have
shown interest in performing at Lambeau Field over the years, but no deals have been finalized. The
District and Packers, in cooperation with a local promoter, have continued to work toward bringing a
major concert to Lambeau Field. In December 2007, a stadium tour was given to a production company
to assess the feasibility of a concert at the facility. While the production company concluded that
Lambeau could successfully host a concert, field protection was a major concern for the Packers and
became an obstacle in securing approval from the team for a concert.
In September 2009, the District worked with the Packers to implement an evaluation of field protection
systems by installing several vendor products on the practice field. Results were positive and appeared to
provide the District and team with a level of confidence regarding their effectiveness. As a result, an offer
was extended to a major act to hold a concert at Lambeau in June 2010. Ultimately, the event was not
held, as an agreement could not be reached with the artist. However, the District and team continue to
work with a local promoter to attract a major concert to Lambeau, and this July, another production
company toured the facility and it appears as though the chances for a concert to be held in 2011 are
very good.
College Football Games
In recent years, colleges and universities have increasingly been scheduling games at neutral-site
stadiums for various reasons, including the ability to potentially sell more tickets and generate additional
revenue, reach a broader base of supporters, and play in marquee facilities. Similar to concerts, a facility
owner can act as a game’s promoter or simply rent the stadium to the participating schools. Regular-
season games would be most likely for Lambeau Field, although the Big 10 has recently added a
conference championship game beginning in 2011 (the first game will be held at Indianapolis’ Lucas Oil
Stadium). Also, a new bowl (the New Era Pinstripe Bowl) will be played at New York’s Yankee Stadium
beginning this year, although New York’s market size and its holiday tourist draw are key differences
compared to Green Bay.
The District and Packers have explored bringing college football to Lambeau Field in the past. The
Packers offered to host a Wisconsin-Northern Illinois game in 2009, but the game will be held at Soldier
Field in 2011. Also, the District worked with a promoter to evaluate a possible Rice-Southern Mississippi
game in 2008, although the District ultimately determined that the game would have been financially
infeasible. More recently, discussions regarding a potential Michigan Tech game have been held, and this
remains at possibility in the long run.
The following summarizes information related to neutral-site college football games:

F
AECOM Project No. 18300 Page 60
• In the 2009 season, a number of NCAA Football Bowl Subdivision (FBS) games (many with elite
teams) played neutral-site regular season games in NFL stadiums and other large football
stadiums across the country. (The FBS was formerly known as Division I-A.) The following table
summarizes the higher-profile games played in these larger facilities.
Table 32: 2009 Neutral-Site NCAA FBS Games
In addition to the games listed above, there are many “classics” that are played between
historically black colleges and universities at neutral sites, many of which are NFL stadiums such
as Soldier Field, Lucas Oil Stadium, and Giants Stadium, as well as others such as Legion Field
(Birmingham), the Cotton Bowl (Dallas), the Citrus Bowl (Orlando), and the Liberty Bowl
(Memphis). These games often include weekend- or week-long festivities such as battles of the
bands, parades, reunions, and other events. However, the existing classics are held in the same
city and facility each year and would generally not be considered candidates to relocate. In
contrast, some of the games listed above are one-time events but similar matchups recur across
the country on an annual basis. Other non- FBS games also take place at NFL stadiums, such as
the annual Wells Fargo Battle in Seattle, played at Qwest Field between Central Washington and
Western Washington. Qwest Field also hosted an Eastern Washington-Portland State game in
2009.
A number of NFL stadiums are also the full-time home of college football programs: Heinz Field
(University of Pittsburgh), Lincoln Financial Field (Temple University), Qualcomm Stadium (San
Diego State University), LP Field (Tennessee State University), the Louisiana Superdome
(Tulane), Sun Life Stadium (University of Miami), and Raymond James Stadium (University of
South Florida). Before the recent opening of TCF Bank Stadium in Minneapolis, the Metrodome
also hosted the University of Minnesota, in addition to the Vikings.
• Examples of past and future regular season neutral-site games have shown the actual and
planned impacts that host markets and universities can capture:
Teams Stadium, City Notes
Virginia Tech - Alabama Georgia Dome, Atlanta Annual location of Chick-fil-A Kickoff GameMiami (OH) - Kentucky Paul Brown Stadium, CincinnatiOhio State - Toledo Browns Stadium, ClevelandArkansas - Texas A&M Cowboys Stadium, Dallas Game will played in Dallas for 10 yearsBYU - Oklahoma Cowboys Stadium, DallasOklahoma - Texas Cotton Bowl, Dallas Annual location of Red River Shootout gameFlorida - Georgia Alltel Stadium, Jacksonville Annual location of gameIowa State - Kansas State Arrowhead Stadium, Kansas City Two-year agreement for '09 and '10Army - Navy Lincoln Financial Field, Philadelphia Through '17, games in Phi, FedEx Field, and M&T Bank StadiumNotre Dame - Washington State Alamodome, San AntonioHawaii - Washington State Qwest Field, SeattleIllinois - Missouri Edward Jones Dome, St. Louis Common location of annual Arch Rivalry game
Source: NCAA, AECOM
F
AECOM Project No. 18300 Page 61
o In 2007, Iowa played Northern Illinois at Soldier Field in Chicago, which was technically a
“home” game for NIU. The game was a sellout (61,500 tickets), and Iowa fans comprised
at least 45,000 seats, according to estimates.
This April, Iowa and Northern Illinois announced that they will once again play each other
at Soldier Field, to open the 2012 season. Like the 2007 game, NIU will be the home
team, and Iowa will not lose a home game from its 2012 schedule.
NIU is also playing Wisconsin at Soldier Field on September 17, 2011.
o For the 2009 BYU-Oklahoma game at Cowboys Stadium, the Cowboys acted as
promoter and paid BYU $1.5 million and Oklahoma $2.5 million. The game was a sellout;
BYU instantly sold its allotment of 7,500 tickets and Oklahoma sold more than 50,000.
o The annual Chick-fil-A Kickoff Game is held at the 72,000-seat Georgia Dome in Atlanta.
In 2009, both Virginia Tech and Alabama sold their allotment of 31,000 tickets, and the
game was a sellout. Thousands of additional people were expected to attend other
game-related festivities throughout Atlanta on Friday and Saturday.
o In 2009, Ohio State played Toledo at Browns Stadium in Cleveland, which was a “home”
game for Toledo. As a result, Toledo received 58,000 tickets, and Ohio State just 12,500.
Toledo required a minimum donation of $100 to its athletic department in order to
purchase a ticket for the game, and many donations came from Ohio State fans. Toledo,
acting as promoter, sold its 58,000 tickets, while its average attendance for a normal
home game is just 17,000. Ticket sales alone generated approximately $3.5 million,
before considering the donations.
Ohio State earned less than $1 million from the game, but will not pay a guarantee to
Toledo when they play in Columbus in 2011 (a typical guarantee would be approximately
$850,000), and had the opportunity to play in Cleveland. In addition, the university was
able to avoid playing in a 30,000-seat stadium in Toledo as part of the “home-and-home”
series.
In 2006, Wisconsin played Bowling Green State University in Cleveland.
o The 91,000-seat FedEx Field will host two college games in 2010. The first will be
Virginia Tech-Boise State in October; Virginia Tech will receive $2.35 million and Boise
State $1.25 million for participating. Virginia Tech also played USC at FedEx Field in
2004.
In November, Indiana University will play a “home” game against Penn State at FedEx
Field. For agreeing to move the game from Bloomington, IU will receive a guaranteed $3
F
AECOM Project No. 18300 Page 62
million, which is more than three times its revenue from a typical home game, and has to
sell only 7,000 tickets. Aside from financial considerations, IU also cited the “bowl-like”
experience of the game and the opportunity to help with recruiting on the East Coast.
o Colorado and Colorado State recently agreed to play the annual Rocky Mountain
Showdown game at Denver’s 76,000-seat Invesco Field for 10 years beginning in 2010.
Based on relative seating capacities at their home stadiums, tickets will be split 55% to
45% in favor of Colorado. In the past, the game has been held in Denver as well as on
each school’s campus. According to estimates, CSU will earn an additional $1.0 to $1.5
million each year from playing in Denver, and CU will earn an additional $750,000.
o Rice University agreed to move its 2010 home game against Texas to Houston’s Reliant
Stadium, after being offered an undisclosed sum from SMG-Reliant Park that reportedly
will generate twice as much revenue as the school earns from an entire season of on-
campus home games.
o In 2010, Kansas City’s Arrowhead Stadium will host three college football games:
Kansas-Missouri, Iowa State-Kansas State, and Pittsburg State-Northwest Missouri
State.
o Northwestern University recently announced that it will host the University of Illinois this
November 20 at Chicago’s Wrigley Field. Of approximately 40,000 seats at Wrigley Field,
the Cubs will control 5,000, Illinois will get 3,000, and Northwestern will have
approximately 32,000. Northwestern, which averaged 21,000 per home game in 2009,
hopes to increase attendance at other games this year by including the Illinois game in its
season-ticket package.
o Other neutral-site marquee games include Syracuse games at the new Meadowlands
Stadium in 2012 and 2014 (against USC and Notre Dame), Syracuse and Rutgers games
at Yankee Stadium, and Washington State often plays one game per season at Seattle’s
Qwest Field.
• Other universities and facilities are known to be actively searching for neutral-site games:
o The Washington Redskins are reportedly discussing the possibility of additional college
games at FedEx Field with “high-profile” teams.
o Notre Dame plans to play one neutral-site game per season in the future. In addition to its
2014 game at the Meadowlands, Notre Dame will play Army at Yankee Stadium in 2010,
Maryland at FedEx Field in 2011, and Arizona State at Cowboys Stadium in 2013. With
2012 open as of early 2010, the university announced that its first option is to play at
Soldier Field in Chicago (reportedly against the University of Miami). The university has

F
AECOM Project No. 18300 Page 63
also announced that its other “priority markets” include Toronto, Cleveland, Atlanta, and
Indianapolis.
In addition to playing in San Antonio in 2009, Notre Dame has played Navy at multiple
locations in the last ten years, including Orlando, Baltimore, and the Meadowlands’
former Giants Stadium.
o In addition to this fall’s game at Wrigley Field, Northwestern has also discussed playing a
regular-season game at Yankee Stadium (due to ties between NU and the Yankees).
Conference Championship Games and Bowl Games
Conference championship games and bowl games are events that generate significant economic
impacts, due to the high percentage of attendees from out of town. As previously mentioned, the addition
of the University of Nebraska to the Big 10 is expected to lead to a conference championship game
beginning in 2011 (as of early July 2010, it has not yet been approved by university presidents). An indoor
stadium in a Big 10 state would likely be a favorite to host this game. According to recent reports, the
Metrodome and Lucas Oil Stadium have already expressed interest in hosting, although the Metrodome’s
viability is dependent on its unfunded renovation, according to a facility representative (Detroit’s Ford
Field is the other indoor stadium in Big 10 territory). According to these reports, Chicago’s Soldier Field –
an open-air stadium – is also interested in bidding for the game.
Also, as mentioned above, Lambeau Field is not necessarily expected to be a strong candidate to host a
postseason bowl game, although not all bowls are held in warm-weather climates or indoors (such as the
Humanitarian Bowl in Boise, the EagleBank Bowl in Washington DC, and New York’s Pinstripe
Bowl).However, the following summarizes the location of conference championship and postseason bowl
games, as some are held in NFL and MLB stadiums.
Table 33: 2009 NCAA Conference Championship Games in NFL Stadiums
Conference Stadium, City
MAC Ford Field, DetroitSEC Georgia Dome, AtlantaBig 12 Cowboys Stadium, ArlingtonACC Raymond James Stadium, Tampa
Source: NCAA
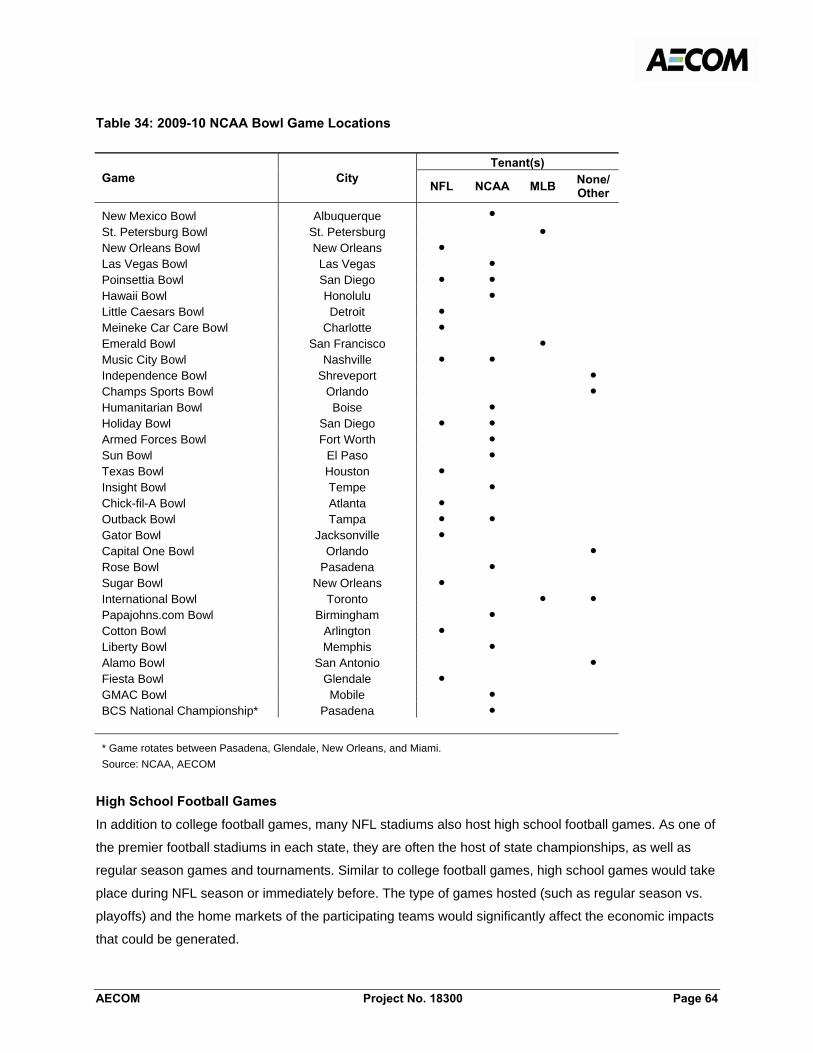
F
AECOM Project No. 18300 Page 64
Table 34: 2009-10 NCAA Bowl Game Locations
Game City Tenant(s)
NFL NCAA MLB None/ Other
New Mexico Bowl Albuquerque ● St. Petersburg Bowl St. Petersburg ● New Orleans Bowl New Orleans ● Las Vegas Bowl Las Vegas ● Poinsettia Bowl San Diego ● ● Hawaii Bowl Honolulu ● Little Caesars Bowl Detroit ● Meineke Car Care Bowl Charlotte ● Emerald Bowl San Francisco ● Music City Bowl Nashville ● ● Independence Bowl Shreveport ● Champs Sports Bowl Orlando ● Humanitarian Bowl Boise ● Holiday Bowl San Diego ● ● Armed Forces Bowl Fort Worth ● Sun Bowl El Paso ● Texas Bowl Houston ● Insight Bowl Tempe ● Chick-fil-A Bowl Atlanta ● Outback Bowl Tampa ● ● Gator Bowl Jacksonville ● Capital One Bowl Orlando ● Rose Bowl Pasadena ● Sugar Bowl New Orleans ● International Bowl Toronto ● ● Papajohns.com Bowl Birmingham ● Cotton Bowl Arlington ● Liberty Bowl Memphis ● Alamo Bowl San Antonio ● Fiesta Bowl Glendale ● GMAC Bowl Mobile ● BCS National Championship* Pasadena ●
* Game rotates between Pasadena, Glendale, New Orleans, and Miami. Source: NCAA, AECOM
High School Football Games
In addition to college football games, many NFL stadiums also host high school football games. As one of
the premier football stadiums in each state, they are often the host of state championships, as well as
regular season games and tournaments. Similar to college football games, high school games would take
place during NFL season or immediately before. The type of games hosted (such as regular season vs.
playoffs) and the home markets of the participating teams would significantly affect the economic impacts
that could be generated.

F
AECOM Project No. 18300 Page 65
Examples of NFL stadiums that host high school football are as follows:
• Soldier Field hosts an annual high school Kickoff Classic tripleheader on a Friday in late August.
• The new Cowboys Stadium hosted the Kirk Herbstreit Varsity Series in 2009, which consisted of
four games on one day, with teams from throughout the country.
• In past years, Reliant Park has hosted a high school football kickoff classic doubleheader.
• Since its recent opening, Lucas Oil Stadium has hosted multiple high school games, including the
four-game Horseshoe Classic and the two-game Peyback Classic (named for Peyton Manning).
• M&T Bank Stadium annually hosts two local rivalry games in November. Attendance at each
game reaches approximately 13,000.
• Since 2005, Raymond James Stadium in Tampa has hosted an annual rivalry game between two
local high schools. Attendance reached a maximum of 13,000 but decreased to less than 5,000
last year.
• Seattle’s Qwest Field annually hosts the five-game Emerald City Kickoff Classic with local and
out-of-state teams, and the “Best of the West” game that features a top team from Washington
and one from another state. (The stadium’s public art program includes a piece called “The State
of Football” that incorporates a replica helmet of every high school team in Washington.)
• The following table lists the states that have NFL stadiums and whether they currently host their
state’s high school football championships. In general, attendance and out-of-town visitation (and
therefore, economic impacts) are expected to be greater at state championships games
compared to regular-season games.

F
AECOM Project No. 18300 Page 66
Table 35: High School Football Championships at NFL Stadiums
As the table shows, a number of NFL stadiums host all of their state’s championships, while others
only host larger classes’ championships or regional championships. (Those that do or have hosted
championships are highlighted.) In Wisconsin, all classes’ championships are played at Madison’s
Camp Randall Stadium.
State Stadium Host championships?
Arizona Univ. of Phoenix Stadium Yes, but not all classes
CaliforniaOakland Oakland-Alameda County Coliseum NoSan Francisco Candlestick Park NoSan Diego Qualcomm Stadium Yes, regional championships at Qualcomm
Colorado Invesco Field Yes, but not all classes
FloridaMiami Sun Life Stadium No, but has hosted in the pastJacksonville Jacksonville Municipal Stadium NoTampa Raymond James Stadium No
Georgia Georgia Dome YesIllinois Soldier Field NoIndiana Lucas Oil Stadium Yes
Louisiana Superdome YesMaryland
Baltimore M&T Bank Stadium YesLandover FedEx Field No
Massachusetts Gillette Stadium E. MA championships, but not all classes
Michigan Ford Field Yes
Minnesota Metrodome YesMissouri
Kansas City Arrowhead Stadium NoSt. Louis Edward Jones Dome Yes
New Jersey Giants Stadium Yes, but not all classes
New York Ralph Wilson Stadium Yes, but not all classesNorth Carolina Bank of America Stadium NoOhio
Cincinnati Paul Brown Stadium NoCleveland Cleveland Browns Stadium No, but have been in Cleveland in the past
PennsylvaniaPhiladelphia Lincoln Finanical Field NoPittsburgh Heinz Field W. PA championships at Heinz Field
Tennessee LP Field No
TexasDallas Cowboys Stadium Texas Stadium has hosted Class 5A; new stadium is expected to
Houston Reliant Stadium Reliant has hosted Class 5A in the pastWashington Qwest Field NoWisconsin Lambeau Field No (all classes at Camp Randall Stadium)
Soruce: AECOM
F
AECOM Project No. 18300 Page 67
Other Events (Sports and Non-Sports)
Outdoor NFL stadiums in both warm and cold climates also often host a wide range of other events,
although these are often non-recurring, one-time events. (Domed NFL stadiums can also host other types
of events, such as basketball games and professional wrestling, which are not possible at Lambeau
Field.) This section describes events other than those discussed above that have commonly been held at
NFL stadiums.
Soccer
Many NFL stadiums have hosted a wide range of soccer matches over the years, including Major League
Soccer (MLS) and collegiate games, international tournaments, and international qualifying games and
exhibitions (“friendlies”). In 2009, the World Football Challenge – an exhibition tournament between four
North American and European clubs – was held at six US football stadiums. The facilities included four
NFL stadiums (the Georgia Dome, M&T Bank Stadium, Gillette Stadium, and Cowboys Stadium,) and two
college stadiums (the Rose Bowl and Stanford Stadium). In addition, this July, Fenway Park will host its
first soccer game since 1968, with a friendly between Scottish and Portuguese clubs.
The Ravens and M&T Bank Stadium have been particularly active in the international soccer market. In
addition to last year’s World Football Challenge match, the Ravens are the promoter of this summer’s
Manchester City-Inter Milan friendly and are actively seeking top matchups for future summers.
According to the U.S. Soccer Federation, the sport’s national governing body, Lambeau Field’s playing
field is generally too small to accommodate soccer. Professional soccer fields are typically 70 to 75 yards
wide, which is larger than Lambeau’s surface, particularly in the corners. According to the USSF, if
Lambeau’s surface was large enough for soccer, the federation would have already tried to bring matches
to the stadium. However, in non-Olympic and -World Cup years, field standards are not as stringent, and
Lambeau Field would have a better opportunity to host soccer matches. In 2009, the stadium had the
opportunity to host a US women’s national team match, but the game was held elsewhere due to
concerns from the District regarding attendance. In addition, the District submitted a preliminary venue
questionnaire to the USA Bid Committee to be considered as a host of 2018 or 2022 World Cup matches.
However, Lambeau Field was not considered as a finalist due to the size of the Green Bay market, the
stadium’s capacity, and the size of the playing field.
Hockey
In recent years, collegiate and professional hockey games played in outdoor stadiums have become
more popular. The highest-profile game is the NHL’s annual game on New Year’s Day, which is now
known as the Winter Classic. These games have been held in NHL markets, and the two most recent
games have been in MLB stadiums (Chicago’s Wrigley Field and Boston’s Fenway Park), although the
2008 game was at the NFL’s Ralph Wilson Stadium in Orchard Park, New York. (The NHL’s only other
outdoor game was held at the 57,000-seat Commonwealth Stadium in Edmonton in 2003.) In late May,
F
AECOM Project No. 18300 Page 68
the NHL announced that the 2011 Winter Classic will be played at Pittsburgh’s Heinz Field. A second
outdoor game, the 2011 Heritage Classic, is expected to be formalized this summer and would be held
next February at the 38,000-seat McMahon Stadium in Calgary.
Examples of other past and upcoming outdoor hockey games include the following:
• In 2006, Lambeau Field hosted the Frozen Tundra Hockey Classic between the University of
Wisconsin and Ohio State, in front of approximately 41,000 fans.
• In 2001, Michigan State hosted Michigan at Spartan Stadium, and the game held the worldwide
hockey attendance record of approximately 75,000 until this May, when a US-Germany game at
the world championships attracted nearly 78,000 people to a soccer stadium in Germany.
This December, Michigan and MSU will have a rematch at Michigan Stadium, and six days before
the game, three high school hockey games will be played on the ice. In May, when ticket sales for
the UM-MSU game exceeded 100,000, ticket sales were stopped in order to allow incoming
freshman to have the opportunity to purchase tickets in the fall. (Michigan Stadium’s capacity will
exceed 108,000 when ongoing renovations are complete by the fall.)
• Wisconsin played Michigan at Madison’s Camp Randall Stadium in February 2010. The “Camp
Randall Hockey Classic” attracted 55,000 attendees in the 80,000-seat stadium, which is
currently the second-highest attendance for a non-NHL hockey game. The success of this game
on campus may potentially decrease the likelihood of the Badgers playing at Lambeau Field
again, where they don’t control all revenues.
• A doubleheader of four local college teams was held at Fenway Park the weekend after this
year’s Winter Classic.
• In February 2010, the first minor-league game (American Hockey League) was played outside at
the New York State Fairgrounds in Syracuse.
Other Sports
A number of other sports have also been held on NFL fields, including lacrosse, rugby, and monster
trucks, in addition to marching band events and competitions (the dimensions of a lacrosse and rugby
field are similar to that of a football field). In March, Cowboys Stadium hosted a Manny Pacquiao-Joshua
Clottey boxing match, and is one of two venues being considered for a Pacquiao-Floyd Maywheather
bout this November. Also, this June, Yankee Stadium hosted a Miguel Cotto-Yuri Foreman bout. In some
cases, the events are generally held in a specific geographic region because of a sport’s following (for
example, the NCAA lacrosse championship has been held at multiple NFL stadiums on the East Coast).
Events such as professional bull riding, monster trucks, and Snocross are often held in large stadiums
and arenas. In 2010, the ISOC Snocross series will be held at facilities including the Milwaukee Mile, LCO
F
AECOM Project No. 18300 Page 69
Casino in Hayward, the Grand Geneva in Lake Geneva, and MLS’ Rio Tinto Stadium outside of Salt Lake
City. The Advance Auto Parts Monster Jam series will be held at many NFL and MLB stadiums, including
the Metrodome, Raymond James Stadium, Lucas Oil Stadium, Qualcomm Stadium, and others. Also, the
AMA Supercross series will only be held in large stadiums (indoor and outdoor), including Lucas Oil
Stadium, Qwest Field, AT&T Park, the University of Utah’s Rice-Eccles Stadium, and Sam Boyd Stadium
in Las Vegas.
Parking Lots and Practice Fields
In addition to the stadium field, a number of facilities have held events in their parking lots and/or on
adjacent practice fields. Based on a review of the event calendars of other NFL and MLB stadiums, these
events have included music festivals, family shows such as Cirque du Soleil, car sales and shows,
paintball and go-karting events, and social/community events such as a Boy Scout sleepover.
Other Stadium and Field Rentals
Similar to the use of parking lots and practice fields, major stadiums also make other facilities (such as
club areas, suites, press boxes, locker rooms, concourses, and others) available for rent. This is currently
done at Lambeau Field. In addition, stadiums generally also make the playing field available for rentals,
such as banquets, workouts, weddings, and other events. Depending on an event’s size and orientation,
these events can generate economic impacts, or alternatively allow for local use of a facility. While most
major stadiums actively advertise their playing field for rent, the following summarizes various information
related to the use of stadium fields:
• In the NFL, many outdoor stadiums, such as those in Denver, Jacksonville, and Chicago,
advertise field rentals for private events, but rates are not advertised.
• In MLB, a number of stadiums have published their standard rates for field usage by private
events:
o In Cincinnati (Great American Ballpark), a group can take batting practice for $2,500,
o In Washington D.C. (Nationals Park), a three-hour batting practice costs $20,000,
o In San Francisco (AT&T Park), the entire stadium can be rented for $100,000
(weekdays) and $150,000 (weeknights and weekends). Batting practice on the field costs
$25,000 to $35,000,
o In San Diego (Petco Park), two hours of field use costs $18,500, and
o In Chicago (US Cellular Field), the White Sox offer a number of on-field wedding
packages, and in the past have offered on-field picnics, movies, and sleepovers to the
general public.
F
AECOM Project No. 18300 Page 70
Other Relevant Considerations Based on a review of the non-tenant events held at other similar stadiums across the country, discussions
with client representatives, other local stakeholders, and event/industry professionals, it appears as
though there would be a market for other impact-generating events at Lambeau Field (although some
events would attract a larger share of local residents). Aside from various issues mentioned above that
would affect the stadium’s ability to host events, the following also merit consideration:
• For concerts, Milwaukee’s Summerfest and Oshkosh’s Country USA Music Festival are held in
June and July. Due to contractual restrictions with the promoters of these events related to
geography and time, performers at these two festivals would generally not be able to play in
Green Bay in the same summer.
• Alpine Valley Music Theatre in East Troy is a Live Nation venue, and the company would
generally be expected to rout its acts there (where it controls all revenues) rather than to other
facilities in the area. The 36,000-seat venue routinely hosts many of the top major touring acts in
any summer, such as the Dave Matthews Band, Phish, Jack Johnson, Coldplay, and others.
• The standard ten-percent ticket tax at Lambeau Field can potentially be problematic when
negotiating with promoters, as they typically would want to share in at least part of it (which they
consider to be part of the ticket price). However, an amendment to the ticket-tax clause allows for
the tax revenue to be used for any direct event-related expense, including payments to promoters
and/or artists.
• For concerts in particular, most of Lambeau Field’s club seats and luxury suites are essentially
unusable, as they are fully indoors behind inoperable windows. (As a result, Lambeau’s seating
capacity is estimated at 54,000 for most concerts.)
• Because the Packers would retain ancillary revenues from other stadium events, they are
perhaps in the best position to act as an event promoter. An outside promoter would have to earn
its profit on ticket sales only, while the Packers could also rely on other sources, which would help
to reduce the risk of lower-than-anticipated ticket sales.
Conclusions Because there have been so few major events at Lambeau Field (not including Packers games and
Atrium events), it is difficult to compare the actual estimated impacts of various types of events to Brown
County. However, as previously shown in this report, the impacts associated with training camp, Packers
games, and Atrium events are substantial. As other stadiums have shown, a wide range of non-NFL
F
AECOM Project No. 18300 Page 71
stadium events can be attracted to facilities, and these events often capture attendees from a large
geographic area.
The following highlights rough estimates of visitation and impacts that have been and could be generated
by various types of events at Lambeau Field:
• Training Camp – as previously shown, 82 percent of training camp attendees are from outside of
Brown County who stay an average of nearly two days. Total estimated economic impacts from
training camp in 2009 were approximately $7.4 million, based on 34,000 attendees. Training
camp’s length and general schedule are set by the NFL, and practice attendance is already
maximized based on seating capacity. However, the Packers have been attempting to increase
visitation by adding other events during training camp, such as the 5K Run/Walk (which sold out
in 2010) and the Packers Movie Night and fireworks show. An increase in total attendance of ten
percent, for example, could generate an additional $740,000 in economic impacts, based on the
characteristics of 2009 attendees.
• Packers Preseason and Regular-Season Games – as previously shown, total economic
impacts from last year’s ten-game home Packers schedule (preseason and regular season) were
approximately $123 million, or an estimated $12 million per game. Assuming the overall NFL
schedule is not expanded, these impacts are largely limited by the size of Lambeau Field, since
all games are sold out. However, with an estimated 87 percent of attendees coming from outside
of Brown County, a seating expansion would allow for greater impacts. For example, an
additional 10,000 seats in Lambeau Field would presumably lead to 8,700 additional non-local
attendees per game, or 87,000 per season. Based on the estimated per-game impacts and the
current number of non-local attendees, a seating expansion of 10,000 seats could generate an
additional $17 million in spending impacts per year (or approximately $1.7 million per home
game).
• Atrium Events – while we have not explored the market for additional space within the Atrium, or
other uses of existing Atrium space, approximately 60 percent of event attendees at the Atrium in
2009 originated from outside of Brown County. Corporate events in particular (65 percent)
attracted non-local attendees. Based on the Atrium’s 2009 usage and attendee characteristics, an
increase in total Atrium attendance of ten percent could generate an additional $1 million in
economic impacts.
• Concerts and Other Events – because these types of events were not held at Lambeau Field in
2009, we have not estimated their impacts to Brown County based on actual data. However, as is
shown above, these events at other stadiums have clearly attracted large percentages of non-
local attendees. Similar to Packers training camp and the team’s home games, for which more
than 85 percent of attendees live outside of Brown County, a major event such as a concert is

F
AECOM Project No. 18300 Page 72
also expected to attract a significant share of non-local attendees. This type of event would also
be expected to be a regional draw due to the limited number of other facilities throughout
Wisconsin that could host a major outdoor concert or sporting event. In addition, because these
events are not currently being held at Lambeau Field, all associated impacts would be
incremental to impacts from 2009 and other recent years.
The preceding sections reviewed non-NFL events typically held at stadiums and highlighted events that
have been held at Lambeau Field. Interviews with the District and team indicate that the District has been
working diligently with the Packers to bring non-NFL events to the stadium. While the team has been
generally cooperative and has displayed flexibility, there has been some reluctance, particularly in regard
to holding on-field events when the turf is not frozen. The District understands that holding a successful
non-NFL event requires the full cooperation of the team, and the approach outlined below has been
taken.
• Snowmobile races held during the winter in 2004 through 2006 were an important first step in
opening the complex to non-football events in the stadium bowl. The events provided valuable
experience to the facility’s operating staff. Although attendance was lower than anticipated,
economic impacts to the community were generated. Also, the events helped build confidence
that non-football events could be held on the playing field (at a minimum, when it is frozen)
without fear of causing significant damage.
• The Frozen Tundra Classic in 2006 built upon the experience provided by the snowmobile races
and involved installation of an ice rink and seating on the playing field. The event further
increased confidence regarding use of the field and provided valuable experience with promotion,
load-in and load-out, and other operational aspects of a major non-football event with more than
40,000 attendees.
• The Leap of Faith event held in 2007 demonstrated that District events could be reasonably
accommodated outside of the offseason and the District’s priority scheduling period. This opens
up a larger scheduling window for hosting non-football events.
• In 2009, after working for a number of years with a local promoter to bring a concert to Lambeau
Field but with no concrete results, public concern began to rise. The District reviewed and
summarized news coverage regarding the Lambeau Field referendum, and at its June meeting
concluded that coverage created the public expectation that non-football events would be held at
the stadium and that they would generate significant economic impacts locally. This summary
was reviewed and discussed with the Packers. In August 2009, the District and team made a
presentation to a City of Green Bay Committee that requested an update regarding possible non-
football events at the stadium. At that point, there still appeared to be team concerns regarding an
event’s impact on the playing field.

F
AECOM Project No. 18300 Page 73
• In response to continuing concerns regarding field protection, the District worked with the Packers
to evaluate field protection systems by installing various products on the practice field in
September 2009. A satisfactory outcome of the evaluation appears to have been a major turning
point, and the Packers became much more receptive to the idea of an on-field concert.
Consequently, an offer was presented to a major act for a summer 2010 concert, although an
agreement could not be reached with the artist.
• In May 2010, LZ Lambeau was held and involved use of the seating bowl (including construction
of a stage in the bowl and limited use of the playing field). The event further demonstrated the
capability of the stadium to host non-football events. Additionally, a local tourism official reported
that the event was a huge success throughout the community, based on responses from local
hoteliers and retailers. The event clearly created an appetite for additional non-football events at
the stadium.
• In July 2010, a production company for a major concert act toured the stadium and found it
acceptable for a concert. The District and team, in cooperation with a local promoter, hope to
attract a concert in 2011.
In the following section, we discuss potential capital improvements to Lambeau Field that could help to
generate additional impacts from various types of events.
F
AECOM Project No. 18300 Page 74
X. Capital Improvements for Additional Potential Impacts According to a recent report in the SportsBusiness Journal, “throughout the NFL, teams and facilities are
taking a more comprehensive look at planning upgrades over the next 10 to 20 years, compared with
implementing isolated projects without considering the long-term effects.” In conjunction with the previous
section, this section further explores the potential for Lambeau Field and its surrounding area to generate
additional impacts through development of new facilities and amenities, accommodation of additional
events, and others. We also discuss complementary facilities that have been developed at other NFL
stadiums.
Events’ Needs and Capabilities of Lambeau Field and the Atrium Based on discussions with event professionals, Lambeau Field’s physical offerings are generally
sufficient to host the types of events that are typically held in NFL stadiums. As described in the previous
section, the playing field is too small to host professional soccer matches. However, the field has already
successfully hosted major collegiate hockey, and there appear to be no significant physical impediments
to hosting concerts or other sporting events. Based on our interviews, Lambeau Field’s sound system is
sufficient, although concerts often supply their own sound equipment based on their unique needs. The
stadium’s loading dock system is not ideal, but is not such that it would preclude events from coming to
Lambeau Field. Beyond these characteristics, two issues appear to remain:
• Premium seating – currently, most of Lambeau Field’s premium seating (all club seats and some
luxury suites) are fully enclosed behind inoperable windows. While this provides protection from
weather, these seats are unusable for concerts in particular due to the windows’ effect on sound.
Providing windows that can be opened and closed would allow these higher-margin seats to
remain in inventory for all stadium events, and would provide seatholders with the option of
opening and closing the windows.
In addition, the Packers are currently exploring the potential market for additional premium
seating offerings at Lambeau Field.
• Seating capacity – Packers games have famously been sold out for decades, and according to
the team, the season-ticket waiting list has more than 80,000 names (with an average wait of 30
years). Because of this demand, single-game tickets are not sold. An expansion of Lambeau
Field’s seating capacity would allow for additional attendance at Packers games, and as
described in the previous section, a high percentage of these attendees would generate
economic impacts because most live outside of Brown County.
As described in the previous section, we have not completed a market analysis for the need for additional
event space in the Atrium.
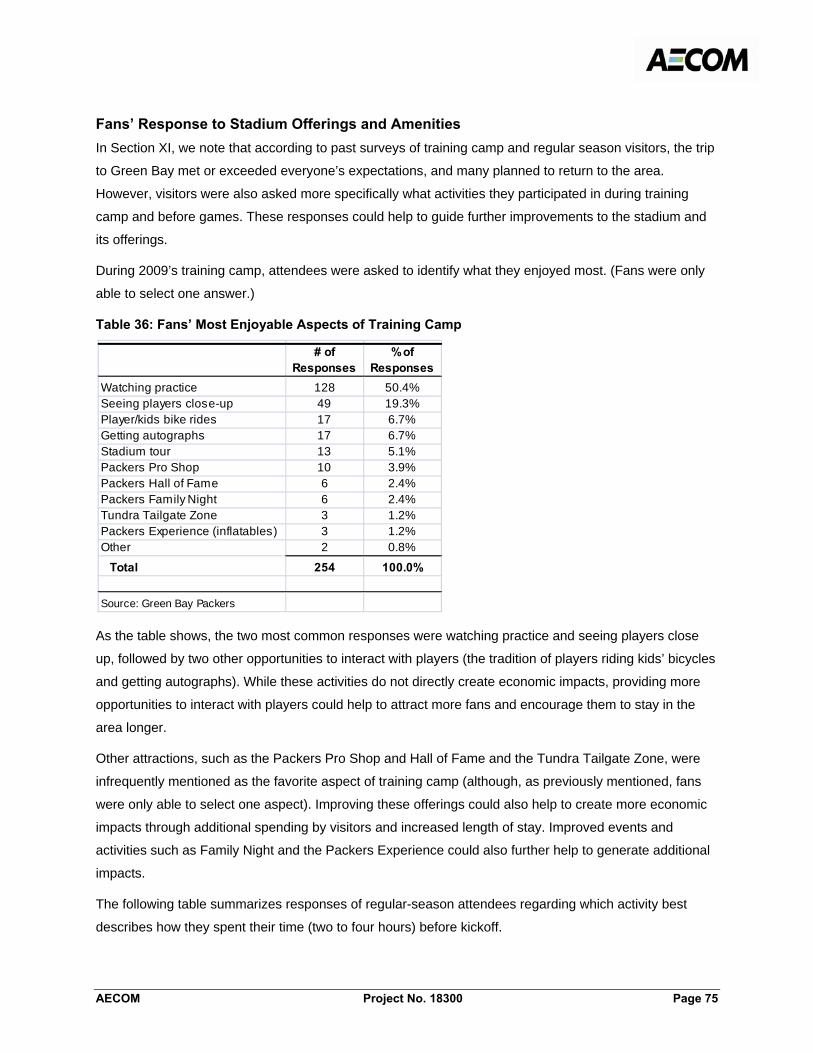
F
AECOM Project No. 18300 Page 75
Fans’ Response to Stadium Offerings and Amenities In Section XI, we note that according to past surveys of training camp and regular season visitors, the trip
to Green Bay met or exceeded everyone’s expectations, and many planned to return to the area.
However, visitors were also asked more specifically what activities they participated in during training
camp and before games. These responses could help to guide further improvements to the stadium and
its offerings.
During 2009’s training camp, attendees were asked to identify what they enjoyed most. (Fans were only
able to select one answer.)
Table 36: Fans’ Most Enjoyable Aspects of Training Camp
As the table shows, the two most common responses were watching practice and seeing players close
up, followed by two other opportunities to interact with players (the tradition of players riding kids’ bicycles
and getting autographs). While these activities do not directly create economic impacts, providing more
opportunities to interact with players could help to attract more fans and encourage them to stay in the
area longer.
Other attractions, such as the Packers Pro Shop and Hall of Fame and the Tundra Tailgate Zone, were
infrequently mentioned as the favorite aspect of training camp (although, as previously mentioned, fans
were only able to select one aspect). Improving these offerings could also help to create more economic
impacts through additional spending by visitors and increased length of stay. Improved events and
activities such as Family Night and the Packers Experience could also further help to generate additional
impacts.
The following table summarizes responses of regular-season attendees regarding which activity best
describes how they spent their time (two to four hours) before kickoff.
# of Responses
% of Responses
Watching practice 128 50.4%Seeing players close-up 49 19.3%Player/kids bike rides 17 6.7%Getting autographs 17 6.7%Stadium tour 13 5.1%Packers Pro Shop 10 3.9%Packers Hall of Fame 6 2.4%Packers Family Night 6 2.4%Tundra Tailgate Zone 3 1.2%Packers Experience (inflatables) 3 1.2%Other 2 0.8%
Total 254 100.0%
Source: Green Bay Packers
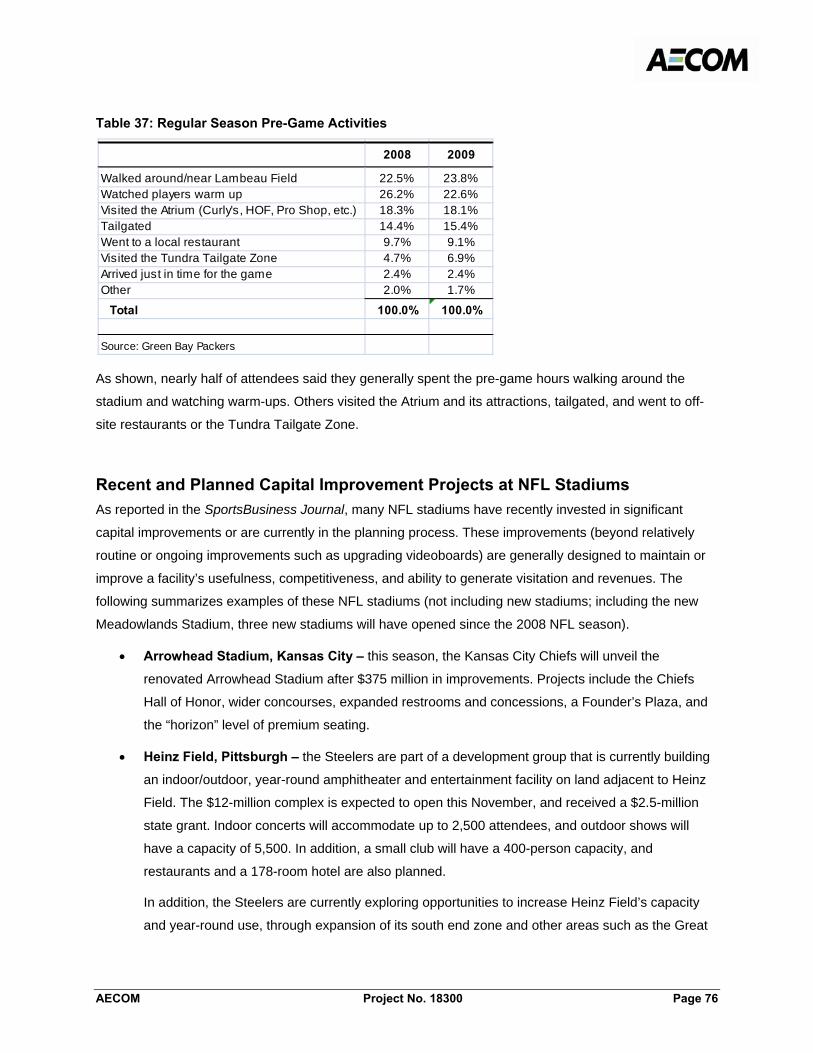
F
AECOM Project No. 18300 Page 76
Table 37: Regular Season Pre-Game Activities
As shown, nearly half of attendees said they generally spent the pre-game hours walking around the
stadium and watching warm-ups. Others visited the Atrium and its attractions, tailgated, and went to off-
site restaurants or the Tundra Tailgate Zone.
Recent and Planned Capital Improvement Projects at NFL Stadiums As reported in the SportsBusiness Journal, many NFL stadiums have recently invested in significant
capital improvements or are currently in the planning process. These improvements (beyond relatively
routine or ongoing improvements such as upgrading videoboards) are generally designed to maintain or
improve a facility’s usefulness, competitiveness, and ability to generate visitation and revenues. The
following summarizes examples of these NFL stadiums (not including new stadiums; including the new
Meadowlands Stadium, three new stadiums will have opened since the 2008 NFL season).
• Arrowhead Stadium, Kansas City – this season, the Kansas City Chiefs will unveil the
renovated Arrowhead Stadium after $375 million in improvements. Projects include the Chiefs
Hall of Honor, wider concourses, expanded restrooms and concessions, a Founder’s Plaza, and
the “horizon” level of premium seating.
• Heinz Field, Pittsburgh – the Steelers are part of a development group that is currently building
an indoor/outdoor, year-round amphitheater and entertainment facility on land adjacent to Heinz
Field. The $12-million complex is expected to open this November, and received a $2.5-million
state grant. Indoor concerts will accommodate up to 2,500 attendees, and outdoor shows will
have a capacity of 5,500. In addition, a small club will have a 400-person capacity, and
restaurants and a 178-room hotel are also planned.
In addition, the Steelers are currently exploring opportunities to increase Heinz Field’s capacity
and year-round use, through expansion of its south end zone and other areas such as the Great
2008 2009
Walked around/near Lambeau Field 22.5% 23.8%Watched players warm up 26.2% 22.6%Visited the Atrium (Curly's, HOF, Pro Shop, etc.) 18.3% 18.1%Tailgated 14.4% 15.4%Went to a local restaurant 9.7% 9.1%Visited the Tundra Tailgate Zone 4.7% 6.9%Arrived just in time for the game 2.4% 2.4%Other 2.0% 1.7%
Total 100.0% 100.0%
Source: Green Bay Packers
F
AECOM Project No. 18300 Page 77
Hall. Similar to Lambeau Field, Heinz Field’s south end zone has additional capacity for various
types of seating areas ranging from group areas to premium seating and special event space.
• Soldier Field, Chicago – the Chicago Park District, owner of Soldier Field, recently started a
master plan that will aim to keep to stadium in the top 25 percent of NFL venues over the next 15
years. The plan will include looking into the stadium’s ability to book more special events, both
inside and outside of the stadium. In the NFL, only Soldier Field is older than Lambeau Field, and
like Lambeau, it recently underwent a major renovation that brought the facility more in line with
other facilities across the league.
• Georgia Dome, Atlanta – the Falcons and their landlord, the Georgia World Congress Center
Authority, have been in talks regarding renovations to the Georgia Dome or a potential new open-
air stadium. The Authority recently commissioned a study that would attempt to upgrade the
Dome to current standards, including a retractable roof, doubling the number of club seats, and
adding more parking spaces.
Other teams, including the St. Louis Rams and Cincinnati Bengals, have leases that stipulate that their
facility must remain among the league’s best in terms of characteristics such as amenities, quality, and
revenue generation. In addition, a number of NFL teams are actively seeking new facilities, including the
Minnesota Vikings, San Diego Chargers, Oakland Raiders, and San Francisco 49ers.
Facilities at Other NFL Stadiums A number of other NFL teams, cities, and facility owners have successfully developed ancillary facilities
within and adjacent to their stadiums that help to generate additional visitation and local use, and the
accompanying impacts (as well as use by local residents and events). This section briefly summarizes
examples of these facilities (not including any that are similar to those already in place in Green Bay,
such as the Atrium).
It is important to note that we have not prepared market analyses for any of these uses and therefore are
not recommending them for the Lambeau Field area, or Green Bay in general. These uses, and any
others, would have to be studied in the broader context of the local market and the potential need for new
event, entertainment, retail, and other uses, particularly due to differences in characteristics such as
market size and climate. However, these represent examples of successful facilities and attractions that
have been built in the immediate vicinity of NFL stadiums in other markets.
• Youth Football Stadium, Buffalo – in 2004, the Bills became the first NFL team to open a youth
football facility on its stadium site. The Bills do not charge for use of the field, and users are
primarily from western New York but also from across the country. In 2008, the stadium hosted
more than 40 games, including the I-90 Youth Football Classic (10 games and a pee-wee football

F
AECOM Project No. 18300 Page 78
carnival), national flag football tournaments, coaching clinics, and player development camps.
The facility is also the home of the Jim Kelly Football Camp, which attracts more than 500 players
from across the country. The facility, formerly a Bills practice field, was partially funded by the
NFL Youth Football Fund.
At Milwaukee’s Miller Park (MLB), the Brewers have a similar facility that is focused on baseball and softball. Helfaer Field is primarily used for youth games, but is also rented for Brewers’ pre-game tailgating and private parties.
• Concerts on the Green, San Diego – when the Chargers moved from their previous practice
space adjacent to Qualcomm Stadium to a new facility, the City of San Diego contracted with
AEG Live to produce a concert series on the vacated practice field. The 200,000-square foot
space has a general admission capacity of 13,000 people. (Also, as previously mentioned in this
report, the MLB Padres recently announced their intention to self-promote a summer [in-season]
concert series at Petco Park, in a scaled-down configuration of approximately 6,000 seats that
would include on-field seating.)
• Patriot Place, Foxborough – The Kraft Group, owners of the Patriots and Gillette Stadium,
developed the open-air Patriot Place district that surrounds the stadium. Phase I of Patriot Place
opened in 2007. The complex includes more than 1.3 million square feet of retail, restaurant,
entertainment, and hotel uses, including New England’s first Bass Pro Shop, an outdoor skating
rink, and a health care center. Kidville, a children’s entertainment, play and educational facility, is
also being added to Patriot Place.
• Qwest Field Event Center, Seattle – the Qwest Field complex includes the Event Center, a
325,000-square foot exhibition facility, and the temporary 6,000-seat WaMu Theater that is
configured within the Event Center.
• Soldier Field, Chicago – when Soldier Field was renovated, 30 acres of surrounding parkland
was created and improved for public use. New spaces include a sledding hill, a children’s garden,
a veteran’s memorial (because of the stadium’s original dedication to American soldiers killed in
war), and others.
Also, at Wrigley Field in Chicago (an MLB stadium), the Cubs built a temporary ice rink adjacent to the
stadium, in a parking lot, during the 2009-10 winter offseason. The rink reportedly cost $300,000, and
skaters paid $6 (children) and $10 (adults) to use the facility.
F
AECOM Project No. 18300 Page 79
XI. Estimated Value of Earned Media Sports properties (such as the Packers) and sponsors alike often attempt to measure the value of media
coverage they receive, and a common method is through estimating the cost of purchasing an equivalent
amount of advertising space or time. This can include broadcast, print, and online coverage. Typically,
coverage is quantified in terms of its length (of broadcast time or print space) or number of mentions, and
a monetary value is assigned based on advertising rates.
However, this method is not ideal, as it does not necessarily consider the following:
• The quality of media coverage – for example, coverage of a team can be negative instead of
positive, and therefore less valuable to the team, or even costly,
• Estimating the actual length or amount of print media coverage – the entire length of a column (in
inches) is often used, although a team or facility may only receive a couple of mentions,
• Selecting the appropriate advertising rates – the maximum or published rates are often used,
when in fact lower rates are generally negotiated, and
• The assumption that 30 seconds of broadcast coverage that consists of ten different mentions of
three seconds each, for example, is not as valuable as a single, continuous 30-second ad.
In the larger picture, estimating the value of media coverage does not necessarily or directly address how
much of the audience was actually attentive to media mentions, or how their attitudes or actions may be
influenced by them. Despite these limitations, this method is commonly used, particularly by sponsors,
due to the ease of quantifying the data and objectively communicating its results. The Packers continually
monitor their media coverage, which is described below. And while the impact on awareness or image
related to media coverage is not directly quantified by this method, past surveys of Packers training camp
and regular-season game attendees have addressed some of these issues, and those results are also
summarized here.
Packers’ Media Coverage The Packers subscribe to a service that monitors the team’s media coverage year-round. This service
compiles all mentions of the team on major television and cable networks, as well as radio, across the
country. This does not currently include online coverage, and only includes weekdays. (Weekend
coverage, particularly during the season, would presumably exceed weekday coverage.) The number of
clips (on TV and radio), the estimated audience, and the estimated publicity value are provided. The
estimated publicity value is the equivalent advertising rate for the coverage in each market.
Because the data does not include weekends, the vast majority of Packers games are not included.
Through the NFL’s television contracts, every Packers game is broadcast on CBS, NBC, Fox, or ESPN.

F
AECOM Project No. 18300 Page 80
In 2009, the Packers played on one Sunday night game and two Monday night games that were
broadcast nationally. The Packers’ Monday night game against Minnesota on October 5, 2009 was the
highest-rated Monday Night Football game on ESPN, the highest-rated program in ESPN’s 30-year
history, and the highest-rated program ever on US cable television. The Packers also have a strong radio
presence, with coverage on more than 40 stations throughout Wisconsin, Michigan, Minnesota, North
Dakota, and South Dakota, as well as through the NFL’s contract with Sirius satellite radio.
The following table summarizes the team’s measurable media coverage during one and a half weeks of
the 2009 season, as well as the season-long coverage on weekdays.
Table 38: Packers Media Coverage
As shown, media coverage increases on Mondays after a Sunday game. During the five-month 2009-10
season, an estimated 3,900 Packer-related clips were seen by more than 271 million people, with a total
estimated media value of $14.2 million. On a typical day during the season, the Packers receive
approximately $150,000 worth of media coverage that is seen by nearly 2.9 million people across the
country. On November 9, 2009 (the day after the Packers’ game in Tampa Bay), the team received the
greatest amount of coverage in terms of the total audience and the publicity value (more than 14 million
people and $700,000, respectively).
Impact of Other Coverage on Fans and Attendees In recent years (2005 and 2008), the University of Wisconsin-Green Bay (UWGB) completed surveys of
fans that attended Packers training camp and regular-season games. Part of these surveys address
where fans receive their information related to their trips to Green Bay, and their reactions to local
marketing initiatives and their anticipated future behavior. The following summarizes these results, related
to media use/coverage and potential accompanying impacts.
Day Time of Week Total # of Clips
Cumulative Est. Audience
Cumulative Est. Publicity
ValueMonday, September 14, 2009 Day after Game (Wk. 1 vs. Chicago) 72 4,612,689 $116,904Tuesday, September 15, 2009 Midweek 43 2,290,323 77,902Thursday, September 17, 2009 Midweek 33 1,086,503 52,588Friday, September 18, 2009 Midweek 23 654,418 27,960Monday, September 21, 2009 Day after Game (Wk. 2 vs. Cincinnati) 52 2,199,427 95,922Wednesday, September 23, 2009 Midweek 37 1,459,261 50,276
2009-10 NFL Season (9-2-09 to 1/29/10)All Days Combined -- 3,894 271,381,278 $14,206,806Average Day -- 40 2,856,645 149,545Maximum* -- 76 14,111,622 708,612Minimum** -- 8 190,924 7,818
Source: Green Bay Packers, AECOM* From October 26 (# of clips; day after game @ Cleveland) and November 9 (audience and value; day after game @ Tampa Bay)** From January 22, 2010, the Friday before the NFC and AFC championship games; the Packers' season had already ended.
F
AECOM Project No. 18300 Page 81
• The primary source of trip-planning information for attendees was the Internet, and the Packers
web site was the most commonly-sited Web site. Other sources included newspapers, brochures,
and magazines.
All respondents indicated that their trip met or exceeded their expectations, and that they would return to
the Green Bay area, which would create additional impacts. Forty-one percent of respondents said that
their trip exceeded expectations, and the remaining 59 percent said that their trip met expectations. In
addition, 44 percent said that they would definitely return to the area within the next year, and 36 percent
said that they were very likely to return.

F
AECOM Project No. 18300 Page 82
XII. Other Community Impacts In addition to the impacts discussed in previous sections of this report, the Packers organization also
benefits the community in many other ways that are not necessarily captured by an economic impact
analysis. In this section, we briefly summarize various activities and contributions made by the team and
the Green Bay Packers Foundation, including current and former players, coaches, and staff. These
include donations to non-profit organizations throughout Brown County and the rest of Wisconsin and
Upper Michigan, fundraising events, personal appearances, and others.
According to the Packers’ Community Outreach Report, the team’s various contributions created a
“charity impact” of more than $4 million in 2008, the most recent year for which information is available
(and the year that is described below).
The Packers’ Community Activities and Contributions In general, the Packers’ community-based programs have the goals of assisting non-profit organizations,
mentoring youth, encouraging volunteerism, and gaining an awareness of communities’ unique needs. In
2008, this included more than 500 special appearances, 8,000 filled requests for signed memorabilia, and
more than $1.4 million in cash donations. Many of these initiatives were made possible through the
generosity of Packers fans and supporters, in addition to direct contributions from the team.
Events • Jerry Parins Cruise for Cancer – nearly 800 bikers, Packers players, and staff raised
approximately $250,000 for various cancer-related organizations.
• Brown County Children’s Charity Golf Classic – is sponsored by the Packers and raised
approximately $30,000.
• Preseason games – for nearly 60 years, the Packers have designated one preseason game as
the Midwest Shrine Game, which has raised more than $3.1 million in donations. Since 1961,
another preseason game has been the Bishop’s Charities Game, which has raised more than
$3.4 million for the Catholic Diocese of Green Bay.
• 65 Roses Celebrity Golf Tournament – the current Packers head coach historically serves as
honorary chairman of the tournament, which has raised more than $500,000 to fight cystic
fibrosis.
• Edgar Bennett Celebrity Bowl-A-Thon – the former Packers running back and current coach,
along with more than 80 other Packers, raised over $45,000 for The Angel Fund for Children with
Cancer.
F
AECOM Project No. 18300 Page 83
• Green and Gold Gala – this annual event supports family Services of Northeast Wisconsin,
which offers services to needy families in the area.
• Families of Children with Cancer Holiday Party – 16 Packers attended the annual event for
young cancer patients and their families.
Green Bay Packers Foundation Grants Since its inception in 1986, the Foundation has contributed more than $1.9 million towards education,
civic affairs, health services, human services, and youth-related programs. In 2008, 85 Wisconsin-based
groups received more than $170,000 ($96,000 of which was provided to Brown County organizations).
The Packers Scholarship Program, established in 2002, awards $15,000 in scholarships each year.
Community Outreach Initiatives • Fit Kids – in conjunction with WFRV, Karma Group, and the Green Bay Area Public School
District, Fit Kids is a fourth-grade curriculum that focuses on physical, nutritional, and social
health.
• What Moves U – the Packers and the American Heart Association offer middle schools
throughout the state a program designed to combat childhood obesity.
• Atlas and Athena – in partnership with seven Wisconsin high schools, the Packers initiated a
program designed to promote healthy living and reduce the use of steroids and other drugs.
• Hometown Huddle – the Packers and City of Green Bay provided a new playground for
Beaumont Elementary School Park.
• Coats for Kids – one regular-season game has been designated as a coat-collection drive. In
2008 fans donated more than 480 coats and $8,000.
• Internships and Pro Shop Outreach – the Packers offer internships in many departments of the
organization, and the Pro Shop annually hires two local high school students and provides two
scholarships through Scholarships, Inc.
• Project LEAP! – for this event, the Atrium is transformed into an indoor playground for children.
• Shindig at 1265 – provides activities for all ages to participate in events such as crafts, cookie
decorating, flower potting, and others.
• Spooktacular Fun at Lambeau Field – is a Halloween-themed public event held in the Atrium.
• Ecumenical Thanksgiving Day Dinner – a prayer service and dinner at the Atrium brought in
500 volunteers who served 850 needy residents, and an additional 600 meals were delivered to
local residents who could not leave their homes.
F
AECOM Project No. 18300 Page 84
• Make-A-Wish Foundation – in 2008, seven children with life-threatening illnesses chose to visit
the Packers and Lambeau Field.
• School visits – in 2008, Packers players visited 11 local schools.
• Cerebral Palsy Telethon – with the involvement of Mark Murphy and other Packers
representatives, the longtime event raised more than $1 million for Green Bay’s CP Center.
• Campbell’s Chunky Soup “Click for Cans” – for the seventh consecutive year, fans voted the
Packers as their favorite team, which resulted in more than 17,000 cans of soup being donated
across Wisconsin.
• Tailgate Tour – the annual four-day, four-city bus trip raised nearly $50,000 for non-profit
organizations across the state.
• Salvation Army – Packers players and coaches join the Salvation Army’s bell ringers and sign
autographs in exchange for donations.
• Toys for Tots – in 2008, $5,700 and nearly 2,600 toys were collected at Lambeau Field
Players’ Foundations A number of current Packers have charitable foundations that benefit Green Bay-area programs and
residents.
• The Donald Driver Foundation – works to improve the educational system and assist homeless
families in the Green Bay and Houston areas.
• The Greg Jennings Foundation – helps children and families to achieve their personal,
professional, and financial goals.
• James Jones’ “Love Jones 4 Kids Foundation” – focuses on the needs of children in Green
Bay and San Jose.
• The Al Harris Foundation – benefits inner-city kids in Pompano Beach, Florida and at-risk
children in Wisconsin.
Youth Football Initiatives • NFL Grassroots – Green Bay Southwest High School’s Dahlin Family Stadium received new
bleachers due in part to a $50,000 grant from the Packers, the NFL Youth Football Fund, and
Local Initiatives Support Corporation.
• NFL Player-Coach High School Football Grant – Randy Wright, coach at Sturgeon Bay High
School and a former Packer, received a $7,000 grant for his program.
F
AECOM Project No. 18300 Page 85
• NFL Player Matching Youth/High School Football Grant Program – current and former NFL
players are able to make contributions to programs that are matched up to $5,000. In 2008,
seven grants totaling $70,000 were awarded to Packers players for youth and high school
programs across the country.
• USA Football Equipment Grants – through USA Football, the Packers donated football
equipment to Denmark Youth Football and The Journey House of Milwaukee.
• Youth Football Games at Lambeau Field – the Packers annually invite Pop Warner leagues to
play on the field during halftime of Packers games. In 2008, the Neighborhood Children’s Sports
League of Milwaukee also participated in pregame and halftime activities.
• High School Football Coach of the Week – each week during the football season, the Packers
honor a high school coach in Wisconsin with a $1,000 grant for the school’s football program, and
the annual Coach of the Year receives $2,000.
• USA Football Coaching School – the Packers and USA Football jointly host a coaching clinic
exclusively for youth and middle school football coaches.
Volunteer Recognition Since 2000, the Packers have awarded a Community Quarterback Award to volunteers in order to
recognize their leadership and dedication. In 2008, ten residents received $2,000 grants.
Packers Women’s Association Comprised of female Packers employees and the significant others of players, coaches, and staff
members, the PWA provides time and resources to the community via outreach programs.
• Paul’s Pantry Food Drive – for more than 20 years, the PWA has collected more than 627,000
food items and $214,000 for Paul’s Pantry, a food distribution program that serves the local area.
• Football 101 Clinic – geared towards female Packer fans, covering the basics of football and the
lives of players and their families.
• Military Appreciation Project – the PWA created and sent care packages to more than two
dozen Wisconsin soldiers in Iraq and Afghanistan.
• Salvation Army’s Adopt-A-Family Program – PWA members adopted 24 families that received
holiday gifts and necessities, and in conjunction with Festival Foods, provided complete holiday
dinners.
• School Mentoring Program – PWA volunteers mentored at-risk students of a Green Bay school.
• Breast Cancer Awareness Event – PWA members participated in the Breast Cancer
Awareness Run/Walk.