Embed Size (px)
Citation preview
Design Consultancy for Upgradation of NH 47 Final Detailed Project Report From Thiruvananthapuram to Kanyakumari and Volume - I: Main Report NH 47B From Nagercoil to Kavalkinaru Package - II
SECON i NH 47 & 47B-66-PR-O001
LIST OF CONTENTS
1.0 EXECUTIVE SUMMARY .................................................................................................... 1
1.1 Project Background............................................................................................................. 1
1.2 Socio-Economic Profile ....................................................................................................... 2
1.3 Alignment and Engineering ................................................................................................ 3
1.4 Geometrics .......................................................................................................................... 3
1.5 Drainage .............................................................................................................................. 3
1.6 Cross Drainage Structures ................................................................................................. 4
1.7 Pavement Design ................................................................................................................ 4
1.8 At-Grade and Grade Separated Intersections .................................................................... 5
1.9 Project Facilities .................................................................................................................. 5
1.10 Cost Estimates .................................................................................................................... 5
1.11 Economic Analysis .............................................................................................................. 5
1.12 Financial Analysis for BOT Project ..................................................................................... 6
2.0 PROJECT BACKGROUND ............................................................................................... 6
2.1 Introduction ......................................................................................................................... 6
2.2 Slope protection by RE wall and Soil Nailing: .................................................................... 8
2.3 Demography........................................................................................................................ 8
2.3.1 Tamil Nadu State Profile ................................................................................................. 8 2.3.2 State Economy of Tamil Nadu ...................................................................................... 10 2.3.3 Kanyakumari District Profile ......................................................................................... 17
2.4 Social Analysis of the Project ........................................................................................... 20
2.4.1 Employment and Poverty Alleviation ............................................................................ 20 2.4.2 Agriculture and Rural Social Classes ........................................................................... 20 2.4.3 Industry, Trade, Commerce and Other Services ......................................................... 21 2.4.4 Literacy, Health and Human Resource Development .................................................. 21 2.4.5 Gender .......................................................................................................................... 21 2.4.6 Scheduled Castes ......................................................................................................... 21
2.5 Conclusion ........................................................................................................................ 22
3.0 SUMMARY OF SURVEY AND INVESTIGATIONS ........................................................ 22
3.1 Topographical and Cadastral Surveys ............................................................................. 22
3.1.1 Topographical Survey ................................................................................................... 22 3.1.2 Methodology for Topographical Survey ........................................................................ 22
3.2 Cadastral Survey .............................................................................................................. 23
3.3 Investigation Data ............................................................................................................. 23
3.3.1 Inventory for Structures ................................................................................................ 23 3.3.2 Benkelman Beam Deflection Survey ............................................................................ 24 3.3.3 Bump Integrator Test .................................................................................................... 24 3.3.4 Existing Soil Strata upto 2m below Ground Level ........................................................ 24 3.3.5 Borelog details .............................................................................................................. 24
4.0 TRAFFIC STUDY AND ANALYSIS ................................................................................. 24
4.1 Traffic Surveys .................................................................................................................. 24
4.1.1 General ......................................................................................................................... 24 4.1.2 Motorised Traffic ........................................................................................................... 25 4.1.3 Non-Motorised Traffic ................................................................................................... 25
4.2 Traffic surveys on NH 47 and NH 47B ............................................................................. 25
Design Consultancy for Upgradation of NH 47 Final Detailed Project Report From Thiruvananthapuram to Kanyakumari and Volume - I: Main Report NH 47B From Nagercoil to Kavalkinaru Package - II
SECON ii NH 47 & 47B-66-PR-O001
4.2.1 Classified Traffic Volume Counts ................................................................................. 25 4.2.2 Classified Turning Movement Surveys ......................................................................... 26 4.2.3 O-D Survey and Commodity Movement Survey .......................................................... 26 4.2.4 Axle Load Surveys ........................................................................................................ 26 4.2.5 Pedestrian / Cattle Surveys .......................................................................................... 26 4.2.6 Speed and Delay (Travel Time) Surveys ..................................................................... 26 4.2.7 Willingness to Pay Surveys .......................................................................................... 27
4.3 Traffic Analysis .................................................................................................................. 27
4.3.1 Historical Traffic ............................................................................................................ 27 4.3.2 Seasonal Variation ........................................................................................................ 27 4.3.3 Present Traffic Conditions ............................................................................................ 28 4.3.4 Traffic Flow along the Project Road ............................................................................. 28 4.3.5 Travel Pattern ............................................................................................................... 30 4.3.6 Axle Load Spectrum ..................................................................................................... 30 4.3.7 Turning Movement Survey............................................................................................ 31 4.3.8 Cross Pedestrian Traffic ............................................................................................... 31 4.3.9 Travel Time Analysis .................................................................................................... 31 4.3.10 Willingness to Pay (WTP) Toll ...................................................................................... 32 4.3.11 Accident Studies for NH 47 Section ............................................................................. 32
4.4 Traffic Projections for NH 47 ............................................................................................ 32
4.4.1 Economic Profile - Project Influence Area .................................................................... 32 4.4.2 Kerala ............................................................................................................................ 32 4.4.3 Tamil Nadu .................................................................................................................... 34
4.5 Economic Forecasts ......................................................................................................... 34
4.5.1 Elasticity of Traffic Demand .......................................................................................... 35 4.5.2 Economic Growth Rate ................................................................................................. 35 4.5.3 Traffic Growth Rates ..................................................................................................... 35 4.5.4 Traffic Forecast ............................................................................................................. 36 4.5.5 Traffic Capacity Analysis .............................................................................................. 37 4.5.6 Traffic Forecast for Intersection .................................................................................... 38
5.0 ALIGNMENT AND ENGINEERING ................................................................................. 38
5.1 Project Description ............................................................................................................ 38
5.1.1 General ......................................................................................................................... 38 5.1.2 Location and Terrain Conditions................................................................................... 38
5.2 Proposed Alignment ......................................................................................................... 39
5.2.1 Proposed Alignment for NH 47 Section ........................................................................ 39 5.2.2 Proposed Alignment for NH 47B Section ..................................................................... 40
5.3 Geometrics ........................................................................................................................ 42
5.4 Structure Design ............................................................................................................... 42
5.5 Design Parameters ........................................................................................................... 43
5.5.1 Design Standards ......................................................................................................... 43 5.5.2 Design Loads ................................................................................................................ 43 5.5.3 Materials ........................................................................................................................ 43 5.5.4 Bearing .......................................................................................................................... 44 5.5.5 Expansion Joints ........................................................................................................... 44 5.5.6 Wearing Coat ................................................................................................................ 44 5.5.7 Approach ....................................................................................................................... 44 5.5.8 Structure ........................................................................................................................ 44
5.6 Proposed Structures ......................................................................................................... 44
6.0 SUBGRADE INVESTIGATION FOR PAVEMENT .......................................................... 51
6.1 General ............................................................................................................................. 51
Design Consultancy for Upgradation of NH 47 Final Detailed Project Report From Thiruvananthapuram to Kanyakumari and Volume - I: Main Report NH 47B From Nagercoil to Kavalkinaru Package - II
SECON iii NH 47 & 47B-66-PR-O001
6.2 Test Pitting ........................................................................................................................ 51
6.3 Planning and Implementation of Test Programme ........................................................... 51
6.4 Analysis of Test Results ................................................................................................... 52
6.5 Implications for pavement designs ................................................................................... 52
7.0 ENVIRONMENTAL IMPACT ASSESSMENT AND MANAGEMENT PLAN.................. 52
7.1 Project Area ...................................................................................................................... 52
7.2 Objectives ......................................................................................................................... 52
7.3 Major Negative Impacts and their Mitigation .................................................................... 52
7.4 Significant Findings ........................................................................................................... 53
7.5 Cost of Environmental Management Plan ........................................................................ 54
8.0 RESETTLEMENT ACTION PLAN .................................................................................. 55
8.1 Description of Project ........................................................................................................ 55
8.2 Objectives ......................................................................................................................... 55
8.3 Socio Economic and Census Surveys ............................................................................. 56
8.4 Project Affected Persons (PAPs)...................................................................................... 56
8.5 Category of Project Affected Families .............................................................................. 56
8.6 Affected Structures By type .............................................................................................. 57
8.7 Loss of Land (Private and Government) .......................................................................... 57
8.8 Community Infrastructure and Assets .............................................................................. 57
8.9 Resettlement Principles .................................................................................................... 58
8.10 Consultation and Disclosures ........................................................................................... 58
8.11 Institutional Mechanism and Grievance Redressal .......................................................... 58
8.12 Total Cost of Rehabilitation and Resettlement ................................................................. 59
8.13 Monitoring and Evaluation ................................................................................................ 59
9.0 COST ESTIMATES .......................................................................................................... 60
9.1 Project Road Packages .................................................................................................... 60
9.2 Unit Rate Analysis ............................................................................................................. 60
9.3 Materials ............................................................................................................................ 60
9.3.1 Stone Metals ................................................................................................................. 60 9.3.2 Sand .............................................................................................................................. 60 9.3.3 Gravel ............................................................................................................................ 60 9.3.4 Earth Works .................................................................................................................. 60 9.3.5 Cement .......................................................................................................................... 61 9.3.6 Steel .............................................................................................................................. 61 9.3.7 Bitumen ......................................................................................................................... 61 9.3.8 Labour ........................................................................................................................... 61 9.3.9 User charges for machineries ....................................................................................... 61 9.3.10 Rates for RE Wall and Soil Nailing ............................................................................... 61 9.3.11 Unit Rate Analysis ......................................................................................................... 61
9.4 Unit Cost ........................................................................................................................... 61
9.4.1 Estimation / Value of quantities for Road work ............................................................ 61 9.4.2 Estimation of Quantities for Structures ......................................................................... 62 9.4.3 Junction Improvements ................................................................................................. 62 9.4.4 Miscellaneous Provisions ............................................................................................. 62 9.4.5 Land Acquisition and Compensation for Structures ..................................................... 63 9.4.6 Contingencies ............................................................................................................... 63 9.4.7 Construction Supervision .............................................................................................. 63
Design Consultancy for Upgradation of NH 47 Final Detailed Project Report From Thiruvananthapuram to Kanyakumari and Volume - I: Main Report NH 47B From Nagercoil to Kavalkinaru Package - II
SECON iv NH 47 & 47B-66-PR-O001
9.4.8 Landscaping .................................................................................................................. 64
9.5 Project cost for Package ................................................................................................... 64
10.0 ECONOMIC ANALYSIS ................................................................................................... 64
10.1 Introduction ....................................................................................................................... 64
10.2 Evaluation Framework ...................................................................................................... 64
10.3 The Project ........................................................................................................................ 65
10.4 Traffic Growth Scenarios .................................................................................................. 65
10.5 Economic Cost .................................................................................................................. 66
10.6 Economic Benefits ............................................................................................................ 66
10.6.1 Estimation of Vehicle Operating Cost ........................................................................... 67 10.6.2 Savings in Value of Time .............................................................................................. 68
10.7 Results of Economic Evaluation ....................................................................................... 68
10.8 Conclusion ........................................................................................................................ 68
11.0 BOT Analysis ................................................................................................................... 68
11.1 Preface .............................................................................................................................. 68
11.2 Project Cost ....................................................................................................................... 69
11.2.1 Civil Construction Cost ................................................................................................. 69 11.2.2 Interest during Construction (IDC) ................................................................................ 69 11.2.3 Contingencies ............................................................................................................... 70 11.2.4 Independent Consultant and Preoperative expenses .................................................. 70 11.2.5 Financing Cost .............................................................................................................. 70
11.3 Toll Rates .......................................................................................................................... 70
11.3.1 New Toll Policy ............................................................................................................. 70
11.4 Traffic ................................................................................................................................ 71
11.4.1 Traffic Growth rates ...................................................................................................... 71
11.5 Toll Revenue ..................................................................................................................... 71
11.6 Tax .................................................................................................................................... 71
11.7 Sources of Finance ........................................................................................................... 72
11.8 Expenses .......................................................................................................................... 72
11.8.1 Expenses during Construction Period .......................................................................... 72 11.8.2 Expenses during Operation and Maintenance Period ................................................. 72
11.9 Results of Financial Analysis ............................................................................................ 73
12.0 CONCLUSIONS AND RECOMMENDATIONS ............................................................... 74
12.1 General ............................................................................................................................. 74
12.2 Existing Road Conditions .................................................................................................. 74
12.3 Proposed Alignment ......................................................................................................... 74
12.4 Typical Cross Sections ..................................................................................................... 74
12.5 Proposed Structures ......................................................................................................... 75
12.6 Pavement Design .............................................................................................................. 75
12.7 Cost Estimate .................................................................................................................... 76
12.8 Economic Analysis ............................................................................................................ 76
Design Consultancy for Upgradation of NH 47 Final Detailed Project Report From Thiruvananthapuram to Kanyakumari and Volume - I: Main Report NH 47B From Nagercoil to Kavalkinaru Package - II
SECON v NH 47 & 47B-66-PR-O001
LIST OF TABLES Table 1.1: Details of the Construction Packages ........................................................................... 1 Table 1.2: List of cross drainage structures ................................................................................... 4 Table 1.3: Pavement Layer Thickness for Main Carriageway ....................................................... 4 Table 1.4: Pavement Layer Thickness for Service Road ............................................................... 5 Table 1.5: List Junctions ................................................................................................................. 5 Table 1.6: Summary of Economic Viability Analysis ...................................................................... 6 Table 1.7: Summary of Financial Analysis ..................................................................................... 6 Table 2.1: Widths of Cross Sectional Elements ............................................................................. 7 Table 2.2: Availability of space based on the CS Type ................................................................. 8 Table 2.2: Populations by Age Groups – (Projected) ..................................................................... 8 Table 2.3: Population by Religion ................................................................................................... 9 Table 2.4: Population Projection- Tamil Nadu................................................................................ 9 Table 2.5: Population of Tamil Nadu – Decennial Growth ........................................................... 10 Table 2.6: Net State Domestic Product*....................................................................................... 11 Table 2.7: Land Utilisation ............................................................................................................ 12 Table 2.8: Per-Capita Consumption of Electricity ........................................................................ 13 Table 2.9: Production of Crude Oil and Natural Gas in Tamil Nadu ............................................ 14 Table 2.10: Time Series Data - Transport Development in Tamil Nadu ...................................... 14 Table 2.11: Railways in Tamil Nadu – 2002-2003 ....................................................................... 15 Table 2.12: Port Development Vessels Entered and Cargo Handled – 2002-2003 .................... 15 Table 2.13: Performance of all State Transport Undertakings in Tamil Nadu ............................. 16 Table 2.14: Select Indicators of Performance of State Transport Corporations 2002-2003 ....... 16 Table 4.1: Traffic Volume Count Location .................................................................................... 25 Table 4.2: Turning Movement Traffic Volume Count Locations .................................................. 26 Table 4.3: Origin-Destination Survey Locations ........................................................................... 26 Table 4.4: Willingness to Pay Survey Locations .......................................................................... 27 Table 4.5(a): Vehicle registration data for Kanyakumari District. ................................................ 27 Table 4.5(b): Vehicle registration data for Tamil Nadu State ....................................................... 27 Table 4.6: PCU Values Adopted ................................................................................................... 28 Table 4.7: Present Traffic Count Result ....................................................................................... 28 Table 4.8: Average Compositions of Vehicles at each Location ................................................. 29 Table 4.9: Directional Split (in percentages) ................................................................................ 30 Table 4.10: VDF for Different Category of Vehicles ..................................................................... 31 Table 4.11: Present Peak Hour Traffic Flow ................................................................................ 31 Table 4.12(a): Accident Data for Kanyakumari District for NH 47 Section .................................. 32 Table 4.12(b): Accident Data for NH 47 B Section ...................................................................... 32 Table 4.13: Growth of Population, Kerala and India: 1971-2001 (in Millions) ............................. 33 Table 4.14: Growth Rate of Urban Population in Kerala, 1981-1991 .......................................... 33 Table 4.15: Growths in NSDP and Per Capita Income in Kerala State ....................................... 33 Table 4.16: Growths in NSDP and Per Capita Income in Tamil Nadu State ............................... 34 Table 4.17: Elasticity values ......................................................................................................... 35 Table 4.18 (a): Estimated traffic growth rates for Low Scenario .................................................. 36 Table 4.18 (b): Estimated traffic growth rates for Medium Scenario ........................................... 36 Table 4.18 (c): Estimated traffic growth rates for High Scenario ................................................. 36 Table 4.19: Future Projected Volume for existing Road Based on Medium Growth rates ......... 36 Table 4.20: Projected Volume for the existing Road Based on the 5% growth ........................... 37 Table 4.21(a): Volume-Capacity Ratio (Existing Road) ............................................................... 37 Table 4.21(b): Volume-Capacity Ratio (New Road) ..................................................................... 37 Table 4.22: Projected Traffic at Intersections by Medium Growth Rates .................................... 38 Table 5.1: Proposed Road Widening or Alignment Details .......................................................... 41 Table 5.2: List of Major Bridges .................................................................................................... 45 Table 5.3: List of Minor Bridges .................................................................................................... 45 Table 5.4: List of Box Culverts Proposed for Improvement or New Construction ....................... 45 Table 5.5: List of Pipe Culverts Proposed for Improvement or New Construction ...................... 47
Design Consultancy for Upgradation of NH 47 Final Detailed Project Report From Thiruvananthapuram to Kanyakumari and Volume - I: Main Report NH 47B From Nagercoil to Kavalkinaru Package - II
SECON vi NH 47 & 47B-66-PR-O001
Table 5.6: Details of Underpasses/Overpasses ........................................................................... 50 Table 5.7: Details of Proposed ROBs .......................................................................................... 51 Table 6.1: Sub-Soil Stratification upto Excavated Depth ............................................................. 52 Table 7.1: Negative Impacts and their Mitigation Measures ........................................................ 53 Table 7.2: ‘Hot Spots’ identified during Environmental / Social Screening Analysis ................... 53 Table 8.1: Project Affected Families & Persons In Terms of Project Impact .............................. 56 Table 8.2: Category of Project Affected Families in Terms of Project Impacts ........................... 56 Table 8.3: Details of Structures .................................................................................................... 57 Table 8.4: Land Acquisition within Project ROW ......................................................................... 57 Table 8.5: Details of Community Structures, Assets and Religious structures ........................... 58 Table 8.6: Total Costs of Rehabilitation and Resettlement .......................................................... 59 Table 9.1: Details of Packages ..................................................................................................... 60 Table 9.2: Pavement Layer Thickness for Main Carriageway ..................................................... 62 Table 9.3: Pavement Layer Thickness for Service Road ............................................................. 62 Table 9.4: Cost for Land Acquisition and Structure ..................................................................... 63 Table 10.1: Details of Package-II ................................................................................................. 65 Table 10.2: Base Year Traffic Volume considered for Economic Evaluation .............................. 66 Table 10.3: Traffic Growth Rates.................................................................................................. 66 Table 10.4: Results of Economic Viability Analysis for Package-II .............................................. 68 Table 11.1: Package Details ......................................................................................................... 69 Table 11.2: Construction Cost for Package-II .............................................................................. 69 Table 11.3: Toll Rates ................................................................................................................... 70 Table 11.4: Projected Toll Rates .................................................................................................. 70 Table 11.5: Base Year Traffic for the Package-II : Tollable Traffic .............................................. 71 Table 11.6: Toll Plaza Expenses .................................................................................................. 72 Table 11.7: Maintenance Cost in Rs Million per Km .................................................................... 73 Table 11.8: Summary of Financial Analysis ................................................................................. 73 Table 12.1: Widths of Cross Sectional Elements ......................................................................... 74 Table 12.2: List of Structures Proposed for Package II ............................................................... 75 Table 12.3: Pavement Layer Thickness for Main Carriageway ................................................... 76 Table 12.4: Pavement Layer Thickness for Service Road ........................................................... 76
Design Consultancy for Upgradation of NH 47 Final Detailed Project Report From Thiruvananthapuram to Kanyakumari and Volume - I: Main Report NH 47B From Nagercoil to Kavalkinaru Package - II
SECON 1 NH 47 & 47B-66-PR-O001
1.0 EXECUTIVE SUMMARY
1.1 Project Background
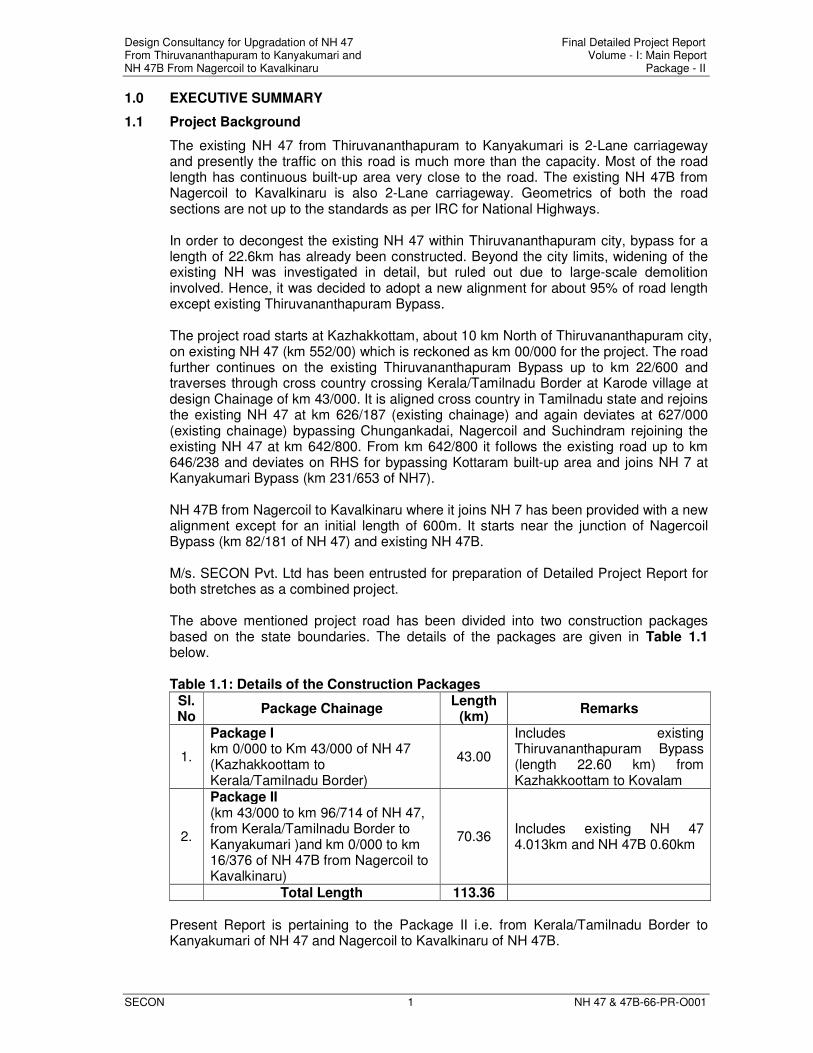
The existing NH 47 from Thiruvananthapuram to Kanyakumari is 2-Lane carriageway and presently the traffic on this road is much more than the capacity. Most of the road length has continuous built-up area very close to the road. The existing NH 47B from Nagercoil to Kavalkinaru is also 2-Lane carriageway. Geometrics of both the road sections are not up to the standards as per IRC for National Highways. In order to decongest the existing NH 47 within Thiruvananthapuram city, bypass for a length of 22.6km has already been constructed. Beyond the city limits, widening of the existing NH was investigated in detail, but ruled out due to large-scale demolition involved. Hence, it was decided to adopt a new alignment for about 95% of road length except existing Thiruvananthapuram Bypass. The project road starts at Kazhakkottam, about 10 km North of Thiruvananthapuram city, on existing NH 47 (km 552/00) which is reckoned as km 00/000 for the project. The road further continues on the existing Thiruvananthapuram Bypass up to km 22/600 and traverses through cross country crossing Kerala/Tamilnadu Border at Karode village at design Chainage of km 43/000. It is aligned cross country in Tamilnadu state and rejoins the existing NH 47 at km 626/187 (existing chainage) and again deviates at 627/000 (existing chainage) bypassing Chungankadai, Nagercoil and Suchindram rejoining the existing NH 47 at km 642/800. From km 642/800 it follows the existing road up to km 646/238 and deviates on RHS for bypassing Kottaram built-up area and joins NH 7 at Kanyakumari Bypass (km 231/653 of NH7). NH 47B from Nagercoil to Kavalkinaru where it joins NH 7 has been provided with a new alignment except for an initial length of 600m. It starts near the junction of Nagercoil Bypass (km 82/181 of NH 47) and existing NH 47B. M/s. SECON Pvt. Ltd has been entrusted for preparation of Detailed Project Report for both stretches as a combined project.
The above mentioned project road has been divided into two construction packages based on the state boundaries. The details of the packages are given in Table 1.1 below.
Table 1.1: Details of the Construction Packages
Sl. No
Package Chainage Length
(km) Remarks
1.
Package I km 0/000 to Km 43/000 of NH 47 (Kazhakkoottam to Kerala/Tamilnadu Border)
43.00
Includes existing Thiruvananthapuram Bypass (length 22.60 km) from Kazhakkoottam to Kovalam
2.
Package II (km 43/000 to km 96/714 of NH 47, from Kerala/Tamilnadu Border to Kanyakumari )and km 0/000 to km 16/376 of NH 47B from Nagercoil to Kavalkinaru)
70.36 Includes existing NH 47 4.013km and NH 47B 0.60km
Total Length 113.36
Present Report is pertaining to the Package II i.e. from Kerala/Tamilnadu Border to Kanyakumari of NH 47 and Nagercoil to Kavalkinaru of NH 47B.
Design Consultancy for Upgradation of NH 47 Final Detailed Project Report From Thiruvananthapuram to Kanyakumari and Volume - I: Main Report NH 47B From Nagercoil to Kavalkinaru Package - II
SECON 2 NH 47 & 47B-66-PR-O001
The scope of the project is to conduct feasibility study and preparation of Detailed Project Report for 4/6 laning of NH 47 and NH 47B.
The Study has been planned under the following stages:
Stage 1: Preparation of Inception Report
Stage 2: Preparation of Feasibility Study Report
Stage 3: Preparation of Preliminary Project Report
Stage 4: Preparation of Detailed Project Report
Based on the various stages planned, the following stages have been completed. Stage 1: The Quality Assurance Plan (QAP) was submitted on 20th June, 2004 and Inception Report was submitted on 24th July, 2004. The revised QAP was submitted on 24th August, 2004. Stage 2: Draft Feasibility Study Report for NH 47 was submitted on 20th December, 2004 and for NH 47B on 18th Jan, 2005. The Final Feasibility Study Report was submitted on 11th April, 2005. Stage 3: Draft Preliminary Project Report was submitted on 20th July, 2005. Final Preliminary Project Report was submitted on 16th August, 2005. Stage 4: The Draft Detailed Project Report for Package-I was submitted on 23rd Sept, 2005 and for Package II was submitted on 30th Nov, 2005. The present submission comprises of Final Detailed Project Report for Package-II. (Note: All the chainages mentioned hereafter in the report refer to Design project chainages, unless otherwise mentioned.)
1.2 Socio-Economic Profile
The project road passes through Kanyakumari District of Tamil Nadu state for the entire length. Kanyakumari is one of the smallest districts in Tamil Nadu having an area of 1685 sq km. The district is bounded by Tirunelveli in the northeast, Kerala in the northwest and confluence of Arabian Sea, Indian Ocean in the west and south. The length of coastal line is 58 km. Soil is mostly red earth and gravel. The rainfall is moderate and climate is pleasant. Main crops raised in this district are paddy, banana and coconut and rubber to certain extent. Fishing industry is well developed in the district and around 50000 people are engaged in fishing. Population is 16, 76,034 as per the latest censes. The study region is located in the southeast part of Tamil Nadu state. Sample survey was done by way of questionnaire to get feedback of local people and also field test conducted on Air, Soil, water and sound to study the impact on environment. Further survey was conducted to identify building structures, religious places, and other features within the road width. The project corridor has mixed rural and urban populations. The major settlements that come in these sections are Kuzhithurai, Marthandam, Swamiyarmadam, Thakkalai, Parvathipuram, Nagercoil, Suchindram, Kottaram, Kanyakumari on NH 47 and Vadassery, Vellamadam, Viswasapuram, Tovala and Arulvoimozhi on NH 47B.
Design Consultancy for Upgradation of NH 47 Final Detailed Project Report From Thiruvananthapuram to Kanyakumari and Volume - I: Main Report NH 47B From Nagercoil to Kavalkinaru Package - II
SECON 3 NH 47 & 47B-66-PR-O001
General impact of this project is that it will affect shops, houses, schools, agricultural land, which is coming within the ROW. But it will not affect any historical monuments and forest land. The above issues can be sorted out by mitigative measures and co operations of PAPs.
1.3 Alignment and Engineering
The proposed alignment for Package-I will end at Karode village near Kerala / Tamil Nadu border. Further, the alignment of Package II follows a cross country alignment bypassing the built up areas of existing highway for the rest of NH 47 section till it bypasses the Nagercoil town. The new alignment utilizes the existing road partially and connects NH 47 with NH7 at two points viz. Kanyakumari and Kavalkinaru with bifurcation near Nagercoil.
Package-II comprises of NH 47 from Kerala Border (km 43/000) to Kanyakumari Bypass of NH 7 after Kottaram bypass, and NH 47B from Nagercoil to Kavalkinaru. Right of Way (ROW) is kept as 60m generally in the entire stretch. However, extra land is required for junction improvements, high embankments etc. depending on site conditions.
Though the terrain is termed as rolling, most of the alignment passes through hillocks and deep valleys especially in the cross – country portion from km 43/000 to km 71/293(existing km-626/187). The alignment crosses Thiruvananthapuram-Kanyakumari railway line at Pallyadi km-58.445. From km-71/293 (existing km-626/187) to km-72/080 (existing km-627/000) the existing NH 47 alignment is utilized. Thereafter the alignment deviates from the existing NH 47 towards left side of Chungankadai, Nagercoil and Suchindram built up area and cuts across NH 47B at km-82/181 and rejoins the existing NH 47 at km 88/800(existing km 642/800). From km 88/800 the alignment follows existing NH 47 up to km 92/100 (existing km 646/238) where Kottaram built up area starts and alignment deviates on RHS of existing road bypassing Kottaram village and joins the proposed NH 7 bypass for Kanyakumari immediately after Kottaram village at km 231/653 of NH 7 at chainage of km 96/714 of NH 47. The alignment crosses Nagercoil - Tirunelveli railway line at km-83/495 (Railway Chainage km 292/700). The proposed alignment of NH 47B utilizes small length of 600m of existing NH 47B and further it is proposed to bypass the heavily builtup areas of Thovalai, Vishwasapuram and Arulvaimozhi to follow a cross-country alignment. The route crosses Nagercoil-Thirunelveli railway line and joins NH-7 at Kavalkinaru. Ruling gradients as applicable to plain and rolling terrain is provided in the design of vertical alignment.
1.4 Geometrics
Beyond km 43/000 the proposal alignment involves new construction of four-lane highway. As per the design adopted in Detailed Project Report (DPR), design speed of 100km per hour is considered for geometric designs. Minimum radius of horizontal curves provided is 400m. The minimum radius has been provided at very few locations and in general considerably larger radii are adopted in order to achieve a smooth and safe road alignment. However, in the initial stretches of NH47B, horizontal radius of 200 m has been provided to adhere to the existing alignment. Maximum super elevation of 7% and maximum gradient of 3.3% is provided.
1.5 Drainage
The drain along the road where the existing road has been used does not have proper maintenance due to which most of these are observed to be in non operational condition. Since the poor drainage system causes the road damage, adequate provision for
Design Consultancy for Upgradation of NH 47 Final Detailed Project Report From Thiruvananthapuram to Kanyakumari and Volume - I: Main Report NH 47B From Nagercoil to Kavalkinaru Package - II
SECON 4 NH 47 & 47B-66-PR-O001
drainage of surface water is made by providing proper roadside drains with required longitudinal slope.
1.6 Cross Drainage Structures
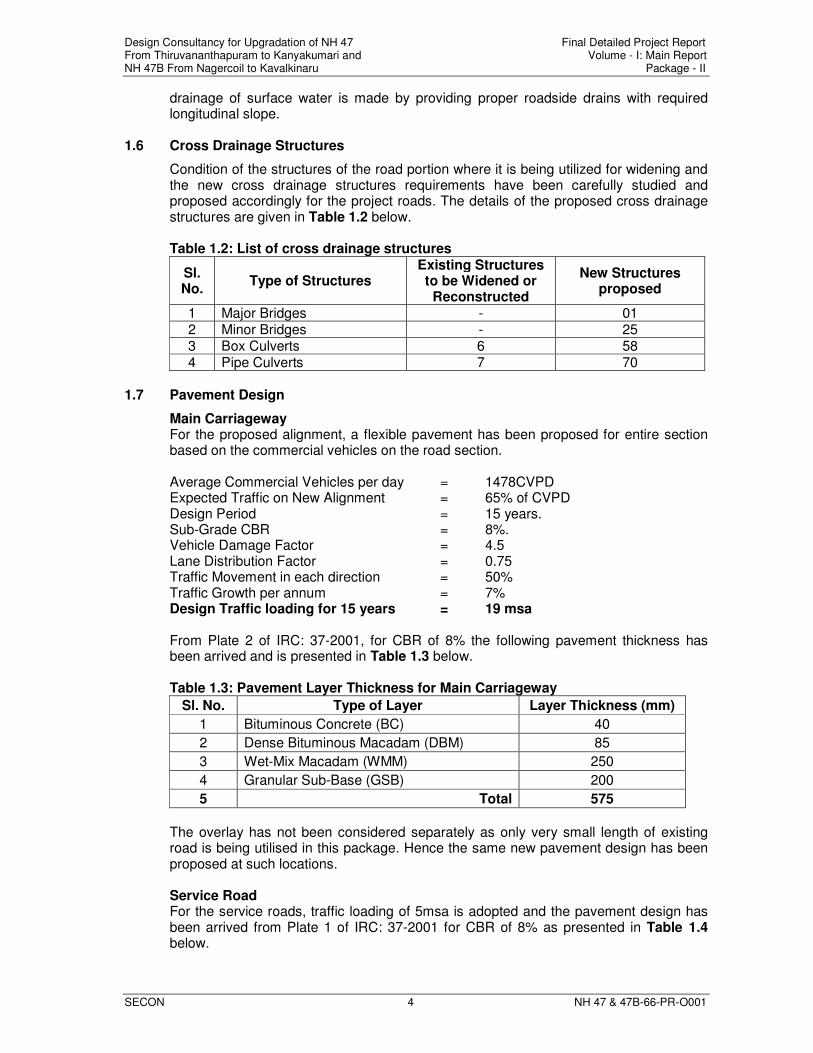
Condition of the structures of the road portion where it is being utilized for widening and the new cross drainage structures requirements have been carefully studied and proposed accordingly for the project roads. The details of the proposed cross drainage structures are given in Table 1.2 below.
Table 1.2: List of cross drainage structures
Sl. No.
Type of Structures Existing Structures to be Widened or Reconstructed
New Structures proposed
1 Major Bridges - 01 2 Minor Bridges - 25 3 Box Culverts 6 58 4 Pipe Culverts 7 70
1.7 Pavement Design
Main Carriageway For the proposed alignment, a flexible pavement has been proposed for entire section based on the commercial vehicles on the road section. Average Commercial Vehicles per day = 1478CVPD Expected Traffic on New Alignment = 65% of CVPD Design Period = 15 years. Sub-Grade CBR = 8%. Vehicle Damage Factor = 4.5 Lane Distribution Factor = 0.75 Traffic Movement in each direction = 50% Traffic Growth per annum = 7% Design Traffic loading for 15 years = 19 msa From Plate 2 of IRC: 37-2001, for CBR of 8% the following pavement thickness has been arrived and is presented in Table 1.3 below.
Table 1.3: Pavement Layer Thickness for Main Carriageway
Sl. No. Type of Layer Layer Thickness (mm)
1 Bituminous Concrete (BC) 40
2 Dense Bituminous Macadam (DBM) 85
3 Wet-Mix Macadam (WMM) 250
4 Granular Sub-Base (GSB) 200
5 Total 575
The overlay has not been considered separately as only very small length of existing road is being utilised in this package. Hence the same new pavement design has been proposed at such locations. Service Road For the service roads, traffic loading of 5msa is adopted and the pavement design has been arrived from Plate 1 of IRC: 37-2001 for CBR of 8% as presented in Table 1.4 below.
Design Consultancy for Upgradation of NH 47 Final Detailed Project Report From Thiruvananthapuram to Kanyakumari and Volume - I: Main Report NH 47B From Nagercoil to Kavalkinaru Package - II
SECON 5 NH 47 & 47B-66-PR-O001
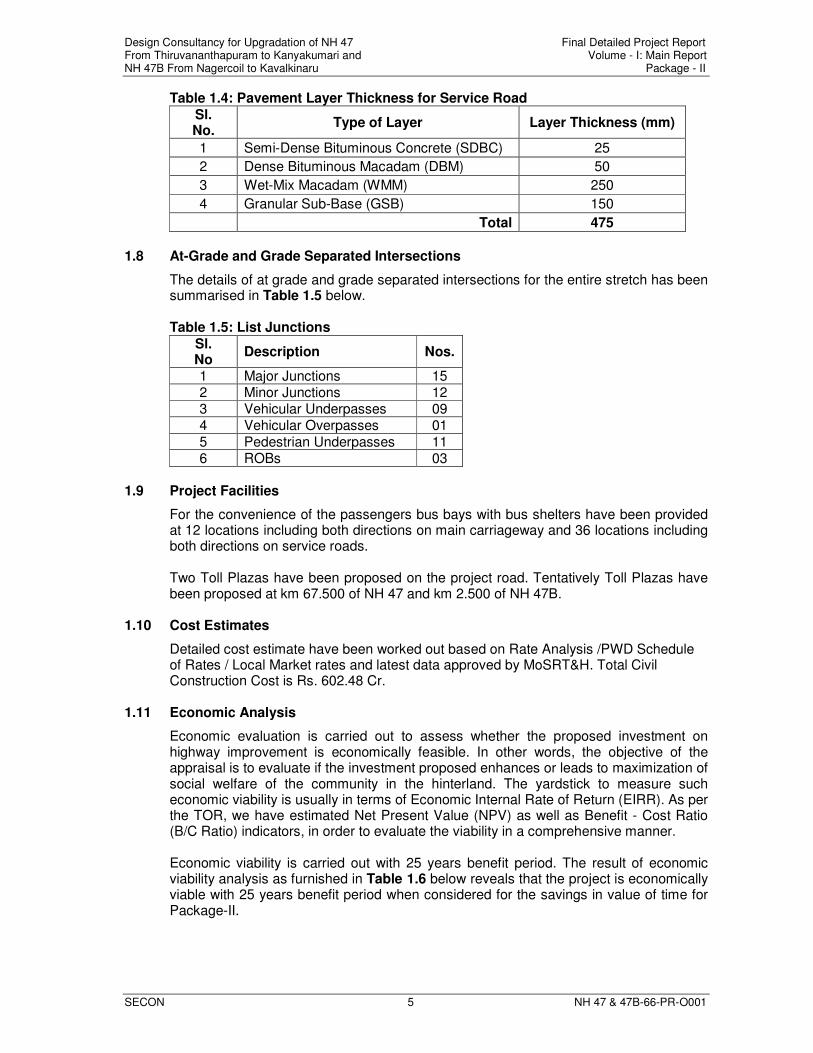
Table 1.4: Pavement Layer Thickness for Service Road
Sl. No.
Type of Layer Layer Thickness (mm)
1 Semi-Dense Bituminous Concrete (SDBC) 25
2 Dense Bituminous Macadam (DBM) 50
3 Wet-Mix Macadam (WMM) 250
4 Granular Sub-Base (GSB) 150
Total 475
1.8 At-Grade and Grade Separated Intersections
The details of at grade and grade separated intersections for the entire stretch has been summarised in Table 1.5 below. Table 1.5: List Junctions
Sl. No
Description Nos.
1 Major Junctions 15 2 Minor Junctions 12 3 Vehicular Underpasses 09 4 Vehicular Overpasses 01
5 Pedestrian Underpasses 11 6 ROBs 03
1.9 Project Facilities
For the convenience of the passengers bus bays with bus shelters have been provided at 12 locations including both directions on main carriageway and 36 locations including both directions on service roads. Two Toll Plazas have been proposed on the project road. Tentatively Toll Plazas have been proposed at km 67.500 of NH 47 and km 2.500 of NH 47B.
1.10 Cost Estimates
Detailed cost estimate have been worked out based on Rate Analysis /PWD Schedule of Rates / Local Market rates and latest data approved by MoSRT&H. Total Civil Construction Cost is Rs. 602.48 Cr.
1.11 Economic Analysis
Economic evaluation is carried out to assess whether the proposed investment on highway improvement is economically feasible. In other words, the objective of the appraisal is to evaluate if the investment proposed enhances or leads to maximization of social welfare of the community in the hinterland. The yardstick to measure such economic viability is usually in terms of Economic Internal Rate of Return (EIRR). As per the TOR, we have estimated Net Present Value (NPV) as well as Benefit - Cost Ratio (B/C Ratio) indicators, in order to evaluate the viability in a comprehensive manner.
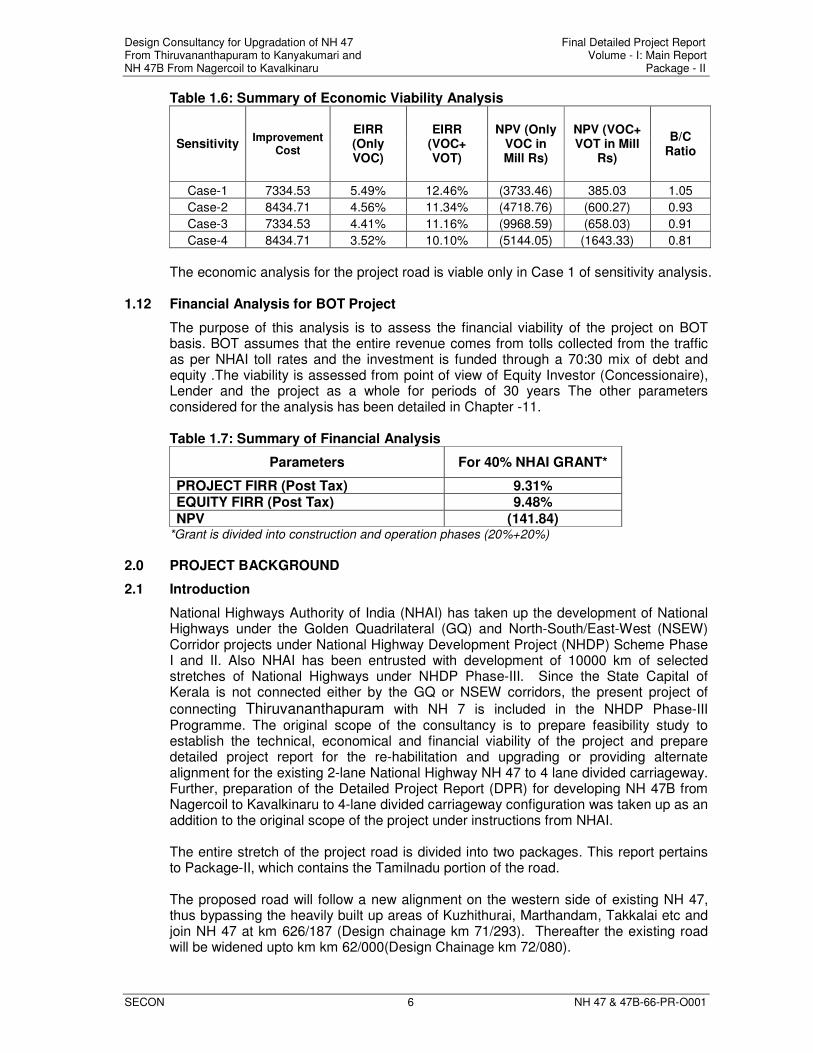
Economic viability is carried out with 25 years benefit period. The result of economic viability analysis as furnished in Table 1.6 below reveals that the project is economically viable with 25 years benefit period when considered for the savings in value of time for Package-II.
Design Consultancy for Upgradation of NH 47 Final Detailed Project Report From Thiruvananthapuram to Kanyakumari and Volume - I: Main Report NH 47B From Nagercoil to Kavalkinaru Package - II
SECON 6 NH 47 & 47B-66-PR-O001
Table 1.6: Summary of Economic Viability Analysis
Sensitivity Improvement
Cost
EIRR (Only VOC)
EIRR (VOC+ VOT)
NPV (Only VOC in Mill Rs)
NPV (VOC+ VOT in Mill
Rs)
B/C Ratio
Case-1 7334.53 5.49% 12.46% (3733.46) 385.03 1.05
Case-2 8434.71 4.56% 11.34% (4718.76) (600.27) 0.93
Case-3 7334.53 4.41% 11.16% (9968.59) (658.03) 0.91
Case-4 8434.71 3.52% 10.10% (5144.05) (1643.33) 0.81
The economic analysis for the project road is viable only in Case 1 of sensitivity analysis.
1.12 Financial Analysis for BOT Project
The purpose of this analysis is to assess the financial viability of the project on BOT basis. BOT assumes that the entire revenue comes from tolls collected from the traffic as per NHAI toll rates and the investment is funded through a 70:30 mix of debt and equity .The viability is assessed from point of view of Equity Investor (Concessionaire), Lender and the project as a whole for periods of 30 years The other parameters considered for the analysis has been detailed in Chapter -11.
Table 1.7: Summary of Financial Analysis
Parameters For 40% NHAI GRANT*
PROJECT FIRR (Post Tax) 9.31% EQUITY FIRR (Post Tax) 9.48%
NPV (141.84) *Grant is divided into construction and operation phases (20%+20%)
2.0 PROJECT BACKGROUND
2.1 Introduction
National Highways Authority of India (NHAI) has taken up the development of National Highways under the Golden Quadrilateral (GQ) and North-South/East-West (NSEW) Corridor projects under National Highway Development Project (NHDP) Scheme Phase I and II. Also NHAI has been entrusted with development of 10000 km of selected stretches of National Highways under NHDP Phase-III. Since the State Capital of Kerala is not connected either by the GQ or NSEW corridors, the present project of
connecting Thiruvananthapuram with NH 7 is included in the NHDP Phase-III Programme. The original scope of the consultancy is to prepare feasibility study to establish the technical, economical and financial viability of the project and prepare detailed project report for the re-habilitation and upgrading or providing alternate alignment for the existing 2-lane National Highway NH 47 to 4 lane divided carriageway. Further, preparation of the Detailed Project Report (DPR) for developing NH 47B from Nagercoil to Kavalkinaru to 4-lane divided carriageway configuration was taken up as an addition to the original scope of the project under instructions from NHAI.
The entire stretch of the project road is divided into two packages. This report pertains to Package-II, which contains the Tamilnadu portion of the road. The proposed road will follow a new alignment on the western side of existing NH 47, thus bypassing the heavily built up areas of Kuzhithurai, Marthandam, Takkalai etc and join NH 47 at km 626/187 (Design chainage km 71/293). Thereafter the existing road will be widened upto km km 62/000(Design Chainage km 72/080).
Design Consultancy for Upgradation of NH 47 Final Detailed Project Report From Thiruvananthapuram to Kanyakumari and Volume - I: Main Report NH 47B From Nagercoil to Kavalkinaru Package - II
SECON 7 NH 47 & 47B-66-PR-O001
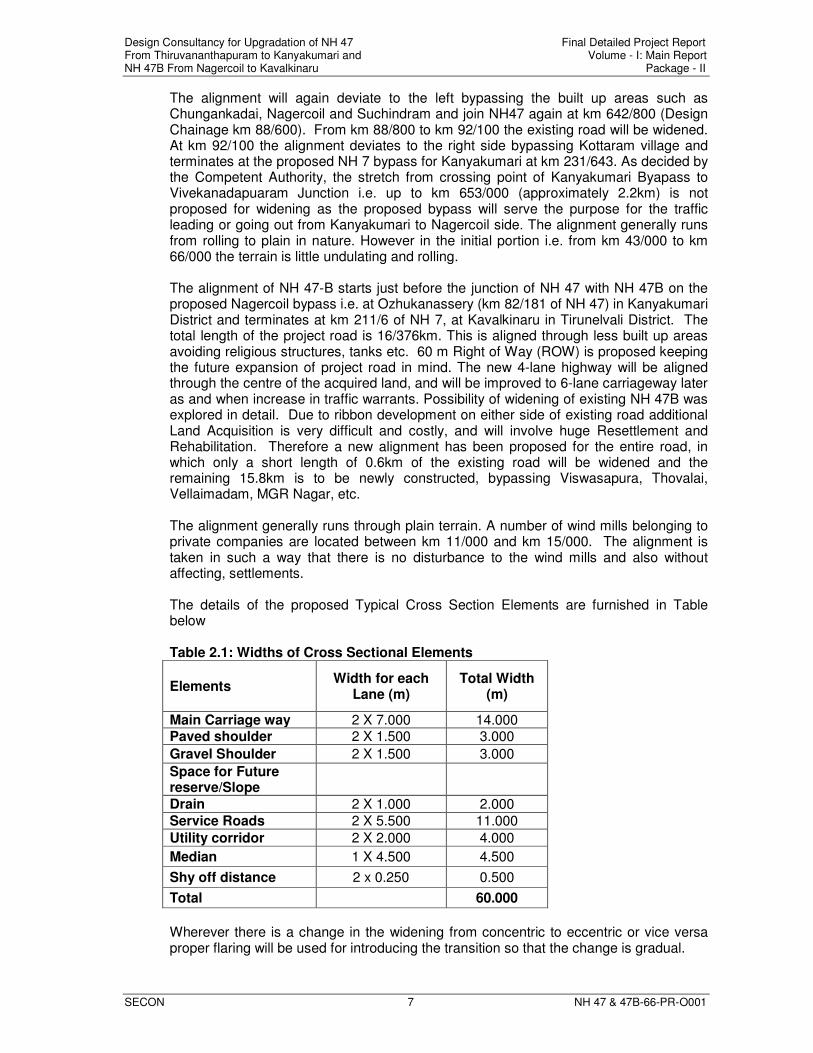
The alignment will again deviate to the left bypassing the built up areas such as Chungankadai, Nagercoil and Suchindram and join NH47 again at km 642/800 (Design Chainage km 88/600). From km 88/800 to km 92/100 the existing road will be widened. At km 92/100 the alignment deviates to the right side bypassing Kottaram village and terminates at the proposed NH 7 bypass for Kanyakumari at km 231/643. As decided by the Competent Authority, the stretch from crossing point of Kanyakumari Byapass to Vivekanadapuaram Junction i.e. up to km 653/000 (approximately 2.2km) is not proposed for widening as the proposed bypass will serve the purpose for the traffic leading or going out from Kanyakumari to Nagercoil side. The alignment generally runs from rolling to plain in nature. However in the initial portion i.e. from km 43/000 to km 66/000 the terrain is little undulating and rolling. The alignment of NH 47-B starts just before the junction of NH 47 with NH 47B on the proposed Nagercoil bypass i.e. at Ozhukanassery (km 82/181 of NH 47) in Kanyakumari District and terminates at km 211/6 of NH 7, at Kavalkinaru in Tirunelvali District. The total length of the project road is 16/376km. This is aligned through less built up areas avoiding religious structures, tanks etc. 60 m Right of Way (ROW) is proposed keeping the future expansion of project road in mind. The new 4-lane highway will be aligned through the centre of the acquired land, and will be improved to 6-lane carriageway later as and when increase in traffic warrants. Possibility of widening of existing NH 47B was explored in detail. Due to ribbon development on either side of existing road additional Land Acquisition is very difficult and costly, and will involve huge Resettlement and Rehabilitation. Therefore a new alignment has been proposed for the entire road, in which only a short length of 0.6km of the existing road will be widened and the remaining 15.8km is to be newly constructed, bypassing Viswasapura, Thovalai, Vellaimadam, MGR Nagar, etc. The alignment generally runs through plain terrain. A number of wind mills belonging to private companies are located between km 11/000 and km 15/000. The alignment is taken in such a way that there is no disturbance to the wind mills and also without affecting, settlements.
The details of the proposed Typical Cross Section Elements are furnished in Table below
Table 2.1: Widths of Cross Sectional Elements
Elements Width for each
Lane (m) Total Width
(m)
Main Carriage way 2 X 7.000 14.000 Paved shoulder 2 X 1.500 3.000
Gravel Shoulder 2 X 1.500 3.000
Space for Future reserve/Slope
Drain 2 X 1.000 2.000
Service Roads 2 X 5.500 11.000
Utility corridor 2 X 2.000 4.000
Median 1 X 4.500 4.500
Shy off distance 2 x 0.250 0.500
Total 60.000
Wherever there is a change in the widening from concentric to eccentric or vice versa proper flaring will be used for introducing the transition so that the change is gradual.
Design Consultancy for Upgradation of NH 47 Final Detailed Project Report From Thiruvananthapuram to Kanyakumari and Volume - I: Main Report NH 47B From Nagercoil to Kavalkinaru Package - II
SECON 8 NH 47 & 47B-66-PR-O001
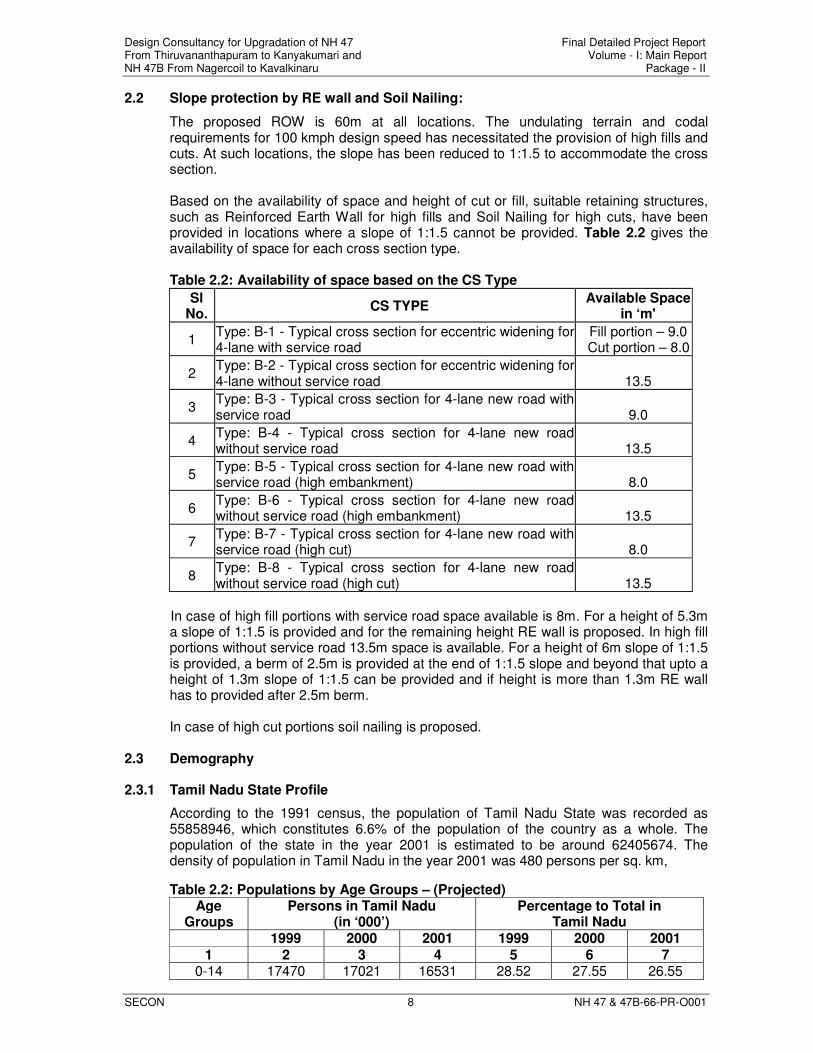
2.2 Slope protection by RE wall and Soil Nailing:
The proposed ROW is 60m at all locations. The undulating terrain and codal requirements for 100 kmph design speed has necessitated the provision of high fills and cuts. At such locations, the slope has been reduced to 1:1.5 to accommodate the cross section. Based on the availability of space and height of cut or fill, suitable retaining structures, such as Reinforced Earth Wall for high fills and Soil Nailing for high cuts, have been provided in locations where a slope of 1:1.5 cannot be provided. Table 2.2 gives the availability of space for each cross section type. Table 2.2: Availability of space based on the CS Type
Sl No.
CS TYPE Available Space
in ‘m'
1 Type: B-1 - Typical cross section for eccentric widening for 4-lane with service road
Fill portion – 9.0 Cut portion – 8.0
2 Type: B-2 - Typical cross section for eccentric widening for 4-lane without service road 13.5
3 Type: B-3 - Typical cross section for 4-lane new road with service road 9.0
4 Type: B-4 - Typical cross section for 4-lane new road without service road 13.5
5 Type: B-5 - Typical cross section for 4-lane new road with service road (high embankment) 8.0
6 Type: B-6 - Typical cross section for 4-lane new road without service road (high embankment) 13.5
7 Type: B-7 - Typical cross section for 4-lane new road with service road (high cut) 8.0
8 Type: B-8 - Typical cross section for 4-lane new road without service road (high cut) 13.5
In case of high fill portions with service road space available is 8m. For a height of 5.3m a slope of 1:1.5 is provided and for the remaining height RE wall is proposed. In high fill portions without service road 13.5m space is available. For a height of 6m slope of 1:1.5 is provided, a berm of 2.5m is provided at the end of 1:1.5 slope and beyond that upto a height of 1.3m slope of 1:1.5 can be provided and if height is more than 1.3m RE wall has to provided after 2.5m berm. In case of high cut portions soil nailing is proposed.
2.3 Demography
2.3.1 Tamil Nadu State Profile
According to the 1991 census, the population of Tamil Nadu State was recorded as 55858946, which constitutes 6.6% of the population of the country as a whole. The population of the state in the year 2001 is estimated to be around 62405674. The density of population in Tamil Nadu in the year 2001 was 480 persons per sq. km,
Table 2.2: Populations by Age Groups – (Projected) Age
Groups Persons in Tamil Nadu
(in ‘000’) Percentage to Total in
Tamil Nadu 1999 2000 2001 1999 2000 2001
1 2 3 4 5 6 7 0-14 17470 17021 16531 28.52 27.55 26.55
Design Consultancy for Upgradation of NH 47 Final Detailed Project Report From Thiruvananthapuram to Kanyakumari and Volume - I: Main Report NH 47B From Nagercoil to Kavalkinaru Package - II
SECON 9 NH 47 & 47B-66-PR-O001
15-29 17564 17780 17980 28.67 28.78 28.88 30-44 12858 13168 13483 20.99 21.32 21.66 45-59 8452 8704 8960 13.80 14.09 14.39
60 & above
4911 5100 5302 8.02 8.26 8.52
Total 61255 61773 62256 100.00 100.00 100.00 Table 2.3: Population by Religion
Sl. No.
Religion Persons in Tamil Nadu
Variation since
(1981-1991)
Percentage
Tamil Nadu All India
1 Hindus 49532052 6515506 88.67 82.41 2 Muslims 3052717 532770 5.47 11.67
3 Christians 3179410 381362 5.69 2.32 4 Sikhs 5449 1054 0.01 1.99 5 Buddhist 2128 1393 Nil 0.77
6 Jain 66900 17336 0.12 0.41
7 Other Religions
2620 ----- 0.01 0.38
8 Religion not stated
17670 15800 0.03 0.05
Total Population 55858946 100 100
Table 2.4: Population Projection- Tamil Nadu
Year Region Population
Persons Male Female 1 2 3 4 5
2002 Total 62698000 31694000 31004000 Rural 40868517 20604172 20264344
Urban 21829483 11089828 10739656
2003 Total 63201000 31937000 31264000 Rural 41158058 20744569 20413489
Urban 22042942 11192431 10850511
2004
Total 63755000 32206000 31549000
Rural 41480135 20901562 20578574 Urban 22274865 11304438 10970426
2005
Total 64350000 32496000 31854000
Rural 41828154 21071865 20756290 Urban 22521846 11424135 11097711
2006 Total 64976000 32712000 32264000 Rural 42225060 21271815 20953245 Urban 22751940 11440185 11310755
2007 Total 65548000 32937000 32611000 Rural 42596777 21459000 21137777
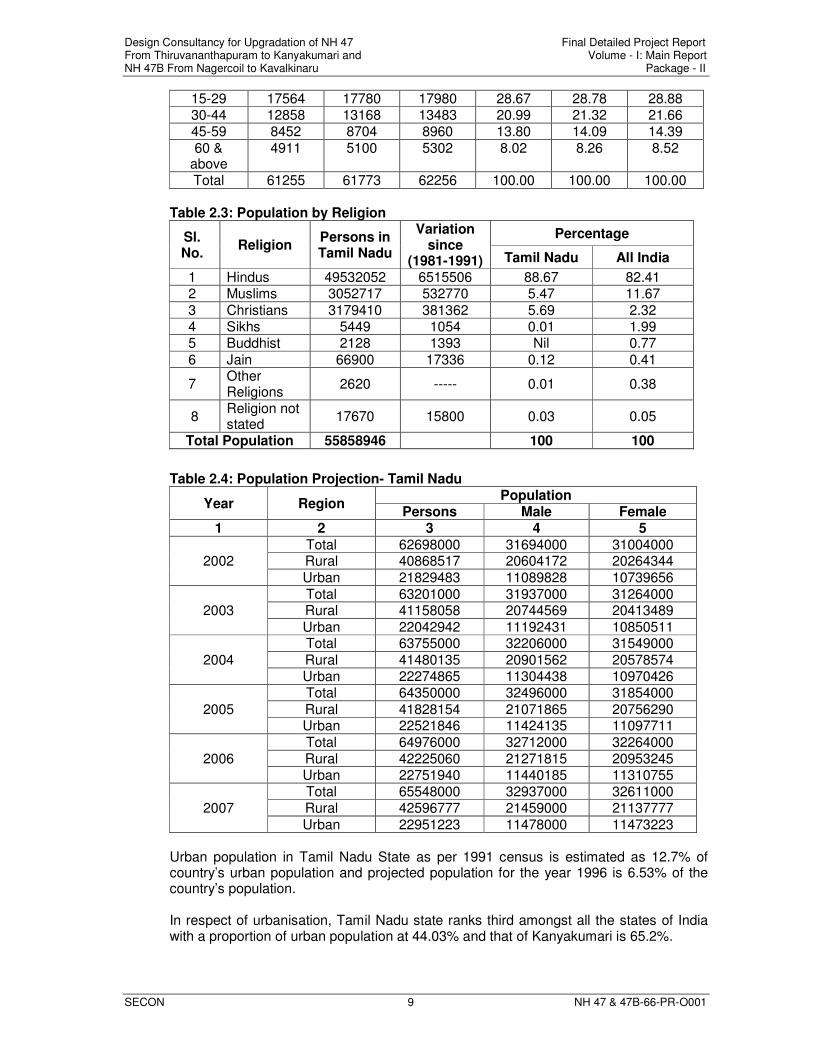
Urban 22951223 11478000 11473223 Urban population in Tamil Nadu State as per 1991 census is estimated as 12.7% of country’s urban population and projected population for the year 1996 is 6.53% of the country’s population. In respect of urbanisation, Tamil Nadu state ranks third amongst all the states of India with a proportion of urban population at 44.03% and that of Kanyakumari is 65.2%.
Design Consultancy for Upgradation of NH 47 Final Detailed Project Report From Thiruvananthapuram to Kanyakumari and Volume - I: Main Report NH 47B From Nagercoil to Kavalkinaru Package - II
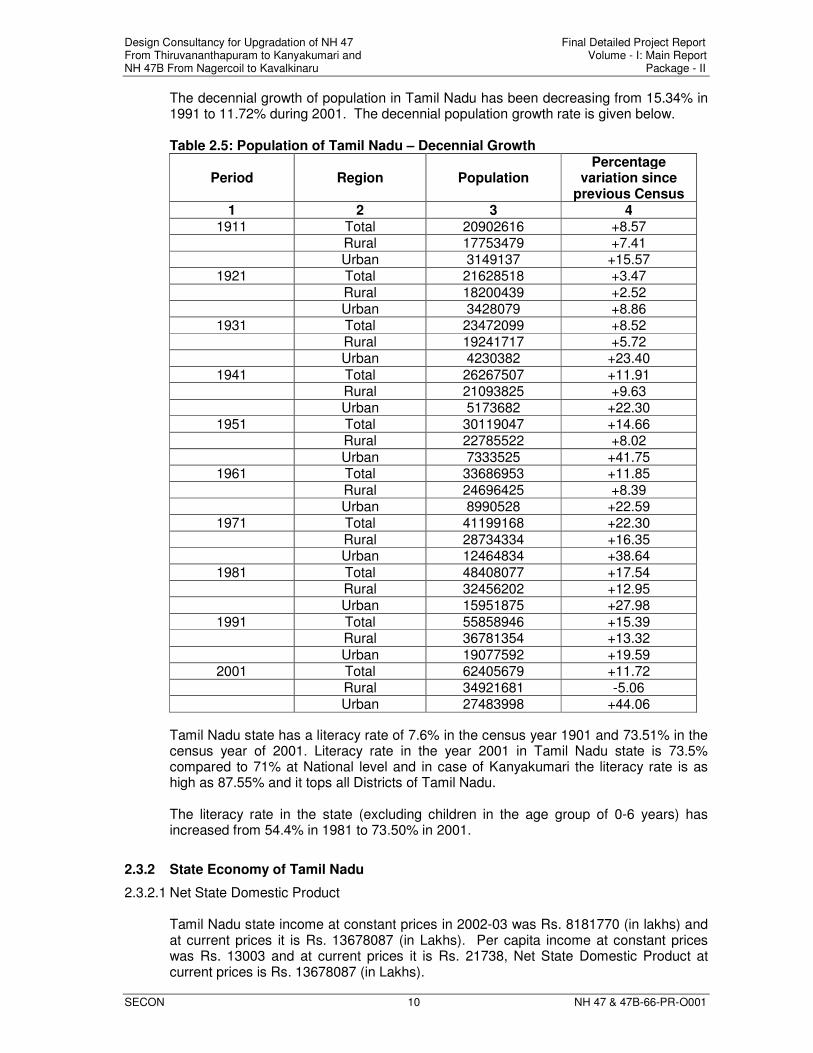
SECON 10 NH 47 & 47B-66-PR-O001
The decennial growth of population in Tamil Nadu has been decreasing from 15.34% in 1991 to 11.72% during 2001. The decennial population growth rate is given below. Table 2.5: Population of Tamil Nadu – Decennial Growth
Period Region Population Percentage
variation since previous Census
1 2 3 4 1911 Total 20902616 +8.57
Rural 17753479 +7.41 Urban 3149137 +15.57
1921 Total 21628518 +3.47
Rural 18200439 +2.52 Urban 3428079 +8.86
1931 Total 23472099 +8.52 Rural 19241717 +5.72 Urban 4230382 +23.40
1941 Total 26267507 +11.91 Rural 21093825 +9.63 Urban 5173682 +22.30
1951 Total 30119047 +14.66 Rural 22785522 +8.02
Urban 7333525 +41.75 1961 Total 33686953 +11.85
Rural 24696425 +8.39 Urban 8990528 +22.59
1971 Total 41199168 +22.30
Rural 28734334 +16.35 Urban 12464834 +38.64
1981 Total 48408077 +17.54 Rural 32456202 +12.95 Urban 15951875 +27.98
1991 Total 55858946 +15.39 Rural 36781354 +13.32
Urban 19077592 +19.59 2001 Total 62405679 +11.72
Rural 34921681 -5.06 Urban 27483998 +44.06
Tamil Nadu state has a literacy rate of 7.6% in the census year 1901 and 73.51% in the census year of 2001. Literacy rate in the year 2001 in Tamil Nadu state is 73.5% compared to 71% at National level and in case of Kanyakumari the literacy rate is as high as 87.55% and it tops all Districts of Tamil Nadu. The literacy rate in the state (excluding children in the age group of 0-6 years) has increased from 54.4% in 1981 to 73.50% in 2001.
2.3.2 State Economy of Tamil Nadu
2.3.2.1 Net State Domestic Product Tamil Nadu state income at constant prices in 2002-03 was Rs. 8181770 (in lakhs) and at current prices it is Rs. 13678087 (in Lakhs). Per capita income at constant prices was Rs. 13003 and at current prices it is Rs. 21738, Net State Domestic Product at current prices is Rs. 13678087 (in Lakhs).
Design Consultancy for Upgradation of NH 47 Final Detailed Project Report From Thiruvananthapuram to Kanyakumari and Volume - I: Main Report NH 47B From Nagercoil to Kavalkinaru Package - II
SECON 11 NH 47 & 47B-66-PR-O001
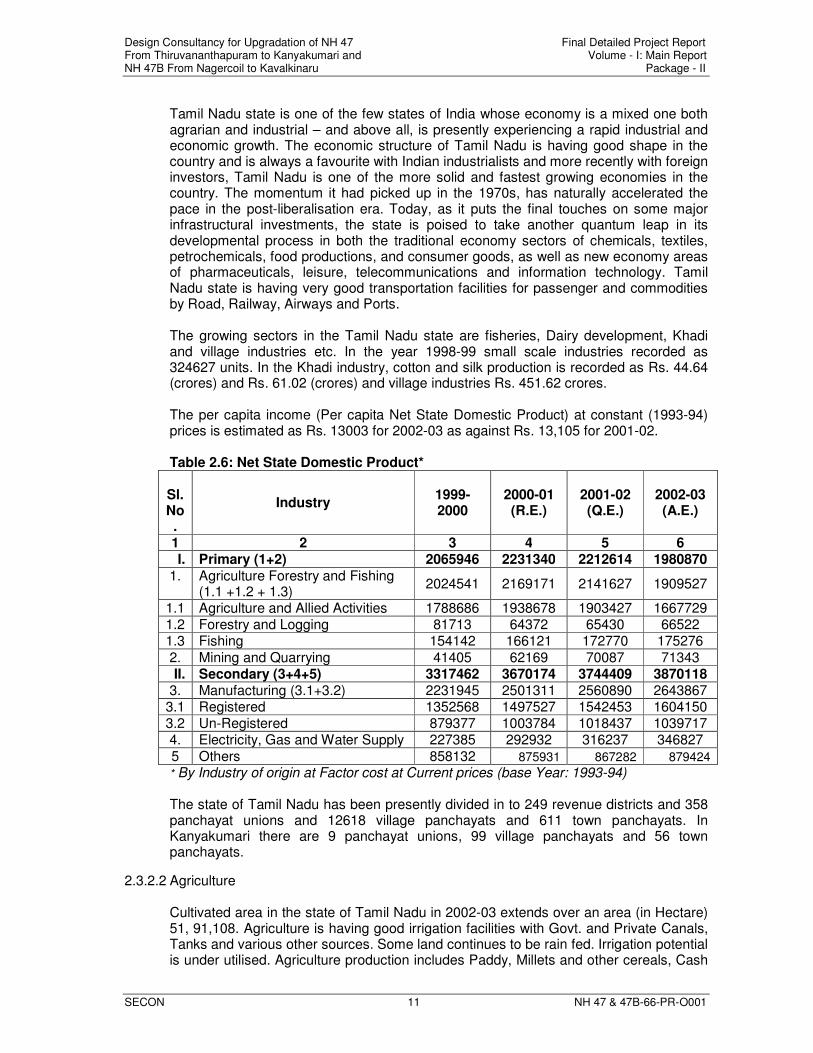
Tamil Nadu state is one of the few states of India whose economy is a mixed one both agrarian and industrial – and above all, is presently experiencing a rapid industrial and economic growth. The economic structure of Tamil Nadu is having good shape in the country and is always a favourite with Indian industrialists and more recently with foreign investors, Tamil Nadu is one of the more solid and fastest growing economies in the country. The momentum it had picked up in the 1970s, has naturally accelerated the pace in the post-liberalisation era. Today, as it puts the final touches on some major infrastructural investments, the state is poised to take another quantum leap in its developmental process in both the traditional economy sectors of chemicals, textiles, petrochemicals, food productions, and consumer goods, as well as new economy areas of pharmaceuticals, leisure, telecommunications and information technology. Tamil Nadu state is having very good transportation facilities for passenger and commodities by Road, Railway, Airways and Ports. The growing sectors in the Tamil Nadu state are fisheries, Dairy development, Khadi and village industries etc. In the year 1998-99 small scale industries recorded as 324627 units. In the Khadi industry, cotton and silk production is recorded as Rs. 44.64 (crores) and Rs. 61.02 (crores) and village industries Rs. 451.62 crores. The per capita income (Per capita Net State Domestic Product) at constant (1993-94) prices is estimated as Rs. 13003 for 2002-03 as against Rs. 13,105 for 2001-02. Table 2.6: Net State Domestic Product*
Sl. No.
Industry 1999-2000
2000-01 (R.E.)
2001-02 (Q.E.)
2002-03 (A.E.)
1 2 3 4 5 6 I. Primary (1+2) 2065946 2231340 2212614 1980870
1. Agriculture Forestry and Fishing (1.1 +1.2 + 1.3)
2024541 2169171 2141627 1909527
1.1 Agriculture and Allied Activities 1788686 1938678 1903427 1667729 1.2 Forestry and Logging 81713 64372 65430 66522 1.3 Fishing 154142 166121 172770 175276
2. Mining and Quarrying 41405 62169 70087 71343 II. Secondary (3+4+5) 3317462 3670174 3744409 3870118
3. Manufacturing (3.1+3.2) 2231945 2501311 2560890 2643867 3.1 Registered 1352568 1497527 1542453 1604150 3.2 Un-Registered 879377 1003784 1018437 1039717 4. Electricity, Gas and Water Supply 227385 292932 316237 346827
5 Others 858132 875931 867282 879424
* By Industry of origin at Factor cost at Current prices (base Year: 1993-94) The state of Tamil Nadu has been presently divided in to 249 revenue districts and 358 panchayat unions and 12618 village panchayats and 611 town panchayats. In Kanyakumari there are 9 panchayat unions, 99 village panchayats and 56 town panchayats.
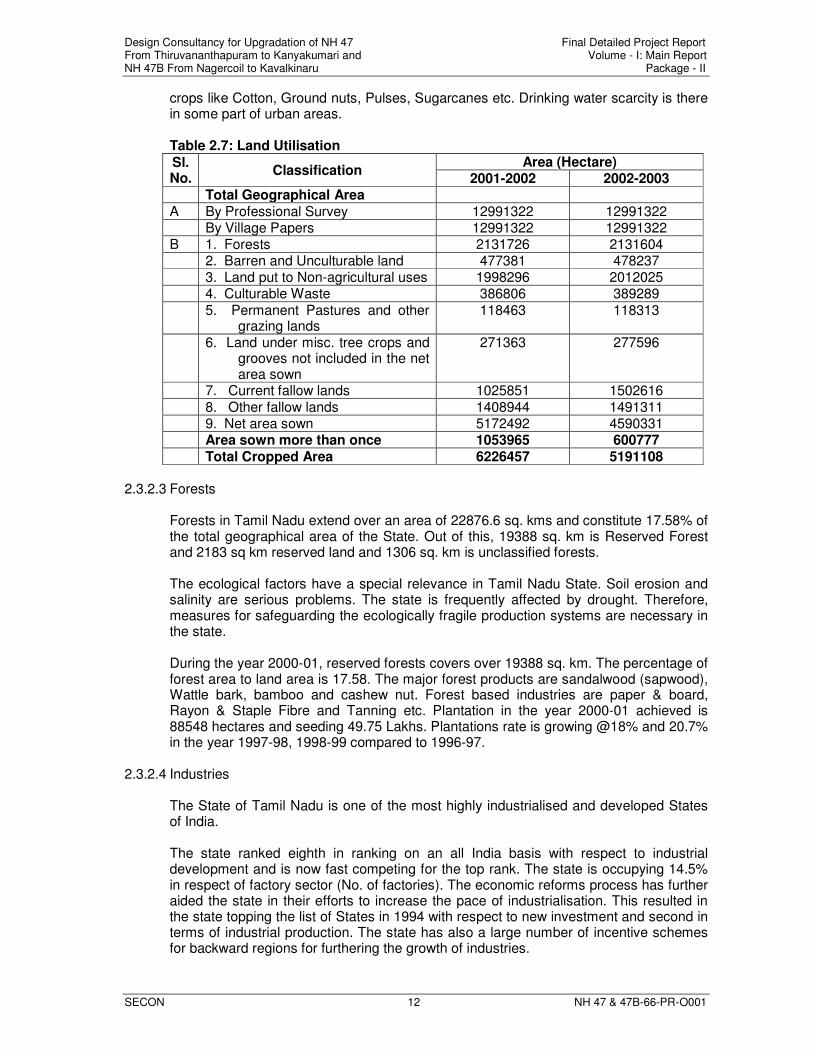
2.3.2.2 Agriculture Cultivated area in the state of Tamil Nadu in 2002-03 extends over an area (in Hectare) 51, 91,108. Agriculture is having good irrigation facilities with Govt. and Private Canals, Tanks and various other sources. Some land continues to be rain fed. Irrigation potential is under utilised. Agriculture production includes Paddy, Millets and other cereals, Cash
Design Consultancy for Upgradation of NH 47 Final Detailed Project Report From Thiruvananthapuram to Kanyakumari and Volume - I: Main Report NH 47B From Nagercoil to Kavalkinaru Package - II
SECON 12 NH 47 & 47B-66-PR-O001
crops like Cotton, Ground nuts, Pulses, Sugarcanes etc. Drinking water scarcity is there in some part of urban areas. Table 2.7: Land Utilisation
Sl. No.
Classification Area (Hectare)
2001-2002 2002-2003 Total Geographical Area
A By Professional Survey 12991322 12991322 By Village Papers 12991322 12991322 B 1. Forests 2131726 2131604 2. Barren and Unculturable land 477381 478237 3. Land put to Non-agricultural uses 1998296 2012025 4. Culturable Waste 386806 389289
5. Permanent Pastures and other grazing lands
118463 118313
6. Land under misc. tree crops and grooves not included in the net area sown
271363 277596
7. Current fallow lands 1025851 1502616
8. Other fallow lands 1408944 1491311 9. Net area sown 5172492 4590331 Area sown more than once 1053965 600777
Total Cropped Area 6226457 5191108
2.3.2.3 Forests Forests in Tamil Nadu extend over an area of 22876.6 sq. kms and constitute 17.58% of the total geographical area of the State. Out of this, 19388 sq. km is Reserved Forest and 2183 sq km reserved land and 1306 sq. km is unclassified forests. The ecological factors have a special relevance in Tamil Nadu State. Soil erosion and salinity are serious problems. The state is frequently affected by drought. Therefore, measures for safeguarding the ecologically fragile production systems are necessary in the state. During the year 2000-01, reserved forests covers over 19388 sq. km. The percentage of forest area to land area is 17.58. The major forest products are sandalwood (sapwood), Wattle bark, bamboo and cashew nut. Forest based industries are paper & board, Rayon & Staple Fibre and Tanning etc. Plantation in the year 2000-01 achieved is 88548 hectares and seeding 49.75 Lakhs. Plantations rate is growing @18% and 20.7% in the year 1997-98, 1998-99 compared to 1996-97.
2.3.2.4 Industries The State of Tamil Nadu is one of the most highly industrialised and developed States of India. The state ranked eighth in ranking on an all India basis with respect to industrial development and is now fast competing for the top rank. The state is occupying 14.5% in respect of factory sector (No. of factories). The economic reforms process has further aided the state in their efforts to increase the pace of industrialisation. This resulted in the state topping the list of States in 1994 with respect to new investment and second in terms of industrial production. The state has also a large number of incentive schemes for backward regions for furthering the growth of industries.
Design Consultancy for Upgradation of NH 47 Final Detailed Project Report From Thiruvananthapuram to Kanyakumari and Volume - I: Main Report NH 47B From Nagercoil to Kavalkinaru Package - II
SECON 13 NH 47 & 47B-66-PR-O001
According to the Annual Survey of Industries in the entire registered factory sector of Tamil Nadu and conducted in 1996-97, the fixed capital employed by the factory sector was about Rs. 352089 million in 1996-97, as against Rs. 283933 million in 1995-96, showing a net increase of around 24%. The value of total output of all registered factories covered by the survey has increased to Rs. 742124.7 million in 1996-97 from Rs. 674783.6 million in 1995-96, thereby revealing an increase of about 10%. It is worthwhile mentioning that Tamil Nadu ranks third only to Maharashtra and Gujarat in respect of the state wise share in Net Value Added by manufacture generated by the factory sector of the country.
2.3.2.5 Irrigation Irrigation facility is a key factor in increasing agricultural production. The ultimate irrigation potentials are surface water as well as subsurface sources. During the year 2001-02 gross irrigated area was 800707 hec. through canals and 536700 hec. through tanks. There are 9632km of canals and 1652008 used for Irrigation. In Kanyakumari District there are 53 canals for a length of 540 km. In the District, 11364 Hectares are irrigated by canals and 15444 hectares through tanks and there is no tubewell. The ground water resources are relatively limited and some of the ground water resources are fully exploited in different parts of the state to the point of ecological degradation. There is an urgent need to curb the over exploitation of water and the only alternative left is augmentation of water resources through surface water.
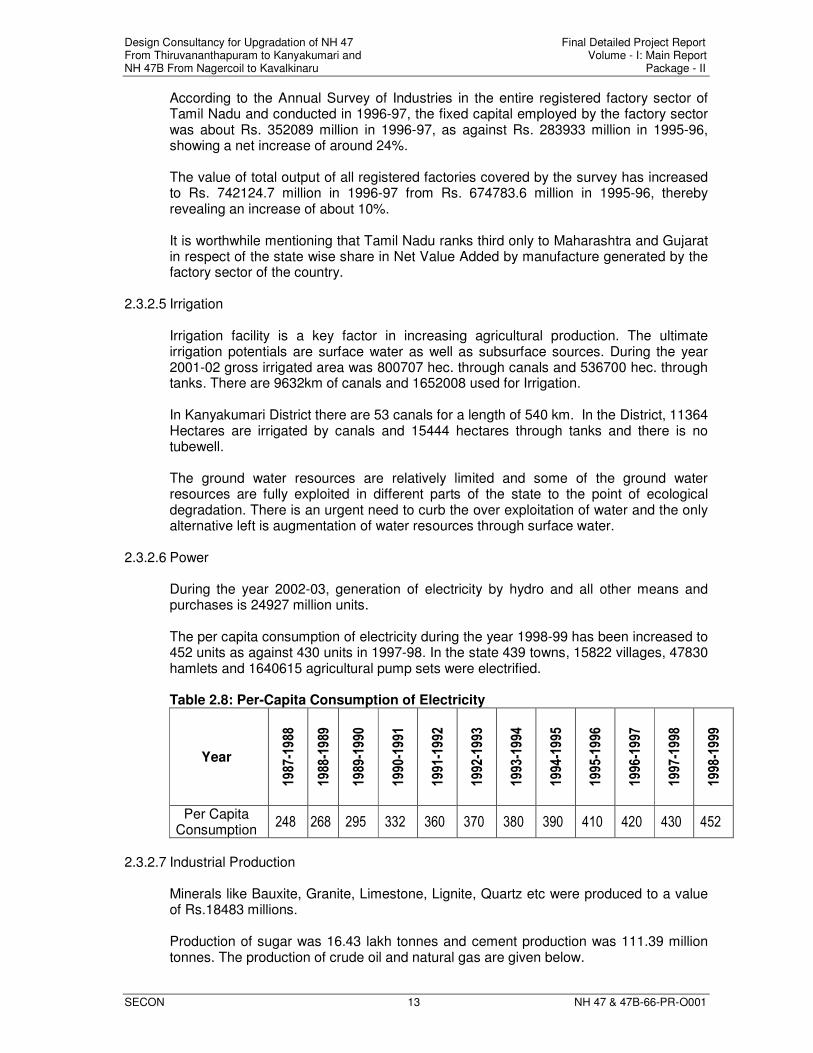
2.3.2.6 Power During the year 2002-03, generation of electricity by hydro and all other means and purchases is 24927 million units. The per capita consumption of electricity during the year 1998-99 has been increased to 452 units as against 430 units in 1997-98. In the state 439 towns, 15822 villages, 47830 hamlets and 1640615 agricultural pump sets were electrified. Table 2.8: Per-Capita Consumption of Electricity
Year
19
87
-19
88
19
88
-19
89
19
89
-19
90
19
90
-19
91
19
91
-19
92
19
92
-19
93
19
93
-19
94
19
94
-19
95
19
95
-19
96
19
96
-19
97
19
97
-19
98
19
98
-19
99
Per Capita Consumption
248 268 295 332 360 370 380 390 410 420 430 452
2.3.2.7 Industrial Production
Minerals like Bauxite, Granite, Limestone, Lignite, Quartz etc were produced to a value of Rs.18483 millions. Production of sugar was 16.43 lakh tonnes and cement production was 111.39 million tonnes. The production of crude oil and natural gas are given below.
Design Consultancy for Upgradation of NH 47 Final Detailed Project Report From Thiruvananthapuram to Kanyakumari and Volume - I: Main Report NH 47B From Nagercoil to Kavalkinaru Package - II
SECON 14 NH 47 & 47B-66-PR-O001
Table 2.9: Production of Crude Oil and Natural Gas in Tamil Nadu
Year Crude Oil Production
Natural Gas Sales (in Million Cubic Metres)
ONCG Joint
Venture Total ONGC
Joint Venture
Total
1999-2000 0.3766 0.274 0.6506 85.91 - 85.91 2000-2001 0.4365 0.199 0.6355 125.56 - 125.56
2001-2002 0.4407 0.224 0.6647 249.03 - 249.03 2002-2003 0.3950 0.207 0.6020 376.92 - 376.92
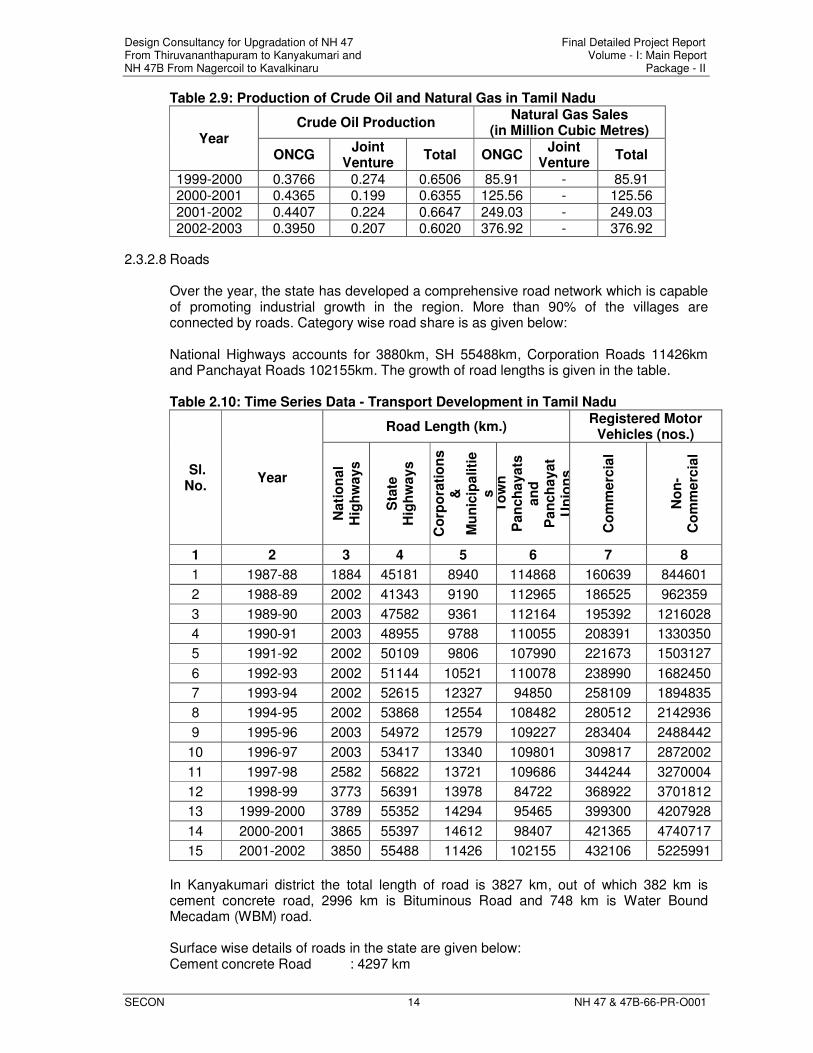
2.3.2.8 Roads Over the year, the state has developed a comprehensive road network which is capable of promoting industrial growth in the region. More than 90% of the villages are connected by roads. Category wise road share is as given below: National Highways accounts for 3880km, SH 55488km, Corporation Roads 11426km and Panchayat Roads 102155km. The growth of road lengths is given in the table. Table 2.10: Time Series Data - Transport Development in Tamil Nadu
Sl. No.
Year
Road Length (km.) Registered Motor
Vehicles (nos.)
Nati
on
al
Hig
hw
ays
Sta
te
Hig
hw
ays
Co
rpo
rati
on
s
&
Mu
nic
ipa
liti
es
To
wn
P
an
ch
ayats
an
d
Pa
nch
ayat
Un
ion
s
Co
mm
erc
ial
No
n-
Co
mm
erc
ial
1 2 3 4 5 6 7 8
1 1987-88 1884 45181 8940 114868 160639 844601
2 1988-89 2002 41343 9190 112965 186525 962359
3 1989-90 2003 47582 9361 112164 195392 1216028
4 1990-91 2003 48955 9788 110055 208391 1330350
5 1991-92 2002 50109 9806 107990 221673 1503127
6 1992-93 2002 51144 10521 110078 238990 1682450
7 1993-94 2002 52615 12327 94850 258109 1894835
8 1994-95 2002 53868 12554 108482 280512 2142936
9 1995-96 2003 54972 12579 109227 283404 2488442
10 1996-97 2003 53417 13340 109801 309817 2872002
11 1997-98 2582 56822 13721 109686 344244 3270004
12 1998-99 3773 56391 13978 84722 368922 3701812
13 1999-2000 3789 55352 14294 95465 399300 4207928
14 2000-2001 3865 55397 14612 98407 421365 4740717
15 2001-2002 3850 55488 11426 102155 432106 5225991
In Kanyakumari district the total length of road is 3827 km, out of which 382 km is cement concrete road, 2996 km is Bituminous Road and 748 km is Water Bound Mecadam (WBM) road. Surface wise details of roads in the state are given below: Cement concrete Road : 4297 km
Design Consultancy for Upgradation of NH 47 Final Detailed Project Report From Thiruvananthapuram to Kanyakumari and Volume - I: Main Report NH 47B From Nagercoil to Kavalkinaru Package - II
SECON 15 NH 47 & 47B-66-PR-O001
Bituminous Road : 106795 km WBM Road : 21443 km Other Surface : 40414 km
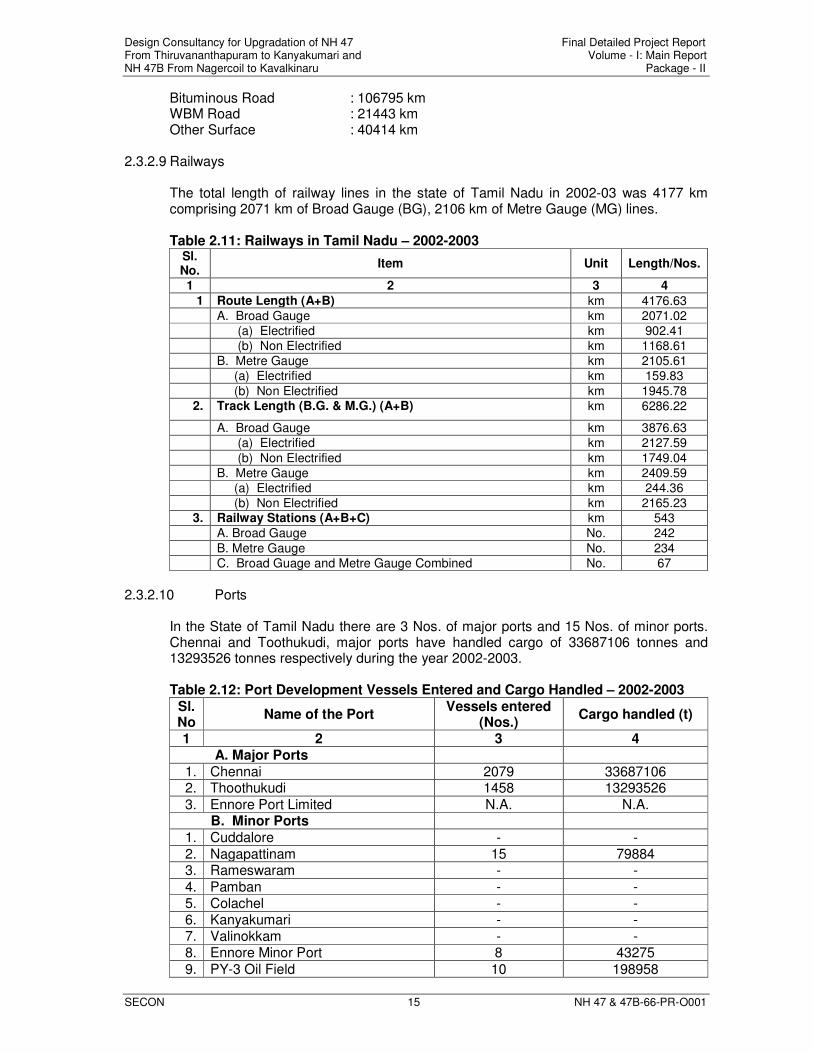
2.3.2.9 Railways The total length of railway lines in the state of Tamil Nadu in 2002-03 was 4177 km comprising 2071 km of Broad Gauge (BG), 2106 km of Metre Gauge (MG) lines. Table 2.11: Railways in Tamil Nadu – 2002-2003
Sl. No.
Item Unit Length/Nos.
1 2 3 4
1 Route Length (A+B) km 4176.63
A. Broad Gauge km 2071.02
(a) Electrified km 902.41
(b) Non Electrified km 1168.61
B. Metre Gauge km 2105.61
(a) Electrified km 159.83
(b) Non Electrified km 1945.78 2. Track Length (B.G. & M.G.) (A+B) km 6286.22
A. Broad Gauge km 3876.63
(a) Electrified km 2127.59
(b) Non Electrified km 1749.04
B. Metre Gauge km 2409.59
(a) Electrified km 244.36
(b) Non Electrified km 2165.23 3. Railway Stations (A+B+C) km 543
A. Broad Gauge No. 242
B. Metre Gauge No. 234
C. Broad Guage and Metre Gauge Combined No. 67
2.3.2.10 Ports
In the State of Tamil Nadu there are 3 Nos. of major ports and 15 Nos. of minor ports. Chennai and Toothukudi, major ports have handled cargo of 33687106 tonnes and 13293526 tonnes respectively during the year 2002-2003.
Table 2.12: Port Development Vessels Entered and Cargo Handled – 2002-2003
Sl. No
Name of the Port Vessels entered
(Nos.) Cargo handled (t)
1 2 3 4 A. Major Ports
1. Chennai 2079 33687106 2. Thoothukudi 1458 13293526
3. Ennore Port Limited N.A. N.A. B. Minor Ports
1. Cuddalore - -
2. Nagapattinam 15 79884 3. Rameswaram - -
4. Pamban - - 5. Colachel - - 6. Kanyakumari - - 7. Valinokkam - - 8. Ennore Minor Port 8 43275
9. PY-3 Oil Field 10 198958
Design Consultancy for Upgradation of NH 47 Final Detailed Project Report From Thiruvananthapuram to Kanyakumari and Volume - I: Main Report NH 47B From Nagercoil to Kavalkinaru Package - II
SECON 16 NH 47 & 47B-66-PR-O001
Sl. No
Name of the Port Vessels entered
(Nos.) Cargo handled (t)
10. Thirukkadaiyur 22 280739
11. Kattupalli - - 12. Thiruchopuram - - 13. Punnakkayal - - 14. Madappad - - 15. Kudankulam - -
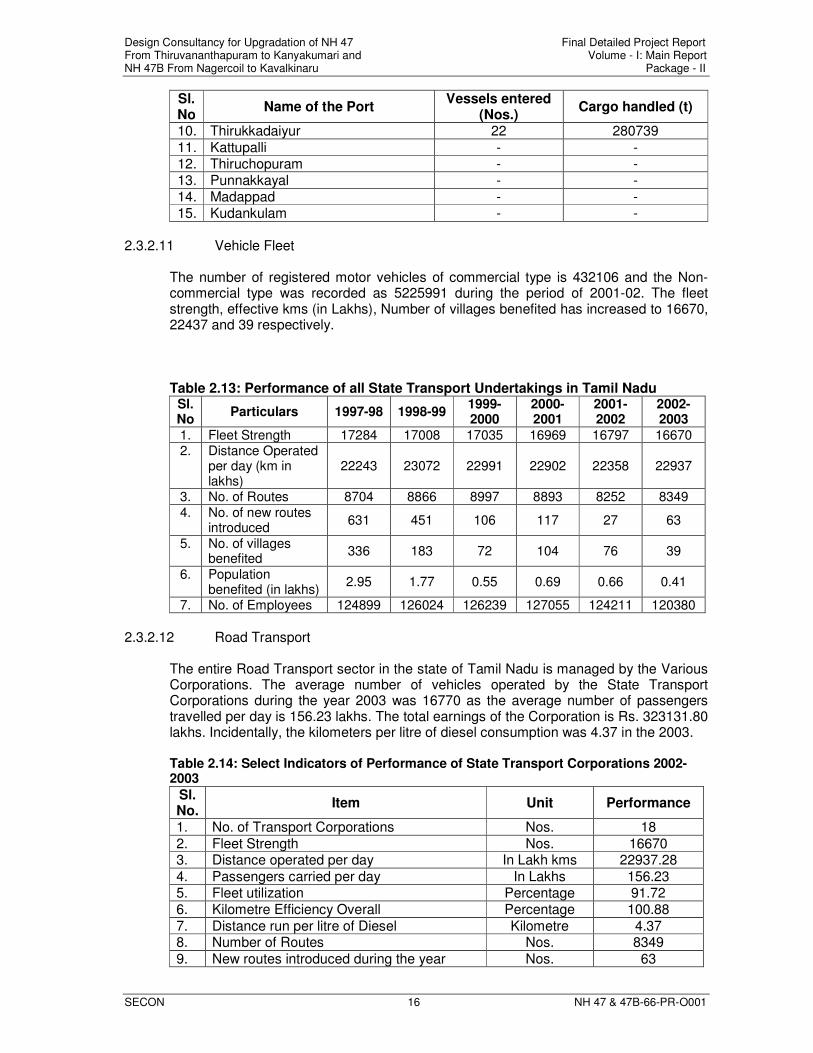
2.3.2.11 Vehicle Fleet
The number of registered motor vehicles of commercial type is 432106 and the Non-commercial type was recorded as 5225991 during the period of 2001-02. The fleet strength, effective kms (in Lakhs), Number of villages benefited has increased to 16670, 22437 and 39 respectively.
Table 2.13: Performance of all State Transport Undertakings in Tamil Nadu Sl. No
Particulars 1997-98 1998-99 1999-2000
2000-2001
2001-2002
2002-2003
1. Fleet Strength 17284 17008 17035 16969 16797 16670 2. Distance Operated
per day (km in lakhs)
22243 23072 22991 22902 22358 22937
3. No. of Routes 8704 8866 8997 8893 8252 8349 4. No. of new routes
introduced 631 451 106 117 27 63
5. No. of villages benefited
336 183 72 104 76 39
6. Population benefited (in lakhs)
2.95 1.77 0.55 0.69 0.66 0.41
7. No. of Employees 124899 126024 126239 127055 124211 120380
2.3.2.12 Road Transport
The entire Road Transport sector in the state of Tamil Nadu is managed by the Various Corporations. The average number of vehicles operated by the State Transport Corporations during the year 2003 was 16770 as the average number of passengers travelled per day is 156.23 lakhs. The total earnings of the Corporation is Rs. 323131.80 lakhs. Incidentally, the kilometers per litre of diesel consumption was 4.37 in the 2003. Table 2.14: Select Indicators of Performance of State Transport Corporations 2002-2003
Sl. No.
Item Unit Performance
1. No. of Transport Corporations Nos. 18
2. Fleet Strength Nos. 16670 3. Distance operated per day In Lakh kms 22937.28
4. Passengers carried per day In Lakhs 156.23 5. Fleet utilization Percentage 91.72 6. Kilometre Efficiency Overall Percentage 100.88
7. Distance run per litre of Diesel Kilometre 4.37 8. Number of Routes Nos. 8349
9. New routes introduced during the year Nos. 63
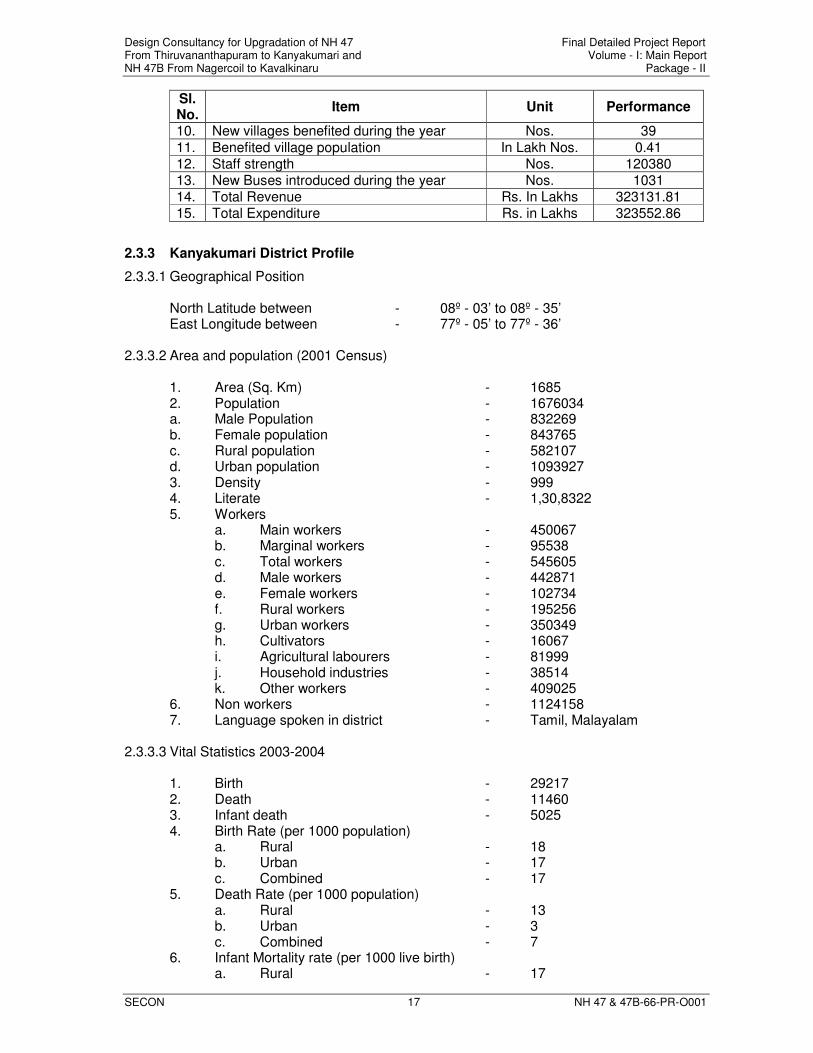
Design Consultancy for Upgradation of NH 47 Final Detailed Project Report From Thiruvananthapuram to Kanyakumari and Volume - I: Main Report NH 47B From Nagercoil to Kavalkinaru Package - II
SECON 17 NH 47 & 47B-66-PR-O001
Sl. No.
Item Unit Performance
10. New villages benefited during the year Nos. 39
11. Benefited village population In Lakh Nos. 0.41 12. Staff strength Nos. 120380 13. New Buses introduced during the year Nos. 1031 14. Total Revenue Rs. In Lakhs 323131.81 15. Total Expenditure Rs. in Lakhs 323552.86
2.3.3 Kanyakumari District Profile
2.3.3.1 Geographical Position
North Latitude between - 08º - 03’ to 08º - 35’ East Longitude between - 77º - 05’ to 77º - 36’
2.3.3.2 Area and population (2001 Census)
1. Area (Sq. Km) - 1685 2. Population - 1676034 a. Male Population - 832269 b. Female population - 843765 c. Rural population - 582107 d. Urban population - 1093927 3. Density - 999 4. Literate - 1,30,8322 5. Workers a. Main workers - 450067 b. Marginal workers - 95538 c. Total workers - 545605 d. Male workers - 442871 e. Female workers - 102734 f. Rural workers - 195256 g. Urban workers - 350349 h. Cultivators - 16067 i. Agricultural labourers - 81999 j. Household industries - 38514 k. Other workers - 409025 6. Non workers - 1124158 7. Language spoken in district - Tamil, Malayalam
2.3.3.3 Vital Statistics 2003-2004
1. Birth - 29217 2. Death - 11460 3. Infant death - 5025 4. Birth Rate (per 1000 population) a. Rural - 18 b. Urban - 17 c. Combined - 17 5. Death Rate (per 1000 population) a. Rural - 13 b. Urban - 3 c. Combined - 7
6. Infant Mortality rate (per 1000 live birth) a. Rural - 17
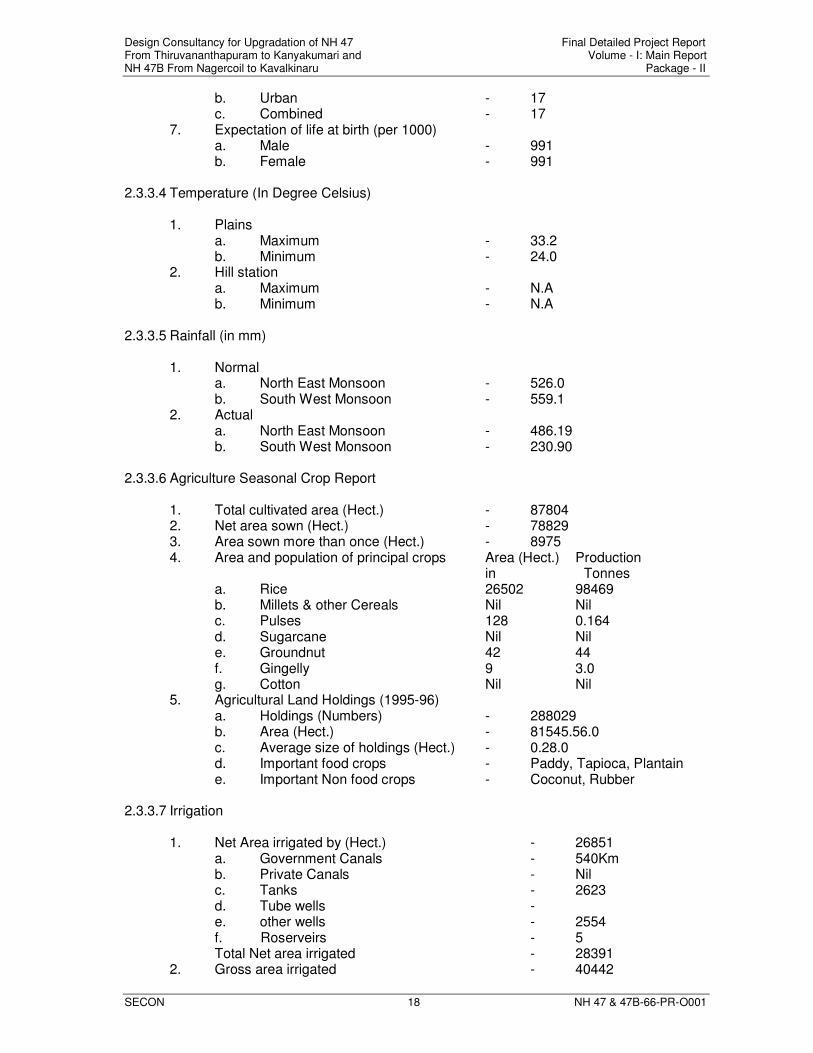
Design Consultancy for Upgradation of NH 47 Final Detailed Project Report From Thiruvananthapuram to Kanyakumari and Volume - I: Main Report NH 47B From Nagercoil to Kavalkinaru Package - II
SECON 18 NH 47 & 47B-66-PR-O001
b. Urban - 17 c. Combined - 17 7. Expectation of life at birth (per 1000) a. Male - 991 b. Female - 991 2.3.3.4 Temperature (In Degree Celsius)
1. Plains a. Maximum - 33.2 b. Minimum - 24.0 2. Hill station a. Maximum - N.A b. Minimum - N.A 2.3.3.5 Rainfall (in mm)
1. Normal a. North East Monsoon - 526.0 b. South West Monsoon - 559.1 2. Actual a. North East Monsoon - 486.19 b. South West Monsoon - 230.90 2.3.3.6 Agriculture Seasonal Crop Report
1. Total cultivated area (Hect.) - 87804 2. Net area sown (Hect.) - 78829 3. Area sown more than once (Hect.) - 8975 4. Area and population of principal crops Area (Hect.) Production in Tonnes a. Rice 26502 98469 b. Millets & other Cereals Nil Nil c. Pulses 128 0.164 d. Sugarcane Nil Nil e. Groundnut 42 44 f. Gingelly 9 3.0 g. Cotton Nil Nil 5. Agricultural Land Holdings (1995-96) a. Holdings (Numbers) - 288029 b. Area (Hect.) - 81545.56.0 c. Average size of holdings (Hect.) - 0.28.0 d. Important food crops - Paddy, Tapioca, Plantain e. Important Non food crops - Coconut, Rubber 2.3.3.7 Irrigation
1. Net Area irrigated by (Hect.) - 26851 a. Government Canals - 540Km b. Private Canals - Nil c. Tanks - 2623 d. Tube wells - e. other wells - 2554 f. Roserveirs - 5 Total Net area irrigated - 28391 2. Gross area irrigated - 40442
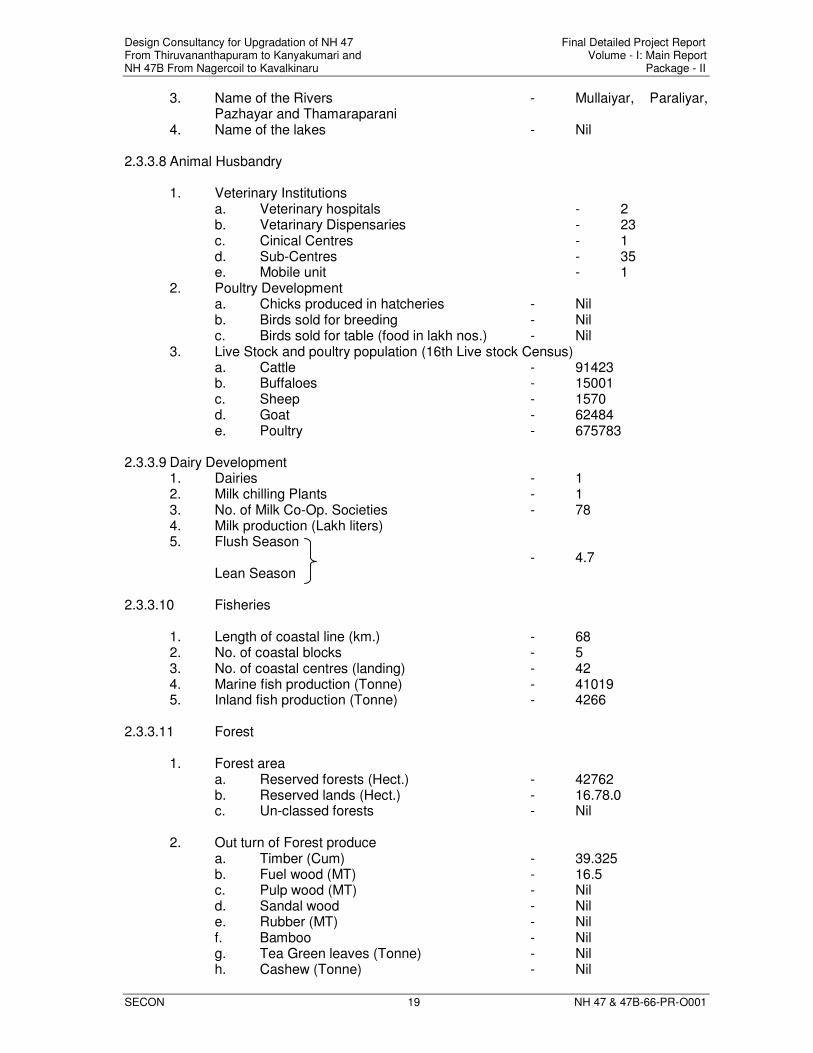
Design Consultancy for Upgradation of NH 47 Final Detailed Project Report From Thiruvananthapuram to Kanyakumari and Volume - I: Main Report NH 47B From Nagercoil to Kavalkinaru Package - II
SECON 19 NH 47 & 47B-66-PR-O001
3. Name of the Rivers - Mullaiyar, Paraliyar, Pazhayar and Thamaraparani
4. Name of the lakes - Nil 2.3.3.8 Animal Husbandry
1. Veterinary Institutions
a. Veterinary hospitals - 2 b. Vetarinary Dispensaries - 23 c. Cinical Centres - 1 d. Sub-Centres - 35 e. Mobile unit - 1
2. Poultry Development a. Chicks produced in hatcheries - Nil b. Birds sold for breeding - Nil c. Birds sold for table (food in lakh nos.) - Nil
3. Live Stock and poultry population (16th Live stock Census) a. Cattle - 91423 b. Buffaloes - 15001 c. Sheep - 1570 d. Goat - 62484 e. Poultry - 675783
2.3.3.9 Dairy Development
1. Dairies - 1 2. Milk chilling Plants - 1 3. No. of Milk Co-Op. Societies - 78 4. Milk production (Lakh liters) 5. Flush Season - 4.7 Lean Season
2.3.3.10 Fisheries
1. Length of coastal line (km.) - 68 2. No. of coastal blocks - 5 3. No. of coastal centres (landing) - 42 4. Marine fish production (Tonne) - 41019 5. Inland fish production (Tonne) - 4266
2.3.3.11 Forest
1. Forest area a. Reserved forests (Hect.) - 42762 b. Reserved lands (Hect.) - 16.78.0 c. Un-classed forests - Nil
2. Out turn of Forest produce
a. Timber (Cum) - 39.325 b. Fuel wood (MT) - 16.5 c. Pulp wood (MT) - Nil
d. Sandal wood - Nil e. Rubber (MT) - Nil f. Bamboo - Nil g. Tea Green leaves (Tonne) - Nil h. Cashew (Tonne) - Nil
Design Consultancy for Upgradation of NH 47 Final Detailed Project Report From Thiruvananthapuram to Kanyakumari and Volume - I: Main Report NH 47B From Nagercoil to Kavalkinaru Package - II
SECON 20 NH 47 & 47B-66-PR-O001
2.3.3.12 Electricity
1. Generation of electricity (in M.U) a. Hydro - 151385 b. wind Mill Generation - 23.270 c. Thermal - Nil d. Power purchased
2.4 Social Analysis of the Project
As outlined in the economic justification of the project major benefits of the proposed highway project are:
� Savings in the Vehicle Operating Cost (VOC) � Savings in Travel Time (Time) � Improved Riding Quality (RQs) � Improved Services and Facilities along the Highway
All these benefits are obviously aimed at various categories of vehicles/ road users using the road facility. However being an important infrastructure facility providing movement of goods and persons direct as well as indirect, impacts are also likely to be experienced by various sections of the population and economic activities in the areas through which the highway traverses. Analogous experience suggests that by providing means of relatively easy and rapid access to higher levels of cultural social and economic infrastructure, improved road facility can possibly become a catalyst for furthering social and economic development objectives. Following paragraphs analyze the possible impacts of the proposed project on various sections of the population economic sectors/ production systems and defined social objectives. Given the existing socio-economic processes in the project region, besides outlining potential benefits, analysis also focuses on issues of equitable distribution of project benefits in terms of gender and vulnerable section of the society.
2.4.1 Employment and Poverty Alleviation
In terms of rural population dependent on the net area sown, the pressure on agriculture land appears to be quite high. Due to constraints of availability of water, further intensification of agriculture in the project area may be a difficult proposition in the near future suggesting the need to further accelerate the pace of non-agrarian economic development. Enhanced road capacity by removing a critical infrastructure bottleneck can possibly facilitate rapid industrial development (and employment) along the project corridor. However under the existing socio-economic process, project’s potential contribution to poverty alleviation and providing non-agrarian employment for resource poor Scheduled Caste population in the region appears to be rather limited. For equitable distribution of non agrarian employment and thus exploiting economic development potential created by the proposed project, there is a need to devise and implement innovative non-agrarian employment programs for socially vulnerable and resource poor sections of the local population.
2.4.2 Agriculture and Rural Social Classes
Given the strong market orientation of agricultural activities in the region, reduction in transportation costs and through deeper integration of the project area with the major markets, agriculture is going to be positively affected by the proposed project. Further proliferation of cash crops will definitely improve farm incomes.
Design Consultancy for Upgradation of NH 47 Final Detailed Project Report From Thiruvananthapuram to Kanyakumari and Volume - I: Main Report NH 47B From Nagercoil to Kavalkinaru Package - II
SECON 21 NH 47 & 47B-66-PR-O001
Transportation times saving is likely to have a highly beneficial impact on allied agrarian activities such as horticulture fishing, poultry development and animal husbandry. Producing high-value commodities with short shelf-life, facility of rapid evacuation of perishable agro-products is going to provide a strong impetus to these activities and thus enhance rural incomes and employment opportunities in the rural areas. The proposed project provides a strong potential for providing self-employment and poverty aleviation opportunities for vulnerable and resource poor section of the society. By providing them with necessary technical know-how, needed resources and organization logistics to encourage them to engage in activities such as small scale floriculture poultry development and animal husbandry, substantial reduction in poverty levels can be achieved.
2.4.3 Industry, Trade, Commerce and Other Services
Apparently clubbing these together may not sound very appropriate. But in Indian conditions, there exists strong linkage between trade, commerce and industrial activity with lot of mobility of capital and educated workforce employed in these sectors. Integration of markets with production centres through easing of transport cost barriers is anticipated to have direct benefits that are likely to be fairly evenly distributed across these sectors.
2.4.4 Literacy, Health and Human Resource Development
By facilitating increased household incomes and providing convenient access to higher levels of educational and health infrastructure, the proposed project has the potential to play a catalytic role in enhancing educational and health status of rural communities in the project region. However, given the existing patterns of distribution of economic resources and cultural constraints such benefits may not be evenly distributed across various social classes and communities.
2.4.5 Gender
Contrary to commonly held notions, the generalized impacts of the anticipated project benefits on women in the project area are anticipated to be only indirect. In terms of Women’s employment given the existing scenario of non-agrarian employment where project areas women in general and SC woman in particular find themselves in relatively disadvantageous position vis-a-vis their male counterparts expansion of non-agrarian employment due to the proposed project may not result in any substantial gains. However women’s education and health may experience positive gains due to speedy and convenient access to higher-level educational and health facilities located in urban centres of the region.
2.4.6 Scheduled Castes
Being a socially discriminated section of the society, Constitution of India has several provisions for safeguarding their dignity, positive access to developmental opportunities and other benefits. Generally belonging to extremely poor sections of the society, most of them being agricultural labourers, affordable mobility can definitely facilitate their attempts to improve incomes and access to various development opportunities and facilities. However under existing socio-development processes in terms of access to employment in non-agrarian sectors of the economy, resource- poor SC communities in
Design Consultancy for Upgradation of NH 47 Final Detailed Project Report From Thiruvananthapuram to Kanyakumari and Volume - I: Main Report NH 47B From Nagercoil to Kavalkinaru Package - II
SECON 22 NH 47 & 47B-66-PR-O001
the region appear to find themselves in a relatively disadvantageous position vis-a-vis other communities. To enable SC communities in the project region to take advantage of enhanced development potential likely to be generated by the proposed project appropriate skill, development training and other program need to be implemented by concerned State Government agencies.
2.5 Conclusion
The project road area comprising of Kanyakumari District in Tamil Nadu is densely populated, with all religious groups and variation in economic status is high. Unemployment is rampant and there is a large scale migration of educated and skilled labourers to other states and nations. The literacy rate is high among both males and females and awareness of the people is more. Even though the area is littered with rare earth, minerals and water, coastal line and tourist spots, no big industries are coming up. The proposed project will pave the way for industrial growth of the area, enhance employment potential and facilitate fast and safe transportation to other parts of the country.
3.0 SUMMARY OF SURVEY AND INVESTIGATIONS
3.1 Topographical and Cadastral Surveys
3.1.1 Topographical Survey
Topographical survey was conducted for the purpose of creating a digital terrain model (in order to design the road and structures) for the stretch of the road from km 43/000 to km 96/714 of NH 47 (Karode to Kanayakumari) and from km 0/000 to km-16/376 of NH 47B (Nagercoil to Kavalkinaru).
3.1.2 Methodology for Topographical Survey
The survey was carried out as follows: 3.1.2.1 Basic plan control
The coordinates of the basic plan control points were established with the use of differential GPS equipment (Leica-SR 530) providing accurate and homogeneous control all along the length of the road stretch. There are 27 GPS stations established during the survey, most of which are on rock-out-crop / sheet rocks situated along the proposed alignment. For each GPS station there is a reference point situated at about 200m away, which has also been fixed by differential GPS method and on similar object as for the GPS station, to serve the purpose of providing starting and closing bearing for Total Station traverse as well as for providing extra primary control point. The co-ordinates were obtained on WGS – 84 system on Transverse Mercator’s Projection with the central meridian of projection passing through the center of the stretch, thereby having practically no scale error for the coordinates.
3.1.2.2 Extension of Planimetric control
In between GPS stations, Total Station traverses were run providing planimetric positions at about 250m apart. Since Bench Marks are established at about 250m apart along the road length, these points were connected during the Total Station traverse for control. Total Stations of 1 second accuracy (Leica TC 1800L and Topcon GTS 710) were used, providing both plan and height control for the pillars / other control points.
Design Consultancy for Upgradation of NH 47 Final Detailed Project Report From Thiruvananthapuram to Kanyakumari and Volume - I: Main Report NH 47B From Nagercoil to Kavalkinaru Package - II
SECON 23 NH 47 & 47B-66-PR-O001
3.1.2.3 Height Control
Double tertiary leveling was done along the entire stretch with precision automatic levels connecting the existing G.T.S. BM at Balaramapuram. The DT leveling was started from this GTS BM and closed on another G.T.S. BM at Thakkalai and further from Thakkalai to Kanyakumari.
The misclosures were seen to be below the tolerant limit of 12 k mm, where k is the length of the leveling line in km. The misclosures were adjusted and heights given to all Bench Marks established at about 250m apart all along the alignment on RCC pillars (as specified by NHAI vide Terms of Reference). Thus, all the Bench Marks established along the stretch are in terms of GTS Bench Marks established by Survey of India.
3.1.2.4 Detailed Survey
All the details / features along the road within the survey boundary were picked up by conducting a detailed Total Station Survey in between the planimetric control points. X, Y and Z coordinates of relevant points were captured by this Total Station survey, such as electric / telephone pole, tree with type, statue, wells and points on string lines (i.e., points on the same linear feature such as centerline of road, left / right edge of carriageway, left / right edge embankment top, left / right embankment toe line, break points on ground, visible property lines, streams, building etc., within the limit of survey).
3.1.2.5 Creation of Digital Terrain Model
The survey data were down loaded and converted to graphic files using Automap and Nova Point software. With the help of x, y, z coordinates of the several points picked up in the field, digital terrain models were created in which the road design is done.
3.2 Cadastral Survey
The cadastral survey has been carried out along the proposed alignment from km 43/000 to km 96/714 of NH 47 and from km 0/000 to km 16/4000 of NH 47B for package-II. The ROW was limited to 60m in Tamil Nadu region. While carrying out cadastral survey the same has been taken into consideration and details of ownership have been collected accordingly.
The draft Gazette Notification No.3 for details of land to be acquired village wise and mandal wise are prepared for submission to NHAI authorities for necessary notification and acquisition of additional land.
3.3 Investigation Data
3.3.1 Inventory for Structures
Detailed condition survey of the existing structures was carried out simultaneously along with the detailed inventory survey. Visual examination of the structures using conventional standard tools mentioned in QAP is considered / recommended for the assessment of the condition of the structure. Signs of degradation and deterioration of the structures such as cracks, exposure of reinforcement, rust stains, corrosion, deflection, if any, condition of expansion joints, bearings, condition of the drain were noted. Details of Condition of Bridges are provided.
Design Consultancy for Upgradation of NH 47 Final Detailed Project Report From Thiruvananthapuram to Kanyakumari and Volume - I: Main Report NH 47B From Nagercoil to Kavalkinaru Package - II
SECON 24 NH 47 & 47B-66-PR-O001
3.3.2 Benkelman Beam Deflection Survey
The design of pavement overlays for the existing pavements requires an evaluation of the available strength in the pavement. The Benkelman Beam (BB) allows an estimate of this available strength to be made by recording of the deflection of the pavement surface at a point when a standard load moves past that point. Because of the inherent variability in the pavement structure it is found that the characteristic value of the pavement deflection is best taken as function of the mean of a series of readings rather than a single reading. To generate the required coverage without generating an excessive number of tests the routine BBD testing was specified at 100m intervals. All testing was carried out in accordance with the requirements of IRC 81-1997.
3.3.3 Bump Integrator Test
The roughness surveys along the existing road stretch of NH 47 have been carried out by using Bump Integrator equipment developed by Central Road Research Institute, New Delhi. The road roughness is measured for every 200m intervals along the stretch by towing the bump integrator on each lane. Two runs have been made for each lane. The collected data has been processed to find out the roughness value.
3.3.4 Existing Soil Strata upto 2m below Ground Level
The existing soil strata for about 2m depth from the ground level have been studied by detailed soil classification from the samples collected at site.
3.3.5 Borelog details
The goe-technical investigations have been carried out at all the major and minor bridge locations and other structures locations. The details of the Borelogs have been presented in Design Report.
4.0 TRAFFIC STUDY AND ANALYSIS
4.1 Traffic Surveys
4.1.1 General
Information about traffic is essential for the highway project since it forms the basis for deciding the number of lanes, design of intersections, design of pavement as well as economic appraisal of the project. Traffic studies require collection of basic information regarding the current level of traffic and its characteristics viz., volume, composition, origin and destination studies, axle load spectrum, speed and delay studies, turning movements, vehicle occupancy etc. These studies generally consist of mode wise traffic estimates, travel patterns of passenger and freight (goods) etc.
The locations for traffic studies were finalised on the basis of a reconnaissance survey undertaken for the project road and in consultation with the NHAI. The project road is a section of the national highway NH 47 connecting Kanyakumari and Thiruvananthapuram and a section NH 47B connecting Nagercoil and Kavalkinaru. NH 47 connects the industrial belts in its influence area to Cochin Port, which falls in its (NH 47) alignment. Proforma designed for traffic surveys are submitted in QAP.
The traffic surveys undertaken for the purpose include:
� Classified 7-day continuous traffic volume counts. � Intersection turning movement surveys � Origin-Destination surveys � Willingness to Pay toll surveys � Pedestrian/Cattle movement surveys � Axle Load surveys
Design Consultancy for Upgradation of NH 47 Final Detailed Project Report From Thiruvananthapuram to Kanyakumari and Volume - I: Main Report NH 47B From Nagercoil to Kavalkinaru Package - II
SECON 25 NH 47 & 47B-66-PR-O001
� Travel time surveys
In addition to the above, data on traffic accidents on the project road stretch was collected to identify black spot locations to suggest suitable remedial measures. Traffic on the Project Road is characterised by a high degree of motorised vehicles, which consist of passenger vehicles such as cars, two wheelers (scooters/motor cycles), buses; and commercial vehicles such as light commercial vehicles (LCVs) and trucks. Non-motorised vehicles, in the traffic stream, consist mostly of bicycles with negligible number of animal drawn vehicles. The classification system specified in the TOR (Terms of Reference) and detailed hereinafter was adopted for the counts.
4.1.2 Motorised Traffic
� 2-wheeler (Scooter/motor Cycle) � 3-Wheeler (Autorickshaw) � Passenger car � Utility Vehicle (Jeep, Van etc.) � Bus (Standard) � Mini Bus � Light Commercial Vehicle (LCV) Passenger � Light Commercial Vehicle (LCV) Freight � Truck - MCV – 2 Axle Rigid Chassis � Truck - HCV – 3 Axle Rigid Chassis � Truck - MAV – Semi Articulated � Truck - MAV – Articulated
4.1.3 Non-Motorised Traffic
� Bicycle � Animal Drawn Vehicle � Others
4.2 Traffic surveys on NH 47 and NH 47B
4.2.1 Classified Traffic Volume Counts
Classified Traffic Volume Counts for 7 continuous days is conducted at three locations, which provides the information about the traffic along the project road. The survey locations are given in Table 4.1 below.
Table 4.1: Traffic Volume Count Location
S. No. Volume Count Location Location 1 VC-1 NH 47 km 626/000
2 VC-2 NH 47 km 646/400 3 VC-3 NH 47B km 11/000
The survey locations approximately coincide with the regular (historical) traffic count station of the National Highways. The classified traffic counts at station VC1 and VC2 were conducted between 15th October 2004 to 21st October 2004 and at VC5 between 16th November to 22nd November 2004 and VC-5 between 16th Nov to 22nd Nov 2004. The number of vehicles in either direction was noted at 15-minute intervals in accordance with their classification by observers specially trained for this purpose.
Design Consultancy for Upgradation of NH 47 Final Detailed Project Report From Thiruvananthapuram to Kanyakumari and Volume - I: Main Report NH 47B From Nagercoil to Kavalkinaru Package - II
SECON 26 NH 47 & 47B-66-PR-O001
4.2.2 Classified Turning Movement Surveys
On the basis of the reconnaissance survey, four intersections along the project road were identified for conducting detailed turning movement surveys. The intersection details are as detailed in Table 4.2 below:
Table 4.2: Turning Movement Traffic Volume Count Locations
Sl. No Count Location Location Details 1 IC-1 NH 47 km 630/400 2 IC-2 NH 47 km 641/600 3 IC-3 NH 47 km 653/000 4 IC-4 NH 47B km 0/000
4.2.3 O-D Survey and Commodity Movement Survey
An Origin-Destination (O-D) and Commodity Movement Survey were carried out adopting Road Side Interviews (RSI) method at two stations for a continuous period of 24 hours. The random sampling method was adopted for this survey. The local police assistance was available to stop the vehicles for interviewing the road users. The RSI was carried out through pre-planned and structured questionnaires suitable for computer analysis. Table 4.3 shows the locations adopted for the O-D surveys are as follows:
Table 4.3: Origin-Destination Survey Locations
Sl. No Number Location Details
1 OD-1 NH 47 km 646/400 2 OD-2 NH 47B km 11/00
The information collected during these surveys for passenger vehicles included the origin and destination; purpose, occupancy and frequency of the trip and income of the main passenger in the vehicle. In the case of freight vehicles the information sought included type and quantity of commodity being transported, in addition to origin and destination, and frequency of travel on the route.
4.2.4 Axle Load Surveys
Axle load surveys were conducted for a period of 24 hours at km 10/600 on NH 47B on 16th / 17th November 2004. Light commercial vehicles; two-axle, three-axle and multi-axle trucks (both loaded and empty) were selected at random and their individual axle weights were determined using axle load weighing pads. A certain number of buses were also weighed.
4.2.5 Pedestrian / Cattle Surveys
Uncontrolled pedestrian or cattle movement across the highway results in traffic hazards and accidents. While there are no significant cattle crossing across the project road, appreciable pedestrian crossing activity is observed at location km 629/000 on NH 47. Pedestrian surveys were organised for 12 hours on a representative working day between 8.00 AM to 8.00 PM. The number of pedestrians walking across the road at 15-minute intervals was observed at the above location.
4.2.6 Speed and Delay (Travel Time) Surveys
Travel Time survey was carried out using “Moving Car Observer Method” on the entire project road on 22nd and 23rd November 2004 on NH 47. The survey was carried out during peak as well as off peak periods. Information on journey time, number of vehicles
Design Consultancy for Upgradation of NH 47 Final Detailed Project Report From Thiruvananthapuram to Kanyakumari and Volume - I: Main Report NH 47B From Nagercoil to Kavalkinaru Package - II
SECON 27 NH 47 & 47B-66-PR-O001
in opposite direction, number of vehicles overtaken by the test car, vehicles overtaking the test car and any delays occurring en-route were recorded during the survey. Two runs were made in each direction.
4.2.7 Willingness to Pay Surveys
The willingness to pay survey was conducted at the following locations. The surveys were conducted at the locations of the OD surveys as given in Table 4.4 below:
Table 4.4: Willingness to Pay Survey Locations
Sl. No Number Location Details 1 WPS-1 NH 47 km 646/400
2 WPS-2 NH 47B km 11/00 4.3 Traffic Analysis
4.3.1 Historical Traffic
The historical data of total and classified number of registered vehicles available with departments have been collected at Kanyakumari for Kanyakumari district and Tamil Nadu State tabulated in Table 4.5(a) below:
Table 4.5(a): Vehicle registration data for Kanyakumari District.
Year Cars TW Auto Bus LCV Trucks 2 axle
Trucks 3 axle
Trucks Multi-axle
Any Other
Total
2001 723 7615 690 05 344 02 36 05 189 9609
2002 780 8303 435 0 108 56 100 91 25 9898 2003 688 7155 278 8 265 11 37 24 76 8542 2004 711 11546 36 02 181 20 31 5 35 12567
Table 4.5(b): Vehicle registration data for Tamil Nadu State
Year 2Wheelers Cars Bus Auto Trucks Others
1993 1586412 301082 31952 61644 160142 11717 1994 1815233 319589 34155 66987 174807 12677
1995 2101787 342326 35956 79172 199572 13033
1996 2454061 370095 37806 93121 213037 13069 1997 2849949 389857 38223 100502 224261 14582
1998 3221037 418380 40641 114633 261484 16667 1999 3629525 453023 42058 128764 285708 18150
2000 4126908 419263 44957 150084 318982 18760 2001 4560290 535503 46056 161996 347077 18991
2002 4997673 579743 49255 181626 380761 19979
4.3.2 Seasonal Variation
Traffic levels along a study stretch vary during different periods of time i.e., in different months/seasons. Information on this aspect is necessary to estimate the AADT (Average Annual Daily Traffic). This is best understood by studying monthly historical traffic volumes on the project road. Since past traffic volume data along the project road was not available, the commercial vehicle data obtained at Amaravila Check post near Thiruvananthapuram for the last four years was considered. It has been found that the maximum vehicles were recorded in the month of January followed by May. The factors were compared with the factors mentioned in the Kerala State Highway Project, wherein the monthly sales of motor fuel have been used to derive the seasonal correction factors.
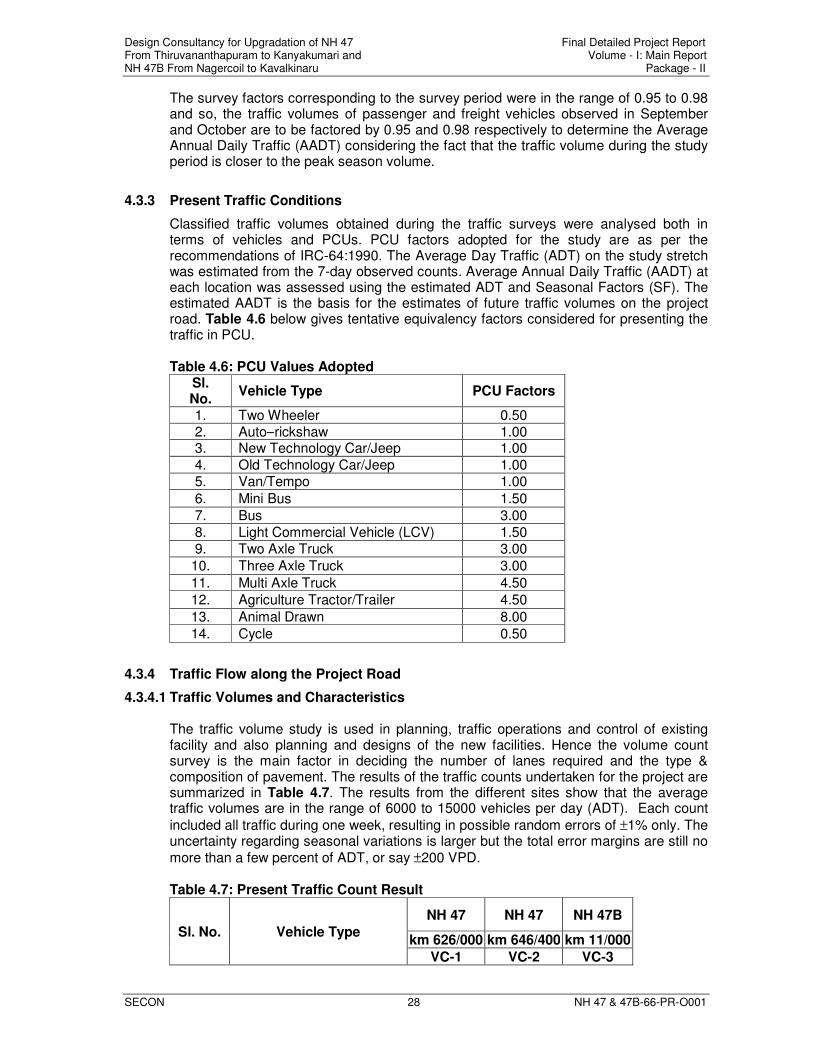
Design Consultancy for Upgradation of NH 47 Final Detailed Project Report From Thiruvananthapuram to Kanyakumari and Volume - I: Main Report NH 47B From Nagercoil to Kavalkinaru Package - II
SECON 28 NH 47 & 47B-66-PR-O001
The survey factors corresponding to the survey period were in the range of 0.95 to 0.98 and so, the traffic volumes of passenger and freight vehicles observed in September and October are to be factored by 0.95 and 0.98 respectively to determine the Average Annual Daily Traffic (AADT) considering the fact that the traffic volume during the study period is closer to the peak season volume.
4.3.3 Present Traffic Conditions
Classified traffic volumes obtained during the traffic surveys were analysed both in terms of vehicles and PCUs. PCU factors adopted for the study are as per the recommendations of IRC-64:1990. The Average Day Traffic (ADT) on the study stretch was estimated from the 7-day observed counts. Average Annual Daily Traffic (AADT) at each location was assessed using the estimated ADT and Seasonal Factors (SF). The estimated AADT is the basis for the estimates of future traffic volumes on the project road. Table 4.6 below gives tentative equivalency factors considered for presenting the traffic in PCU.
Table 4.6: PCU Values Adopted
Sl. No.
Vehicle Type PCU Factors
1. Two Wheeler 0.50
2. Auto–rickshaw 1.00 3. New Technology Car/Jeep 1.00
4. Old Technology Car/Jeep 1.00
5. Van/Tempo 1.00
6. Mini Bus 1.50
7. Bus 3.00
8. Light Commercial Vehicle (LCV) 1.50
9. Two Axle Truck 3.00
10. Three Axle Truck 3.00
11. Multi Axle Truck 4.50
12. Agriculture Tractor/Trailer 4.50
13. Animal Drawn 8.00
14. Cycle 0.50
4.3.4 Traffic Flow along the Project Road
4.3.4.1 Traffic Volumes and Characteristics The traffic volume study is used in planning, traffic operations and control of existing facility and also planning and designs of the new facilities. Hence the volume count survey is the main factor in deciding the number of lanes required and the type & composition of pavement. The results of the traffic counts undertaken for the project are summarized in Table 4.7. The results from the different sites show that the average traffic volumes are in the range of 6000 to 15000 vehicles per day (ADT). Each count
included all traffic during one week, resulting in possible random errors of ±1% only. The uncertainty regarding seasonal variations is larger but the total error margins are still no
more than a few percent of ADT, or say ±200 VPD.
Table 4.7: Present Traffic Count Result
Sl. No. Vehicle Type
NH 47 NH 47 NH 47B
km 626/000 km 646/400 km 11/000
VC-1 VC-2 VC-3
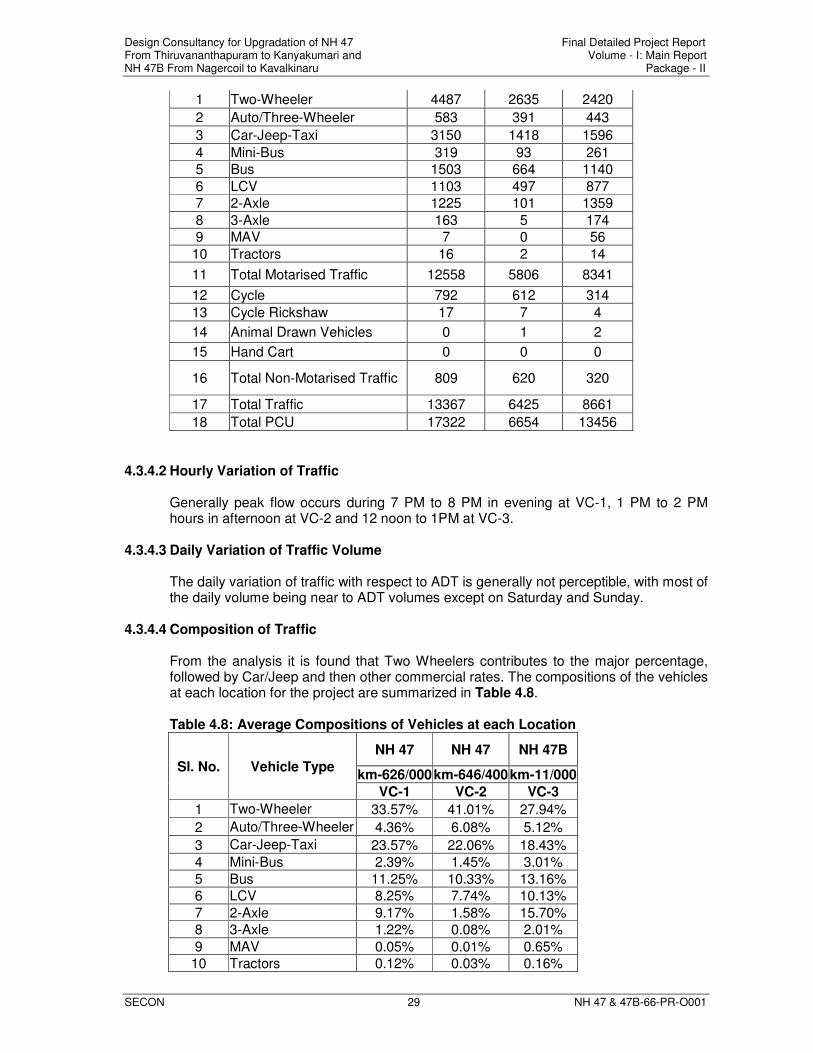
Design Consultancy for Upgradation of NH 47 Final Detailed Project Report From Thiruvananthapuram to Kanyakumari and Volume - I: Main Report NH 47B From Nagercoil to Kavalkinaru Package - II
SECON 29 NH 47 & 47B-66-PR-O001
1 Two-Wheeler 4487 2635 2420
2 Auto/Three-Wheeler 583 391 443
3 Car-Jeep-Taxi 3150 1418 1596
4 Mini-Bus 319 93 261
5 Bus 1503 664 1140
6 LCV 1103 497 877
7 2-Axle 1225 101 1359
8 3-Axle 163 5 174
9 MAV 7 0 56
10 Tractors 16 2 14
11 Total Motarised Traffic 12558 5806 8341
12 Cycle 792 612 314
13 Cycle Rickshaw 17 7 4
14 Animal Drawn Vehicles 0 1 2
15 Hand Cart 0 0 0
16 Total Non-Motarised Traffic 809 620 320
17 Total Traffic 13367 6425 8661
18 Total PCU 17322 6654 13456
4.3.4.2 Hourly Variation of Traffic
Generally peak flow occurs during 7 PM to 8 PM in evening at VC-1, 1 PM to 2 PM hours in afternoon at VC-2 and 12 noon to 1PM at VC-3.
4.3.4.3 Daily Variation of Traffic Volume
The daily variation of traffic with respect to ADT is generally not perceptible, with most of the daily volume being near to ADT volumes except on Saturday and Sunday.
4.3.4.4 Composition of Traffic
From the analysis it is found that Two Wheelers contributes to the major percentage, followed by Car/Jeep and then other commercial rates. The compositions of the vehicles at each location for the project are summarized in Table 4.8.
Table 4.8: Average Compositions of Vehicles at each Location
Sl. No. Vehicle Type
NH 47 NH 47 NH 47B
km-626/000 km-646/400 km-11/000
VC-1 VC-2 VC-3
1 Two-Wheeler 33.57% 41.01% 27.94%
2 Auto/Three-Wheeler 4.36% 6.08% 5.12%
3 Car-Jeep-Taxi 23.57% 22.06% 18.43%
4 Mini-Bus 2.39% 1.45% 3.01%
5 Bus 11.25% 10.33% 13.16%
6 LCV 8.25% 7.74% 10.13%
7 2-Axle 9.17% 1.58% 15.70%
8 3-Axle 1.22% 0.08% 2.01%
9 MAV 0.05% 0.01% 0.65%
10 Tractors 0.12% 0.03% 0.16%
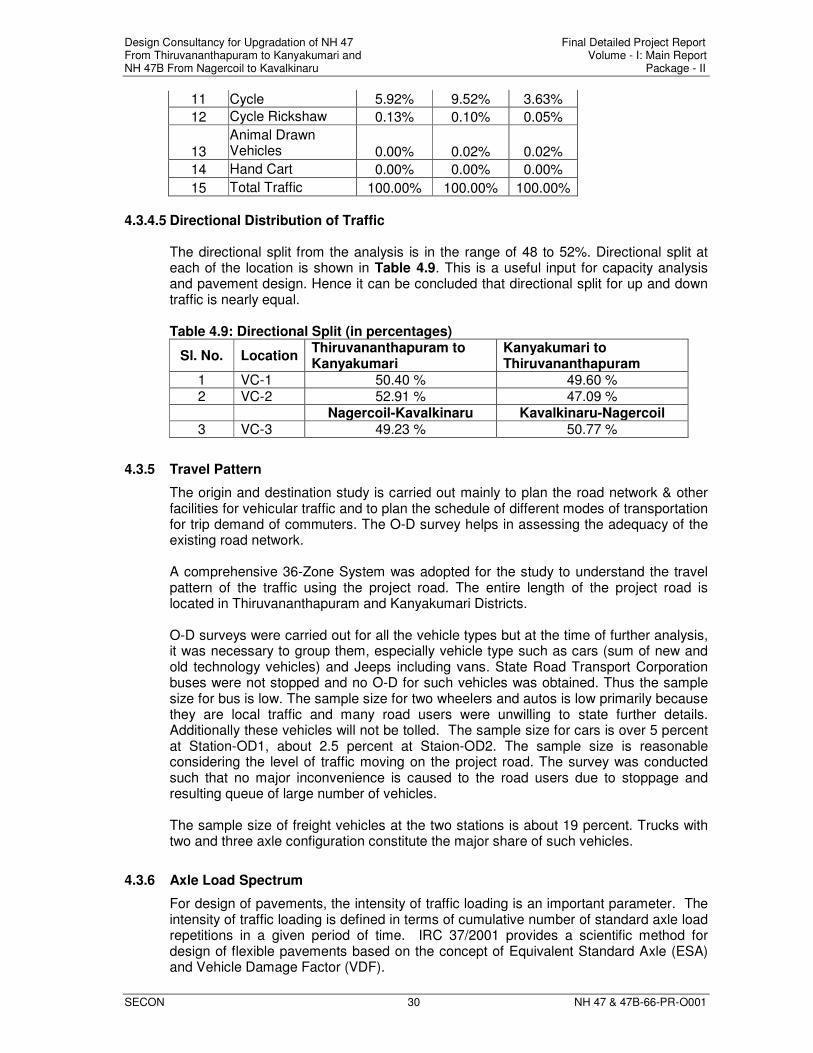
Design Consultancy for Upgradation of NH 47 Final Detailed Project Report From Thiruvananthapuram to Kanyakumari and Volume - I: Main Report NH 47B From Nagercoil to Kavalkinaru Package - II
SECON 30 NH 47 & 47B-66-PR-O001
11 Cycle 5.92% 9.52% 3.63%
12 Cycle Rickshaw 0.13% 0.10% 0.05%
13
Animal Drawn Vehicles 0.00% 0.02% 0.02%
14 Hand Cart 0.00% 0.00% 0.00%
15 Total Traffic 100.00% 100.00% 100.00% 4.3.4.5 Directional Distribution of Traffic
The directional split from the analysis is in the range of 48 to 52%. Directional split at each of the location is shown in Table 4.9. This is a useful input for capacity analysis and pavement design. Hence it can be concluded that directional split for up and down traffic is nearly equal. Table 4.9: Directional Split (in percentages)
Sl. No. Location Thiruvananthapuram to Kanyakumari
Kanyakumari to Thiruvananthapuram
1 VC-1 50.40 % 49.60 % 2 VC-2 52.91 % 47.09 % Nagercoil-Kavalkinaru Kavalkinaru-Nagercoil 3 VC-3 49.23 % 50.77 %
4.3.5 Travel Pattern
The origin and destination study is carried out mainly to plan the road network & other facilities for vehicular traffic and to plan the schedule of different modes of transportation for trip demand of commuters. The O-D survey helps in assessing the adequacy of the existing road network. A comprehensive 36-Zone System was adopted for the study to understand the travel pattern of the traffic using the project road. The entire length of the project road is located in Thiruvananthapuram and Kanyakumari Districts. O-D surveys were carried out for all the vehicle types but at the time of further analysis, it was necessary to group them, especially vehicle type such as cars (sum of new and old technology vehicles) and Jeeps including vans. State Road Transport Corporation buses were not stopped and no O-D for such vehicles was obtained. Thus the sample size for bus is low. The sample size for two wheelers and autos is low primarily because they are local traffic and many road users were unwilling to state further details. Additionally these vehicles will not be tolled. The sample size for cars is over 5 percent at Station-OD1, about 2.5 percent at Staion-OD2. The sample size is reasonable considering the level of traffic moving on the project road. The survey was conducted such that no major inconvenience is caused to the road users due to stoppage and resulting queue of large number of vehicles. The sample size of freight vehicles at the two stations is about 19 percent. Trucks with two and three axle configuration constitute the major share of such vehicles.
4.3.6 Axle Load Spectrum
For design of pavements, the intensity of traffic loading is an important parameter. The intensity of traffic loading is defined in terms of cumulative number of standard axle load repetitions in a given period of time. IRC 37/2001 provides a scientific method for design of flexible pavements based on the concept of Equivalent Standard Axle (ESA) and Vehicle Damage Factor (VDF).
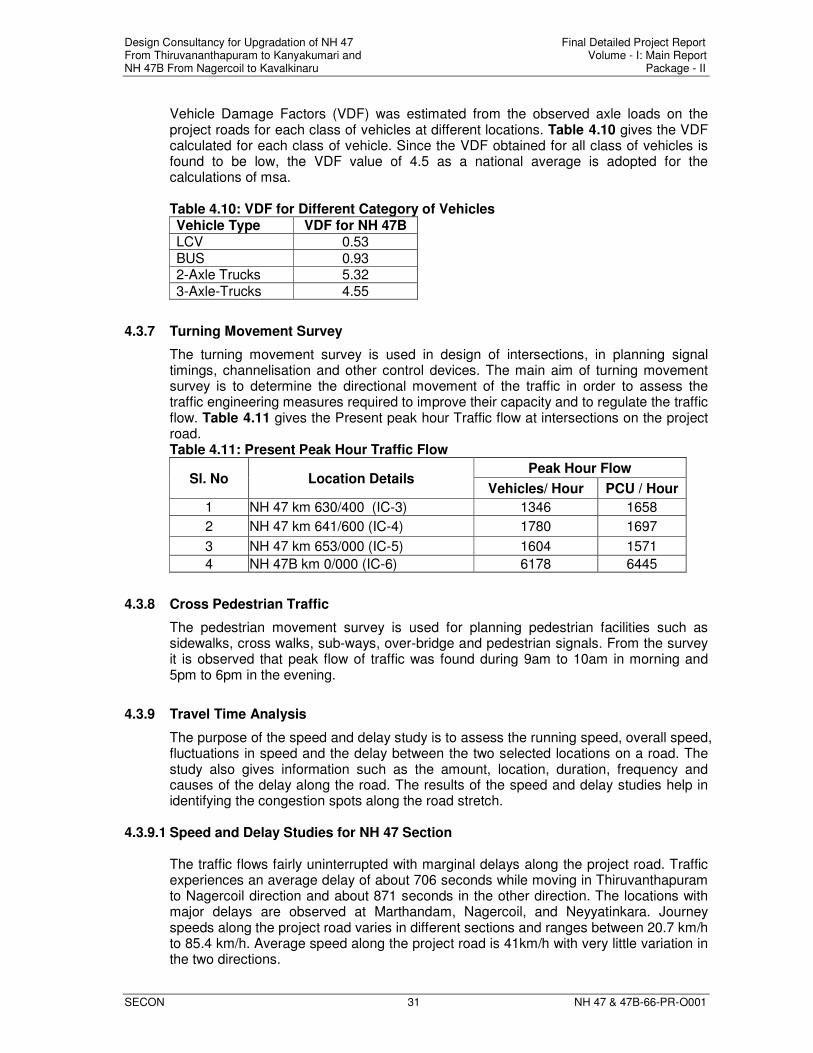
Design Consultancy for Upgradation of NH 47 Final Detailed Project Report From Thiruvananthapuram to Kanyakumari and Volume - I: Main Report NH 47B From Nagercoil to Kavalkinaru Package - II
SECON 31 NH 47 & 47B-66-PR-O001
Vehicle Damage Factors (VDF) was estimated from the observed axle loads on the project roads for each class of vehicles at different locations. Table 4.10 gives the VDF calculated for each class of vehicle. Since the VDF obtained for all class of vehicles is found to be low, the VDF value of 4.5 as a national average is adopted for the calculations of msa.
Table 4.10: VDF for Different Category of Vehicles Vehicle Type VDF for NH 47B LCV 0.53
BUS 0.93 2-Axle Trucks 5.32
3-Axle-Trucks 4.55
4.3.7 Turning Movement Survey
The turning movement survey is used in design of intersections, in planning signal timings, channelisation and other control devices. The main aim of turning movement survey is to determine the directional movement of the traffic in order to assess the traffic engineering measures required to improve their capacity and to regulate the traffic flow. Table 4.11 gives the Present peak hour Traffic flow at intersections on the project road. Table 4.11: Present Peak Hour Traffic Flow
Sl. No Location Details Peak Hour Flow
Vehicles/ Hour PCU / Hour
1 NH 47 km 630/400 (IC-3) 1346 1658
2 NH 47 km 641/600 (IC-4) 1780 1697
3 NH 47 km 653/000 (IC-5) 1604 1571
4 NH 47B km 0/000 (IC-6) 6178 6445
4.3.8 Cross Pedestrian Traffic
The pedestrian movement survey is used for planning pedestrian facilities such as sidewalks, cross walks, sub-ways, over-bridge and pedestrian signals. From the survey it is observed that peak flow of traffic was found during 9am to 10am in morning and 5pm to 6pm in the evening.
4.3.9 Travel Time Analysis
The purpose of the speed and delay study is to assess the running speed, overall speed, fluctuations in speed and the delay between the two selected locations on a road. The study also gives information such as the amount, location, duration, frequency and causes of the delay along the road. The results of the speed and delay studies help in identifying the congestion spots along the road stretch.
4.3.9.1 Speed and Delay Studies for NH 47 Section
The traffic flows fairly uninterrupted with marginal delays along the project road. Traffic experiences an average delay of about 706 seconds while moving in Thiruvanthapuram to Nagercoil direction and about 871 seconds in the other direction. The locations with major delays are observed at Marthandam, Nagercoil, and Neyyatinkara. Journey speeds along the project road varies in different sections and ranges between 20.7 km/h to 85.4 km/h. Average speed along the project road is 41km/h with very little variation in the two directions.
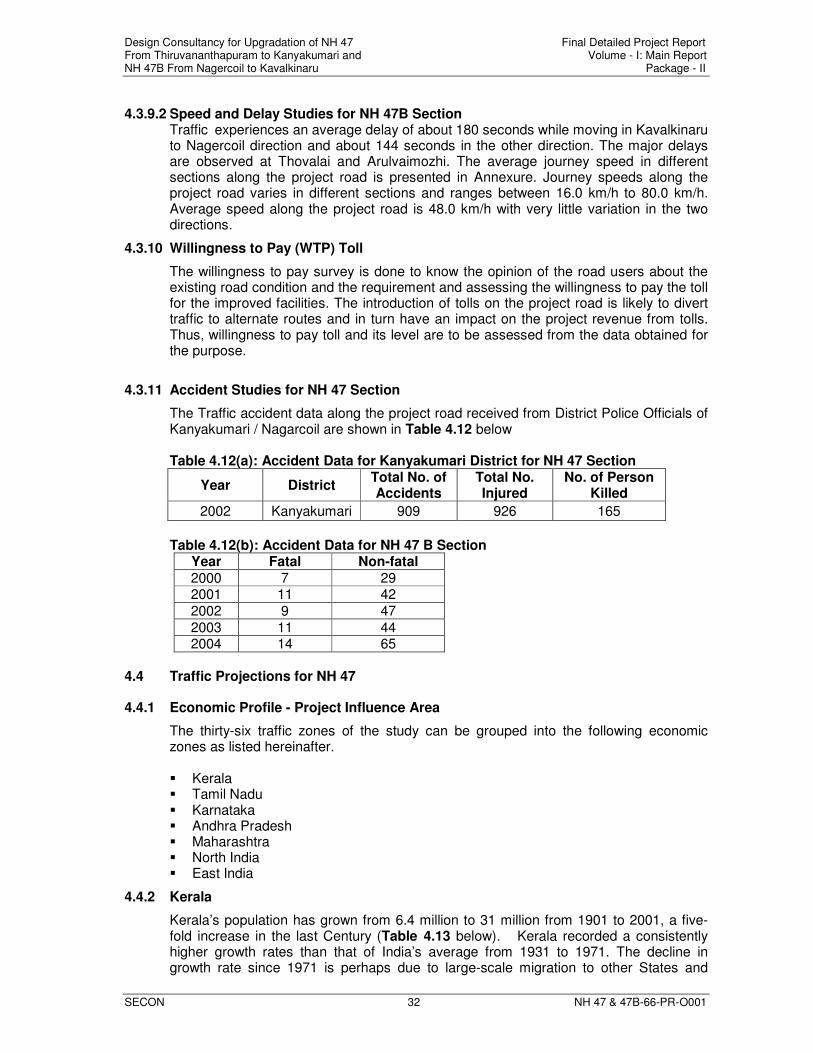
Design Consultancy for Upgradation of NH 47 Final Detailed Project Report From Thiruvananthapuram to Kanyakumari and Volume - I: Main Report NH 47B From Nagercoil to Kavalkinaru Package - II
SECON 32 NH 47 & 47B-66-PR-O001
4.3.9.2 Speed and Delay Studies for NH 47B Section
Traffic experiences an average delay of about 180 seconds while moving in Kavalkinaru to Nagercoil direction and about 144 seconds in the other direction. The major delays are observed at Thovalai and Arulvaimozhi. The average journey speed in different sections along the project road is presented in Annexure. Journey speeds along the project road varies in different sections and ranges between 16.0 km/h to 80.0 km/h. Average speed along the project road is 48.0 km/h with very little variation in the two directions.
4.3.10 Willingness to Pay (WTP) Toll
The willingness to pay survey is done to know the opinion of the road users about the existing road condition and the requirement and assessing the willingness to pay the toll for the improved facilities. The introduction of tolls on the project road is likely to divert traffic to alternate routes and in turn have an impact on the project revenue from tolls. Thus, willingness to pay toll and its level are to be assessed from the data obtained for the purpose.
4.3.11 Accident Studies for NH 47 Section
The Traffic accident data along the project road received from District Police Officials of Kanyakumari / Nagarcoil are shown in Table 4.12 below
Table 4.12(a): Accident Data for Kanyakumari District for NH 47 Section
Year District Total No. of Accidents
Total No. Injured
No. of Person Killed
2002 Kanyakumari 909 926 165
Table 4.12(b): Accident Data for NH 47 B Section
Year Fatal Non-fatal
2000 7 29 2001 11 42
2002 9 47
2003 11 44 2004 14 65
4.4 Traffic Projections for NH 47
4.4.1 Economic Profile - Project Influence Area
The thirty-six traffic zones of the study can be grouped into the following economic zones as listed hereinafter.
� Kerala � Tamil Nadu � Karnataka � Andhra Pradesh � Maharashtra � North India � East India
4.4.2 Kerala
Kerala’s population has grown from 6.4 million to 31 million from 1901 to 2001, a five-fold increase in the last Century (Table 4.13 below). Kerala recorded a consistently higher growth rates than that of India’s average from 1931 to 1971. The decline in growth rate since 1971 is perhaps due to large-scale migration to other States and
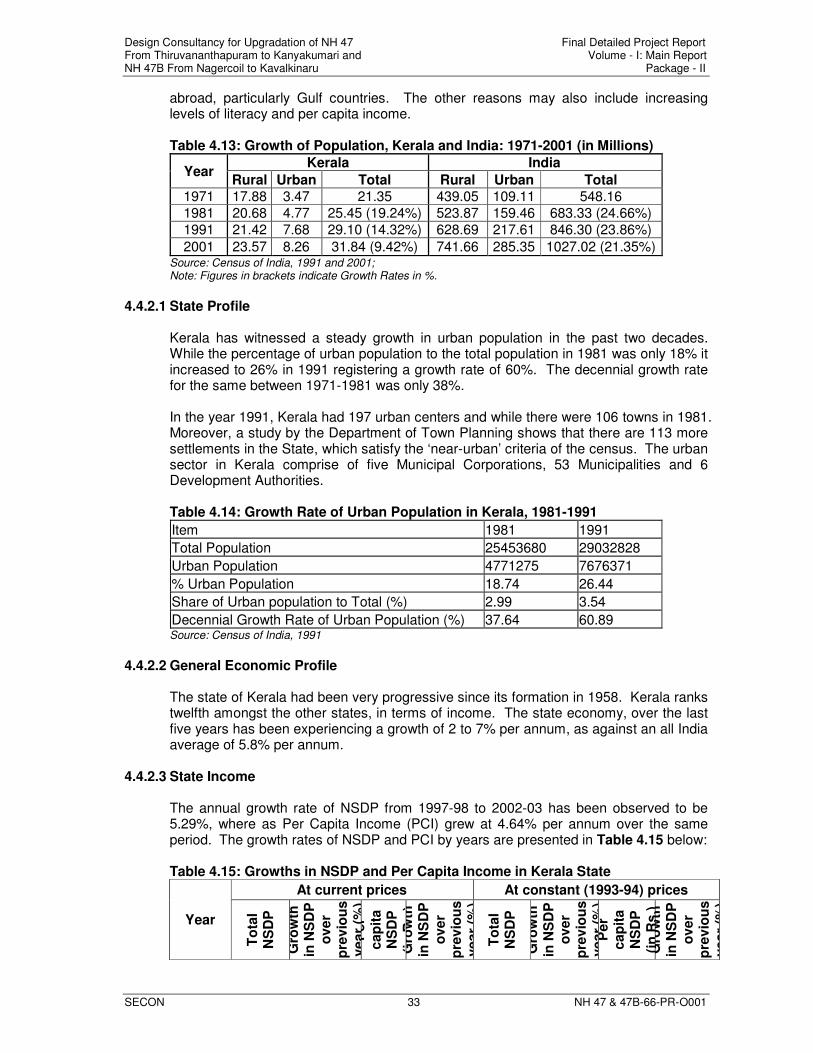
Design Consultancy for Upgradation of NH 47 Final Detailed Project Report From Thiruvananthapuram to Kanyakumari and Volume - I: Main Report NH 47B From Nagercoil to Kavalkinaru Package - II
SECON 33 NH 47 & 47B-66-PR-O001
abroad, particularly Gulf countries. The other reasons may also include increasing levels of literacy and per capita income.
Table 4.13: Growth of Population, Kerala and India: 1971-2001 (in Millions)
Year Kerala India
Rural Urban Total Rural Urban Total
1971 17.88 3.47 21.35 439.05 109.11 548.16
1981 20.68 4.77 25.45 (19.24%) 523.87 159.46 683.33 (24.66%)
1991 21.42 7.68 29.10 (14.32%) 628.69 217.61 846.30 (23.86%)
2001 23.57 8.26 31.84 (9.42%) 741.66 285.35 1027.02 (21.35%) Source: Census of India, 1991 and 2001; Note: Figures in brackets indicate Growth Rates in %.
4.4.2.1 State Profile
Kerala has witnessed a steady growth in urban population in the past two decades. While the percentage of urban population to the total population in 1981 was only 18% it increased to 26% in 1991 registering a growth rate of 60%. The decennial growth rate for the same between 1971-1981 was only 38%.
In the year 1991, Kerala had 197 urban centers and while there were 106 towns in 1981. Moreover, a study by the Department of Town Planning shows that there are 113 more settlements in the State, which satisfy the ‘near-urban’ criteria of the census. The urban sector in Kerala comprise of five Municipal Corporations, 53 Municipalities and 6 Development Authorities.
Table 4.14: Growth Rate of Urban Population in Kerala, 1981-1991
Item 1981 1991
Total Population 25453680 29032828
Urban Population 4771275 7676371
% Urban Population 18.74 26.44
Share of Urban population to Total (%) 2.99 3.54
Decennial Growth Rate of Urban Population (%) 37.64 60.89 Source: Census of India, 1991
4.4.2.2 General Economic Profile
The state of Kerala had been very progressive since its formation in 1958. Kerala ranks twelfth amongst the other states, in terms of income. The state economy, over the last five years has been experiencing a growth of 2 to 7% per annum, as against an all India average of 5.8% per annum.
4.4.2.3 State Income The annual growth rate of NSDP from 1997-98 to 2002-03 has been observed to be 5.29%, where as Per Capita Income (PCI) grew at 4.64% per annum over the same period. The growth rates of NSDP and PCI by years are presented in Table 4.15 below:
Table 4.15: Growths in NSDP and Per Capita Income in Kerala State
Year
At current prices At constant (1993-94) prices
To
tal
NS
DP
Gro
wth
in
NS
DP
o
ver
pre
vio
us
year
(%)
Per
cap
ita
NS
DP
(in
Rs.)
G
row
th
in N
SD
P
over
pre
vio
us
year
(%)
To
tal
NS
DP
Gro
wth
in
NS
DP
o
ver
pre
vio
us
year
(%)
Per
cap
ita
NS
DP
(in
Rs.)
G
row
th
in N
SD
P
over
pre
vio
us
year
(%)
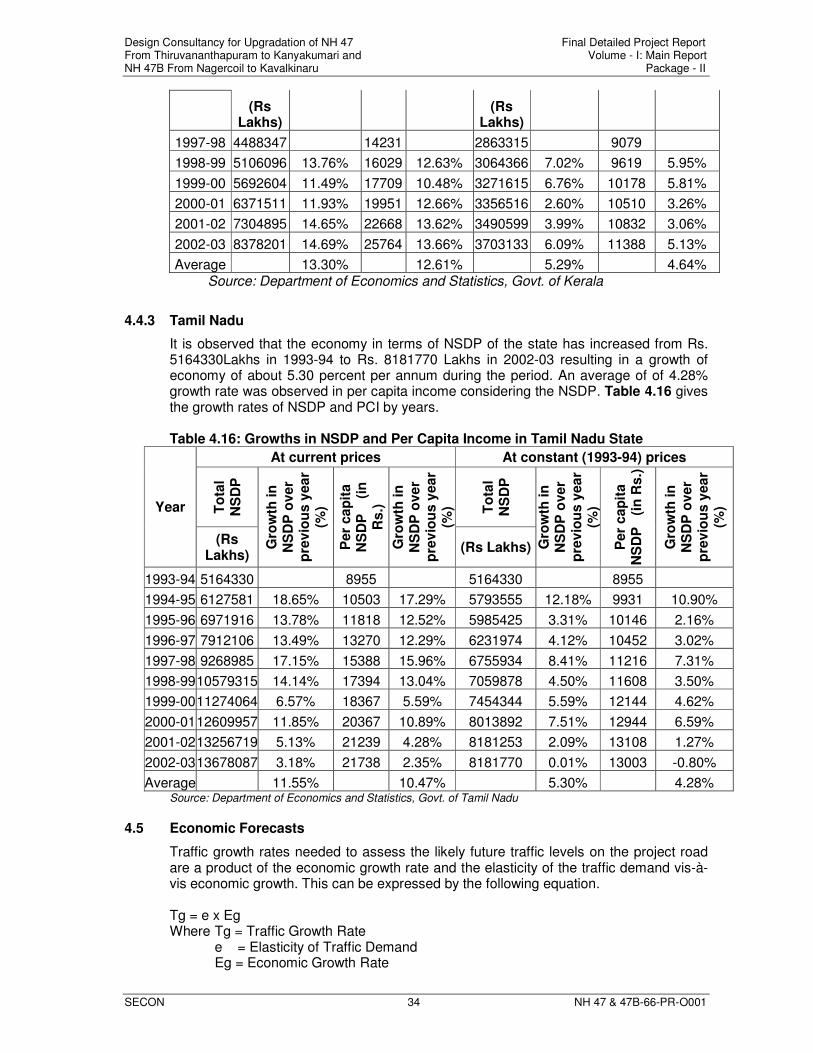
Design Consultancy for Upgradation of NH 47 Final Detailed Project Report From Thiruvananthapuram to Kanyakumari and Volume - I: Main Report NH 47B From Nagercoil to Kavalkinaru Package - II
SECON 34 NH 47 & 47B-66-PR-O001
(Rs Lakhs)
(Rs Lakhs)
1997-98 4488347 14231 2863315 9079
1998-99 5106096 13.76% 16029 12.63% 3064366 7.02% 9619 5.95%
1999-00 5692604 11.49% 17709 10.48% 3271615 6.76% 10178 5.81%
2000-01 6371511 11.93% 19951 12.66% 3356516 2.60% 10510 3.26%
2001-02 7304895 14.65% 22668 13.62% 3490599 3.99% 10832 3.06%
2002-03 8378201 14.69% 25764 13.66% 3703133 6.09% 11388 5.13%
Average 13.30% 12.61% 5.29% 4.64% Source: Department of Economics and Statistics, Govt. of Kerala
4.4.3 Tamil Nadu
It is observed that the economy in terms of NSDP of the state has increased from Rs. 5164330Lakhs in 1993-94 to Rs. 8181770 Lakhs in 2002-03 resulting in a growth of economy of about 5.30 percent per annum during the period. An average of of 4.28% growth rate was observed in per capita income considering the NSDP. Table 4.16 gives the growth rates of NSDP and PCI by years.
Table 4.16: Growths in NSDP and Per Capita Income in Tamil Nadu State
Year
At current prices At constant (1993-94) prices
To
tal
NS
DP
Gro
wth
in
N
SD
P o
ver
pre
vio
us y
ear
(%)
Per
cap
ita
NS
DP
(i
n
Rs.)
Gro
wth
in
N
SD
P o
ver
pre
vio
us y
ear
(%) To
tal
NS
DP
Gro
wth
in
N
SD
P o
ver
pre
vio
us y
ear
(%)
Per
cap
ita
NS
DP
(
in R
s.)
Gro
wth
in
N
SD
P o
ver
pre
vio
us y
ear
(%)
(Rs Lakhs)
(Rs Lakhs)
1993-94 5164330 8955 5164330 8955
1994-95 6127581 18.65% 10503 17.29% 5793555 12.18% 9931 10.90%
1995-96 6971916 13.78% 11818 12.52% 5985425 3.31% 10146 2.16%
1996-97 7912106 13.49% 13270 12.29% 6231974 4.12% 10452 3.02%
1997-98 9268985 17.15% 15388 15.96% 6755934 8.41% 11216 7.31%
1998-99 10579315 14.14% 17394 13.04% 7059878 4.50% 11608 3.50%
1999-00 11274064 6.57% 18367 5.59% 7454344 5.59% 12144 4.62%
2000-01 12609957 11.85% 20367 10.89% 8013892 7.51% 12944 6.59%
2001-02 13256719 5.13% 21239 4.28% 8181253 2.09% 13108 1.27%
2002-03 13678087 3.18% 21738 2.35% 8181770 0.01% 13003 -0.80%
Average 11.55% 10.47% 5.30% 4.28% Source: Department of Economics and Statistics, Govt. of Tamil Nadu
4.5 Economic Forecasts
Traffic growth rates needed to assess the likely future traffic levels on the project road are a product of the economic growth rate and the elasticity of the traffic demand vis-à-vis economic growth. This can be expressed by the following equation.
Tg = e x Eg Where Tg = Traffic Growth Rate e = Elasticity of Traffic Demand Eg = Economic Growth Rate
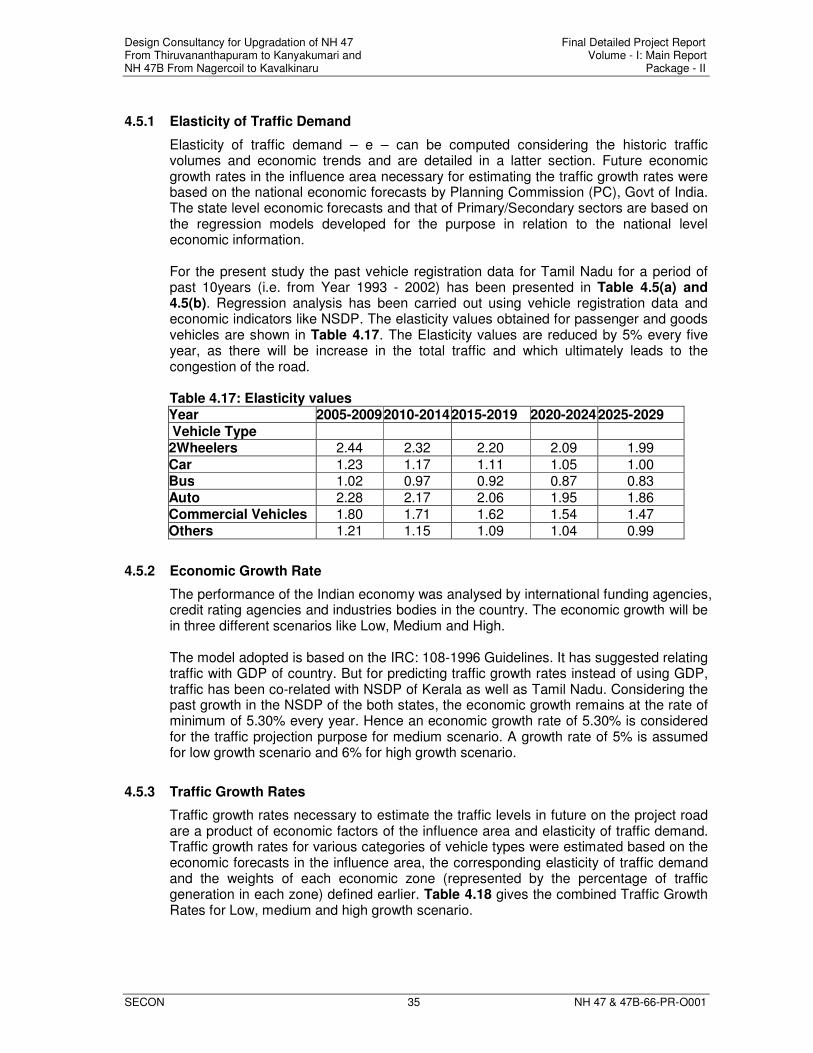
Design Consultancy for Upgradation of NH 47 Final Detailed Project Report From Thiruvananthapuram to Kanyakumari and Volume - I: Main Report NH 47B From Nagercoil to Kavalkinaru Package - II
SECON 35 NH 47 & 47B-66-PR-O001
4.5.1 Elasticity of Traffic Demand
Elasticity of traffic demand – e – can be computed considering the historic traffic volumes and economic trends and are detailed in a latter section. Future economic growth rates in the influence area necessary for estimating the traffic growth rates were based on the national economic forecasts by Planning Commission (PC), Govt of India. The state level economic forecasts and that of Primary/Secondary sectors are based on the regression models developed for the purpose in relation to the national level economic information.
For the present study the past vehicle registration data for Tamil Nadu for a period of past 10years (i.e. from Year 1993 - 2002) has been presented in Table 4.5(a) and 4.5(b). Regression analysis has been carried out using vehicle registration data and economic indicators like NSDP. The elasticity values obtained for passenger and goods vehicles are shown in Table 4.17. The Elasticity values are reduced by 5% every five year, as there will be increase in the total traffic and which ultimately leads to the congestion of the road.
Table 4.17: Elasticity values Year 2005-2009 2010-2014 2015-2019 2020-2024 2025-2029
Vehicle Type 2Wheelers 2.44 2.32 2.20 2.09 1.99
Car 1.23 1.17 1.11 1.05 1.00 Bus 1.02 0.97 0.92 0.87 0.83
Auto 2.28 2.17 2.06 1.95 1.86
Commercial Vehicles 1.80 1.71 1.62 1.54 1.47
Others 1.21 1.15 1.09 1.04 0.99
4.5.2 Economic Growth Rate
The performance of the Indian economy was analysed by international funding agencies, credit rating agencies and industries bodies in the country. The economic growth will be in three different scenarios like Low, Medium and High.
The model adopted is based on the IRC: 108-1996 Guidelines. It has suggested relating traffic with GDP of country. But for predicting traffic growth rates instead of using GDP, traffic has been co-related with NSDP of Kerala as well as Tamil Nadu. Considering the past growth in the NSDP of the both states, the economic growth remains at the rate of minimum of 5.30% every year. Hence an economic growth rate of 5.30% is considered for the traffic projection purpose for medium scenario. A growth rate of 5% is assumed for low growth scenario and 6% for high growth scenario.
4.5.3 Traffic Growth Rates
Traffic growth rates necessary to estimate the traffic levels in future on the project road are a product of economic factors of the influence area and elasticity of traffic demand. Traffic growth rates for various categories of vehicle types were estimated based on the economic forecasts in the influence area, the corresponding elasticity of traffic demand and the weights of each economic zone (represented by the percentage of traffic generation in each zone) defined earlier. Table 4.18 gives the combined Traffic Growth Rates for Low, medium and high growth scenario.
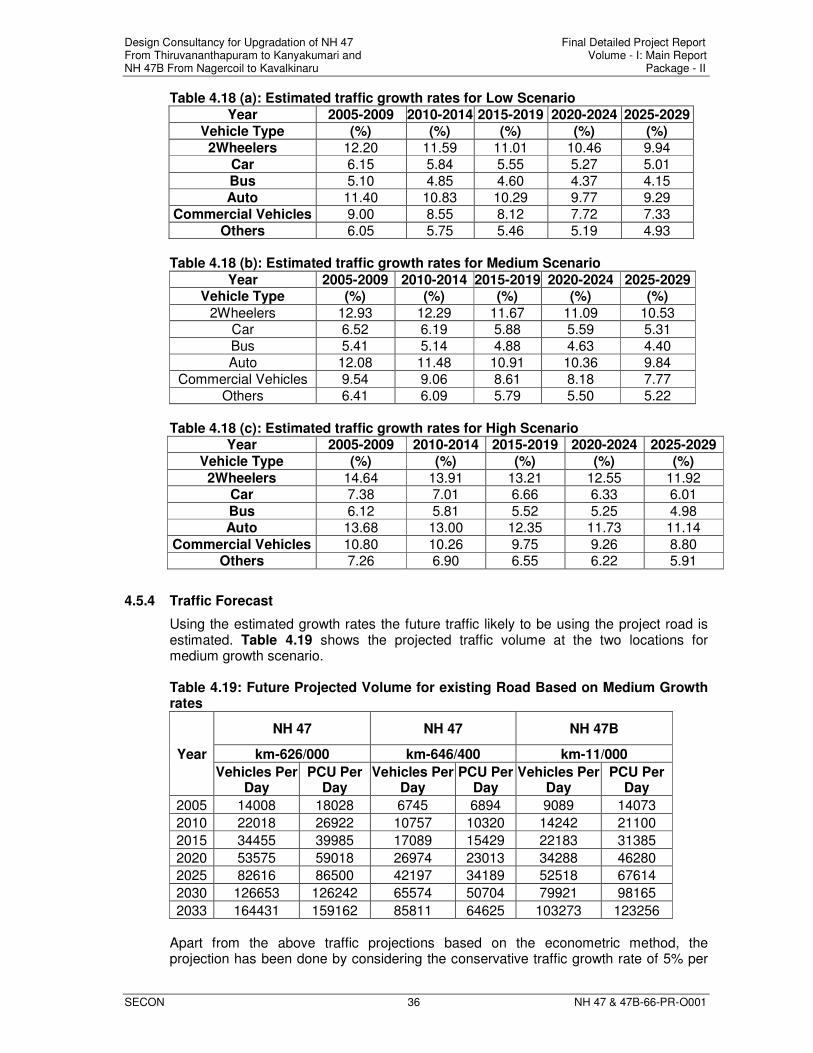
Design Consultancy for Upgradation of NH 47 Final Detailed Project Report From Thiruvananthapuram to Kanyakumari and Volume - I: Main Report NH 47B From Nagercoil to Kavalkinaru Package - II
SECON 36 NH 47 & 47B-66-PR-O001
Table 4.18 (a): Estimated traffic growth rates for Low Scenario
Year 2005-2009 2010-2014 2015-2019 2020-2024 2025-2029
Vehicle Type (%) (%) (%) (%) (%)
2Wheelers 12.20 11.59 11.01 10.46 9.94
Car 6.15 5.84 5.55 5.27 5.01
Bus 5.10 4.85 4.60 4.37 4.15
Auto 11.40 10.83 10.29 9.77 9.29
Commercial Vehicles 9.00 8.55 8.12 7.72 7.33
Others 6.05 5.75 5.46 5.19 4.93
Table 4.18 (b): Estimated traffic growth rates for Medium Scenario
Year 2005-2009 2010-2014 2015-2019 2020-2024 2025-2029 Vehicle Type (%) (%) (%) (%) (%)
2Wheelers 12.93 12.29 11.67 11.09 10.53 Car 6.52 6.19 5.88 5.59 5.31
Bus 5.41 5.14 4.88 4.63 4.40
Auto 12.08 11.48 10.91 10.36 9.84
Commercial Vehicles 9.54 9.06 8.61 8.18 7.77
Others 6.41 6.09 5.79 5.50 5.22
Table 4.18 (c): Estimated traffic growth rates for High Scenario Year 2005-2009 2010-2014 2015-2019 2020-2024 2025-2029
Vehicle Type (%) (%) (%) (%) (%)
2Wheelers 14.64 13.91 13.21 12.55 11.92 Car 7.38 7.01 6.66 6.33 6.01
Bus 6.12 5.81 5.52 5.25 4.98 Auto 13.68 13.00 12.35 11.73 11.14
Commercial Vehicles 10.80 10.26 9.75 9.26 8.80 Others 7.26 6.90 6.55 6.22 5.91
4.5.4 Traffic Forecast
Using the estimated growth rates the future traffic likely to be using the project road is estimated. Table 4.19 shows the projected traffic volume at the two locations for medium growth scenario.
Table 4.19: Future Projected Volume for existing Road Based on Medium Growth rates
Year
NH 47 NH 47 NH 47B
km-626/000 km-646/400 km-11/000
Vehicles Per Day
PCU Per Day
Vehicles Per Day
PCU Per Day
Vehicles Per Day
PCU Per Day
2005 14008 18028 6745 6894 9089 14073
2010 22018 26922 10757 10320 14242 21100
2015 34455 39985 17089 15429 22183 31385
2020 53575 59018 26974 23013 34288 46280
2025 82616 86500 42197 34189 52518 67614
2030 126653 126242 65574 50704 79921 98165
2033 164431 159162 85811 64625 103273 123256
Apart from the above traffic projections based on the econometric method, the projection has been done by considering the conservative traffic growth rate of 5% per
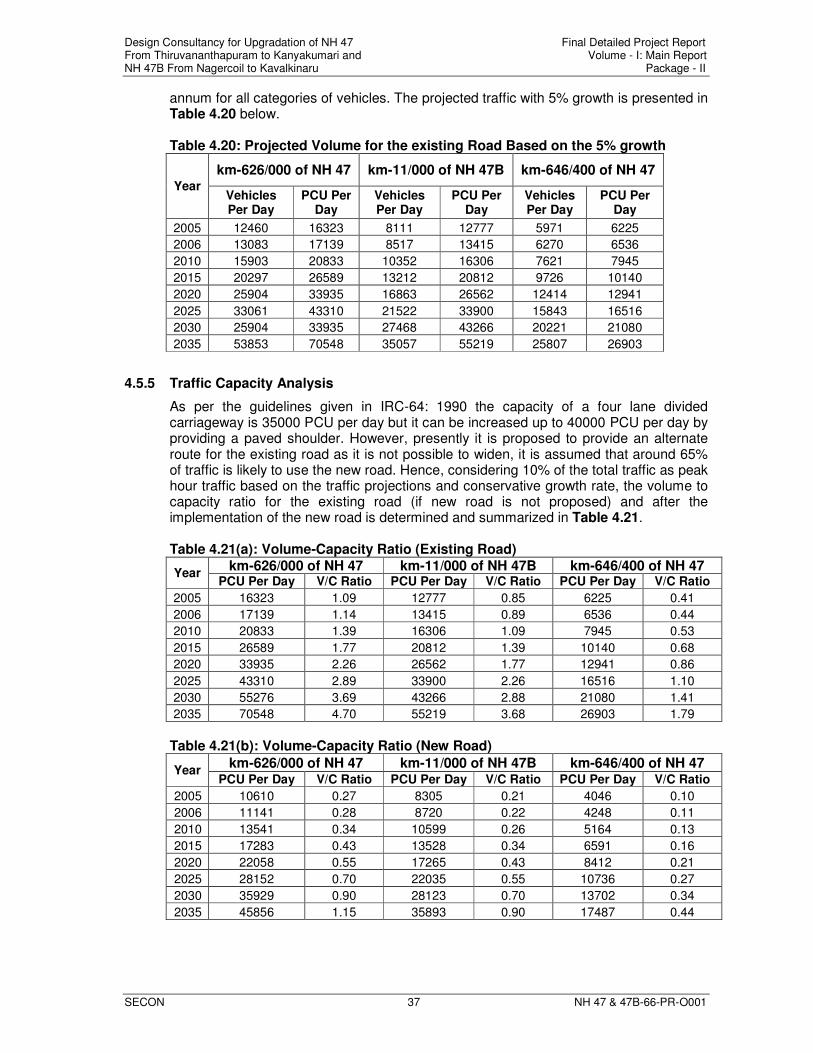
Design Consultancy for Upgradation of NH 47 Final Detailed Project Report From Thiruvananthapuram to Kanyakumari and Volume - I: Main Report NH 47B From Nagercoil to Kavalkinaru Package - II
SECON 37 NH 47 & 47B-66-PR-O001
annum for all categories of vehicles. The projected traffic with 5% growth is presented in Table 4.20 below. Table 4.20: Projected Volume for the existing Road Based on the 5% growth
Year
km-626/000 of NH 47 km-11/000 of NH 47B km-646/400 of NH 47
Vehicles Per Day
PCU Per Day
Vehicles Per Day
PCU Per Day
Vehicles Per Day
PCU Per Day
2005 12460 16323 8111 12777 5971 6225
2006 13083 17139 8517 13415 6270 6536
2010 15903 20833 10352 16306 7621 7945
2015 20297 26589 13212 20812 9726 10140
2020 25904 33935 16863 26562 12414 12941
2025 33061 43310 21522 33900 15843 16516
2030 25904 33935 27468 43266 20221 21080
2035 53853 70548 35057 55219 25807 26903
4.5.5 Traffic Capacity Analysis
As per the guidelines given in IRC-64: 1990 the capacity of a four lane divided carriageway is 35000 PCU per day but it can be increased up to 40000 PCU per day by providing a paved shoulder. However, presently it is proposed to provide an alternate route for the existing road as it is not possible to widen, it is assumed that around 65% of traffic is likely to use the new road. Hence, considering 10% of the total traffic as peak hour traffic based on the traffic projections and conservative growth rate, the volume to capacity ratio for the existing road (if new road is not proposed) and after the implementation of the new road is determined and summarized in Table 4.21.
Table 4.21(a): Volume-Capacity Ratio (Existing Road)
Year km-626/000 of NH 47 km-11/000 of NH 47B km-646/400 of NH 47
PCU Per Day V/C Ratio PCU Per Day V/C Ratio PCU Per Day V/C Ratio
2005 16323 1.09 12777 0.85 6225 0.41
2006 17139 1.14 13415 0.89 6536 0.44
2010 20833 1.39 16306 1.09 7945 0.53
2015 26589 1.77 20812 1.39 10140 0.68
2020 33935 2.26 26562 1.77 12941 0.86
2025 43310 2.89 33900 2.26 16516 1.10
2030 55276 3.69 43266 2.88 21080 1.41
2035 70548 4.70 55219 3.68 26903 1.79
Table 4.21(b): Volume-Capacity Ratio (New Road)
Year km-626/000 of NH 47 km-11/000 of NH 47B km-646/400 of NH 47
PCU Per Day V/C Ratio PCU Per Day V/C Ratio PCU Per Day V/C Ratio
2005 10610 0.27 8305 0.21 4046 0.10
2006 11141 0.28 8720 0.22 4248 0.11
2010 13541 0.34 10599 0.26 5164 0.13
2015 17283 0.43 13528 0.34 6591 0.16
2020 22058 0.55 17265 0.43 8412 0.21
2025 28152 0.70 22035 0.55 10736 0.27
2030 35929 0.90 28123 0.70 13702 0.34
2035 45856 1.15 35893 0.90 17487 0.44
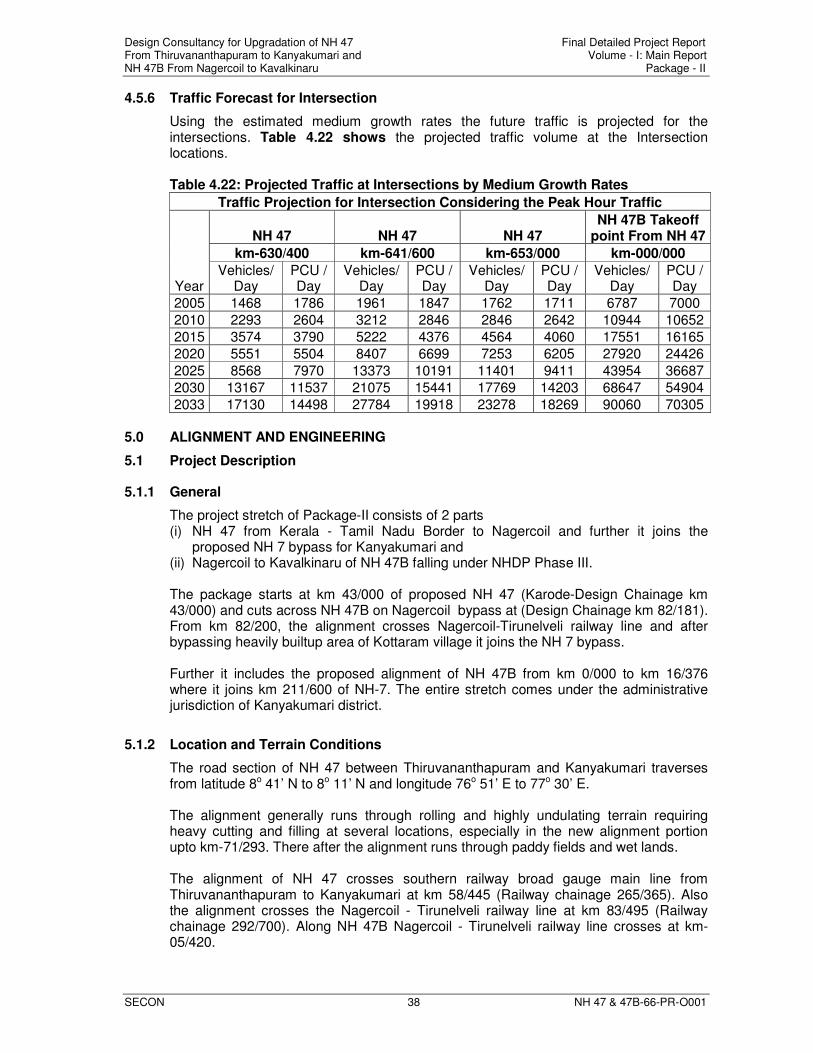
Design Consultancy for Upgradation of NH 47 Final Detailed Project Report From Thiruvananthapuram to Kanyakumari and Volume - I: Main Report NH 47B From Nagercoil to Kavalkinaru Package - II
SECON 38 NH 47 & 47B-66-PR-O001
4.5.6 Traffic Forecast for Intersection
Using the estimated medium growth rates the future traffic is projected for the intersections. Table 4.22 shows the projected traffic volume at the Intersection locations.
Table 4.22: Projected Traffic at Intersections by Medium Growth Rates
Traffic Projection for Intersection Considering the Peak Hour Traffic
Year
NH 47 NH 47 NH 47 NH 47B Takeoff
point From NH 47
km-630/400 km-641/600 km-653/000 km-000/000
Vehicles/ Day
PCU / Day
Vehicles/ Day
PCU / Day
Vehicles/ Day
PCU / Day
Vehicles/ Day
PCU / Day
2005 1468 1786 1961 1847 1762 1711 6787 7000
2010 2293 2604 3212 2846 2846 2642 10944 10652
2015 3574 3790 5222 4376 4564 4060 17551 16165
2020 5551 5504 8407 6699 7253 6205 27920 24426
2025 8568 7970 13373 10191 11401 9411 43954 36687
2030 13167 11537 21075 15441 17769 14203 68647 54904
2033 17130 14498 27784 19918 23278 18269 90060 70305 5.0 ALIGNMENT AND ENGINEERING
5.1 Project Description
5.1.1 General
The project stretch of Package-II consists of 2 parts (i) NH 47 from Kerala - Tamil Nadu Border to Nagercoil and further it joins the
proposed NH 7 bypass for Kanyakumari and (ii) Nagercoil to Kavalkinaru of NH 47B falling under NHDP Phase III. The package starts at km 43/000 of proposed NH 47 (Karode-Design Chainage km 43/000) and cuts across NH 47B on Nagercoil bypass at (Design Chainage km 82/181). From km 82/200, the alignment crosses Nagercoil-Tirunelveli railway line and after bypassing heavily builtup area of Kottaram village it joins the NH 7 bypass. Further it includes the proposed alignment of NH 47B from km 0/000 to km 16/376 where it joins km 211/600 of NH-7. The entire stretch comes under the administrative jurisdiction of Kanyakumari district.
5.1.2 Location and Terrain Conditions
The road section of NH 47 between Thiruvananthapuram and Kanyakumari traverses from latitude 8o 41’ N to 8o 11’ N and longitude 76o 51’ E to 77o 30’ E. The alignment generally runs through rolling and highly undulating terrain requiring heavy cutting and filling at several locations, especially in the new alignment portion upto km-71/293. There after the alignment runs through paddy fields and wet lands. The alignment of NH 47 crosses southern railway broad gauge main line from Thiruvananthapuram to Kanyakumari at km 58/445 (Railway chainage 265/365). Also the alignment crosses the Nagercoil - Tirunelveli railway line at km 83/495 (Railway chainage 292/700). Along NH 47B Nagercoil - Tirunelveli railway line crosses at km-05/420.
Design Consultancy for Upgradation of NH 47 Final Detailed Project Report From Thiruvananthapuram to Kanyakumari and Volume - I: Main Report NH 47B From Nagercoil to Kavalkinaru Package - II
SECON 39 NH 47 & 47B-66-PR-O001
5.2 Proposed Alignment
5.2.1 Proposed Alignment for NH 47 Section
km 43/000 to km 49/000 The alignment after crossing the Kerala border at km 43/000 at Manjamkuzhi proceeds through areas of Adakkakuzhi, Pirakode, Kuluvilai and finally crosses Tamraparani river at km 48/183. The alignment is taken through less built up areas and through low contour avoiding high cutting. The alignment cuts some of the local roads and it passes mainly through rubber estates and paddy fields. km 49/000 to km 58/450 The alignment passes through Mayapuram, Tamarakulam, Kappukkadu, and Mulamkuzhi villages through banana plantations, coconut gardens and rubber plantations. The alignment is taken through low contour avoiding hill cutting, but it cuts several local roads which is unavoidable. Beyond km 56/000 the alignment passes near Palliyadi and crosses railway line at km 58/445 (Railway chainage 265/365). At the proposed ROB location the railway line passes through cutting avoiding very high embankment for approach. km 58/450 to km 65/000 After crossing Thiruvananthapuram – Kanyakumari railway line at Palliyadi, the alignment runs through villages of Vadavila, Pukkadai, Kozhiporuvila and Paruthikattuvilai and through coconut gardens, rubber and banana plantations. The alignment cuts Kozhiporuvila-Pukkadai road and Eranil branch canal and passes through residential areas and Pandaravilai village. It also cuts a tank and Thiruvankode - Milady road. km 65/000 to km 71/293 The alignment passes through banana plantation and cuts Aluvarcoil – Manjanuvila road connecting existing NH 47 at km 620 at Thackalai. Then it crosses river Valliyar at km 66/860 and runs through less built up areas of Pandaravilai, Puchikad and cuts Villukuri canal and joins the existing NH 47 at km 626/187. The major length of the alignment is generally passing through banana and coconut plantations. km 71/150 to km 72/080 (Old NH : km 626/187 to 627/000) After joining the existing NH, the alignment follows the existing NH up to km 72/080 and then deviates to left before Chungankadai village. km 72/080 to km 82/181 The alignment runs through paddy fields and foothills of Chungankadai, after the alignment crosses Puthery – Vadaserry road. Further it crosses Palayar River (km 79/800) and Teraikkalpudur road and joins NH 47 B at km 82/181 at Ozhukinsseri. km 82/181 to km 88/800 After crossing NH 47B the alignment of proposed NH 47 goes through paddy fields and crosses Nagercoil – Tirunelveli railway line at km 83/495 and runs through Karuppukottai, Therur villages. This portion of alignment runs north of Nagercoil and Suchindram and joins NH 47, at km 88/800 (km 642/800) near Manavila junction.
Design Consultancy for Upgradation of NH 47 Final Detailed Project Report From Thiruvananthapuram to Kanyakumari and Volume - I: Main Report NH 47B From Nagercoil to Kavalkinaru Package - II
SECON 40 NH 47 & 47B-66-PR-O001
km 88/800 to 92/100 (Old NH: km 642/800 to 646/238) It is proposed to widen the existing highway in this stretch on right side as there is a canal, buildings and shops on left side and the alignment deviates from NH at km 92/100. km 92/100 to km 96/714 From km 92/100 the alignment deviates towards the south bypassing heavily built up Kottaram village and meets at km 231/653 of NH 7 Kanyakumari Bypass terminating the NH 47 chainage at km 96/714. The alignment generally runs through paddy fields. km 651/600 to 653/600 (existing NH 47) From km 651/600 to km 653/000, it is proposed to retain the existing two lane as it is. Since the Bypass has already been proposed to Kanyakumari that woul serve the purpose of traffic to reach end point at Kanyakumari.
5.2.2 Proposed Alignment for NH 47B Section
The proposed alignment of NH 47B starts just before proposed Nagercoil bypass in Kanyakumari District and terminates at km 211/600 of NH-7, in Kavalkinaru of Tirunelveli district. The total length of project road is 16/376km and is aligned through less built up areas avoiding religious structures, ponds, etc. 60m Right of Way is proposed keeping provision for future expansion of project road. The new four lane highway will be aligned through the centre of the acquired land. Considering the large number of structures affected while using the existing NH47B, totally new alignment is proposed bypassing built up areas like Viswasapuram, Thovalai, Vellamadam, MGR Nagar, Arvalmozhai etc. km 0/000 to km 2/000 The alignment of NH 47B cuts the proposed Nagercoil bypass of NH47 at km 82/181. the alignment starts at 0.205km before the junction of NH 47B and NH 47 (new alignment) and continues up to 0.6 km of existing NH 47B. Further it deviates towards left crossing paddy fields and cuts Teraikkalpudur-Thirupathisaram road, and proceeds further to cross existing NH47B at km 2/000 .The alignment runs through paddy fields and less built up areas. The existing road for a length of 600m is used by widening towards right. km 2/000 to km 5/000 The entire alignment runs through paddy fields and coconut plantation and crosses Puttanar canal at km 3/500 and passes through paddy fields, crosses a small stream and proceeds through open lands near Viramartandanpuram. km 5/0 to km 6/0 The alignment cuts Viramartandanpuram-Sivagnanapuram road at km 5/150, then a pond and proceeds further to cross Thirunelveli-Nagarcoil railway line at km 5/470. Generally the alignment is going through open land. km 6/0 to km 7/0
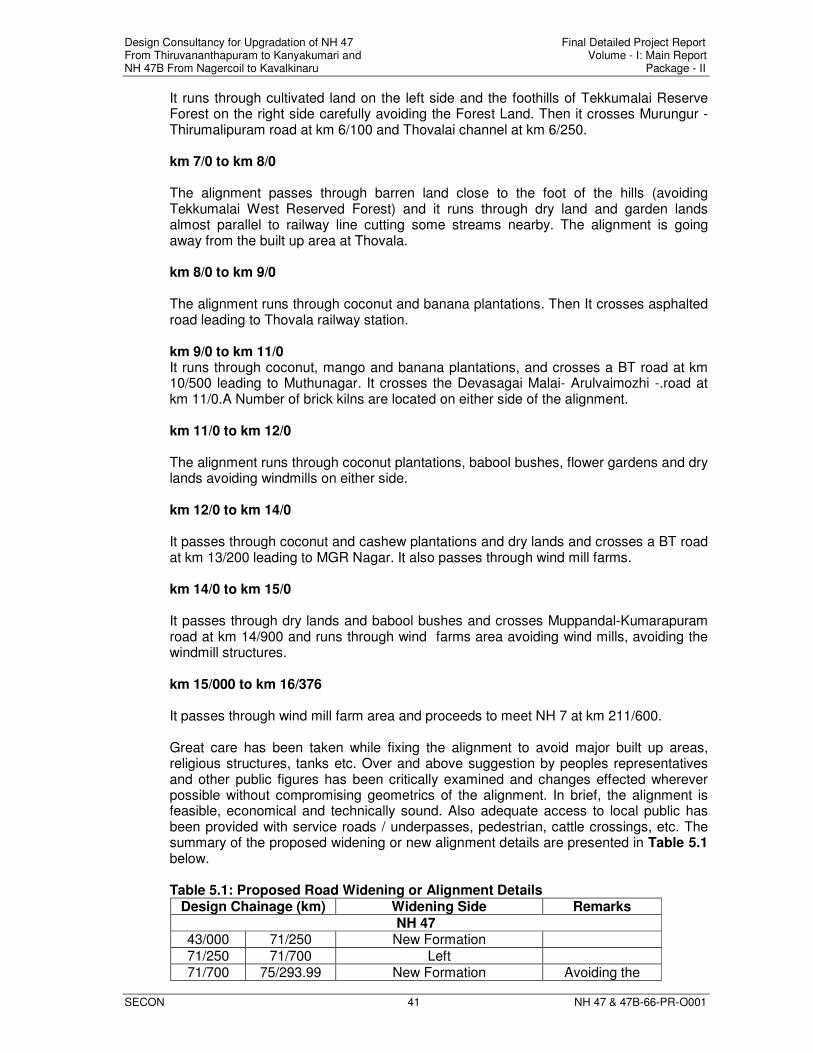
Design Consultancy for Upgradation of NH 47 Final Detailed Project Report From Thiruvananthapuram to Kanyakumari and Volume - I: Main Report NH 47B From Nagercoil to Kavalkinaru Package - II
SECON 41 NH 47 & 47B-66-PR-O001
It runs through cultivated land on the left side and the foothills of Tekkumalai Reserve Forest on the right side carefully avoiding the Forest Land. Then it crosses Murungur -Thirumalipuram road at km 6/100 and Thovalai channel at km 6/250. km 7/0 to km 8/0 The alignment passes through barren land close to the foot of the hills (avoiding Tekkumalai West Reserved Forest) and it runs through dry land and garden lands almost parallel to railway line cutting some streams nearby. The alignment is going away from the built up area at Thovala. km 8/0 to km 9/0 The alignment runs through coconut and banana plantations. Then It crosses asphalted road leading to Thovala railway station. km 9/0 to km 11/0 It runs through coconut, mango and banana plantations, and crosses a BT road at km 10/500 leading to Muthunagar. It crosses the Devasagai Malai- Arulvaimozhi -.road at km 11/0.A Number of brick kilns are located on either side of the alignment. km 11/0 to km 12/0 The alignment runs through coconut plantations, babool bushes, flower gardens and dry lands avoiding windmills on either side. km 12/0 to km 14/0 It passes through coconut and cashew plantations and dry lands and crosses a BT road at km 13/200 leading to MGR Nagar. It also passes through wind mill farms. km 14/0 to km 15/0 It passes through dry lands and babool bushes and crosses Muppandal-Kumarapuram road at km 14/900 and runs through wind farms area avoiding wind mills, avoiding the windmill structures. km 15/000 to km 16/376 It passes through wind mill farm area and proceeds to meet NH 7 at km 211/600. Great care has been taken while fixing the alignment to avoid major built up areas, religious structures, tanks etc. Over and above suggestion by peoples representatives and other public figures has been critically examined and changes effected wherever possible without compromising geometrics of the alignment. In brief, the alignment is feasible, economical and technically sound. Also adequate access to local public has been provided with service roads / underpasses, pedestrian, cattle crossings, etc. The summary of the proposed widening or new alignment details are presented in Table 5.1 below. Table 5.1: Proposed Road Widening or Alignment Details
Design Chainage (km) Widening Side Remarks
NH 47 43/000 71/250 New Formation
71/250 71/700 Left 71/700 75/293.99 New Formation Avoiding the
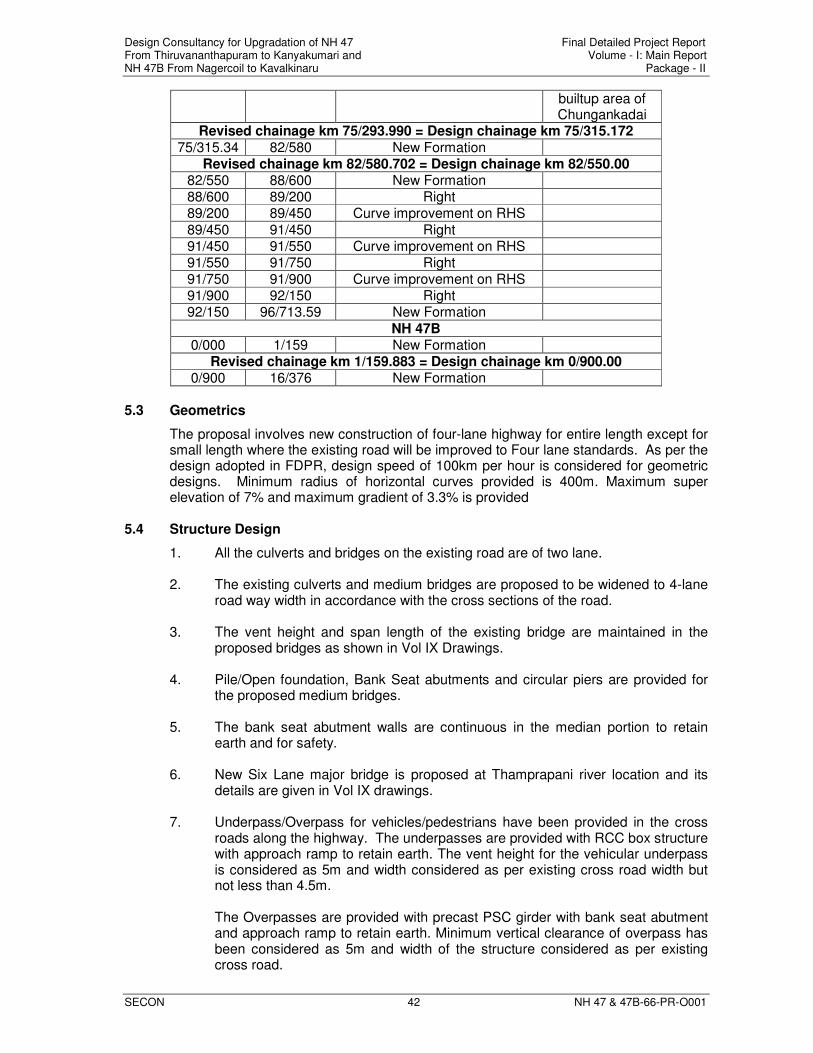
Design Consultancy for Upgradation of NH 47 Final Detailed Project Report From Thiruvananthapuram to Kanyakumari and Volume - I: Main Report NH 47B From Nagercoil to Kavalkinaru Package - II
SECON 42 NH 47 & 47B-66-PR-O001
builtup area of Chungankadai
Revised chainage km 75/293.990 = Design chainage km 75/315.172
75/315.34 82/580 New Formation Revised chainage km 82/580.702 = Design chainage km 82/550.00
82/550 88/600 New Formation 88/600 89/200 Right 89/200 89/450 Curve improvement on RHS
89/450 91/450 Right 91/450 91/550 Curve improvement on RHS 91/550 91/750 Right 91/750 91/900 Curve improvement on RHS 91/900 92/150 Right 92/150 96/713.59 New Formation
NH 47B 0/000 1/159 New Formation
Revised chainage km 1/159.883 = Design chainage km 0/900.00 0/900 16/376 New Formation
5.3 Geometrics
The proposal involves new construction of four-lane highway for entire length except for small length where the existing road will be improved to Four lane standards. As per the design adopted in FDPR, design speed of 100km per hour is considered for geometric designs. Minimum radius of horizontal curves provided is 400m. Maximum super elevation of 7% and maximum gradient of 3.3% is provided
5.4 Structure Design
1. All the culverts and bridges on the existing road are of two lane. 2. The existing culverts and medium bridges are proposed to be widened to 4-lane
road way width in accordance with the cross sections of the road.
3. The vent height and span length of the existing bridge are maintained in the proposed bridges as shown in Vol IX Drawings.
4. Pile/Open foundation, Bank Seat abutments and circular piers are provided for
the proposed medium bridges.
5. The bank seat abutment walls are continuous in the median portion to retain earth and for safety.
6. New Six Lane major bridge is proposed at Thamprapani river location and its
details are given in Vol IX drawings.
7. Underpass/Overpass for vehicles/pedestrians have been provided in the cross roads along the highway. The underpasses are provided with RCC box structure with approach ramp to retain earth. The vent height for the vehicular underpass is considered as 5m and width considered as per existing cross road width but not less than 4.5m. The Overpasses are provided with precast PSC girder with bank seat abutment and approach ramp to retain earth. Minimum vertical clearance of overpass has been considered as 5m and width of the structure considered as per existing cross road.
Design Consultancy for Upgradation of NH 47 Final Detailed Project Report From Thiruvananthapuram to Kanyakumari and Volume - I: Main Report NH 47B From Nagercoil to Kavalkinaru Package - II
SECON 43 NH 47 & 47B-66-PR-O001
8. New Six Lane ROBs are provide at railway line crossings with minimum vertical
clearance of km 6.525 keeping the future view of Electrified Railway engines. 5.5 Design Parameters
5.5.1 Design Standards
The design conforms to the following IRC standards i) IRC:05-1985 General Details ii) IRC:06-2000 Loads and Stresses iii) IRC:78-2000 Design of Substructure iv) IRC 18-2000 Design of Prestressed Members v) IRC 21-2000 Design of reinforced members vi) IRC 83-2000 Design of Bearing (Part-I, II and III) vii) IS:1893-2002 Design of Earthquake resistant structures Viii) Railway Codal Recommendation and Practice Southern Central Railway
5.5.2 Design Loads
For the design of major structures, following Design Loads are adopted:
(a) Dead Loads (As per IRC:6) Unit weight of PCC members : 2.4 t/m3
Unit Weight of RCC Members : 2.5 t/m3 Unit Weight of Wearing Coat : 2.2 t/m3
(b) Live Loads (As per IRC:6) For Global Analysis One lane of Class 70R Wheel + One lane of Class A wheel OR
Three lanes of Class A Vehicles whichever governs. For Local Analysis, Class AA Tracked Vehicle has been considered
All the above analysis for the superstructure has been done using STAAD Pro Software.
(c) Wind Loads, Earthquake Loads, braking loads, Temperature Effects, Water
current forces and Buoyancy forces are considered as per relevant clauses of IRC : 6
For Earthquake Design, the structure is considered in Zone III as per IS:1893
(d) Design has been carried out using Moderate conditions of exposure as per IRC:21
5.5.3 Materials
Foundation Concrete Grade : M35(for major bridge/ROB/underpass/ overpass);
M30 (for minor bridge and cross drainage structure) Reinforcement : HYSD of grade Fe415
Design Consultancy for Upgradation of NH 47 Final Detailed Project Report From Thiruvananthapuram to Kanyakumari and Volume - I: Main Report NH 47B From Nagercoil to Kavalkinaru Package - II
SECON 44 NH 47 & 47B-66-PR-O001
Abutment/Abutment Cap, Pier /Pier Cap Concrete Grade : M35 (for major bridge/ROB/underpass/ overpass); M30
(for minor bridge and cross drainage structure) Reinforcement : HYSD of grade Fe415 Superstructure Concrete Grade : M40 (PSC girder & RCC Deck slab) M30 (RCC girder & Deck Slab) Reinforcement : HYSD of grade Fe415 Crash Barrier Concrete Grade : M40 Reinforcement : HYSD steel of grade Fe415
Approach Slab Concrete Grade : M30 Reinforcement : HYSD steel of grade Fe415 Clear Cover to any Reinforcements are followed as below: a) Foundation : 75mm b) Pier, Piercap, Abutment, Abutment Cap : 50mm d) RCC Desk Slab : 25mm
5.5.4 Bearing
Neoprene bearing for slab superstructure and Pot-cum- PTFE bearing for girder superstructure has been adopted.
5.5.5 Expansion Joints
Compression seal for slab superstructures and Elastomeric Strip Seal for girder superstructures are used.
5.5.6 Wearing Coat
For minor bridge and cross drainage structure 50mm thick bituminous concrete wearing coat has been proposed. For major bridge and ROB 40mm thick bituminous concrete overlaid with 25mm thick mastic asphalt has been proposed.
5.5.7 Approach
Earth wall Embankment shall be adopted for the approaches.
5.5.8 Structure
All the salient features of the structures are maintained as per the general arrangements drawing accordingly.
5.6 Proposed Structures
After proposing the feasible and technically sound alignment, a detailed study was done to provide the various cross drainage structures and other structures along the alignment. The cross drainage structures include Major Bridges, Minor Bridges, Culverts (Box/Pipe) etc. The other structures include Vehicular Underpass, Vehicular Overpass, ROBs and Pedestrian Underpass etc. The lists of structures proposed along the alignment are presented in Table 5.2 to 5.7 below. 3-lane structures are proposed on
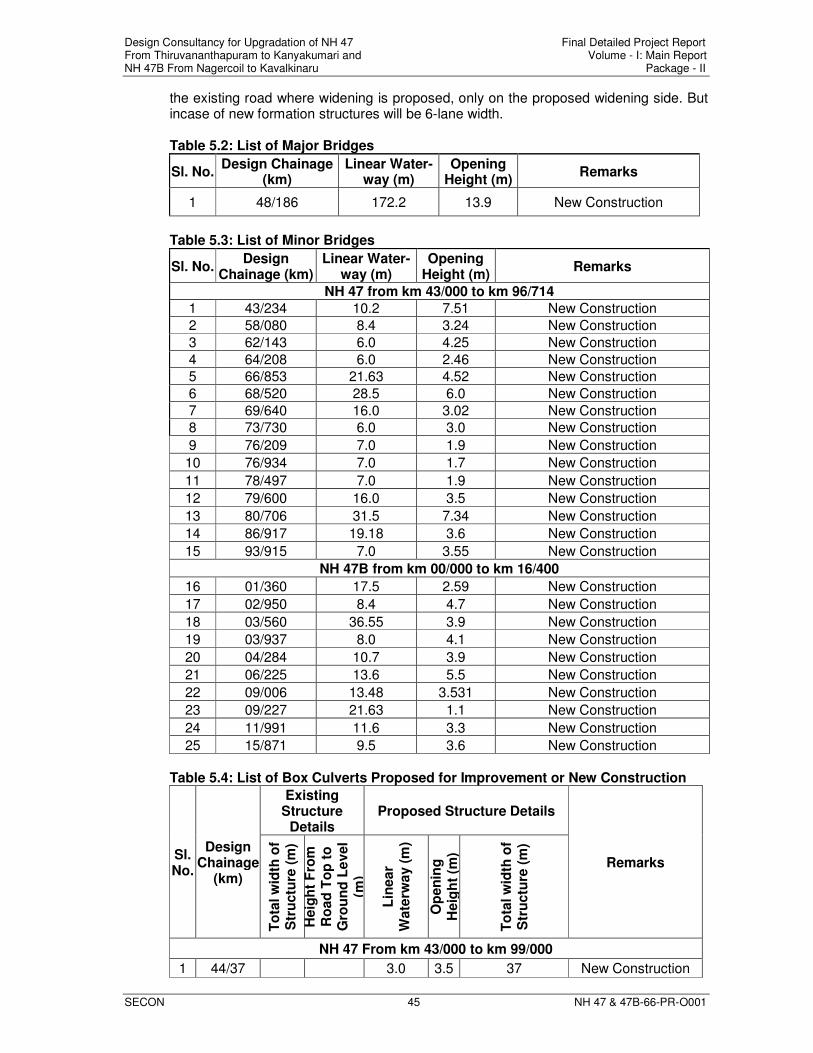
Design Consultancy for Upgradation of NH 47 Final Detailed Project Report From Thiruvananthapuram to Kanyakumari and Volume - I: Main Report NH 47B From Nagercoil to Kavalkinaru Package - II
SECON 45 NH 47 & 47B-66-PR-O001
the existing road where widening is proposed, only on the proposed widening side. But incase of new formation structures will be 6-lane width.
Table 5.2: List of Major Bridges
Sl. No. Design Chainage
(km) Linear Water-
way (m) Opening
Height (m) Remarks
1 48/186 172.2 13.9 New Construction
Table 5.3: List of Minor Bridges
Sl. No. Design
Chainage (km) Linear Water-
way (m) Opening
Height (m) Remarks
NH 47 from km 43/000 to km 96/714
1 43/234 10.2 7.51 New Construction
2 58/080 8.4 3.24 New Construction
3 62/143 6.0 4.25 New Construction
4 64/208 6.0 2.46 New Construction
5 66/853 21.63 4.52 New Construction
6 68/520 28.5 6.0 New Construction
7 69/640 16.0 3.02 New Construction
8 73/730 6.0 3.0 New Construction
9 76/209 7.0 1.9 New Construction
10 76/934 7.0 1.7 New Construction
11 78/497 7.0 1.9 New Construction
12 79/600 16.0 3.5 New Construction
13 80/706 31.5 7.34 New Construction
14 86/917 19.18 3.6 New Construction
15 93/915 7.0 3.55 New Construction
NH 47B from km 00/000 to km 16/400
16 01/360 17.5 2.59 New Construction
17 02/950 8.4 4.7 New Construction
18 03/560 36.55 3.9 New Construction
19 03/937 8.0 4.1 New Construction
20 04/284 10.7 3.9 New Construction
21 06/225 13.6 5.5 New Construction
22 09/006 13.48 3.531 New Construction
23 09/227 21.63 1.1 New Construction
24 11/991 11.6 3.3 New Construction
25 15/871 9.5 3.6 New Construction
Table 5.4: List of Box Culverts Proposed for Improvement or New Construction
Sl. No.
Design Chainage
(km)
Existing Structure
Details Proposed Structure Details
Remarks
To
tal w
idth
of
Str
uctu
re (
m)
Heig
ht
Fro
m
Ro
ad
To
p t
o
Gro
un
d L
evel
(m)
Lin
ear
Wate
rway (
m)
Op
en
ing
H
eig
ht
(m)
To
tal w
idth
of
Str
uctu
re (
m)
NH 47 From km 43/000 to km 99/000
1 44/37 3.0 3.5 37 New Construction
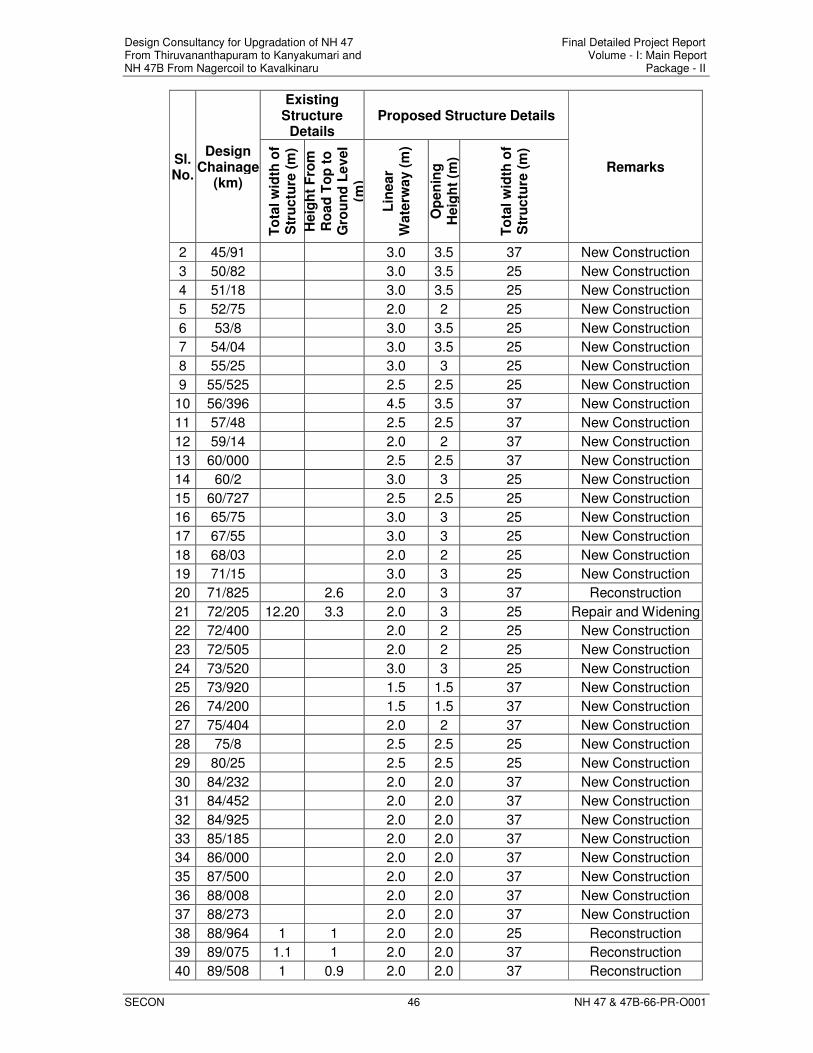
Design Consultancy for Upgradation of NH 47 Final Detailed Project Report From Thiruvananthapuram to Kanyakumari and Volume - I: Main Report NH 47B From Nagercoil to Kavalkinaru Package - II
SECON 46 NH 47 & 47B-66-PR-O001
Sl. No.
Design Chainage
(km)
Existing Structure
Details Proposed Structure Details
Remarks
To
tal w
idth
of
Str
uctu
re (
m)
Heig
ht
Fro
m
Ro
ad
To
p t
o
Gro
un
d L
evel
(m)
Lin
ear
Wate
rway (
m)
Op
en
ing
H
eig
ht
(m)
To
tal w
idth
of
Str
uctu
re (
m)
2 45/91 3.0 3.5 37 New Construction
3 50/82 3.0 3.5 25 New Construction
4 51/18 3.0 3.5 25 New Construction
5 52/75 2.0 2 25 New Construction
6 53/8 3.0 3.5 25 New Construction
7 54/04 3.0 3.5 25 New Construction
8 55/25 3.0 3 25 New Construction
9 55/525 2.5 2.5 25 New Construction
10 56/396 4.5 3.5 37 New Construction
11 57/48 2.5 2.5 37 New Construction
12 59/14 2.0 2 37 New Construction
13 60/000 2.5 2.5 37 New Construction
14 60/2 3.0 3 25 New Construction
15 60/727 2.5 2.5 25 New Construction
16 65/75 3.0 3 25 New Construction
17 67/55 3.0 3 25 New Construction
18 68/03 2.0 2 25 New Construction
19 71/15 3.0 3 25 New Construction
20 71/825 2.6 2.0 3 37 Reconstruction
21 72/205 12.20 3.3 2.0 3 25 Repair and Widening
22 72/400 2.0 2 25 New Construction
23 72/505 2.0 2 25 New Construction
24 73/520 3.0 3 25 New Construction
25 73/920 1.5 1.5 37 New Construction
26 74/200 1.5 1.5 37 New Construction
27 75/404 2.0 2 37 New Construction
28 75/8 2.5 2.5 25 New Construction
29 80/25 2.5 2.5 25 New Construction
30 84/232 2.0 2.0 37 New Construction
31 84/452 2.0 2.0 37 New Construction
32 84/925 2.0 2.0 37 New Construction
33 85/185 2.0 2.0 37 New Construction
34 86/000 2.0 2.0 37 New Construction
35 87/500 2.0 2.0 37 New Construction
36 88/008 2.0 2.0 37 New Construction
37 88/273 2.0 2.0 37 New Construction
38 88/964 1 1 2.0 2.0 25 Reconstruction
39 89/075 1.1 1 2.0 2.0 37 Reconstruction
40 89/508 1 0.9 2.0 2.0 37 Reconstruction
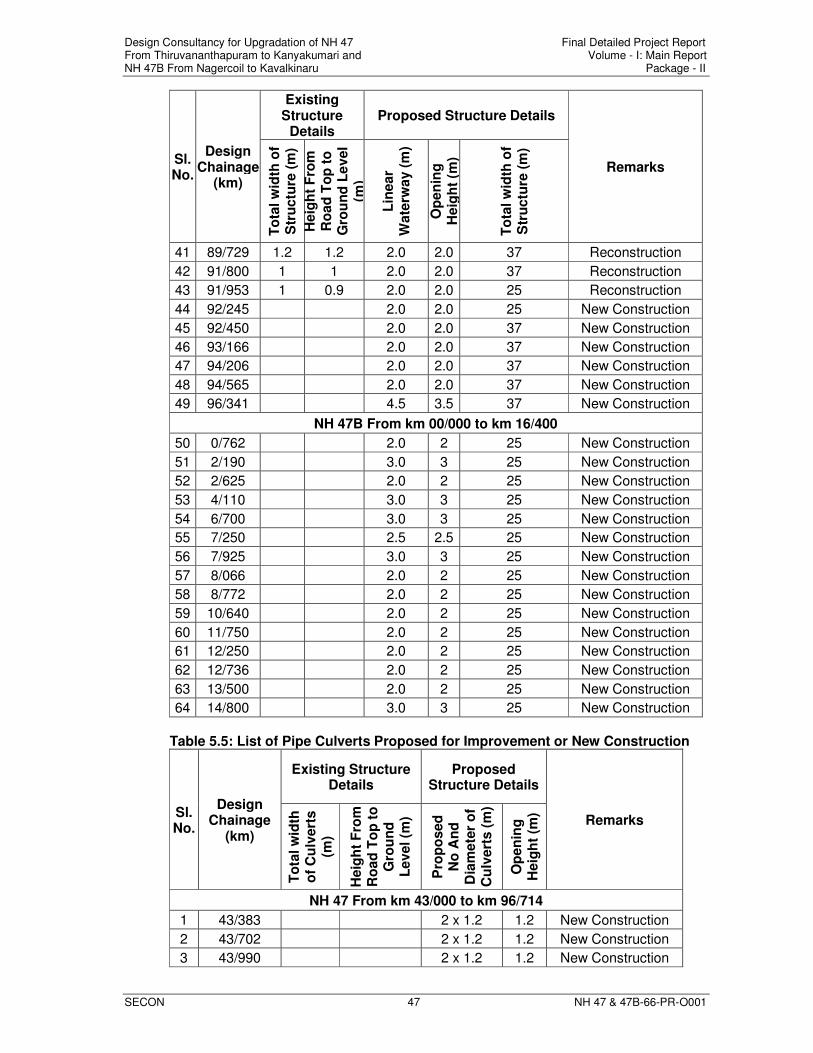
Design Consultancy for Upgradation of NH 47 Final Detailed Project Report From Thiruvananthapuram to Kanyakumari and Volume - I: Main Report NH 47B From Nagercoil to Kavalkinaru Package - II
SECON 47 NH 47 & 47B-66-PR-O001
Sl. No.
Design Chainage
(km)
Existing Structure
Details Proposed Structure Details
Remarks
To
tal w
idth
of
Str
uctu
re (
m)
Heig
ht
Fro
m
Ro
ad
To
p t
o
Gro
un
d L
evel
(m)
Lin
ear
Wate
rway (
m)
Op
en
ing
H
eig
ht
(m)
To
tal w
idth
of
Str
uctu
re (
m)
41 89/729 1.2 1.2 2.0 2.0 37 Reconstruction
42 91/800 1 1 2.0 2.0 37 Reconstruction
43 91/953 1 0.9 2.0 2.0 25 Reconstruction
44 92/245 2.0 2.0 25 New Construction
45 92/450 2.0 2.0 37 New Construction
46 93/166 2.0 2.0 37 New Construction
47 94/206 2.0 2.0 37 New Construction
48 94/565 2.0 2.0 37 New Construction
49 96/341 4.5 3.5 37 New Construction
NH 47B From km 00/000 to km 16/400
50 0/762 2.0 2 25 New Construction
51 2/190 3.0 3 25 New Construction
52 2/625 2.0 2 25 New Construction
53 4/110 3.0 3 25 New Construction
54 6/700 3.0 3 25 New Construction
55 7/250 2.5 2.5 25 New Construction
56 7/925 3.0 3 25 New Construction
57 8/066 2.0 2 25 New Construction
58 8/772 2.0 2 25 New Construction
59 10/640 2.0 2 25 New Construction
60 11/750 2.0 2 25 New Construction
61 12/250 2.0 2 25 New Construction
62 12/736 2.0 2 25 New Construction
63 13/500 2.0 2 25 New Construction
64 14/800 3.0 3 25 New Construction
Table 5.5: List of Pipe Culverts Proposed for Improvement or New Construction
Sl. No.
Design Chainage
(km)
Existing Structure Details
Proposed Structure Details
Remarks
To
tal w
idth
o
f C
ulv
ert
s
(m)
Heig
ht
Fro
m
Ro
ad
To
p t
o
Gro
un
d
Level (m
)
Pro
po
sed
N
o A
nd
D
iam
ete
r o
f C
ulv
ert
s (
m)
Op
en
ing
H
eig
ht
(m)
NH 47 From km 43/000 to km 96/714
1 43/383 2 x 1.2 1.2 New Construction
2 43/702 2 x 1.2 1.2 New Construction
3 43/990 2 x 1.2 1.2 New Construction
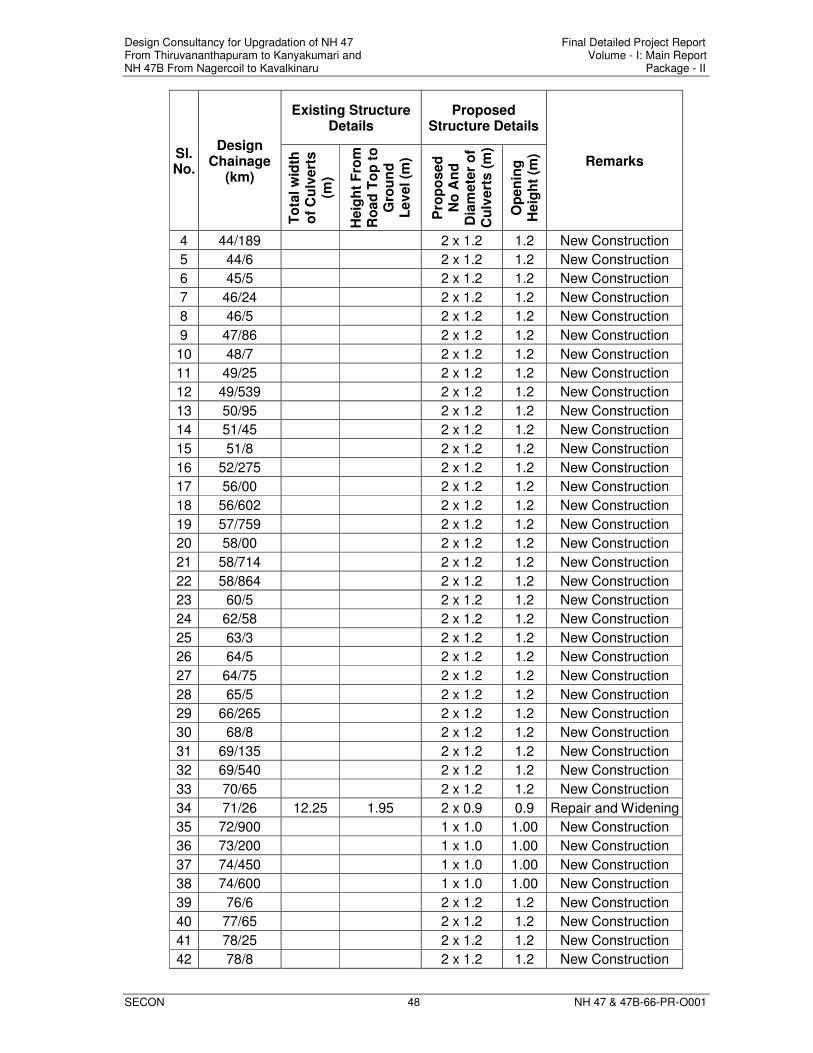
Design Consultancy for Upgradation of NH 47 Final Detailed Project Report From Thiruvananthapuram to Kanyakumari and Volume - I: Main Report NH 47B From Nagercoil to Kavalkinaru Package - II
SECON 48 NH 47 & 47B-66-PR-O001
Sl. No.
Design Chainage
(km)
Existing Structure Details
Proposed Structure Details
Remarks
To
tal w
idth
o
f C
ulv
ert
s
(m)
Heig
ht
Fro
m
Ro
ad
To
p t
o
Gro
un
d
Lev
el (m
)
Pro
po
sed
N
o A
nd
D
iam
ete
r o
f C
ulv
ert
s (
m)
Op
en
ing
H
eig
ht
(m)
4 44/189 2 x 1.2 1.2 New Construction
5 44/6 2 x 1.2 1.2 New Construction
6 45/5 2 x 1.2 1.2 New Construction
7 46/24 2 x 1.2 1.2 New Construction
8 46/5 2 x 1.2 1.2 New Construction
9 47/86 2 x 1.2 1.2 New Construction
10 48/7 2 x 1.2 1.2 New Construction
11 49/25 2 x 1.2 1.2 New Construction
12 49/539 2 x 1.2 1.2 New Construction
13 50/95 2 x 1.2 1.2 New Construction
14 51/45 2 x 1.2 1.2 New Construction
15 51/8 2 x 1.2 1.2 New Construction
16 52/275 2 x 1.2 1.2 New Construction
17 56/00 2 x 1.2 1.2 New Construction
18 56/602 2 x 1.2 1.2 New Construction
19 57/759 2 x 1.2 1.2 New Construction
20 58/00 2 x 1.2 1.2 New Construction
21 58/714 2 x 1.2 1.2 New Construction
22 58/864 2 x 1.2 1.2 New Construction
23 60/5 2 x 1.2 1.2 New Construction
24 62/58 2 x 1.2 1.2 New Construction
25 63/3 2 x 1.2 1.2 New Construction
26 64/5 2 x 1.2 1.2 New Construction
27 64/75 2 x 1.2 1.2 New Construction
28 65/5 2 x 1.2 1.2 New Construction
29 66/265 2 x 1.2 1.2 New Construction
30 68/8 2 x 1.2 1.2 New Construction
31 69/135 2 x 1.2 1.2 New Construction
32 69/540 2 x 1.2 1.2 New Construction
33 70/65 2 x 1.2 1.2 New Construction
34 71/26 12.25 1.95 2 x 0.9 0.9 Repair and Widening
35 72/900 1 x 1.0 1.00 New Construction
36 73/200 1 x 1.0 1.00 New Construction
37 74/450 1 x 1.0 1.00 New Construction
38 74/600 1 x 1.0 1.00 New Construction
39 76/6 2 x 1.2 1.2 New Construction
40 77/65 2 x 1.2 1.2 New Construction
41 78/25 2 x 1.2 1.2 New Construction
42 78/8 2 x 1.2 1.2 New Construction
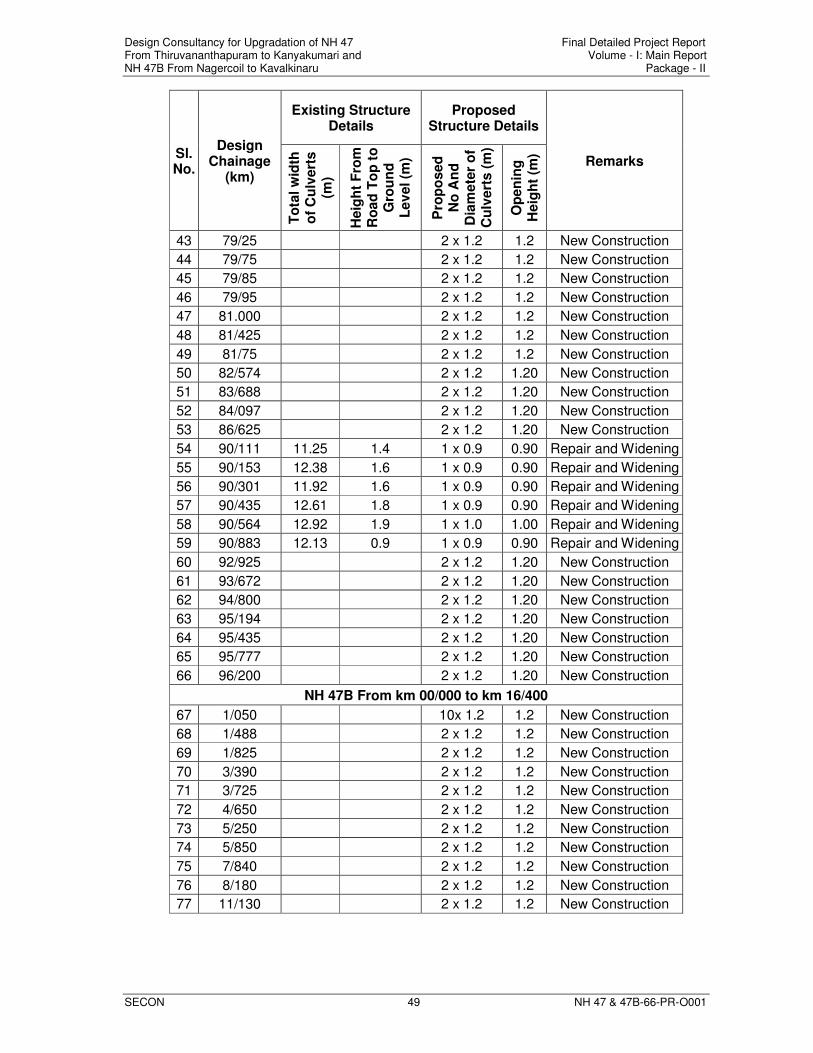
Design Consultancy for Upgradation of NH 47 Final Detailed Project Report From Thiruvananthapuram to Kanyakumari and Volume - I: Main Report NH 47B From Nagercoil to Kavalkinaru Package - II
SECON 49 NH 47 & 47B-66-PR-O001
Sl. No.
Design Chainage
(km)
Existing Structure Details
Proposed Structure Details
Remarks
To
tal w
idth
o
f C
ulv
ert
s
(m)
Heig
ht
Fro
m
Ro
ad
To
p t
o
Gro
un
d
Lev
el (m
)
Pro
po
sed
N
o A
nd
D
iam
ete
r o
f C
ulv
ert
s (
m)
Op
en
ing
H
eig
ht
(m)
43 79/25 2 x 1.2 1.2 New Construction
44 79/75 2 x 1.2 1.2 New Construction
45 79/85 2 x 1.2 1.2 New Construction
46 79/95 2 x 1.2 1.2 New Construction
47 81.000 2 x 1.2 1.2 New Construction
48 81/425 2 x 1.2 1.2 New Construction
49 81/75 2 x 1.2 1.2 New Construction
50 82/574 2 x 1.2 1.20 New Construction
51 83/688 2 x 1.2 1.20 New Construction
52 84/097 2 x 1.2 1.20 New Construction
53 86/625 2 x 1.2 1.20 New Construction
54 90/111 11.25 1.4 1 x 0.9 0.90 Repair and Widening
55 90/153 12.38 1.6 1 x 0.9 0.90 Repair and Widening
56 90/301 11.92 1.6 1 x 0.9 0.90 Repair and Widening
57 90/435 12.61 1.8 1 x 0.9 0.90 Repair and Widening
58 90/564 12.92 1.9 1 x 1.0 1.00 Repair and Widening
59 90/883 12.13 0.9 1 x 0.9 0.90 Repair and Widening
60 92/925 2 x 1.2 1.20 New Construction
61 93/672 2 x 1.2 1.20 New Construction
62 94/800 2 x 1.2 1.20 New Construction
63 95/194 2 x 1.2 1.20 New Construction
64 95/435 2 x 1.2 1.20 New Construction
65 95/777 2 x 1.2 1.20 New Construction
66 96/200 2 x 1.2 1.20 New Construction
NH 47B From km 00/000 to km 16/400
67 1/050 10x 1.2 1.2 New Construction
68 1/488 2 x 1.2 1.2 New Construction
69 1/825 2 x 1.2 1.2 New Construction
70 3/390 2 x 1.2 1.2 New Construction
71 3/725 2 x 1.2 1.2 New Construction
72 4/650 2 x 1.2 1.2 New Construction
73 5/250 2 x 1.2 1.2 New Construction
74 5/850 2 x 1.2 1.2 New Construction
75 7/840 2 x 1.2 1.2 New Construction
76 8/180 2 x 1.2 1.2 New Construction
77 11/130 2 x 1.2 1.2 New Construction
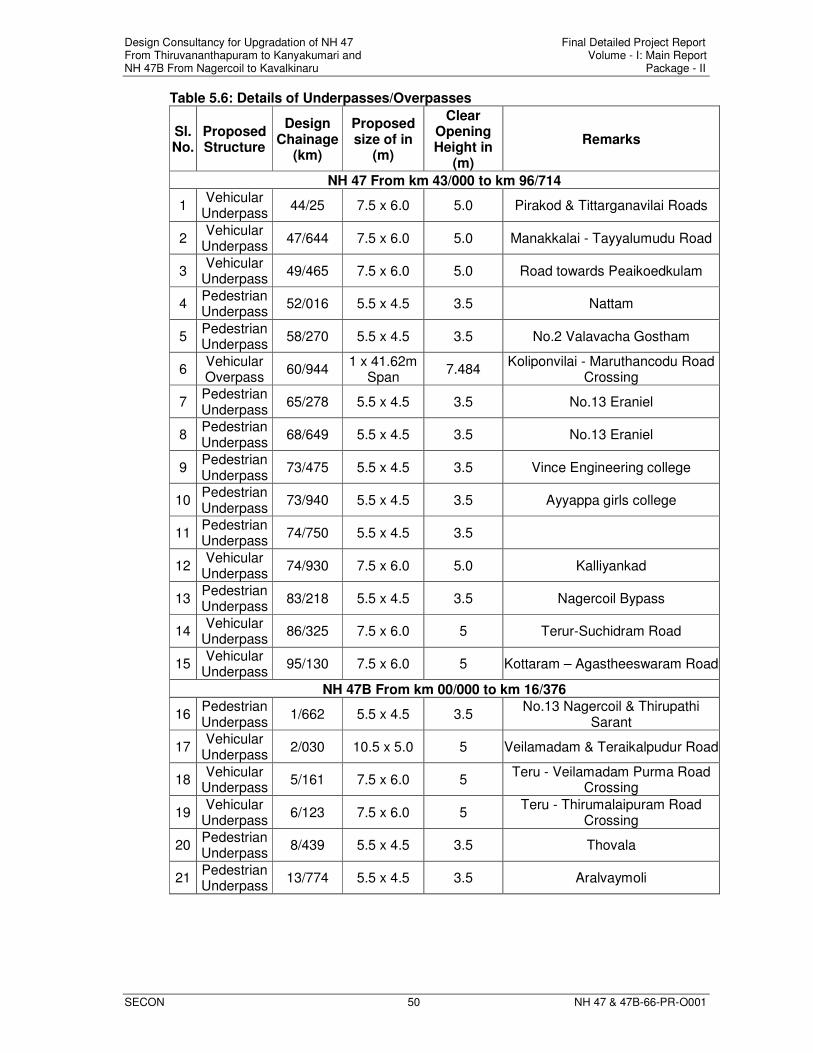
Design Consultancy for Upgradation of NH 47 Final Detailed Project Report From Thiruvananthapuram to Kanyakumari and Volume - I: Main Report NH 47B From Nagercoil to Kavalkinaru Package - II
SECON 50 NH 47 & 47B-66-PR-O001
Table 5.6: Details of Underpasses/Overpasses
Sl. No.
Proposed Structure
Design Chainage
(km)
Proposed size of in
(m)
Clear Opening Height in
(m)
Remarks
NH 47 From km 43/000 to km 96/714
1 Vehicular
Underpass 44/25 7.5 x 6.0 5.0 Pirakod & Tittarganavilai Roads
2 Vehicular
Underpass 47/644 7.5 x 6.0 5.0 Manakkalai - Tayyalumudu Road
3 Vehicular
Underpass 49/465 7.5 x 6.0 5.0 Road towards Peaikoedkulam
4 Pedestrian Underpass
52/016 5.5 x 4.5 3.5 Nattam
5 Pedestrian Underpass
58/270 5.5 x 4.5 3.5 No.2 Valavacha Gostham
6 Vehicular Overpass
60/944 1 x 41.62m
Span 7.484
Koliponvilai - Maruthancodu Road Crossing
7 Pedestrian Underpass
65/278 5.5 x 4.5 3.5 No.13 Eraniel
8 Pedestrian Underpass
68/649 5.5 x 4.5 3.5 No.13 Eraniel
9 Pedestrian Underpass
73/475 5.5 x 4.5 3.5 Vince Engineering college
10 Pedestrian Underpass
73/940 5.5 x 4.5 3.5 Ayyappa girls college
11 Pedestrian Underpass
74/750 5.5 x 4.5 3.5
12 Vehicular
Underpass 74/930 7.5 x 6.0 5.0 Kalliyankad
13 Pedestrian Underpass
83/218 5.5 x 4.5 3.5 Nagercoil Bypass
14 Vehicular
Underpass 86/325 7.5 x 6.0 5 Terur-Suchidram Road
15 Vehicular
Underpass 95/130 7.5 x 6.0 5 Kottaram – Agastheeswaram Road
NH 47B From km 00/000 to km 16/376
16 Pedestrian Underpass
1/662 5.5 x 4.5 3.5 No.13 Nagercoil & Thirupathi
Sarant
17 Vehicular
Underpass 2/030 10.5 x 5.0 5 Veilamadam & Teraikalpudur Road
18 Vehicular
Underpass 5/161 7.5 x 6.0 5
Teru - Veilamadam Purma Road Crossing
19 Vehicular
Underpass 6/123 7.5 x 6.0 5
Teru - Thirumalaipuram Road Crossing
20 Pedestrian Underpass
8/439 5.5 x 4.5 3.5 Thovala
21 Pedestrian Underpass
13/774 5.5 x 4.5 3.5 Aralvaymoli
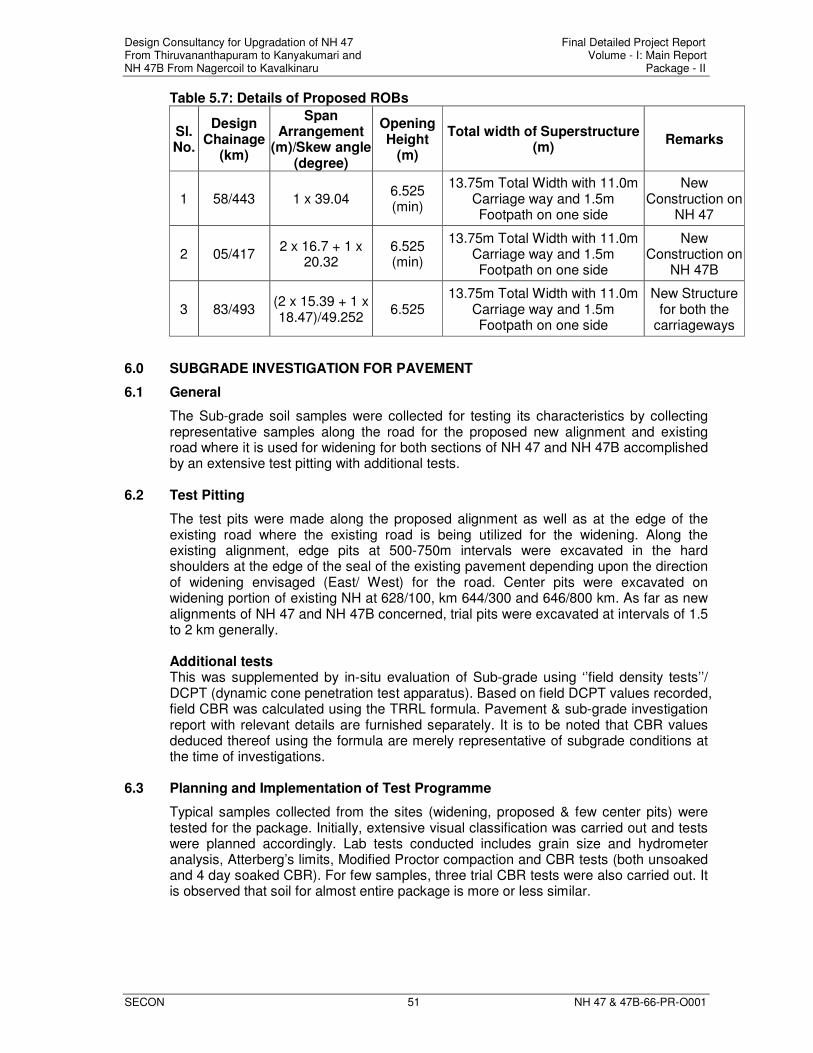
Design Consultancy for Upgradation of NH 47 Final Detailed Project Report From Thiruvananthapuram to Kanyakumari and Volume - I: Main Report NH 47B From Nagercoil to Kavalkinaru Package - II
SECON 51 NH 47 & 47B-66-PR-O001
Table 5.7: Details of Proposed ROBs
Sl. No.
Design Chainage
(km)
Span Arrangement
(m)/Skew angle (degree)
Opening Height
(m)
Total width of Superstructure (m)
Remarks
1 58/443 1 x 39.04 6.525 (min)
13.75m Total Width with 11.0m Carriage way and 1.5m Footpath on one side
New Construction on
NH 47
2 05/417 2 x 16.7 + 1 x
20.32 6.525 (min)
13.75m Total Width with 11.0m Carriage way and 1.5m Footpath on one side
New Construction on
NH 47B
3 83/493 (2 x 15.39 + 1 x 18.47)/49.252
6.525 13.75m Total Width with 11.0m
Carriage way and 1.5m Footpath on one side
New Structure for both the
carriageways
6.0 SUBGRADE INVESTIGATION FOR PAVEMENT
6.1 General
The Sub-grade soil samples were collected for testing its characteristics by collecting representative samples along the road for the proposed new alignment and existing road where it is used for widening for both sections of NH 47 and NH 47B accomplished by an extensive test pitting with additional tests.
6.2 Test Pitting
The test pits were made along the proposed alignment as well as at the edge of the existing road where the existing road is being utilized for the widening. Along the existing alignment, edge pits at 500-750m intervals were excavated in the hard shoulders at the edge of the seal of the existing pavement depending upon the direction of widening envisaged (East/ West) for the road. Center pits were excavated on widening portion of existing NH at 628/100, km 644/300 and 646/800 km. As far as new alignments of NH 47 and NH 47B concerned, trial pits were excavated at intervals of 1.5 to 2 km generally.
Additional tests This was supplemented by in-situ evaluation of Sub-grade using ‘’field density tests’’/ DCPT (dynamic cone penetration test apparatus). Based on field DCPT values recorded, field CBR was calculated using the TRRL formula. Pavement & sub-grade investigation report with relevant details are furnished separately. It is to be noted that CBR values deduced thereof using the formula are merely representative of subgrade conditions at the time of investigations.
6.3 Planning and Implementation of Test Programme
Typical samples collected from the sites (widening, proposed & few center pits) were tested for the package. Initially, extensive visual classification was carried out and tests were planned accordingly. Lab tests conducted includes grain size and hydrometer analysis, Atterberg’s limits, Modified Proctor compaction and CBR tests (both unsoaked and 4 day soaked CBR). For few samples, three trial CBR tests were also carried out. It is observed that soil for almost entire package is more or less similar.
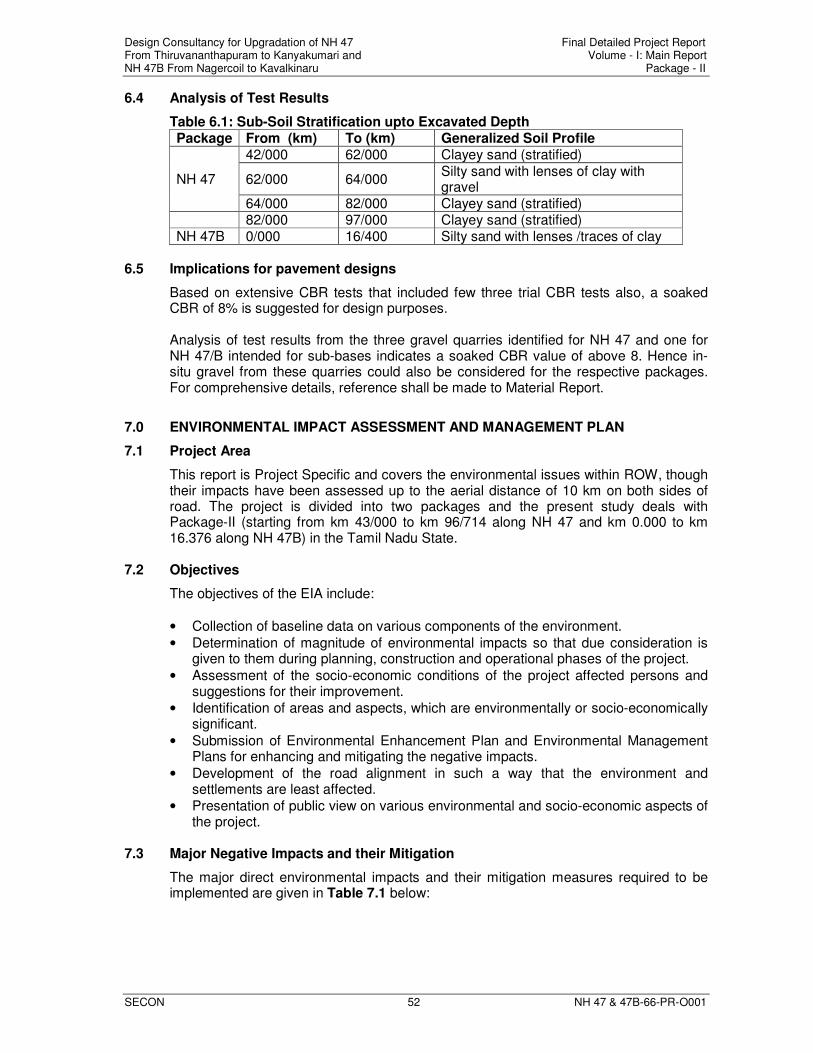
Design Consultancy for Upgradation of NH 47 Final Detailed Project Report From Thiruvananthapuram to Kanyakumari and Volume - I: Main Report NH 47B From Nagercoil to Kavalkinaru Package - II
SECON 52 NH 47 & 47B-66-PR-O001
6.4 Analysis of Test Results
Table 6.1: Sub-Soil Stratification upto Excavated Depth Package From (km) To (km) Generalized Soil Profile
NH 47
42/000 62/000 Clayey sand (stratified)
62/000 64/000 Silty sand with lenses of clay with gravel
64/000 82/000 Clayey sand (stratified) 82/000 97/000 Clayey sand (stratified) NH 47B 0/000 16/400 Silty sand with lenses /traces of clay
6.5 Implications for pavement designs
Based on extensive CBR tests that included few three trial CBR tests also, a soaked CBR of 8% is suggested for design purposes. Analysis of test results from the three gravel quarries identified for NH 47 and one for NH 47/B intended for sub-bases indicates a soaked CBR value of above 8. Hence in-situ gravel from these quarries could also be considered for the respective packages. For comprehensive details, reference shall be made to Material Report.
7.0 ENVIRONMENTAL IMPACT ASSESSMENT AND MANAGEMENT PLAN
7.1 Project Area
This report is Project Specific and covers the environmental issues within ROW, though their impacts have been assessed up to the aerial distance of 10 km on both sides of road. The project is divided into two packages and the present study deals with Package-II (starting from km 43/000 to km 96/714 along NH 47 and km 0.000 to km 16.376 along NH 47B) in the Tamil Nadu State.
7.2 Objectives
The objectives of the EIA include:
• Collection of baseline data on various components of the environment.
• Determination of magnitude of environmental impacts so that due consideration is given to them during planning, construction and operational phases of the project.
• Assessment of the socio-economic conditions of the project affected persons and suggestions for their improvement.
• Identification of areas and aspects, which are environmentally or socio-economically significant.
• Submission of Environmental Enhancement Plan and Environmental Management Plans for enhancing and mitigating the negative impacts.
• Development of the road alignment in such a way that the environment and settlements are least affected.
• Presentation of public view on various environmental and socio-economic aspects of the project.
7.3 Major Negative Impacts and their Mitigation
The major direct environmental impacts and their mitigation measures required to be implemented are given in Table 7.1 below:
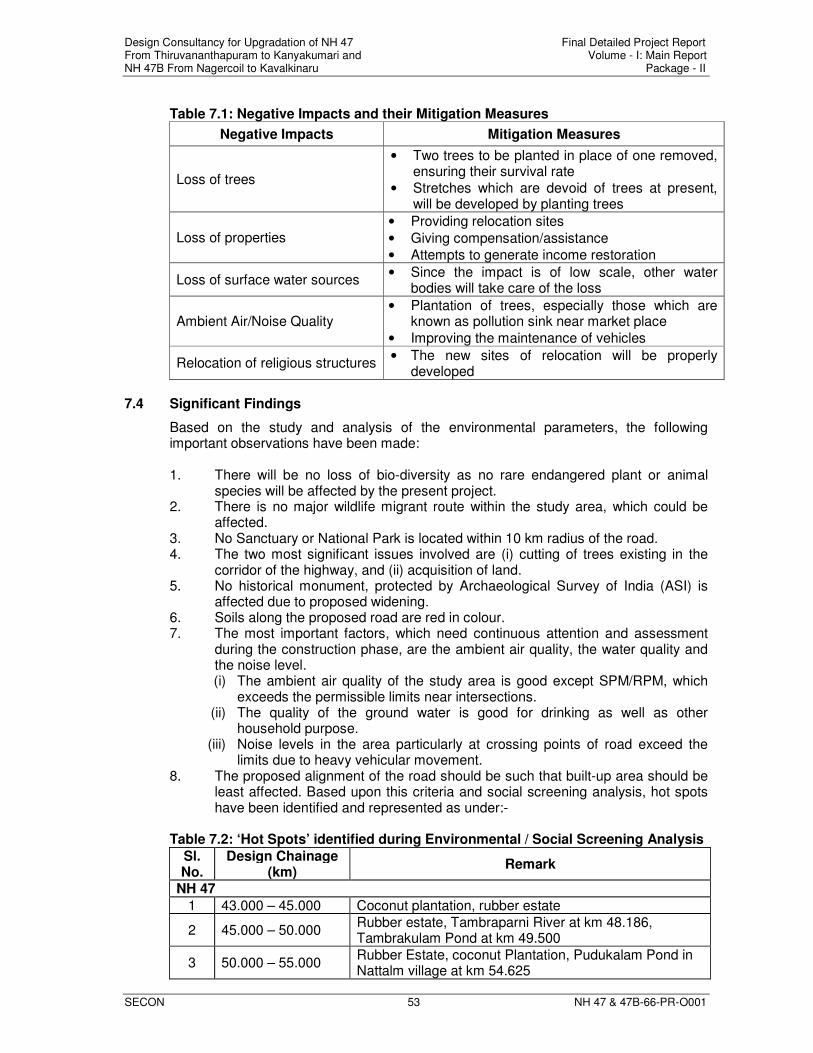
Design Consultancy for Upgradation of NH 47 Final Detailed Project Report From Thiruvananthapuram to Kanyakumari and Volume - I: Main Report NH 47B From Nagercoil to Kavalkinaru Package - II
SECON 53 NH 47 & 47B-66-PR-O001
Table 7.1: Negative Impacts and their Mitigation Measures
Negative Impacts Mitigation Measures
Loss of trees
• Two trees to be planted in place of one removed, ensuring their survival rate
• Stretches which are devoid of trees at present, will be developed by planting trees
Loss of properties • Providing relocation sites
• Giving compensation/assistance
• Attempts to generate income restoration
Loss of surface water sources • Since the impact is of low scale, other water
bodies will take care of the loss
Ambient Air/Noise Quality • Plantation of trees, especially those which are
known as pollution sink near market place
• Improving the maintenance of vehicles
Relocation of religious structures • The new sites of relocation will be properly
developed 7.4 Significant Findings
Based on the study and analysis of the environmental parameters, the following important observations have been made:
1. There will be no loss of bio-diversity as no rare endangered plant or animal
species will be affected by the present project. 2. There is no major wildlife migrant route within the study area, which could be
affected. 3. No Sanctuary or National Park is located within 10 km radius of the road. 4. The two most significant issues involved are (i) cutting of trees existing in the
corridor of the highway, and (ii) acquisition of land. 5. No historical monument, protected by Archaeological Survey of India (ASI) is
affected due to proposed widening. 6. Soils along the proposed road are red in colour. 7. The most important factors, which need continuous attention and assessment
during the construction phase, are the ambient air quality, the water quality and the noise level. (i) The ambient air quality of the study area is good except SPM/RPM, which
exceeds the permissible limits near intersections. (ii) The quality of the ground water is good for drinking as well as other
household purpose. (iii) Noise levels in the area particularly at crossing points of road exceed the
limits due to heavy vehicular movement. 8. The proposed alignment of the road should be such that built-up area should be
least affected. Based upon this criteria and social screening analysis, hot spots have been identified and represented as under:-
Table 7.2: ‘Hot Spots’ identified during Environmental / Social Screening Analysis
Sl. No.
Design Chainage (km)
Remark
NH 47
1 43.000 – 45.000 Coconut plantation, rubber estate
2 45.000 – 50.000 Rubber estate, Tambraparni River at km 48.186, Tambrakulam Pond at km 49.500
3 50.000 – 55.000 Rubber Estate, coconut Plantation, Pudukalam Pond in Nattalm village at km 54.625
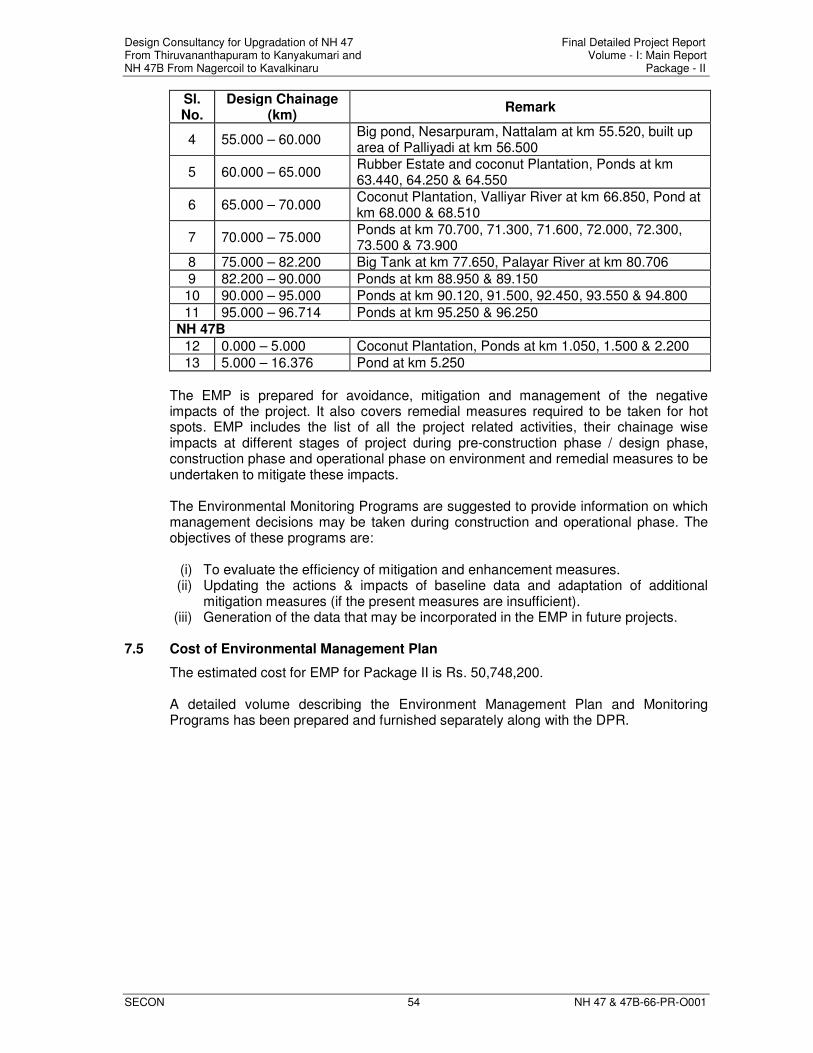
Design Consultancy for Upgradation of NH 47 Final Detailed Project Report From Thiruvananthapuram to Kanyakumari and Volume - I: Main Report NH 47B From Nagercoil to Kavalkinaru Package - II
SECON 54 NH 47 & 47B-66-PR-O001
Sl. No.
Design Chainage (km)
Remark
4 55.000 – 60.000 Big pond, Nesarpuram, Nattalam at km 55.520, built up area of Palliyadi at km 56.500
5 60.000 – 65.000 Rubber Estate and coconut Plantation, Ponds at km 63.440, 64.250 & 64.550
6 65.000 – 70.000 Coconut Plantation, Valliyar River at km 66.850, Pond at km 68.000 & 68.510
7 70.000 – 75.000 Ponds at km 70.700, 71.300, 71.600, 72.000, 72.300, 73.500 & 73.900
8 75.000 – 82.200 Big Tank at km 77.650, Palayar River at km 80.706
9 82.200 – 90.000 Ponds at km 88.950 & 89.150
10 90.000 – 95.000 Ponds at km 90.120, 91.500, 92.450, 93.550 & 94.800
11 95.000 – 96.714 Ponds at km 95.250 & 96.250
NH 47B
12 0.000 – 5.000 Coconut Plantation, Ponds at km 1.050, 1.500 & 2.200
13 5.000 – 16.376 Pond at km 5.250
The EMP is prepared for avoidance, mitigation and management of the negative impacts of the project. It also covers remedial measures required to be taken for hot spots. EMP includes the list of all the project related activities, their chainage wise impacts at different stages of project during pre-construction phase / design phase, construction phase and operational phase on environment and remedial measures to be undertaken to mitigate these impacts. The Environmental Monitoring Programs are suggested to provide information on which management decisions may be taken during construction and operational phase. The objectives of these programs are:
(i) To evaluate the efficiency of mitigation and enhancement measures. (ii) Updating the actions & impacts of baseline data and adaptation of additional
mitigation measures (if the present measures are insufficient). (iii) Generation of the data that may be incorporated in the EMP in future projects.
7.5 Cost of Environmental Management Plan
The estimated cost for EMP for Package II is Rs. 50,748,200. A detailed volume describing the Environment Management Plan and Monitoring Programs has been prepared and furnished separately along with the DPR.
Design Consultancy for Upgradation of NH 47 Final Detailed Project Report From Thiruvananthapuram to Kanyakumari and Volume - I: Main Report NH 47B From Nagercoil to Kavalkinaru Package - II
SECON 55 NH 47 & 47B-66-PR-O001
8.0 RESETTLEMENT ACTION PLAN
8.1 Description of Project
The existing NH 47 from Thiruvananthapuram to Kanyakumari is 2-Lane carriageway and presently the traffic on this road is much more than the capacity. Most of the road length has continuous built-up area very close to the road. The existing NH 47B from Nagercoil to Kavalkinaru is also 2-Lane carriageway. Geometrics of both the road sections are not up to the standards as per IRC for National Highways. In order to decongest the existing NH 47 within Thiruvananthapuram city, bypass for a length of 22.6km has already been constructed. Beyond the city limits, widening of the existing NH was investigated in detail, but ruled out due to large cale demolition involved. Hence, it was decided to adopt a new alignment for about 95% of road length except existing Thiruvananthapuram Bypass. The project road starts at Kazhakkottam, about 10 km North of Thiruvananthapuram city, on existing NH 47 (km 552/00) which is reckoned as km 00/000 for the project. The road further continues on the existing Thiruvananthapuram Bypass up to km 22/600 and traverses through cross country crossing Kerala/Tamil Nadu Border at Karode village at design Chainage of km 43/000. It is aligned cross country in Tamil Nadu state and rejoins the existing NH 47 at km 626/187 (existing chainage) and again deviates at 627/000 (existing chainage) bypassing Chungankadai, Nagercoil and Suchindram rejoining the existing NH 47 at km 642/800. From km 642/800 it follows the existing road up to km 646/238 and deviates on RHS for bypassing Kottaram built-up area and joins NH 7 at Kanyakumari Bypass (km 231/653 of NH7). NH 47B from Nagercoil to Kavalkinaru where it joins NH 7 has been provided with a new alignment except for an initial length of 600m. It starts near the junction of Nagercoil Bypass (km 82/181 of NH 47) and existing NH 47B. M/s. SECON Pvt. Ltd has been entrusted for preparation of Detailed Project Report for both stretches as a combined project The report is Project Specific and covers the Resettlement Action Plan for the affected people along the proposed ROW.
The project is divided into two packages. Package I pertains to the road stretch falling in Kerala State and Package II for Tamil Nadu area. This report is pertaining to Package II i.e. from Karode (Kerala/Tamil Nadu Border) to Kanyakumari (End of Kottaram Bypass joining with Proposed NH 7 Bypass for Kanyakumari) and NH 47B from Nagercoil to Kavalkinaru in the State of Tamil Nadu.
8.2 Objectives
The resettlement plan has been prepared keeping the following broad objectives:-
• The negative impact on persons affected by the project would be avoided or minimized.
• Affected people and the beneficiary population will be informed and consulted about the project and its design where the negative impacts are unavoidable.
• The Project-Affected Persons (PAPs) will be assisted in improving or regaining their standard of living.
• People’s Opinion will be considered in planning and implementation of the project.
• All information related to resettlement plan and implementation will be disclosed to PAP’s.
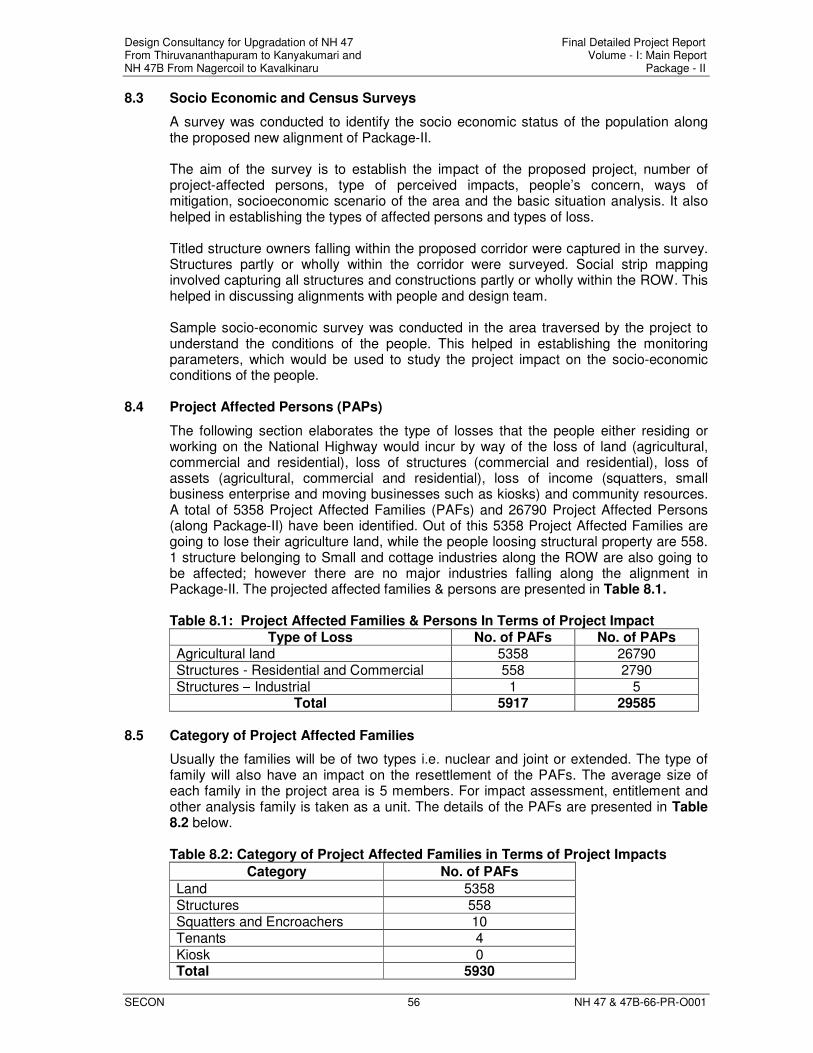
Design Consultancy for Upgradation of NH 47 Final Detailed Project Report From Thiruvananthapuram to Kanyakumari and Volume - I: Main Report NH 47B From Nagercoil to Kavalkinaru Package - II
SECON 56 NH 47 & 47B-66-PR-O001
8.3 Socio Economic and Census Surveys
A survey was conducted to identify the socio economic status of the population along the proposed new alignment of Package-II. The aim of the survey is to establish the impact of the proposed project, number of project-affected persons, type of perceived impacts, people’s concern, ways of mitigation, socioeconomic scenario of the area and the basic situation analysis. It also helped in establishing the types of affected persons and types of loss. Titled structure owners falling within the proposed corridor were captured in the survey. Structures partly or wholly within the corridor were surveyed. Social strip mapping involved capturing all structures and constructions partly or wholly within the ROW. This helped in discussing alignments with people and design team. Sample socio-economic survey was conducted in the area traversed by the project to understand the conditions of the people. This helped in establishing the monitoring parameters, which would be used to study the project impact on the socio-economic conditions of the people.
8.4 Project Affected Persons (PAPs)
The following section elaborates the type of losses that the people either residing or working on the National Highway would incur by way of the loss of land (agricultural, commercial and residential), loss of structures (commercial and residential), loss of assets (agricultural, commercial and residential), loss of income (squatters, small business enterprise and moving businesses such as kiosks) and community resources. A total of 5358 Project Affected Families (PAFs) and 26790 Project Affected Persons (along Package-II) have been identified. Out of this 5358 Project Affected Families are going to lose their agriculture land, while the people loosing structural property are 558. 1 structure belonging to Small and cottage industries along the ROW are also going to be affected; however there are no major industries falling along the alignment in Package-II. The projected affected families & persons are presented in Table 8.1. Table 8.1: Project Affected Families & Persons In Terms of Project Impact
Type of Loss No. of PAFs No. of PAPs Agricultural land 5358 26790 Structures - Residential and Commercial 558 2790
Structures – Industrial 1 5 Total 5917 29585
8.5 Category of Project Affected Families
Usually the families will be of two types i.e. nuclear and joint or extended. The type of family will also have an impact on the resettlement of the PAFs. The average size of each family in the project area is 5 members. For impact assessment, entitlement and other analysis family is taken as a unit. The details of the PAFs are presented in Table 8.2 below.
Table 8.2: Category of Project Affected Families in Terms of Project Impacts
Category No. of PAFs
Land 5358
Structures 558 Squatters and Encroachers 10 Tenants 4
Kiosk 0 Total 5930
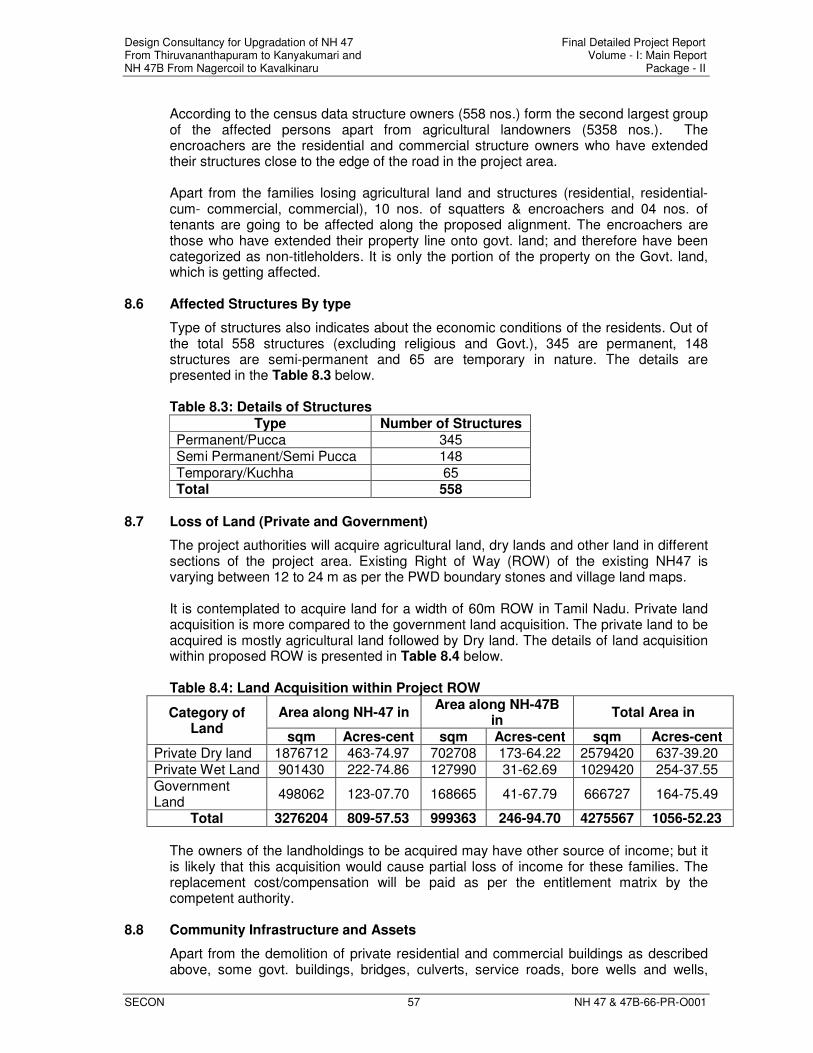
Design Consultancy for Upgradation of NH 47 Final Detailed Project Report From Thiruvananthapuram to Kanyakumari and Volume - I: Main Report NH 47B From Nagercoil to Kavalkinaru Package - II
SECON 57 NH 47 & 47B-66-PR-O001
According to the census data structure owners (558 nos.) form the second largest group of the affected persons apart from agricultural landowners (5358 nos.). The encroachers are the residential and commercial structure owners who have extended their structures close to the edge of the road in the project area.
Apart from the families losing agricultural land and structures (residential, residential-cum- commercial, commercial), 10 nos. of squatters & encroachers and 04 nos. of tenants are going to be affected along the proposed alignment. The encroachers are those who have extended their property line onto govt. land; and therefore have been categorized as non-titleholders. It is only the portion of the property on the Govt. land, which is getting affected.
8.6 Affected Structures By type
Type of structures also indicates about the economic conditions of the residents. Out of the total 558 structures (excluding religious and Govt.), 345 are permanent, 148 structures are semi-permanent and 65 are temporary in nature. The details are presented in the Table 8.3 below.
Table 8.3: Details of Structures
Type Number of Structures Permanent/Pucca 345 Semi Permanent/Semi Pucca 148
Temporary/Kuchha 65 Total 558
8.7 Loss of Land (Private and Government)
The project authorities will acquire agricultural land, dry lands and other land in different sections of the project area. Existing Right of Way (ROW) of the existing NH47 is varying between 12 to 24 m as per the PWD boundary stones and village land maps. It is contemplated to acquire land for a width of 60m ROW in Tamil Nadu. Private land acquisition is more compared to the government land acquisition. The private land to be acquired is mostly agricultural land followed by Dry land. The details of land acquisition within proposed ROW is presented in Table 8.4 below.
Table 8.4: Land Acquisition within Project ROW
Category of Land
Area along NH-47 in Area along NH-47B
in Total Area in
sqm Acres-cent sqm Acres-cent sqm Acres-cent Private Dry land 1876712 463-74.97 702708 173-64.22 2579420 637-39.20 Private Wet Land 901430 222-74.86 127990 31-62.69 1029420 254-37.55 Government Land
498062 123-07.70 168665 41-67.79 666727 164-75.49
Total 3276204 809-57.53 999363 246-94.70 4275567 1056-52.23
The owners of the landholdings to be acquired may have other source of income; but it is likely that this acquisition would cause partial loss of income for these families. The replacement cost/compensation will be paid as per the entitlement matrix by the competent authority.
8.8 Community Infrastructure and Assets
Apart from the demolition of private residential and commercial buildings as described above, some govt. buildings, bridges, culverts, service roads, bore wells and wells,
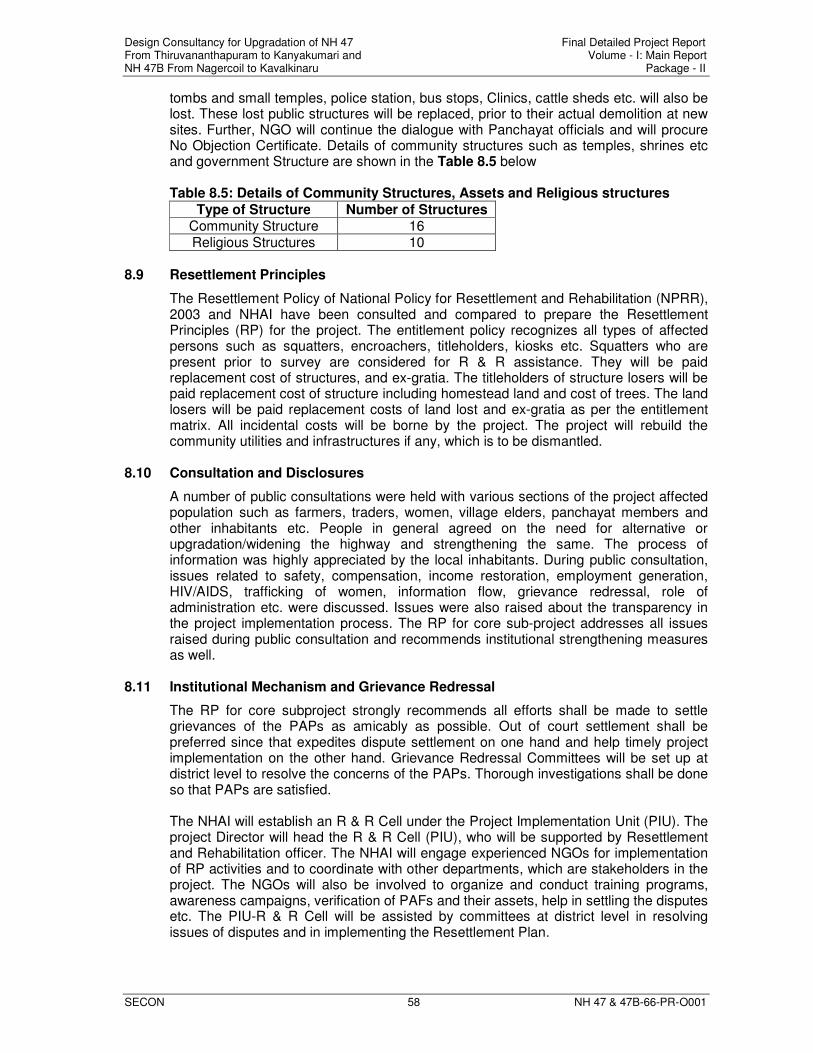
Design Consultancy for Upgradation of NH 47 Final Detailed Project Report From Thiruvananthapuram to Kanyakumari and Volume - I: Main Report NH 47B From Nagercoil to Kavalkinaru Package - II
SECON 58 NH 47 & 47B-66-PR-O001
tombs and small temples, police station, bus stops, Clinics, cattle sheds etc. will also be lost. These lost public structures will be replaced, prior to their actual demolition at new sites. Further, NGO will continue the dialogue with Panchayat officials and will procure No Objection Certificate. Details of community structures such as temples, shrines etc and government Structure are shown in the Table 8.5 below
Table 8.5: Details of Community Structures, Assets and Religious structures
Type of Structure Number of Structures Community Structure 16 Religious Structures 10
8.9 Resettlement Principles
The Resettlement Policy of National Policy for Resettlement and Rehabilitation (NPRR), 2003 and NHAI have been consulted and compared to prepare the Resettlement Principles (RP) for the project. The entitlement policy recognizes all types of affected persons such as squatters, encroachers, titleholders, kiosks etc. Squatters who are present prior to survey are considered for R & R assistance. They will be paid replacement cost of structures, and ex-gratia. The titleholders of structure losers will be paid replacement cost of structure including homestead land and cost of trees. The land losers will be paid replacement costs of land lost and ex-gratia as per the entitlement matrix. All incidental costs will be borne by the project. The project will rebuild the community utilities and infrastructures if any, which is to be dismantled.
8.10 Consultation and Disclosures
A number of public consultations were held with various sections of the project affected population such as farmers, traders, women, village elders, panchayat members and other inhabitants etc. People in general agreed on the need for alternative or upgradation/widening the highway and strengthening the same. The process of information was highly appreciated by the local inhabitants. During public consultation, issues related to safety, compensation, income restoration, employment generation, HIV/AIDS, trafficking of women, information flow, grievance redressal, role of administration etc. were discussed. Issues were also raised about the transparency in the project implementation process. The RP for core sub-project addresses all issues raised during public consultation and recommends institutional strengthening measures as well.
8.11 Institutional Mechanism and Grievance Redressal
The RP for core subproject strongly recommends all efforts shall be made to settle grievances of the PAPs as amicably as possible. Out of court settlement shall be preferred since that expedites dispute settlement on one hand and help timely project implementation on the other hand. Grievance Redressal Committees will be set up at district level to resolve the concerns of the PAPs. Thorough investigations shall be done so that PAPs are satisfied.
The NHAI will establish an R & R Cell under the Project Implementation Unit (PIU). The project Director will head the R & R Cell (PIU), who will be supported by Resettlement and Rehabilitation officer. The NHAI will engage experienced NGOs for implementation of RP activities and to coordinate with other departments, which are stakeholders in the project. The NGOs will also be involved to organize and conduct training programs, awareness campaigns, verification of PAFs and their assets, help in settling the disputes etc. The PIU-R & R Cell will be assisted by committees at district level in resolving issues of disputes and in implementing the Resettlement Plan.
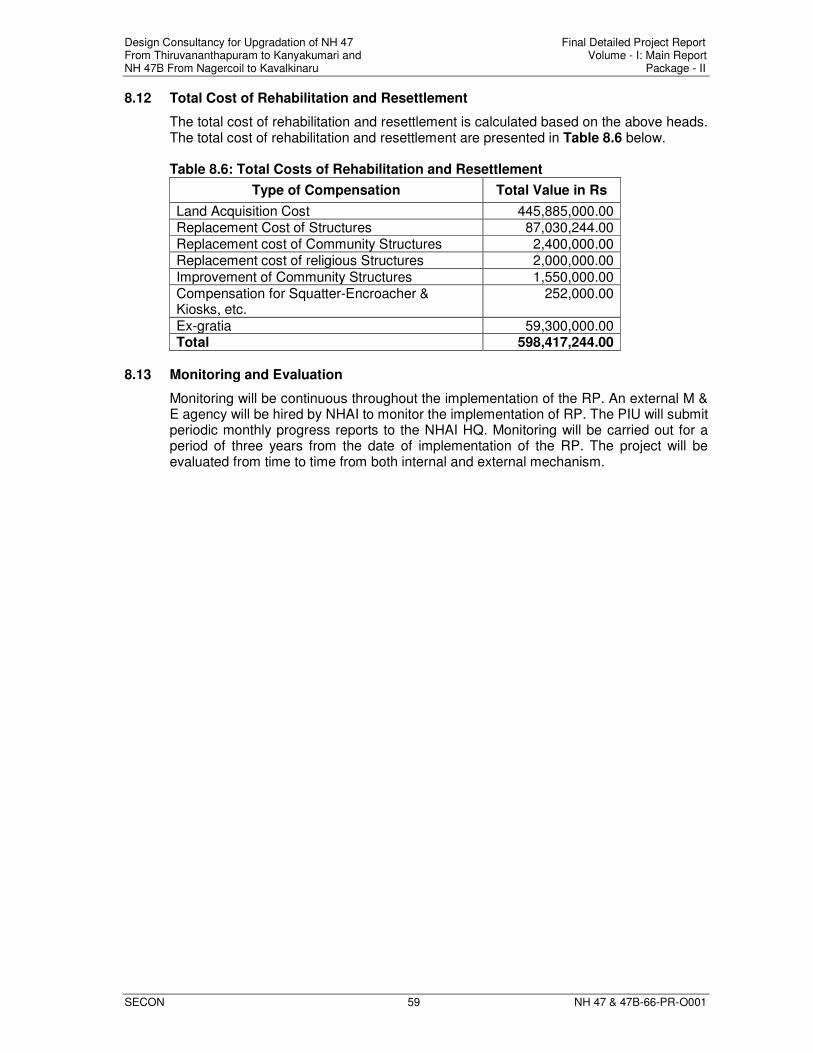
Design Consultancy for Upgradation of NH 47 Final Detailed Project Report From Thiruvananthapuram to Kanyakumari and Volume - I: Main Report NH 47B From Nagercoil to Kavalkinaru Package - II
SECON 59 NH 47 & 47B-66-PR-O001
8.12 Total Cost of Rehabilitation and Resettlement
The total cost of rehabilitation and resettlement is calculated based on the above heads. The total cost of rehabilitation and resettlement are presented in Table 8.6 below.
Table 8.6: Total Costs of Rehabilitation and Resettlement
Type of Compensation Total Value in Rs
Land Acquisition Cost 445,885,000.00 Replacement Cost of Structures 87,030,244.00 Replacement cost of Community Structures 2,400,000.00 Replacement cost of religious Structures 2,000,000.00
Improvement of Community Structures 1,550,000.00 Compensation for Squatter-Encroacher & Kiosks, etc.
252,000.00
Ex-gratia 59,300,000.00 Total 598,417,244.00
8.13 Monitoring and Evaluation
Monitoring will be continuous throughout the implementation of the RP. An external M & E agency will be hired by NHAI to monitor the implementation of RP. The PIU will submit periodic monthly progress reports to the NHAI HQ. Monitoring will be carried out for a period of three years from the date of implementation of the RP. The project will be evaluated from time to time from both internal and external mechanism.
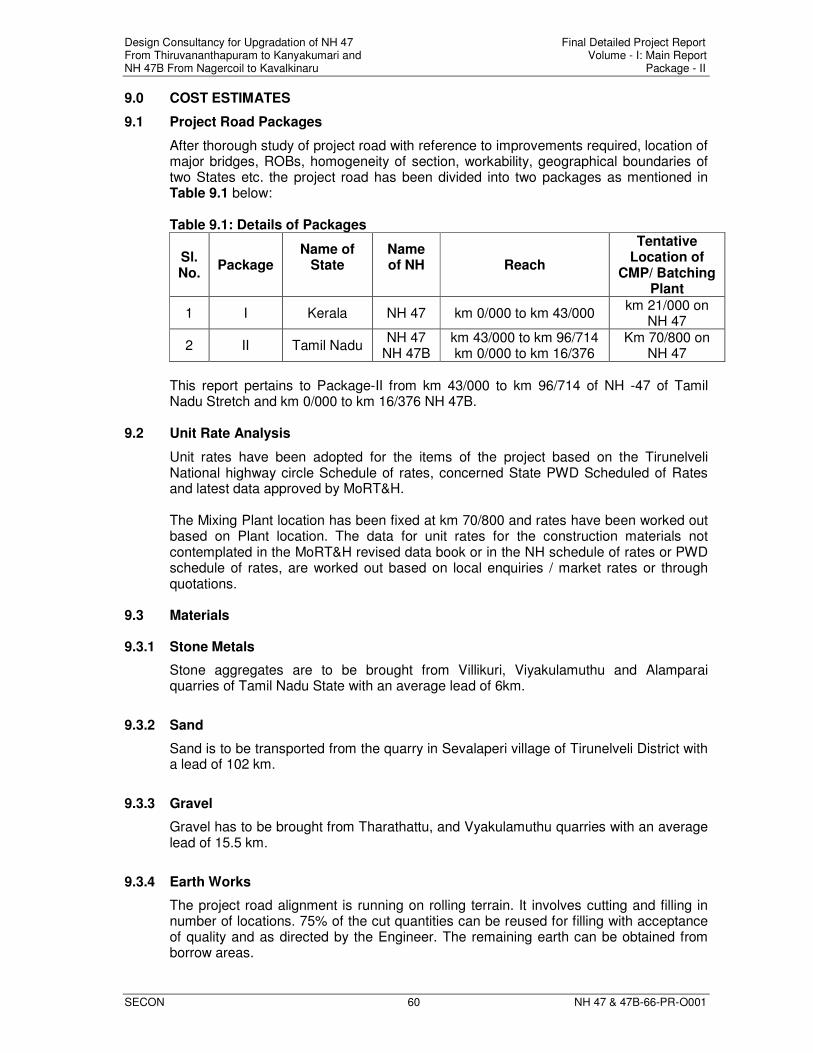
Design Consultancy for Upgradation of NH 47 Final Detailed Project Report From Thiruvananthapuram to Kanyakumari and Volume - I: Main Report NH 47B From Nagercoil to Kavalkinaru Package - II
SECON 60 NH 47 & 47B-66-PR-O001
9.0 COST ESTIMATES
9.1 Project Road Packages
After thorough study of project road with reference to improvements required, location of major bridges, ROBs, homogeneity of section, workability, geographical boundaries of two States etc. the project road has been divided into two packages as mentioned in Table 9.1 below:
Table 9.1: Details of Packages
Sl. No.
Package Name of
State
Name of NH
Reach
Tentative Location of
CMP/ Batching Plant
1 I Kerala NH 47 km 0/000 to km 43/000 km 21/000 on
NH 47
2 II Tamil Nadu NH 47
NH 47B km 43/000 to km 96/714 km 0/000 to km 16/376
Km 70/800 on NH 47
This report pertains to Package-II from km 43/000 to km 96/714 of NH -47 of Tamil Nadu Stretch and km 0/000 to km 16/376 NH 47B.
9.2 Unit Rate Analysis
Unit rates have been adopted for the items of the project based on the Tirunelveli National highway circle Schedule of rates, concerned State PWD Scheduled of Rates and latest data approved by MoRT&H.
The Mixing Plant location has been fixed at km 70/800 and rates have been worked out based on Plant location. The data for unit rates for the construction materials not contemplated in the MoRT&H revised data book or in the NH schedule of rates or PWD schedule of rates, are worked out based on local enquiries / market rates or through quotations.
9.3 Materials
9.3.1 Stone Metals
Stone aggregates are to be brought from Villikuri, Viyakulamuthu and Alamparai quarries of Tamil Nadu State with an average lead of 6km.
9.3.2 Sand
Sand is to be transported from the quarry in Sevalaperi village of Tirunelveli District with a lead of 102 km.
9.3.3 Gravel
Gravel has to be brought from Tharathattu, and Vyakulamuthu quarries with an average lead of 15.5 km.
9.3.4 Earth Works
The project road alignment is running on rolling terrain. It involves cutting and filling in number of locations. 75% of the cut quantities can be reused for filling with acceptance of quality and as directed by the Engineer. The remaining earth can be obtained from borrow areas.
Design Consultancy for Upgradation of NH 47 Final Detailed Project Report From Thiruvananthapuram to Kanyakumari and Volume - I: Main Report NH 47B From Nagercoil to Kavalkinaru Package - II
SECON 61 NH 47 & 47B-66-PR-O001
9.3.5 Cement
Market rates prevailing in Tamil Nadu have been adopted in the project road.
9.3.6 Steel
Market rates prevailing in Tamil Nadu has been adopted.
As the project road runs in coastal area from beginning to end and the structures are subject to severe corrosion, it is proposed to provide anti corrosive coating to all the steel used in RCC structures. Only High Corrosion Resistance Material Steel reinforcement shall be used for all the structures.
9.3.7 Bitumen
Rates for various grades of Bitumen including emulsions have been obtained from nearest Oil Companies and used in rate analysis.
9.3.8 Labour
Rates for all skilled and unskilled labour are based on NH schedule of rates or PWD schedule of rates.
9.3.9 User charges for machineries
Rate of hire charges of modern machineries and plants for road and bridge works are based on the NH schedule of rates as per latest MoSRT&H guidelines.
9.3.10 Rates for RE Wall and Soil Nailing
For high embankments rate of RE wall is adopted as per rate analysis. In high cut portions Soil Nailing is proposed and the rates upto 8m height, upto 12m height and upto 16m height are analysed. The rates are analysed based on the services provided by specialized and approved contractors.
9.3.11 Unit Rate Analysis
Unit rate analysis for various items of work for the road and bridge works have been done as per MoSRT&H Data Book based on the rates for material, labour and hire charges for machinery, giving allowance for Contractor’s profit and overheads.
9.4 Unit Cost
9.4.1 Estimation / Value of quantities for Road work
Typical cross sections have been prepared for the following types of widening:
1. Concentric widening of existing two lane road to four lane with central median, paved and earthen shoulders service roads, drains etc.
2. One side widening of the existing two lane to four lane width with paved and
earthen shoulders with a provision of open drain in between main carriageway and service roads.
3. Construction of new four lane divided carriageway with paved and earthen
shoulders on either side with service roads at identified locations.
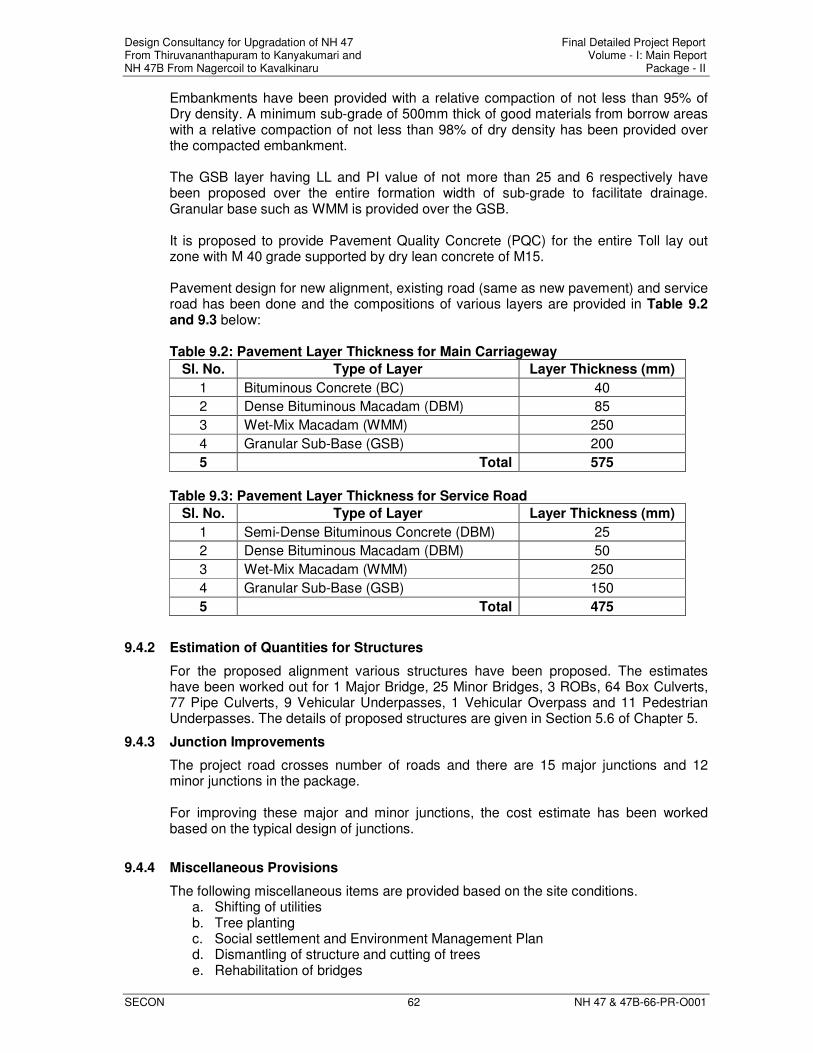
Design Consultancy for Upgradation of NH 47 Final Detailed Project Report From Thiruvananthapuram to Kanyakumari and Volume - I: Main Report NH 47B From Nagercoil to Kavalkinaru Package - II
SECON 62 NH 47 & 47B-66-PR-O001
Embankments have been provided with a relative compaction of not less than 95% of Dry density. A minimum sub-grade of 500mm thick of good materials from borrow areas with a relative compaction of not less than 98% of dry density has been provided over the compacted embankment. The GSB layer having LL and PI value of not more than 25 and 6 respectively have been proposed over the entire formation width of sub-grade to facilitate drainage. Granular base such as WMM is provided over the GSB. It is proposed to provide Pavement Quality Concrete (PQC) for the entire Toll lay out zone with M 40 grade supported by dry lean concrete of M15. Pavement design for new alignment, existing road (same as new pavement) and service road has been done and the compositions of various layers are provided in Table 9.2 and 9.3 below:
Table 9.2: Pavement Layer Thickness for Main Carriageway
Sl. No. Type of Layer Layer Thickness (mm)
1 Bituminous Concrete (BC) 40
2 Dense Bituminous Macadam (DBM) 85
3 Wet-Mix Macadam (WMM) 250
4 Granular Sub-Base (GSB) 200
5 Total 575
Table 9.3: Pavement Layer Thickness for Service Road
Sl. No. Type of Layer Layer Thickness (mm)
1 Semi-Dense Bituminous Concrete (DBM) 25
2 Dense Bituminous Macadam (DBM) 50
3 Wet-Mix Macadam (WMM) 250
4 Granular Sub-Base (GSB) 150
5 Total 475
9.4.2 Estimation of Quantities for Structures
For the proposed alignment various structures have been proposed. The estimates have been worked out for 1 Major Bridge, 25 Minor Bridges, 3 ROBs, 64 Box Culverts, 77 Pipe Culverts, 9 Vehicular Underpasses, 1 Vehicular Overpass and 11 Pedestrian Underpasses. The details of proposed structures are given in Section 5.6 of Chapter 5.
9.4.3 Junction Improvements
The project road crosses number of roads and there are 15 major junctions and 12 minor junctions in the package.
For improving these major and minor junctions, the cost estimate has been worked based on the typical design of junctions.
9.4.4 Miscellaneous Provisions
The following miscellaneous items are provided based on the site conditions. a. Shifting of utilities b. Tree planting c. Social settlement and Environment Management Plan d. Dismantling of structure and cutting of trees e. Rehabilitation of bridges
Design Consultancy for Upgradation of NH 47 Final Detailed Project Report From Thiruvananthapuram to Kanyakumari and Volume - I: Main Report NH 47B From Nagercoil to Kavalkinaru Package - II
SECON 63 NH 47 & 47B-66-PR-O001
f. Repair and maintenance of road g. Turfing h. Road furnitures i. Rest area and truck parking j. Telephone booth k. Providing diversions during construction l. Toll plaza m. Bus shelter n. KM / HM boundary stone o. Revetment with granular backing p. Filling of Wells q. Fencing r. Vehicular underpass / over pass s. Rainwater harvesting in built up area t. Stone pitching on high embankment slope u. Side Drain etc.
9.4.5 Land Acquisition and Compensation for Structures
Rate / acre of land is assessed from prevailing market rate by local enquiry which has been verified with Registration Department and is adopted in cost estimate.
The total cost of Land Acquisition based on the market rate and compensation for structures based on the RAP has been summarised in Table 9.4 below.
Table 9.4: Cost for Land Acquisition and Structure
Total Cost of Land (in million)
Cost of Structure (in million)
Total Cost of Land and Structure (in million)
445.885 92.980 538.865
9.4.6 Contingencies
A provision of 3 % of the construction cost has been considered as unforseen contingency items. The following items have been brought under the head of contingency.
� Variation in project length during actual execution. � Variation in cutting earth, rock, excavation requiring blasting � Variation in pavement quantities as per final pavement design based on CBR values
and BBD study during construction. � Variation in foundation depth of CD and bridge works after detailed study. � Variation in revetment on hill side after detailed study. � Variation in land acquisition cost as per detailed land plan schedule. � Variation in cost of social settlement after detailed study. � Unforeseen items. � Variation in other components and miscellaneous items.
9.4.7 Construction Supervision
As it is a major road project, it is absolutely necessary to have an independent agency to supervise the execution of project package. This may consist of appointing a consultant with qualified engineers for effective supervision at the construction stage of project. They should be provided with administration staff, office, accommodation, vehicles, furniture, stationary etc. Hence provision of 6% of project cost is made for construction supervision.
Design Consultancy for Upgradation of NH 47 Final Detailed Project Report From Thiruvananthapuram to Kanyakumari and Volume - I: Main Report NH 47B From Nagercoil to Kavalkinaru Package - II
SECON 64 NH 47 & 47B-66-PR-O001
9.4.8 Landscaping
To make certain locations free from eyesore, provision for landscaping has been made @ 1% of the construction cost.
9.5 Project cost for Package
The total project cost for the package as a whole has been worked out by taking in to account the sum of Road Work, Structures such as Major Bridges, Minor Bridges, Culverts, ROBs, Vehicular Underpasses/Overpasses and Pedestrian Underpasses etc., Junction improvements, Miscellaneous provisions, Land Acquisition, Compensation for Structures, contingencies, Q.C charges & Construction Supervision and Landscaping.
Total Estimated Project Cost for Package II is Rs. 851.05 Crores.
The work on above packages is expected to commence by mid 2008 and programmed for completion within 30 months in phases as given below:
1st Year = 30 % 2nd Year = 50 % 3rd Year = 20 % 10.0 ECONOMIC ANALYSIS
10.1 Introduction
Economic evaluation is carried out to assess whether the proposed investment on highway improvement is economically acceptable or not. In other words, the objective of the appraisal is to evaluate if the investment proposed enhances or leads to maximization of social welfare of the community in the hinterland or not. The yardstick to measure such economic viability is usually in terms of Economic Internal Rate of Return (EIRR). As per the TOR, we have estimated Net Present Value (NPV) as well as Benefit Cost Ratio (B/C Ratio) indicators, in order to evaluate the viability in a comprehensive manner. The project is different in nature when it is compared with other routine projects. However it is assumed that by providing alternate alignment to existing road it will serve the benefits in both ways,
(i) it reduces the VOC on the existing road as traffic is being diverted on to the new road
(ii) it reduces the extent of demolition of structures along the existing road. 10.2 Evaluation Framework
Economic evaluation has been carried out within the framework of cost-benefit analysis technique that is widely used in the appraisal of public investment projects. The analysis was carried out for both “with” and “without” project conditions. The Guidelines of MOST, GOI i.e. IRC-SP-30, revised in 1993 and the Study for updating road user cost data, 2001 carried out by CRRI for the MoRT&H, GOI have been followed in this evaluation.
The evaluation is carried out by adopting incremental cost analysis with discounting cash flow technique. The financial cost is converted into economic cost by adopting shadow pricing factor as recommended in IRC SP 30 Manual. The updated Road User Cost Study of MoRT&H carried out by CRRI, 2001 has been followed in estimating the economic benefits. Benefits considered are savings in Vehicle Operating Cost (VOC) and savings in value of time arising out of the proposed road widening, strengthening and improvement from 2 lanes to 4 lanes configuration. Annual maintenance and periodic maintenance like overlay has been considered. The incremental cost and
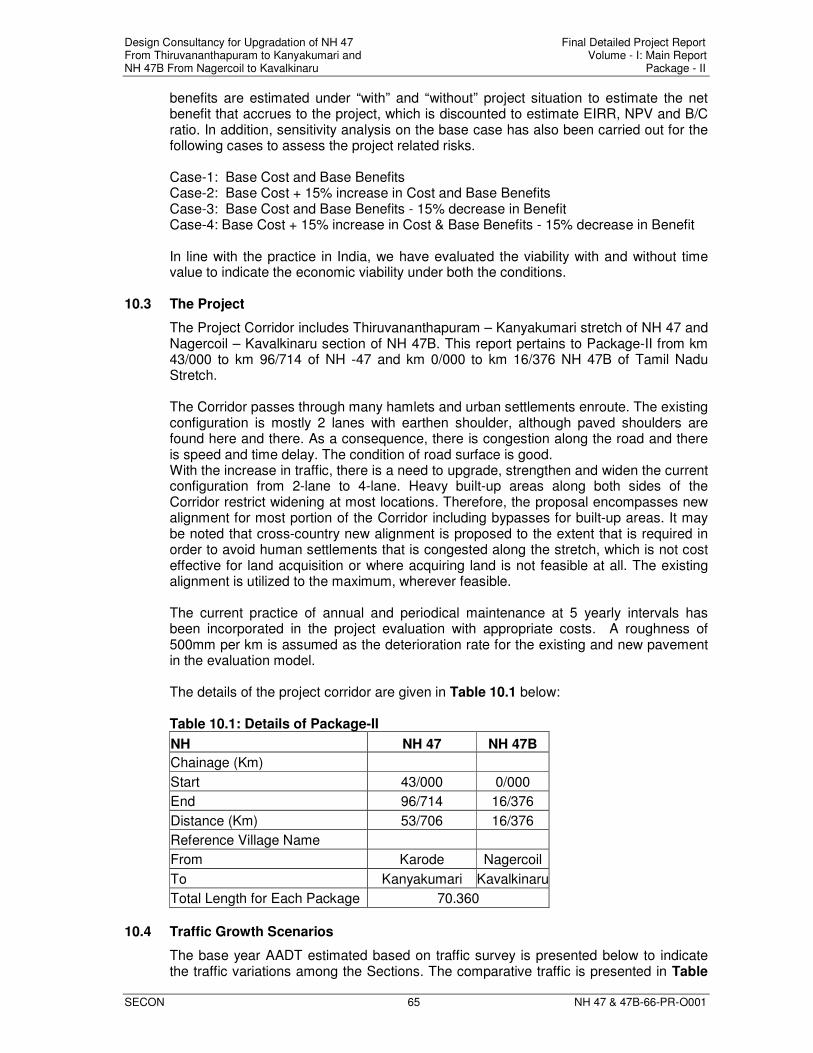
Design Consultancy for Upgradation of NH 47 Final Detailed Project Report From Thiruvananthapuram to Kanyakumari and Volume - I: Main Report NH 47B From Nagercoil to Kavalkinaru Package - II
SECON 65 NH 47 & 47B-66-PR-O001
benefits are estimated under “with” and “without” project situation to estimate the net benefit that accrues to the project, which is discounted to estimate EIRR, NPV and B/C ratio. In addition, sensitivity analysis on the base case has also been carried out for the following cases to assess the project related risks.
Case-1: Base Cost and Base Benefits Case-2: Base Cost + 15% increase in Cost and Base Benefits Case-3: Base Cost and Base Benefits - 15% decrease in Benefit Case-4: Base Cost + 15% increase in Cost & Base Benefits - 15% decrease in Benefit
In line with the practice in India, we have evaluated the viability with and without time value to indicate the economic viability under both the conditions.
10.3 The Project
The Project Corridor includes Thiruvananthapuram – Kanyakumari stretch of NH 47 and Nagercoil – Kavalkinaru section of NH 47B. This report pertains to Package-II from km 43/000 to km 96/714 of NH -47 and km 0/000 to km 16/376 NH 47B of Tamil Nadu Stretch.
The Corridor passes through many hamlets and urban settlements enroute. The existing configuration is mostly 2 lanes with earthen shoulder, although paved shoulders are found here and there. As a consequence, there is congestion along the road and there is speed and time delay. The condition of road surface is good. With the increase in traffic, there is a need to upgrade, strengthen and widen the current configuration from 2-lane to 4-lane. Heavy built-up areas along both sides of the Corridor restrict widening at most locations. Therefore, the proposal encompasses new alignment for most portion of the Corridor including bypasses for built-up areas. It may be noted that cross-country new alignment is proposed to the extent that is required in order to avoid human settlements that is congested along the stretch, which is not cost effective for land acquisition or where acquiring land is not feasible at all. The existing alignment is utilized to the maximum, wherever feasible.
The current practice of annual and periodical maintenance at 5 yearly intervals has been incorporated in the project evaluation with appropriate costs. A roughness of 500mm per km is assumed as the deterioration rate for the existing and new pavement in the evaluation model.
The details of the project corridor are given in Table 10.1 below:
Table 10.1: Details of Package-II
NH NH 47 NH 47B
Chainage (Km)
Start 43/000 0/000
End 96/714 16/376
Distance (Km) 53/706 16/376
Reference Village Name
From Karode Nagercoil
To Kanyakumari Kavalkinaru
Total Length for Each Package 70.360
10.4 Traffic Growth Scenarios
The base year AADT estimated based on traffic survey is presented below to indicate the traffic variations among the Sections. The comparative traffic is presented in Table
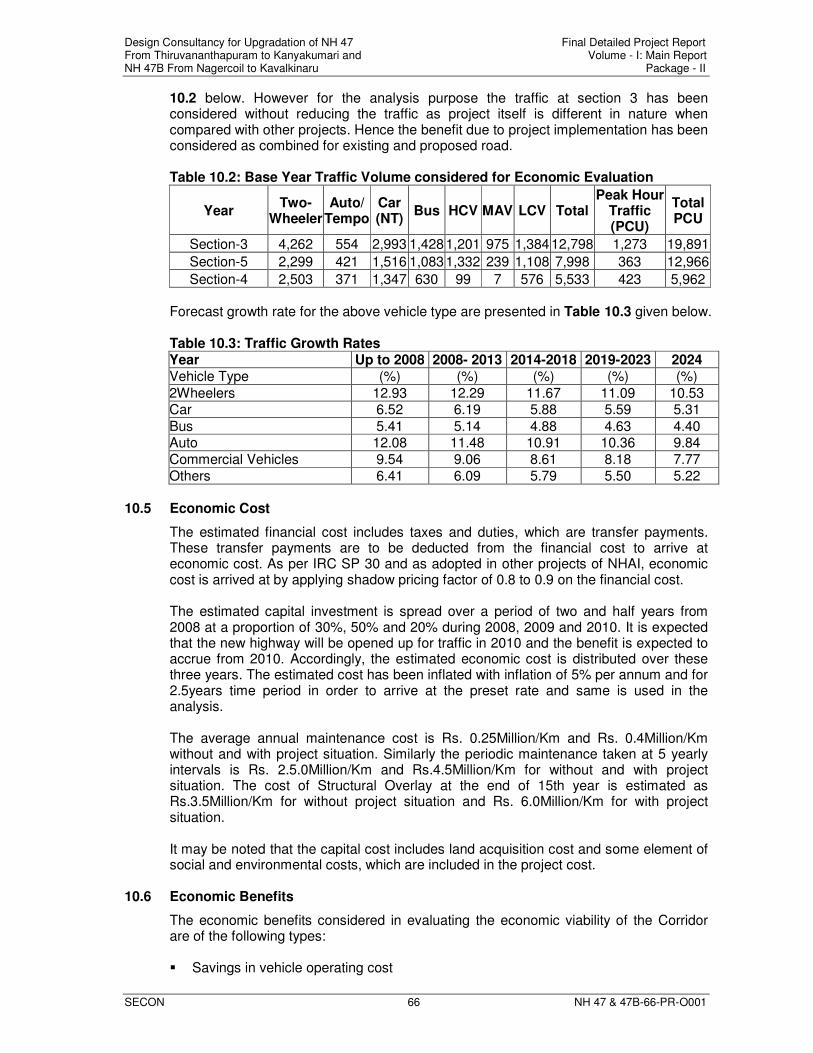
Design Consultancy for Upgradation of NH 47 Final Detailed Project Report From Thiruvananthapuram to Kanyakumari and Volume - I: Main Report NH 47B From Nagercoil to Kavalkinaru Package - II
SECON 66 NH 47 & 47B-66-PR-O001
10.2 below. However for the analysis purpose the traffic at section 3 has been considered without reducing the traffic as project itself is different in nature when compared with other projects. Hence the benefit due to project implementation has been considered as combined for existing and proposed road.
Table 10.2: Base Year Traffic Volume considered for Economic Evaluation
Year Two-
Wheeler Auto/
Tempo Car (NT)
Bus HCV MAV LCV Total Peak Hour
Traffic (PCU)
Total PCU
Section-3 4,262 554 2,993 1,428 1,201 975 1,384 12,798 1,273 19,891
Section-5 2,299 421 1,516 1,083 1,332 239 1,108 7,998 363 12,966
Section-4 2,503 371 1,347 630 99 7 576 5,533 423 5,962
Forecast growth rate for the above vehicle type are presented in Table 10.3 given below.
Table 10.3: Traffic Growth Rates Year Up to 2008 2008- 2013 2014-2018 2019-2023 2024
Vehicle Type (%) (%) (%) (%) (%)
2Wheelers 12.93 12.29 11.67 11.09 10.53 Car 6.52 6.19 5.88 5.59 5.31
Bus 5.41 5.14 4.88 4.63 4.40 Auto 12.08 11.48 10.91 10.36 9.84
Commercial Vehicles 9.54 9.06 8.61 8.18 7.77
Others 6.41 6.09 5.79 5.50 5.22
10.5 Economic Cost
The estimated financial cost includes taxes and duties, which are transfer payments. These transfer payments are to be deducted from the financial cost to arrive at economic cost. As per IRC SP 30 and as adopted in other projects of NHAI, economic cost is arrived at by applying shadow pricing factor of 0.8 to 0.9 on the financial cost.
The estimated capital investment is spread over a period of two and half years from 2008 at a proportion of 30%, 50% and 20% during 2008, 2009 and 2010. It is expected that the new highway will be opened up for traffic in 2010 and the benefit is expected to accrue from 2010. Accordingly, the estimated economic cost is distributed over these three years. The estimated cost has been inflated with inflation of 5% per annum and for 2.5years time period in order to arrive at the preset rate and same is used in the analysis.
The average annual maintenance cost is Rs. 0.25Million/Km and Rs. 0.4Million/Km without and with project situation. Similarly the periodic maintenance taken at 5 yearly intervals is Rs. 2.5.0Million/Km and Rs.4.5Million/Km for without and with project situation. The cost of Structural Overlay at the end of 15th year is estimated as Rs.3.5Million/Km for without project situation and Rs. 6.0Million/Km for with project situation.
It may be noted that the capital cost includes land acquisition cost and some element of social and environmental costs, which are included in the project cost.
10.6 Economic Benefits
The economic benefits considered in evaluating the economic viability of the Corridor are of the following types:
� Savings in vehicle operating cost
Design Consultancy for Upgradation of NH 47 Final Detailed Project Report From Thiruvananthapuram to Kanyakumari and Volume - I: Main Report NH 47B From Nagercoil to Kavalkinaru Package - II
SECON 67 NH 47 & 47B-66-PR-O001
� Savings in value of time
There are other indirect benefits such as social benefits in terms of savings in life (prevention of accident due to improved geometry), citizens riding comfort due to improved maintenance practice, and increase in value of property adjacent to the project corridor.
10.6.1 Estimation of Vehicle Operating Cost
VOC comprises of distance related costs and time related costs. The distance related cost elements are: � Fuel cost � Tyre cost � Engine oil cost � Other oil cost � Grease cost � Spare cost � Maintenance cost
All the above costs constitute variable cost portion of the VOC estimate. The time related cost components of VOC includes: � Fixed cost � Depreciation � Wages
The above cost components are estimated for each vehicle type and for each section corrected for congestion levels, as the cost component estimates are under free flowing conditions. Therefore, congestion factors have been estimated for distance related and time related separately. These factors are corrected for congestion level (Factor of 0.8) and finally VOC per km of distance is estimated for each of the vehicle types and packages. The distance and time related congestion factors are assumed not to exceed 2 or less than 1, as recommended by the IRC Guidelines.
The factors that affect the Vehicle Operating Cost (VOC) are speed, road roughness and carriageway width. These factors are calibrated for “with” and “without” project situation to estimate the VOC “with” and “without” project situation. The speed flow equations as updated in 2001 by CRRI have been used to estimate the speed with given forecast traffic on the Corridor by Sections, taking in to account the condition of pavement, type of terrain and carriageway width. As the estimated speed based on these equations is under free-flow conditions, we have calibrated the speed for the observed speed using distance related congestion factors and time related congestion factors, which are estimated using the relationships as given in the Updated RUCS, 2001. The road roughness of the existing pavement is from the actual survey carried out and for the with project situation, it is assumed that on completion of construction, it will have a roughness of about 2000 mm/km. As a standard practice the pavement deterioration rate for “without situation” is always higher than “with project situation”, due to pavement quality and varying maintenance practice. Accordingly, we have assumed the pavement deterioration rate at 500mm/Km for the existing pavement and 500-mm/ km per year for the new pavement. Carriageway width is 7 m wide with earthen shoulders for the existing road and for the proposed Corridor, it is 4 lane divided carriageway. The highway capacity assumed for estimating volume capacity ratio is based on IRC recommended values. The peak hour
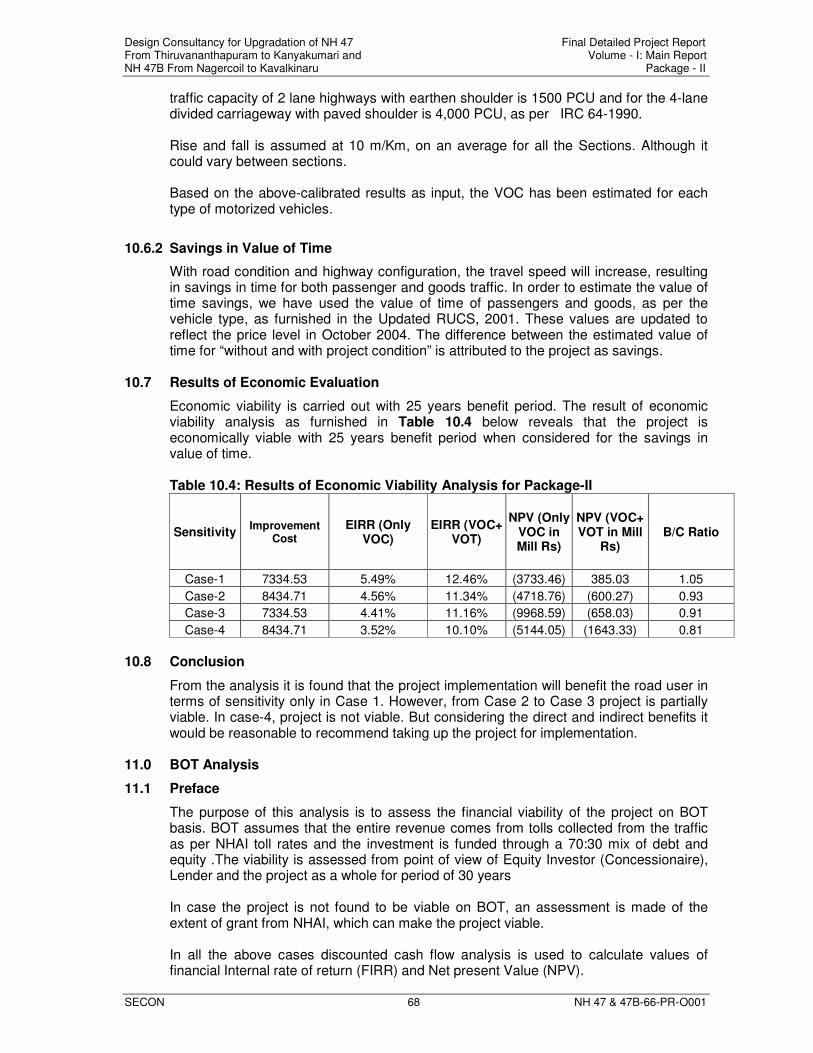
Design Consultancy for Upgradation of NH 47 Final Detailed Project Report From Thiruvananthapuram to Kanyakumari and Volume - I: Main Report NH 47B From Nagercoil to Kavalkinaru Package - II
SECON 68 NH 47 & 47B-66-PR-O001
traffic capacity of 2 lane highways with earthen shoulder is 1500 PCU and for the 4-lane divided carriageway with paved shoulder is 4,000 PCU, as per IRC 64-1990.
Rise and fall is assumed at 10 m/Km, on an average for all the Sections. Although it could vary between sections.
Based on the above-calibrated results as input, the VOC has been estimated for each type of motorized vehicles.
10.6.2 Savings in Value of Time
With road condition and highway configuration, the travel speed will increase, resulting in savings in time for both passenger and goods traffic. In order to estimate the value of time savings, we have used the value of time of passengers and goods, as per the vehicle type, as furnished in the Updated RUCS, 2001. These values are updated to reflect the price level in October 2004. The difference between the estimated value of time for “without and with project condition” is attributed to the project as savings.
10.7 Results of Economic Evaluation
Economic viability is carried out with 25 years benefit period. The result of economic viability analysis as furnished in Table 10.4 below reveals that the project is economically viable with 25 years benefit period when considered for the savings in value of time.
Table 10.4: Results of Economic Viability Analysis for Package-II
Sensitivity Improvement
Cost EIRR (Only
VOC) EIRR (VOC+
VOT)
NPV (Only VOC in Mill Rs)
NPV (VOC+ VOT in Mill
Rs) B/C Ratio
Case-1 7334.53 5.49% 12.46% (3733.46) 385.03 1.05
Case-2 8434.71 4.56% 11.34% (4718.76) (600.27) 0.93
Case-3 7334.53 4.41% 11.16% (9968.59) (658.03) 0.91
Case-4 8434.71 3.52% 10.10% (5144.05) (1643.33) 0.81
10.8 Conclusion
From the analysis it is found that the project implementation will benefit the road user in terms of sensitivity only in Case 1. However, from Case 2 to Case 3 project is partially viable. In case-4, project is not viable. But considering the direct and indirect benefits it would be reasonable to recommend taking up the project for implementation.
11.0 BOT Analysis
11.1 Preface
The purpose of this analysis is to assess the financial viability of the project on BOT basis. BOT assumes that the entire revenue comes from tolls collected from the traffic as per NHAI toll rates and the investment is funded through a 70:30 mix of debt and equity .The viability is assessed from point of view of Equity Investor (Concessionaire), Lender and the project as a whole for period of 30 years
In case the project is not found to be viable on BOT, an assessment is made of the extent of grant from NHAI, which can make the project viable.
In all the above cases discounted cash flow analysis is used to calculate values of financial Internal rate of return (FIRR) and Net present Value (NPV).
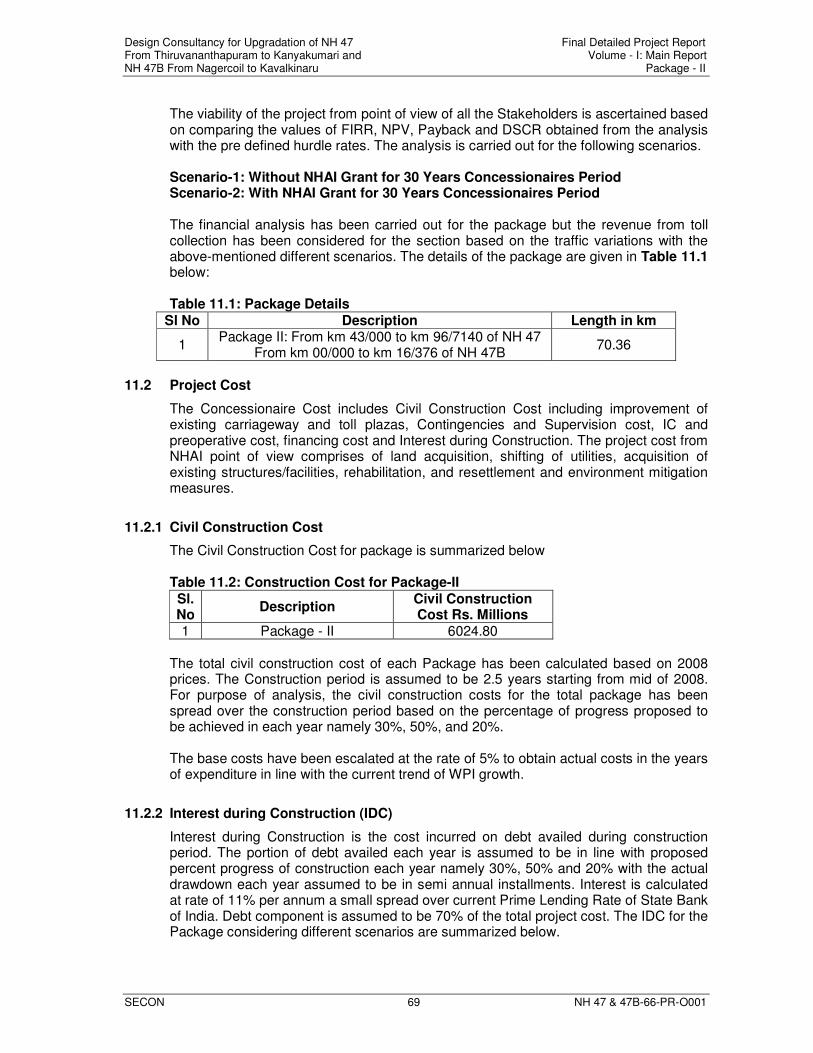
Design Consultancy for Upgradation of NH 47 Final Detailed Project Report From Thiruvananthapuram to Kanyakumari and Volume - I: Main Report NH 47B From Nagercoil to Kavalkinaru Package - II
SECON 69 NH 47 & 47B-66-PR-O001
The viability of the project from point of view of all the Stakeholders is ascertained based on comparing the values of FIRR, NPV, Payback and DSCR obtained from the analysis with the pre defined hurdle rates. The analysis is carried out for the following scenarios.
Scenario-1: Without NHAI Grant for 30 Years Concessionaires Period Scenario-2: With NHAI Grant for 30 Years Concessionaires Period The financial analysis has been carried out for the package but the revenue from toll collection has been considered for the section based on the traffic variations with the above-mentioned different scenarios. The details of the package are given in Table 11.1 below:
Table 11.1: Package Details
Sl No Description Length in km
1 Package II: From km 43/000 to km 96/7140 of NH 47
From km 00/000 to km 16/376 of NH 47B 70.36
11.2 Project Cost
The Concessionaire Cost includes Civil Construction Cost including improvement of existing carriageway and toll plazas, Contingencies and Supervision cost, IC and preoperative cost, financing cost and Interest during Construction. The project cost from NHAI point of view comprises of land acquisition, shifting of utilities, acquisition of existing structures/facilities, rehabilitation, and resettlement and environment mitigation measures.
11.2.1 Civil Construction Cost
The Civil Construction Cost for package is summarized below
Table 11.2: Construction Cost for Package-II
Sl. No
Description Civil Construction Cost Rs. Millions
1 Package - II 6024.80
The total civil construction cost of each Package has been calculated based on 2008 prices. The Construction period is assumed to be 2.5 years starting from mid of 2008. For purpose of analysis, the civil construction costs for the total package has been spread over the construction period based on the percentage of progress proposed to be achieved in each year namely 30%, 50%, and 20%.
The base costs have been escalated at the rate of 5% to obtain actual costs in the years of expenditure in line with the current trend of WPI growth.
11.2.2 Interest during Construction (IDC)
Interest during Construction is the cost incurred on debt availed during construction period. The portion of debt availed each year is assumed to be in line with proposed percent progress of construction each year namely 30%, 50% and 20% with the actual drawdown each year assumed to be in semi annual installments. Interest is calculated at rate of 11% per annum a small spread over current Prime Lending Rate of State Bank of India. Debt component is assumed to be 70% of the total project cost. The IDC for the Package considering different scenarios are summarized below.
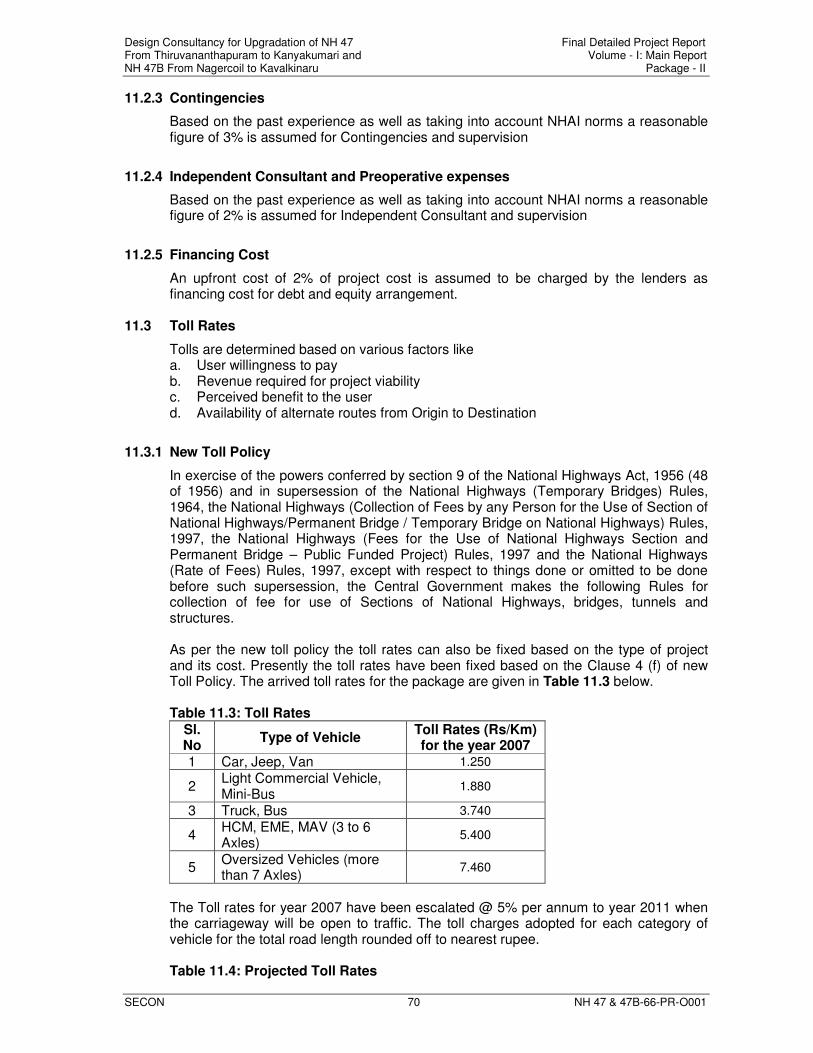
Design Consultancy for Upgradation of NH 47 Final Detailed Project Report From Thiruvananthapuram to Kanyakumari and Volume - I: Main Report NH 47B From Nagercoil to Kavalkinaru Package - II
SECON 70 NH 47 & 47B-66-PR-O001
11.2.3 Contingencies
Based on the past experience as well as taking into account NHAI norms a reasonable figure of 3% is assumed for Contingencies and supervision
11.2.4 Independent Consultant and Preoperative expenses
Based on the past experience as well as taking into account NHAI norms a reasonable figure of 2% is assumed for Independent Consultant and supervision
11.2.5 Financing Cost
An upfront cost of 2% of project cost is assumed to be charged by the lenders as financing cost for debt and equity arrangement.
11.3 Toll Rates
Tolls are determined based on various factors like a. User willingness to pay b. Revenue required for project viability c. Perceived benefit to the user d. Availability of alternate routes from Origin to Destination
11.3.1 New Toll Policy
In exercise of the powers conferred by section 9 of the National Highways Act, 1956 (48 of 1956) and in supersession of the National Highways (Temporary Bridges) Rules, 1964, the National Highways (Collection of Fees by any Person for the Use of Section of National Highways/Permanent Bridge / Temporary Bridge on National Highways) Rules, 1997, the National Highways (Fees for the Use of National Highways Section and Permanent Bridge – Public Funded Project) Rules, 1997 and the National Highways (Rate of Fees) Rules, 1997, except with respect to things done or omitted to be done before such supersession, the Central Government makes the following Rules for collection of fee for use of Sections of National Highways, bridges, tunnels and structures. As per the new toll policy the toll rates can also be fixed based on the type of project and its cost. Presently the toll rates have been fixed based on the Clause 4 (f) of new Toll Policy. The arrived toll rates for the package are given in Table 11.3 below. Table 11.3: Toll Rates
Sl. No
Type of Vehicle Toll Rates (Rs/Km) for the year 2007
1 Car, Jeep, Van 1.250
2 Light Commercial Vehicle, Mini-Bus
1.880
3 Truck, Bus 3.740
4 HCM, EME, MAV (3 to 6 Axles)
5.400
5 Oversized Vehicles (more than 7 Axles)
7.460
The Toll rates for year 2007 have been escalated @ 5% per annum to year 2011 when the carriageway will be open to traffic. The toll charges adopted for each category of vehicle for the total road length rounded off to nearest rupee.
Table 11.4: Projected Toll Rates
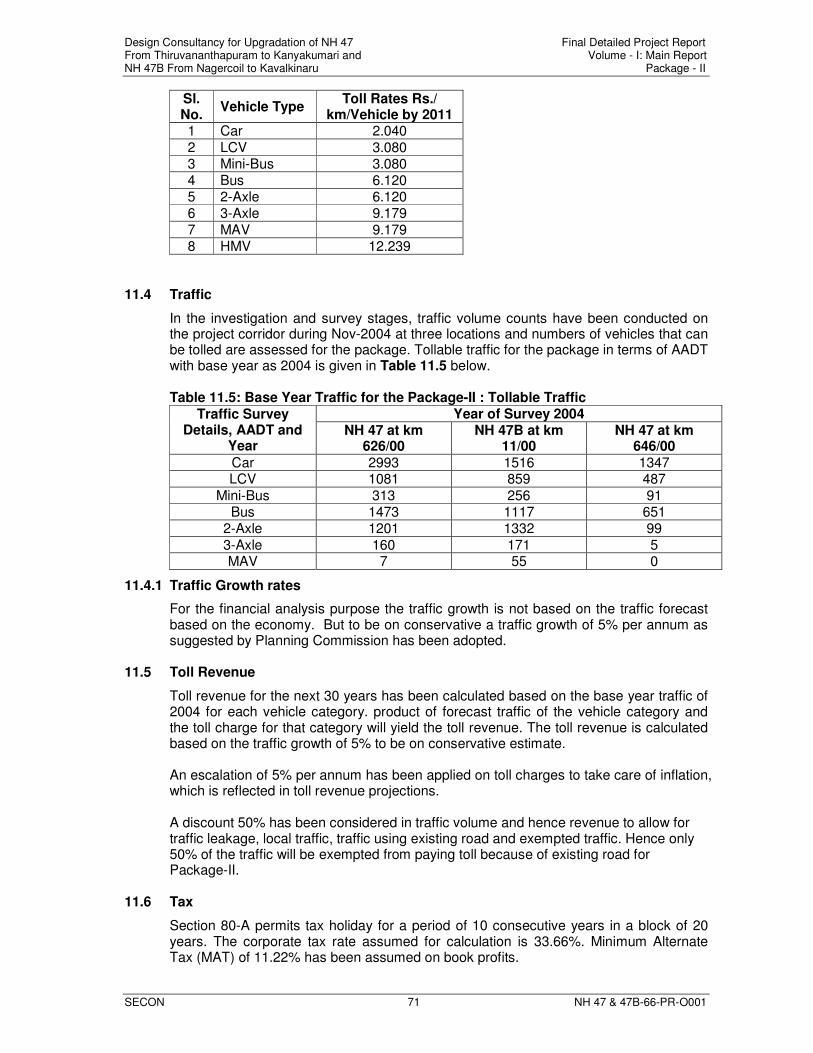
Design Consultancy for Upgradation of NH 47 Final Detailed Project Report From Thiruvananthapuram to Kanyakumari and Volume - I: Main Report NH 47B From Nagercoil to Kavalkinaru Package - II
SECON 71 NH 47 & 47B-66-PR-O001
Sl. No.
Vehicle Type Toll Rates Rs./
km/Vehicle by 2011 1 Car 2.040
2 LCV 3.080 3 Mini-Bus 3.080 4 Bus 6.120 5 2-Axle 6.120 6 3-Axle 9.179
7 MAV 9.179 8 HMV 12.239
11.4 Traffic
In the investigation and survey stages, traffic volume counts have been conducted on the project corridor during Nov-2004 at three locations and numbers of vehicles that can be tolled are assessed for the package. Tollable traffic for the package in terms of AADT with base year as 2004 is given in Table 11.5 below.
Table 11.5: Base Year Traffic for the Package-II : Tollable Traffic
Traffic Survey Details, AADT and
Year
Year of Survey 2004 NH 47 at km
626/00 NH 47B at km
11/00 NH 47 at km
646/00
Car 2993 1516 1347 LCV 1081 859 487
Mini-Bus 313 256 91 Bus 1473 1117 651
2-Axle 1201 1332 99
3-Axle 160 171 5 MAV 7 55 0
11.4.1 Traffic Growth rates
For the financial analysis purpose the traffic growth is not based on the traffic forecast based on the economy. But to be on conservative a traffic growth of 5% per annum as suggested by Planning Commission has been adopted.
11.5 Toll Revenue
Toll revenue for the next 30 years has been calculated based on the base year traffic of 2004 for each vehicle category. product of forecast traffic of the vehicle category and the toll charge for that category will yield the toll revenue. The toll revenue is calculated based on the traffic growth of 5% to be on conservative estimate.
An escalation of 5% per annum has been applied on toll charges to take care of inflation, which is reflected in toll revenue projections.
A discount 50% has been considered in traffic volume and hence revenue to allow for traffic leakage, local traffic, traffic using existing road and exempted traffic. Hence only 50% of the traffic will be exempted from paying toll because of existing road for Package-II.
11.6 Tax
Section 80-A permits tax holiday for a period of 10 consecutive years in a block of 20 years. The corporate tax rate assumed for calculation is 33.66%. Minimum Alternate Tax (MAT) of 11.22% has been assumed on book profits.
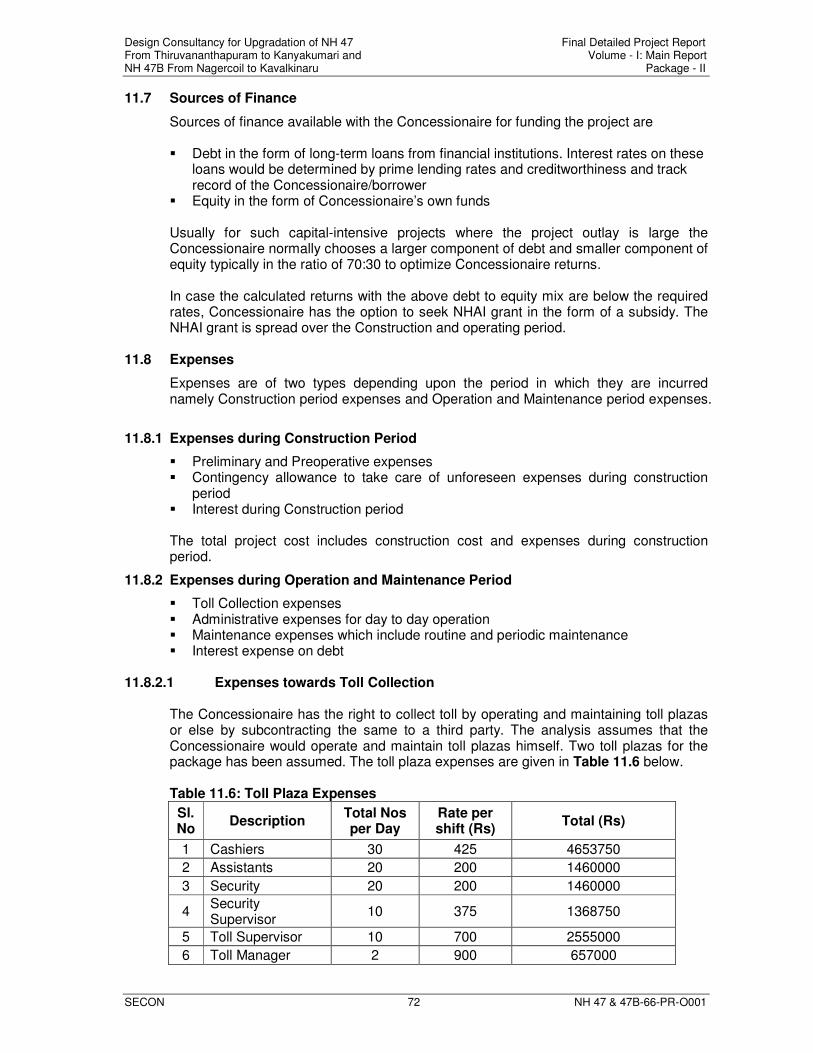
Design Consultancy for Upgradation of NH 47 Final Detailed Project Report From Thiruvananthapuram to Kanyakumari and Volume - I: Main Report NH 47B From Nagercoil to Kavalkinaru Package - II
SECON 72 NH 47 & 47B-66-PR-O001
11.7 Sources of Finance
Sources of finance available with the Concessionaire for funding the project are
� Debt in the form of long-term loans from financial institutions. Interest rates on these loans would be determined by prime lending rates and creditworthiness and track record of the Concessionaire/borrower
� Equity in the form of Concessionaire’s own funds
Usually for such capital-intensive projects where the project outlay is large the Concessionaire normally chooses a larger component of debt and smaller component of equity typically in the ratio of 70:30 to optimize Concessionaire returns. In case the calculated returns with the above debt to equity mix are below the required rates, Concessionaire has the option to seek NHAI grant in the form of a subsidy. The NHAI grant is spread over the Construction and operating period.
11.8 Expenses
Expenses are of two types depending upon the period in which they are incurred namely Construction period expenses and Operation and Maintenance period expenses.
11.8.1 Expenses during Construction Period
� Preliminary and Preoperative expenses � Contingency allowance to take care of unforeseen expenses during construction
period � Interest during Construction period
The total project cost includes construction cost and expenses during construction period.
11.8.2 Expenses during Operation and Maintenance Period
� Toll Collection expenses � Administrative expenses for day to day operation � Maintenance expenses which include routine and periodic maintenance � Interest expense on debt
11.8.2.1 Expenses towards Toll Collection
The Concessionaire has the right to collect toll by operating and maintaining toll plazas or else by subcontracting the same to a third party. The analysis assumes that the Concessionaire would operate and maintain toll plazas himself. Two toll plazas for the package has been assumed. The toll plaza expenses are given in Table 11.6 below.
Table 11.6: Toll Plaza Expenses
Sl. No
Description Total Nos per Day
Rate per shift (Rs)
Total (Rs)
1 Cashiers 30 425 4653750
2 Assistants 20 200 1460000
3 Security 20 200 1460000
4 Security Supervisor
10 375 1368750
5 Toll Supervisor 10 700 2555000
6 Toll Manager 2 900 657000
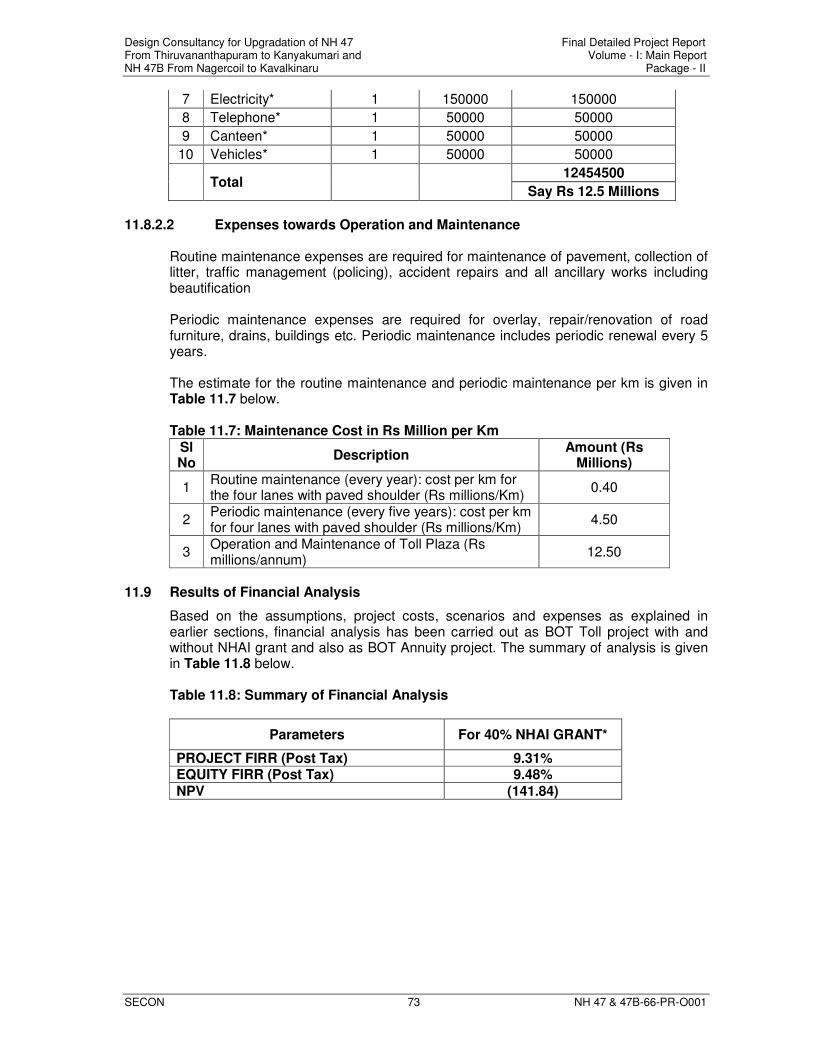
Design Consultancy for Upgradation of NH 47 Final Detailed Project Report From Thiruvananthapuram to Kanyakumari and Volume - I: Main Report NH 47B From Nagercoil to Kavalkinaru Package - II
SECON 73 NH 47 & 47B-66-PR-O001
7 Electricity* 1 150000 150000
8 Telephone* 1 50000 50000
9 Canteen* 1 50000 50000
10 Vehicles* 1 50000 50000
Total 12454500
Say Rs 12.5 Millions
11.8.2.2 Expenses towards Operation and Maintenance
Routine maintenance expenses are required for maintenance of pavement, collection of litter, traffic management (policing), accident repairs and all ancillary works including beautification
Periodic maintenance expenses are required for overlay, repair/renovation of road furniture, drains, buildings etc. Periodic maintenance includes periodic renewal every 5 years.
The estimate for the routine maintenance and periodic maintenance per km is given in Table 11.7 below. Table 11.7: Maintenance Cost in Rs Million per Km
Sl No
Description Amount (Rs
Millions)
1 Routine maintenance (every year): cost per km for the four lanes with paved shoulder (Rs millions/Km)
0.40
2 Periodic maintenance (every five years): cost per km for four lanes with paved shoulder (Rs millions/Km)
4.50
3 Operation and Maintenance of Toll Plaza (Rs millions/annum)
12.50
11.9 Results of Financial Analysis
Based on the assumptions, project costs, scenarios and expenses as explained in earlier sections, financial analysis has been carried out as BOT Toll project with and without NHAI grant and also as BOT Annuity project. The summary of analysis is given in Table 11.8 below.
Table 11.8: Summary of Financial Analysis
Parameters For 40% NHAI GRANT*
PROJECT FIRR (Post Tax) 9.31% EQUITY FIRR (Post Tax) 9.48%
NPV (141.84)
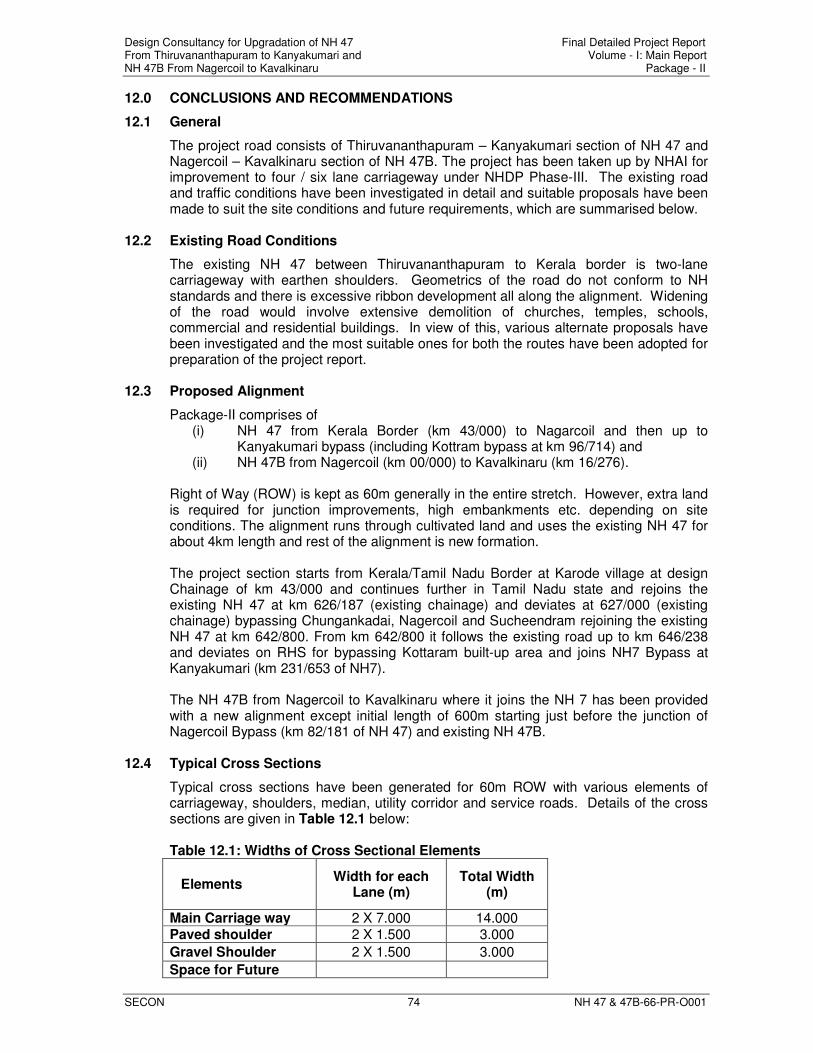
Design Consultancy for Upgradation of NH 47 Final Detailed Project Report From Thiruvananthapuram to Kanyakumari and Volume - I: Main Report NH 47B From Nagercoil to Kavalkinaru Package - II
SECON 74 NH 47 & 47B-66-PR-O001
12.0 CONCLUSIONS AND RECOMMENDATIONS
12.1 General
The project road consists of Thiruvananthapuram – Kanyakumari section of NH 47 and Nagercoil – Kavalkinaru section of NH 47B. The project has been taken up by NHAI for improvement to four / six lane carriageway under NHDP Phase-III. The existing road and traffic conditions have been investigated in detail and suitable proposals have been made to suit the site conditions and future requirements, which are summarised below.
12.2 Existing Road Conditions
The existing NH 47 between Thiruvananthapuram to Kerala border is two-lane carriageway with earthen shoulders. Geometrics of the road do not conform to NH standards and there is excessive ribbon development all along the alignment. Widening of the road would involve extensive demolition of churches, temples, schools, commercial and residential buildings. In view of this, various alternate proposals have been investigated and the most suitable ones for both the routes have been adopted for preparation of the project report.
12.3 Proposed Alignment
Package-II comprises of (i) NH 47 from Kerala Border (km 43/000) to Nagarcoil and then up to
Kanyakumari bypass (including Kottram bypass at km 96/714) and (ii) NH 47B from Nagercoil (km 00/000) to Kavalkinaru (km 16/276).
Right of Way (ROW) is kept as 60m generally in the entire stretch. However, extra land is required for junction improvements, high embankments etc. depending on site conditions. The alignment runs through cultivated land and uses the existing NH 47 for about 4km length and rest of the alignment is new formation.
The project section starts from Kerala/Tamil Nadu Border at Karode village at design Chainage of km 43/000 and continues further in Tamil Nadu state and rejoins the existing NH 47 at km 626/187 (existing chainage) and deviates at 627/000 (existing chainage) bypassing Chungankadai, Nagercoil and Sucheendram rejoining the existing NH 47 at km 642/800. From km 642/800 it follows the existing road up to km 646/238 and deviates on RHS for bypassing Kottaram built-up area and joins NH7 Bypass at Kanyakumari (km 231/653 of NH7). The NH 47B from Nagercoil to Kavalkinaru where it joins the NH 7 has been provided with a new alignment except initial length of 600m starting just before the junction of Nagercoil Bypass (km 82/181 of NH 47) and existing NH 47B.
12.4 Typical Cross Sections
Typical cross sections have been generated for 60m ROW with various elements of carriageway, shoulders, median, utility corridor and service roads. Details of the cross sections are given in Table 12.1 below:
Table 12.1: Widths of Cross Sectional Elements
Elements Width for each
Lane (m) Total Width
(m)
Main Carriage way 2 X 7.000 14.000 Paved shoulder 2 X 1.500 3.000
Gravel Shoulder 2 X 1.500 3.000
Space for Future
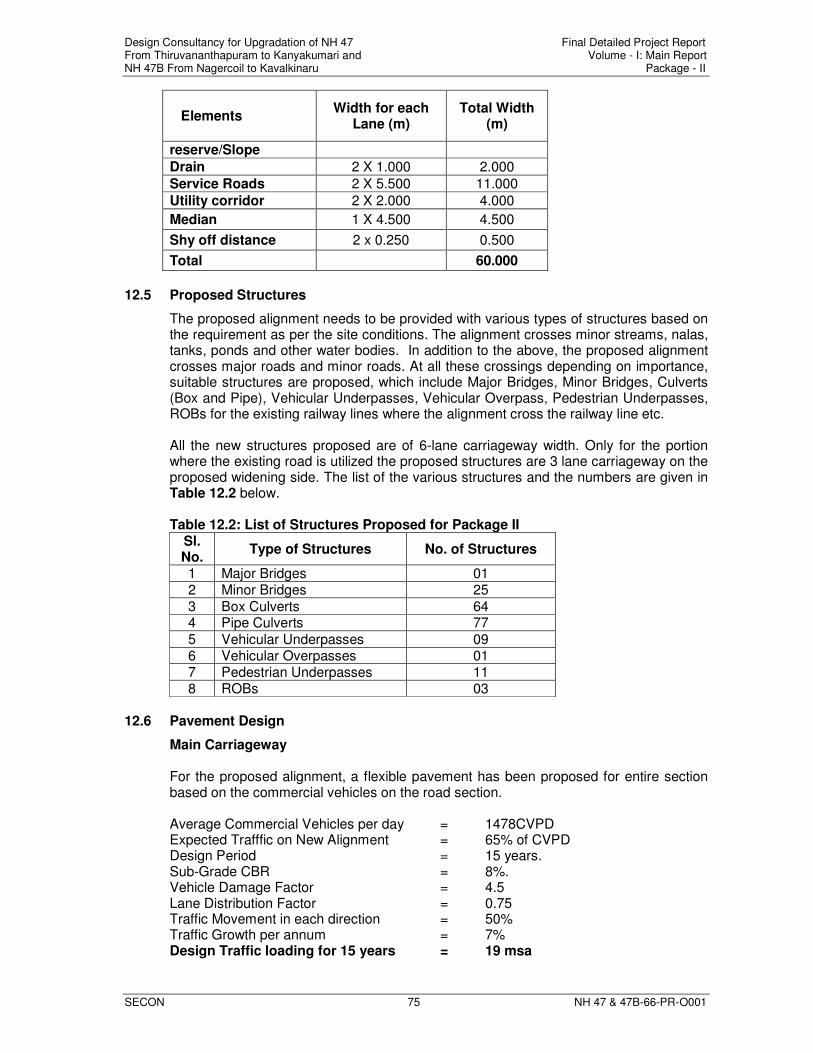
Design Consultancy for Upgradation of NH 47 Final Detailed Project Report From Thiruvananthapuram to Kanyakumari and Volume - I: Main Report NH 47B From Nagercoil to Kavalkinaru Package - II
SECON 75 NH 47 & 47B-66-PR-O001
Elements Width for each
Lane (m) Total Width
(m)
reserve/Slope
Drain 2 X 1.000 2.000
Service Roads 2 X 5.500 11.000
Utility corridor 2 X 2.000 4.000
Median 1 X 4.500 4.500
Shy off distance 2 x 0.250 0.500
Total 60.000
12.5 Proposed Structures
The proposed alignment needs to be provided with various types of structures based on the requirement as per the site conditions. The alignment crosses minor streams, nalas, tanks, ponds and other water bodies. In addition to the above, the proposed alignment crosses major roads and minor roads. At all these crossings depending on importance, suitable structures are proposed, which include Major Bridges, Minor Bridges, Culverts (Box and Pipe), Vehicular Underpasses, Vehicular Overpass, Pedestrian Underpasses, ROBs for the existing railway lines where the alignment cross the railway line etc. All the new structures proposed are of 6-lane carriageway width. Only for the portion where the existing road is utilized the proposed structures are 3 lane carriageway on the proposed widening side. The list of the various structures and the numbers are given in Table 12.2 below.
Table 12.2: List of Structures Proposed for Package II
Sl. No.
Type of Structures No. of Structures
1 Major Bridges 01 2 Minor Bridges 25
3 Box Culverts 64 4 Pipe Culverts 77
5 Vehicular Underpasses 09 6 Vehicular Overpasses 01 7 Pedestrian Underpasses 11 8 ROBs 03
12.6 Pavement Design
Main Carriageway For the proposed alignment, a flexible pavement has been proposed for entire section based on the commercial vehicles on the road section. Average Commercial Vehicles per day = 1478CVPD Expected Trafffic on New Alignment = 65% of CVPD Design Period = 15 years. Sub-Grade CBR = 8%. Vehicle Damage Factor = 4.5 Lane Distribution Factor = 0.75 Traffic Movement in each direction = 50% Traffic Growth per annum = 7% Design Traffic loading for 15 years = 19 msa
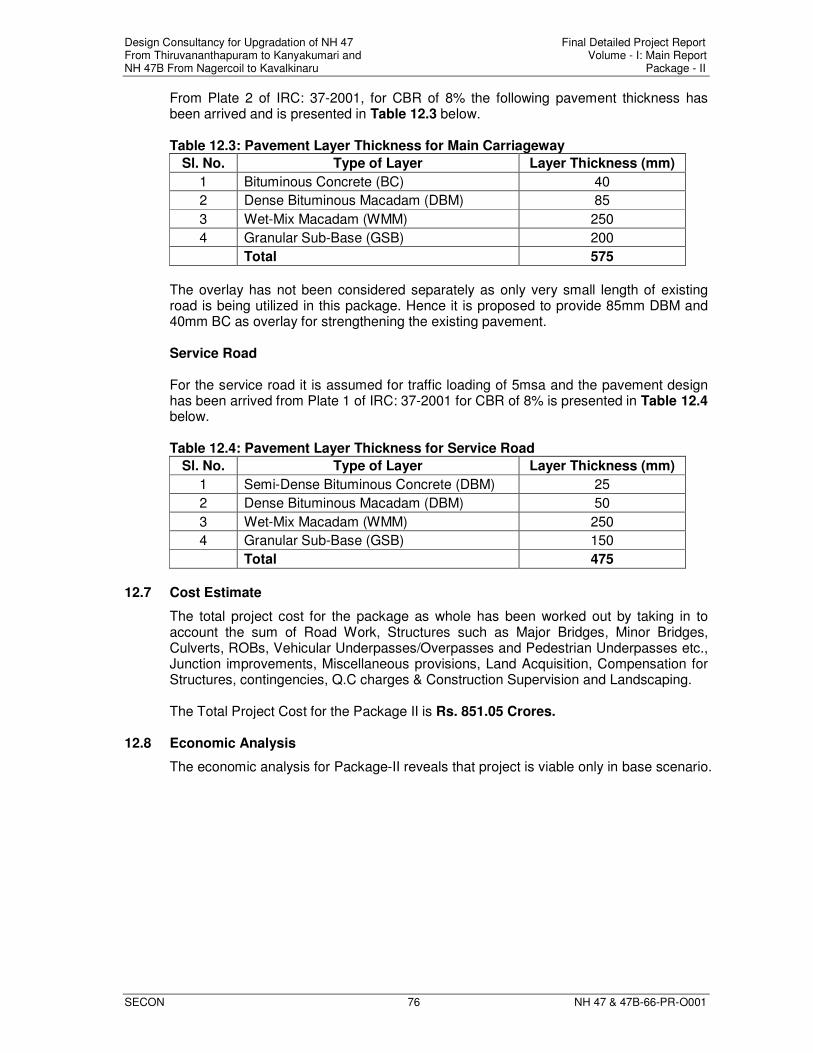
Design Consultancy for Upgradation of NH 47 Final Detailed Project Report From Thiruvananthapuram to Kanyakumari and Volume - I: Main Report NH 47B From Nagercoil to Kavalkinaru Package - II
SECON 76 NH 47 & 47B-66-PR-O001
From Plate 2 of IRC: 37-2001, for CBR of 8% the following pavement thickness has been arrived and is presented in Table 12.3 below. Table 12.3: Pavement Layer Thickness for Main Carriageway
Sl. No. Type of Layer Layer Thickness (mm)
1 Bituminous Concrete (BC) 40
2 Dense Bituminous Macadam (DBM) 85
3 Wet-Mix Macadam (WMM) 250
4 Granular Sub-Base (GSB) 200
Total 575
The overlay has not been considered separately as only very small length of existing road is being utilized in this package. Hence it is proposed to provide 85mm DBM and 40mm BC as overlay for strengthening the existing pavement. Service Road For the service road it is assumed for traffic loading of 5msa and the pavement design has been arrived from Plate 1 of IRC: 37-2001 for CBR of 8% is presented in Table 12.4 below. Table 12.4: Pavement Layer Thickness for Service Road
Sl. No. Type of Layer Layer Thickness (mm)
1 Semi-Dense Bituminous Concrete (DBM) 25
2 Dense Bituminous Macadam (DBM) 50
3 Wet-Mix Macadam (WMM) 250
4 Granular Sub-Base (GSB) 150
Total 475
12.7 Cost Estimate
The total project cost for the package as whole has been worked out by taking in to account the sum of Road Work, Structures such as Major Bridges, Minor Bridges, Culverts, ROBs, Vehicular Underpasses/Overpasses and Pedestrian Underpasses etc., Junction improvements, Miscellaneous provisions, Land Acquisition, Compensation for Structures, contingencies, Q.C charges & Construction Supervision and Landscaping. The Total Project Cost for the Package II is Rs. 851.05 Crores.
12.8 Economic Analysis
The economic analysis for Package-II reveals that project is viable only in base scenario.