Embed Size (px)
Citation preview

1
Project SchedulingConverts action plan into operating time tableFundamental basis for monitoring and controlling projectScheduling more important in projects than in production,because unique natureSometimes customer specified/approved requirement - example JKR projectsBased on Work Breakdown Structure (WBS)

2
Network Techniques : PERT and CPMPERT: Program Evaluation and Review Technique - developed by the US Navy with Booz Hamilton Lockheed on the Polaris Missile/Submarine program 1958CPM: Critical Path Method developed by DuPont for Chemical Plant Shutdown Project - about same time as PERTBoth use same calculations, almost similar - main difference is probabilistic and deterministic in time estimation Gantt Chart - also used in scheduling

3
Network
Network of activities and event relationships that graphically portray the sequential relations between tasks in the projectClearly identify tasks that must PRECEDE or follow other tasksPowerful tool for planning and controlling project

4
Benefits of a networkConsistent framework for planning, scheduling, monitoring and control the projectIllustrates interdependence of all tasks, work packages, work elementsShow the times when specific resources must be made availableHelps ensure proper communication between departmentsDetermines project completion time

5
Benefits of a networkIdentifies critical activities, if delayed, WILL delay projectAlso identifies activities that have slack - can delay without affectDetermines dates on which tasks can be started, or must be started if project is to stay on scheduleShows which tasks must be coordinated to avoid resource or timing conflictsShows which tasks may run in parallel to meet project completion date

6
Network example1

7
Network example2

8
DEFINITION OF TERMS USED IN A NETWORK
Activity: task (s) required by project,uses up resource and consumes time
Event: Result of completing one or more activities, identifiable end state, occur at particular time
Network: Combination of all activities and events
PRECEEDING SUCCESSORACTIVITY
EVENT

9
A simple exampleConsider the list of four activities for making a simple product:
Activity Description Immediatepredecessors
A Buy Plastic Body -
B Design Component -
C Make Component B
D Assemble product A,C
The immediate predecessors for a particular activity are the activities
that, when completed, enable the start of the activity in question.

10
Sequence of activitiesWe can start work on activities A and B anytime, since neither of these activities depends upon the completion of prior activities.
Activity C cannot be started until activity B has been completed, and activity D cannot be started until both activities A and C have been completed.
The graphical representation (next slide) is referred to as the PERT/CPM network for project.

11
Network of four activities
1 3 4
2
B
A
C
D
Arcs indicate project activities
Nodes correspond to the beginning and ending of activities

12
A Comparison of AON and AOA Network Conventions

13
Another example
Develop the network for a project with following activities and immediate predecessors:
Activity Immediatepredecessors
A -
B -
C B
D A, C
E C
F C
G D,E,F
First, attempt for the first five (A,B,C,D,E) activities

14
Network of first five activities
3 4
C
D
5
E
1 A
B
2We need to introduce a
dummy activity

15
DUMMY- No Time or Resource, only helps LOGIC
1 2 1
2
3
1 1
2
a
Dummy
RIGHT!!!WRONG!!!
a
b b
Activity c not required for e
a
b
c
d
e
a
b
c d
e
WRONG!!!RIGHT!!!
Network concurrent activities

16
1 1
2 2
3 3
4
a d
b e
c f
a d
be
fc
WRONG!!! RIGHT!!!
a precedes d. a and b precede e,b and c precede f (a does not precede f)

17
Network of seven activities3 4A
B
C 5
E
6F
G1 D7
2
• Note how the network correctly identifies D, E, and F as the immediate predecessors for activity G.
• Dummy activities can be used to identify precedence relationships correctly as well as to eliminate the possible confusion of two or more activities having the same starting and ending nodes.

18
Scheduling with activity timeActivity Immediate Completion
predecessors Time (week)A - 5B - 6C A 4D A 3E A 1F E 4G D,F 14H B,C 12I G,H 2
Total …… 51This information indicates that the total time required to complete activities is 51 weeks. However, we can see from the network that several of the activities can be
conducted simultaneously (A and B, for example).

19
Network with activity time
3
2
6
A5
B6
C4
D3
E1
F4
G14
H12
I2
5
74
1
Each activity letter is written above and each activity time is written
bellow the corresponding arcPATH: sequence of connected activities from the starting (1) to Finish (7). ADGI: 5+3+14+2 =24; ACHI :5+4+12+2 =23AEFGI: 5+1+4+14+2=26: BCHI: 6+12+2 =20CRITICAL PATH : Longest Path, Time taken to complete project (26)

20
Earliest start & earliest finish timeWe are interested in the longest path through the network, i.e., the critical path.
Starting at the network’s origin (node 1) and using a starting time of 0, we compute an earliest start (ES) and earliest finish (EF) time for each activity in the network.
The expression EF = ES + t can be used to find the earliest finish time for a given activity. For example, for activity A, ES = 0 and t = 5; thus the earliest finish time for activity A is
EF = 0 + 5 = 5

21
Arc with ES & EF time
1
2A [0,5]
5
Activity
ES = earliest start time
EF = earliest finish time
t = expected activity time

22
Network with ES & EF time
3
2
6
A[0,5]
5
B[0,6]6
C[5,9]4
D[5,8]3
E[5,6]1 F[6,10
]
4
G[10,24]
14H[9,21]
12
I[24,26]
2
5
74
1
Earliest start time rule:The earliest start time for an activity leaving a particular node is equal to the largest of the earliest finish times for all activities entering the node.

23
ES, EF, LS, LF
2
3C [5,9]
4 [8,12]
Activity
ES = earliest start time
EF = earliest finish time
LF = latest finish timeLS = latest start time

24
Latest start & latest finish timeTo find the critical path we need a backward pass calculation.
Starting at the completion point (node 7) and using a latest finish time (LF) of 26 for activity I, we trace back through the network computing a latest start (LS) and latest finish time for each activity
.
The expression LS = LF – t can be used to calculate latest start time for each activity. For example, for activity I, LF = 26 and t = 2, thus the latest start time for activity I is
LS = 26 – 2 = 24

25
Network with LS & LF time
3
2
6
A[0,5]
5[0,5]
B[0,6]6[6,12]
C[5,9]
4[8,12]
D[5,8]3[7,10]
E[5,6]1[5,6]F[6,
10]
4[6,10
]
G[10,24]
14[10,24]H[9,21]
12[12,24]
I[24,26]
2[24,26]
5
74
1
Latest finish time rule: The latest finish time for an activity entering a particular node is equal to the smallest of the latest start times for all activities leaving the node.

26
Slack or Free Time or FloatSlack is the length of time an activity can be delayed without affecting the completion date for the entire project. For example, slack for C = 3 weeks, i.e Activity C can be delayed up to 3 weeks
(start anywhere between weeks 5 and 8).
ES5
LS8
EF9
LF-EF = 12 –9 =3
LS-ES = 8 – 5 = 3
LF-ES-t = 12-5-4 = 3
EF12
23C [5,9]
4 [8,12]

27
Activity schedule for our example
Yes026262424I32421129H
Yes024241010GYes0101066FYes06655E
210875D312985C612660B
Yes05500A
Critical path
Slack(LS-ES)
Latest finish (LF)
Earliest finish (EF)
Latest start (LS)
Earliest start (ES)
Activity

28
IMPORTANT QUESTIONSWhat is the total time to complete the project?
– 26 weeks if the individual activities are completed on schedule.
What are the scheduled start and completion times for each activity?
– ES, EF, LS, LF are given for each activity.
What activities are critical and must be completed as scheduled in order to keep the project on time?
– Critical path activities: A, E, F, G, and I.
How long can non-critical activities be delayed before they cause a delay in the project’s completion time
– Slack time available for all activities are given.

29
Importance of Float (Slack) and Critical Path
1. Slack or Float shows how much allowance each activity has, i.e how long it can be delayed without affecting completion date of project
2. Critical path is a sequence of activities from start to finish with zero slack. Critical activities are activities on the critical path.
3. Critical path identifies the minimum time to complete project
4. If any activity on the critical path is shortened or extended, project time will be shortened or extended accordingly

30
Importance of Float (Slack) and Critical Path (cont)
5. So, a lot of effort should be put in trying to control activities along this path, so that project can meet due date. If any activity is lengthened, be aware that project will not meet deadline and some action needs to be taken
6. If can spend resources to speed up some activity, do so only for critical activities.
7. Don’t waste resources on non-critical activity, it will not shorten the project time.
8. If resources can be saved by lengthening some activities, do so for non-critical activities, up to limit of float.
9. Total Float belongs to the path

31
PERT For Dealing With Uncertainty
So far, times can be estimated with relative certainty, confidenceFor many situations this is not possible, e.g Research, development, new products and projects etc.Use 3 time estimates
m= most likely time estimate, mode.a = optimistic time estimate,b = pessimistic time estimate, and
Expected Value (TE) = (a + 4m + b) /6Variance (V) = ( ( b – a) / 6 ) 2
Std Deviation (σ) = SQRT (V)
32
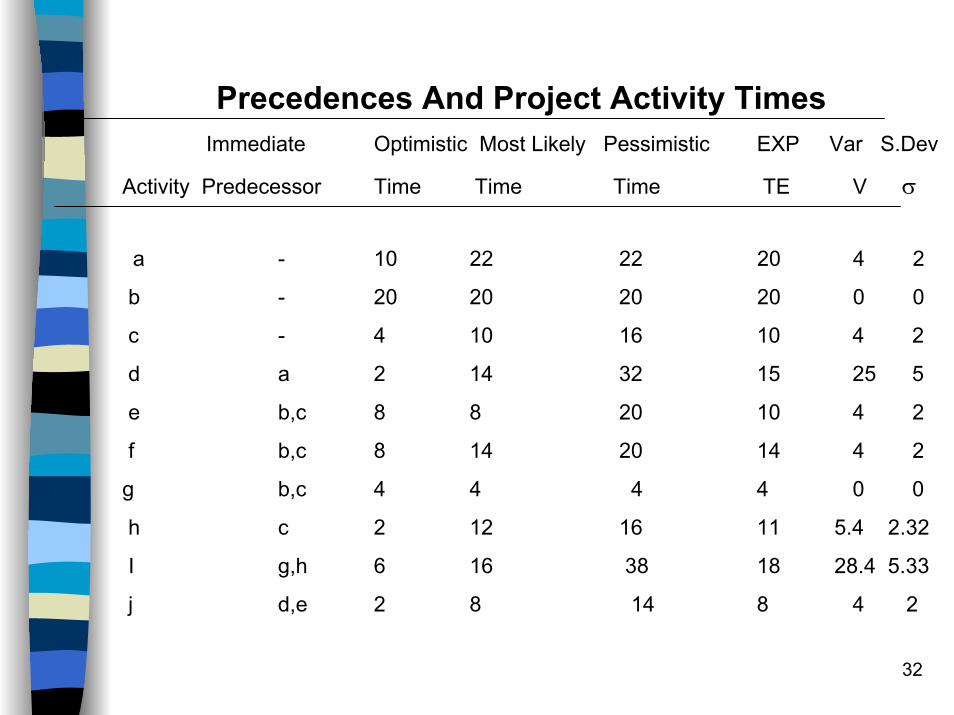
Precedences And Project Activity TimesImmediate Optimistic Most Likely Pessimistic EXP Var S.Dev
Activity Predecessor Time Time Time TE V σ
a - 10 22 22 20 4 2
b - 20 20 20 20 0 0
c - 4 10 16 10 4 2
d a 2 14 32 15 25 5
e b,c 8 8 20 10 4 2
f b,c 8 14 20 14 4 2
g b,c 4 4 4 4 0 0
h c 2 12 16 11 5.4 2.32
I g,h 6 16 38 18 28.4 5.33
j d,e 2 8 14 8 4 2

33
The complete network
2 6
1 3 7
4 5
a(20,4)
d(15,25)
e(10,4)
f(14,4)
j(18,4)
i(18,28.4)
g(4,0)
h(11,5.4)
c(10,4)

34
Figure 8-13 The complete Network
2 6
1 3 7
4 5
a(20,0)
d(15,25)
e(10,4)
f(14,4)
j(8,4)
i(18,28.4)
g(4,0)
h(11,5.4)
c(10,4)
2410
20
a(20,4)
EF=20 35
43CRIT. TIME = 43

35
Critical Path Analysis (PERT)
35
24
10
20
20
20
20
0
0
0
ES
Yes035j
125i
414h
121g
929f
Yes525e
020d
44c
Yes11b
00a
Critical ?SlacksLSActivity

36
Assume, PM promised to complete the project in the fifty days. What are the chances of meeting that deadline?Ccalculate Z, where
Z = (D-S) / √V
Example, D = 50; S(Scheduled date) = 20+15+8 =43; V = (4+25+4) =33Z = (50 – 43) / 5.745
= 1.22 standard deviations.
The probability value of Z = 1.22, is 0.888
1.22

37
What deadline are you 95% sure of meeting
Z value associated with 0.95 is 1.645
D = S + 5.745 (1.645)= 43 + 9.45= 52.45 days
Thus, there is a 95 percent chance of finishing the project by 52.45 days.

38
Comparison Between CPM and PERT
Same as CPMUses network, calculate float or slack, identify critical path and activities, guides to monitor and controlling project
1
Example: Involving new activities or products, research and development etc
Example: construction projects, building one off machines, ships, etc
5
Meeting time target or estimating percent completion is more important
Minimizing cost is more important4
Used where times cannot be estimated with confidence.Unfamiliar or new activities
Used where times can be estimated with confidence, familiar activities
3
Requires 3 estimates of activity timeCalculates mean and variance of time
Uses one value of activity time2
PERTCPM
39
BENEFITS OFCPM / PERT NETWORK
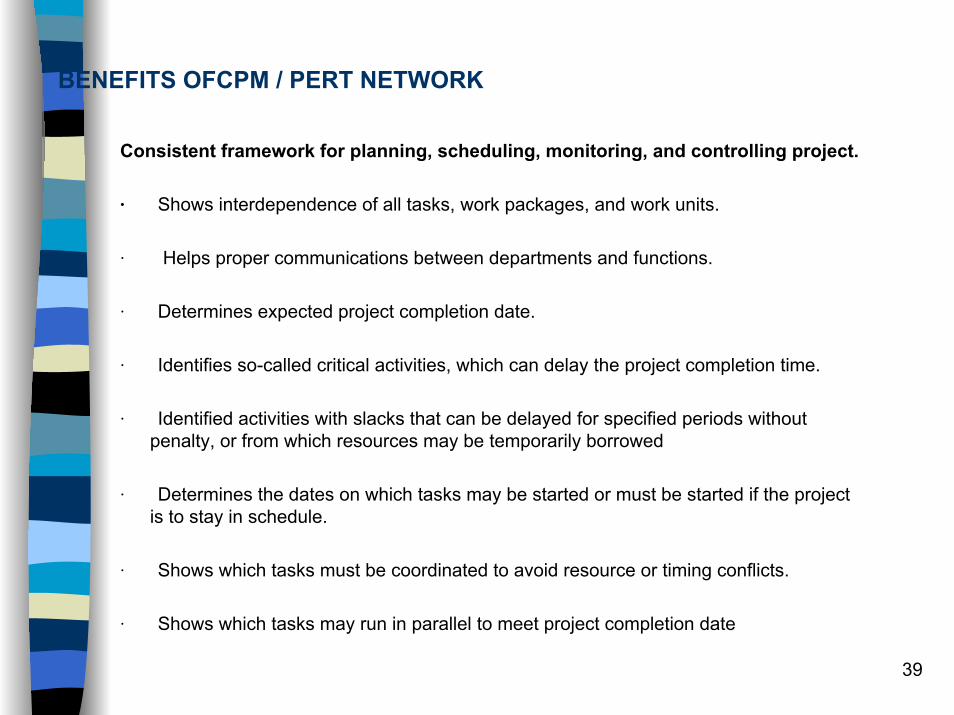
Consistent framework for planning, scheduling, monitoring, and controlling project.
· Shows interdependence of all tasks, work packages, and work units.
· Helps proper communications between departments and functions.
· Determines expected project completion date.
· Identifies so-called critical activities, which can delay the project completion time.
· Identified activities with slacks that can be delayed for specified periods without penalty, or from which resources may be temporarily borrowed
· Determines the dates on which tasks may be started or must be started if the project is to stay in schedule.
· Shows which tasks must be coordinated to avoid resource or timing conflicts.
· Shows which tasks may run in parallel to meet project completion date

40
Gantt ChartsSince 1917; Useful for showing work versus time in form of bar charts
e.g.
Can draw directly or from CPM/PERT network

41
Modified PERT/CPM diagram from network
1
1
1
4
3
3
2
5
7
4
3
6
e
f
a d
b
c dummy
h
0 5 10 15 20 25 30 35 40 45
Legend
[ Scheduled Start] Scheduled Finish − Actual Progress⊗ UnavailableΛ Current Date ◊ Milestone Scheduled♦ Milestone Achieved
Days

42
GANTT CHART

43

44

45
Gantt Charts and CPM/PERT Networks
Gantt Charts:
Even though a lot of info, easy to read and , understand to monitor and follow progress.
Not very good for logical constraints
Should be used to COMPLEMENT networks, not replace

46

47

48

49

50

51