Embed Size (px)
Citation preview
New England University Transportation Center
77 Massachusetts Avenue, E40-279 Cambridge, MA 02139
utc.mit.edu
Grant Number: DTRT13-G-UTC31
Project Title:
Understanding Perceptions of Transportation for Livable
Communities
MITR25-55 06/30/19 12/12/19
Samantha Brady, MPA
Research Specialist
Massachusetts Institute of Technology
617-258-7633
Joseph Coughlin, PhD
Director
Massachusetts Institute of Technology
(617) 253-0753
Project Number: Project End Date: Submission Date:
Principal Investigator:
Title:
University:
Email:
Phone:
Co-Principal Investigator:
Title:
University:
Email:
Phone:
Year 25 Final Report

Problem and Approach
Transportation accomplishes more than simply moving people from point A to point B; transportation keeps residents connected and engaged in their community and is a critical element in determining community and life satisfaction (Dawkins, Jeon & Pendall, 2015; Cutler, 1975). While transportation is key to remaining independent and productive, it is often an overlooked aspect of an individual’s community. This study aims to investigate people’s perceptions and behaviors around various modes of transportation in their current community and the ways in which transportation informs decision making, for example, when thinking about relocation. This study also explores generational attitudes and behaviors around different modes of transportation, including autonomous vehicles of the future. Driving is the primary mode of transportation for many living in the United States (U.S. Department of Transportation, 2019). However, as people age, driving rates decrease and access to alternative modes of transportation becomes increasingly important (Federal Highway Administration, 2018). While public transportation may become increasingly important later in life, only 11% of Americans report regular public transportation use (Anderson, 2016). One reason public transportation is low is due to access. The American Public Transportation Association (2019) estimates that approximately 45% of Americans have no access to public transportation. Even though public and alternate transportation usage is low in the United States, access to these forms of transportation is critical, especially as communities continue to age. When developing the Age-Friendly Cities model, the World Health Organization (2007) deemed access to affordable and accessible transportation as one of the key factors necessary for active and healthy aging. Additionally, AARP’s Livability Index also highlights transportation as a major influencer of community livability (AARP, 2018). While Age Friendly Cities and the AARP Livability Index are geared toward older community members, these frameworks not only benefit older residents, but aim to meet the needs of residents across the age spectrum (Biggs & Carr, 2015). Therefore, access to transportation is essential for individuals of all ages. While access to transportation is a key factor driving utilization, attitudes and perceptions toward public transportation may also influence use. This study will investigate the pain points and difficulties people have accessing and using public transportation in their communities. Results of this survey will begin to illustrate specific characteristics of public transportation that may lead to lower utilization and can provide a starting point for future research aimed at developing recommendations for urban planners and local transportation authorities. While transportation remains a critical factor for well-being, especially as people age, the extent to which transportation is factored into decision making is unclear. One example is the decision around relocation. Many factors influence where and when people choose to relocate including proximity to friends, family and coworkers (Wang et al., 2016; Ioannides & Zabel, 2008), climate (Dorfman & Mandich, 2015) and access to
job opportunities (Mulder & Hooimeijer, 1999). However, little research has examined the role of transportation options and access when making relocation decisions. This research examines, how people across generations perceive and utilize various forms of transportation. More specifically, study results illuminate how and when individuals utilize various modes of transportation and their attitudes toward different forms of public transportation. This study also investigates the expectations individuals have on the role of transportation in their future lives.
Methodology
Data for this study were collected through a nationally representative survey of adults over the age of 23. The survey was developed by the MIT AgeLab and administered by NORC/AmeriSpeak. As data collection is currently in process, this study utilizes survey pre-test data consisting of (54) participants. Pre-test data collection occurred from November 28, 2019 to December 5, 2019 and cleaned survey data were delivered to the AgeLab on December 9, 2019. The national survey contained a variety of questions aimed at understanding the modes of transportation respondents predominately used in their daily lives, as well as information on which modes of transportation were available and accessible to participants in their current communities. A variety of transportation modes were explored included personally operated vehicles, taxi and ride sharing services, public transportation (e.g., buses, subways, ferries), and walking and cycling. The survey asked about both primary mode of transportation as well as the top three other most frequently used modes of transportation used in a typical month. The survey also asked respondents a series of questions on their use of and availability of public transportation options in their community. This series included question related to availability of public transportation, the distance of the nearest public transportation stop from the participant’s home, and a battery of questions around perceptions of convenience, ease of use, proximity to destinations of interest, and public transportation preferences. The survey also asked participants about their expectations of future transportation use. Specifically, the survey asked what forms of transportation an individual expected to use ten years into the future. While the pre-test data sample used for this report is not able to speak to how transportation plays a role in relocation decisions, due to the small sample size, complete data collected from the national survey will illustrate how transportation ranks in the relocation decision-making process. Survey questions include, the primary reasons why participants have or are planning to relocate and the most challenging aspects of their current homes, including perceived proximity to public transportation options.
Questions included in the national survey aim to uncover how participants across generations and regions interact with and perceive various forms of transportation in their daily lives as well as expectations abo ut the future.
Findings
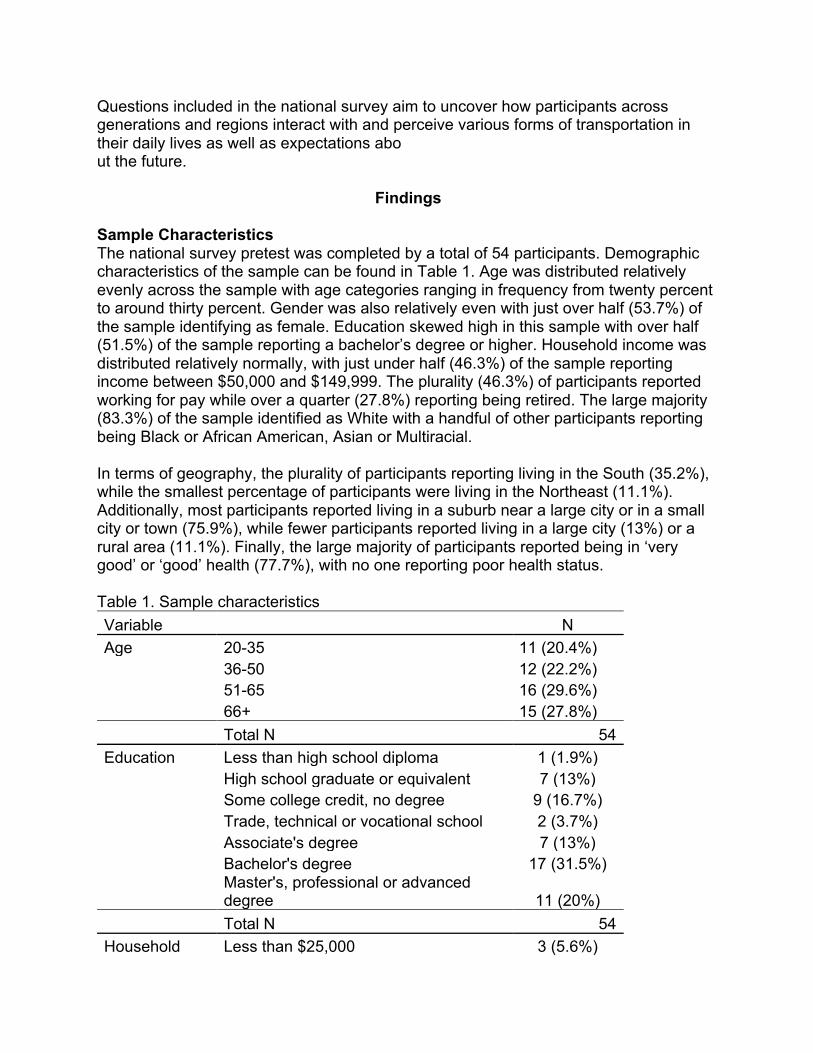
Sample Characteristics The national survey pretest was completed by a total of 54 participants. Demographic characteristics of the sample can be found in Table 1. Age was distributed relatively evenly across the sample with age categories ranging in frequency from twenty percent to around thirty percent. Gender was also relatively even with just over half (53.7%) of the sample identifying as female. Education skewed high in this sample with over half (51.5%) of the sample reporting a bachelor’s degree or higher. Household income was distributed relatively normally, with just under half (46.3%) of the sample reporting income between $50,000 and $149,999. The plurality (46.3%) of participants reported working for pay while over a quarter (27.8%) reporting being retired. The large majority (83.3%) of the sample identified as White with a handful of other participants reporting being Black or African American, Asian or Multiracial. In terms of geography, the plurality of participants reporting living in the South (35.2%), while the smallest percentage of participants were living in the Northeast (11.1%). Additionally, most participants reported living in a suburb near a large city or in a small city or town (75.9%), while fewer participants reported living in a large city (13%) or a rural area (11.1%). Finally, the large majority of participants reported being in ‘very good’ or ‘good’ health (77.7%), with no one reporting poor health status. Table 1. Sample characteristics Variable N Age 20-35 11 (20.4%) 36-50 12 (22.2%) 51-65 16 (29.6%) 66+ 15 (27.8%) Total N 54 Education Less than high school diploma 1 (1.9%)
High school graduate or equivalent 7 (13%) Some college credit, no degree 9 (16.7%) Trade, technical or vocational school 2 (3.7%) Associate's degree 7 (13%) Bachelor's degree 17 (31.5%)
Master's, professional or advanced degree 11 (20%)
Total N 54 Household Less than $25,000 3 (5.6%)

income
$25,000 - $34,999 5 (9.3%) $35,000 -$49,999 5 (9.3%) $50,000 - $74,999 11 (20.4%) $75,000 - $99,999 8 (14.8%) $100,000 - $149,999 6 (11.1%) $150,000 - $199,999 5 (9.3%) $200,000 - $249,999 1 (1.9%) $250,000 or more 1 (1.9%)
Total N 45 Gender Female 29 (53.7%)
Male 24 (44.4%) Total N 54 Employment status Working - as a paid employee 25 (46.3%)
Working - self-employed 4 (7.4%) Not working - looking for work 1 (1.9%) Not working - retired 15 (27.8%) Not working - disabled 3 (5.6%) Not working - other 6 (11.1%)
Total N 54 Race Asian 3 (5.6%)
Black or African American 2 (3.7%) White 45 (83.3%) Multiracial 2 (3.7%)
Total N 52 Health status Excellent 5 (9.3%)
Very good 24 (44.4%) Good 18 (33.3%) Fair 7 (13%) Poor 0 (0%)
Total N 54 Region Northeast 6 (11.1%)
Midwest 13 (24.1%) South 19 (35.2%) West 16 (29.6%)
Total N 54 City size A large city 7 (13%)
A suburb near a large city 19 (35.2%)

A small city or town 22 (40.7%) A rural area 6 (11.1%)
Total N 54 Current Transportation Use and Future Expectations Participants were asked about their current primary mode of transportation as well as their expected primary mode of transportation 10 years from now. Results are displaying in Table 2 and Table 3. Almost all survey respondents reported that their primary mode of transportation was a personally operated vehicle. Most vehicle user reported that they typically drive themselves (85.2%), while others indicated that they primarily received rides from a friend, family member or caregiver (5.6%). Only 3 respondents reported using any other alternative form of transportation, including subway, commuter rail, and walking. When asked about their expected primary form of transportation ten years from now, respondents expected a personally operated vehicle to continue to be their primary mode. While slightly fewer people said they expected to drive themselves (72.2%), an increased number expected that someone else might serve as their chauffeur in the future. While relatively few participants expected to use alternative forms of transportation in the future, two respondents did indicate their interest in using a self-driving car as their primary form of transportation in ten years. One of these respondents was between the ages of 25-35 while the other was between 51-65. Table 2. Primary transportation - now Table 3. Primary transportation – 10 years Mode of Transportation N Mode of Transportation N Drive myself 46 (85.2%) Drive myself 39 (72.2%) Friend, family member or caregiver drives me 3 (5.6%)
Friend, family member or caregiver drives me 8 (14.8%)
Subway 1 (1.9%) A self-driving vehicle 2 (3.7%) Commuter rail 1 (1.9%) Subway 1 (1.9%) Walk 1 (1.9%) Commuter rail 1 (1.9%) N=52 Walk 1 (1.9%)
Car sharing (e.g., Zipcar, Enterprise) 1 (1.9%)
Bus or trolley 1 (1.9%)
N=53 One potential explanation for the low percentage of respondents using alternate modes of transportation may be that participants simply don’t have access to alternative modes. In order to explore this, participants were asked whether or not they were aware of having a bus, subway, or other public transportation within a quarter mile of where they lived. Results can be found in Table 4. A majority (58.1%) of respondents indicated

that they did have access to a bus, subway or other public transportation stop within a short distance of their home. Another third (34.9%) said they do not have access, while only 3 participants said they didn’t know if a public transportation stop was located within a quarter mile. These results indicate that while most participants were not using public transportation as their primary travel mode, a majority did have access to these alternative forms of transportation. Table 4. Public transportation access within a quarter mile Yes 25 (58.1%)
No 15 (34.9%)
Don't know 3 (7%) N=43
Attitudes and Perceptions Toward Public Transportation Survey participants were also asked their attitudes and perceptions of public transportation along multiple dimensions including, ease of use, proximity, stress, and convenience. Questions were framed with both positive and negative statements that respondents could agree or disagree with. Table 5 breaks down the survey results by responses to negative prompts followed by positive prompts. Negative public transportation prompts The majority of survey participants (79.1%) agreed that it takes too long for them to get where they need to by using public transportation. Almost half (46.6%) of participants also agreed that public transportation routes don’t go where they want to go. These perceived drawbacks of public transportation may account for the low rates of usage reported by participants. When asked about public transportation comfort, the plurality (34.9%) reported a neutral opinion. Finally, when asked how difficult public transportation stops or stations are to navigate, responses indicated that participants had few issues navigating the system. Altogether, the data highlight that while public transportation does not appear to be excessively uncomfortable or difficult to navigate, the low perception of convenience of public transportation may be a deterrent to more frequent use. Positive public transportation prompts. The large majority (79.1%) of respondents disagreed with statement ‘public transportation is the most convenient form of transportation for me’, while only 2 participants indicated agreement. Similarly, the majority (74.4%) also disagreed that public transportation is the least stressful way to get around their community, with only one individual agreeing. In line with the number of people who reported that public transportation was not their primary mode of transport, 81.4% of respondents disagree with the statement ‘public transportation is my preferred form of transportation’. Attitudes were mixed regarding how easy public transportation is to figure out, with 41.9% saying they neither agree nor disagree with the statement. There was also variation in perceptions of how close public transportation stops are to individuals’ homes or workplaces.

Strongly disagree Disagree
Neither agree nor disagree Agree Strongly agree
Negative public transportation aspects
Public transportation routes do not go where I want to go
2 (4.7%) 1 (2.3%) 20 (46.5%) 14 (32.6%) 6 (14%)
Public transportation is not comfortable for me2 (4.7%) 6 (14%) 15 (34.9%) 5 (11.6%) 5 (11.6%)
Public transportation stations/stops are difficult for me to navigate
7 (16.3%) 9 (20.9%) 18 (41.9%) 8 (18.6%) 1 (2.3%)
It takes too long for me to get where I need to by public transportation 1 (2.3%) 1 (2.3%) 7 (16.3%) 19 (44.2%) 15 (34.9%)
Positive public transportation aspects
Public transportation is the most convenient form of transportation for me
23 (53.5%) 11 (25.6%) 7 (16.3%) 2 (4.7%) 0 (0%)
Public transportation is the least stressful way for me to get around my community
13 (30.2%) 19 (44.2%) 10 (23.3%) 1 (2.3%) 0 (0%)
Public transportation is easy for me to figure out
1 (2.3%) 11 (25.6%) 18 (41.9%) 9 (20.9%) 4 (9.3%)
Public transportation stations/stops are location close to my home or workplace
8 (18.6%) 8 (18.6%) 7 (16.3%) 17 (39.5%) 3 (7%)
Public transportation is my preferred form of transportation 22 (51.2%) 13 (30.2%) 4 (9.3%) 2 (4.7%) 1 (2.3%)
N=43
Table 5. Positive and negative attitudes toward public transportation

Conclusions
The aim of this study was to gain a preliminary understanding of transportation behaviors, attitudes and perceptions within an individual’s community. While the sample size was small due to the data stemming from national survey pre-test data, results indicated that the vast majority of individuals mainly used personally operated vehicles as their primary mode of transportation. Even when imagining their future transportation needs, respondents primarily cited cars as their primary transportation mode. However, a small subset of respondents mentioned self-driving cars as their expected primarily transportation mode in the future. Because these respondents were from both a younger and older age category, this may point to acceptance of self-driving cars across generations. Although completely autonomous vehicles do not exist today, preliminary research suggests that interest in and acceptance of self-driving cars are negatively correlation with age (Lee et al., 2017). As autonomous vehicles move closer to becoming reality, more research is needed to understand how age might influence attitudes and perceptions, as well as behaviors around these vehicles of the future. Results of this study also indicate that while the majority of participants have access to some form of public transportation, many view their community’s system as inconvenient. This finding is line with the national trends in which 55% of Americans have access to some form of public transportation while only a small percentage actually utilize it on a regular basis (American Public Transportation Association, 2019). The most common inconveniences respondents cited were that public transportation routes were not comprehensive enough to encompasses the locations they needed to access and that trips using public transportation simply took too long to reach their destinations. On the flip side, respondents reported that their public transportation system was relatively easy to use and navigate. Local public transportation authorities may use these results when considering improvements to their systems. This preliminary data suggests that the experience of public transportation may be less of a deterrent for potential users than the geographic scope and efficiency of the system as a whole.
Limitations
Data for this study was collected as part of pre-test for a larger national survey around transportation and housing, therefore the sample size is too low to find statistical significance across generations or other demographic variables. A larger data collection effort is currently in progress which will increase generalizability and statistical significance of the study findings. Additionally, data for this study were based on self-reported responses. When answering self-report questions, participants may not accurately report their use of transportation modes, for example, leading to biased study results (Touranheau, 1999).
Recommendations
While this study was able to provide preliminary insight into people’s attitudes, perceptions, and behaviors around various forms of transportation, the sample size was too small to make any true statistical comparisons. Future research should aim to capture a wider variety of respondents in different communities across to country. By using a larger sample size, future researchers will be able to investigate how people of different demographic characteristics experience and perceive transportation. For example, it would be valuable to know how gender might influence perceptions of transportation comfort, convenience, and ease of use. Additionally, future research may aim to better understand people’s attitudes and perceptions toward autonomous vehicles of the future and how these attitudes may change over time as self-driving cars become a reality. Finally, urban planners and local transportation authorities can use the results of this study to better understand pain points people experience with public transportation in their daily lives. By understanding the challenges and difficulties people face with public transportation systems, planners can better target system improvements that may ultimately lead more people to utilize public transportation.

References
Anderson, M. (2016). Who relies on public transit in the U.S. Pew Research Center. Retrieved from https://www.pewresearch.org/fact-tank/2016/04/07/who-relies-on-public-transit-in-the-u-s/. American Public Transportation Association. (2019). 2019 Public Transportation Fact Book. Retrieved from https://www.apta.com/wp-content/uploads/APTA_Fact-Book-2019_FINAL.pdf.
Cutler, S. J. (1975). Transportation and changes in life satisfaction. The Gerontologist, 15(2), 155-159. Dawkins, C., Jeon, J. S., & Pendall, R. (2015). Transportation access, rental vouchers, and neighborhood satisfaction: Evidence from the moving to opportunity experiment. Housing Policy Debate, 25(3), 497-530.
Dorfman, J. H., & Mandich, A. M. (2015). Senior Migration: Spatial Considerations Of Amenity And Health Access Drivers. Journal of Regional Science,56(1), 96-133. doi:10.1111/jors.12209. Federal Highway Administration. (2018). Summary of Travel Trends: 2017 National Household Travel Survey. U.S. Department of Transportation. Retrieved from https://nhts.ornl.gov/assets/2017_nhts_summary_travel_trends.pdf. Ioannides, Y. M., & Zabel, J. E. (2008). Interactions, neighborhood selection and housing demand. Journal of Urban Economics,63(1), 229-252. doi:10.1016/j.jue.2007.01.010. Lee, C., Ward, C., Raue, M., D’Ambrosio, L. & Coughlin, J.F. (2017). Age differences in acceptance of self-driving cars: A survey of perceptions and attitudes. 3rd International Conference on Human Aspects of IT for the Aged Population, held as part of 19th International Conference on Human-Computer Interaction (HCII 2017), Vancouver, Canada, July 9-14. Mulder, C. H., & Hooimeijer, P. (1999). Residential relocations in the life course. Population issues (pp. 159-186). Springer, Dordrecht. Tourangeau, R. (1999). Remembering what happened: Memory errors and survey reports. In The science of self-report (pp. 41-60). Psychology Press. U.S. Department of Transportation (DOT). (2019). Table 1-41: Principal means of transportation to work (thousands), National Transportation Statistics 2017. Retrieved from http://www.princeton.edu/~alaink/Orf467F17/NTS_Entire_2017Q2.pdf.

Wang, M., Yang, Y., Jin, S., Gu, L., & Zhang, H. (2016). Social and cultural factors that influence residential location choice of urban senior citizens in China – The case of Chengdu city. Habitat International,53, 55-65. doi:10.1016/j.habitatint.2015.10.011.