Embed Size (px)
Citation preview
Technological University Dublin Technological University Dublin
ARROW@TU Dublin ARROW@TU Dublin
Articles Dublin Energy Lab
2010-04-01
Projected Costs of a Grid-Connected Domestic PV System Under Projected Costs of a Grid-Connected Domestic PV System Under
Different Scenarios in Ireland, Using Measured Data from a Trial Different Scenarios in Ireland, Using Measured Data from a Trial
Installation Installation
Lacour Ayompe Technological University Dublin, [email protected]
Aidan Duffy Technological University Dublin, [email protected]
Sarah McCormack University of Dublin, Trinity College, [email protected]
See next page for additional authors
Follow this and additional works at: https://arrow.tudublin.ie/dubenart
Part of the Power and Energy Commons, and the Urban, Community and Regional Planning Commons
Recommended Citation Recommended Citation Ayompe, L., Duffy, A., McCormack, S., & Conlon, M. (2010). Projected costs of a grid-connected domestic PV system under different scenarios in Ireland, using measured data from a trial installation. Energy Policy, vol. 38, pp. 3731-3743. doi:10.1016/j.enpol.2010.02.051
This Article is brought to you for free and open access by the Dublin Energy Lab at ARROW@TU Dublin. It has been accepted for inclusion in Articles by an authorized administrator of ARROW@TU Dublin. For more information, please contact [email protected], [email protected].
This work is licensed under a Creative Commons Attribution-Noncommercial-Share Alike 4.0 License Funder: Department of Education, TSR Strand III

Authors Authors Lacour Ayompe, Aidan Duffy, Sarah McCormack, and Michael Conlon
This article is available at ARROW@TU Dublin: https://arrow.tudublin.ie/dubenart/4
UNCORRECTED PROOF
Projected costs of a grid-connected domestic PV system under differentscenarios in Ireland, using measured data from a trial installation
L.M. Ayompe a,n, A. Duffy a, S.J. McCormack b, M. Conlon c
a Department of Civil and Structural Engineering, School of Civil and Building Services, Dublin Institute of Technology, Bolton Street, Dublin 1, Irelandb Department of Civil, Structural and Environmental Engineering, Trinity College, Dublin 8, Irelandc School of Electrical Engineering Systems, Dublin Institute of Technology, Kevin St, Dublin 8, Ireland
a r t i c l e i n f o
Article history:
Received 14 August 2009
Accepted 24 February 2010
Keywords:
PV system
Net present value (NPV)
Electricity cost
Grid parity
Life cycleQ2 cost
a b s t r a c t
This paper presents results of a study of projected costs for a grid-connected PV system for domestic
application in Ireland. The study is based on results from a 1.72 kWp PV system installed on a flat
rooftop in Dublin, Ireland. During its first year of operation a total of 885.1 kWh/kWp of electricity was
generated with a performance ratio of 81.5%. The scenarios employed in this study consider: a range of
capital costs; cost dynamics based on a PV module learning rate of 2075%; projections for global
annual installed PV capacity under an advanced and moderate market growth conditions; domestic
electricity cost growth of 4.5% based on historic data; and a reduction of 25% or 50% in the CO2 intensity
of national electricity production by 2055. These scenarios are used to predict when system life cycle
production costs fall to grid prices (grid parity).
Average NPV and electricity generation costs ranged from �h14,330 and 0.58 h/kWh and were close
to zero and 0.18 h/kWh for a system installed in 2009 and 2030, respectively. However, under
optimistic conditions NPVs are positive for systems installed after 2021 and grid parity occurs in 2016.
Findings are compared with similar international studies.
& 2010 Published by Elsevier Ltd.
1. Introduction
In April 2008, the Irish Government indicated its interest inmicro-generation by announcing the implementation of amicro- and small-scale electricity generation programme. Pilottrials were due to be installed in 2009 for domestic scale PVsystems (Sustainable Energy Ireland, 2008b). Furthermore, inFebruary 2009 the Irish Government and the largest Irishelectricity supplier, the Electricity Supply Board (ESB) introduceda feed-in tariff of 19h cents per kWh for electricity frommicro-generation (Department of Environment Heritage and LocalGovernment, 2009).
In order to evaluate the performance of PV systems in Ireland itis imperative that both field trials which provide information onthe annual energy yield of typical installations as well as studiesto determine the economics and environmental benefits of PVsystems be undertaken. This information is necessary forevidence-based policy design and implementation.
During operation, PV systems generate electricity without theemission of greenhouse gases such as CO2, while displacing
electricity generated from conventional power plants. Theadoption of PV systems offers significant benefits to householdin terms of reduced energy bills and to society as a whole in termsof reduced greenhouse gas emissions (Ren et al., 2009). Numerousissues remain still to be resolved if PV micro-generation is to beimplemented on a large-scale within the residential sector. Someof these issues include: high electricity generation costs; highcapital cost, high CO2 abatement costs; lack of an adequate tariffstructure for electricity sale; grid integration; and load profilemismatch with electricity generation.
The main objective of this paper is to provide an insight intothe projected energy, economic and environmental performanceof PV systems for domestic applications in Ireland based onsystem cost, system performance, solar radiation data, CO2
emission and energy output dynamics. This would provide usefulinformation to potential investors and policy makers.
2. Methodology
Performance results of a 1.72 kWp PV system installed inDublin, Ireland were used to determine the annual performanceratio and total in-plane solar insolation which are importantparameters used to determine annual energy generation. The totalenergy generated throughout the PV system’s life of 25 years was
1
3
5
7
9
11
13
15
17
19
21
23
25
27
29
31
33
35
37
39
41
43
45
47
49
51
53
55
57
59
61
63
65
67
69
71
73
75
77
79
81
83
85
87
89
91
93
95
ARTICLE IN PRESSJEPO 4104 XML-IS
Contents lists available at ScienceDirect
journal homepage: www.elsevier.com/locate/enpol
Energy Policy
0301-4215/$ - see front matter & 2010 Published by Elsevier Ltd.
doi:10.1016/j.enpol.2010.02.051
n Corresponding author. Tel.: +353 14023940Q1 .
E-mail addresses: [email protected] (L.M. Ayompe), [email protected]
(A. Duffy).
Please cite this article as: Ayompe, L.M., et al., Projected costs of a grid-connected domestic PV system under different scenarios inIreland, using measured data from a trial installation. Energy Policy (2010), doi:10.1016/j.enpol.2010.02.051
Energy Policy ] (]]]]) ]]]–]]]
UNCORRECTED PROOF
ARTICLE IN PRESSJEPO 4104 XML-IS
estimated taking into consideration an annual output drop as aresult of module degradation as a result of exposure to ultravioletradiation. A PV system life of 25 years was chosen in this studysince it is same as the performance warranty period of manymodule producers (EPIA, 2008).
The average installed cost of PV systems in Ireland in 2009, alearning rate of 2075% and two scenarios for PV system annualinstalled capacity growth were used to project the system’sinstalled cost until 2030. These projected costs together with theeconomic parameters in Table 1 were used to calculate projectednet present value and the life cycle cost of electricity generationfor different years of installation at which the PV system isinstalled.
Net life cycle greenhouse gas (GHG) emissions were calculatedtaking into consideration two scenarios reflecting different trendsin the GHG intensity of electricity production in Ireland. The netlife cycle GHG emissions were used to evaluate GHG abatementcosts associated with PV generated electricity in different years ofinstallation.
Key assumptions:
� The current feed-in tariff is applicable throughout the PVsystem’s life.� CO2 emissions due to embodied energy can be ignored from a
national emissions policy perspective since PV modules andsystem components are not manufactured in Ireland.� The inverter is replaced after 10 years.
3. PV system performance
3.1. System description
The grid connected photovoltaic system used in this study wasinstalled at the rooftop of the Focas Institute building, DublinInstitute of Technology, Ireland. It consisted of 8 modulescovering a total area of 10 m2 with an installed capacity of1.72 kWp. The Sanyo HIP-215NHE5 modules were each of 215 Wp
capacity and comprised 72 solar cells made of thinmono-crystalline silicon wafer surrounded by ultra-thin amor-phous silicon layers. The modules had an efficiency of 17.2% understandard test conditions and were connected in series. Theunshaded modules were fixed, inclined at an angle of 531 equal
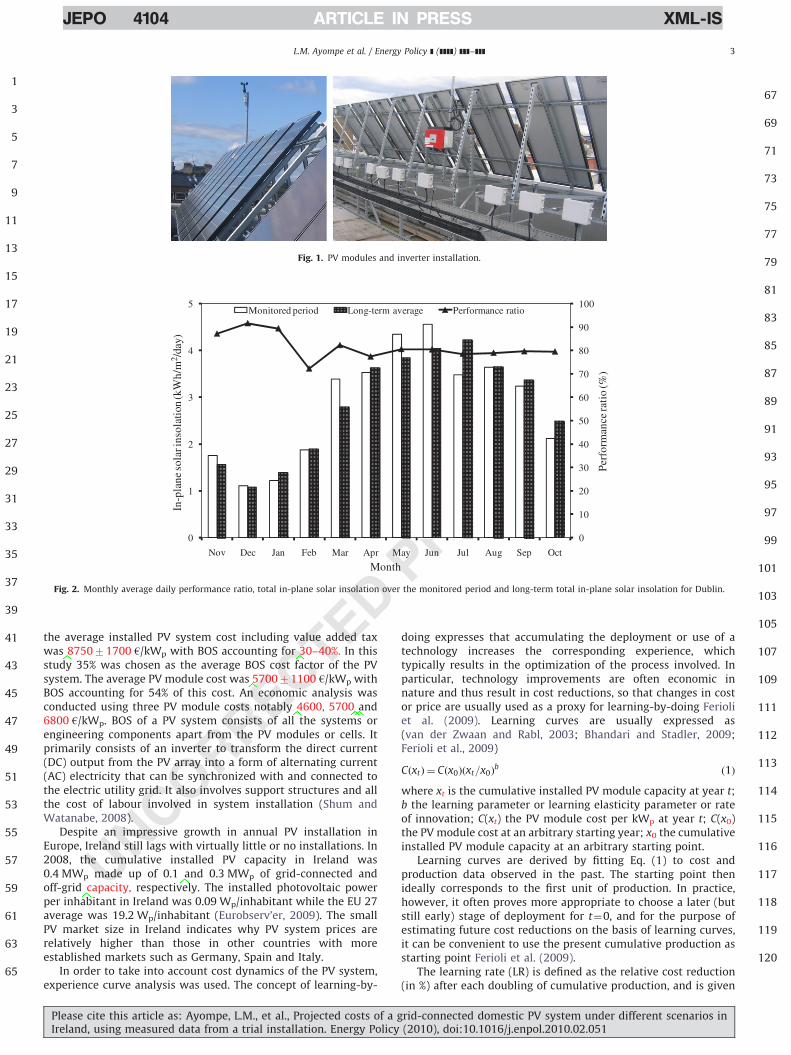
to the latitude of Dublin, facing south at an azimuth angle of zerodegrees. The PV modules were not cleaned throughout themonitoring period. A single phase Sunny Boy SB 1700 inverterwas used to convert DC to AC which was fed directly into thebuilding. The inverter had a maximum efficiency of 93.5% andmaximum AC power of 1700 W. In-plane total solar radiation wasmeasured using a Sunny SensorBox. Additional sensors formeasuring ambient temperature, wind speed and temperatureat the back of one of the PV modules were connected to theSensorBox. The solar radiation sensor had an accuracy of 78%and a resolution of 1 W/m2. The PV module temperature sensorwas a PT 100-M type with accuracy of 70.5 1C while the ambienttemperature sensor was a JUMO PT 100 U type with accuracy of70.5 1C. The anemometer was a Thies small wind transmitterwith accuracy of 75%. Fig. 1 shows the PV modules and inverterinstallation.
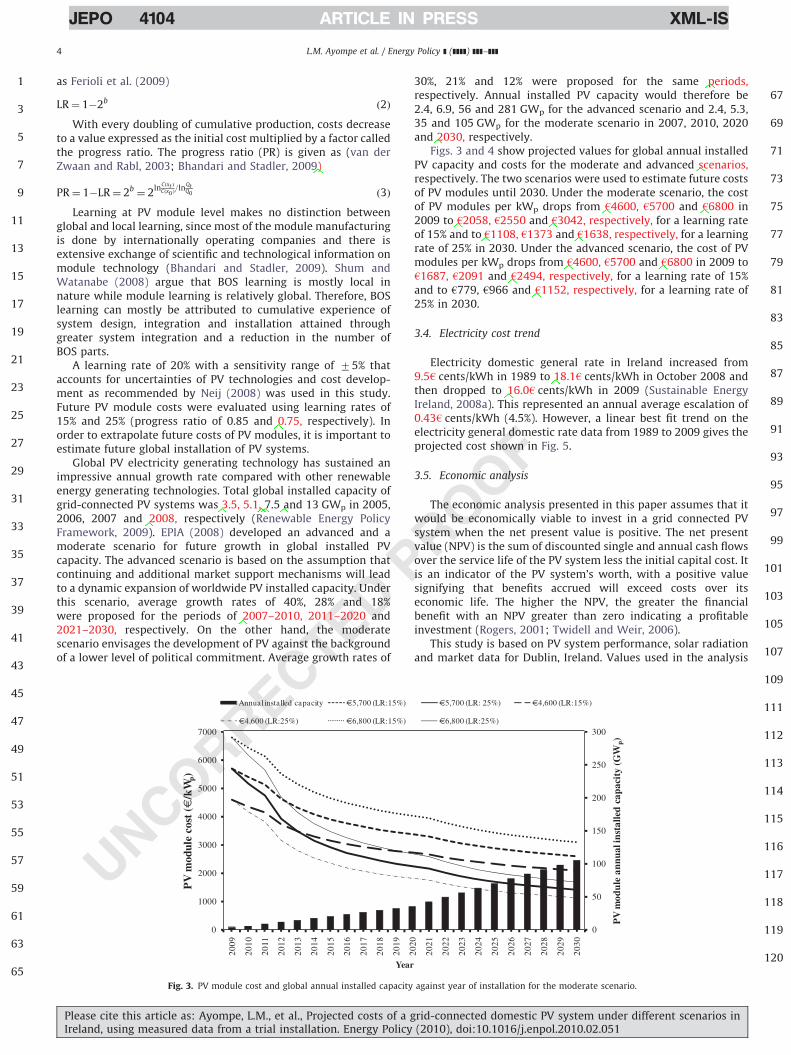
3.2. Solar radiation and performance ratio
The PV system was monitored between November 2008 andOctober 2009. Fig. 2 shows variation of monthly average dailytotal in-plane long-term solar insolation for Dublin, performanceratio and total in-plane solar insolation over the monitoredperiod. A horizontal surface in Dublin receives on average 920peak sunshine hours annually. Long-term monthly average dailytotal in-plane (531) solar insolation values were obtained usingRetScreen4 software (RETScreen International, 2009). The PVsystem’s annual performance ratio was 81.5% while the annualtotal in-plane solar insolation over the monitored period and thelong-term annual average for Dublin were 1043 and 1034 kWh/m2, respectively. The annual total in-plane solar insolation overthe monitored period was 0.83% higher than the long-termaverage so the corrected long-term performance ratio of 80.8%was used in this study.
3.3. PV system cost
The installed cost of a roof mounted, grid-connected PV systemdepends on its capacity; type of PV modules; nature of thebuilding on which it is to be installed; cost of balance of system(BOS) components and installation cost. A survey of 16 crystallinePV systems installed under the government pilot trial programmeadministered by Sustainable Energy Ireland in 2009 withcapacities between 1–6 kWp was conducted. Results showed that
1
3
5
7
9
11
13
15
17
19
21
23
25
27
29
31
33
35
37
39
41
43
45
47
49
51
53
55
57
59
61
63
65
67
69
71
73
75
77
79
81
83
85
87
89
91
93
95
97
99
101
103
105
107
109
111
112
113
114
115
116
117
118
119
120
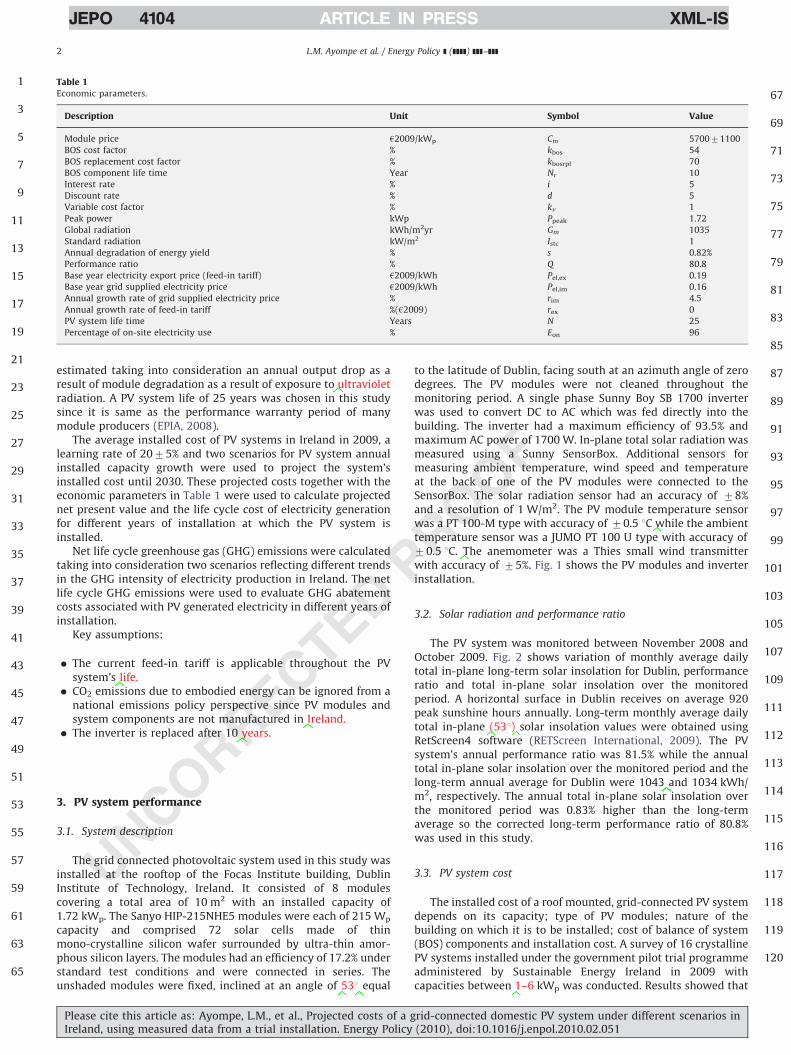
Table 1Economic parameters.
Description Unit Symbol Value
Module price h2009/kWp Cm 570071100
BOS cost factor % kbos 54
BOS replacement cost factor % kbosrpl 70
BOS component life time Year Nr 10
Interest rate % i 5
Discount rate % d 5
Variable cost factor % kv 1
Peak power kWp Ppeak 1.72
Global radiation kWh/m2yr Gm 1035
Standard radiation kW/m2 Istc 1
Annual degradation of energy yield % s 0.82%
Performance ratio % Q 80.8
Base year electricity export price (feed-in tariff) h2009/kWh Pel,ex 0.19
Base year grid supplied electricity price h2009/kWh Pel,im 0.16
Annual growth rate of grid supplied electricity price % rim 4.5
Annual growth rate of feed-in tariff %(h2009) rex 0
PV system life time Years N 25
Percentage of on-site electricity use % Eon 96
L.M. Ayompe et al. / Energy Policy ] (]]]]) ]]]–]]]2
Please cite this article as: Ayompe, L.M., et al., Projected costs of a grid-connected domestic PV system under different scenarios inIreland, using measured data from a trial installation. Energy Policy (2010), doi:10.1016/j.enpol.2010.02.051
UNCORRECTED PROOF
ARTICLE IN PRESSJEPO 4104 XML-IS
the average installed PV system cost including value added taxwas 875071700 h/kWp with BOS accounting for 30–40%. In thisstudy 35% was chosen as the average BOS cost factor of the PVsystem. The average PV module cost was 570071100 h/kWp withBOS accounting for 54% of this cost. An economic analysis wasconducted using three PV module costs notably 4600, 5700 and6800 h/kWp. BOS of a PV system consists of all the systems orengineering components apart from the PV modules or cells. Itprimarily consists of an inverter to transform the direct current(DC) output from the PV array into a form of alternating current(AC) electricity that can be synchronized with and connected tothe electric utility grid. It also involves support structures and allthe cost of labour involved in system installation (Shum andWatanabe, 2008).
Despite an impressive growth in annual PV installation inEurope, Ireland still lags with virtually little or no installations. In2008, the cumulative installed PV capacity in Ireland was0.4 MWp made up of 0.1 and 0.3 MWp of grid-connected andoff-grid capacity, respectively. The installed photovoltaic powerper inhabitant in Ireland was 0.09 Wp/inhabitant while the EU 27average was 19.2 Wp/inhabitant (Eurobserv’er, 2009). The smallPV market size in Ireland indicates why PV system prices arerelatively higher than those in other countries with moreestablished markets such as Germany, Spain and Italy.
In order to take into account cost dynamics of the PV system,experience curve analysis was used. The concept of learning-by-
doing expresses that accumulating the deployment or use of atechnology increases the corresponding experience, whichtypically results in the optimization of the process involved. Inparticular, technology improvements are often economic innature and thus result in cost reductions, so that changes in costor price are usually used as a proxy for learning-by-doing Ferioliet al. (2009). Learning curves are usually expressed as(van der Zwaan and Rabl, 2003; Bhandari and Stadler, 2009;Ferioli et al., 2009)
CðxtÞ ¼ Cðx0Þðxt=x0Þb
ð1Þ
where xt is the cumulative installed PV module capacity at year t;b the learning parameter or learning elasticity parameter or rateof innovation; C(xt) the PV module cost per kWp at year t; C(x0)the PV module cost at an arbitrary starting year; x0 the cumulativeinstalled PV module capacity at an arbitrary starting point.
Learning curves are derived by fitting Eq. (1) to cost andproduction data observed in the past. The starting point thenideally corresponds to the first unit of production. In practice,however, it often proves more appropriate to choose a later (butstill early) stage of deployment for t¼0, and for the purpose ofestimating future cost reductions on the basis of learning curves,it can be convenient to use the present cumulative production asstarting point Ferioli et al. (2009).
The learning rate (LR) is defined as the relative cost reduction(in %) after each doubling of cumulative production, and is given
1
3
5
7
9
11
13
15
17
19
21
23
25
27
29
31
33
35
37
39
41
43
45
47
49
51
53
55
57
59
61
63
65
67
69
71
73
75
77
79
81
83
85
87
89
91
93
95
97
99
101
103
105
107
109
111
112
113
114
115
116
117
118
119
120
0
10
20
30
40
50
60
70
80
90
100
0
1
2
3
4
5
Nov Dec Jan Feb Mar Apr May Jun Jul Aug Sep Oct
Perf
orm
ance
rati
o (%
)
In-p
lane
sola
r ins
olat
ion
(kW
h/m
2 /da
y)
Month
Monitored period Long-term average Performance ratio
Fig. 2. Monthly average daily performance ratio, total in-plane solar insolation over the monitored period and long-term total in-plane solar insolation for Dublin.
Fig. 1. PV modules and inverter installation.
L.M. Ayompe et al. / Energy Policy ] (]]]]) ]]]–]]] 3
Please cite this article as: Ayompe, L.M., et al., Projected costs of a grid-connected domestic PV system under different scenarios inIreland, using measured data from a trial installation. Energy Policy (2010), doi:10.1016/j.enpol.2010.02.051
UNCORRECTED PROOF
ARTICLE IN PRESSJEPO 4104 XML-IS
as Ferioli et al. (2009)
LR¼ 1�2bð2Þ
With every doubling of cumulative production, costs decreaseto a value expressed as the initial cost multiplied by a factor calledthe progress ratio. The progress ratio (PR) is given as (van derZwaan and Rabl, 2003; Bhandari and Stadler, 2009)
PR¼ 1�LR¼ 2b¼ 2
lnCðxt ÞCðx0 Þ
=lnQtQ0 ð3Þ
Learning at PV module level makes no distinction betweenglobal and local learning, since most of the module manufacturingis done by internationally operating companies and there isextensive exchange of scientific and technological information onmodule technology (Bhandari and Stadler, 2009). Shum andWatanabe (2008) argue that BOS learning is mostly local innature while module learning is relatively global. Therefore, BOSlearning can mostly be attributed to cumulative experience ofsystem design, integration and installation attained throughgreater system integration and a reduction in the number ofBOS parts.
A learning rate of 20% with a sensitivity range of 75% thataccounts for uncertainties of PV technologies and cost develop-ment as recommended by Neij (2008) was used in this study.Future PV module costs were evaluated using learning rates of15% and 25% (progress ratio of 0.85 and 0.75, respectively). Inorder to extrapolate future costs of PV modules, it is important toestimate future global installation of PV systems.
Global PV electricity generating technology has sustained animpressive annual growth rate compared with other renewableenergy generating technologies. Total global installed capacity ofgrid-connected PV systems was 3.5, 5.1, 7.5 and 13 GWp in 2005,2006, 2007 and 2008, respectively (Renewable Energy PolicyFramework, 2009). EPIA (2008) developed an advanced and amoderate scenario for future growth in global installed PVcapacity. The advanced scenario is based on the assumption thatcontinuing and additional market support mechanisms will leadto a dynamic expansion of worldwide PV installed capacity. Underthis scenario, average growth rates of 40%, 28% and 18%were proposed for the periods of 2007–2010, 2011–2020 and2021–2030, respectively. On the other hand, the moderatescenario envisages the development of PV against the backgroundof a lower level of political commitment. Average growth rates of
30%, 21% and 12% were proposed for the same periods,respectively. Annual installed PV capacity would therefore be2.4, 6.9, 56 and 281 GWp for the advanced scenario and 2.4, 5.3,35 and 105 GWp for the moderate scenario in 2007, 2010, 2020and 2030, respectively.
Figs. 3 and 4 show projected values for global annual installedPV capacity and costs for the moderate and advanced scenarios,respectively. The two scenarios were used to estimate future costsof PV modules until 2030. Under the moderate scenario, the costof PV modules per kWp drops from h4600, h5700 and h6800 in2009 to h2058, h2550 and h3042, respectively, for a learning rateof 15% and to h1108, h1373 and h1638, respectively, for a learningrate of 25% in 2030. Under the advanced scenario, the cost of PVmodules per kWp drops from h4600, h5700 and h6800 in 2009 toh1687, h2091 and h2494, respectively, for a learning rate of 15%and to h779, h966 and h1152, respectively, for a learning rate of25% in 2030.
3.4. Electricity cost trend
Electricity domestic general rate in Ireland increased from9.5h cents/kWh in 1989 to 18.1h cents/kWh in October 2008 andthen dropped to 16.0h cents/kWh in 2009 (Sustainable EnergyIreland, 2008a). This represented an annual average escalation of0.43h cents/kWh (4.5%). However, a linear best fit trend on theelectricity general domestic rate data from 1989 to 2009 gives theprojected cost shown in Fig. 5.
3.5. Economic analysis
The economic analysis presented in this paper assumes that itwould be economically viable to invest in a grid connected PVsystem when the net present value is positive. The net presentvalue (NPV) is the sum of discounted single and annual cash flowsover the service life of the PV system less the initial capital cost. Itis an indicator of the PV system’s worth, with a positive valuesignifying that benefits accrued will exceed costs over itseconomic life. The higher the NPV, the greater the financialbenefit with an NPV greater than zero indicating a profitableinvestment (Rogers, 2001; Twidell and Weir, 2006).
This study is based on PV system performance, solar radiationand market data for Dublin, Ireland. Values used in the analysis
1
3
5
7
9
11
13
15
17
19
21
23
25
27
29
31
33
35
37
39
41
43
45
47
49
51
53
55
57
59
61
63
65
67
69
71
73
75
77
79
81
83
85
87
89
91
93
95
97
99
101
103
105
107
109
111
112
113
114
115
116
117
118
119
120
0
50
100
150
200
250
300
0
1000
2000
3000
4000
5000
6000
7000
2009
2010
2011
2012
2013
2014
2015
2016
2017
2018
2019
2020
2021
2022
2023
2024
2025
2026
2027
2028
2029
2030
PV
mod
ule
annu
al in
stal
led
capa
city
(GW
p)
PV
mod
ule
cost
(€
/kW
p)
Year
Annual installed capacity €5,700 (LR:15%) €5,700 (LR: 25%) €4,600 (LR:15%)
€4,600 (LR:25%) €6,800 (LR:15%) €6,800 (LR:25%)
Fig. 3. PV module cost and global annual installed capacity against year of installation for the moderate scenario.
L.M. Ayompe et al. / Energy Policy ] (]]]]) ]]]–]]]4
Please cite this article as: Ayompe, L.M., et al., Projected costs of a grid-connected domestic PV system under different scenarios inIreland, using measured data from a trial installation. Energy Policy (2010), doi:10.1016/j.enpol.2010.02.051

UNCORRECTED PROOF
ARTICLE IN PRESSJEPO 4104 XML-IS
are shown in Table 1. The PV used in this analysis had a capacityof 1.72 kWp and generated 885.1 kWh/kWp during its first year ofoperation. The average annual electricity consumption of arepresentative domestic dwelling in Ireland is 5591 kWh. Ananalysis run on the daily energy generated by the PV system on15 min interval and the energy demand profile for the represen-tative dwelling revealed that over a year, 96% of the energygenerated will be consumed on-site while 4% will be exported tothe grid. Over the lifespan of the PV modules, exposure toultraviolet radiation would lead to degradation of power output. Astudy conducted by Osterwald et al. (2002) showed a lineardependence of maximum power degradation of 0.82% per year formono-crystalline Si modules due to exposure to ultravioletradiation.
3.5.1. Performance ratio
The performance ratio (Q) indicates the overall effect of losseson a PV array’s normal power output depending on arraytemperature and incomplete utilization of incident solar radiation
and system component inefficiencies or failures. The PR of a PVsystem indicates how close it approaches ideal performanceduring real operation and allows comparison of PV systemsindependent of location, tilt angle, orientation and their nominalrated power capacity (Blaesser, 1997). Performance ratio isdefined by the following equations as (Eicker, 2003; Nakagamiet al., 2003):
Q ¼Zsys
ZSTC
¼EAC
Gt
GSTC
EDC,STCð4Þ
where, Zsys is the system efficiency (%); ZSTC the efficiency understandard test conditions (%); EAC the AC energy output (kWh);EDC,STC the DC energy output under standard test conditions(kWh); Gt the total in-plane solar radiation; GSTC the total solarradiation under standard test conditions.
3.5.2. Net present value
The present value of total cost of the PV system is the sum ofthe present value of costs associated with the PV module, initialBOS, replacement cost of BOS and variable cost. It is assumed that
1
3
5
7
9
11
13
15
17
19
21
23
25
27
29
31
33
35
37
39
41
43
45
47
49
51
53
55
57
59
61
63
65
67
69
71
73
75
77
79
81
83
85
87
89
91
93
95
97
99
101
103
105
107
109
111
112
113
114
115
116
117
118
119
120
0
5
10
15
20
25
30
35
40
1989
1991
1993
1995
1997
1999
2001
2003
2005
2007
2009
2011
2013
2015
2017
2019
2021
2023
2025
2027
2029
2031
2033
2035
2037
2039
2041
2043
2045
2047
2049
Ele
ctri
city
cos
t (€
cent
s/k
Wh)
Year
Actual cost Projected cost
Fig. 5. Electricity general domestic rate and projections in Ireland from 1989 to 2050.
0
50
100
150
200
250
300
0
1000
2000
3000
4000
5000
6000
7000
2009
2010
2011
2012
2013
2014
2015
2016
2017
2018
2019
2020
2021
2022
2023
2024
2025
2026
2027
2028
2029
2030
PV
mod
ule
ann
ual i
nsta
lled
capa
city
(GW
p)
PV
mod
ule
cost
(€
/kW
p)
Year
Annual installed capacity €5,700 (LR:15%) €5,700 (LR: 25%) €4,600 (LR:15%)
€4,600 (LR:25%) €6,800 (LR:15%) €6,800 (LR:25%)
Fig. 4. PV module cost and global annual installed capacity against year of installation for the advanced scenario.
L.M. Ayompe et al. / Energy Policy ] (]]]]) ]]]–]]] 5
Please cite this article as: Ayompe, L.M., et al., Projected costs of a grid-connected domestic PV system under different scenarios inIreland, using measured data from a trial installation. Energy Policy (2010), doi:10.1016/j.enpol.2010.02.051
UNCORRECTED PROOF
ARTICLE IN PRESSJEPO 4104 XML-IS
money used to buy the PV modules and BOS components areobtained from a bank loan. The total life cycle cost of the PVsystem (Ct) is given as (Bhandari and Stadler, 2009)
Ct ¼ CmtþCBOSþCBOSrepþCv ð5Þ
and written as
Ct ¼ CmPpeak
Xn ¼ N
n ¼ 1
1þ iðN�nþ1Þ
Nð1þdÞn
( )þ
Xn ¼ Nr
n ¼ 1
1þ iðNr�nþ1Þ
Nrð1þdÞn
( )
kkBOSkBOSrep
ð1þdÞðNr Þ
� �þ kvð1þkBOSÞ
Xn ¼ N
n ¼ 1
1
ð1þdÞn
( )2666664
3777775ð6Þ
The PV module price reduction factor (k) is given as
k¼CmðnþNr Þ
CmðnÞ
where Ct is the total PV system cost (h); Cmt the present value ofcost associated with PV module (h2009); CBOS the present value ofcost associated with the initial investment on BOS (h2009); CBOSrep
the present value of BOS replacement cost (h2009); Cv the presentvalue of total variable cost (h2009); GHGEF the greenhouse gasemission factor.
The present value of total revenue from the system during itsuseful life is the sum of the present value of revenue of PVgenerated electricity consumed on-site and the present value ofrevenue of electricity exported to the grid. The size of the PVsystem and the electricity demand profile determine the quantityof electricity it generates that is used on-site to displace gridsupplied electricity at a cost of Pel,im for a given year. The presentvalue of total revenue (Rt) of the PV system is given as
Rt ¼ PpeakQGm
ISTCPel,imEon
Xn ¼ N
n ¼ 1
ð1þnrimÞð1�sÞn�1
ð1þdÞn
"
þPel,exð1�EonÞXn ¼ N
n ¼ 1
ð1þnrexÞð1�sÞn�1
ð1þdÞn
#ð7Þ
The net present value (NPV) of the PV system is given as
NPV¼ Rt�Ct ð8Þ
3.5.3. PV electricity cost
The cost of electricity generated (CE in h/kWh) is the ratio ofthe life cycle cost of the PV system to the total power output fromthe PV system over its service life and is given as
CE ¼Ct
Enð9Þ
The total power output (En in kWh) by the PV system over itsservice life is given as
En ¼ PpeakQGm
ISTC
XN
n ¼ 1
ð1�sÞn�1ð10Þ
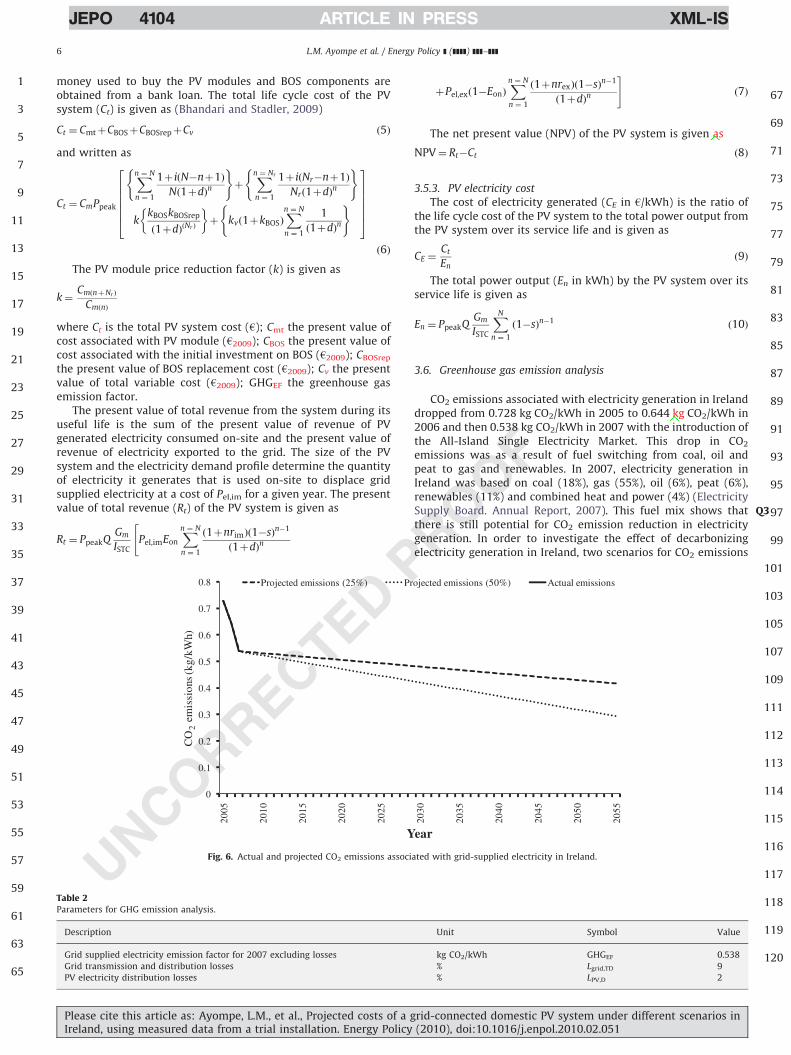
3.6. Greenhouse gas emission analysis
CO2 emissions associated with electricity generation in Irelanddropped from 0.728 kg CO2/kWh in 2005 to 0.644 kg CO2/kWh in2006 and then 0.538 kg CO2/kWh in 2007 with the introduction ofthe All-Island Single Electricity Market. This drop in CO2
emissions was as a result of fuel switching from coal, oil andpeat to gas and renewables. In 2007, electricity generation inIreland was based on coal (18%), gas (55%), oil (6%), peat (6%),renewables (11%) and combined heat and power (4%) (ElectricitySupply Board. Annual Report, 2007 Q3). This fuel mix shows thatthere is still potential for CO2 emission reduction in electricitygeneration. In order to investigate the effect of decarbonizingelectricity generation in Ireland, two scenarios for CO2 emissions
1
3
5
7
9
11
13
15
17
19
21
23
25
27
29
31
33
35
37
39
41
43
45
47
49
51
53
55
57
59
61
63
65
67
69
71
73
75
77
79
81
83
85
87
89
91
93
95
97
99
101
103
105
107
109
111
112
113
114
115
116
117
118
119
120
0
0.1
0.2
0.3
0.4
0.5
0.6
0.7
0.8
2005
2010
2015
2020
2025
2030
2035
2040
2045
2050
2055
CO
2em
issi
ons (
kg/k
Wh)
Year
Projected emissions (25%) Projected emissions (50%) Actual emissions
Fig. 6. Actual and projected CO2 emissions associated with grid-supplied electricity in Ireland.
Table 2Parameters for GHG emission analysis.
Description Unit Symbol Value
Grid supplied electricity emission factor for 2007 excluding losses kg CO2/kWh GHGEF 0.538
Grid transmission and distribution losses % Lgrid,TD 9
PV electricity distribution losses % LPV,D 2
L.M. Ayompe et al. / Energy Policy ] (]]]]) ]]]–]]]6
Please cite this article as: Ayompe, L.M., et al., Projected costs of a grid-connected domestic PV system under different scenarios inIreland, using measured data from a trial installation. Energy Policy (2010), doi:10.1016/j.enpol.2010.02.051
UNCORRECTED PROOF
ARTICLE IN PRESSJEPO 4104 XML-IS
reduction were considered in this study namely: 25% and 50%reduction of 2007 emissions between 2007 and 2055 when a PVsystem with a service life of 25 years installed in 2030 will bedecommissioned as shown in Fig. 6.
Table 2 shows the parameters used to calculate the quantity ofavoided CO2 emissions by the PV system. Avoided CO2 emissionsassociated with grid supplied electricity are essentially thosedisplaced by PV generated electricity used on-site. On the otherhand, avoided CO2 emissions associated with PV generated
electricity exported to the grid are reduced by the distributionlosses on the low voltage distribution lines since this electricityends up within the PV system’s neighbourhood.
3.6.1. Avoided greenhouse gas emissions
PV systems produce electricity in a CO2 neutral way duringtheir service life although some CO2 emissions arise during theproduction of PV modules and other equipment. In this study theembodied emissions due to the production of the PV systemcomponents are neglected since the components are notmanufactured in Ireland and do not therefore affect nationalCO2 emission figures. The total quantity of avoided greenhousegas emissions (GHGavoided in kg CO2/kWh) during the PV system’sservice life is the sum of avoided emissions due to the quantity ofdisplaced grid-supplied electricity by the PV system used on-site(including transmission and distribution losses) plus the quantityof avoided emissions due to electricity exported to the low
1
3
5
7
9
11
13
15
17
19
21
23
25
27
29
31
33
35
37
39
41
43
45
47
49
51
53
55
57
59
61
63
65
67
69
71
73
75
77
79
81
83
85
87
89
91
93
95
97
99
101
103
105
107
109
111
112
113
114
115
116
117
118
119
120
(0.49)
(0.60)
(0.72)
(0.46)
(0.57)
(0.68)
(0.48)
(0.59)
(0.71)
(0.46)
(0.57)
(0.67)
-20000
-18000
-16000
-14000
-12000
-10000
-8000
-6000
-4000
-2000
0
€4,600 €5,700 €6,800
Net
pre
sent
val
ue (€
)
PV module cost (€ /kWp)
Moderate 15 Moderate 25 Advanced 15 Advanced 25
Fig. 8. Net present value and electricity generation cost against PV module cost under different scenarios. Life cycle electricity production costs (h/kWh) are shown in
parenthesis.
-20,000
-15,000
-10,000
-5,000
0
5,000
2009
2010
2011
2012
2013
2014
2015
2016
2017
2018
2019
2020
2021
2022
2023
2024
2025
2026
2027
2028
2029
2030
Net
pre
sent
val
ue (€
)
Year of installation
Moderate 15 Moderate 25 Advanced 15 Advanced 25
Fig. 9. Net present value for different years of installation under different scenarios for PV module cost of h4600 per kWp.
Global PV market growth Moderate
Learning
Rate
‘Moderate 25’
‘Moderate 15’
‘Advanced 25’
‘Advanced 15’
Advanced
25%
15%
Fig. 7. PV learning rate and global growth scenarios.
L.M. Ayompe et al. / Energy Policy ] (]]]]) ]]]–]]] 7
Please cite this article as: Ayompe, L.M., et al., Projected costs of a grid-connected domestic PV system under different scenarios inIreland, using measured data from a trial installation. Energy Policy (2010), doi:10.1016/j.enpol.2010.02.051
UNCORRECTED PROOF
ARTICLE IN PRESSJEPO 4104 XML-IS
voltage grid (including distribution losses). It is calculated usingEq. (11) given as
GHGavoided ¼ PpeakQGm
ISTC
XN
n ¼ 1
ð1�sÞn�1GHGEF,n Eonð1þLgrid,TDÞ�
þð1�EonÞð1þLgrid,TD�LPV,DÞ�
ð11Þ
3.6.2. Greenhouse gas emissions abatement cost
The total cost of greenhouse gas emissions abatement (CGHG) iscalculated using the negative values of NPV which indicate theamount of money required to make the investment on the PVsystem economically viable. It is calculated using Eq. (12) given as
CGHG ¼NPV
GHGavoidedð12Þ
4. Results and discussion
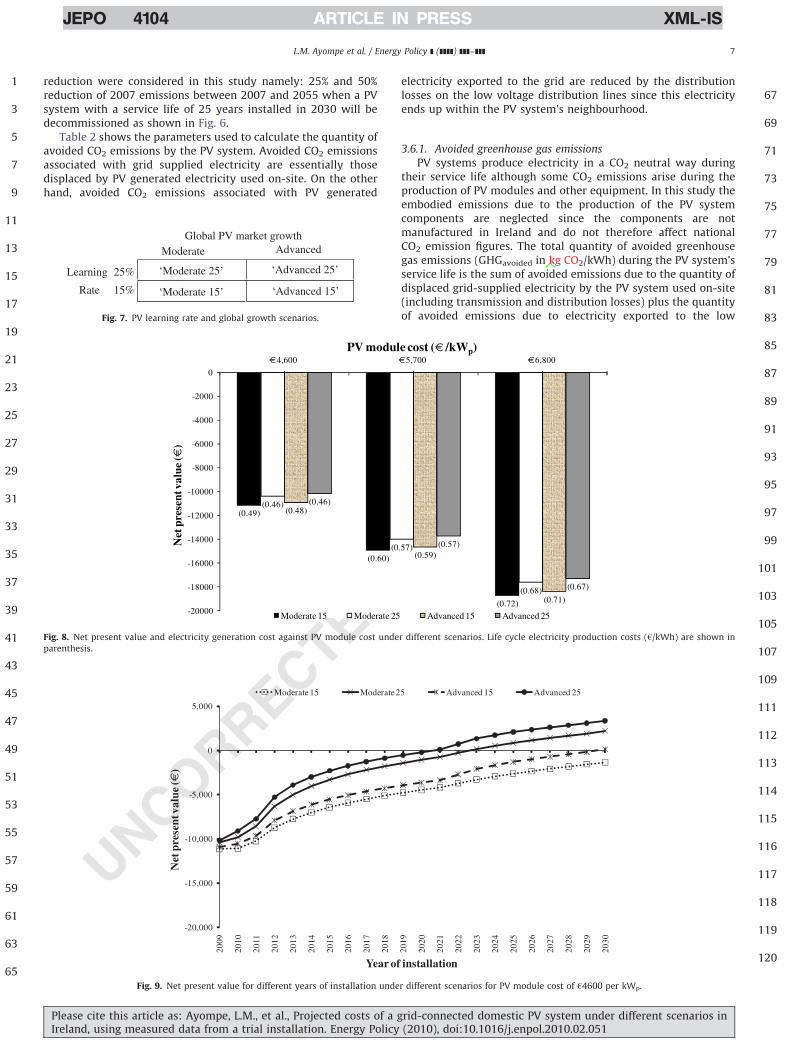
Four scenarios were developed to model the effect of PVmodule cost reduction based on a moderate and advanced growthin annual installed global PV capacity and a learning rate of either15% or 25% (i.e. 20%75%). The scenarios are illustrated in Fig. 7.System NPVs and life cycle electricity generation costs werecalculated for the four scenarios based on the PV system costs anda system lifespan of 25 years.
4.1. PV system installed in 2009
Fig. 8 shows system NPVs and electricity generation costsagainst PV module costs under the different scenarios for PVsystems installed in 2009. It can be seen that NPVs decrease withPV module costs for a given scenario. The values in bracketsrepresent the life cycle costs of electricity generation in h/kWh.
1
3
5
7
9
11
13
15
17
19
21
23
25
27
29
31
33
35
37
39
41
43
45
47
49
51
53
55
57
59
61
63
65
67
69
71
73
75
77
79
81
83
85
87
89
91
93
95
97
99
101
103
105
107
109
111
112
113
114
115
116
117
118
119
120
-20,000
-15,000
-10,000
-5,000
0
5,000
2009
2010
2011
2012
2013
2014
2015
2016
2017
2018
2019
2020
2021
2022
2023
2024
2025
2026
2027
2028
2029
2030
Net
pre
sent
val
ue (€
)
Year of installation
Moderate 15 Moderate 25 Advanced 15 Advanced 25
Fig. 10. Net present value for different years of installation under different scenarios for PV module cost of h5700 per kWp.
-20,000
-15,000
-10,000
-5,000
0
5,000
2009
2010
2011
2012
2013
2014
2015
2016
2017
2018
2019
2020
2021
2022
2023
2024
2025
2026
2027
2028
2029
2030
Net
pre
sent
val
ue (€
)
Year of installation
Moderate 15 Moderate 25 Advanced 15 Advanced 25
Fig. 11. Net present value against year of installation under different scenarios for PV module cost of h6800 per kWp.
L.M. Ayompe et al. / Energy Policy ] (]]]]) ]]]–]]]8
Please cite this article as: Ayompe, L.M., et al., Projected costs of a grid-connected domestic PV system under different scenarios inIreland, using measured data from a trial installation. Energy Policy (2010), doi:10.1016/j.enpol.2010.02.051

UNCORRECTED PROOF
ARTICLE IN PRESSJEPO 4104 XML-IS
Electricity generation costs also decrease with increases inlearning rates for a given PV module price. However, electricitygeneration costs which increase with PV module cost are lowerfor the advanced scenarios than the moderate scenarios whileholding learning rates constant.
The system’s NPV reduces from �h10,173 for PV module costof h4600 per kWP to �h18,718 per kWp for the Advanced 25 andModerate 15 scenarios, respectively. The negative NPVs showedthat investment in the PV system in 2009 was not economicallyviable. The average cost of PV electricity generation was 0.47, 0.58and 0.70 h/kWh for PV module costs of h4600, h5700 and h6800per kWp, respectively.
4.2. Net present value and electricity cost projections
The negative NPV values for the PV system installed in 2009presented in Section 4.1 show that at present it is not economically
viable to invest in the PV system under the conditions assumed inthis study. However, the cost reduction potential of PV modules dueto market growth, learning by doing and technological develop-ments (resulting in a learning rate of 2075%) together with thelikely long-term increase in the value of electricity assumed to be(4.5% per annum) has the effect of improving the NPV for systemsinstalled post 2009. Therefore, the future values of NPV and life cycleelectricity generation costs for systems installed after 2009 werecalculated for each of the scenarios (see Fig. 7) and capital costprojections (see Figs. 3 and 4). Results obtained show that theNPV increases with year of investment and systems becomeeconomically viable under some scenarios and PV module costswithin the time horizon analysed (up to 2030). The negativevalues of NPV indicate the level of additional capital supportrequired to make investment in the PV system economically viable.The support required decreases as the year of investment increasesbeyond 2009.
1
3
5
7
9
11
13
15
17
19
21
23
25
27
29
31
33
35
37
39
41
43
45
47
49
51
53
55
57
59
61
63
65
67
69
71
73
75
77
79
81
83
85
87
89
91
93
95
97
99
101
103
105
107
109
111
112
113
114
115
116
117
118
119
120
0.0
0.1
0.2
0.3
0.4
0.5
0.6
0.7
0.8
2009
2010
2011
2012
2013
2014
2015
2016
2017
2018
2019
2020
2021
2022
2023
2024
2025
2026
2027
2028
2029
2030
Ele
ctri
city
cos
t (€
/kW
h)
Year of installation
Grid electricity Moderate 15 Moderate 25 Advanced 15 Advanced 25
Fig. 13. PV-generated and grid-supplied electricity cost against year of installation under different scenarios for PV module cost of h5700 per kWp.
0.0
0.1
0.2
0.3
0.4
0.5
0.6
0.7
0.8
2009
2010
2011
2012
2013
2014
2015
2016
2017
2018
2019
2020
2021
2022
2023
2024
2025
2026
2027
2028
2029
2030
Ele
ctri
city
cos
t (€
/kW
h)
Year of installation
Grid electricity Moderate 15 Moderate 25 Advanced 15 Advanced 25
Fig. 12. PV-generated and grid-supplied electricity cost against year of installation under different scenarios for PV module cost of h4600 per kWp.
L.M. Ayompe et al. / Energy Policy ] (]]]]) ]]]–]]] 9
Please cite this article as: Ayompe, L.M., et al., Projected costs of a grid-connected domestic PV system under different scenarios inIreland, using measured data from a trial installation. Energy Policy (2010), doi:10.1016/j.enpol.2010.02.051
UNCORRECTED PROOF
ARTICLE IN PRESSJEPO 4104 XML-IS
4.2.1. Net present value
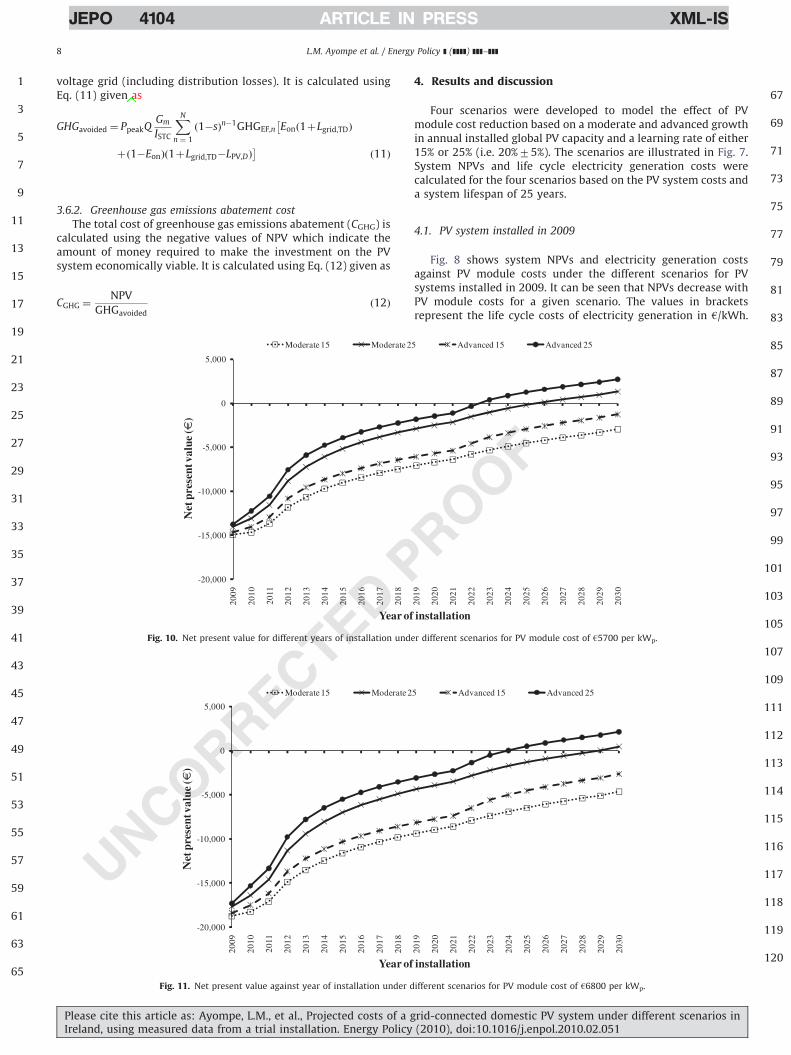
Figs. 9–11 show variation in NPV against year of installationunder different scenarios for initial (2009) PV module costs of h4600,h5700 and h6800 per kWp, respectively. Fig. 9 shows that for aninitial PV module cost of h4600 per kWp, the investment would beeconomically viable under the Advanced 15, Moderate 25 andAdvanced 25 scenarios in 2030, 2023 and 2021, respectively. Fig. 10shows that for an initial PV module cost of h5700 per kWp, theinvestment would be economically viable under the Moderate 25and Advanced 25 scenarios in 2026 and 2023, respectively. Fig. 11shows that for an initial PV module cost of h6800 per kWp, theinvestment would be economically viable under the Moderate 25and Advanced 25 scenarios in 2029 and 2024, respectively.
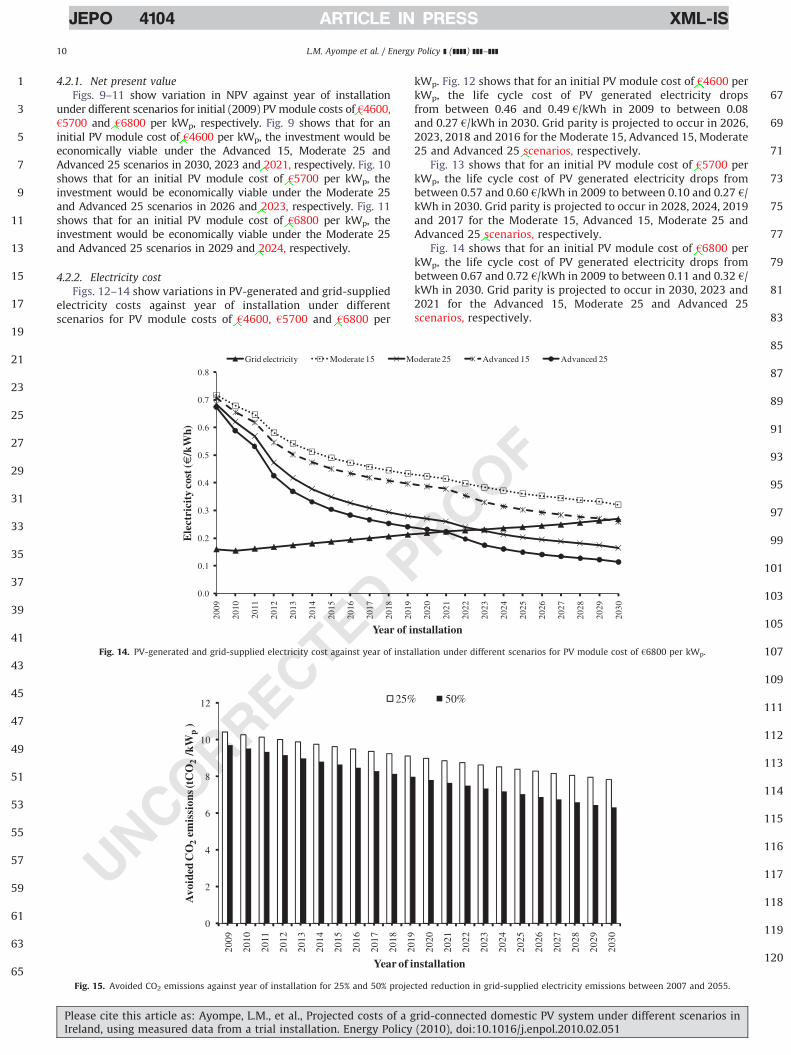
4.2.2. Electricity cost
Figs. 12–14 show variations in PV-generated and grid-suppliedelectricity costs against year of installation under differentscenarios for PV module costs of h4600, h5700 and h6800 per
kWp. Fig. 12 shows that for an initial PV module cost of h4600 perkWp, the life cycle cost of PV generated electricity dropsfrom between 0.46 and 0.49 h/kWh in 2009 to between 0.08and 0.27 h/kWh in 2030. Grid parity is projected to occur in 2026,2023, 2018 and 2016 for the Moderate 15, Advanced 15, Moderate25 and Advanced 25 scenarios, respectively.
Fig. 13 shows that for an initial PV module cost of h5700 perkWp, the life cycle cost of PV generated electricity drops frombetween 0.57 and 0.60 h/kWh in 2009 to between 0.10 and 0.27 h/kWh in 2030. Grid parity is projected to occur in 2028, 2024, 2019and 2017 for the Moderate 15, Advanced 15, Moderate 25 andAdvanced 25 scenarios, respectively.
Fig. 14 shows that for an initial PV module cost of h6800 perkWp, the life cycle cost of PV generated electricity drops frombetween 0.67 and 0.72 h/kWh in 2009 to between 0.11 and 0.32 h/kWh in 2030. Grid parity is projected to occur in 2030, 2023 and2021 for the Advanced 15, Moderate 25 and Advanced 25scenarios, respectively.
1
3
5
7
9
11
13
15
17
19
21
23
25
27
29
31
33
35
37
39
41
43
45
47
49
51
53
55
57
59
61
63
65
67
69
71
73
75
77
79
81
83
85
87
89
91
93
95
97
99
101
103
105
107
109
111
112
113
114
115
116
117
118
119
120
0.0
0.1
0.2
0.3
0.4
0.5
0.6
0.7
0.8
2009
2010
2011
2012
2013
2014
2015
2016
2017
2018
2019
2020
2021
2022
2023
2024
2025
2026
2027
2028
2029
2030
Ele
ctri
city
cos
t (€
/kW
h)
Year of installation
Grid electricity Moderate 15 Moderate 25 Advanced 15 Advanced 25
Fig. 14. PV-generated and grid-supplied electricity cost against year of installation under different scenarios for PV module cost of h6800 per kWp.
0
2
4
6
8
10
12
2009
2010
2011
2012
2013
2014
2015
2016
2017
2018
2019
2020
2021
2022
2023
2024
2025
2026
2027
2028
2029
2030
Avo
ided
CO
2em
issi
ons (
tCO
2/k
Wp
)
Year of installation
25% 50%
Fig. 15. Avoided CO2 emissions against year of installation for 25% and 50% projected reduction in grid-supplied electricity emissions between 2007 and 2055.
L.M. Ayompe et al. / Energy Policy ] (]]]]) ]]]–]]]10
Please cite this article as: Ayompe, L.M., et al., Projected costs of a grid-connected domestic PV system under different scenarios inIreland, using measured data from a trial installation. Energy Policy (2010), doi:10.1016/j.enpol.2010.02.051
UNCORRECTED PROOF
ARTICLE IN PRESSJEPO 4104 XML-IS
4.3. Avoided greenhouse gas emissions
Fig. 15 shows avoided total life cycle CO2 emissions against yearof installation for a 25% and 50% projected reduction in grid-suppliedelectricity emissions between 2007 and 2055. The results show areduction in the quantity of avoided CO2 emissions due to theprojected reduction in GHG emissions associated with electricitygeneration. It is seen that the total quantity of avoided CO2
emissions for the PV system installed in 2009 reduces from 10.4and 9.7 tCO2/kWp for the 25% and 50% cases, respectively, to 7.8 and6.3 tCO2/kWp if the PV system was installed in 2030. This shows thatreducing the intensity of GHG emissions associated with thegeneration of grid supplied electricity reduces the attractiveness ofPV systems in mitigating CO2 emissions.
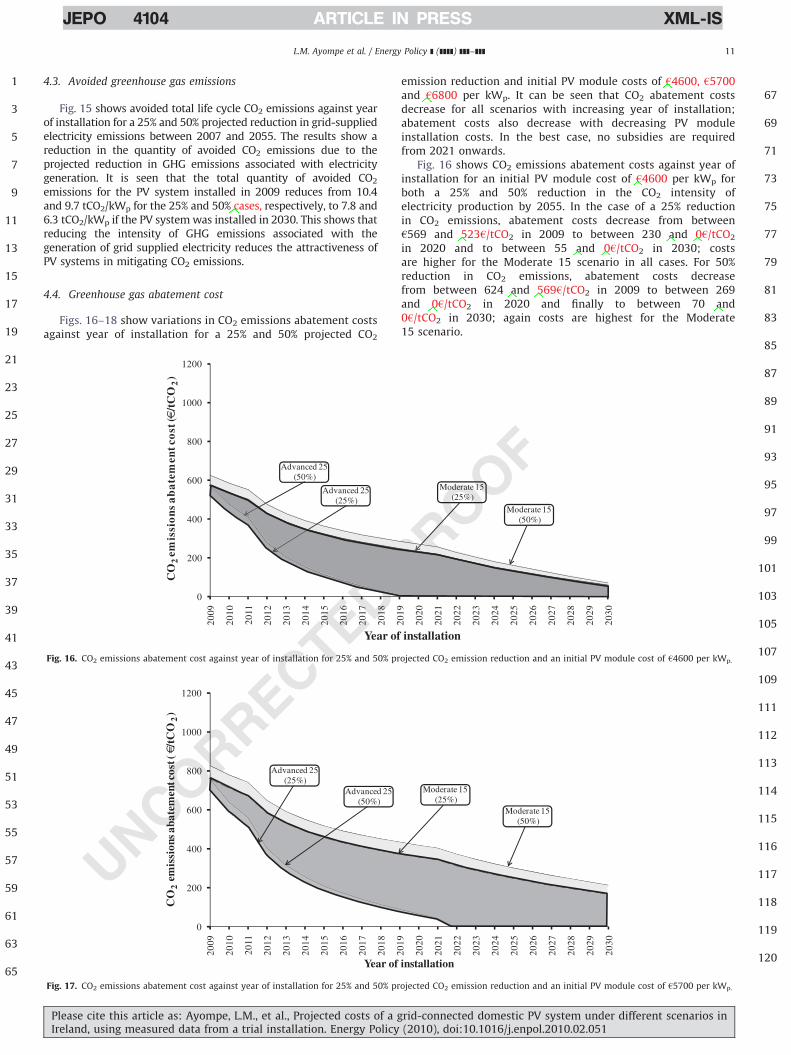
4.4. Greenhouse gas abatement cost
Figs. 16–18 show variations in CO2 emissions abatement costsagainst year of installation for a 25% and 50% projected CO2
emission reduction and initial PV module costs of h4600, h5700and h6800 per kWp. It can be seen that CO2 abatement costsdecrease for all scenarios with increasing year of installation;abatement costs also decrease with decreasing PV moduleinstallation costs. In the best case, no subsidies are requiredfrom 2021 onwards.
Fig. 16 shows CO2 emissions abatement costs against year ofinstallation for an initial PV module cost of h4600 per kWp forboth a 25% and 50% reduction in the CO2 intensity ofelectricity production by 2055. In the case of a 25% reductionin CO2 emissions, abatement costs decrease from betweenh569 and 523h/tCO2 in 2009 to between 230 and 0h/tCO2
in 2020 and to between 55 and 0h/tCO2 in 2030; costsare higher for the Moderate 15 scenario in all cases. For 50%reduction in CO2 emissions, abatement costs decreasefrom between 624 and 569h/tCO2 in 2009 to between 269and 0h/tCO2 in 2020 and finally to between 70 and0h/tCO2 in 2030; again costs are highest for the Moderate15 scenario.
1
3
5
7
9
11
13
15
17
19
21
23
25
27
29
31
33
35
37
39
41
43
45
47
49
51
53
55
57
59
61
63
65
67
69
71
73
75
77
79
81
83
85
87
89
91
93
95
97
99
101
103
105
107
109
111
112
113
114
115
116
117
118
119
120
0
200
400
600
800
1000
1200
2009
2010
2011
2012
2013
2014
2015
2016
2017
2018
2019
2020
2021
2022
2023
2024
2025
2026
2027
2028
2029
2030
CO
2(t soctn e
met aba
sno issime
€/t
CO
2)
Year of installation
Advanced 25(25%)
Advanced 25(50%)
Moderate 15(25%)
Moderate 15(50%)
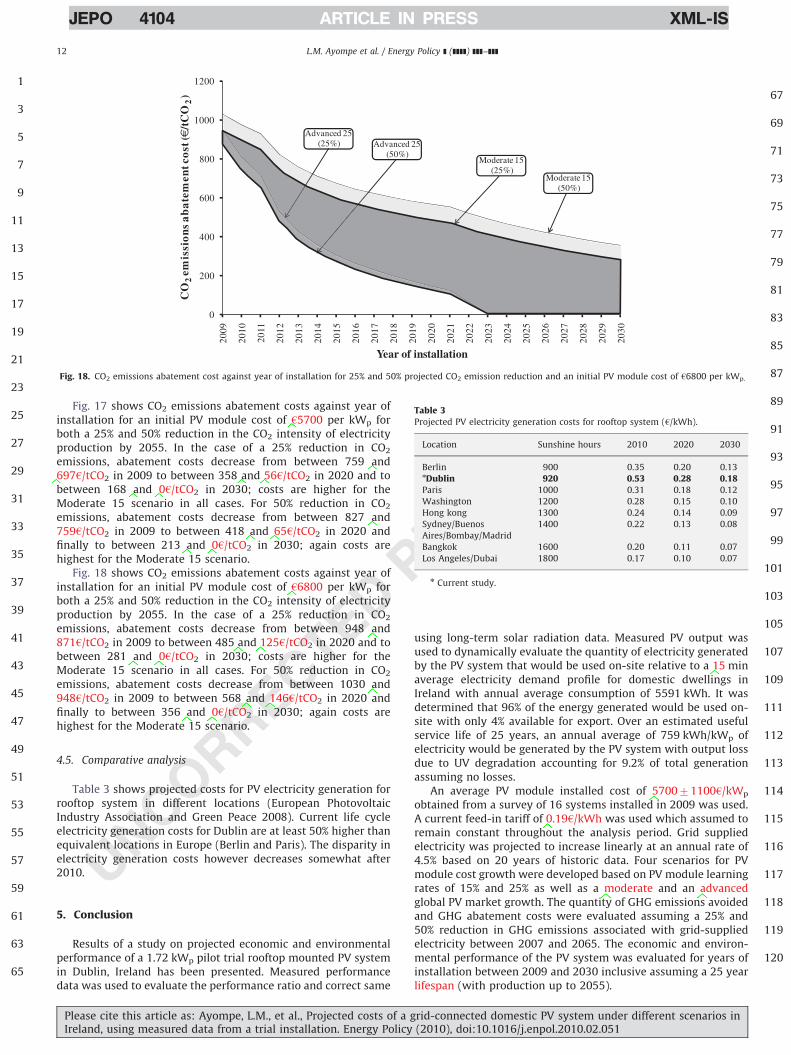
Fig. 16. CO2 emissions abatement cost against year of installation for 25% and 50% projected CO2 emission reduction and an initial PV module cost of h4600 per kWp.
0
200
400
600
800
1000
1200
2009
2010
2011
2012
2013
2014
2015
2016
2017
2018
2019
2020
2021
2022
2023
2024
2025
2026
2027
2028
2029
2030
CO
2em
issi
ons a
bate
men
t cos
t (€/
tCO
2)
Year of installation
Advanced 25(25%)
Advanced 25(50%)
Moderate 15(25%)
Moderate 15(50%)
Fig. 17. CO2 emissions abatement cost against year of installation for 25% and 50% projected CO2 emission reduction and an initial PV module cost of h5700 per kWp.
L.M. Ayompe et al. / Energy Policy ] (]]]]) ]]]–]]] 11
Please cite this article as: Ayompe, L.M., et al., Projected costs of a grid-connected domestic PV system under different scenarios inIreland, using measured data from a trial installation. Energy Policy (2010), doi:10.1016/j.enpol.2010.02.051
UNCORRECTED PROOF
ARTICLE IN PRESSJEPO 4104 XML-IS
Fig. 17 shows CO2 emissions abatement costs against year ofinstallation for an initial PV module cost of h5700 per kWp forboth a 25% and 50% reduction in the CO2 intensity of electricityproduction by 2055. In the case of a 25% reduction in CO2
emissions, abatement costs decrease from between 759 and697h/tCO2 in 2009 to between 358 and 56h/tCO2 in 2020 and tobetween 168 and 0h/tCO2 in 2030; costs are higher for theModerate 15 scenario in all cases. For 50% reduction in CO2
emissions, abatement costs decrease from between 827 and759h/tCO2 in 2009 to between 418 and 65h/tCO2 in 2020 andfinally to between 213 and 0h/tCO2 in 2030; again costs arehighest for the Moderate 15 scenario.
Fig. 18 shows CO2 emissions abatement costs against year ofinstallation for an initial PV module cost of h6800 per kWp forboth a 25% and 50% reduction in the CO2 intensity of electricityproduction by 2055. In the case of a 25% reduction in CO2
emissions, abatement costs decrease from between 948 and871h/tCO2 in 2009 to between 485 and 125h/tCO2 in 2020 and tobetween 281 and 0h/tCO2 in 2030; costs are higher for theModerate 15 scenario in all cases. For 50% reduction in CO2
emissions, abatement costs decrease from between 1030 and948h/tCO2 in 2009 to between 568 and 146h/tCO2 in 2020 andfinally to between 356 and 0h/tCO2 in 2030; again costs arehighest for the Moderate 15 scenario.
4.5. Comparative analysis
Table 3 shows projected costs for PV electricity generation forrooftop system in different locations (European PhotovoltaicIndustry Association and Green Peace 2008). Current life cycleelectricity generation costs for Dublin are at least 50% higher thanequivalent locations in Europe (Berlin and Paris). The disparity inelectricity generation costs however decreases somewhat after2010.
5. Conclusion
Results of a study on projected economic and environmentalperformance of a 1.72 kWp pilot trial rooftop mounted PV systemin Dublin, Ireland has been presented. Measured performancedata was used to evaluate the performance ratio and correct same
using long-term solar radiation data. Measured PV output wasused to dynamically evaluate the quantity of electricity generatedby the PV system that would be used on-site relative to a 15 minaverage electricity demand profile for domestic dwellings inIreland with annual average consumption of 5591 kWh. It wasdetermined that 96% of the energy generated would be used on-site with only 4% available for export. Over an estimated usefulservice life of 25 years, an annual average of 759 kWh/kWp ofelectricity would be generated by the PV system with output lossdue to UV degradation accounting for 9.2% of total generationassuming no losses.
An average PV module installed cost of 570071100h/kWp
obtained from a survey of 16 systems installed in 2009 was used.A current feed-in tariff of 0.19h/kWh was used which assumed toremain constant throughout the analysis period. Grid suppliedelectricity was projected to increase linearly at an annual rate of4.5% based on 20 years of historic data. Four scenarios for PVmodule cost growth were developed based on PV module learningrates of 15% and 25% as well as a moderate and an advancedglobal PV market growth. The quantity of GHG emissions avoidedand GHG abatement costs were evaluated assuming a 25% and50% reduction in GHG emissions associated with grid-suppliedelectricity between 2007 and 2065. The economic and environ-mental performance of the PV system was evaluated for years ofinstallation between 2009 and 2030 inclusive assuming a 25 yearlifespan (with production up to 2055).
1
3
5
7
9
11
13
15
17
19
21
23
25
27
29
31
33
35
37
39
41
43
45
47
49
51
53
55
57
59
61
63
65
67
69
71
73
75
77
79
81
83
85
87
89
91
93
95
97
99
101
103
105
107
109
111
112
113
114
115
116
117
118
119
120
0
200
400
600
800
1000
1200
2009
2010
2011
2012
2013
2014
2015
2016
2017
2018
2019
2020
2021
2022
2023
2024
2025
2026
2027
2028
2029
2030
CO
2(tsoctne
m etaba
snoissime
€/t
CO
2)
Year of installation
Advanced 25(25%) Advanced 25
(50%)Moderate 15
(25%)Moderate 15
(50%)
Fig. 18. CO2 emissions abatement cost against year of installation for 25% and 50% projected CO2 emission reduction and an initial PV module cost of h6800 per kWp.
Table 3Projected PV electricity generation costs for rooftop system (h/kWh).
Location Sunshine hours 2010 2020 2030
Berlin 900 0.35 0.20 0.13nDublin 920 0.53 0.28 0.18Paris 1000 0.31 0.18 0.12
Washington 1200 0.28 0.15 0.10
Hong kong 1300 0.24 0.14 0.09
Sydney/Buenos 1400 0.22 0.13 0.08
Aires/Bombay/Madrid
Bangkok 1600 0.20 0.11 0.07
Los Angeles/Dubai 1800 0.17 0.10 0.07
n Current study.
L.M. Ayompe et al. / Energy Policy ] (]]]]) ]]]–]]]12
Please cite this article as: Ayompe, L.M., et al., Projected costs of a grid-connected domestic PV system under different scenarios inIreland, using measured data from a trial installation. Energy Policy (2010), doi:10.1016/j.enpol.2010.02.051

UNCORRECTED PROOF
ARTICLE IN PRESSJEPO 4104 XML-IS
Results obtained showed that domestic grid-supplied electricitycost is projected to grow from 0.16h/kWh in 2009 to 0.27h/kWh in2030 and 0.45h/kWh in 2065. PV generated electricity costs decreasefrom 0.60 and 0.57h/kWh in 2009 to 0.27 and 0.10h/kWh in 2030 forthe Moderate 15 and Advanced 25 scenarios, respectively. Gridparity would then occur in 2030 and 2019 for the Moderate 15 andAdvanced 25 scenarios, respectively. The system NPVs increase from�h14,926 and �h13,734 in 2009 to �h2971 and h2731 for theModerate 15 and Advanced 25 scenarios, respectively, during thesame period. The corresponding normalized NPVs would thereforeincrease from �8678 and �7985h/kWp in 2009 to �1727 and1588h/kWp, respectively. For all four scenarios considered, theaverage PV generated electricity costs drop from 0.58 to 0.18h/kWhwhile the average NPV increases from �h14,330 to �h35 if the PVsystem is installed in 2009 and 2030, respectively. The normalizedaverage NPV increases from –8331 to �20h/kWp for PV systemsinstalled in 2009 and 2030, respectively. Grid parity then occurs in2024. The total quantity of avoided CO2 emissions for the PV systeminstalled in 2009 reduces from 10.4 and 9.7 tCO2/kWp for the 25%and 50% cases, respectively, to 7.8 and 6.3 tCO2/kWp if the PV systemwas installed in 2030. The life cycle cost of CO2 abatement dropsfrom between 523 and 1030h/tCO2 in 2009 to between 0 and 568h/tCO2 in 2020 and finally to between 0 and 356h/tCO2 in 2030.
A comparative analysis shows that current PV system costs areat least 50% higher in Ireland than other jurisdictions with similarclimatic conditions. This suggests that the market is not operatingoptimally, possibly due to the low numbers of buyers and sellersor due to a lack of market information such as system price andquality. Significant decreases in capital costs might occur,therefore, if many buyers and sellers entered the market andinformation were more freely available. This would requiremarket intervention such as subsidies (e.g. grants or low costloans), higher feed-in tariffs, or regulation. However witha current marginal cost of abatement of between 523 and1030h/tCO2, widespread deployment would be costly and wouldnot represent best value for money for the taxpayer.
References
Bhandari, R., Stadler, I., 2009. Grid parity analysis of solar photovoltaic systems inGermany using experience curves. Solar Energy 83 (9), 1634–1644.
Blaesser, G., 1997. PV system measurements and monitoring the Europeanexperience. Solar Energy Materials and Solar Cells 47 (1–4), 167–176.
Department of Environment Heritage and Local Government, 2009. People power./http://www.dcenr.gov.ie/Press+Releases/People+power+-+Minister+Ryan+announces+incentives+for+micro-generation.htmS (accessed on 20/03/2009).
Eicker, U., 2003. Solar Technologies for Buildings.. John Wiley and Sons, England.Electricity Supply Board. Annual Report 2007: ESB power generation review.
/http://www.esb.ieS (accessed on 30/10/2008).Eurobserv’er, March 2009. Photovoltaic barometer.EPIA, 2008. Solar generation V. /http://www.epia.orgS (accessed on 13/12/2008).
Ferioli, F., Schoots, K., et al., 2009. Use and limitations of learning curves for energytechnology policy: a component-learning hypothesis. Energy Policy 37 (7),2525–2535.
Nakagami, H., Ishihar, O., et al., 2003. Performance of residential PV system underactual field conditions in wester part of Japan. In: International Solar EnergyConference, Hawaii, USA.
Neij, L., 2008. Cost development of future technologies for power generation—astudy based on experience curves and complementary bottom-up assess-ments. Energy Policy 36 (6), 2200–2211.
Osterwald, C.R., Anderberg, A., et al., May 2002. Degradation analysis of weatheredcrystalline-silicon PV modules. National Renewable Energy Laboratory, NREL/CP-520-31455. /http://www.nrel.gov/docs/fy02osti/31455.pdfS.
Ren, H., Gao, W., Ruan, Y., 2009. Economic optimization and sensitivity analysis ofphotovoltaic system in residential buildings. Renewable Energy 34 (3),883–889.
Renewable Energy Policy Framework (REN21), 2009. Renewables global statusreport: 2009 update. Paris.
RETScreen International, 2009. Renewable energy project analysis software./http://www.retscreen.netS.
Rogers, M., 2001. Engineering Project Appraisal. Blackwell Science, Oxford, UK.Shum, K.L., Watanabe, C., 2008. Towards a local learning (innovation) model of
solar photovoltaic deployment. Energy Policy 36 (2), 508–521.Sustainable Energy Ireland, 2008a. Domestic fuel datasheet. /http://www.sei.ieS
(accessed on 17/10/2008).Sustainable Energy Ireland, 2008b. Micro and small scale-generation pilot trial
consultation. /http://www.sei.ie/index.asp?locID=1708&docID=-1S (accessedon 20/11/2008).
Twidell, J., Weir, T., 2006. Renewable Energy Resources. Taylor and Francis, NewYork.
van der Zwaan, B., Rabl, A., 2003. Prospects for PV: a learning curve analysis. SolarEnergy 74 (1), 19–31.
Glossary
Annual degradation of PV yield (s): Percentage at which the maximum powerdegrades due to exposure to ultraviolet radiation (%);
Balance of system (BOS): All PV system components other than the PV modules orcells;
BOS cost factor (kbos): BOS components cost relative to the cost of PV modules;Discount rate (D): Interest rate used to discount future cash flows (%);Feed-in tariff (FIT): Policy mechanism designed to pay the producer of electricity at
a specific rate usually higher than the purchase price;Global radiation (Gm): Sum of beam (direct) and diffuse (indirect) solar radiation
(kWh/m2/yr);Greenhouse gases (GHG): Gases in the atmosphere that absorb and emit radiation
within the thermal infrared range;Grid parity: When the cost of PV generated electricity equals that of grid supplied
electricity;Interest rate (i): Rate charged or paid for the use of money expressed as an annual
percentage of the principal (%);Net present value (NPV): Sum of present value of costs associated with the PV
module, initial BOS, replacement cost of BOS and variable cost (h);Peak power (Ppeak): Maximum rated power under standard test conditions;Performance ratio (Q): Indicator of how close a PV system approaches ideal
performance during real operation and allows for comparison of PV systemsindependent of location, tilt angle, orientation and their nominal rated powercapacity;
PV system life (N): Period during which a PV system produces energy (years);Standard radiation (Istc): Total solar radiation under standard test conditions for PV
modules (1 kW/m2) ;Variable cost factor (kv): Proportion of the initial investment used annually for
system maintenance and insurance.
1
3
5
7
9
11
13
15
17
19
21
23
25
27
29
31
33
35
37
39
41
43
45
47
49
51
53
55
57
59
61
63
65
67
69
71
73
75
77
79
81
83
85
87
89
91
93
95
97
99
101
L.M. Ayompe et al. / Energy Policy ] (]]]]) ]]]–]]] 13
Please cite this article as: Ayompe, L.M., et al., Projected costs of a grid-connected domestic PV system under different scenarios inIreland, using measured data from a trial installation. Energy Policy (2010), doi:10.1016/j.enpol.2010.02.051