Embed Size (px)
Citation preview
Tellus (2009), 61B, 602–617 C© 2009 IIASAJournal compilation C© 2009 Blackwell Munksgaard
Printed in Singapore. All rights reserved
T E L L U S
Projections of SO2, NOx and carbonaceous aerosolsemissions in Asia
By Z. K LIM O N T 1,∗, J. C O FA LA 1, J. X IN G 2, W. W EI2, C . ZH A N G 2, S . WA N G 2, J. K EJU N 3,P. B H A N DA R I4, R . M ATH U R 4, P. PU RO H IT 1, P. R A FA J1, A . C H A M B ER S 1, M . A M A N N 1
and J. H AO 2, 1International Institute for Applied Systems Analysis, A-2361 Laxenburg, Austria; 2TsinghuaUniversity, Beijing 100084, China; 3Energy Research Institute, B-1503, Jia. No.11, Beijing 100038, China;
4The Energy and Resources Institute, Darbari Seth Block, Habitat Place, Lodi Road, New Delhi 110003, India
(Manuscript received 11 August 2008; in final form 8 May 2009)
A B S T R A C TEstimates of Asian emissions of air pollutants and carbonaceous aerosols and their mid-term projections have beenchanging significantly in the last years. The remote sensing community has shown that increase in NOx in CentralEast Asia is much stronger than any of the emission inventories or projections indicated so far. A number of studiesreviewing older estimates appeared. Here, we review the key contributions and compare them to the most recent resultsof the GAINS model application for Asia and to the SRES projections used in the IPPC work. The recent projectionsindicate that the growth of emissions of SO2 in Asia should slow down significantly towards 2010 or even stabilize atthe current level. For NOx, however, further growth is projected although it will be most likely slower that in the lastdecade, owing to introduction of measures in transport. Emissions of carbonaceous aerosols (black carbon and organiccarbon) are expected to decline after 2010, largely due to reduced use of biofuels in residential sector and efficiencyimprovements. The estimates of these emissions are burdened with significantly larger uncertainties than SO2 and NOx;even for the year 2000 the differences in estimates between studies are up to a factor of 2.
1. Introduction
Asian emissions of air pollutants have been growing at an un-precedented rate over the last decade. This is directly linkedto the continuing strong economic growth (averaging to about10% a−1 in the last decade) in China and India. In spite ofthe environmental legislation introduced in several countries,specifically targeting transport sector in urban areas as well aspower plant sector, the emissions continue to grow and the Asiancontribution to the global emissions of SO2 and NOx increasedfrom about 30 and 20% in the beginning of the 1990s to 50and 35% in 2005, respectively (Cofala et al., 2007). The paceof change from mid 1990s until now has been hotly debated inseveral papers, especially for China where the decline in coalconsumption reported in statistics in the end of the last centurydoes not correspond to the continuing economic growth (Streetsand Aunan, 2005; Akimoto et al., 2006).
The work of the remote sensing community has indicated amuch faster growth of NOx emissions in the Central and East
∗Corresponding author.e-mail: [email protected]: 10.1111/j.1600-0889.2009.00428.x
Asia in the last decade (Richter et al., 2005) than previouslyshown in emission inventory work and models (He et al., 2007;Zhang et al., 2007). Similarly high growth has been estimatedrecently for emissions of SO2 in Asia (Richter et al., 2007).
Early inventories and projections suffered from poor dataavailability, were too optimistic about the pace of introductionand efficiency of environmental legislation, and underestimatedthe economic growth experienced in the last decade in Chinaand India. In the last few years a number of authors reassessedtheir previous emission estimates for Asia for several pollutants(e.g. Streets et al., 2006; Ohara et al., 2007; Zhang et al., 2007).The new assessment of past developments led to a revision ofseveral projections. This paper discusses the recent mid-termscenarios of SO2, NOx, black carbon (BC) and primary particu-late organic carbon (OC) emissions in Asia developed with theGreenhouse Gas and Air Pollution Interactions and Synergies(GAINS) model and compares them to the key peer reviewedprojections of air pollutants as well as to the SO2 and NOx
SRES scenarios for Asia (Nakicenovic et al., 2000) used also inthe Fourth Assessment Report of the IPPC (IPCC, 2007).
Presented here GAINS model findings are a further evolutionof results shown for Asia by Klimont et al. (2001), Cofala et al.(2004) and in the global study by Cofala et al. (2007). They take
602 Tellus 61B (2009), 4
P U B L I S H E D B Y T H E I N T E R N A T I O N A L M E T E O R O L O G I C A L I N S T I T U T E I N S T O C K H O L M
SERIES BCHEMICALAND PHYSICAL METEOROLOGY
ESTIMATES OF ASIAN EMISSIONS OF AIR POLLUTANTS AND CARBONACEOUS AEROSOLS 603
into account new information on activity data and local emis-sion factors developed by the authors or updated based on themost recent studies, for example, Zhang et al. (2007), as wellas new national economic projections for China and India. Fi-nally, the model has been improved to better represent some im-portant emission sources. Examples include: brick production,where regional statistics and several brick making technologiesare distinguished, residential combustion, where more detailedtypes of biomass (fuel wood, agricultural residue and dung) andstoves (heating and cooking stoves) are considered. Also data onopen burning of agricultural residue has improved due to inclu-sion of regional statistics. All data used in the model for largercountries are on the subnational level, compatible with the ap-proach used previously in the RAINS-Asia model (IIASA, 2001;Cofala et al., 2004). For example, calculations for China distin-guish 32 regions and for India 23 regions. Further details on themethodology and data used are discussed in the next section.
2. Method and data
Our emission estimates for Asia have been developed withthe GAINS model (http://gains.iiasa.ac.at). The GAINS model(previously RAINS) has been originally developed for Europe(Schopp et al., 1999) with specific modules for calculating airpollutant emissions, environmental impacts, and control costs.The relevant documentation for the pollutants included in thispaper, that is, for SO2 (Cofala and Syri, 1998a), NOx (Cofalaand Syri, 1998b) and carbonaceous aerosols (Kupiainen andKlimont, 2004, 2007) can be downloaded from the model site.Development of a comparable model for Asia followed; firstfor SO2 and later for NOx and the latest version of RAINS-Asia model is still available (IIASA, 2001). The model was peerreviewed in 2004 (CEC, 2004) and shortly afterwards the devel-opment of GAINS has started (Klaassen et al., 2004). GAINSextends to include greenhouse gasses and allows for the analy-sis of the synergies in air pollution and climate policies but theprinciples of emission calculation remain similar to the RAINSmodel. For a given country i, year y and pollutant n consideredin this paper, this is shown in the equation below
Ei,n,y =∑
j,k,l
Ai,j,k,l,y
∑
m
[efi,j,k,l,n(1 − ηi,k,m,n)Xi,j,k,l,m,y], (1)
where, j represents the province (administrative region); k rep-resents the economic sector or combustion technology type (e.g.stoves in residential sector, cement production, open biomassburning); l represents the fuel type (if relevant for a specific k);m represents the abatement technology type; E is the nationalannual emissions; A is the activity level (e.g. fuel consumption,production of cement, amount of biomass burned on-field); ef isthe uncontrolled emission factor; η is the reduction efficiency ofthe abatement technology and X is the penetration of the abate-ment measure m expressed as a percentage of total activity A,
for example, fuel consumption in a given sector k, such that�X = 1.
2.1. Emission factors
Emission factors in GAINS-Asia are an updated and extendedversion of data collected for the RAINS-Asia model. Updatestake into account recent literature reporting measurements ofAsian sources, findings of local projects where authors of thispaper have been involved, and local information on parametersneeded to calculate emission factors, for example, sulphur or ashcontent of fuels. Methodologies differ in detail for consideredcompounds.
The uncontrolled emission factors (ef) for SO2 are calculatedusing country-region (i,j), sector (k) and fuel (l) specific param-eters (Cofala and Syri, 1998a)
efi,j,k,l = 2sci,j,k,l
hvi,j,k,l
(1 − sri,j,k,l), (2)
where, sc is the sulphur content (per weight) of the fuel; hv is theheat value of the fuel and sr is the fraction of sulphur retainedin ash. The parameters used in this equation have been collectedfrom national sources and vary between provinces/states in agiven country resulting in province/state specific values of ef.Emission factors derived in eq. (2) represent uncontrolled sit-uation. The actual emission rate will depend on the type andimplementation rate of abatement measure, which in GAINSinclude for SO2 low sulphur fuel, in-furnace control (limestoneinjection) and flue gas desulphurization (FGD). The assumptionson the current and future penetration of measures, determiningthe implied emission factor, are discussed in the next section.
For stationary sources of NOx, uncontrolled emission factorsrely on reported measurements on specific installations. Eachtype of stationary combustion sources needs to meet emissionstandard, which may be achieved through implementation ofprimary (combustion modification, including low NOx burner)or secondary (catalytic or non-catalytic reduction) measures.In particular, our current assessment includes (in aggregatedform) recent findings for China by Zhang et al. (2007). For othercountries and industrial combustion our values are similar tothose summarized by Streets et al. (2003) and Garg et al. (2001)who reviewed a number of local measurements, and those usedby Cofala et al. (2007).
The uncontrolled emission factors in transport are determinedbased on studies where local conditions, fuel and vehicle type,and driving patterns representative of the pre-2000 vehicle fleetare considered (Fu et al., 2001; Garg et al., 2001; Streets et al.,2003). In order to include the impacts of legislation on transportsector emissions, GAINS distinguishes EURO stages (a packageof measures including fuel standards, engine modification andend-of-pipe measures) as abatement technologies.
Emissions factors for BC and OC in the GAINS frameworkare assessed together with the estimates of total particulate
Tellus 61B (2009), 4
604 Z. KLIMONT ET AL.
matter (PM) emissions to assure overall consistency (Klimontet al., 2002; Kupiainen and Klimont, 2004). For solid fossilfuels the PM emission factors consider the local fuel quality pa-rameters like ash content, heat value and ash retention in boilerresulting in province/state specific values. Although, the BC andOC emission rates are ‘decoupled’ from the fossil fuel qualityparameters and consequently are independent from the estimatesof PM10, PM2.5, etc., the consistency is safeguarded by com-paring the BC and OC rates with estimates of fine particles. Suchverification is also performed for biomass and other fuels as wellas for process sources.
Originally developed characteristics for BC and OC inGAINS are applicable in general for the developed countries(Kupiainen and Klimont, 2007). The database was extended fur-ther for global application (Cofala et al., 2007) drawing largelyon Bond et al. (2004) who reviewed several measurements per-formed in the developing countries with special emphasis onAsia. Further, we have reviewed newer sources of informa-tion for Asia, that is, available after Bond et al. (2004) study(Parashar et al., 2005; Venkataraman et al., 2005; Cao et al.,2006; Kannari et al., 2007; Ohara et al., 2007) and introducedminor adjustments.
All emission factors, underlying parameter data, and other as-sumptions can be viewed in the on-line version of the GAINS-Asia model (http://gains.iiasa.ac.at) while a more detailed de-scription of several specific aspects for Asia is also available inthe methodology document (Amann et al., 2008a).
2.2. Scenario assumptions
We report results of several projects carried out with the sup-port of the European Commission. The GAINS projection orig-inates from the GAINS-Asia model scenarios (Amann et al.,2008b). They were developed in the period 2006–2008 in col-laboration between the research groups at International Institutefor Applied Systems Analysis (IIASA) in Laxenburg (Austria),Tsinghua University and Energy Research Institute (ERI) inBeijing (China) and The Energy and Resources Institute (TERI)in New Delhi (India). The Atmospheric Composition Change,The European Network of Excellence (ACCENT) projectionsoriginate from the studies of global emissions (Cofala et al.,2006, 2007).
The recent GAINS-Asia scenarios include not only updateof activity data for the years 2000–2005 but also a number ofpotential future developments in the energy sector, includingpenetration of alternative technologies and renewable energy,creating basis for the ‘alternative’ scenario to the ‘baseline’development. These new projections originate from the mostrecent national studies; for India developed by The Energy andResources Institute (TERI, 2006) and for China by the EnergyResearch Institute based on the latest 11-yr plan and describedin the recently completed GAINS-Asia report (Amann et al.,
2008b). Furthermore, we have developed two projections simu-lating varying level of the implementation of air pollution legis-lation. These define upper (baseline) and lower (very optimisticassumptions about implementation of legislation) bounds for thepresented GAINS projection (see the range in Figs. 3–6). Thisis justified not only by the uncertainty in the real life reductionefficiencies of the control technologies but even more so dueto the uncertainty in the actual enforcement (Xu et al., 2009),size distribution and lifetime of installations which will play asignificant role in how quickly the expected reduction can beachieved. More detailed discussion of respective assumptionsand their effects is presented in Section 3.1 (see Tables 1–3).
All databases developed in the GAINS-Asia study includeprovincial/state level data, that is, detailed sectoral, fuel andtechnological information considering, to an extent possi-ble, the local factors. The databases and results can be ac-cessed from the GAINS-Asia model website (registration re-quired): http://gains.iiasa.ac.at/. Sectoral fuel consumption inthe GAINS-Asia baseline is provided in the Appendix S1 inSupporting Information to this paper while base year and futureevolution of emission factors for key categories is discussed inSection 3.1 and shown in Tables 2 and 3.
The global ACCENT projections up to 2030 were developedbetween 2005 and 2006 making use of the available at the timenational information on emission legislation and on projectionsof activity data; for Asia data from the RAINS-Asia implemen-tation (Cofala et al., 2004) were used. Where national activitydata was not available we applied the trends of future economicand energy developments of the IPCC SRES B2 MESSAGEscenario (Nakicenovic et al., 2000; Riahi and Roehl, 2000) tothe activity levels reported in international statistics for the year2000 (IEA, 2002; UN, 2003). Within ACCENT we developedtwo sets of scenarios. The first set (ACCENT_v1) includes esti-mates for SO2, NOx, CO and CH4. Detailed information on theassumptions, data sources, and regional results have been doc-umented in Cofala et al. (2006). The second set (ACCENT_v2)includes, for Asia, updates of the air pollution control legislation(ADB, 2005) and year 2000 activity data that were available bythe end of 2006. This projection includes also emission esti-mates for carbonaceous aerosols and has been documented inCofala et al. (2007). For both ACCENT studies, the activity dataand estimated emissions, aggregated by SRES, regions can bealso downloaded from the dedicated websites; for details see theoriginal papers.
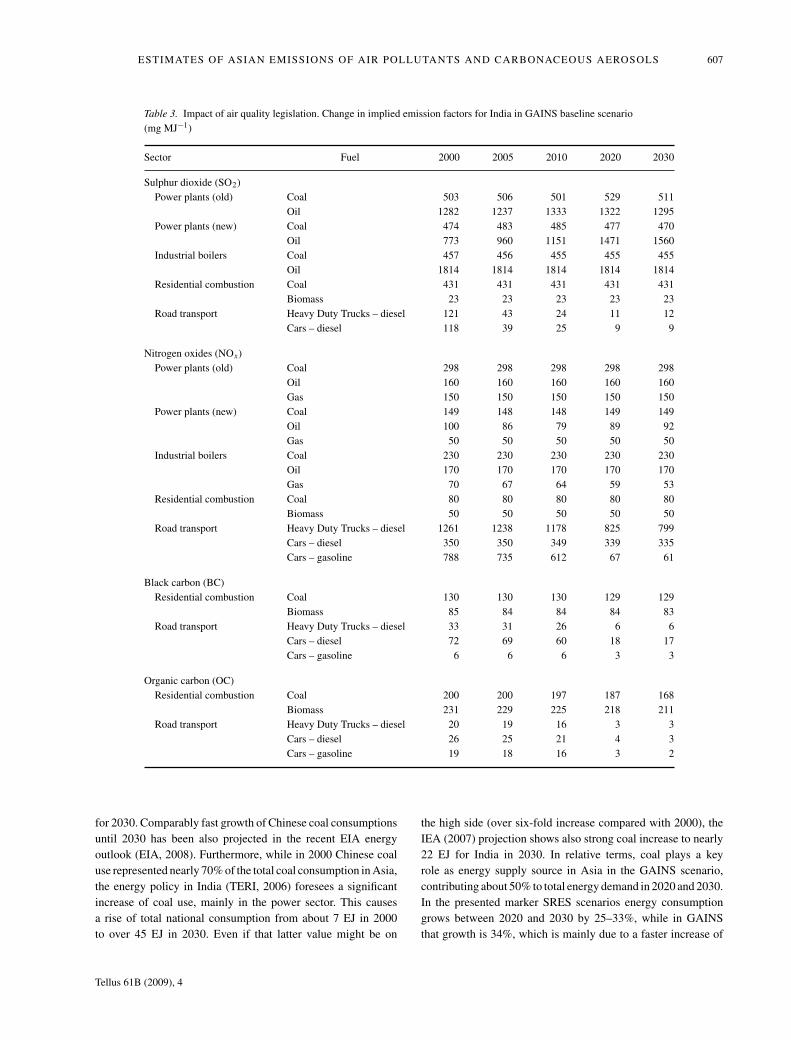
2.2.1. Comparison with SRES scenarios. In order to compareour recent projections to SRES we selected four marker scenar-ios representative of the four SRES families (Nakicenovic et al.,2000). For A1, the results of the AIM model were used; forA2, the ASF model, for B1, the IMAGE model and for B2, theMESSAGE model. Fig. 1 shows scenario assumptions on theevolution of key macroeconomic parameters related to the year2000 and the total primary energy supply for the year 2000 and2030.
Tellus 61B (2009), 4
ESTIMATES OF ASIAN EMISSIONS OF AIR POLLUTANTS AND CARBONACEOUS AEROSOLS 605
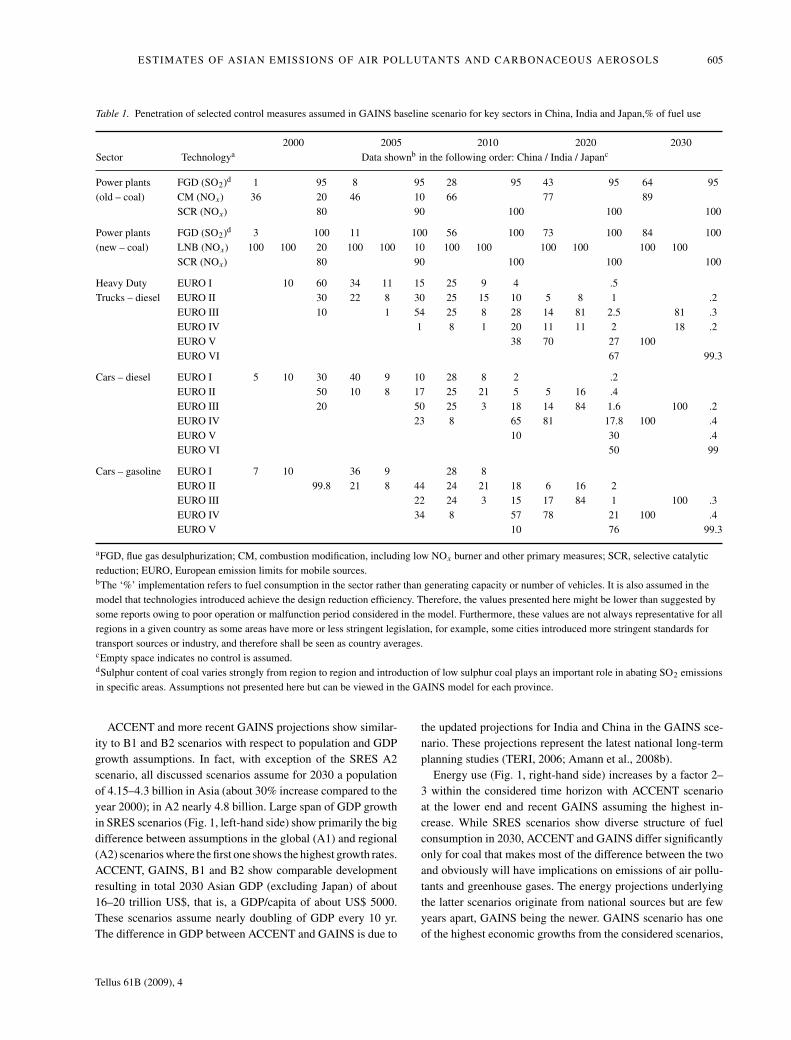
Table 1. Penetration of selected control measures assumed in GAINS baseline scenario for key sectors in China, India and Japan,% of fuel use
2000 2005 2010 2020 2030Sector Technologya Data shownb in the following order: China / India / Japanc
Power plants FGD (SO2)d 1 95 8 95 28 95 43 95 64 95(old – coal) CM (NOx) 36 20 46 10 66 77 89
SCR (NOx) 80 90 100 100 100
Power plants FGD (SO2)d 3 100 11 100 56 100 73 100 84 100(new – coal) LNB (NOx) 100 100 20 100 100 10 100 100 100 100 100 100
SCR (NOx) 80 90 100 100 100
Heavy Duty EURO I 10 60 34 11 15 25 9 4 .5Trucks – diesel EURO II 30 22 8 30 25 15 10 5 8 1 .2
EURO III 10 1 54 25 8 28 14 81 2.5 81 .3EURO IV 1 8 1 20 11 11 2 18 .2EURO V 38 70 27 100EURO VI 67 99.3
Cars – diesel EURO I 5 10 30 40 9 10 28 8 2 .2EURO II 50 10 8 17 25 21 5 5 16 .4EURO III 20 50 25 3 18 14 84 1.6 100 .2EURO IV 23 8 65 81 17.8 100 .4EURO V 10 30 .4EURO VI 50 99
Cars – gasoline EURO I 7 10 36 9 28 8EURO II 99.8 21 8 44 24 21 18 6 16 2EURO III 22 24 3 15 17 84 1 100 .3EURO IV 34 8 57 78 21 100 .4EURO V 10 76 99.3
aFGD, flue gas desulphurization; CM, combustion modification, including low NOx burner and other primary measures; SCR, selective catalyticreduction; EURO, European emission limits for mobile sources.bThe ‘%’ implementation refers to fuel consumption in the sector rather than generating capacity or number of vehicles. It is also assumed in themodel that technologies introduced achieve the design reduction efficiency. Therefore, the values presented here might be lower than suggested bysome reports owing to poor operation or malfunction period considered in the model. Furthermore, these values are not always representative for allregions in a given country as some areas have more or less stringent legislation, for example, some cities introduced more stringent standards fortransport sources or industry, and therefore shall be seen as country averages.cEmpty space indicates no control is assumed.dSulphur content of coal varies strongly from region to region and introduction of low sulphur coal plays an important role in abating SO2 emissionsin specific areas. Assumptions not presented here but can be viewed in the GAINS model for each province.
ACCENT and more recent GAINS projections show similar-ity to B1 and B2 scenarios with respect to population and GDPgrowth assumptions. In fact, with exception of the SRES A2scenario, all discussed scenarios assume for 2030 a populationof 4.15–4.3 billion in Asia (about 30% increase compared to theyear 2000); in A2 nearly 4.8 billion. Large span of GDP growthin SRES scenarios (Fig. 1, left-hand side) show primarily the bigdifference between assumptions in the global (A1) and regional(A2) scenarios where the first one shows the highest growth rates.ACCENT, GAINS, B1 and B2 show comparable developmentresulting in total 2030 Asian GDP (excluding Japan) of about16–20 trillion US$, that is, a GDP/capita of about US$ 5000.These scenarios assume nearly doubling of GDP every 10 yr.The difference in GDP between ACCENT and GAINS is due to
the updated projections for India and China in the GAINS sce-nario. These projections represent the latest national long-termplanning studies (TERI, 2006; Amann et al., 2008b).
Energy use (Fig. 1, right-hand side) increases by a factor 2–3 within the considered time horizon with ACCENT scenarioat the lower end and recent GAINS assuming the highest in-crease. While SRES scenarios show diverse structure of fuelconsumption in 2030, ACCENT and GAINS differ significantlyonly for coal that makes most of the difference between the twoand obviously will have implications on emissions of air pollu-tants and greenhouse gases. The energy projections underlyingthe latter scenarios originate from national sources but are fewyears apart, GAINS being the newer. GAINS scenario has oneof the highest economic growths from the considered scenarios,
Tellus 61B (2009), 4
606 Z. KLIMONT ET AL.
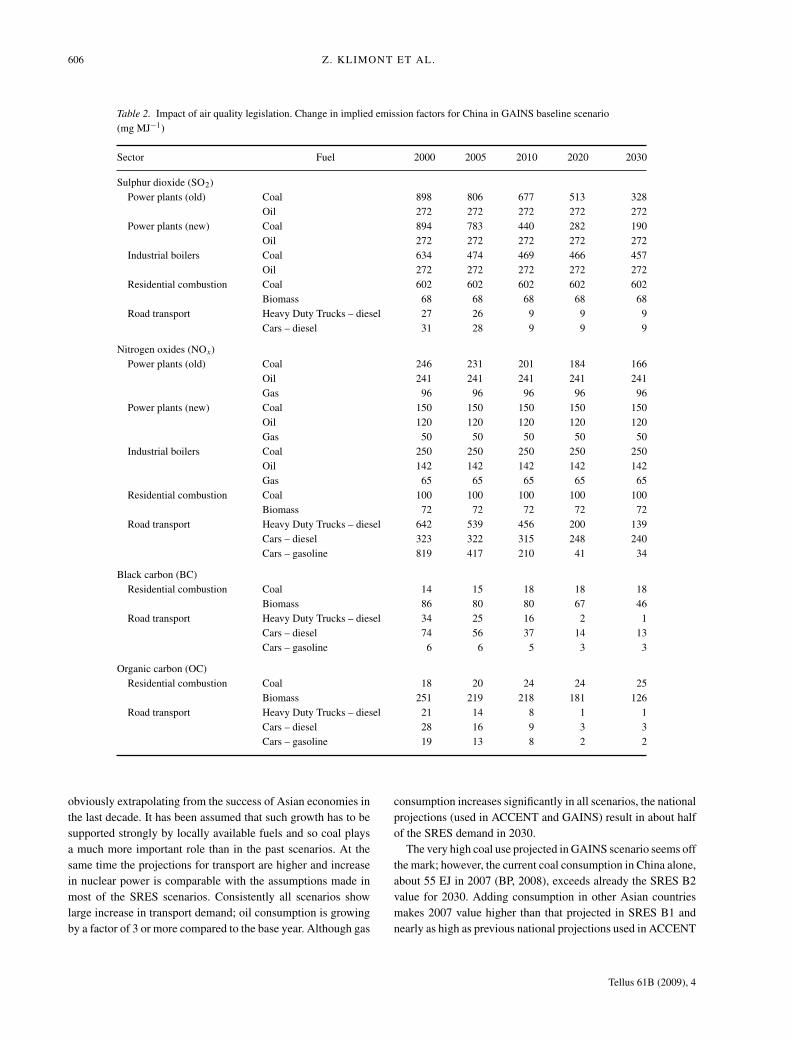
Table 2. Impact of air quality legislation. Change in implied emission factors for China in GAINS baseline scenario(mg MJ−1)
Sector Fuel 2000 2005 2010 2020 2030
Sulphur dioxide (SO2)Power plants (old) Coal 898 806 677 513 328
Oil 272 272 272 272 272Power plants (new) Coal 894 783 440 282 190
Oil 272 272 272 272 272Industrial boilers Coal 634 474 469 466 457
Oil 272 272 272 272 272Residential combustion Coal 602 602 602 602 602
Biomass 68 68 68 68 68Road transport Heavy Duty Trucks – diesel 27 26 9 9 9
Cars – diesel 31 28 9 9 9
Nitrogen oxides (NOx)Power plants (old) Coal 246 231 201 184 166
Oil 241 241 241 241 241Gas 96 96 96 96 96
Power plants (new) Coal 150 150 150 150 150Oil 120 120 120 120 120Gas 50 50 50 50 50
Industrial boilers Coal 250 250 250 250 250Oil 142 142 142 142 142Gas 65 65 65 65 65
Residential combustion Coal 100 100 100 100 100Biomass 72 72 72 72 72
Road transport Heavy Duty Trucks – diesel 642 539 456 200 139Cars – diesel 323 322 315 248 240Cars – gasoline 819 417 210 41 34
Black carbon (BC)Residential combustion Coal 14 15 18 18 18
Biomass 86 80 80 67 46Road transport Heavy Duty Trucks – diesel 34 25 16 2 1
Cars – diesel 74 56 37 14 13Cars – gasoline 6 6 5 3 3
Organic carbon (OC)Residential combustion Coal 18 20 24 24 25
Biomass 251 219 218 181 126Road transport Heavy Duty Trucks – diesel 21 14 8 1 1
Cars – diesel 28 16 9 3 3Cars – gasoline 19 13 8 2 2
obviously extrapolating from the success of Asian economies inthe last decade. It has been assumed that such growth has to besupported strongly by locally available fuels and so coal playsa much more important role than in the past scenarios. At thesame time the projections for transport are higher and increasein nuclear power is comparable with the assumptions made inmost of the SRES scenarios. Consistently all scenarios showlarge increase in transport demand; oil consumption is growingby a factor of 3 or more compared to the base year. Although gas
consumption increases significantly in all scenarios, the nationalprojections (used in ACCENT and GAINS) result in about halfof the SRES demand in 2030.
The very high coal use projected in GAINS scenario seems offthe mark; however, the current coal consumption in China alone,about 55 EJ in 2007 (BP, 2008), exceeds already the SRES B2value for 2030. Adding consumption in other Asian countriesmakes 2007 value higher than that projected in SRES B1 andnearly as high as previous national projections used in ACCENT
Tellus 61B (2009), 4
ESTIMATES OF ASIAN EMISSIONS OF AIR POLLUTANTS AND CARBONACEOUS AEROSOLS 607
Table 3. Impact of air quality legislation. Change in implied emission factors for India in GAINS baseline scenario(mg MJ−1)
Sector Fuel 2000 2005 2010 2020 2030
Sulphur dioxide (SO2)Power plants (old) Coal 503 506 501 529 511
Oil 1282 1237 1333 1322 1295Power plants (new) Coal 474 483 485 477 470
Oil 773 960 1151 1471 1560Industrial boilers Coal 457 456 455 455 455
Oil 1814 1814 1814 1814 1814Residential combustion Coal 431 431 431 431 431
Biomass 23 23 23 23 23Road transport Heavy Duty Trucks – diesel 121 43 24 11 12
Cars – diesel 118 39 25 9 9
Nitrogen oxides (NOx)Power plants (old) Coal 298 298 298 298 298
Oil 160 160 160 160 160Gas 150 150 150 150 150
Power plants (new) Coal 149 148 148 149 149Oil 100 86 79 89 92Gas 50 50 50 50 50
Industrial boilers Coal 230 230 230 230 230Oil 170 170 170 170 170Gas 70 67 64 59 53
Residential combustion Coal 80 80 80 80 80Biomass 50 50 50 50 50
Road transport Heavy Duty Trucks – diesel 1261 1238 1178 825 799Cars – diesel 350 350 349 339 335Cars – gasoline 788 735 612 67 61
Black carbon (BC)Residential combustion Coal 130 130 130 129 129
Biomass 85 84 84 84 83Road transport Heavy Duty Trucks – diesel 33 31 26 6 6
Cars – diesel 72 69 60 18 17Cars – gasoline 6 6 6 3 3
Organic carbon (OC)Residential combustion Coal 200 200 197 187 168
Biomass 231 229 225 218 211Road transport Heavy Duty Trucks – diesel 20 19 16 3 3
Cars – diesel 26 25 21 4 3Cars – gasoline 19 18 16 3 2
for 2030. Comparably fast growth of Chinese coal consumptionsuntil 2030 has been also projected in the recent EIA energyoutlook (EIA, 2008). Furthermore, while in 2000 Chinese coaluse represented nearly 70% of the total coal consumption in Asia,the energy policy in India (TERI, 2006) foresees a significantincrease of coal use, mainly in the power sector. This causesa rise of total national consumption from about 7 EJ in 2000to over 45 EJ in 2030. Even if that latter value might be on
the high side (over six-fold increase compared with 2000), theIEA (2007) projection shows also strong coal increase to nearly22 EJ for India in 2030. In relative terms, coal plays a keyrole as energy supply source in Asia in the GAINS scenario,contributing about 50% to total energy demand in 2020 and 2030.In the presented marker SRES scenarios energy consumptiongrows between 2020 and 2030 by 25–33%, while in GAINSthat growth is 34%, which is mainly due to a faster increase of
Tellus 61B (2009), 4
608 Z. KLIMONT ET AL.
Fig. 1. Assumptions on the growth of population, GDP (market exchange rates) and total primary energy supply (TPES) in Asia (left-hand side) andTPES in 2030 by fuel (right-hand side) for the presented projections.
energy use in India. Sectoral fuel use assumed in the GAINS-Asia baseline is available in the Appendix S1 in the SupportingInformation.
3. Results and discussion
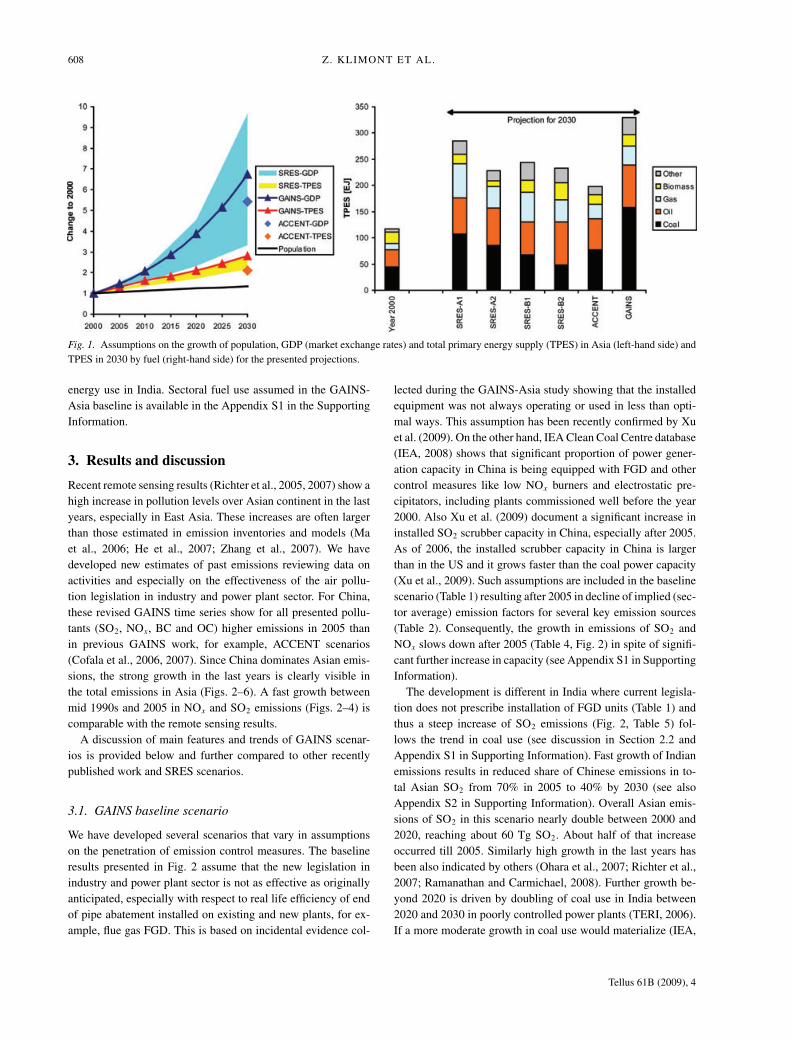
Recent remote sensing results (Richter et al., 2005, 2007) show ahigh increase in pollution levels over Asian continent in the lastyears, especially in East Asia. These increases are often largerthan those estimated in emission inventories and models (Maet al., 2006; He et al., 2007; Zhang et al., 2007). We havedeveloped new estimates of past emissions reviewing data onactivities and especially on the effectiveness of the air pollu-tion legislation in industry and power plant sector. For China,these revised GAINS time series show for all presented pollu-tants (SO2, NOx, BC and OC) higher emissions in 2005 thanin previous GAINS work, for example, ACCENT scenarios(Cofala et al., 2006, 2007). Since China dominates Asian emis-sions, the strong growth in the last years is clearly visible inthe total emissions in Asia (Figs. 2–6). A fast growth betweenmid 1990s and 2005 in NOx and SO2 emissions (Figs. 2–4) iscomparable with the remote sensing results.
A discussion of main features and trends of GAINS scenar-ios is provided below and further compared to other recentlypublished work and SRES scenarios.
3.1. GAINS baseline scenario
We have developed several scenarios that vary in assumptionson the penetration of emission control measures. The baselineresults presented in Fig. 2 assume that the new legislation inindustry and power plant sector is not as effective as originallyanticipated, especially with respect to real life efficiency of endof pipe abatement installed on existing and new plants, for ex-ample, flue gas FGD. This is based on incidental evidence col-
lected during the GAINS-Asia study showing that the installedequipment was not always operating or used in less than opti-mal ways. This assumption has been recently confirmed by Xuet al. (2009). On the other hand, IEA Clean Coal Centre database(IEA, 2008) shows that significant proportion of power gener-ation capacity in China is being equipped with FGD and othercontrol measures like low NOx burners and electrostatic pre-cipitators, including plants commissioned well before the year2000. Also Xu et al. (2009) document a significant increase ininstalled SO2 scrubber capacity in China, especially after 2005.As of 2006, the installed scrubber capacity in China is largerthan in the US and it grows faster than the coal power capacity(Xu et al., 2009). Such assumptions are included in the baselinescenario (Table 1) resulting after 2005 in decline of implied (sec-tor average) emission factors for several key emission sources(Table 2). Consequently, the growth in emissions of SO2 andNOx slows down after 2005 (Table 4, Fig. 2) in spite of signifi-cant further increase in capacity (see Appendix S1 in SupportingInformation).
The development is different in India where current legisla-tion does not prescribe installation of FGD units (Table 1) andthus a steep increase of SO2 emissions (Fig. 2, Table 5) fol-lows the trend in coal use (see discussion in Section 2.2 andAppendix S1 in Supporting Information). Fast growth of Indianemissions results in reduced share of Chinese emissions in to-tal Asian SO2 from 70% in 2005 to 40% by 2030 (see alsoAppendix S2 in Supporting Information). Overall Asian emis-sions of SO2 in this scenario nearly double between 2000 and2020, reaching about 60 Tg SO2. About half of that increaseoccurred till 2005. Similarly high growth in the last years hasbeen also indicated by others (Ohara et al., 2007; Richter et al.,2007; Ramanathan and Carmichael, 2008). Further growth be-yond 2020 is driven by doubling of coal use in India between2020 and 2030 in poorly controlled power plants (TERI, 2006).If a more moderate growth in coal use would materialize (IEA,
Tellus 61B (2009), 4
ESTIMATES OF ASIAN EMISSIONS OF AIR POLLUTANTS AND CARBONACEOUS AEROSOLS 609
Fig. 2. Emissions of air pollutants in Asia in the GAINS baseline scenario and contribution of China and India.
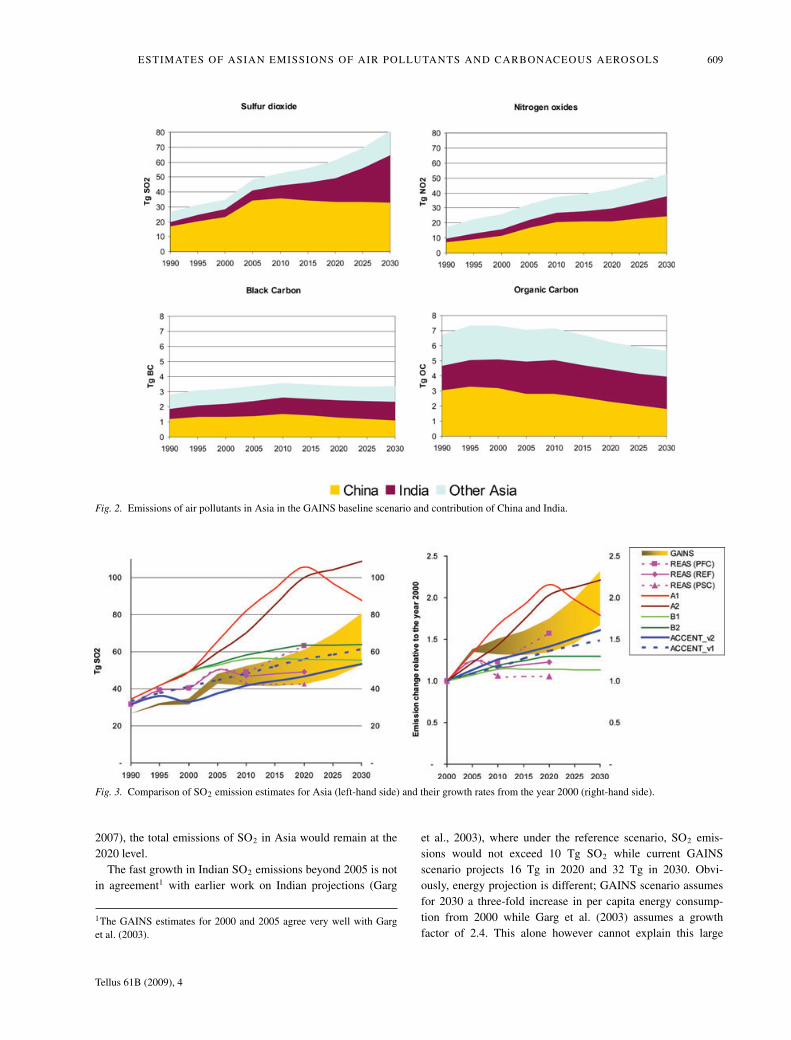
Fig. 3. Comparison of SO2 emission estimates for Asia (left-hand side) and their growth rates from the year 2000 (right-hand side).
2007), the total emissions of SO2 in Asia would remain at the2020 level.
The fast growth in Indian SO2 emissions beyond 2005 is notin agreement1 with earlier work on Indian projections (Garg
1The GAINS estimates for 2000 and 2005 agree very well with Garget al. (2003).
et al., 2003), where under the reference scenario, SO2 emis-sions would not exceed 10 Tg SO2 while current GAINSscenario projects 16 Tg in 2020 and 32 Tg in 2030. Obvi-ously, energy projection is different; GAINS scenario assumesfor 2030 a three-fold increase in per capita energy consump-tion from 2000 while Garg et al. (2003) assumes a growthfactor of 2.4. This alone however cannot explain this large
Tellus 61B (2009), 4
610 Z. KLIMONT ET AL.
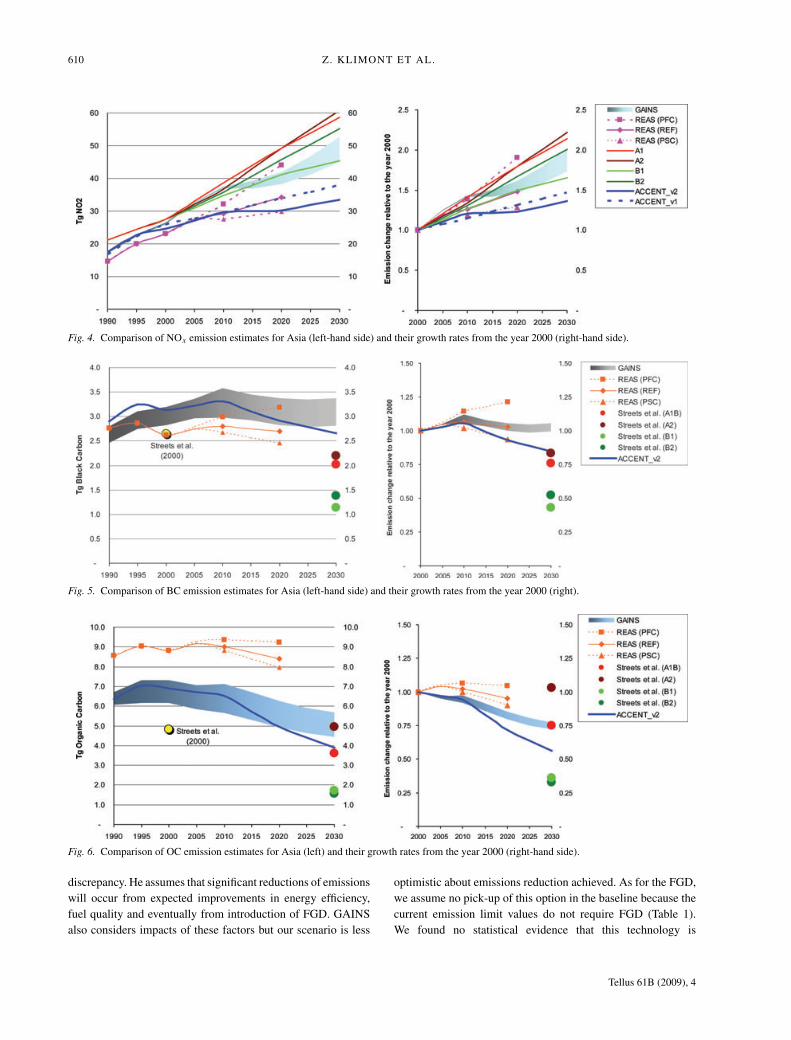
Fig. 4. Comparison of NOx emission estimates for Asia (left-hand side) and their growth rates from the year 2000 (right-hand side).
Fig. 5. Comparison of BC emission estimates for Asia (left-hand side) and their growth rates from the year 2000 (right).
Fig. 6. Comparison of OC emission estimates for Asia (left) and their growth rates from the year 2000 (right-hand side).
discrepancy. He assumes that significant reductions of emissionswill occur from expected improvements in energy efficiency,fuel quality and eventually from introduction of FGD. GAINSalso considers impacts of these factors but our scenario is less
optimistic about emissions reduction achieved. As for the FGD,we assume no pick-up of this option in the baseline because thecurrent emission limit values do not require FGD (Table 1).We found no statistical evidence that this technology is
Tellus 61B (2009), 4
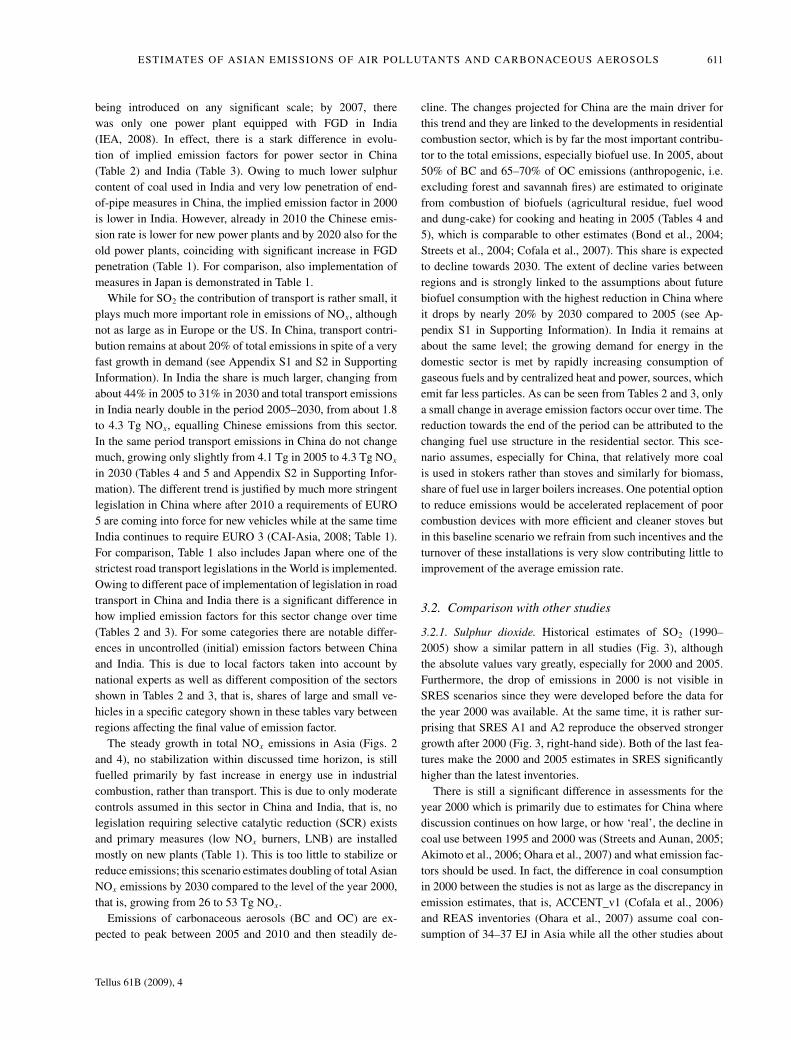
ESTIMATES OF ASIAN EMISSIONS OF AIR POLLUTANTS AND CARBONACEOUS AEROSOLS 611
being introduced on any significant scale; by 2007, therewas only one power plant equipped with FGD in India(IEA, 2008). In effect, there is a stark difference in evolu-tion of implied emission factors for power sector in China(Table 2) and India (Table 3). Owing to much lower sulphurcontent of coal used in India and very low penetration of end-of-pipe measures in China, the implied emission factor in 2000is lower in India. However, already in 2010 the Chinese emis-sion rate is lower for new power plants and by 2020 also for theold power plants, coinciding with significant increase in FGDpenetration (Table 1). For comparison, also implementation ofmeasures in Japan is demonstrated in Table 1.
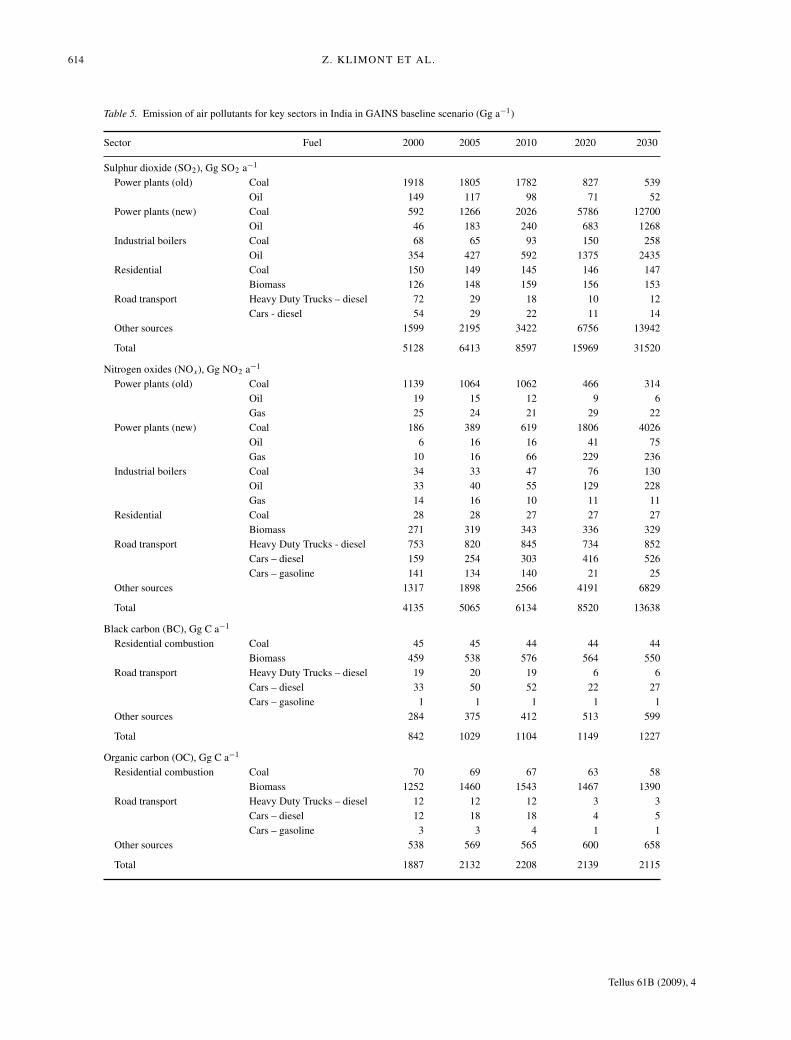
While for SO2 the contribution of transport is rather small, itplays much more important role in emissions of NOx, althoughnot as large as in Europe or the US. In China, transport contri-bution remains at about 20% of total emissions in spite of a veryfast growth in demand (see Appendix S1 and S2 in SupportingInformation). In India the share is much larger, changing fromabout 44% in 2005 to 31% in 2030 and total transport emissionsin India nearly double in the period 2005–2030, from about 1.8to 4.3 Tg NOx, equalling Chinese emissions from this sector.In the same period transport emissions in China do not changemuch, growing only slightly from 4.1 Tg in 2005 to 4.3 Tg NOx
in 2030 (Tables 4 and 5 and Appendix S2 in Supporting Infor-mation). The different trend is justified by much more stringentlegislation in China where after 2010 a requirements of EURO5 are coming into force for new vehicles while at the same timeIndia continues to require EURO 3 (CAI-Asia, 2008; Table 1).For comparison, Table 1 also includes Japan where one of thestrictest road transport legislations in the World is implemented.Owing to different pace of implementation of legislation in roadtransport in China and India there is a significant difference inhow implied emission factors for this sector change over time(Tables 2 and 3). For some categories there are notable differ-ences in uncontrolled (initial) emission factors between Chinaand India. This is due to local factors taken into account bynational experts as well as different composition of the sectorsshown in Tables 2 and 3, that is, shares of large and small ve-hicles in a specific category shown in these tables vary betweenregions affecting the final value of emission factor.
The steady growth in total NOx emissions in Asia (Figs. 2and 4), no stabilization within discussed time horizon, is stillfuelled primarily by fast increase in energy use in industrialcombustion, rather than transport. This is due to only moderatecontrols assumed in this sector in China and India, that is, nolegislation requiring selective catalytic reduction (SCR) existsand primary measures (low NOx burners, LNB) are installedmostly on new plants (Table 1). This is too little to stabilize orreduce emissions; this scenario estimates doubling of total AsianNOx emissions by 2030 compared to the level of the year 2000,that is, growing from 26 to 53 Tg NOx.
Emissions of carbonaceous aerosols (BC and OC) are ex-pected to peak between 2005 and 2010 and then steadily de-
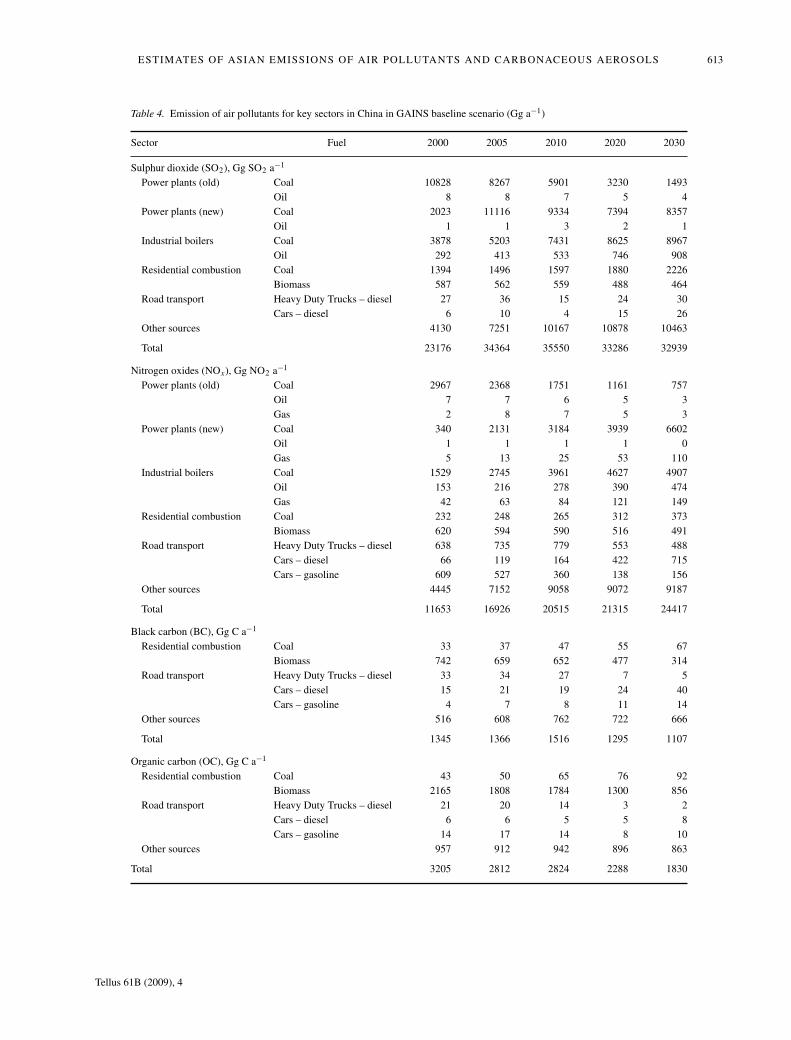
cline. The changes projected for China are the main driver forthis trend and they are linked to the developments in residentialcombustion sector, which is by far the most important contribu-tor to the total emissions, especially biofuel use. In 2005, about50% of BC and 65–70% of OC emissions (anthropogenic, i.e.excluding forest and savannah fires) are estimated to originatefrom combustion of biofuels (agricultural residue, fuel woodand dung-cake) for cooking and heating in 2005 (Tables 4 and5), which is comparable to other estimates (Bond et al., 2004;Streets et al., 2004; Cofala et al., 2007). This share is expectedto decline towards 2030. The extent of decline varies betweenregions and is strongly linked to the assumptions about futurebiofuel consumption with the highest reduction in China whereit drops by nearly 20% by 2030 compared to 2005 (see Ap-pendix S1 in Supporting Information). In India it remains atabout the same level; the growing demand for energy in thedomestic sector is met by rapidly increasing consumption ofgaseous fuels and by centralized heat and power, sources, whichemit far less particles. As can be seen from Tables 2 and 3, onlya small change in average emission factors occur over time. Thereduction towards the end of the period can be attributed to thechanging fuel use structure in the residential sector. This sce-nario assumes, especially for China, that relatively more coalis used in stokers rather than stoves and similarly for biomass,share of fuel use in larger boilers increases. One potential optionto reduce emissions would be accelerated replacement of poorcombustion devices with more efficient and cleaner stoves butin this baseline scenario we refrain from such incentives and theturnover of these installations is very slow contributing little toimprovement of the average emission rate.
3.2. Comparison with other studies
3.2.1. Sulphur dioxide. Historical estimates of SO2 (1990–2005) show a similar pattern in all studies (Fig. 3), althoughthe absolute values vary greatly, especially for 2000 and 2005.Furthermore, the drop of emissions in 2000 is not visible inSRES scenarios since they were developed before the data forthe year 2000 was available. At the same time, it is rather sur-prising that SRES A1 and A2 reproduce the observed strongergrowth after 2000 (Fig. 3, right-hand side). Both of the last fea-tures make the 2000 and 2005 estimates in SRES significantlyhigher than the latest inventories.
There is still a significant difference in assessments for theyear 2000 which is primarily due to estimates for China wherediscussion continues on how large, or how ‘real’, the decline incoal use between 1995 and 2000 was (Streets and Aunan, 2005;Akimoto et al., 2006; Ohara et al., 2007) and what emission fac-tors should be used. In fact, the difference in coal consumptionin 2000 between the studies is not as large as the discrepancy inemission estimates, that is, ACCENT_v1 (Cofala et al., 2006)and REAS inventories (Ohara et al., 2007) assume coal con-sumption of 34–37 EJ in Asia while all the other studies about
Tellus 61B (2009), 4
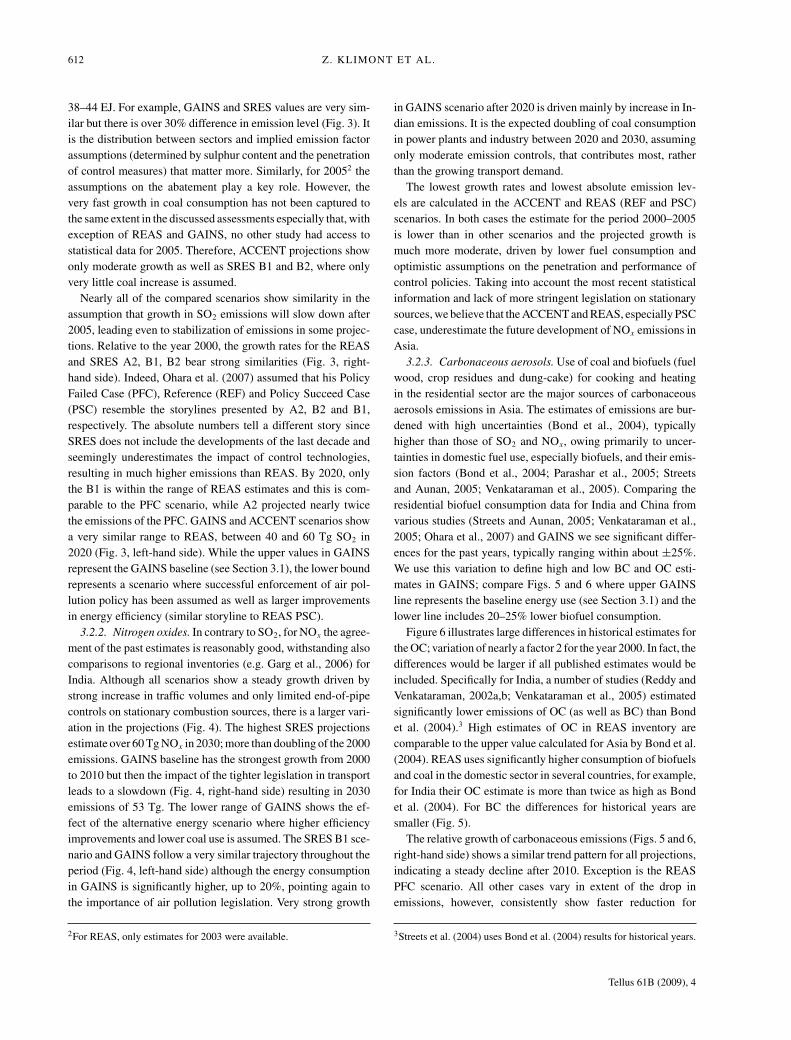
612 Z. KLIMONT ET AL.
38–44 EJ. For example, GAINS and SRES values are very sim-ilar but there is over 30% difference in emission level (Fig. 3). Itis the distribution between sectors and implied emission factorassumptions (determined by sulphur content and the penetrationof control measures) that matter more. Similarly, for 20052 theassumptions on the abatement play a key role. However, thevery fast growth in coal consumption has not been captured tothe same extent in the discussed assessments especially that, withexception of REAS and GAINS, no other study had access tostatistical data for 2005. Therefore, ACCENT projections showonly moderate growth as well as SRES B1 and B2, where onlyvery little coal increase is assumed.
Nearly all of the compared scenarios show similarity in theassumption that growth in SO2 emissions will slow down after2005, leading even to stabilization of emissions in some projec-tions. Relative to the year 2000, the growth rates for the REASand SRES A2, B1, B2 bear strong similarities (Fig. 3, right-hand side). Indeed, Ohara et al. (2007) assumed that his PolicyFailed Case (PFC), Reference (REF) and Policy Succeed Case(PSC) resemble the storylines presented by A2, B2 and B1,respectively. The absolute numbers tell a different story sinceSRES does not include the developments of the last decade andseemingly underestimates the impact of control technologies,resulting in much higher emissions than REAS. By 2020, onlythe B1 is within the range of REAS estimates and this is com-parable to the PFC scenario, while A2 projected nearly twicethe emissions of the PFC. GAINS and ACCENT scenarios showa very similar range to REAS, between 40 and 60 Tg SO2 in2020 (Fig. 3, left-hand side). While the upper values in GAINSrepresent the GAINS baseline (see Section 3.1), the lower boundrepresents a scenario where successful enforcement of air pol-lution policy has been assumed as well as larger improvementsin energy efficiency (similar storyline to REAS PSC).
3.2.2. Nitrogen oxides. In contrary to SO2, for NOx the agree-ment of the past estimates is reasonably good, withstanding alsocomparisons to regional inventories (e.g. Garg et al., 2006) forIndia. Although all scenarios show a steady growth driven bystrong increase in traffic volumes and only limited end-of-pipecontrols on stationary combustion sources, there is a larger vari-ation in the projections (Fig. 4). The highest SRES projectionsestimate over 60 Tg NOx in 2030; more than doubling of the 2000emissions. GAINS baseline has the strongest growth from 2000to 2010 but then the impact of the tighter legislation in transportleads to a slowdown (Fig. 4, right-hand side) resulting in 2030emissions of 53 Tg. The lower range of GAINS shows the ef-fect of the alternative energy scenario where higher efficiencyimprovements and lower coal use is assumed. The SRES B1 sce-nario and GAINS follow a very similar trajectory throughout theperiod (Fig. 4, left-hand side) although the energy consumptionin GAINS is significantly higher, up to 20%, pointing again tothe importance of air pollution legislation. Very strong growth
2For REAS, only estimates for 2003 were available.
in GAINS scenario after 2020 is driven mainly by increase in In-dian emissions. It is the expected doubling of coal consumptionin power plants and industry between 2020 and 2030, assumingonly moderate emission controls, that contributes most, ratherthan the growing transport demand.
The lowest growth rates and lowest absolute emission lev-els are calculated in the ACCENT and REAS (REF and PSC)scenarios. In both cases the estimate for the period 2000–2005is lower than in other scenarios and the projected growth ismuch more moderate, driven by lower fuel consumption andoptimistic assumptions on the penetration and performance ofcontrol policies. Taking into account the most recent statisticalinformation and lack of more stringent legislation on stationarysources, we believe that the ACCENT and REAS, especially PSCcase, underestimate the future development of NOx emissions inAsia.
3.2.3. Carbonaceous aerosols. Use of coal and biofuels (fuelwood, crop residues and dung-cake) for cooking and heatingin the residential sector are the major sources of carbonaceousaerosols emissions in Asia. The estimates of emissions are bur-dened with high uncertainties (Bond et al., 2004), typicallyhigher than those of SO2 and NOx, owing primarily to uncer-tainties in domestic fuel use, especially biofuels, and their emis-sion factors (Bond et al., 2004; Parashar et al., 2005; Streetsand Aunan, 2005; Venkataraman et al., 2005). Comparing theresidential biofuel consumption data for India and China fromvarious studies (Streets and Aunan, 2005; Venkataraman et al.,2005; Ohara et al., 2007) and GAINS we see significant differ-ences for the past years, typically ranging within about ±25%.We use this variation to define high and low BC and OC esti-mates in GAINS; compare Figs. 5 and 6 where upper GAINSline represents the baseline energy use (see Section 3.1) and thelower line includes 20–25% lower biofuel consumption.
Figure 6 illustrates large differences in historical estimates forthe OC; variation of nearly a factor 2 for the year 2000. In fact, thedifferences would be larger if all published estimates would beincluded. Specifically for India, a number of studies (Reddy andVenkataraman, 2002a,b; Venkataraman et al., 2005) estimatedsignificantly lower emissions of OC (as well as BC) than Bondet al. (2004).3 High estimates of OC in REAS inventory arecomparable to the upper value calculated for Asia by Bond et al.(2004). REAS uses significantly higher consumption of biofuelsand coal in the domestic sector in several countries, for example,for India their OC estimate is more than twice as high as Bondet al. (2004). For BC the differences for historical years aresmaller (Fig. 5).
The relative growth of carbonaceous emissions (Figs. 5 and 6,right-hand side) shows a similar trend pattern for all projections,indicating a steady decline after 2010. Exception is the REASPFC scenario. All other cases vary in extent of the drop inemissions, however, consistently show faster reduction for
3Streets et al. (2004) uses Bond et al. (2004) results for historical years.
Tellus 61B (2009), 4
ESTIMATES OF ASIAN EMISSIONS OF AIR POLLUTANTS AND CARBONACEOUS AEROSOLS 613
Table 4. Emission of air pollutants for key sectors in China in GAINS baseline scenario (Gg a−1)
Sector Fuel 2000 2005 2010 2020 2030
Sulphur dioxide (SO2), Gg SO2 a−1
Power plants (old) Coal 10828 8267 5901 3230 1493Oil 8 8 7 5 4
Power plants (new) Coal 2023 11116 9334 7394 8357Oil 1 1 3 2 1
Industrial boilers Coal 3878 5203 7431 8625 8967Oil 292 413 533 746 908
Residential combustion Coal 1394 1496 1597 1880 2226Biomass 587 562 559 488 464
Road transport Heavy Duty Trucks – diesel 27 36 15 24 30Cars – diesel 6 10 4 15 26
Other sources 4130 7251 10167 10878 10463
Total 23176 34364 35550 33286 32939
Nitrogen oxides (NOx), Gg NO2 a−1
Power plants (old) Coal 2967 2368 1751 1161 757Oil 7 7 6 5 3Gas 2 8 7 5 3
Power plants (new) Coal 340 2131 3184 3939 6602Oil 1 1 1 1 0Gas 5 13 25 53 110
Industrial boilers Coal 1529 2745 3961 4627 4907Oil 153 216 278 390 474Gas 42 63 84 121 149
Residential combustion Coal 232 248 265 312 373Biomass 620 594 590 516 491
Road transport Heavy Duty Trucks – diesel 638 735 779 553 488Cars – diesel 66 119 164 422 715Cars – gasoline 609 527 360 138 156
Other sources 4445 7152 9058 9072 9187
Total 11653 16926 20515 21315 24417
Black carbon (BC), Gg C a−1
Residential combustion Coal 33 37 47 55 67Biomass 742 659 652 477 314
Road transport Heavy Duty Trucks – diesel 33 34 27 7 5Cars – diesel 15 21 19 24 40Cars – gasoline 4 7 8 11 14
Other sources 516 608 762 722 666
Total 1345 1366 1516 1295 1107
Organic carbon (OC), Gg C a−1
Residential combustion Coal 43 50 65 76 92Biomass 2165 1808 1784 1300 856
Road transport Heavy Duty Trucks – diesel 21 20 14 3 2Cars – diesel 6 6 5 5 8Cars – gasoline 14 17 14 8 10
Other sources 957 912 942 896 863
Total 3205 2812 2824 2288 1830
Tellus 61B (2009), 4
614 Z. KLIMONT ET AL.
Table 5. Emission of air pollutants for key sectors in India in GAINS baseline scenario (Gg a−1)
Sector Fuel 2000 2005 2010 2020 2030
Sulphur dioxide (SO2), Gg SO2 a−1
Power plants (old) Coal 1918 1805 1782 827 539Oil 149 117 98 71 52
Power plants (new) Coal 592 1266 2026 5786 12700Oil 46 183 240 683 1268
Industrial boilers Coal 68 65 93 150 258Oil 354 427 592 1375 2435
Residential Coal 150 149 145 146 147Biomass 126 148 159 156 153
Road transport Heavy Duty Trucks – diesel 72 29 18 10 12Cars - diesel 54 29 22 11 14
Other sources 1599 2195 3422 6756 13942
Total 5128 6413 8597 15969 31520
Nitrogen oxides (NOx), Gg NO2 a−1
Power plants (old) Coal 1139 1064 1062 466 314Oil 19 15 12 9 6Gas 25 24 21 29 22
Power plants (new) Coal 186 389 619 1806 4026Oil 6 16 16 41 75Gas 10 16 66 229 236
Industrial boilers Coal 34 33 47 76 130Oil 33 40 55 129 228Gas 14 16 10 11 11
Residential Coal 28 28 27 27 27Biomass 271 319 343 336 329
Road transport Heavy Duty Trucks - diesel 753 820 845 734 852Cars – diesel 159 254 303 416 526Cars – gasoline 141 134 140 21 25
Other sources 1317 1898 2566 4191 6829
Total 4135 5065 6134 8520 13638
Black carbon (BC), Gg C a−1
Residential combustion Coal 45 45 44 44 44Biomass 459 538 576 564 550
Road transport Heavy Duty Trucks – diesel 19 20 19 6 6Cars – diesel 33 50 52 22 27Cars – gasoline 1 1 1 1 1
Other sources 284 375 412 513 599
Total 842 1029 1104 1149 1227
Organic carbon (OC), Gg C a−1
Residential combustion Coal 70 69 67 63 58Biomass 1252 1460 1543 1467 1390
Road transport Heavy Duty Trucks – diesel 12 12 12 3 3Cars – diesel 12 18 18 4 5Cars – gasoline 3 3 4 1 1
Other sources 538 569 565 600 658
Total 1887 2132 2208 2139 2115
Tellus 61B (2009), 4
ESTIMATES OF ASIAN EMISSIONS OF AIR POLLUTANTS AND CARBONACEOUS AEROSOLS 615
OC than for BC. The lowest presented projections (Streets et al.,2004) show a strong decline, compared to the year 2000. SRESprojections of energy consumption used by Streets et al. (2004),assume virtually elimination of residential coal use in China by2030 and significant reduction of use of biofuels in Asia, espe-cially in B1 and B2 scenarios. Since residential combustion isa key source of carbonaceous aerosols in Asia, the 2030 emis-sions of BC and OC are estimated to drop in B1 and B2 bymore than 50% compared to the levels of 2000 (Figs. 5 and 6).No comparable assumptions on a very strong reduction of solidfuels use in the domestic sector in Asia were made in REAS,ACCENT or GAINS leading to significantly higher estimates in2030. In GAINS baseline, the biofuel use in residential sectorin India and most other countries remains fairly constant overtime, while in China it declines by nearly 20% compared tothe 2000. At the same time, residential use of coal continuesto grow (see Appendix S1 in Supporting Information). For OCemissions, ACCENT and GAINS projections are similar to theA1 and A2 (Streets et al., 2004) while REAS is much higheralthough shows a similar trend (Fig. 6, left-hand side). For BC,the 2030 estimates of REAS, ACCENT and GAINS are verysimilar but still higher than A1 and A2 (Fig. 5, left-hand side).Generally, REAS and GAINS show similar ranges of BC emis-sions towards the end of the forecasting period while ACCENTand especially SRES B1 and B2 are significantly lower for BCas well as OC.
4. Conclusions
The past (1990–2005) emissions of SO2, NOx, BC and OCin Asia have been reassessed in the last years following thefindings of the remote sensing community indicating a veryhigh growth of air pollution in East Asia in the last decade. Newinventories and modelling studies confirm these findings for NOx
and SO2 although they estimate slightly smaller increases. Nocomparably high growth in emissions of BC and OC has beenestimated. There are still significant uncertainties in estimates forthe historical years, especially for the emissions of carbonaceousaerosols where data on biofuel use and emission factors fromresidential combustion need improvement.
For the future, the recent studies show comparable trends inemissions of SO2 (moderate growth to stabilization after 2010,especially in China), NOx (continuing growth, slowed downslightly by already decided legislation), and BC and OC (steadydecline after 2010).
Future SO2 and NOx emission levels in Asia estimated in thisstudy for 2020 and 2030 are lower than in the previously shownand widely used IPCC SRES marker A1, A2 and B2 scenarioswhile B1 is within the GAINS range of estimates. Although theGAINS scenarios have significantly higher coal consumptionthan SRES futures, the assumptions about the future penetrationof control technologies, especially in the power plant and trans-port sectors, include more stringent standards resulting in lower
pollutant releases than previously anticipated. Similar trends asin GAINS have been estimated in the REAS project. It seems thatthe impact of legislation has been underestimated in the SRESwork. Similar conclusions for sulphur emissions were presentedrecently (Van Vuuren and O’Neil, 2006) and the authors con-cluded further that other factors being equal, the lower sulphuremissions would imply increase in the expected temperaturechange associated with respective SRES scenarios.
IPCC SRES did not include BC and OC estimates but theirimportance for climate change has been highlighted in severalstudies. Asia is a major contributor to the global BC and OCbudget and the key sources of these aerosols (domestic combus-tion) need to be better understood since the uncertainties of theemission estimates remain large and are carried forward in theprojections, limiting also our ability to assess future reductionpotentials.
5. Acknowledgments
The authors are grateful for very constructive comments fromanonymous reviewers, Frank Dentener (JRC, Italy) who kindlyreviewed the draft manuscript, and Chao Yu and Long Wang(Tsinghua University, Beijing, China) for helping in the finalrevision stages of the paper. The authors acknowledge the sup-port of the European Commission who under the Sixth Frame-work Programme funded ACCENT and the GAINS-Asia projectwithin which this research was performed.
References
ADB. 2005. Vehicle Emissions Reductions. Asian DevelopmentBank, Manila, Philippines. http://www.adb.org/vehicle-emissions/General/Standards-asia.asp.
Akimoto, H., Ohara, T., Kurokawa, J.-I. and Horii, N. 2006. Verificationof energy consumption in China during 1996–2003 by using satelliteobservational data. Atmos. Environ. 40, 7663–7667.
Amann, M., Bertok, I., Borken, J., Chambers, A., Cofala, J. andco-authors. 2008a. GAINS-Asia: A Tool to Combat Air Pollution
and Climate Change Simultaneously; Methodology. InternationalInstitute for Applied Systems Analysis (IIASA), Laxenburg, Austria.http://gains.iiasa.ac.at/gains/reports/GAINS-Asia-Methodology-20081205.pdf.
Amann, M., Kejun, J., Hao, J., Wang, S., Wei, W. and co-authors. 2008b. GAINS-Asia: Scenarios for Cost-Effective Con-
trol of Air Pollution and Greenhouse Gases in China. In-ternational Institute for Applied Systems Analysis (IIASA),Laxenburg, Austria. http://gains.iiasa.ac.at/gains/download/GAINS-Asia-China-v8_MA.pdf.
Bond, T., Streets, D., Yarber, K. F., Nelson, S. M., Wo, J.-H. and co-authors. 2004. A technology-based global inventory of black andorganic carbon emissions from combustion. J. Geophys. Res. 109,1–43.
BP. 2008. Statistical Review of World Energy 2008. http://www.bp.com/statisticalreview.
Tellus 61B (2009), 4
616 Z. KLIMONT ET AL.
CAI-Asia. 2008. Emission standards for new vehicles (light duty).Clean Air Initiative for Asian Cities (CAI-Asia). http://www.cleanairnet.org/caiasia/1412/articles-58969_new.pdf.
Cao, G., Zhang, X. and Zheng, F. 2006. Inventory of black carbon andorganic carbon emissions from China. Atmos. Environ. 40, 6516–6527.
CEC 2004. Service Contract for Review of the RAINS Inte-
grated Assessment Model. Commission of the European Com-munities, ENV.C1/SER/2003/0079, Brussels. http://europa.eu.int/comm/environment/air/cafe/pdf/rains_report_review.pdf.
Cofala, J. and Syri, S. 1998a. Sulfur Emissions, Abatement Technologiesand Related Costs for Europe in the RAINS Model Database. Inter-national Institute for Applied Systems Analysis (IIASA), IR-98–035,Laxenburg, Austria.
Cofala, J. and Syri, S. 1998b. Nitrogen Oxides Emissions, Abate-
ment Technologies and Related Costs for Europe in the RAINS
Model Database. International Institute for Applied Systems Anal-ysis (IIASA), IR-98–88, Laxenburg, Austria.
Cofala, J., Amann, M., Gyarfas, F., Schopp, W., Boudri, J. C. and co-authors. 2004. Cost-effective control of SO2 emissions in Asia. J.Environ. Manag. 72, 149–161.
Cofala, J., Amann, M. and Mechler, R. 2006. Scenarios of Global Anthro-
pogenic Emissions of Air Pollutants and Methane up to 2030. Inter-national Institute for Applied Systems Analysis (IIASA), Laxenburg,Austria. http://www.iiasa.ac.at/rains/global_emiss/IR-06–023.pdf
Cofala, J., Amann, M., Klimont, Z., Kupiainen, K. and Hoglund-Isaksson, L. 2007. Scenarios of global anthropogenic emissions of airpollutants and methane until 2030. Atmos. Environ. 41, 8486–8499.
EIA. 2008. International Energy Outlook 2008—Highlights. EnergyInformation Administration, Washington, US. http://www.eia.doe.gov/oiaf/ieo/emissions.html.
Fu, L., Hao, J., He, D., He, K. and Li, P. 2001. Assessment of vehicularpollution in China. J. Air Waste Manage. Assoc. 51, 658– 668.
Garg, A., Shukla, P. R., Bhattacharya, S. and Dadhwal, V. K. 2001. Sub-region (district) and sector level SO2 and NOx emissions for India:assessment of inventories and mitigation flexibility. Atmos. Environ.
35, 703–713.Garg, A., Shukla, P. R., Ghosh, D., Kapshe, M. and Rajesh, N. 2003.
Future greenhouse gas and local pollutants emissions for India: policylinks and disjoints. Mitigation Adapt. Strat. Global Change 8, 71–72.
Garg, A., Shukla, P. R. and Kapshe, M. 2006. The sectoral trends ofmultigas emissions inventory of India. Atmos. Environ. 40, 4608–4620.
He, Y., Uno, I., Wang, Z., Ohara, T., Sugimoto, N. and co-authors. 2007.Variations of the increasing trend of tropospheric NO2 over centraleast China during the past decade. Atmos. Environ. 41, 4865–4876.
IEA. 2002. Energy Statistics and Balances—OECD and Non-OECDCountries. International Energy Agency, Paris, France.
IEA. 2007. World Energy Outlook 2007. OECD/IEA, Paris.IEA. 2008. Coal Power Database. IEA Clean Cloal Centre.
http://www.iea-coal.org.uk.IIASA. 2001. RAINS-Asia Version 7.5, Software Package for Integrated
Assessment of Pollution Control Strategies in Southeast Asia. Inter-national Institute for Applied Systems Analysis (IIASA), Laxenburg,Austria. http://www.iiasa.ac.at/rains.
IPCC. 2007. Climate Change 2007: Mitigation of Climate Change.
Working Group III Contribution to the Fourth Assessment Report
of the Intergovernmental Panel on Climate Change. CambridgeUniversity Press, Cambridge, UK and New York, USA.
Kannari, K., Tonooka, Y., Baba, T. and Murano, K. 2007. Developmentof multiple-species 1 km x 1 km resolution hourly baiss emissionsinventory for Japan. Atmos. Environ. 41, 3428–3439.
Klaassen, G., Amann, M., Berglund, C., Cofala, J., Hoglund-Isaksson, L.and co-authors. 2004. The Extension of the RAINS Model to Green-
house Gases. International Institute for Applied Systems Analysis(IIASA), IR-04–015, Laxenburg, Austria.
Klimont, Z., Cofala, J., Schopp, W., Amann, M., Streets, D. and co-authors. 2001. Projections of SO2, NOx, NH3, and VOC emissions inEast Asia up to 2030. Water, Air, and Soil Pollution 130, 193–198.
Klimont, Z., Cofala, J., Bertok, I., Amann, M., Heyes, C. and co-authors.2002. Modelling Particulate Emissions in Europe. A Framework toEstimate Reduction Potential and Control Costs. International Insti-tute for Applied Systems Analysis (IIASA), Laxenburg, Austria.
Kupiainen, K. and Klimont, Z. 2004. Primary Emissions of Submi-cron and Carbonaceous Particles in Europe and the Potential for
their Control. International Institute for Applied Systems Analysis(IIASA), IR-04–79, Laxenburg, Austria.
Kupiainen, K. and Klimont, Z. 2007. Primary emissions of fine carbona-ceous particles in Europe. Atmos. Environ. 41, 2156–2170.
Ma, J., Richter, A., Burrows, J. P., Nu[ss], H. and van Aardenne, J. A.2006. Comparison of model-simulated tropospheric NO2 over Chinawith GOME-satellite data. Atmos. Environ. 40, 593–604.
Nakicenovic, N., Swart, R., Alcamo, J., Davis, G., Vries, B. d. andco-authors. 2000. Special Report on Emissions Scenarios. WorkingGroup III of the Intergovernmental Panel on Climate Change (IPCC),Cambridge University Press, Cambridge, UK, ISBN 0–521-80493–0.
Ohara, T., Akimoto, H., Kurokawa, J., Horii, N., Yamaji, K. and co-authors. 2007. An Asian emission inventory of anthropogenic emis-sion sources for the period 1980–2020. Atmos. Chem. Phys. Discuss.
7, 6843–6902.Parashar, D. C., Gadi, R., Mandal, T. K. and Mitra, A. P. 2005. Carbona-
ceous aerosol emissions from India. Atmos. Environ. 39, 7861–7871.Ramanathan, V. and Carmichael, G. R. 2008. Global and regional climate
changes due to black carbon. Nat. Geosci. 1, 221–227.Reddy, S. M. and Venkataraman, C. 2002a. Inventory of aerosol and
sulphur dioxide emissions from India. Part I - Fossil fuel combustion.Atmos. Environ. 36, 677–697.
Reddy, S. M. and Venkataraman, C. 2002b. Inventory of aerosol andsulphur dioxide emissions from India. Part II - biomass combustion.Atmos. Environ. 36, 699–712.
Riahi, K. and Roehl, R. A. 2000. Greenhouse gas emissions in dynamics-as-usual scenario of economic and energy development. Technol.
Forecast. Social Change, North Holland 63, 175–205.Richter, A., Burrows, J. P., Nub, H., Granier, C. and Niemeier, U. 2005.
Increase in tropospheric nitrogen dioxide over China observed fromspace. Nature 437, 129–132.
Richter, A., Heckel, A., Lee, M., Vrekoussis, M., Wittrock, F. andco-authors. 2007. Tropospheric composition change observed fromspace. In: 2nd ACCENT Symposium, Urbino, Italy.
Schopp, W., Amann, M., Cofala, J., Heyes, C. and Klimont, Z. 1999. In-tegrated assessment of european air pollution emission control strate-gies. Environ. Model. Software 14, 1–9.
Streets, D. G. and Aunan, K. 2005. The importance of China’s householdsector for black carbon emissions. Geophys. Res. Lett. 32, 1–4.
Tellus 61B (2009), 4
ESTIMATES OF ASIAN EMISSIONS OF AIR POLLUTANTS AND CARBONACEOUS AEROSOLS 617
Streets, D. G., Bond, T. C., Carmichael, G. R., Fernandes, S. D., Fu, Q.and co-authors. 2003. An inventory of gaseous and primary aerosolemissions in Asia in the year 2000. J. Geophys. Res. 108, GTE 30–31–GTE 30–23.
Streets, D. G., Bond, T. C., Lee, T. and Jang, C. 2004. On the future ofcarbonaceous aerosol emissions. J. Geophys. Res. 109, 1–19.
Streets, D. G., Zhang, Q., Wang, L., He, K., Hao, J. and co-authors 2006.Revisiting China’s CO emissions after the Transport and ChemicalEvolution over the Pacific (TRACE-P) mission: Synthesis of invento-ries, atmospheric modeling, and observations. J. Geophys. Res. 111,1–16.
TERI. 2006. National Energy Map for India: Technology Vision 2030.The Energy and Resources Institute, PSA/2006/3, New Delhi, India.
UN. 2003. 2001 Industrial Commodity Statistics. United Nations, NewYork, USA.
Van Vuuren, D. P. V. and O’Neil, B. C. 2006. The consistency of IPCC’sSRES scenarios to 1990–2000 trends and recent projections. ClimaticChange 75, 9–46.
Venkataraman, C., Habib, G., Eiguren-Fernandez, A., Miguel, A. H. andFriedlander, S. K. 2005. Residential biofuels in South Asia: carbona-ceous aerosol emissions and climate impacts. Science 307, 1454–1456.
Xu, Y., Williams, R. H. and Socolow, R. H. 2009. China’s rapid deploy-ment of SO2 scrubbers. Energy Environ. Sci. 2, 459–465.
Zhang, Q., Streets, D. G., He, K., Wang, Y., Richter, A. and co-authors.2007. NOx emission trends for China, 1995–2004: The view from theground and the view from space. J. Geophys. Res. 112, 1–18.
Supporting Information
Additional Supporting Information may be found in the onlineversion of this article.
Appendix S1. Fuel consumption in China, India, and other Asiain the GAINS baseline scenarioAppendix S2. Sectoral emissions of SO2, NOx, BC and OC forChina, India and other Asia in the GAINS baseline scenario.
Please note: Wiley-Blackwell are not responsible for the contentor functionality of any supporting materials supplied by theauthors. Any queries (other than missing material) should bedirected to the corresponding author for the article.
Tellus 61B (2009), 4