Embed Size (px)
Citation preview

Projektbericht
Heft 59
Rheinisch-Westfälisches Institut für Wirtschaftsforschung
German Institute of Urban Aff airs – DIFU
NEA Transport research and training
Policy Research & Consultancy – PRAC
Second State of European Cities Report
Contract No. 2008CE160AT024November 2010
Research Project for theEuropean Commission, DG Regional Policy
Heft 59
Boris AugurzkyRosemarie GülkerSebastian KrolopChristoph M. Schmidt Hartmut SchmidtHendrik SchmitzStefan Terkatz

Imprint
Vorstand des RWI
Prof. Dr. Christoph M. Schmidt (Präsident)
Prof. Dr. Thomas K. Bauer (Vizepräsident)
Prof. Dr. Wim Kösters
Verwaltungsrat
Dr. Eberhard Heinke (Vorsitzender);
Dr. Henning Osthues-Albrecht; Dr. Rolf Pohlig; Reinhold Schulte (stellv. Vorsitzende);
Manfred Breuer; Oliver Burkhard; Dr. Hans Georg Fabritius;Hans Jürgen Kerkhoff ; Dr. Thomas Köster; Dr. Wilhelm Koll; Prof. Dr. Walter Krämer; Dr. Thomas A. Lange; Reinhard Schulz; Hermann Rappen; Dr.-Ing. Sandra Scheermesser
Forschungsbeirat
Prof. Michael C. Burda, Ph.D.; Prof. David Card, Ph.D.; Prof. Dr. Clemens Fuest; Prof. Dr. Justus Haucap; Prof. Dr.Walter Krämer; Prof. Dr. Michael Lechner; Prof. Dr. Till Requate; Prof. Nina Smith, Ph.D.
Ehrenmitglieder des RWI
Heinrich Frommknecht; Prof. Dr. Paul Klemmer †; Dr. Dietmar Kuhnt
RWI Materialien Heft 59
Herausgeber:
Rheinisch-Westfälisches Institut für WirtschaftsforschungHohenzollernstraße 1/3, 45128 Essen, GermanyPhone +49 201–81 49-0, Fax +49 201–81 49-200, e-mail: [email protected]
Alle Rechte vorbehalten. Essen 2010
Schriftleitung: Prof. Dr. Christoph M. Schmidt
Second State of European Cities Report
Contract No. 2008CE160AT024November 2010
Research Project for the European Commission, DG Regional Policy

Report
Rheinisch-Westfälisches Institut für Wirtschaftsforschung
German Institute of Urban Aff airs – DIFU
NEA Transport research and training
Policy Research & Consultancy – PRAC
Second State of European Cities Report
Contract No. 2008CE160AT024November 2010
Research Project for theEuropean Commission, DG Regional Policy

Report
Project Team:
RWI: Rüdiger Budde, Christoph Ehlert, Dr. Uwe Neumann (Project Leader), Dr.Matthias Peistrup
Difu: Dr. Busso Grabow, Dr. Beate Hollbach-Grömig, Antje Seidel-Schulze
NEA: Dr. Laura Trofi n
PRAC: Dr. Rolf Bergs
The project team would like to thank Claudia Burgard, FranziskaDöring, Claudia Lohkamp, Robert Schweizog, Daniela Schwindt andBenedict Zinke for research assistance and support of the project work.
Linguistic editing by TITELBILD Subtitling and Translation GmbH, Berlin.
3/189
Contents
Executive Summary ............................................................................................. 9
1. Issues and methodical approach ...................................................... 21 1.1 Objectives and approach .................................................................. 21 1.2 The first State of European Cities Report ......................................... 23 1.3 Issues for this Second State of European Cities Report ................... 24 1.3.1 Urbanisation: growth, decline, settlement patterns and
environmental behaviour of city populations ..................................... 26 1.3.2 Economic change and its impact on social cohesion ........................ 28 1.3.3 Emergence of a knowledge economy ............................................... 29 1.3.4 Regional governance ........................................................................ 30 1.4 Preliminary remarks on the usability of the Urban Audit
according to the results of the City Panel workshop ......................... 31 1.4.1 Data collection process ..................................................................... 32 1.4.2 Local acquaintance with Urban Audit data ........................................ 32
2. Revised city typology ........................................................................ 35 2.1 The Urban Audit as a basis of empirical analysis ............................. 35 2.2 City types .......................................................................................... 38 2.3 Typologies compared ....................................................................... 48
3. Key trends of urban dynamics in Europe .......................................... 53 3.1 Population ......................................................................................... 53 3.1.1 City growth ........................................................................................ 54 3.1.2 Suburbanisation ................................................................................ 65 3.1.3 Age structure .................................................................................... 66 3.1.4 Components of city growth ............................................................... 72 3.1.5 Policy Implications ............................................................................ 73 3.2 Economy ........................................................................................... 74 3.2.1 Agglomeration of economic activity .................................................. 75 3.2.2 Tertiarisation ..................................................................................... 80 3.2.3 Innovation and entrepreneurship ...................................................... 82 3.2.4 Policy implications ............................................................................ 86 3.3 Knowledge and creativity .................................................................. 88 3.3.1 Education standards and knowledge-work in European cities .......... 89 3.3.2 Cultural activity ................................................................................. 91 3.3.3 Cultural diversity ............................................................................... 95 3.4 Social cohesion ................................................................................. 98 3.4.1 Employment and unemployment .................................................... 100 3.4.2 Living conditions: health care, housing, safety ................................ 104 3.4.3 Segregation .................................................................................... 107 3.4.4 Central findings and policy implications .......................................... 110 3.5 Governance and civic involvement ................................................. 113 3.5.1 Urban governance – background and challenges ........................... 114 3.5.2 Approach ........................................................................................ 116 3.5.3 Municipal income and expenditure ................................................. 118 3.5.4 “Powers” of city administrations ...................................................... 119 3.5.5 Modes of urban governance: survey results ................................... 120 3.5.6 Results ............................................................................................ 122 3.6 Environment .................................................................................... 123

4/189
3.6.1 Land use ......................................................................................... 124 3.6.2 Air quality ........................................................................................ 127 3.6.3 Environmental protection ................................................................ 130 3.6.4 Commuting behaviour ..................................................................... 134
4. Conclusions .................................................................................... 139
References ...................................................................................................... 147
Appendix ........................................................................................................ 151

5/189
Tables Table 1 Urban Audit (2004) – number of indicators by year and
spatial level ............................................................................ 37 Table 2 Change in the number of indicators by domain from UA
2001 to UA 2004 .................................................................... 38 Table 3 Numbers of Urban Audit cities in city types, by country ......... 41 Table 4 Selected key characteristics of city types A and B in
comparison ............................................................................ 44 Table 5 Selected key characteristics of city types C and D in
comparison ............................................................................ 45 Table 6 Selected key characteristics of city types A and B in
comparison ............................................................................ 46 Table 7 Selected key characteristics of city types C and D in
comparison ............................................................................ 46 Table 8 Total population of city types ................................................. 47 Table 9 Selected key characteristics of Turkish cities in
comparison ............................................................................ 47 Table 10 Typologies from first and second State of European
Cities Report compared ......................................................... 50 Table 11 Typology from first report and sub-types from second
report compared .................................................................... 50 Table 12 Average annual population change 2001 – 2004 in the
outer urban zone ................................................................... 67 Table 13 Long-term change of unemployment and employment
rates .................................................................................... 104 Table 14 Air pollution: UA cities with the highest number of days
per year of poor air quality ................................................... 127 Table X1 List of cities within city types ................................................ 158 Table X2 Selected key characteristics of Urban Audit cities in
comparison .......................................................................... 159 Table X3 Change in the number of cities participating in the
Urban Audit.......................................................................... 168 Table X4 Clusters of similar response rate patterns by Urban
Audit Sub-Domain ............................................................... 169 Table X5 Countries and cities within clusters of similar response
rate ...................................................................................... 170 Table X6 Dimensions of intra-city differentials in Europe 2004 –
factor loadings ..................................................................... 171 Table X7 Cities and institutions represented in the Urban Audit
City Panel 2009 ................................................................... 172 Table X8 City powers index 2004 ....................................................... 174
6/189
Figures Figure I Population change 2001-2004 ............................................... 13 Figure II GDP per head in PPS ............................................................ 14 Figure III Proportion of domestic and commercial solid waste
disposal methods ................................................................... 20 Figure 2 Economic prosperity and city size – typologies
compared .............................................................................. 51 Figure 3 Share of city types in total population of all Urban Audit
cities ...................................................................................... 55 Figure 4 Population Change 2001-2004 .............................................. 55 Figure 5 Average annual population change 2001-2004 ..................... 57 Figure 6 Average annual population change 2001-2004 ..................... 57 Figure 7 Average annual population change 2001-2004 ..................... 58 Figure 8 Average annual population change 2001-2004 ..................... 58 Figure 9 Net migration into core cities 2003/2004* .............................. 59 Figure 10 Natural population change 2004 ............................................ 63 Figure 11 Natural population change 2004 ............................................ 63 Figure 12 Total population change 1991-2004 ...................................... 65 Figure 13 Proportion of total population aged < 5 .................................. 68 Figure 14 Age structure of Germany in comparison with selected
West and South European Countries .................................... 69 Figure 15 Age structure of Germany in comparison with selected
Central European Countries .................................................. 69 Figure 16 Proportion of total population aged 35-45 .............................. 70 Figure 17 Proportion of total population aged > 75 ................................ 70 Figure 18 Proportion of total population aged > 75 ................................ 71 Figure 19 GDP per head in PPS ............................................................ 75 Figure 20 GDP per head in PPS in relation to the national average ...... 77 Figure 21 Multi-modal accessibility in relation to the EU 27
average ................................................................................. 78 Figure 22 Multi-modal accessibility in relation to the EU 27
average ................................................................................. 78 Figure 23 Proportion of employment in the service sector (NACE
Rev.1.1 G-P) .......................................................................... 81 Figure 24 Proportion of employment in the service sector (NACE
Rev.1.1 G-P) .......................................................................... 81 Figure 25 Proportion of employment in financial services (NACE
Rev.1.1 J-K)........................................................................... 82 Figure 26 Patent Intensity ...................................................................... 84 Figure 27 Patent Intensity ...................................................................... 84 Figure 28 Proportion of working-age population qualified at
university level (ISCED 5-6) .................................................... 90 Figure 29 Proportion of firms in the ICT services sector ........................ 90 Figure 30 Students in university education (ISCED 5-6) per 1,000
inhabitants ............................................................................. 91 Figure 31 Annual cinema attendance per resident ................................ 92 Figure 32 Annual cinema attendance per resident ................................ 93 Figure 33 Tourist overnight stays per resident population ..................... 95 Figure 34 Economic wealth and share of foreigners in European
cities ...................................................................................... 96 Figure 35 Share of foreigners among total population ........................... 96

7/189
Figure 36 Share of foreigners among total population ........................... 97 Figure 37 Agreement: “Foreigners are well integrated” ......................... 98 Figure 38 Unemployment rate ............................................................. 100 Figure 39 Unemployment rate in core cities and outer zones .............. 102 Figure 40 Change of unemployment rate in core cities and outer
zones ................................................................................... 102 Figure 41 Employment rate ................................................................. 103 Figure 42 Hospital beds per 1,000 inhabitants .................................... 105 Figure 43 Murders and violent deaths per 1,000 inhabitants1 .............. 106 Figure 44 Sub-city differentials of unemployment ................................ 108 Figure 45 Statement: “I feel safe in the neighbourhood (in which I
live)” ..................................................................................... 110 Figure 46 Proportion of municipal authority income derived from
local taxation........................................................................ 118 Figure 47 Involvement of citizens´ associations and commercial
associations in policy matters .............................................. 121 Figure 48 Distribution of land use among Urban Audit Cities .............. 124 Figure 49 Net residential density ......................................................... 126 Figure 50 Population density ............................................................... 126 Figure 51 Population density and NO2 concentration .......................... 128 Figure 52 Number of days PM10 concentrations exceed 50 µg/m³ ...... 128 Figure 53 Green space and PM10 ........................................................ 130 Figure 54 Days of rain and PM10 ......................................................... 130 Figure 55 Tons of domestic and commercial waste per head .............. 132 Figure 56 Proportion of domestic and commercial solid waste
disposal methods ................................................................. 133 Figure 57 Proportion of domestic and commercial solid waste
disposal methods ................................................................. 134 Figure 58 Proportion of journeys to work by car .................................. 135 Figure 59 Population density and proportion of journeys to work
by car ................................................................................... 136 Figure 60 Number of registered cars per 1,000 population .................. 136 Figure X1 Acquaintance with Urban Audit data .................................... 151 Figure X2 Usage of Urban Audit data .................................................. 151

8/189
Maps Map I European Macro-Regions for City Comparison ..................... 12 Map 1 City types ............................................................................... 40 Map 2 European Macro-Regions for City Comparison ..................... 52 Map 3 Average annual population change 2001-2004 ..................... 56 Map 4 Migration into core cities 2003/2004 by nationality ................ 60 Map 5 Natural population change 2004 ............................................ 61 Map 6 Total population change 1991-2004 ...................................... 64 Map 7 GDP per head in PPS in relation to national average ............ 76 Map 8 Patent Intensity ...................................................................... 85 Map 9 Unemployment rates in sub-city districts of selected
cities .................................................................................... 108
Boxes Box 1 Spatial observation units in the Urban Audit .......................... 36 Box 2 Relevance of the Worldwide Patent Statistical Database
(PATSTAT) of the European Patent Office (EPO) ................. 83 Box 3 The Perception Survey on quality of life in European
cities ...................................................................................... 94 Box X1 City typology – methodical approach ................................... 152 Box X2 Technical recommendations ................................................ 154

9/189
Executive Summary
Preamble This State of the European Cities report is based on the Urban Audit, which
now allows a comparison between 322 cities in the European Union (EU) and 47 non-EU cities (5 Croatian, 6 Norwegian, 10 Swiss and 26 Turkish cities). The most recent update of the data collection for 2004 considered in this report is from February 2009. It comprises data for 320 cities from the European Union, 6 Norwegian, 4 Swiss and 26 Turkish cities. Altogether, there is information about 356 cities in the data base analysed in this report.
The Urban Audit is a Europe-wide collection of data about cities, which is coordinated by the European Commission (Directorate-General for Regional Policy and Eurostat, the statistical office of the European Union) and was started in 1999. It is conducted in cooperation with national statistical offices from the European Union Member States as well as from Croatia, Norway, Switzerland and Turkey, and with cities concerned. The Urban Audit provides city data on different spatial levels: core cities, larger urban zones (LUZ), sub-city districts and national averages.
The year 2002 saw the launch of the first large-scale Urban Audit data collection, comprising 258 cities in the EU Member States and accession countries. The data compiled up to 2002 comprised data for the year 2001 and restricted sets for 1991 and 1996.
As noted above, the Urban Audit collects data for 369 cities. The resulting data set allows objective comparisons to be made between the cities included from across the European Union and beyond, in the fields of demography, social conditions, economic aspects, education, civic involvement, environment, transport and culture.
Following a call for tenders, launched by the European Commission, the consortium responsible for producing this report was appointed to undertake an analysis of the Urban Audit data base, focusing on the collection for the year 2004, carried out and validated from 2006 to 2008. This report is one of the main outputs of this work. The previous State of European Cities report, which was coordinated by Ecotec, was published in 20071 and based on the previous data collections.
During the analysis and report writing phases, the study team benefited greatly from exchanges with a Scientific Steering Committee composed of a panel of
1"State of European Cities Report - Adding value to the European Urban Audit"
http://ec.europa.eu/regional_policy/themes/urban/audit/index_en.htm

10/189
five renowned experts2 in the field of urban development in Europe, as well as comments from the European Environment Agency.
Issues and approach It is the task of this report to provide up-to-date information on urban
characteristics and urban dynamics in Europe, which can be used as background for strategic planning in a wide range of policy fields with a distinct urban dimension, e.g. economic, environmental and cohesion policy.
Analysis in this report follows a strategy of empirical “information compaction”, filtering out key aspects from a broad set of indicators using state-of-the-art statistical methods. Preparation of this second State of European Cities Report comprised discussion of intermediate results with colleagues from the European Commission (DG Regional Policy, Eurostat) and with the panel of experts. In addition, a panel of representatives from 32 cities in 24 countries was set up. It took part in a survey on matters of urban governance and met for a two-day workshop in Berlin to discuss intermediate results of the analysis, user-related questions and the future development of the Urban Audit data base.
This report groups cities into “types” with the aim of providing a solid foundation to compare cities with similar characteristics. Four basic city types were defined by statistical analysis based on a set of 21 indicators. These four types provide the general background for city comparison in the report. In an additional step, nine sub-types of the four basic city types were derived. Selected indicators were examined according to their variation across the sub-types. To improve usability, city types were provided with labels, which summarise the main characteristics. It must be kept in mind, however, that any labelling is combined with a considerable degree of simplification.
Basic type A comprises 52 very large and capital cities from all parts of Europe, with an average of over 1,000,000 inhabitants, described as “Principal Metropolises”. These cities are not only the largest agglomerations of people and firms, they also account for the most dynamic innovation and entrepreneurial activity and are centres of specialised services aiming at national and international markets. Furthermore, they are central locations of private and public administrative functions. Type B (Regional Centres) comprises 151 cities from all parts of Western Europe. With an average population of around 290,000 they are considerably smaller than the Principal Metropolises. Overall economic output, patent intensity and entrepreneurial activity are lower than in the highest-ranking urban centres, yet still high above national averages. Type C (Smaller Centres) comprises 44 cities, mainly from Western Europe and mostly outside its economic core zone. The urban economy in these cities is less vibrant than in
2The panel of experts comprised Prof. Roberto Camagni, Politecnico di Milano; Prof.
Christian Lefèvre, Université Paris-Est; Prof. Anne Power, London School of Economics; Dr Ivan Tosics, Metropolitan Research Institute of Hungary, Budapest; Prof. Cecilia Wong, University of Manchester.

11/189
types A and B. However, on average, the share of highly qualified working-age residents is relatively high. Type D (Towns and Cities of the Lagging Regions) consists of 82 smaller cities from economically lagging regions in Central and Southern Europe, which differ from other cities in that they have higher unemployment, lower GDP per head and a regional specialisation, in which manufacturing plays a far more important role. In contrast to other cities, their population is declining.
The results of the classification approach applied in this report by and large corroborate the key features of the typology from the first State of European Cities Report. The current typology, however, is characterised by a more distinct core-periphery progression between the core zone of the European economy, the more peripheral parts of Western Europe and the non-capital cities of Central Europe, even though the indicator set was not restricted to direct measures of economic prosperity. In Europe-wide comparison, cities obviously need to be classified firstly according to their basic (macro-)regional affiliation and secondly in terms of their more specific function. Comparison among similar city types, therefore, only comprises one aspect of the analysis in this report. We also compare cities within countries and parts of Europe (Central, North, South, West, cf. Map I).
Population This section focuses on processes of city growth, suburbanisation, and the age
structure. The picture of urban growth or decline in Europe is highly diverse and it is very difficult to identify common trends valid for all cities or even groups of cities and macro-regions. On average, it would appear that more recently large cities in the European economic core zone and cities in Northern Europe have grown more rapidly than smaller cities and cities in Central Europe (cf. Figure I).
However, particularly in Western and Southern Europe a varied picture of growth, stagnation and decline can be observed among cities of different size and type. In the period from 2001 to 2004 the outer zones of all different city types on average grew faster than the core cities. In Central Europe, on average the outer zones grew, while the inner zones (and thus the larger urban zones altogether) shrunk.
Balanced net migration into core cities suggests that in most cities of Western Europe, there is currently no major shift of population from the inner to the outer zones. In Central Europe a more pronounced suburbanisation process can be observed.
Many cities in the most accessible parts of Europe, e.g. in Germany, have reached a relatively advanced stage in the demographic ageing process. In most of these cities, there is a surplus of deaths over births, i.e. population growth depends on net immigration. In other parts of Europe, the population is, on average, still “younger”.

12/189
Map I European Macro-Regions for City Comparison
Own illustration.
13/189
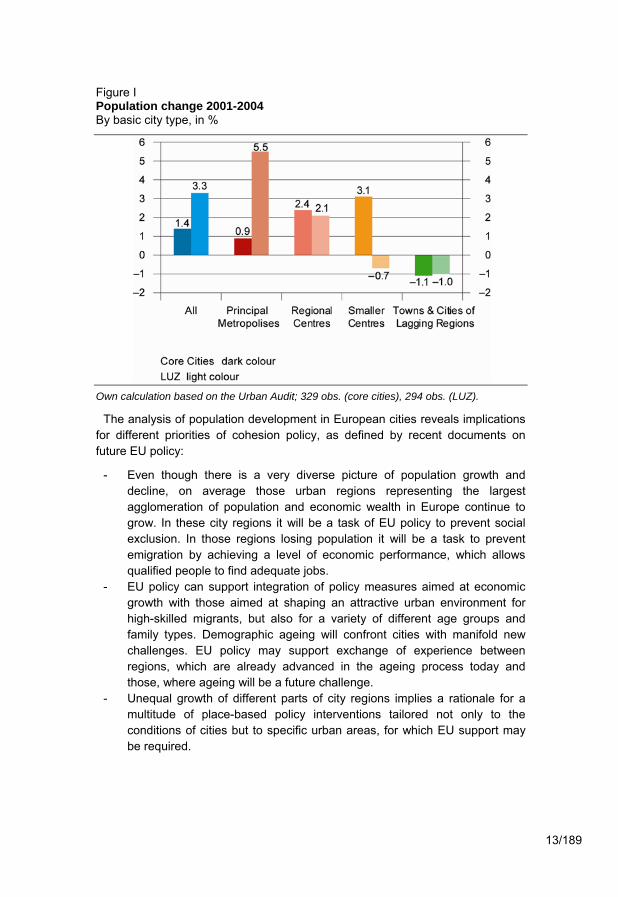
Figure I Population change 2001-2004 By basic city type, in %
Own calculation based on the Urban Audit; 329 obs. (core cities), 294 obs. (LUZ).
The analysis of population development in European cities reveals implications for different priorities of cohesion policy, as defined by recent documents on future EU policy:
- Even though there is a very diverse picture of population growth and decline, on average those urban regions representing the largest agglomeration of population and economic wealth in Europe continue to grow. In these city regions it will be a task of EU policy to prevent social exclusion. In those regions losing population it will be a task to prevent emigration by achieving a level of economic performance, which allows qualified people to find adequate jobs.
- EU policy can support integration of policy measures aimed at economic growth with those aimed at shaping an attractive urban environment for high-skilled migrants, but also for a variety of different age groups and family types. Demographic ageing will confront cities with manifold new challenges. EU policy may support exchange of experience between regions, which are already advanced in the ageing process today and those, where ageing will be a future challenge.
- Unequal growth of different parts of city regions implies a rationale for a multitude of place-based policy interventions tailored not only to the conditions of cities but to specific urban areas, for which EU support may be required.

14/189
Economy This section focuses on indicators of economic prosperity, regional economic
specialisation, innovation and entrepreneurship. Economic wealth and activity is highly concentrated in a European core zone of Western and Northern Europe, Northern Italy, parts of Spain, and the capital cities of Central European countries. In the past few decades, smaller cities in Central Europe and in more peripheral parts of Northern and Southern Europe have failed to keep pace with the economic dynamics of the big cities and capitals and the more vibrant smaller cities of Northern, Southern and Western Europe.
In most European countries there is an exceptional agglomeration of wealth in the capital city. This verifies the dominant and unique position of capitals in a (national) economic system (Figure II).
Figure II GDP per head in PPS By country, macro-region and city type, 2004 (core cities/NUTS3 regions)
Own calculation based on the Urban Audit and regional Statistics from Eurostat. – Type A: Principal Metropolises (except capital cities, which are shown separately), Type B: Regional Centres, Type C: Smaller Centres, Type D: Towns & Cities of the Lagging Regions, other: cities, which are not part of the typology (cities from Turkey and Cayenne, French Guyana). For an explanation of the typology cf. section on “Issues and approach”.
Between 2001 and 2004, economic growth has been particularly high in Central Europe (except for Poland and Romania). Patent intensity in 2004 reveals remarkable regional disparities in technological competitiveness in Europe and is high in the most prosperous cities and low in peripheral regions. However, patent intensity is relatively high in some (capital and non-capital) Central European cities, where the conditions for economic prosperity are, therefore, improving (and have already improved throughout the past two decades, see below).
The analysis of economic indicators reveals the following implications for “innovation”, which EU documents define as a particular core priority of future cohesion policy:
0
10000
20000
30000
40000
50000
60000
70000
80000
90000Capital city Type A (non‐capital) Type B Type C Type D other Country UA cities (weighted average)
Northern Central Western Southern
DK FI NO SE BG CZ EE HU LV LT PL RO SK SI AT BE FR DE IE LU NL CH UK CY GR IT MT PT ES TR
Northern Central Western SouthernNorthern Central Western SouthernNorthern Central Western SouthernNorthern Central Western SouthernNorthern Central Western SouthernNorthern Central Western SouthernNorthern Central Western Southern

15/189
- Innovation and technological progress are most prevalent in Europe’s existing hubs of economic activity. However, a number of relatively innovative locations within Central Europe indicate that there is scope for regions in the process of structural adaptation to find economic specialisations, which can be based on intra-regional technological innovation.
- The findings of this analysis support the rationale of a strategy, which, firstly, seeks to identify the economic core activities of a region and, secondly develops measures to support these actors and networks. This strategy needs to be “tailored” to regional conditions. Distinction will be made in particular between support of innovation and entrepreneurship in those regions, which are already economic hubs now and those, where competitive specialisations still need to be developed. It is true, in an ever-changing economy, regional specialisation can only last so long, before new technologies and completely new activities will take over. Especially for smaller cities, however, a very broad diversification will not be a possible alternative to a certain degree of specialisation. In any case, economic cores need to be understood as very flexible entities of industries and networks, which are themselves subject to constant change. There is scope for EU policy to support regions in this “smart specialisation” process.
- A specific characteristic of urban economic specialisation is tertiarisation, i.e. the concentration of services (including administrations of industrial enterprises and state administration). In many Western European countries, the most central public and private sector administrative functions concentrate in very large and capital cities, while regional economic control functions agglomerate in those classified as Regional Centres (Type B) in this report. In the highly centralised administrative systems of Central Europe, it will be very difficult to encourage a more balanced distribution of urban economic control functions over national space. As part of an economic development strategy focusing on utilisation of regional capacity, however, it can be a goal to enhance the role of smaller cities as focal points of regional productive networks.
Knowledge, Creativity, Diversity While manifold interrelationships between regional competitiveness and human
capital are apparent and engaging in higher education is an indispensible factor of economic prosperity, it cannot be expected that investing in education will provide short-term success in the process of structural adaptation. There is no doubt that many Central European cities, which stand out because of a particularly active engagement in higher education, will benefit from this effort in the long run. Since there is conclusive evidence demonstrating the role of knowledge workers in regional performance, cities must provide more attractive conditions in peripheral and lagging regions, to encourage students to stay in the region after graduation. In the case of all cities, there is a very strong positive

16/189
correlation between the proportion of foreigners and urban economic wealth. While vibrant cities in the core zones of the European economy attract many migrants from within and beyond national borders, in peripheral locations, the in-flow of migrants from other regions and countries is low. For peripheral cities, it is naturally a key priority to provide favourable conditions for economically active inhabitants to stay in the region.
There is a highly urban dimension especially to the support of knowledge-based territorial cohesion. Innovation indicators, such as patent intensity, measure higher innovation activity in cities than in countries on average and among cities, innovation output is particularly high in the very large agglomerations. Cities, therefore, seem to provide favourable surroundings for the diffusion of knowledge and its application in economic activity, even though it is very difficult to apply statistical indicators for these processes on a regional level and the existing measures may be biased in favour of cities, e.g. because firms may attribute all company-wide research activity to headquarter locations. Since generation of innovation requires constant effort and is, in itself, the driving force of economic change, there is a wide scope of policy support with an urban focus even in the most prosperous regions of Europe. In Central Europe, it will be a task of cohesion policy to support local actors in identifying suitable economic sectors and developing strategies for regional knowledge-based growth.
Social cohesion Empowering people in inclusive societies is one of the key priorities of the
envisaged EU policy for the forthcoming decade. A socially inclusive society can, in short, be defined as one in which all individuals (and groups) can enjoy essential standards and in which disparities are not too great. It is, of course, very difficult to examine to what extent disparities between individuals and groups are acceptable. Yet, based on the Urban Audit indicator set and additional (subjective) information from the Perception Survey on quality of life in European cities3, an overview of the standard of living according to selected indicators is given in the report.
The main issues examined in this section comprise employment and unemployment and living conditions as represented by health care, housing, and safety. A direct measure of intra-city income disparity is only available for part of the Urban Audit cities. It suggests that in the period from 2001 to 2004, income disparity in cities as a whole did not increase and that income disparity is not a typical “big city” problem in Europe, but an apparent characteristic of cities of very different size and in very different macro-regions.
3Perception survey on quality of life in 75 European cities, European Commission, Re-gional Policy, March 2010, available in five languages (DE, EN, ES, FR, NL) at: http://ec.europa.eu/regional_policy/themes/urban/audit/index_en.htm

17/189
It can be argued that the overall agglomeration process in the European core zone is not, as might be suspected according to some hypotheses, accompanied by a simultaneously increasing degree of urban poverty or disparity, as far as the available indicators allow such generalisation. Unemployment rates differ between cities from most European macro-regions, except for Northern Europe, where unemployment rates are generally low. Unemployment is particularly high in smaller cities of Central Europe, but has declined there, considerably, since the beginning of the 1990s and continued to decline in the period from 2001 to 2004. Unemployment is lowest in the most prosperous cities and there is no above-average concentration of unemployment in very large cities. Unemployment is particularly low in the outer zones of the very large cities, where, on average, unemployment rates have decreased even further in the study period. Yet, employment rates of the resident population in Northern, Southern and Western Europe are relatively low in a number of cities.
The apparent lack of an interlinkage between wealth and job creation for urban residents in cities has been described as an urban paradox. In particular, employment rates would be expected to be very high in the Principal Metropolises, but they are considerably higher in some of the second-tier Regional Centres. By and large, since the 1990s this paradoxical situation has persisted in European cities, yet as a whole the share of those not participating in the creation of value has not – as might have been suspected – increased.
In order to secure economic prosperity and social stability, it will be a task for many of the large cities of Europe, but also for the smaller cities in peripheral regions, to encourage higher participation in the urban labour market among the resident population.
Since it can be expected that labour-oriented migration will continue to focus on large cities, smaller cities may find it increasingly difficult to compete for mobile workers. However, combination of a good quality public (e.g. health care, education, culture) infrastructure, good accessibility, a certain degree of economic specialisation and affordable high-quality housing may prove to be a considerable advantage of smaller cities in competition with the large agglomerations and serve to prevent income disparity and poverty.
According to the Barca (2009) report on an “agenda for a reformed cohesion policy”4, an EU place-based approach can respond to the highly diverse way, in which migration flows affect regions. The results presented in this Second State of European Cities Report would strongly support this argument, since it was shown that attraction of foreigners is one of the factors securing urban prosperity already and is likely to improve in importance in the course of demographic ageing of European society on the one hand and increasing mobility on the other. EU cohesion policy could support local authorities in urban and rural areas in adjusting public service in the fields of education, healthcare, transport,
4http://ec.europa.eu/regional_policy/policy/future/barca_en.htm

18/189
childcare, extension of skills, business support, urban renewal, and in addressing special needs of migrants and people particularly affected by migration.
Since children in Europe have a higher poverty risk than the total population, ensuring their social inclusion, particularly in cities, can also be considered as a core policy priority. In many cities, low birth rates in comparison with national averages show that families with children are under-represented. High priority would also be recommended for social inclusion of the elderly as a policy objective in order to secure future prosperity of cities in particular.
So far, no general conclusion about the degree of disparities between sub-city districts or the extent, to which such disparities are deemed “acceptable” can be made. It is very likely that due to residential segregation social inclusion for poor people and minority groups will be more difficult to achieve. However, segregation patterns are highly diverse, even among cities of similar size and function and within regions. Policy aiming at a reduction of segregation needs to be tailored to specific regional conditions. Responsibility for such programmes would ideally be located at the relevant departments of municipal administrations, which may be supported by an “external intervention” from national governments and the EU. In neighbourhood-oriented policy, more attention needs to be paid to the effects of segregation according to age and fa-mily type.
Governance and civic involvement The index of “city powers”5 as elaborated by the first State of European Cities
report has been revised. The results shed some light on cities’ financial capacities in terms of financial weight and financial autonomy. Interpreting governance data and comparing data in different cities is a far more complex endeavour than analysis of other city characteristics (e.g. demographic and economic aspects), since institutional settings must be considered here.
Looking at the index of “powers”, it is apparent from the variety of national patterns that cities do not only differ as a result of their size, economic potential or location, but also on account of the country they represent in the analysis. Since Scandinavian countries traditionally entrust sub-national levels (e.g. cities) with stronger decision-making powers and greater financial capacity, Scandinavian cities, whether large or small, economically powerful or lagging behind, will, as a matter of course, score high in the index of powers.
While it may have been expected that the scope of city administrations depends more or less evenly on city size and political autonomy, e.g. in local taxation, a significantly larger proportion of those Urban Audit cities with
5The members of the panel of experts expressed a lot of scepticism concerning the
terminology in this section of the report. In the literature, the term “powers” is associated with the scope of a city’s entrusted authority, conveyed by budgetary capacity, autonomy and size. Since this concept is suitable to the focus of this study, the term “powers” was adopted here.

19/189
relatively large administrative “powers” appear to draw their overall scope to govern their own concerns more from political autonomy than from sheer size.
Environment and transport With respect to the indicators provided by the Urban Audit, the environmental
characteristics of European cities differ to a great extent. The analysis in this report takes into account a selection of these indicators, namely land use, air pollution, car use and waste treatment.
Land use in Urban Audit cities shows rather little variation in respect to the size of land allocated to housing and recreation and sports. In contrast, there is high diversity in the size of total land area and green space area among the cities. In general, cities with a relatively large land area in relation to the resident population, are “greener” cities providing more urban biodiversity. NO2 concentrations are negatively correlated with the proportion of green space in the core city area. A similar relationship between air pollution and the way in which settlements are geographically organised is found for PM10, the concentration of which is positively correlated with the population density of the urban set-tlements. From a policy perspective, therefore, it seems recommendable to pre-serve as much green space in cities as possible in order to improve air quality and to preserve urban biodiversity, which itself also might raise awareness of the importance of environmental protection among the urban population. Nevertheless, in an urban environmental strategy avoiding pollutant emission is, of course, the primary goal.
On average, Northern and Western European cities have the highest recycling share in commercial and domestic waste treatment, while Central European cities have only very low recycling shares and much higher shares of landfill waste disposal (Figure III). Furthermore, the share of landfill waste disposal should be reduced in order to allow for more environmentally friendly ways of waste treatment, such as energy recovery by incineration or recycling.
As recycling rates are high in some of the most prosperous large cities of Northern and Western Europe, there is obviously no conflict between economic prosperity and environmental protection. It is thus a likely task of cohesion policy to support inter-city and international cooperation in developing strategies to achieve economic growth while preserving the environment.

20/189
Figure III Proportion of domestic and commercial solid waste disposal methods National averages of Urban Audit cities, 2004
Own calculation based on the Urban Audit.
City statistics as a tool for European policy Since the achievement of key goals of European policy, e.g. support of
knowledge-based economic growth, social inclusion and environmental sustainability, depends on the success of many measures with a particular urban focus, continuing efforts to improve the knowledge-base on urban conditions are required. To improve usability of the Urban Audit as a policy-oriented information tool further, the indicator set itself and the instruments for analysis and display are currently being advanced. Among the Urban Audit cities, an additional annual data collection with a reduced catalogue of variables will be added in order to provide complete time-series of key indicators. The total data collection will be continued every third year. A further Large City Audit includes all ‘non-Urban Audit cities’ with more than 100,000 inhabitants in the EU. To provide information about the perception of life in European cities, the Perception Survey on quality of life in European cities will be continued. As from 2010, a GIS-based information tool on the Internet, the Urban Atlas, will improve usability of the Urban Audit considerably. Allowing display of Urban Audit data in different kinds of maps, it will be a useful tool for planners and policy-makers in particular. Furthermore, Eurostat is preparing a web-based dissemination tool called “Cities’ and Regions’ Profile” (CARP) based on Urban Audit data.
0
100
80
60
40
20
MT LT HU LV CZ PL SK UK SI PT EE ES FI IT DE SE NL BE NO AT CH DK
landfill other methodsincinerator recycling

21/189
1. Issues and methodical approach European regional and urban policy face the dual challenge of a rising
awareness about urban issues and finding comparable information on cities and their developmental dynamics. The Urban Audit therefore aims at improving comparative information about urban areas in Europe. The Urban Audit is a Europe-wide collection of data about cities, which is coordinated by the European Commission (Directorate-General for Regional Policy and Eurostat). It is conducted in cooperation with national statistical offices from the EU Member States and from Norway, Switzerland and Turkey and from cities concerned. The Urban Audit provides city data on different spatial levels: core cities, larger urban zones (LUZ), sub-city districts and national averages. Following an initial pilot project involving 58 cities in 1998, 2002 saw the launch of the first large-scale Urban Audit data collection, comprising 258 cities in the EU Member States and accession countries. Over 300 variables were processed covering demographic, social, economic, environmental and cultural aspects, civic involvement, accessibility and other factors concerning transport infrastructure and use of modern information technology. The data compiled up to 2002 comprised data for the year 2001 and restricted sets for 1991 and 1996. The first State of European Cities Report, published in 2007, used this data base as its foundation. A second large-scale collection focusing on the year 2004, carried out and validated from 2006 to 2008, subsequently created a fourth date in the longitudinal data set. It comprises data for 369 cities from the European Union, Croatia, Norway, Switzerland and Turkey6. This second State of European Cities Report focuses on this update of the Urban Audit7.
The Urban Audit is distinctive in that it does not only comprise a comprehensive collection of data about cities but also includes information on the respective larger urban zones, sub-city districts and national averages. The combination of peri-urban, city and sub-city information makes the Urban Audit a particularly invaluable source of empirical urban research, which is highly relevant for regional and urban policy.
This second State of European Cities Report has used this empirical base to conduct an up-to-date review of the state of the urban system in Europe and to observe its dynamics at the beginning of the 21st century.
1.1 Objectives and approach This second State of European Cities Report aims 6Further information is provided by the Urban Audit web site: www.urbanaudit.org and by
the INFOREGIO site at http://ec.europa.eu/regional_policy/themes/urban/audit/index_en.htm. Urban Audit data can be downloaded from the Urban Audit web site and from the Eurostat site http://epp.eurostat.ec.europa.eu.
7The most recent update of the data collection for 2004 considered in this report is from February 2009. It comprises data for 356 cities, 320 from the European Union, 6 Norwegian, 4 Swiss and 26 Turkish cities.

22/189
• to use this unique data set to produce an up-to-date analysis of the urban system and its dynamics in Europe,
• to encourage usage of the Urban Audit by providing user-friendly presentation of both the data set and the results of the analysis in this research project,
• to interpret the analysis in the context of the current discussion in urban research concerning the prospects of European cities and the factors shaping urban dynamics,
• to examine these results in light of their urban and regional policy implications, and
• to draw conclusions with regard to key policy issues at the EU and urban levels and with regards to the further development of the urban audit and/or harmonisation of urban statistics in Europe.
In line with the discussion on the emergence of a continental and global urban hierarchy (Friedman 1986, Sassen 1991, Taylor 2005), observing urban economic competitiveness was a key focus of the first report. This report pursues this train of thought while examining in greater detail the interrelationships of various urban characteristics in the process of shaping the competitive position of individual cities in Europe. In this respect, the analysis draws upon the entire spectrum of information included in the Urban Audit concerning demography, social and economic aspects, civic involvement, training and education, the environment, travel and transport, access to information technology, and culture and recreation.
Information from an extensive range of topical domains is therefore used both to identify groups of cities exhibiting similar structural characteristics and to examine key aspects of urban dynamics. Analysis of urban trends in the report follows a strategy of empirical “information compaction”, filtering out key aspects from a broad set of indicators using state-of-the-art statistical methods. Since any empirical analysis depends on the quality of the information upon which it is based, the analysis begins with a thorough assessment of the Urban Audit as a statistical analysis base. The empirical approach was based on the findings of this initial assessment. Further indispensable factors in the preparation of this second State of European Cities Report included
• discussion of intermediate results with colleagues from the European Commission (DG Regional Policy, Eurostat) and with a panel of five renowned experts8,
8The panel of experts comprised Prof. Roberto Camagni, Politecnico di Milano; Prof.
Christian Lefèvre, Université Paris-Est; Prof. Anne Power, London School of Economics; Dr Ivan Tosics, Metropolitan Research Institute of Hungary, Budapest; Prof. Cecilia Wong, University of Manchester.

23/189
• setting up a large panel of city representatives from 32 cities in 24 countries who took part in a survey on matters of urban governance and met for a two-day workshop in Berlin to discuss intermediate results of the analysis and experience concerning the usability of the Urban Audit9.
The report is structured as follows: the remainder of this chapter gives an overview of relevant literature and establishes a number of issues which form the parameters for the analysis. Based on the discussion during the City Panel workshop in Berlin, an initial assessment of the usability of the Urban Audit data base is provided. Chapter 2 develops a suitable approach for a revision of the city typology provided by the first State of European Cities Report and identifies groups of cities with similar basic conditions for comparison in the subsequent analysis. Chapter 3 provides an up-to-date analysis of the urban system and its dynamics in Europe, based on all the key topics (domains) of the Urban Audit (2004). Chapter 4 concludes by summarising the key results concerning the main policy-relevant issues raised in the first chapter. Finally, Chapter 5 highlights the implications for further development of the Urban Audit as a source of information for different target groups, e.g. policy-makers at different administrative levels (city, region, country, EU) and researchers.
1.2 The first State of European Cities Report The first State of European Cities Report, published in 2007, examined
important urban research issues such as population change, urban economic competitiveness, selected living conditions and the administrative power of cities by drawing on key elements of the first three waves of the Urban Audit data set, i.e. 1991, 1996 and 2001 (European Commission (ed.) 2007).
One of the key outcomes of the first report was the drafting of a city typology applicable to the European urban system as a whole. This typology consisted of city types, which were grouped firstly by size and GDP and then heuristically according to various city characteristics. The analysis gave rise to 13 city types (see below).
One of the aims of this second report is to provide an evidence-based review of this typology. Furthermore, the first report achieved a significant goal by providing an overview of finance and governance patterns taking into account matters of size, political status, spending power and control over income. Drawing on the analysis provided by the first report, this report aims to investigate the role of new modes of urban and regional governance as a prerequisite to guaranteeing cities and regions the best possible conditions for economic competitiveness and quality of life in times of increasing financial constraints.
9Table X7 in the appendix includes a list of the cities and institutions represented in the
city panel. Box X2 in the appendix highlights the technical recommendations concerning future development of the Urban Audit. It summarises the results of the Berlin workshop.

24/189
A key achievement of new approaches to urban regeneration, such as the URBAN I (1994-1999) and URBAN II (2000-2006) Community initiatives, has been the integration of various fields of urban policy into a comprehensive overall strategy focusing on the local level. In the current 2007-2013 funding period, EU cohesion policy aims to strengthen the urban dimension of its strategies. Comprehensive information on urban matters, such as that provided by the first and second State of European Cities Report, forms a vital basis of information for developing effective policy responses.
1.3 Issues for this Second State of European Cities Report The first and second State of European Cities Reports are unique insofar as
they are rooted in an empirical base of harmonised information comprising a large number of cities across Europe. With regard to the literature, empirical evidence based on comparable statistics from such a wide array of cities is usually only available for North America. Empirical studies taking Europe as a case study are generally either restricted to parts of the continent, using data from national or regional sources, or based on information about regions, possibly comprising urban agglomerations and their more rural hinterland, entirely rural areas, more than one city or even subdivisions of large urban regions. The first and second State of European Cities Reports thus broaden the literature relevant to comparative urban analysis by providing a review from a European urban perspective.
Most and for all, it is the task of this empirical work to provide up-to-date information on urban characteristics and urban dynamics in Europe, which can be used as background for a wide range of policy measures with a distinct urban dimension, e.g. economic, environmental, regional and social cohesion policy.
The European Commission (2009a) considers that in the forthcoming decade EU policy will need to focus on three priorities:
(i) creating value by basing growth on knowledge,
(ii) empowering people in inclusive societies,
(iii) creating a competitive, connected and greener economy.
In this report it will be shown that there is a particular urban dimension to policy measures focusing on these priorities. Overall fulfilment of many policy goals under these priorities depends on their success in urban areas. Cities are focal points for the diffusion of knowledge and the generation of innovation, but densely populated areas also give rise to manifold social and environmental problems.
In his report on an agenda for a reformed cohesion policy, Barca (2009) suggests six possible priorities for future cohesion policy, which substantiate the three more general priorities mentioned above: innovation, climate change, migration, children, skills and ageing. Particularly, the report argues that a place-based development strategy aimed at both core economic and social objectives

25/189
is required to achieve EU policy goals. It defines a place-based policy as “...a long-term strategy aimed at tackling persistent underutilisation of potential and reducing persistent social exclusion in specific places through external interventions and multilevel governance” (Barca 2009: VII). Policy measures focussing on place-specific potentials and obstacles require a sound characterisation of place-specific development conditions. Surely, a city typology will be required for this purpose.
This second State of European Cities Report provides a typology of comparable cities. It highlights the starting position of cities in all EU countries and in Norway, Switzerland and Turkey to meet the challenges facing the EU in the forthcoming decade. It draws on information from all topical domains of the Urban Audit, i.e. Demography, Social Aspects, Economic Aspects, Civic Involvement, Training and Education, Environment, Travel and Transport, Information Society, Culture and Recreation.
In order to focus on the most relevant urban issues, the choice of indicators has been decided according to data availability and according to the main questions and arguments currently discussed in the scientific literature on urban dynamics. There are, in particular, four strands of literature which raise the key issues for this report. These concern
(i) urbanisation, i.e. all aspects concerning growth or decline of city populations and their behaviour with respect to settlement patterns, mobility, and environmental sustainability,
(ii) economic change and its impact on social cohesion,
(iii) the emergence of a knowledge economy,
(iv) governance of cities and regions.
This report examines urban dynamics predominantly from the perspective of the social sciences. As Alberti (2009: 25) states: “Studies of urban systems and of ecological systems have evolved in separate knowledge domains […]A new inter-disciplinary synthesis is necessary if urban and ecological dynamics are to be integrated successfully”. Since achievement of environmental sustainability will be one of the major political targets of the next decades, an analysis of environmental standards and treatment of the environment, based on information from the Urban Audit, has been carried out. This, however, can only be one small step towards a more integrated framework for studying the interactions between biophysical and socioeconomic processes.
This section highlights the key arguments from the current discussion in the relevant literature, which give the background for the analysis displayed in chapters 2 and 3. Before discussion of the analysis, the following section 1.4 summarises the remarks about the usability of the Urban Audit articulated during the City Panel workshop in Berlin in March 2009. This review provides necessary

26/189
preliminary information about the state of the Urban Audit data collection and its applicability as basis of empirical analysis.
1.3.1 Urbanisation: growth, decline, settlement patterns and environmental behaviour of city populations
The widest range of literature on urban and regional dynamics relevant to this report deals with urbanisation trends in general. This literature, basically, looks at why people and firms agglomerate, under what conditions spatial development tends to result in regional disparities, under what conditions disparities tend to equalise and how settlement patterns and living conditions within densely populated regions develop. Recent advances in theoretical and empirical work have considerably improved knowledge about these processes. As Redding (2009) pointed out in a recent review, some of the central theoretical predictions of the New Economic Geography literature (cf. Krugman 1991) receive substantial empirical support. For the purposes of this report, the most relevant findings are that
a. there is a considerable “home market effect”, implying that firms tend to concentrate in a single location and close to a large market, and
b. there are further powerful agglomeration forces, in particular pooling of specialised skills, proximity to customers and suppliers, and knowledge spillovers, which imply that firms tend to collocate (cf. Ellison et al. 2007).
In other words: more people and firms will settle in urban regions which are already economically successful. In the near future, in Europe market forces alone, therefore, cannot be expected to equalise existing regional disparities.
As stated in the Interim Territorial Cohesion Report (EU Commission 2004a), economic activity within Europe is highly concentrated in a region between the cities of Hamburg, London, Milan, Munich, and Paris. In the second half of the 1990s there was a sharp westward shift in population within Europe (EU Commission 2004a: 13), i.e. predominantly from Eastern and Central Europe towards the existing economic core zone. In Central Europe, the report identifies growth potential in a transnational macro-region between Warsaw, Berlin, Prague, Vienna and Budapest. One of the tasks of this report will be to examine whether spatial agglomeration processes currently tend to increase or decrease inequalities between cities in “core and periphery”, both on a European and on a regional scale and if intensified city-specific policy action in the lagging regions (EU Commission 2006a, 2008b) is to be recommended. It should be noted that the empirical base used in this analysis focuses on the 2004 period of the Urban Audit, i.e. the observation does not include changes in Central Europe since accession to the EU.
As emphasised in the Green Paper on Territorial Cohesion (EU Commission 2008a), a particular asset of the European urban system is the way in which it comprises only a relatively small number of very large urban agglomerations. In contrast to other densely populated hemispheres, e.g. North America, in terms of

27/189
resource-efficiency and quality of life, the European settlement pattern has the advantage that it consists of a vast array of smaller cities. It has been highlighted in the Green Paper (EU Commission 2008: 5) however, that the pattern of economic activity in Europe is far more uneven than the pattern of settlement. In this respect the Green Paper establishes that territorial policy must aim to prevent excessive spatial concentration of economic growth, which may combine with undesired effects, e.g. congestion, inner-city decay and pollution.
In spite of an ongoing suburbanisation process resulting in the sprawl of urban settlements from the core zones to the surrounding areas to date there are no signs of a disintegration of urban settlements altogether, as predicted by some theories (Berry 1976).
Yet, over the course of suburbanisation, segregation according to income, age, and family status acquired a regional dimension, leaving older people, singles and the poor in the inner parts of central cities, while many well-off families moved into one-family-homes in the surrounding areas. It has, accordingly, been described as an urban paradox that on the one hand, there is great concentration of wealth and economic dynamism in cities, while, on the other, in many cities unemployment is high among the residential population (EU Commission 2006b: 9; OECD 2006: 76).
Since the 1980s a re-migration process of well-off working-age people into selected central city quarters has been observed in many cities around the world. (Smith and Williams 1986). As this re-urbanisation (or “gentrification”) process is restricted to particular areas, it is likely to augment the great diversity of urban neighbourhoods, some of which are characterised by a concentration of poverty, others by a considerable accumulation of wealth. In the course of demographic change, new challenges to urban policy may arise from the specific age and family structure of cities, e.g. due to the agglomeration of senior citizens in central city areas or the “ageing” of the suburban population resulting from a dramatic decrease in fertility.
In the future, intra-regional migration processes between core cities and outer zones may depend on the environmental situation in large cities. Also, as mentioned before, greater efforts must be made to examine how cities in particular can become more sustainable with regard to environmental protection.
The state of the discussion about city growth, settlement patterns and environmental treatment in cities leads to the following issues for this report:
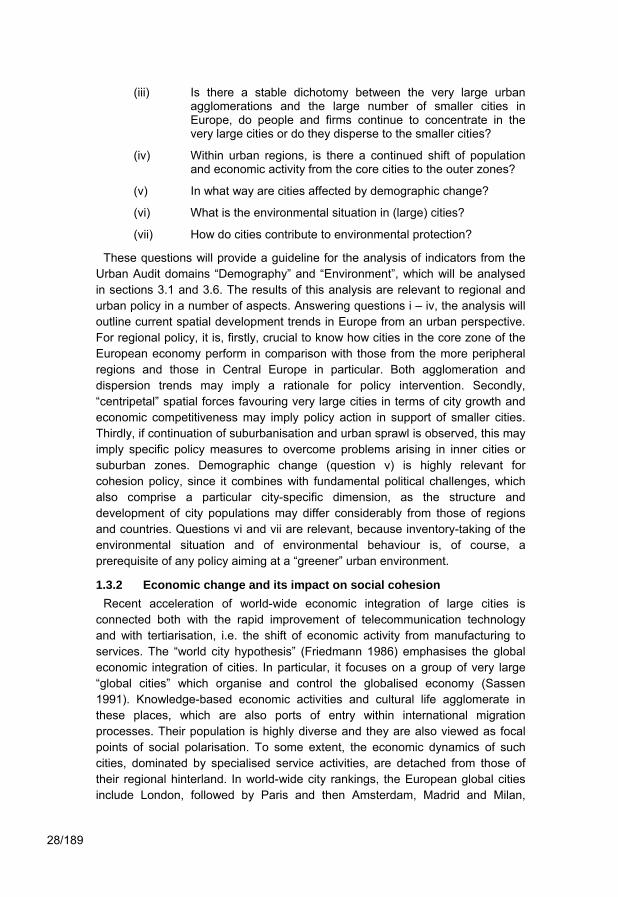
(i) Is there an ongoing spatial concentration process with regard to people and economic activity in cities of the core zone of the European economy?
(ii) Are cities in Central Europe catching up with those in Western Europe or do dynamics within the urban system signal an increase in disparities?
28/189
(iii) Is there a stable dichotomy between the very large urban agglomerations and the large number of smaller cities in Europe, do people and firms continue to concentrate in the very large cities or do they disperse to the smaller cities?
(iv) Within urban regions, is there a continued shift of population and economic activity from the core cities to the outer zones?
(v) In what way are cities affected by demographic change?
(vi) What is the environmental situation in (large) cities?
(vii) How do cities contribute to environmental protection?
These questions will provide a guideline for the analysis of indicators from the Urban Audit domains “Demography” and “Environment”, which will be analysed in sections 3.1 and 3.6. The results of this analysis are relevant to regional and urban policy in a number of aspects. Answering questions i – iv, the analysis will outline current spatial development trends in Europe from an urban perspective. For regional policy, it is, firstly, crucial to know how cities in the core zone of the European economy perform in comparison with those from the more peripheral regions and those in Central Europe in particular. Both agglomeration and dispersion trends may imply a rationale for policy intervention. Secondly, “centripetal” spatial forces favouring very large cities in terms of city growth and economic competitiveness may imply policy action in support of smaller cities. Thirdly, if continuation of suburbanisation and urban sprawl is observed, this may imply specific policy measures to overcome problems arising in inner cities or suburban zones. Demographic change (question v) is highly relevant for cohesion policy, since it combines with fundamental political challenges, which also comprise a particular city-specific dimension, as the structure and development of city populations may differ considerably from those of regions and countries. Questions vi and vii are relevant, because inventory-taking of the environmental situation and of environmental behaviour is, of course, a prerequisite of any policy aiming at a “greener” urban environment.
1.3.2 Economic change and its impact on social cohesion Recent acceleration of world-wide economic integration of large cities is
connected both with the rapid improvement of telecommunication technology and with tertiarisation, i.e. the shift of economic activity from manufacturing to services. The “world city hypothesis” (Friedmann 1986) emphasises the global economic integration of cities. In particular, it focuses on a group of very large “global cities” which organise and control the globalised economy (Sassen 1991). Knowledge-based economic activities and cultural life agglomerate in these places, which are also ports of entry within international migration processes. Their population is highly diverse and they are also viewed as focal points of social polarisation. To some extent, the economic dynamics of such cities, dominated by specialised service activities, are detached from those of their regional hinterland. In world-wide city rankings, the European global cities include London, followed by Paris and then Amsterdam, Madrid and Milan,

29/189
considerably lower down the scale (Taylor 2005). Yet, it has become clear that all large cities within Europe are to some extent involved in an international city hierarchy. This hierarchisation process is closely interlinked with the increasing economic dominance of the service sector.
Issues arising from this discussion are:
(viii) What is the degree of economic tertiarisation in cities and is the shift of activity from manufacturing to services continuing?
(ix) Are the economic functions of very large cities disconnected from their national and regional surroundings?
(x) Are cities focal points for social polarisation and is there an increasingly paradoxical situation, in which jobs and firms concentrate in cities on the one hand, but employment rates are low among people living in cities on the other hand?
Sections 3.2 and 3.4 will investigate these questions and discuss
- if there is a rationale for urban policy either to support or even to try to prevent processes of economic globalisation and tertiarisation affecting specific cities and
- if social cohesion in cities is affected to an extent that produces a demand for enhanced policy action.
1.3.3 Emergence of a knowledge economy It is undisputed that individual and collective knowledge are key to regional
economic wealth. It is thought that in the emerging “knowledge economy” the role of knowledge as a source of economic prosperity will increase considerably. Porter (1990, 1998, 2003) determines that the intensity of inter-firm cooperation in innovative clusters has a major impact on regional economic performance. The cluster perspective enhances regional economic analysis by focusing on the spatial agglomeration of interlinked firms from different economic sectors, such as manufacturing and services. Naturally, such a cross-industry approach is a major challenge to empirical research, since data on economic activity available from administrative sources is structured by industry.
The concept of the regional milieu (Camagni (ed.) 1991, Malecki 1991) emphasises the way firms are rooted in regional networks which even go beyond cluster-type inter-firm linkages. According to the milieu concept, such networks are particularly useful for face-to-face information transfer and therefore likely to be one of the reasons why agglomeration forces outweigh dispersion forces.
In a number of publications, Florida (2002, 2005) initiated a new discussion about the impact of human capital and cultural diversity on regional economic performance. While the role of human capital is unquestioned, Florida suggests new approaches to examine its regional distribution and economic relevance. In their model of regional development, in addition to more conventional indicators, Florida et al. (2008) account for the regional importance of

30/189
- the “creative class”, comprising a wide range of highly skilled “knowledge work” occupations, and a high proportion of individuals engaged in arts, design and related occupations.
- tolerance, represented by the share of gay and lesbian households.
In their reasoning, the production of human capital, e.g. by universities, is a necessary but inadequate condition for attracting educated and skilled persons to a region or even retaining those who were educated there. In their opinion, technology, talent and tolerance must interrelate with economic performance to produce growth. Their empirical findings support this assumption.
Using patent citations in U.S. manufacturing industries as measures of knowledge spillovers Ellison et al. (2007) on the other hand, establish that although knowledge spillover comprises one of the factors explaining regional agglomeration of economic activity, customer-supplier relations and labour market pooling – i.e. the other two agglomeration forces already mentioned by Marshall (1920) – are, to some extent, more important. Using German micro-data, Möller and Tubadji (2009) verify Florida’s classification scheme for creative people but find no evidence that a desire for a tolerant regional milieu attracts creative people to cities. In spite of difficulties to measure what exactly attracts knowledge workers to cities, the discussion on the rise of the knowledge economy clearly demonstrates a need to focus on knowledge work in this analysis. The issue arising from this literature is
(xi) To what extent is the competitive position of cities dependent on attracting knowledge workers engaged in innovative economic activities and by what measures can urban policy support cities in becoming hubs of the knowledge economy?
Section 3.3 will examine this question.
1.3.4 Regional governance Much contemporary academic and policy debate about (city-)regions is
concerned with the right mix of governance institutions, a factor which is thought to have a substantial impact on the competitiveness of local and regional economies (Herrschel and Newman 2003). At the European level, there is evidently a desire for greater interest and participation of citizens in different matters of public policy (European Commission 2001). In many policy fields concerning regional and urban development, it has become clear that the most efficient allocation of public funds is not achieved by mere top-down decision-making within regional and municipal governments. Yet, due to an increasing strain on fiscal/financial capacities, cities (and other governmental layers) have to constantly “perform better with less” (OECD 2006: 156).
According to Fürst and Knieling (eds.) (2002), urban and regional governance and their coordination beyond established government institutions represent new forms of collective action. Very often, this type of governance occurs when

31/189
governments alone are no longer able to administer complex processes of socio-economic development, structural transformation and related planning activities. This new form of collective action is then predominantly implemented via networks at the level of cities and city districts, metropolitan regions or at the supranational level (e.g. Interreg). The group of non-state stakeholders can range from individual entrepreneurs and citizens, local traders’ associations, citizens’ initiatives and different types of social organisations to chambers of commerce, large trade associations, public and private cultural and educational organisations and inter-municipal organisations. However, as Lefèvre (1998) points out, the process of achieving such regional consensus provokes new kinds of political and ideological conflict.
The first State of European Cities Report provides a detailed analysis of key aspects regarding cities’ power to govern matters concerning their own development, e.g. according to spending power and control over income, and the balance between central and urban/local decision-making, using data provided by the Urban Audit (European Commission (ed.) 2007: 120-144). While the first report analysed these questions very thoroughly, many questions concerning the role of regional and municipal administrations in securing the best possible conditions for territorial development remain open. It will be a task of future research to examine if there is an interrelationship between modes of governance and different aspects of urban performance. To improve knowledge about the emergence of different modes of governance in the first place, this report will address a more preliminary question (cf. chapter 3.5):
(xii) Is there an interrelationship between the administrative and fiscal “powers” of cities and the modes of governance being implemented on different territorial levels?
1.4 Preliminary remarks on the usability of the Urban Audit according to the results of the City Panel workshop
Before carrying out the analysis according to the key issues raised in this chapter, the following section summarises central results of the City Panel workshop. This summary is given here, because the remarks about the Urban Audit reveal important implications for the subsequent analysis. Further technical remarks from the workshop are summarised in Box X2 in the appendix. With the objective to promote the Urban Audit towards cities as users and to increase the level of awareness, it was one of the tasks of the consortium preparing the report to encourage intensification of cooperation between the different levels of administrative statistics (EU, country, city) contributing to the Urban Audit. Therefore, an Urban Audit City Panel with 35 participants from 32 cities in 24 European countries was set up in November 2008. The members of the panel have different professional affiliations including city administrations, universities and national statistical offices (see list of participants and programme in the appendix). The main event of the City Panel was a two-day-workshop in March 2009 in Berlin, where city panel members discussed different issues related to

32/189
the Urban Audit, i.e. intermediate results of the analysis carried out in preparation of this report and aspects of further development of the Urban Audit itself. The following central points of the discussion are summarised to give an overview about cities´ experience with the Urban Audit and the main points of discussion during the City Panel.
1.4.1 Data collection process The data collection process and willingness to collaborate in the Urban Audit
varies to a high extent among countries and cities. This was not only stated by participants of the city panel but also became obvious during the analysis carried out in preparation of this report. Even in 2009, not all data from the 2004 collection was available via Eurostat due to delays in delivery of data by the National Statistical offices and resulting delays in plausibility checks. National response rates in 2004 vary between 99 percent of all Urban Audit indicators and only 14 percent. According to the remarks of City Panel participants, lack of data is often caused by the extraordinary expenses to collect data. Data on some of the Urban Audit indicators is apparently easy to deliver, data on some is not available but can be estimated, but for some indicators data is not available at all. In some cases, data is not available at the required regional level. According to the discussion during the City Panel workshop, this incompleteness and a lack of topical focus are the main issues, which need to be improved in the near future to strengthen the Urban Audit as a widely accepted database (cf. Chapter 5).
The data collection process including transmission of Urban Audit data from cities to Eurostat so far is conducted by National Urban Audit Coordinators (NUAC). They gather data from cities and other data suppliers for the Urban Audit and send them to Eurostat as a national package. NUACs are persons in charge for data transmission of Urban Audit data from cities to Eurostat and play a key role in the data collecting and transmission process. It was widely agreed among panel participants that it may enhance national significance of the Urban Audit collection if national responsibility would be delegated to a small team instead of just one person.
1.4.2 Local acquaintance with Urban Audit data In preparation of the workshop the 35 Urban Audit City Panel members were
asked about the acquaintance and use of Urban Audit data in their countries. According to the results of this survey, the majority of city representatives assessed the acquaintance with the Urban Audit in their cities and country as relatively low (cf. Figure X1 in the appendix). Even if these answers are, of course, subjective, they suggest that there is some scope for enhancing the relevance of the Urban Audit, particularly in cities. It is true, this small survey did not cover the academic use of the Urban Audit, which is much more generalised. Following their own assessment, the majority of workshop participants are not using Urban Audit data themselves so far (Figure X2). One reason for low usage levels in cities are up-to-dateness and low fill rates of many indicators of the

33/189
Urban Audit, which restrict the comparability with other cities. The first difficulty should be remedied thanks to the availability of an annual Urban Audit. The second one is more difficult to overcome as more resources should be committed to urban statistics in countries or regions concerned. In spite of this and other restrictions, the Urban Audit data collection in general was still assessed as useful by the majority of participants, particularly for comparisons between cities similar in size and characteristics. It was therefore concluded that the diffusion of information about the Urban Audit to data collectors, administrations and policy makers should be intensified. In many cities, policy makers have developed a growing awareness for data-based communication and city comparisons for publicity purposes. It was agreed that typologies at the European or national level may thus support strategic thinking and planning, even if every city has very unique structures with a huge amount of different characteristics. Great variation of data accuracy and response rates imposes great challenges to comparative empirical analysis, which is the task of this report. Any attempt at deriving a city typology from the 2004 Urban Audit data, therefore, needs to follow a careful assessment of its suitability for this purpose (cf. Chapter 2.1).


35/189
2. Revised city typology This chapter gives an overview of the background required for the comparative
city analysis which will be primarily based on the Urban Audit’s most recent period of observation, i.e. the 2004 data collection period. The first State of European Cities Report drew on data from up to the 2001 period; this second report depicts changes taking place at the very beginning of the 21st century. The analysis starts with an investigation into the basic structural patterns characterising groups of European cities. This analysis aims to provide a thorough basis to enable comparison of cities with similar basic structural characteristics. This classification will be used as a basis for analysing city differentiation according to selected indicators provided by the Urban Audit. The first sub-section of this chapter will consist of an assessment of the Urban Audit as an empirical base in order to verify the applicability of the statistical methods which give rise to city clusters. These will then be highlighted in the subsequent sub-sections.
Comparison will also be provided between the results of the city typologies developed in this and in the first report. There will also be an outlook on different approaches to classify cities. The strategy pursued in this report is to derive a classification of cities from a range of indicators from different topical domains. It is part of this approach, firstly, to carry out a technical assessment of the suitability of the existing data base for statistical analysis and secondly, to filter out those indicators, which are particularly relevant as measures of the issues introduced in the first chapter.
2.1 The Urban Audit as a basis of empirical analysis The Urban Audit is distinctive in that it not only comprises an extremely comprehensive collection of data about cities but also includes information on the respective larger urban zones (and additional “kernel” regions of selected large cities) and on sub-city districts (cf. Box 1). The core city will be the basic spatial unit of observation in this report, since the Urban Audit comprises the widest spectrum of indicators for core cities, response rates for individual indicators are usually higher for core cities than for the other relevant spatial unit, Larger Urban Zones (LUZ), and a considerable number of cities would simply be excluded if LUZ were chosen as the basic unit: in the update of the 2004 Urban Audit considered in this report, there is data for 356 core cities10, but only for 294 LUZ. Table 1 outlines the number of indicators available in the Urban Audit by period and spatial level.
10As explained, there are now 369 cities in the data collection. The most recent update
considered in this report is from February 2009. It comprises data for 356 cities.

36/189
Box 1 Spatial observation units in the Urban Audit
The Urban Audit provides data on five spatial levels:
- the Core City according to the administrative definition, as the basic level, - the Larger Urban Zone (LUZ) being an approximation of the functional
urban zone centred around the city, - the Kernel, which was created for nine capital cities where the concept of
the “Administrative City” does not yield comparable spatial units, and - the Sub-City District, being a subdivision of the city according to strict
criteria, and - the country as a whole.
Cities have, as local councils or governments, most of the responsibility for managing urban change. Very often, they are service providers, and develop and maintain the infrastructure; the relevant local administration is empowered to run the city. In this respect, it is clear that information is available at an administrative (i.e. core city) level.
More than this, urban areas also have an impact on surrounding areas in terms of commuting, job concentration, traffic systems etc. In this way, there is also a need for clearly defined functional urban regions and demand for information on these larger urban entities, including the hinterland. The definition of the Larger Urban Zone, which corresponds to an estimate of the Functional Urban Region (FUR), is a complex issue. The definition of FURs varies according to the national and local context, although the FUR is very often identified as being an employment zone or a commuting area. There are variables for which the core city is relevant (for example municipal expenditure and provision of services for the inhabitants of the city) and others for which only the LUZ makes sense (for example GDP).
Statistics at a sub-city level are more a matter for the cities themselves. The bigger the city, the more relevant such statistics, as there are likely to be significant intra-city disparities. This is also the level with which the public will identify, as it corresponds to neighbourhoods with their own individual characteristics.
Applying the concept of the “Administrative City” does not always yield comparable spatial units. “Greater London” for example (as classified at the NUTS level 1 region UKI) has a population of 7.2 Mio inhabitants, whereas “Paris” (as classified at the NUTS level 3 region FR101) has a population of 2.1 Mio inhabitants. To facilitate better comparison between the largest cities in Europe, an additional spatial unit, the “Kernel” has been developed for some capital cities.
To highlight the particular characteristics of cities and urban regions, the Urban Audit also allows for a comparison with national averages.
Source: European Commission (2007a): 204-206

37/189
Table 1 Urban Audit (2004) – number of indicators by year and spatial level
Period Indicators per Spatial Level
City LUZ* Kernel Country SCD1* SCD2*
1991 269 151 45 218 27 25 1996 289 148 60 232 24 22 2001 343 185 166 288 40 40 2004 354 189 168 274 32 36
*LUZ = Larger Urban Zone, Kernel = an additional regional level among the largest European cities, SCD1 = Sub-city district level 1, SCD2 = Sub-city district level 2.
The content of the Urban Audit data base adapts in line with users’ changing needs and interests. This implies that the audit will not report on some indicators in future and will incorporate new information in their place. In general, the Urban Audit comprises nine domains (Table 2) and 24 sub-domains (Table X4 in the appendix). Compared to the previous Urban Audit, the number of indicators increased by 19% to a total of 354 indicators in 2004. About half of the indicators from the last survey (55%) remained, while 160 new indicators were added11.
As Table X3 in the appendix illustrates, the UA 2004 was not only restructured with regard to content; its administration also succeeded in expanding the audit’s scope to include many new cities from within and outside the EU 27. The new additions were on average considerably smaller (200,000 inhabitants) than those cities that had already participated in the UA 2001.
A cluster analysis of delivering behaviour was conducted to identify structures across cities with regard to response rates which could lead to a distortion of analytical results (cf. tables X4 and X5 in the appendix). All things considered, the pattern of variables from different domains delivered by certain countries, or at best by small groups of countries, makes cross-country, Europe-wide comparisons impossible in the case of many of the Urban Audit variables. In other words, as soon as an analysis comprises a large range of domains and variables, the number of countries delivering all this information decreases significantly. A Europe-wide comparison is only possible in the case of selected indicators. The revised city typology will therefore be based on a set of indicators which represent the key issues as stated in Chapter 1.3 and are characterised by high response rates. An additional indicator, patent intensity (see below), was calculated for all Urban Audit cities on the basis of data from the European Patent Office (EPO).
As a whole, response rates in the Urban Audit 2004 are lower than in the Urban Audit 2001, on which the first report was based. Since in many European countries, 2001 was a census year, data availability for 2001 was relatively high. While most variables record many missing values even in the 2001 data, in
11While a “living“ data collection needs to develop its indicator set, consistency of
indicators is needed to analyse changes over time.

38/189
2004, cities in some countries only provided data for less than half of the Urban Audit variables (Bulgaria, Czech Republic, France, cf. Tables X4 and X5 in the appendix).
Table 2 Change in the number of indicators by domain from UA 2001 to UA 2004
Chapter Number of indicators
change in % UA 2001 UA 2004
1 Demography 31 57 83.9 2 Social Aspects 40 50 25.0 3 Economic Aspects 67 77 14.9 4 Civic Involvement 22 19 -13.6 5 Training and Education 21 21 0.0 6 Environment 61 44 -27.9 7 Travel and Transport 25 39 56.0 8 Information Society 15 17 13.3 9 Culture and Recreation 19 30 57.9 Total 301 354 17.6 Own calculation based on the Urban Audit.
2.2 City types This report groups cities into “city types” with the aim of providing a solid
foundation to compare cities with similar basic structural characteristics. This classification will be used as a basis for analysing city differentiation according to selected indicators provided by the Urban Audit. In order to exploit the multitude of information inherent in the Urban Audit data base to the greatest possible extent, the statistical classification is performed using a step-wise strategy of “information compaction”. Based on a wide range of indicators, it subdivides the Urban Audit cities into a small number of relatively homogeneous groups which differ considerably from each other. Of course, each characterisation depends on the choice of indicators. Here, the selection of indicators is based on the issues raised in Chapter 1.3. The methodical approach applied in this analysis high-lights the role of the interplay of different characteristics to define the position of an individual city or urban area within the European territory. To allow for the complexity of urban patterns, a two-step classification was applied, in which each city belongs to a specific city type, but is also a “hybrid” member of a more basic type12.
12Among the total spectrum of Urban Audit indicators, those focusing on individual city
characteristics rather than on inter-city relations prevail. It is better suited to analyse the main characteristics of different groups of cities than to probe into the “borderline areas” between different groups. Therefore, it was decided here to apply a typology of mutually exclusive groups instead of an approach allowing “hybrid” group membership. Some cities, therefore, may occur as “borderline cases”, which will not comply to the average values of their group in every variable.

39/189
Various explorative approaches to statistical classification incorporating all Urban Audit cities highlighted the need to observe one “big city group” separately from the larger number of smaller cities. Using information on a wide array of cities of very different sizes and economic positions in statistical cluster analysis may generate a result which “overlooks” some of the subtle differences between cities of similar sizes and with similar structural characteristics. In a preliminary step, therefore, a group of 52 comparable cities was formed, incorporating the largest cities, those with the highest concentration of economic activity in relation to national averages and capital cities13. Furthermore, various analyses incorporating all cities taking part in the 2004 period of the Urban Audit revealed that Turkish cities differ from all other cities in their specific combination of characteristics. The report therefore provides a comparative analysis of selected key characteristics of Turkish cities. Also, Cayenne (French Guyana) differs from the other Urban Audit cities to such an extent that it had to be excluded from the analysis. The methodical approach to defining comparable groups among the remaining 277 cities is outlined in detail in Box X1 in the appendix. Except for those cities deliberately excluded from the analysis (Cayenne and all 26 Turkish cities), all other cities taking part in the UA 2004 were classified. In a first step, three city types of the remaining 277 cities were defined by a statistical classification (regional factor and cluster analysis) based on a set of 21 indicators from the Urban Audit14. In a second step all four types were further subdivided by this method in order to provide a more specific classification, arriving at a total of nine sub-types. In this report the four basic city types provide the general background for city comparison. Selected indicators will be examined according to their variation across the sub-types15.
Map 1 shows the distribution of the four basic city types across Europe. Table X1 in the appendix provides a complete list of cities belonging to each of the sub-types. Table X2 in the appendix shows selected key characteristics of all cities. Table 3 specifies the number of cities in each basic city type by country. Tables 4-7 provide a comparison of selected key characteristics of the four basic city types in the case of core cities and Larger Urban Zones.
13The “Principal Metropolises” group comprises capital cities and cities that fall within the
top 25% in terms of total population (over 380,000 inhabitants) and regional GDP per head in relation to the national average. UA 2004 data on GDP per head in PPS was available for cities from the following countries: CY, DE (except for Göttingen and Saarbrücken), EE, FI, MT, PT (except for Lisboa), SE (only for Linköping, Orebrö and Uppsala), SK. NUTS 2 data was used for cities from TR, NUTS 3 level data for all other cities. Data on national GDP per head in PPS was extracted from the Eurostat data base at the NUTS 0/1 level. Urban Audit cities were assigned to NUTS 3 regions in the appendix of the first State of European Cities Report (European Commission (ed.) 2007, A3).
14Missing values were replaced by data from other sources or by own estimations (cf. Box X1 in the appendix).
15Given the sample size of 329 cities, on which the typology is based, further subdivision of the four basic city types results in relatively small groups of cities, which may not represent the corresponding category among all European cities in every respect.

40/189
Map 1 City types
Own calculation based on the Urban Audit (2004).

41/189
Table 3 Numbers of Urban Audit cities in city types, by countrya
Country
Type A Principal
Metropolises
Type B Regional Centres
Type C Smaller Centres
Type D Cities in Lagging
Regions
Total
AT 1 4 0 0 5 BE 2 4 1 0 7 BG 1 0 0 6 7 CH 1 3 0 0 4 CY 1 0 0 0 1 CZ 1 1 0 12 14 DE 11 27 2 0 40 DK 1 1 2 0 4 EE 1 0 0 1 2 ES 2 17 6 0 25 FI 1 2 1 0 4 FR 2 28 4 0 34 GR 1 3 3 2 9 HU 1 0 1 7 9 IE 1 3 0 0 4 IT 2 18 5 7 32 LT 1 0 0 2 3 LU 1 0 0 0 1 LV 1 0 0 1 2 MT 1 0 0 1 2 NL 1 12 2 0 15 NO 1 1 4 0 6 PL 6 0 0 22 28 PT 1 2 6 0 9 RO 1 0 0 13 14 SE 1 2 5 0 8 SI 1 0 0 1 2 SK 1 0 0 7 8 UK 5 23 2 0 30 Total 52 151 44 82 329
Own calculation based on the Urban Audit (2004). – a. The Urban Audit now contains data on an additional fifth Irish city, Waterford. For selected indicators, information on Waterford is displayed in the report. Since the latest update considered in this report (February 2009), further cities from Bulgaria (Stara Zagora), Croatia (Osijek, Rijeka, Slavonski Brod, Split, Zagreb) and Switzerland (Basel, Biel/Bienne, Lugano, Luzern, St. Gallen, Winterthur) have been added to the Urban Audit. Data from these cities were not analysed in the report.

42/189
Table 8 compares the distribution of the overall population between types in core cities and Larger Urban Zones. Table 9 compares the key characteristics of Turkish cities, which have not been included in the classification of cities. Table 10 allocates cities from the four basic types according to the typology of the first State of European Cities Report.
To improve usability, types resulting from a statistical classification procedure are commonly provided with labels, which summarise the main characteristics. It must be kept in mind that any labelling is combined with a considerable degree of simplification and, of course, liable to subjectivity. In “borderline cases”, which will not comply to the average values of their group in every variable, labels may even be misleading. With great precaution, the city types were given the following labels:
A Principal Metropolises,
B Regional Centres,
C Smaller Centres,
D Towns and Cities of the Lagging Regions.
City type A comprises 52 very large and capital cities from all parts of Europe, with an average of over 1,000,000 inhabitants, described as “Principal Metropolises”. These international and national centres differ from other cities not just in size and economic agglomeration. They account for the largest number of patent applications per population and the largest share of new businesses, i.e. the most dynamic innovation and entrepreneurial activity. Tertiarisation, i.e. a high share of employees in the service sector, is a characteristic of most cities, yet it is most prevalent in the Principal Metropolises, which are centres of specialised service industries aimed at national or international markets. They are also ports of entry for international migrants16.
Type B (Regional Centres) comprises 151 cities from all parts of Western Europe. With an average population of around 290,000 they are considerably smaller than the Principal Metropolises. Overall economic output (GDP) per inhabitant, patent intensity and entrepreneurial activity are lower than in the highest-ranking urban centres, yet still above national averages17.
16Basic type A subdivides into type A1 (Leading European Capitals and Metropolises),
comprising 24 metropolises, which represent the highest urban concentration of economic prosperity, as measured by GDP per head, and type A2 (National Capitals and Metropolises), comprising 28 cities, which are large economic centres of national importance and/or capital cities.
17The group of Regional Centres subdivides into three types representing different functions of cities in a regional context within Northern, Southern and Western Europe. Type B1 (Regional Service Centres) comprises 76 cities providing highly specialised services, particularly from the financial and business service sector, public administration, health and education. These cities are also research centres for hi-tech industries and hubs of IT services. Type B2 (Regional Innovation Centres) is a group of 51 cities, mainly from Germany and Italy, which are characterised by a particularly dynamic entrepreneurial

43/189
Type C (Smaller Centres) comprises 44 cities, mainly from Western Europe and mostly outside its economic core zone. These cities are considerably smaller and less densely populated than those of the other city types. They are, in particular, significantly less accessible than cities from Types A and B. The urban economy in these cities is less vibrant in terms of overall output (GDP per head), innovation (patents), tertiarisation and entrepreneurial activity.
However, on average, the share of highly qualified working-age residents in core cities is relatively high. Cities from Type C are distinctive in that they have recently experienced greater population growth than cities in all the other groups. Between 2001 and 2004 their populations grew by 3% (average of all cities: 1%). Furthermore, growth in these cities is based on both in-migration and birth surplus. Due to their more peripheral location (mainly) in Northern, Western and Southern Europe, these cities are a target of regional rather than international mobility18.
Type D (Towns and Cities of the Lagging Regions) consists of 82 smaller cities from Central and Southern Europe, which differ from other cities in that they have higher unemployment, lower GDP per head and a regional economic specialisation, in which manufacturing plays a far more important role. In contrast to the other cities, the population of these cities and their Larger Urban Zones is falling19.
Even though a wider spectrum of indicators from the Urban Audit domains Demography, Economic Aspects, Training and Education, and Environment was applied, the resulting typology quite clearly groups cities according to economic prosperity and size (Figure 1).
and research activity. It is also a feature of these innovative hubs that their resident population represents a relatively advanced demographic ageing process. Type B3 (Regional Centres with Growing Population) is represented by 24 cities from Western (Austria, Germany, the Netherlands) and Southern Europe (Greece and Spain). Among the Regional Centres, this is the most dynamic group in terms of city growth, particularly due to in-migration, but also because of birth surpluses. Younger working-age residents account for a larger share of the total population than in the other Regional Centres. It is a characteristic of the economy of these cities that there is an above-average share of employees working in firms providing ICT services. Also, employment in public services, health and education combined accounts for a relatively high share (33% compared to 28% in all cities) of the total labour force. Most of these cities are important tourist destinations.
18Type C subdivides into type C1 (Smaller Administrative Centres), 36 cities, where service functions from local public administration, health and education agglomerate, and type C2 (Smaller Centres with Growing Population), a small group of 8 cities with a relatively “young” population, which are currently experiencing rapid growth in population.
19Type D subdivides into a larger group of 67 cities (Type D1, Cities in the Process of Structural Adaption) with relatively higher prosperity and, in particular, a high share of students among the resident population, and 15 cities (Type D2, Less developed towns and cities), which are characterised by particularly low economic prosperity, innovation and creativity, as measurable by the available urban indicators. Bleak conditions here are somewhat ameliorated by comparatively low unemployment and birth surpluses.
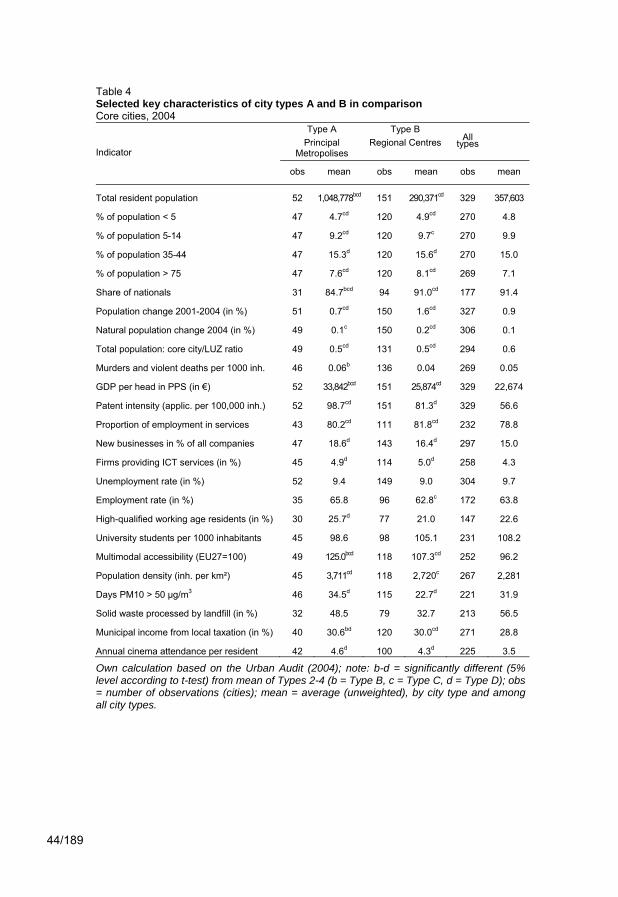
44/189
Table 4 Selected key characteristics of city types A and B in comparison Core cities, 2004
Indicator
Type A Type B All
types Principal Metropolises
Regional Centres
obs mean obs mean obs mean
Total resident population 52 1,048,778bcd 151 290,371cd 329 357,603
% of population < 5 47 4.7cd 120 4.9cd 270 4.8
% of population 5-14 47 9.2cd 120 9.7c 270 9.9
% of population 35-44 47 15.3d 120 15.6d 270 15.0
% of population > 75 47 7.6cd 120 8.1cd 269 7.1
Share of nationals 31 84.7bcd 94 91.0cd 177 91.4
Population change 2001-2004 (in %) 51 0.7cd 150 1.6cd 327 0.9
Natural population change 2004 (in %) 49 0.1c 150 0.2cd 306 0.1
Total population: core city/LUZ ratio 49 0.5cd 131 0.5cd 294 0.6
Murders and violent deaths per 1000 inh. 46 0.06b 136 0.04 269 0.05
GDP per head in PPS (in €) 52 33,842bcd 151 25,874cd 329 22,674
Patent intensity (applic. per 100,000 inh.) 52 98.7cd 151 81.3d 329 56.6
Proportion of employment in services 43 80.2cd 111 81.8cd 232 78.8
New businesses in % of all companies 47 18.6d 143 16.4d 297 15.0
Firms providing ICT services (in %) 45 4.9d 114 5.0d 258 4.3
Unemployment rate (in %) 52 9.4 149 9.0 304 9.7
Employment rate (in %) 35 65.8 96 62.8c 172 63.8
High-qualified working age residents (in %) 30 25.7d 77 21.0 147 22.6
University students per 1000 inhabitants 45 98.6 98 105.1 231 108.2
Multimodal accessibility (EU27=100) 49 125.0bcd 118 107.3cd 252 96.2
Population density (inh. per km²) 45 3,711cd 118 2,720c 267 2,281
Days PM10 > 50 µg/m3 46 34.5d 115 22.7d 221 31.9
Solid waste processed by landfill (in %) 32 48.5 79 32.7 213 56.5
Municipal income from local taxation (in %) 40 30.6bd 120 30.0cd 271 28.8
Annual cinema attendance per resident 42 4.6d 100 4.3d 225 3.5
Own calculation based on the Urban Audit (2004); note: b-d = significantly different (5% level according to t-test) from mean of Types 2-4 (b = Type B, c = Type C, d = Type D); obs = number of observations (cities); mean = average (unweighted), by city type and among all city types.
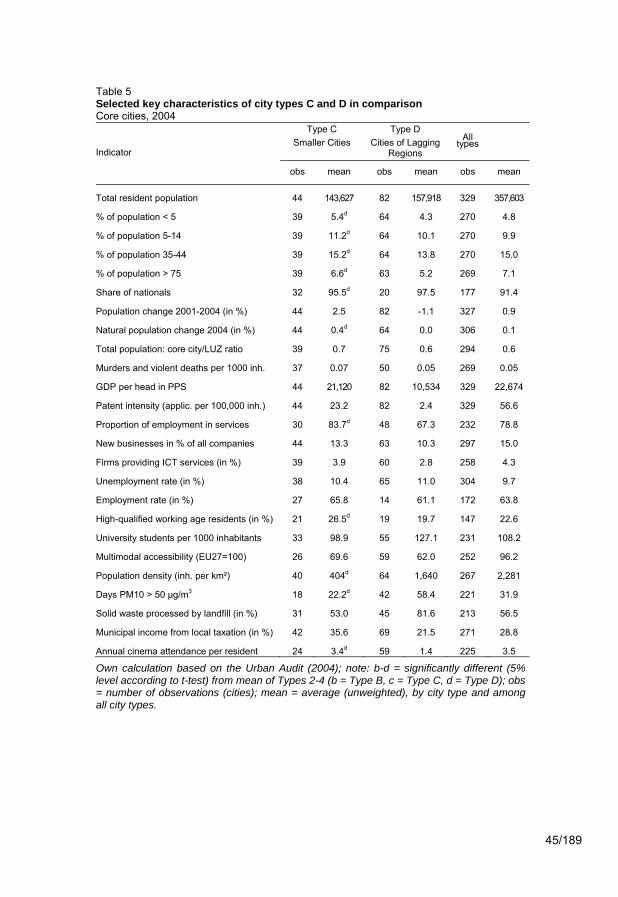
45/189
Table 5 Selected key characteristics of city types C and D in comparison Core cities, 2004
Indicator
Type C Type D All
types Smaller Cities Cities of Lagging Regions
obs mean obs mean obs mean
Total resident population 44 143,627 82 157,918 329 357,603
% of population < 5 39 5.4d 64 4.3 270 4.8
% of population 5-14 39 11.2d 64 10.1 270 9.9
% of population 35-44 39 15.2d 64 13.8 270 15.0
% of population > 75 39 6.6d 63 5.2 269 7.1
Share of nationals 32 95.5d 20 97.5 177 91.4
Population change 2001-2004 (in %) 44 2.5 82 -1.1 327 0.9
Natural population change 2004 (in %) 44 0.4d 64 0.0 306 0.1
Total population: core city/LUZ ratio 39 0.7 75 0.6 294 0.6
Murders and violent deaths per 1000 inh. 37 0.07 50 0.05 269 0.05
GDP per head in PPS 44 21,120 82 10,534 329 22,674
Patent intensity (applic. per 100,000 inh.) 44 23.2 82 2.4 329 56.6
Proportion of employment in services 30 83.7d 48 67.3 232 78.8
New businesses in % of all companies 44 13.3 63 10.3 297 15.0
Firms providing ICT services (in %) 39 3.9 60 2.8 258 4.3
Unemployment rate (in %) 38 10.4 65 11.0 304 9.7
Employment rate (in %) 27 65.8 14 61.1 172 63.8
High-qualified working age residents (in %) 21 26.5d 19 19.7 147 22.6
University students per 1000 inhabitants 33 98.9 55 127.1 231 108.2
Multimodal accessibility (EU27=100) 26 69.6 59 62.0 252 96.2
Population density (inh. per km²) 40 404d 64 1,640 267 2,281
Days PM10 > 50 µg/m3 18 22.2d 42 58.4 221 31.9
Solid waste processed by landfill (in %) 31 53.0 45 81.6 213 56.5
Municipal income from local taxation (in %) 42 35.6 69 21.5 271 28.8
Annual cinema attendance per resident 24 3.4d 59 1.4 225 3.5
Own calculation based on the Urban Audit (2004); note: b-d = significantly different (5% level according to t-test) from mean of Types 2-4 (b = Type B, c = Type C, d = Type D); obs = number of observations (cities); mean = average (unweighted), by city type and among all city types.
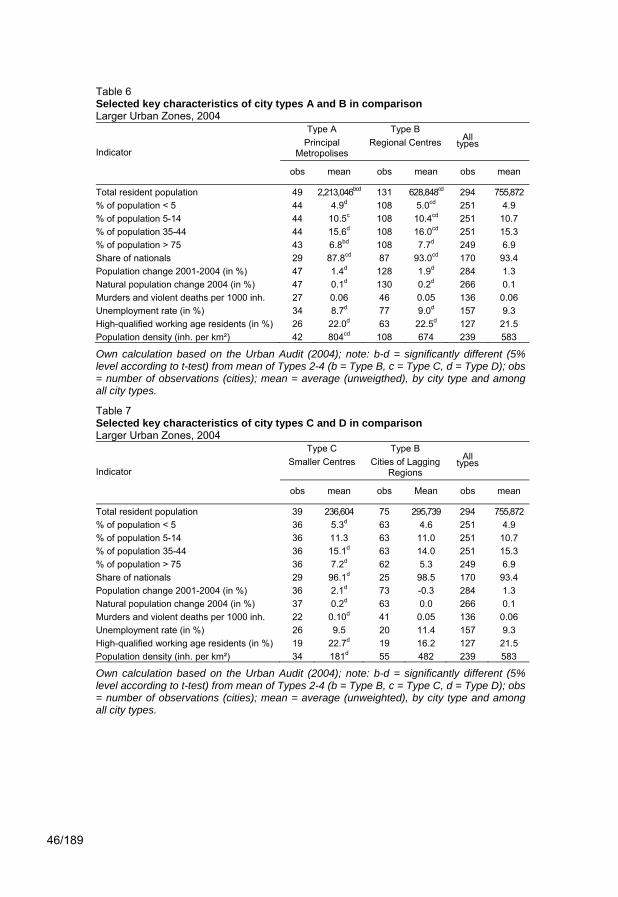
46/189
Table 6 Selected key characteristics of city types A and B in comparison Larger Urban Zones, 2004
Indicator
Type A Type B All
types Principal Metropolises
Regional Centres
obs mean obs mean obs mean
Total resident population 49 2,213,046bcd 131 628,848cd 294 755,872 % of population < 5 44 4.9d 108 5.0cd 251 4.9 % of population 5-14 44 10.5c 108 10.4cd 251 10.7 % of population 35-44 44 15.6d 108 16.0cd 251 15.3 % of population > 75 43 6.8bd 108 7.7d 249 6.9 Share of nationals 29 87.8cd 87 93.0cd 170 93.4 Population change 2001-2004 (in %) 47 1.4d 128 1.9d 284 1.3 Natural population change 2004 (in %) 47 0.1d 130 0.2d 266 0.1 Murders and violent deaths per 1000 inh. 27 0.06 46 0.05 136 0.06 Unemployment rate (in %) 34 8.7d 77 9.0d 157 9.3 High-qualified working age residents (in %) 26 22.0d 63 22.5d 127 21.5 Population density (inh. per km²) 42 804cd 108 674 239 583
Own calculation based on the Urban Audit (2004); note: b-d = significantly different (5% level according to t-test) from mean of Types 2-4 (b = Type B, c = Type C, d = Type D); obs = number of observations (cities); mean = average (unweigthed), by city type and among all city types.
Table 7 Selected key characteristics of city types C and D in comparison Larger Urban Zones, 2004
Indicator
Type C Type B All
types Smaller Centres Cities of Lagging Regions
obs mean obs Mean obs mean
Total resident population 39 236,604 75 295,739 294 755,872 % of population < 5 36 5.3d 63 4.6 251 4.9 % of population 5-14 36 11.3 63 11.0 251 10.7 % of population 35-44 36 15.1d 63 14.0 251 15.3 % of population > 75 36 7.2d 62 5.3 249 6.9 Share of nationals 29 96.1d 25 98.5 170 93.4 Population change 2001-2004 (in %) 36 2.1d 73 -0.3 284 1.3 Natural population change 2004 (in %) 37 0.2d 63 0.0 266 0.1 Murders and violent deaths per 1000 inh. 22 0.10d 41 0.05 136 0.06 Unemployment rate (in %) 26 9.5 20 11.4 157 9.3 High-qualified working age residents (in %) 19 22.7d 19 16.2 127 21.5 Population density (inh. per km²) 34 181d 55 482 239 583
Own calculation based on the Urban Audit (2004); note: b-d = significantly different (5% level according to t-test) from mean of Types 2-4 (b = Type B, c = Type C, d = Type D); obs = number of observations (cities); mean = average (unweighted), by city type and among all city types.
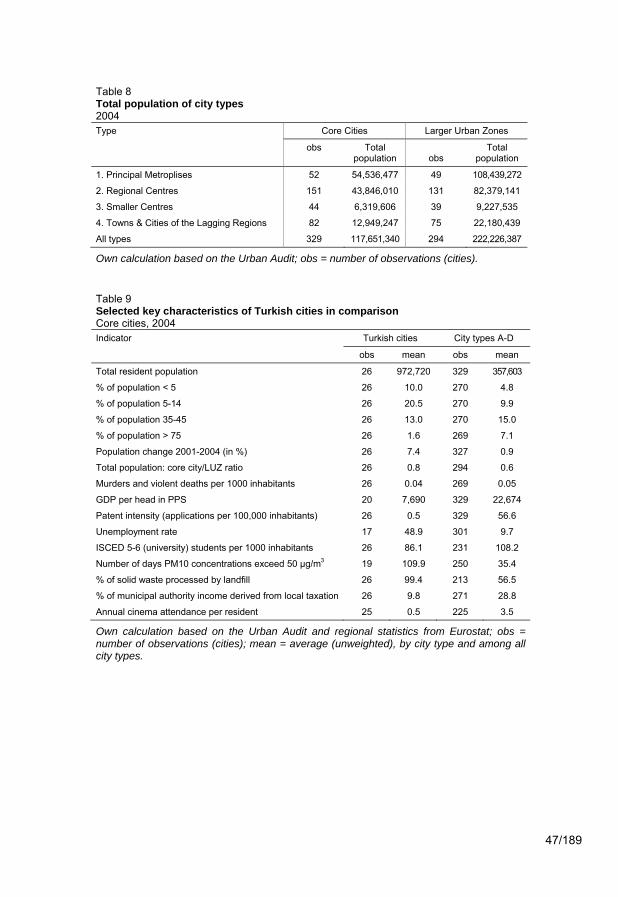
47/189
Table 8 Total population of city types 2004 Type Core Cities Larger Urban Zones
obs Total population obs
Total population
1. Principal Metroplises 52 54,536,477 49 108,439,272
2. Regional Centres 151 43,846,010 131 82,379,141
3. Smaller Centres 44 6,319,606 39 9,227,535
4. Towns & Cities of the Lagging Regions 82 12,949,247 75 22,180,439
All types 329 117,651,340 294 222,226,387
Own calculation based on the Urban Audit; obs = number of observations (cities).
Table 9 Selected key characteristics of Turkish cities in comparison Core cities, 2004 Indicator Turkish cities City types A-D
obs mean obs mean
Total resident population 26 972,720 329 357,603
% of population < 5 26 10.0 270 4.8
% of population 5-14 26 20.5 270 9.9
% of population 35-45 26 13.0 270 15.0
% of population > 75 26 1.6 269 7.1
Population change 2001-2004 (in %) 26 7.4 327 0.9
Total population: core city/LUZ ratio 26 0.8 294 0.6
Murders and violent deaths per 1000 inhabitants 26 0.04 269 0.05
GDP per head in PPS 20 7,690 329 22,674
Patent intensity (applications per 100,000 inhabitants) 26 0.5 329 56.6
Unemployment rate 17 48.9 301 9.7
ISCED 5-6 (university) students per 1000 inhabitants 26 86.1 231 108.2
Number of days PM10 concentrations exceed 50 µg/m3 19 109.9 250 35.4
% of solid waste processed by landfill 26 99.4 213 56.5
% of municipal authority income derived from local taxation 26 9.8 271 28.8
Annual cinema attendance per resident 25 0.5 225 3.5
Own calculation based on the Urban Audit and regional statistics from Eurostat; obs = number of observations (cities); mean = average (unweighted), by city type and among all city types.
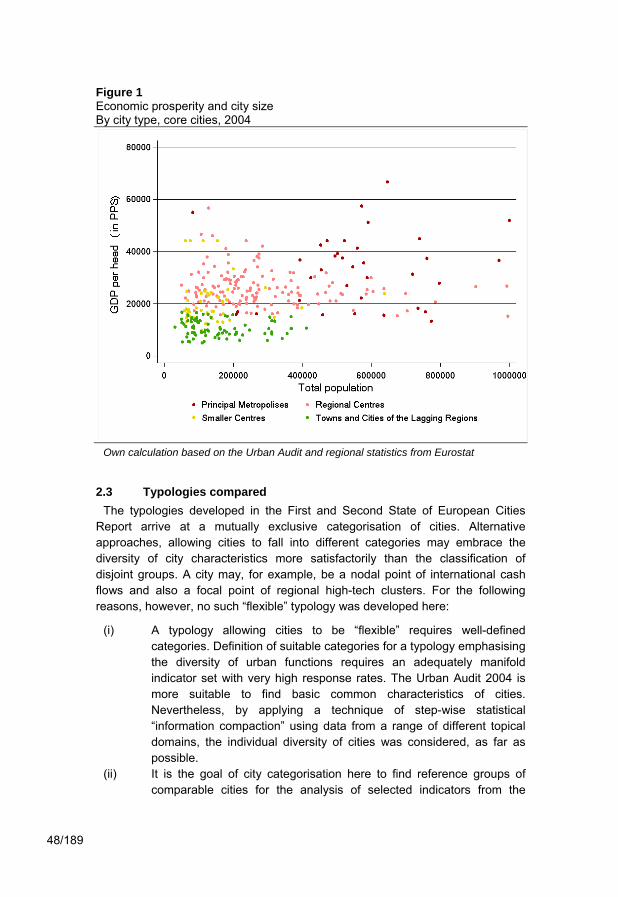
48/189
Figure 1 Economic prosperity and city size By city type, core cities, 2004
Own calculation based on the Urban Audit and regional statistics from Eurostat
2.3 Typologies compared The typologies developed in the First and Second State of European Cities
Report arrive at a mutually exclusive categorisation of cities. Alternative approaches, allowing cities to fall into different categories may embrace the diversity of city characteristics more satisfactorily than the classification of disjoint groups. A city may, for example, be a nodal point of international cash flows and also a focal point of regional high-tech clusters. For the following reasons, however, no such “flexible” typology was developed here:
(i) A typology allowing cities to be “flexible” requires well-defined categories. Definition of suitable categories for a typology emphasising the diversity of urban functions requires an adequately manifold indicator set with very high response rates. The Urban Audit 2004 is more suitable to find basic common characteristics of cities. Nevertheless, by applying a technique of step-wise statistical “information compaction” using data from a range of different topical domains, the individual diversity of cities was considered, as far as possible.
(ii) It is the goal of city categorisation here to find reference groups of comparable cities for the analysis of selected indicators from the

49/189
different domains of the Urban Audit. It is more practicable to define disjoint groups here, because differences between them can be explained more clearly than between groups with common elements.
(iii) The city types defined here are to a considerable extent “flexible” in themselves, since they are defined as broad categories. This typology avoids to pretend that precise “pigeonholes” have been found, to which cities could be allocated.
(iv) It is a considerable advantage of the classification approach applied in this report to avoid setting of arbitrary thresholds, which is a deficit of any typology based on rankings of individual indicators or indices. In the statistical cluster analytic method, which is the main component of the typology developed in this report, group membership is defined according to the combination of city characteristics taken as a basis of the analysis. Compared to other approaches, this method therefore objectifies allocation of cities to “types” to a larger extent.
Comparison of cities according to the typology approach applied here, however, will comprise only one part of the analysis in this report. In the following, we also compare cities within countries and parts of Europe (Central, North, South, West, cf. Map 2). Whenever applicable, further categorisations will be considered.
Ordering the four basic types according to the typology from the first State of European Cities Report20 is most straightforward in the case of the International Hubs, which all belong to basic type A (Table 10 and Figure 2). The majority of the cities classified as Specialised Poles and Regional Centres according to the typology from the first report belong to type B, Regional Centres. Cities from types C (Smaller Centres) and D (Towns and Cities of the Lagging Regions) are both mainly Regional Centres according to the typology from the first report. Comparison between the sub-types of the revised typology and the types from the first report reveals that statistical analysis based on the 2004 period Urban Audit data by and large corroborates the key features of the first typology, which was based on data from the 2001 period (Table 11 and Figure 2).
Comparing the average size and economic prosperity of city types, a group of large and capital cities separates from the other cities quite clearly in both typologies (types 1-3 from first report and types A1 and A2 from this report, Figure 2). Both typologies classify a large group of cities as Regional Centres (types 4-8 from the first and types B1 – B3 from the second report). The smaller cities grouped as types C1 and C2 in this report on average resemble those from types 9, 11, 12 and 13 from the first report. The Towns and Cities of the Lagging Regions (types D1 and D2) resemble the groups described as “De-Industrialised Cities” (type 10) and “Regional Market Centres (type 11) in the first report.
20New cities from the 2004 period were allocated to the types from the first report by k-
means clustering based on regional GDP per capita and total population.
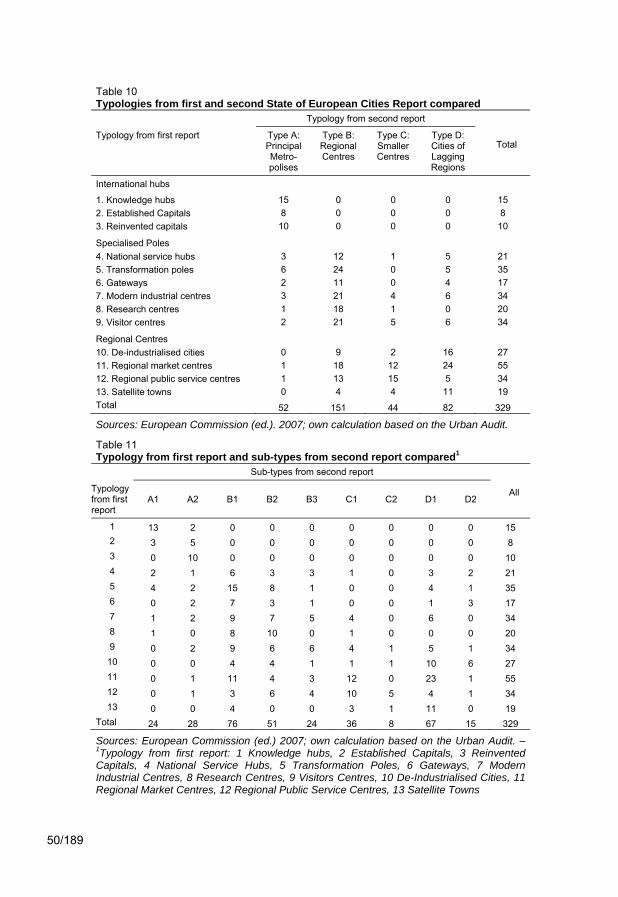
50/189
Table 10 Typologies from first and second State of European Cities Report compared Typology from second report
Total Typology from first report Type A:
Principal Metro-polises
Type B: Regional Centres
Type C: Smaller Centres
Type D: Cities of Lagging Regions
International hubs
1. Knowledge hubs 15 0 0 0 15 2. Established Capitals 8 0 0 0 8 3. Reinvented capitals 10 0 0 0 10
Specialised Poles 4. National service hubs 3 12 1 5 21 5. Transformation poles 6 24 0 5 35 6. Gateways 2 11 0 4 17 7. Modern industrial centres 3 21 4 6 34 8. Research centres 1 18 1 0 20 9. Visitor centres 2 21 5 6 34
Regional Centres 10. De-industrialised cities 0 9 2 16 27 11. Regional market centres 1 18 12 24 55 12. Regional public service centres 1 13 15 5 34 13. Satellite towns 0 4 4 11 19 Total 52 151 44 82 329
Sources: European Commission (ed.). 2007; own calculation based on the Urban Audit.
Table 11 Typology from first report and sub-types from second report compared1 Sub-types from second report
All Typology from first report
A1 A2 B1 B2 B3 C1 C2 D1 D2
1 13 2 0 0 0 0 0 0 0 15 2 3 5 0 0 0 0 0 0 0 8 3 0 10 0 0 0 0 0 0 0 10 4 2 1 6 3 3 1 0 3 2 21 5 4 2 15 8 1 0 0 4 1 35 6 0 2 7 3 1 0 0 1 3 17 7 1 2 9 7 5 4 0 6 0 34 8 1 0 8 10 0 1 0 0 0 20 9 0 2 9 6 6 4 1 5 1 34 10 0 0 4 4 1 1 1 10 6 27 11 0 1 11 4 3 12 0 23 1 55 12 0 1 3 6 4 10 5 4 1 34 13 0 0 4 0 0 3 1 11 0 19
Total 24 28 76 51 24 36 8 67 15 329
Sources: European Commission (ed.) 2007; own calculation based on the Urban Audit. – 1Typology from first report: 1 Knowledge hubs, 2 Established Capitals, 3 Reinvented Capitals, 4 National Service Hubs, 5 Transformation Poles, 6 Gateways, 7 Modern Industrial Centres, 8 Research Centres, 9 Visitors Centres, 10 De-Industrialised Cities, 11 Regional Market Centres, 12 Regional Public Service Centres, 13 Satellite Towns
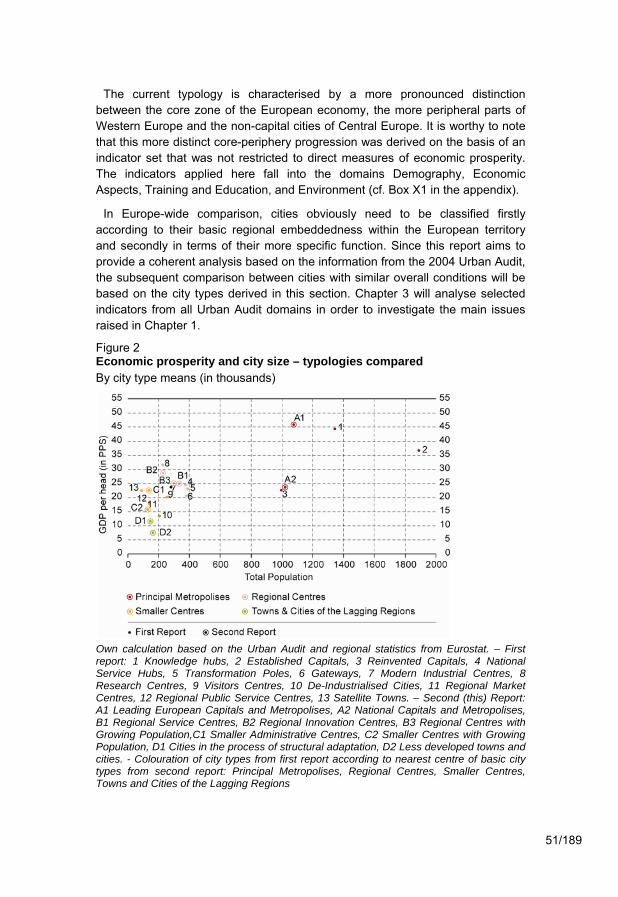
51/189
The current typology is characterised by a more pronounced distinction between the core zone of the European economy, the more peripheral parts of Western Europe and the non-capital cities of Central Europe. It is worthy to note that this more distinct core-periphery progression was derived on the basis of an indicator set that was not restricted to direct measures of economic prosperity. The indicators applied here fall into the domains Demography, Economic Aspects, Training and Education, and Environment (cf. Box X1 in the appendix).
In Europe-wide comparison, cities obviously need to be classified firstly according to their basic regional embeddedness within the European territory and secondly in terms of their more specific function. Since this report aims to provide a coherent analysis based on the information from the 2004 Urban Audit, the subsequent comparison between cities with similar overall conditions will be based on the city types derived in this section. Chapter 3 will analyse selected indicators from all Urban Audit domains in order to investigate the main issues raised in Chapter 1.
Figure 2 Economic prosperity and city size – typologies compared By city type means (in thousands)
Own calculation based on the Urban Audit and regional statistics from Eurostat. – First report: 1 Knowledge hubs, 2 Established Capitals, 3 Reinvented Capitals, 4 National Service Hubs, 5 Transformation Poles, 6 Gateways, 7 Modern Industrial Centres, 8 Research Centres, 9 Visitors Centres, 10 De-Industrialised Cities, 11 Regional Market Centres, 12 Regional Public Service Centres, 13 Satellite Towns. – Second (this) Report: A1 Leading European Capitals and Metropolises, A2 National Capitals and Metropolises, B1 Regional Service Centres, B2 Regional Innovation Centres, B3 Regional Centres with Growing Population,C1 Smaller Administrative Centres, C2 Smaller Centres with Growing Population, D1 Cities in the process of structural adaptation, D2 Less developed towns and cities. - Colouration of city types from first report according to nearest centre of basic city types from second report: Principal Metropolises, Regional Centres, Smaller Centres, Towns and Cities of the Lagging Regions

52/189
Map 2 European Macro-Regions for City Comparison
Own illustration

53/189
3. Key trends of urban dynamics in Europe The third chapter examines the current “state of European cities” and recent
urban dynamics on the basis of the 2004 period and previous “waves” of the Urban Audit. The empirical base of this analysis was complemented by regional information from Eurostat and other sources.
This chapter will detail city characteristics using a wide range of indicators from all nine topical domains of the Urban Audit (cf. Table 2, Chapter 2). Comparisons will be made between city values and national averages and between cities with similar basic conditions. The “state of cities” will therefore be examined both by country and according to the city types derived in Chapter 2. As explained, the core city will be the basic spatial unit of observation. The following analysis will comprise six sections:
(i) population,
(ii) economy,
(iii) knowledge,
(iv) social cohesion,
(v) governance,
(vi) environment and transport.
Each section starts with a short introduction which highlights the motivation for the analysis. It presents selected indicators analysed by country and, in many cases, also by city type or other categorisations. A cross-domain analysis will investigate the determinants of the two main urbanisation processes: concentration of population and economic wealth.
3.1 Population The distribution of people and the dynamics of this distribution is the basic
measure of urbanisation. The Urban Audit domain “Demography” will form the primary basis for observation here
This section looks at some of the issues raised in Chapter 1. For very general questions, which can only be answered on the basis of an investigation into a wider range of urban characteristics, Chapter 3.1.3 features an excursus presenting an additional cross-domain analysis of the determinants of population change, thus providing a more general view.
The following sections will describe three main subjects, firstly in relation to European macro-regions and subsequently with regard to city types.
- City growth (represented by population change between 2001 and 2004, net migration into core cities, natural population change)
- Suburbanisation (represented by population change in core cities and LUZ)
- Age structure (represented by the proportion of different age groups)

54/189
3.1.1 City growth One can begin to answer the questions if there is an ongoing spatial
concentration in cites in general and in the European core zone (see above) in particular, by comparing overall population change between the four basic city types and between cities, urban regions and national averages (Figures 3-8 and Map 3). First of all, core cities and LUZ grew in population in the 2001-2004 period (Figure 4). All in all, since LUZ experienced more considerable growth than core cities, it would appear that the population in the outer zones of urban regions increased more than in the inner zones. When comparing city types, population increase in the LUZ of Principals Metropolises was considerably higher than in the LUZ of smaller cities. With regard to the core zones of smaller cities, those from Type C (Smaller Centres) experienced the highest growth (+3.1%) (but experienced population loss in the LUZ), while Regional Centres (Type B) grew in their core zones (+2.4%) and LUZ (+2.1%).
There was, therefore, a continuing growth in population particularly in those urban regions, where already by far the majority of all inhabitants of cities taking part in the Urban Audit live: in Types A and B (Figure 3). In contrast to the other city groups, Type D cities and Larger Urban Zones decreased in population. These initial indicators therefore suggest that in the 2001-2004 period, large urban regions were subject to an ongoing spatial concentration process with regard to population, and due to a continuing drop in population, cities in Central Europe have not yet managed to “catch up”.
Whereas population on the whole has been growing in Northern, Western and Southern Europe, Central Europe has experienced population decline or, at most, stagnation. In Northern Europe, population growth in most urban areas (core cities and LUZ) has been higher than in the respective countries as a whole (Figures 5 and 721).
Some Central European countries (Czech Republic, Slovakia, Slovenia) reported a balanced overall population development between 2001 and 2004, whereas core cities decreased in population. In Romania, population losses in cities (core cities and LUZ) were lower than in the country as a whole. A more differentiated picture exists in other countries (Bulgaria, Hungary, Poland), where some cities are losing population to a greater extent than the countries as a whole and other cities are experiencing less population decline or even growing.
Among the large Western European countries, population increased in cities and LUZ in France and increased in most LUZ in the UK. German cities report a wider range of growth and decline with regard to population development. In Austria, cities grew faster than the country as a whole. In Southern Europe, there is a wide spectrum of above-average population growth and decline in core cities and LUZ. On average, the outer urban areas in all basic city types report gains in
21Weighting of city type and national averages of Urban Audit cities by total population.
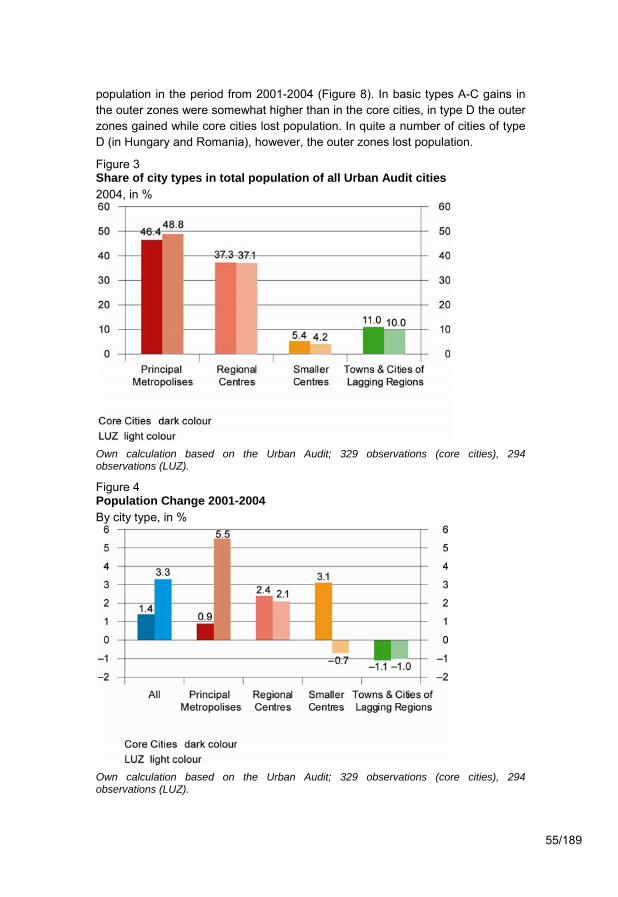
55/189
population in the period from 2001-2004 (Figure 8). In basic types A-C gains in the outer zones were somewhat higher than in the core cities, in type D the outer zones gained while core cities lost population. In quite a number of cities of type D (in Hungary and Romania), however, the outer zones lost population.
Figure 3 Share of city types in total population of all Urban Audit cities 2004, in %
Own calculation based on the Urban Audit; 329 observations (core cities), 294 observations (LUZ).
Figure 4 Population Change 2001-2004 By city type, in %
Own calculation based on the Urban Audit; 329 observations (core cities), 294 observations (LUZ).

56/189
Map 3 Average annual population change 2001-2004 Core Cities (in %)
Own calculation based on the Urban Audit.

57/189
Figure 5 Average annual population change 2001-2004 Core Cities, by country, macro-region and city type (in %)
Own calculation based on the Urban Audit and regional statistics from Eurostat.
Figure 6 Average annual population change 2001-2004 Core cities, by city type (in %)
Own calculation based on the Urban Audit.
‐3
‐2
0
2
3
5
6Capital city Type A (non‐capital) Type B Type C Type D other Country UA cities (weighted average)
Northern Central Western Southern
DK FI NO SE BG CZ EE HU LV LT PL RO SK SI AT BE FR DE IE LU NL CH UK CY GR IT MT PT ES TR
Northern Central Western SouthernNorthern Central Western SouthernNorthern Central Western SouthernNorthern Central Western SouthernNorthern Central Western SouthernNorthern Central Western SouthernNorthern Central Western Southern

58/189
Figure 7 Average annual population change 2001-2004 LUZ, by country, macro-region and city type (in %)
Own calculation based on the Urban Audit and regional statistics from Eurostat.
Figure 8 Average annual population change 2001-2004 Outer Urban Zones (non-core-city parts of LUZ), by city type (in %)
Own calculation based on the Urban Audit.
‐3
‐2
0
2
3
5
6Capital city Type A (non‐capital) Type B Type C Type D other Country UA cities (weighted average)
Northern Central Western Southern
DK FI NO SE BG CZ EE HU LV LT PL RO SK SI AT BE FR DE IE LU NL CH UK CY GR IT MT PT ES TR
Northern Central Western SouthernNorthern Central Western SouthernNorthern Central Western Southern
‐5
‐4
‐3
‐2
‐1
0
1
2
3
4
5 A B C DPrincipal Regional Centres Smaller Centres Towns & Cities of the
Metropolises Lagging Regions
Weighted Average

59/189
Figure 9 Net migration into core cities 2003/2004* Moves into in relation to moves out of the city (core cities), by country, macro-region and city type (in %)
Own calculation based on the Urban Audit, *>0 = migration gain, 0 = balance, < 0 = migration loss, e.g. -1 means a city lost 1% of its total population (as of 2004) due to out-migration in the years 2003 and 2004 combined.
In Northern Europe, overall increase in urban population corresponds with net migration into core cities. In Central Europe, the majority of cities are losing population due to out-migration. In Western Europe, core cities in Germany report both migration gains and losses, while the majority of Dutch cities are attracting more migrants than they are losing as a result of out-migration. In Southern Europe, the majority of cities in Italy are gaining in population; cities in Spain, again, report a wide range of both gains and losses (Figure 9). Comparison between city types reveals that most cities from basic types A-C were gaining population due to net immigration in 2003/2004, while almost all smaller cities in the lagging regions (type D) were losing population due to net emigration. Among the largest and capital cities rather the National (type A2) than the Leading European Capitals and Metropolises (A1) attracted many migrants. Among the Regional Centres, many cities from the Regional Innovation Centres (Type B2) and Regional Centres with Growing Population (B3) are currently gaining in population by migration. The vast majority of migrants to cities in the northern parts of Germany, the Netherlands and the Scandinavian Countries are nationals, i.e. they are mainly targets of migration originating in their own country. In Southern Germany and Switzerland, the share of EU- and Non-EU nationals among in-migrants is considerably higher. The number of in-migrants to Spanish cities is higher than to (North) Italian cities delivering data in 2004. In Spanish cities along the Mediterranean coast, a high share of migrants originates in non-EU countries, whereas the majority of migrants to the Spanish Atlantic coast are Spanish nationals. Greek cities are also mainly the target of within-country migration (cf. Map 4).
‐1
0
1Capital city Type A (non‐capital) Type B Type C Type D other Country UA cities (weighted average)
Northern Central Western Southern
DK FI NO SE BG CZ EE HU LV LT PL RO SK SI AT BE FR DE IE LU NL CH UK CY GR IT MT PT ES TR
Northern Central Western SouthernNorthern Central Western SouthernNorthern Central Western SouthernNorthern Central Western SouthernNorthern Central Western SouthernNorthern Central Western SouthernNorthern Central Western Southern

60/189
Map 4 Migration into core cities 2003/2004 by nationality (in %)
Own calculation based on the Urban Audit.- Values for Vienna not displayed due to inconsistency with municipal data.
Size of circle is relative to migration into core city in 2003/2004

61/189
The second component of regional and urban population development (i.e. in addition to regional migration) is natural population change (Figures 10-11 and Map 5). A common feature of almost all Northern, Western (with the exception of Germany) and Southern European cities is that they experience lower population growth resulting from a surplus of births over deaths than the country as a whole. In most Central European countries, on the other hand, urban natural population gains were above the national averages in 2004.
Across Europe in 2004, there was less variation between cities than between countries in terms of natural population gains. While natural population change in cities varied between -0.6% and +1.6%, in the case of countries it ranged from -5.2% in Bulgaria to +4.5% in France. When comparing city types, it is not surprising that natural population change particularly accounts for population gains in cities in peripheral regions (Type C), which differ from other cities in terms of age structure and in that they have a higher share of small children (< 5) (cf. Tables 4-7 and see below). In the case of the European core zone (types A and B) a larger number of cities than expected also report birth surpluses. It would appear, therefore, that large cities are not necessarily “family-unfriendly” environments.
It would certainly be a major diseconomy of congestion in large European cities if their living conditions deterred residents from starting a family. In many cases it is clear that the inner zones of big cities do not provide the surroundings many families desire for life with small children. Also, many families with children may not be able to afford their preferred type of housing in very central locations. More research about the motivation of household location is required. In any case, the analysis shows that many families decide to live in big cities. A promising finding with regard to cities in lagging regions (Type D) is that the majority report birth surpluses.
Population change from 1991 to 2004 shows that, in general, recent developments are in line with longer-term trends. Population increased in Northern, Western and Southern European countries and declined or remained stable at best in Central Europe. In Poland, a number of cities experienced long-term growth while, in general, most Central European cities decreased in population. In Northern Europe, a more distinct urbanisation process was apparent than in other parts of Europe, since here almost all cities experienced an above-average growth in population. In Western and Southern Europe, there was a considerably more differentiated picture of growing and declining cities.
Over the past two decades France has reported a trend of continued urban growth, while in Germany, the majority of cities have shrunk and cities in the UK have experienced both increases and decreases in population. In Italy, the majority of cities – small and big ones – have shrunk, In Spain, the biggest cities, Madrid and Barcelona, and most of the small cities (around 100,000 inhabitants) have shrunk, while the larger cities on the Mediterranean coast have gained in population (Map 6 and Figure 12).

62/189
Map 5 Natural population change 2004 Live births – deaths in % of the total population
Own calculation based on the Urban Audit.

63/189
Figure 10 Natural population change 2004 Live births - deaths in % of the total population (core cities), by macro-region, country and city type
Own calculation based on the Urban Audit.
Figure 11 Natural population change 2004 Live births - deaths in % of the total population, by city type
Own calculation based on the Urban Audit.
‐1
0
1
2 Capital city Type A (non‐capital) Type B Type C Type D other Country UA cities (weighted average)
Northern Central Western Southern
DK FI NO SE BG CZ EE HU LV LT PL RO SK SI AT BE FR DE IE LU NL CH UK CY GR IT MT PT ES TR
Northern Central Western SouthernNorthern Central Western SouthernNorthern Central Western SouthernNorthern Central Western SouthernNorthern Central Western SouthernNorthern Central Western SouthernNorthern Central Western Southern
‐1
0
1
2
A1 A2 B1 B2 B3 C1 C2 D1 D2
Weighted Average
A B C DPrincipal Regional Centres Smaller Centres Towns & Cities of the
Metropolises Lagging Regions

64/189
Map 6 Total population change 1991-2004 (in %)
Own calculation based on the Urban Audit.
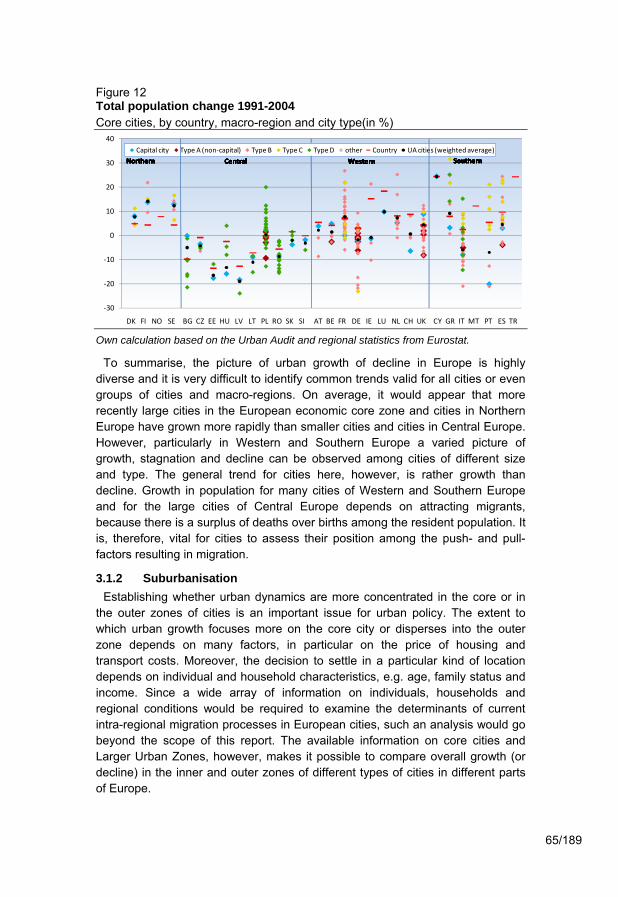
65/189
Figure 12 Total population change 1991-2004 Core cities, by country, macro-region and city type(in %)
Own calculation based on the Urban Audit and regional statistics from Eurostat.
To summarise, the picture of urban growth of decline in Europe is highly diverse and it is very difficult to identify common trends valid for all cities or even groups of cities and macro-regions. On average, it would appear that more recently large cities in the European economic core zone and cities in Northern Europe have grown more rapidly than smaller cities and cities in Central Europe. However, particularly in Western and Southern Europe a varied picture of growth, stagnation and decline can be observed among cities of different size and type. The general trend for cities here, however, is rather growth than decline. Growth in population for many cities of Western and Southern Europe and for the large cities of Central Europe depends on attracting migrants, because there is a surplus of deaths over births among the resident population. It is, therefore, vital for cities to assess their position among the push- and pull-factors resulting in migration.
3.1.2 Suburbanisation Establishing whether urban dynamics are more concentrated in the core or in
the outer zones of cities is an important issue for urban policy. The extent to which urban growth focuses more on the core city or disperses into the outer zone depends on many factors, in particular on the price of housing and transport costs. Moreover, the decision to settle in a particular kind of location depends on individual and household characteristics, e.g. age, family status and income. Since a wide array of information on individuals, households and regional conditions would be required to examine the determinants of current intra-regional migration processes in European cities, such an analysis would go beyond the scope of this report. The available information on core cities and Larger Urban Zones, however, makes it possible to compare overall growth (or decline) in the inner and outer zones of different types of cities in different parts of Europe.
‐30
‐20
‐10
0
10
20
30
40Capital city Type A (non‐capital) Type B Type C Type D other Country UA cities (weighted average)
Northern Central Western Southern
DK FI NO SE BG CZ EE HU LV LT PL RO SK SI AT BE FR DE IE LU NL CH UK CY GR IT MT PT ES TR
Northern Central Western SouthernNorthern Central Western SouthernNorthern Central Western SouthernNorthern Central Western SouthernNorthern Central Western SouthernNorthern Central Western SouthernNorthern Central Western Southern

66/189
On average, about 60% of all Urban Audit city inhabitants live in core cities (about 50% in big cities (Type A), 50-70% in smaller cities (Types B-D), cf. Table 8 in Chapter 2). The outer zones of many very large urban agglomerations have recently experienced more rapid population growth than the inner zones (Figure 4). Particularly in very large cities, suburbanisation, therefore, is still an ongoing trend, even though net migration losses in core cities of most western European cities have ceased (Figure 9). Nevertheless, the outer zones of all different city types on average have been growing faster than the core zones (Figures 6 and 8). In smaller Central European cities, on average the outer zones grew in the period from 2001 to 2004, while the inner zones shrunk. In capital cities of Central Europe, the outer zones also grew, while core cities declined or remained stable. To summarise, agglomeration factors of many cities of different size and in different parts of Europe appear to be somewhat more favourable in the outer than in the inner zones. However, balanced net migration into core cities suggests that in most cities of Western Europe, there is currently no major shift of population from the inner to the outer zones. In Central Europe, a more pronounced suburbanisation process can be observed.
A comparative analysis of change in the outer urban zones and core cities reveals that among cities with the ten fastest growing outer urban zones in the 2001-2004 period, there are only two (Palma di Mallorca and Toulouse) where the corresponding core city ranks among the average annual growth “top 20” in this period. This trend may be taken as an indicator of increasing urban sprawl, though there are also situations where both shrinking population and urban sprawl coincide on a given territory The highest average annual growth in the outer zone (over 9%) was reported by the Hungarian city Gyõr, which shrunk in its core zone. Spain is the country with the largest number of cities in the “top 10“ of growth in the outer zone. The cities with the ten fastest declining outer urban zones are spread more evenly across different countries, yet the majority (6) are from Central Europe. None of the four Western European cities from this group was declining in the core zone (Table 12).
It is even more difficult to examine intra-regional shifts of economic activity on the basis of the existing data. In a sample of 35 (German) Urban Audit cities – again as an example of the differences that exist – the share of jobs in the core cities compared with all jobs in the LUZ remained at 44% between 2001 and 2004. At least in the European core zone, therefore, no major shift in the distribution of economic activity between inner and outer urban zones is apparent at present. Yet, as comparison between population dynamics in different parts of Europe has shown, the urban system in Germany is far from representative of the whole of (Western) Europe.
3.1.3 Age structure A comparative analysis of European regions shows that the average share of
very young children (under five years old) among the overall population is lowest in Central Europe, where there is also relatively little variation between cities with

67/189
regard to this indicator. In Southern Europe, national averages of the share of under five-year-olds are just under those from Central Europe, but variation among cities is higher.
Table 12 Average annual population change 2001 – 2004 in the outer urban zone* City Country Average annual population change 2001
– 2004 in %
in outer urban zone in core city (Rank)
Top 10: Highest increase
1. Gyõr HU 9.2 -0.5 (280) 2. Uppsala SE 7.9 -1.6 (345) 3. s' Gravenhage NL 5.8 2.0 (37) 4. Málaga ES 4.8 1.5 (56) 5. Palma di Mallorca ES 4.6 3.5 (12) 6. Zaragoza ES 4.2 1.3 (69) 7. Logroño ES 4.1 2.1 (31) 8. Roma IT 3.1 0.1 (210) 9. Toulouse FR 3.0 3.0 (15)
10. Madrid ES 3.0 1.8 (46) Bottom 10: Highest loss
267. Umeå SE -0.6 1.1 (49)
268. Weimar DE -0.7 0.5 (97)
269. Tromsø NO -0.8 1.0 (53)
270. Liepaja LV -0.9 -0.8 (253)
271. Szeged HU -1.2 -1.4 (272)
272. Nyíregyháza HU -1.5 0.2 (137)
273. Arad RO -3.1 -0.7 (245)
274. Székesfehérvár HU -3.3 -0.6 (232)
275. Thessaloniki GR -4.3 0.1 (157)
276. Miskolc HU -7.2 -0.8 (255) Own calculation based on the Urban Audit. *EU countries, Switzerland and Norway
The highest proportion of children under five and between five and 15 is recorded in Turkey, where one third of Urban Audit city inhabitants are under 15 years old (Figure 13). Other countries with a relatively high national average of young children are located in Northern (Norway, Sweden, Denmark) and Western Europe (Ireland, Luxemburg, Netherlands). Low numbers of young children clearly demonstrate the “baby bust” that has accompanied the dramatic post-communist changes in Central Europe. However, since many cities now report birth surpluses once again (see above), natural population development appears to be gaining momentum.
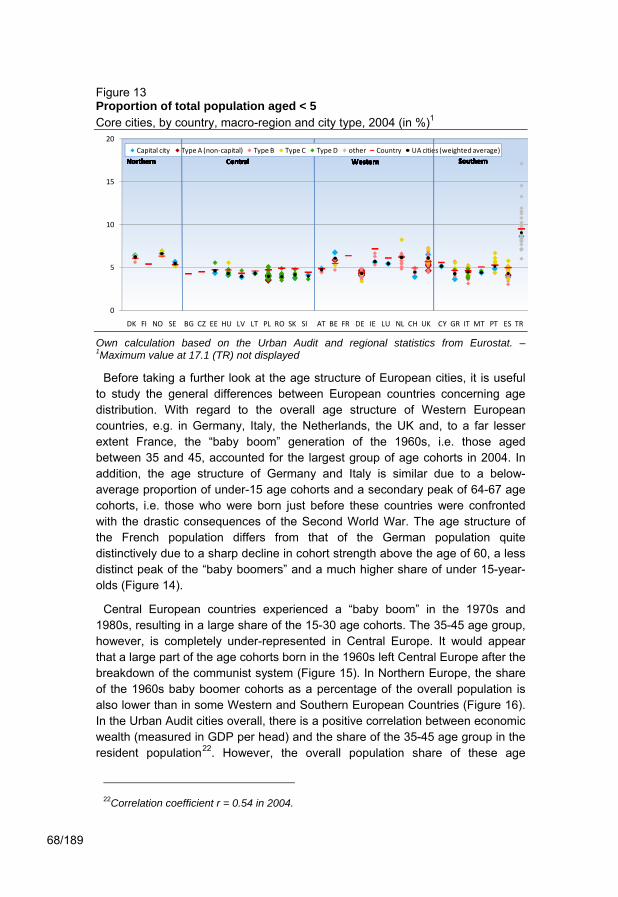
68/189
Figure 13 Proportion of total population aged < 5 Core cities, by country, macro-region and city type, 2004 (in %)1
Own calculation based on the Urban Audit and regional statistics from Eurostat. – 1Maximum value at 17.1 (TR) not displayed
Before taking a further look at the age structure of European cities, it is useful to study the general differences between European countries concerning age distribution. With regard to the overall age structure of Western European countries, e.g. in Germany, Italy, the Netherlands, the UK and, to a far lesser extent France, the “baby boom” generation of the 1960s, i.e. those aged between 35 and 45, accounted for the largest group of age cohorts in 2004. In addition, the age structure of Germany and Italy is similar due to a below-average proportion of under-15 age cohorts and a secondary peak of 64-67 age cohorts, i.e. those who were born just before these countries were confronted with the drastic consequences of the Second World War. The age structure of the French population differs from that of the German population quite distinctively due to a sharp decline in cohort strength above the age of 60, a less distinct peak of the “baby boomers” and a much higher share of under 15-year-olds (Figure 14).
Central European countries experienced a “baby boom” in the 1970s and 1980s, resulting in a large share of the 15-30 age cohorts. The 35-45 age group, however, is completely under-represented in Central Europe. It would appear that a large part of the age cohorts born in the 1960s left Central Europe after the breakdown of the communist system (Figure 15). In Northern Europe, the share of the 1960s baby boomer cohorts as a percentage of the overall population is also lower than in some Western and Southern European Countries (Figure 16). In the Urban Audit cities overall, there is a positive correlation between economic wealth (measured in GDP per head) and the share of the 35-45 age group in the resident population22. However, the overall population share of these age
22Correlation coefficient r = 0.54 in 2004.
0
5
10
15
20Capital city Type A (non‐capital) Type B Type C Type D other Country UA cities (weighted average)
Northern Central Western Southern
DK FI NO SE BG CZ EE HU LV LT PL RO SK SI AT BE FR DE IE LU NL CH UK CY GR IT MT PT ES TR
Northern Central Western SouthernNorthern Central Western SouthernNorthern Central Western SouthernNorthern Central Western SouthernNorthern Central Western SouthernNorthern Central Western SouthernNorthern Central Western Southern
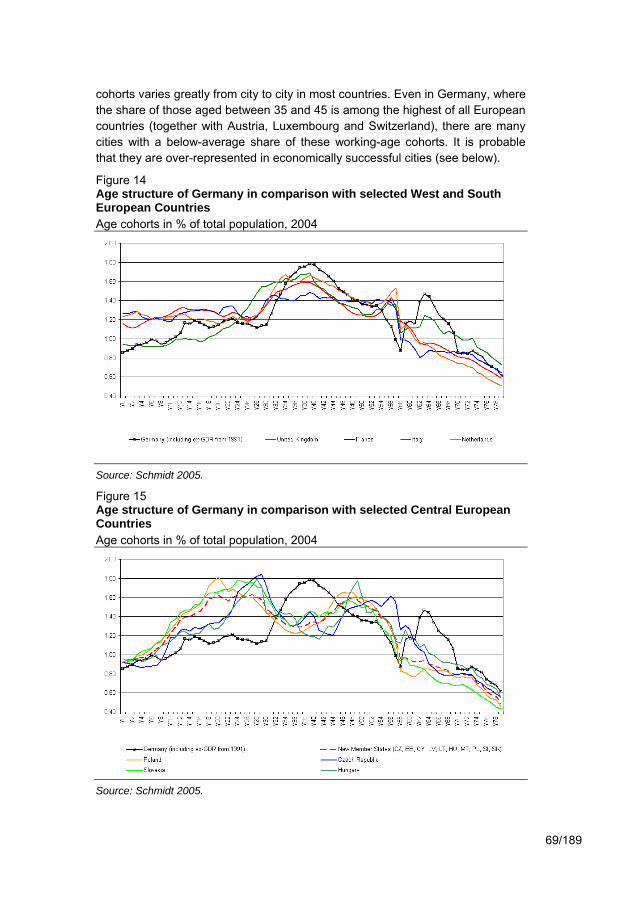
69/189
cohorts varies greatly from city to city in most countries. Even in Germany, where the share of those aged between 35 and 45 is among the highest of all European countries (together with Austria, Luxembourg and Switzerland), there are many cities with a below-average share of these working-age cohorts. It is probable that they are over-represented in economically successful cities (see below).
Figure 14 Age structure of Germany in comparison with selected West and South European Countries Age cohorts in % of total population, 2004
Source: Schmidt 2005.
Figure 15 Age structure of Germany in comparison with selected Central European Countries Age cohorts in % of total population, 2004
Source: Schmidt 2005.

70/189
Figure 16 Proportion of total population aged 35-45 Core cities, by country and macro- region and city type, 2004 (in %)
Own calculation based on the Urban Audit and regional statistics from Eurostat.
Figure 17 Proportion of total population aged > 75 Core cities, by country, macro-region and city type, 2004 (in %)
Own calculation based on the Urban Audit and regional statistics from Eurostat.
On average, the share of senior citizens (>75 years old) is relatively low in Central Europe and high in Western and Northern Europe. In Southern Europe, the share of seniors is low in smaller countries (Cyprus, Malta), close to the average of Northern and Western European countries in Greece, Spain and Portugal, but very high in Italy. For many Italian cities, demographic ageing is a process which has become a reality of urban life (Figure 17). Ireland is characterised by an age structure which is very different to that of most other European countries. Here, the share of young children is very high and that of seniors very low.
0
5
10
15
20 Capital city Type A (non‐capital) Type B Type C Type D other Country UA cities (weighted average)
Northern Central Western Southern
DK FI NO SE BG CZ EE HU LV LT PL RO SK SI AT BE FR DE IE LU NL CH UK CY GR IT MT PT ES TR
Northern Central Western SouthernNorthern Central Western SouthernNorthern Central Western SouthernNorthern Central Western SouthernNorthern Central Western SouthernNorthern Central Western SouthernNorthern Central Western Southern

71/189
Figure 18 Proportion of total population aged > 75 Core cities, by city type, 2004 (in %)
Own calculation based on the Urban Audit.
A comparison of city types firstly reveals that there are more seniors than young children in most cities of all types and in all parts of Europe. The share of young children is high in many Type C cities (Smaller Centres) and low in lagging regions (Type D). Among the Regional Centres, the share of young children is relatively high in many Regional Service Centres (Type B1).
Demographic ageing is most advanced among the Regional Centres (Type B), and, particularly in the Regional Innovation Centres (B2). The lowest share of seniors live in Types C2 (Smaller Centres with Growing Population) and D2 (Less developed towns and cities) (Figure 18).
To summarise, it could be said that demographic change is a challenge which has, to date, affected different regions to varying degrees. Many cities in the most accessible parts of Europe, e.g. in Germany, have reached a relatively advanced stage in the demographic ageing process. In most of these cities, there is a surplus of deaths over births, i.e. population growth depends on net immigration. In other parts of Europe, the population is, on average, still “younger” and the demographic ageing process appears to be less of a concern at present. In Western Europe, cities with a large share of young children experienced particularly high population growth in the 2001-2004 period. Cities must provide favourable living conditions for families with children, both in terms of living and working. Quite interestingly, population growth was apparent in many big cities, particularly in Southern Europe (Madrid, Barcelona, Milan), with an above-average share of senior citizens (>75), i.e. these cities can obviously
0
5
10
15
A1 A2 B1 B2 B3 C1 C2 D1 D2
A B C DPrincipal Regional Centres Smaller Centres Towns & Cities of the
Metropolises Lagging Regions
Weighted Average
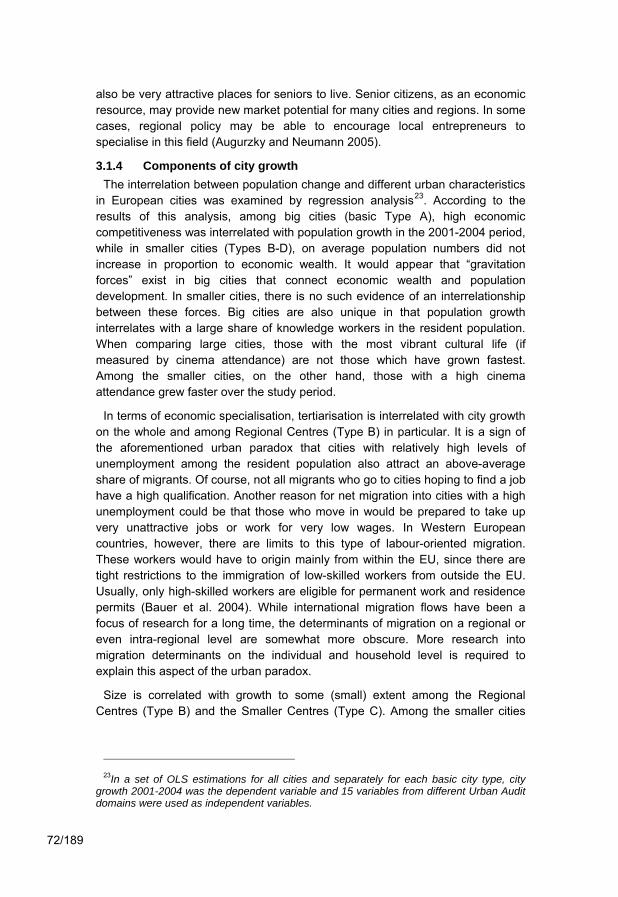
72/189
also be very attractive places for seniors to live. Senior citizens, as an economic resource, may provide new market potential for many cities and regions. In some cases, regional policy may be able to encourage local entrepreneurs to specialise in this field (Augurzky and Neumann 2005).
3.1.4 Components of city growth The interrelation between population change and different urban characteristics
in European cities was examined by regression analysis23. According to the results of this analysis, among big cities (basic Type A), high economic competitiveness was interrelated with population growth in the 2001-2004 period, while in smaller cities (Types B-D), on average population numbers did not increase in proportion to economic wealth. It would appear that “gravitation forces” exist in big cities that connect economic wealth and population development. In smaller cities, there is no such evidence of an interrelationship between these forces. Big cities are also unique in that population growth interrelates with a large share of knowledge workers in the resident population. When comparing large cities, those with the most vibrant cultural life (if measured by cinema attendance) are not those which have grown fastest. Among the smaller cities, on the other hand, those with a high cinema attendance grew faster over the study period.
In terms of economic specialisation, tertiarisation is interrelated with city growth on the whole and among Regional Centres (Type B) in particular. It is a sign of the aforementioned urban paradox that cities with relatively high levels of unemployment among the resident population also attract an above-average share of migrants. Of course, not all migrants who go to cities hoping to find a job have a high qualification. Another reason for net migration into cities with a high unemployment could be that those who move in would be prepared to take up very unattractive jobs or work for very low wages. In Western European countries, however, there are limits to this type of labour-oriented migration. These workers would have to origin mainly from within the EU, since there are tight restrictions to the immigration of low-skilled workers from outside the EU. Usually, only high-skilled workers are eligible for permanent work and residence permits (Bauer et al. 2004). While international migration flows have been a focus of research for a long time, the determinants of migration on a regional or even intra-regional level are somewhat more obscure. More research into migration determinants on the individual and household level is required to explain this aspect of the urban paradox.
Size is correlated with growth to some (small) extent among the Regional Centres (Type B) and the Smaller Centres (Type C). Among the smaller cities
23In a set of OLS estimations for all cities and separately for each basic city type, city
growth 2001-2004 was the dependent variable and 15 variables from different Urban Audit domains were used as independent variables.

73/189
there is apparently a “gravitation force” concentrating on the relatively larger cities.
3.1.5 Policy Implications The analysis of population development in European cities carried out in this
section reveals implications for three priorities of cohesion policy as defined by the Barca (2009) report: migration, children and ageing.
(i) In the period under observation (2001-2004), a continuing growth in population particularly in large cities in the core zone of the European economy was observed. Even though there is a very diverse picture of population growth and decline in different types of cities and in different parts of Europe, on average the largest growth was taking place in those urban regions, which already represent the largest agglomeration of population and economic wealth in Europe. The Barca (2009: VIII) report argues that there is no contradiction between policy interventions aimed at increasing prosperity on the one hand and those aimed at reducing inequality on the other, but that a clear distinction should be made between these policy goals. While it is very difficult to decide in which cases agglomeration processes should be encouraged or discouraged by policy, it will be a task of EU policy to ensure that social exclusion in otherwise rich urban regions will not arise as a future challenge to territorial cohesion. Otherwise, labour-oriented regional migration is likely to be accompanied by a considerable degree of inequality among the working-age population in the most prosperous cities (urban paradox, see below).
(ii) Among the large cities in Europe, presence of a high share of high-skilled “knowledge workers” turns out to be combined with overall city growth. It is a task of public policy to encourage the multitude of interrelated aspects of economic innovation and attraction of high-skilled inhabitants. EU policy can support integration of policy measures aimed at economic growth with those aimed at shaping an attractive urban environment for high-skilled migrants, e.g. by upgrading urban areas, provision of infrastructure (e.g. healthcare, public transport, security) and leisure and cultural facilities.
(iii) While the Barca (2009: XIV) report states that convergence in terms of per capita income is not a sufficient policy goal, observation of population growth (or rather decline) in smaller cities of Central Europe gives some reason for concern, since here, the majority of cities are losing population due to continued out-migration. This can clearly be interpreted as an underutilisation of regional resources and it must be a goal of cohesion policy to support a level of economic performance in these cities and regions, which makes it possible for qualified people to find adequate job opportunities there.
(iv) While there appears to be a direct link between accessibility and economic prosperity among European cities (see below), high accessibility alone is not suf-ficient to attract very large numbers of migrants to cities, even in the most prosperous regions of Europe. Improvement of accessibility, i.e. upgrading of the

74/189
transport infrastructure, will therefore be one part only of a successful overall policy to improve living conditions, cities' attractiveness and economic prosperity in Central Europe. And it appears as crucial to integrate any development of the transport infrastructure in the overall urban planning.
(v) The current age structure of countries and cities in Europe has been shaped by historical events and changes, e.g. wars, periods of long-term economic growth or decline and increasing mobility. Long-term demographic change is a process, which so far has affected different regions to varying degrees. Under the policy objectives of “children” and “ageing”, cities must provide favourable living conditions for families with children, both in terms of living and working, and for senior citizens. Provision of an adequate infrastructure, e.g. schools and day care facilities for children, local services for senior citizens is a crucial part of this policy. Also, cohesion policy can encourage housing development aimed at a variety of family types and lifestyle affiliations in urban regions, including families, one- or two-person households and senior citizens. By examples from seven European countries, a recent study has shown how urban planning with an intergenerational focus can be implemented at the neighbourhood level (BMVBS/BBSR (ed.) 2009). A relatively large number of “big cities” report birth surpluses, i.e. many families with children decide to live in cities. Already, many cities are home to a large number of senior citizens. National policy may be supported by the EU in providing favourable conditions for different age groups and family types locally.
(vi) Unequal growth of different parts of city regions implies a rationale for a multitude of place-based policy interventions tailored not only to the conditions of cities but to specific urban areas. Tasks of such policy are, e.g. preventing social exclusion of inner and outer city neighbourhood populations affected by decline and/or ageing, but also providing favourable conditions for growth at attractive locations. National and local policy aimed at neighbourhood-oriented development should be supported by EU measures.
3.2 Economy This section starts with an overview of the distribution of economic wealth and
its concentration in cities across Europe and continues with an analysis of regional economic specialisation and innovation. It will examine three main subjects, firstly by European regions and subsequently by city types:
– economic prosperity (represented by various GDP indicators and multimodal-accessibility)
– tertiarisation and regional economic specialisation, (represented by proportion of employment in service sector and financial businesses)
– innovation and entrepreneurship, (represented by patent intensity, new businesses)
Other closely related indicators, e.g. knowledge work and (un)employment rates will be analysed in separate sections.

75/189
3.2.1 Agglomeration of economic activity Regional GDP is the most commonly used measure of regional economic
wealth and agglomeration. For cross-country comparisons conducted at a particular point in time, the use of Purchasing Power Standards (PPS) is preferable. Since the size of spatial observation units in this analysis differs greatly, the observation here focuses on GDP per head (in PPS). Another common measure is labour productivity, i.e. GDP per employment (at workplace). With regard to national averages of GDP per head, a clear gap emerges between Northern, Western and Southern Europe on the one hand, and Central Europe on the other (Figure 19). In Northern and Western European countries, GDP per head was between 20,000 and 30,000 PPS (or over 30,000, in Norway, for example) in 2004. In Southern Europe, it was around 20,000 and in Central Europe (and in Turkey) around 10,000.
Figure 19 GDP per head in PPS Core city/NUTS 3 region*, by country, macro-region and city type, 2004
Own calculation based on the Urban Audit and regional Statistics from Eurostat (NUTS 3), *For 290 out of 356 cities, missing data was replaced by data on NUTS 3 regions available from Eurostat (NUTS 2 for cities from TR) via the internet.
It is remarkable that in most European countries there is an exceptional agglomeration of wealth in the capital city. This verifies the dominant and unique position of capitals in a (national) economic system. In eight European capitals, the GDP per head is more than double the national average. Not surprisingly, this applies to London and Paris, but also to the capitals of the new Member States such as Warsaw, Bratislava, Sofia, Bucharest, Prague, Budapest, Riga and Tallinn (Figure 19 and Map 7).
With regard to the economic competitiveness of countries and regions, findings on labour productivity are similar to those concerning GDP per head. Here again, countries in Northern and Western Europe ranked highest with a GDP per total employment of more than EUR 60,000. In 2004 Ireland and Denmark even reported labour productivity of over EUR 80,000 and EUR 70,000 per employee respectively.
0
10000
20000
30000
40000
50000
60000
70000
80000
90000Capital city Type A (non‐capital) Type B Type C Type D other Country UA cities (weighted average)
Northern Central Western Southern
DK FI NO SE BG CZ EE HU LV LT PL RO SK SI AT BE FR DE IE LU NL CH UK CY GR IT MT PT ES TR
Northern Central Western SouthernNorthern Central Western SouthernNorthern Central Western SouthernNorthern Central Western SouthernNorthern Central Western SouthernNorthern Central Western SouthernNorthern Central Western Southern
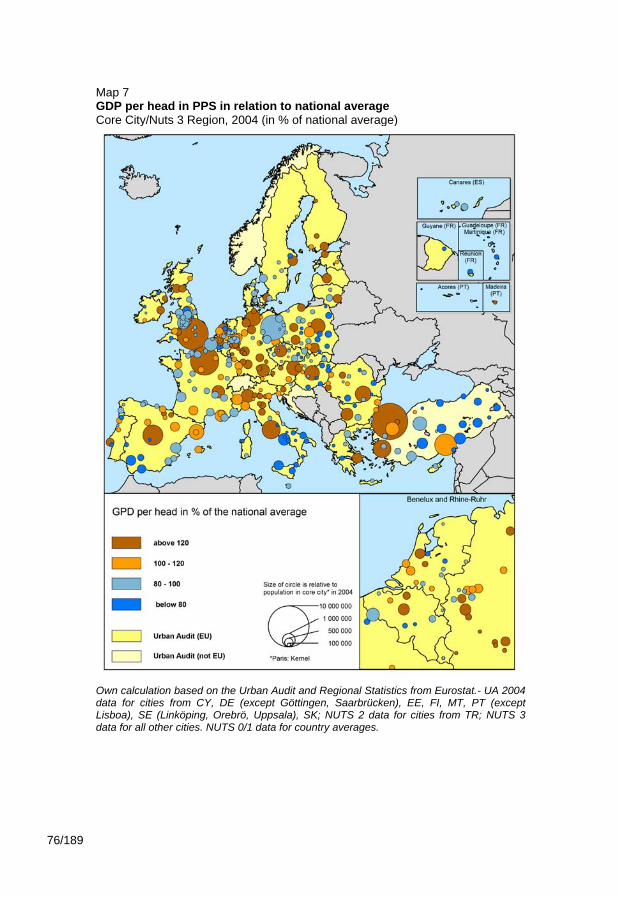
76/189
Map 7 GDP per head in PPS in relation to national average Core City/Nuts 3 Region, 2004 (in % of national average)
Own calculation based on the Urban Audit and Regional Statistics from Eurostat.- UA 2004 data for cities from CY, DE (except Göttingen, Saarbrücken), EE, FI, MT, PT (except Lisboa), SE (Linköping, Orebrö, Uppsala), SK; NUTS 2 data for cities from TR; NUTS 3 data for all other cities. NUTS 0/1 data for country averages.

77/189
Figure 20 GDP per head in PPS in relation to the national average Core City/NUTS 3 region, by city type, 2004 (in % of national average)
Own calculation based on the Urban Audit and regional Statistics from Eurostat (NUTS 3).
Countries in Southern Europe are located in a “midfield” between EUR 30,000 and EUR 50,000 per employee. In Southern Europe, Portugal accounts for the lowest (no data available for Turkey) and Italy for the highest labour productivity. Countries in Central Europe had the lowest labour productivity with a GDP per employee of less than EUR 30,000. With labour productivity at below EUR 10,000 per employee, economic conditions in particular in Bulgaria and Romania still differ significantly from those in Western, Northern and Southern Europe.
Among Central European countries, labour productivity on average is highest in Slovenia. In Poland, most urban regions score an above-average labour productivity. Otherwise, cities are distributed more or less equally around their respective national averages of labour productivity.
Comparing city types gives a vivid picture of concentration of economic wealth in big cities (Figure 20). In almost all Type A cities, GDP per head is above the national average. In Regional Centres (Type B), there is a more balanced distribution of above- and below-average urban GDP per capita. In almost all Smaller Centres (Type C) and in lagging regions (Type D), economic output per resident is below the national average. Real GDP growth in the period from 2001-2004 clearly sets basic Type D apart. Most cities (or NUTS 3 Regions) in Western Europe experienced slow to moderate economic growth; a few experienced moderate decline. In smaller cities in lagging regions, on the other hand, there was a dichotomy between decline and high growth (over +10%).
50
100
150
200
250
300A B C D
Principal Regional Centres Smaller Centres Towns & Cities of theMetropolises Lagging Regions
Weighted Average

78/189
Figure 21 Multi-modal accessibility in relation to the EU 27 average Core cities, by country, macro-region and city type (deviation from EU 27 average in %)
Own calculation based on the Urban Audit.
Figure 22 Multi-modal accessibility in relation to the EU 27 average Core cities, by city type (deviation from EU 27 in %)
Own calculation based on the Urban Audit.
Capital city Type A (non‐capital) Type B Type C Type D other UA cities (weighted average)
Northern Central Western Southern
DK FI NO SE BG CZ EE HU LV LT PL RO SK SI AT BE FR DE IE LU NL CH UK CY GR IT MT PT ES TR
Northern Central Western SouthernNorthern Central Western SouthernNorthern Central Western SouthernNorthern Central Western SouthernNorthern Central Western SouthernNorthern Central Western SouthernNorthern Central Western Southern100
50
0
‐ 50
‐100
0
50
100
150
200100
50
0
‐50
‐100
A B C DPrincipal Regional Centres Smaller Centres Towns & Cities of the
Metropolises Lagging Regions
Weighted Average

79/189
It is clear that high accessibility is common to all of the most important cities of Europe. When comparing regions, the Benelux Countries and Germany have the highest accessibility, followed by Austria, France and the UK albeit with considerably lower levels of accessibility. In Central, Northern and Southern Europe, city accessibility is usually below the EU 27 average. While in Southern European countries, there are a range of cities with varying accessibility, in countries from Central and Northern Europe, there is usually only one (capital) city, which is highly accessible (well above the EU 27 average), while most other cities are far less accessible. Obviously, the transport infrastructure in these countries is largely concentrated in one large centre functioning as a national economic hub (Figure 21). Above-average accessibility is, of course a characteristic of most Principal Metropolises (Type A) and Regional Centres (Type B). Multi-modal accessibility of almost all cities in types C and D, on the other hand, is below the EU 27 average (Figure 22).
To summarise the assessment of economic agglomeration, there is evidently a high concentration of economic wealth and activity in a European core zone of Western and Northern Europe, Northern Italy, parts of Spain, and the capital cities of Central European countries. In the past few decades, smaller cities in Central Europe and in more peripheral parts of Northern and Southern Europe have failed to keep up with the economic dynamics of the big cities and capitals and the more vibrant smaller cities of Northern, Southern and Western Europe. Recently (2001-2004), Central Europe (with the exception of Poland and Romania) experienced particularly high economic growth. While it may be true that patent intensity in 2004 reveals remarkable regional disparities in technological competitiveness in Europe, in some Central European cities, patent intensity is relatively high.
There are, therefore, signs that the conditions for economic prosperity are improving in some Central European regions. In most parts of Western Europe, a relatively stable urban hierarchy has emerged, where national economic control functions are concentrated in very large cities and smaller cities play a considerable role as regional economic hubs. As stated in the Green Paper on Territorial Cohesion from 2008, Europe’s urban system is characterised by relatively few very large agglomerations and a large number of smaller cities (EU Commission 2008a). In Central Europe, there is no such stable “division of labour” between large and small cities. Here, “gravitation forces” concerning population and economic dynamics still exist and are concentrated in a limited range of big and capital cities, while smaller cities have yet to find their position in the urban system24.
24It is very hard to predict the effects of the 2008 global financial and economic crisis on
the distribution of economic activity across Europe. For quite some time, it may be more difficult for Central European countries to obtain the capital required to modernise their economies to Western European standards.

80/189
3.2.2 Tertiarisation The share of service sector employees across Europe is consistently higher in
cities than in countries overall. As previously explained, concentration of service sector activities is a major component of current urban economic development. The degree of tertiarisation, as measured by the share of the labour force (in the workplace) in the service sector, is highest in Northern and Western European countries (near or above 70%), lower in Southern Europe (usually between 60% and 70%) and lowest in Central Europe (50-60%). A number of cities in some countries (Denmark, Germany, the Netherlands, Switzerland and the UK) are now almost entirely service economies: the share of employees in the service sector here is above 90% (Figure 23).
These cities belong to Types A and B, in particular to the groups of Leading European Capitals and Metropolises (Type A1), Regional Service Centres (Type B1) and Regional Innovation Centres (Type B2). The smaller cities in peripheral and in lagging regions (Types C and D) are less tertiarised.
In most Type C cities the share of service sector employees is under 80%; in most Type D cities, it is under 70%. In the 2001-2004 period, the share of service sector employees continued to increase in all city types (Figure 24).
The service sector of course comprises a highly diverse range of economic activities. In cities, service activities requiring a highly skilled professional background, e.g. financial and business services, are usually over-represented. As expected, comparative analysis of city types reveals that the share of financial and business services is significantly higher in Types A and B than in C and D, yet variation within these groups is considerable (Figure 25). By far the highest concentration of financial and business services is a characteristic of the Leading European Capitals and Metropolises. The location behaviour of these highly specialised service activities is clearly one factor, which separates the most prosperous and internationally interwoven cities (Type A1) into a “league of their own”. Among the Regional Centres, the Regional Centres with Growing Population (B3) differ from the other sub-groups by being less specialised in financial and business services. Within the Towns and Cities of the Lagging Regions type, a particularly small share of employees focus on these highly qualified activities in the sub-group of Cities in Lagging Regions of Central Europe (D2).
In Type D, for example, a number of cities in Southern Italy report a relatively high share of employment in financial and business services, whereas in smaller Central European cities, this sector is clearly under-represented when viewed from the perspective of Europe overall. It is thus clear that specialisations with regard to service activities vary even among very large cities.
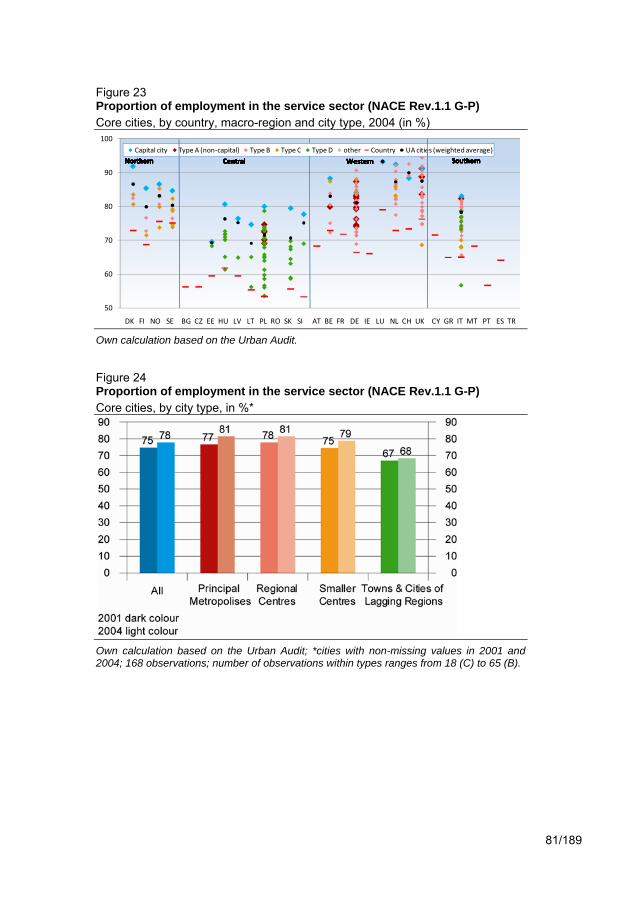
81/189
Figure 23 Proportion of employment in the service sector (NACE Rev.1.1 G-P) Core cities, by country, macro-region and city type, 2004 (in %)
Own calculation based on the Urban Audit.
Figure 24 Proportion of employment in the service sector (NACE Rev.1.1 G-P) Core cities, by city type, in %*
Own calculation based on the Urban Audit; *cities with non-missing values in 2001 and 2004; 168 observations; number of observations within types ranges from 18 (C) to 65 (B).
50
60
70
80
90
100Capital city Type A (non‐capital) Type B Type C Type D other Country UA cities (weighted average)
Northern Central Western Southern
DK FI NO SE BG CZ EE HU LV LT PL RO SK SI AT BE FR DE IE LU NL CH UK CY GR IT MT PT ES TR
Northern Central Western SouthernNorthern Central Western SouthernNorthern Central Western SouthernNorthern Central Western SouthernNorthern Central Western SouthernNorthern Central Western SouthernNorthern Central Western Southern

82/189
Figure 25 Proportion of employment in financial services (NACE Rev.1.1 J-K) Core cities, by city type, 2004 (in %)
Own calculation based on the Urban Audit.
On the basis of this analysis, it can be stated that the performance of cities throughout Europe is interrelated with the location behaviour of (specialised) service activities. However, it would appear that specialisation within the service sector is highly diverse. There is a clear link between urban concentration of economic wealth in the core zone of the European Economy and specialisation in services. At the moment, it remains unclear if Central European economies will or should follow this economic “path”, or if they will be able to gain a stronger position in the European economy by specialising more on industrial production.
3.2.3 Innovation and entrepreneurship Innovation and entrepreneurship are the key sources of regional
competitiveness. One of EU cohesion policy’s aims at present is thus to support the creation and growth of businesses, in particular small and medium-sized enterprises (SMEs). Innovation and entrepreneurship are closely linked, since the life-cycle of products and technologies always begins with a period of infancy and experimentation in which small entrepreneurial firms are founded to develop and exploit innovations before these are produced on a mass scale (Scott 2006). Entrepreneurship research has shown that the conditions for such innovative economic activity are most favourable in large urban agglomerations (Malecki 1994). Not surprisingly, this analysis has revealed that entrepreneurship and innovation are particularly concentrated in large urban economic centres, i.e. Types A and B (cf. Chapter 2, Table 8). In fact, potential for entrepreneurship in big cities is usually so great that entrepreneurs can be persuaded to locate their
0
10
20
30
40A1 A2 B1 B2 B3 C1 C2 D1 D2
A B C DPrincipal Regional Centres Smaller Centres Towns & Cities of theMetropolises Lagging Regions
Weighted Average

83/189
small firm in relatively unpopular neighbourhoods, if local economic development initiatives provide certain locational advantages (e.g. floor space in attractively designed and well-managed business incubators). In so doing, entrepreneurs can help pave the way for the revitalisation of distressed inner-city districts (Neumann et al. 2008; BMVBS (ed.) 2010).
It is of particular interest for regional policy to examine precisely how regional surroundings determine successful entrepreneurship and innovation. This is generally very difficult to study since, as Krugman (1991: 53) puts it, knowledge flows “...leave no paper trail by which they can be measured...” In line with previous research, this analysis will approximate innovation according to urban patent intensity. Although a certain amount of care should be taken when interpreting statistics on patents (cf. Box 2), they provide a unique possibility for comparing innovation activities in European cities. Entrepreneurship is measured by the number of new businesses registered in 2004.
A comparative regional analysis shows that patent intensity is considerably higher in Northern and Western Europe than in Central and Southern Europe. In many Northern and Western European Countries, the number of patent applications per 100,000 residents is over 80 (Finland, Germany, Luxembourg, the Netherlands, Sweden, Switzerland), while it is below 10 in most Central and Southern European Countries (Figure 26). Patent intensity is also relatively high in many cities in France, Ireland, the UK, and Northern Italy. While it is relatively low in most Central European cities, it would appear that some cities in the Czech Republic, Hungary, Poland and Slovenia are located within a relatively innovative regional environment, e.g. Debrecen (HU), Liberec (CZ), Ljubljana (SI), and Zielona Góra (PL) (Map 8).
Overall, the analysis showed that innovation as measured by patent intensity is highly correlated with economic concentration: cities with a high GDP per capita and a large concentration of service activities are also those with a particularly high patent intensity. Not surprisingly, among the four city types, patent intensity in Types A and B, where the ratio of patent applications to the resident population is very high, decreases rapidly in Types C and D, where it is very low (Figure 27).
It is clear that innovation, technological progress, and, as far as this can be measured by the data, knowledge spillover, are most prevalent in Europe’s existing hubs of economic activity. However, a number of relatively innovative locations within Central Europe clearly indicate that there is scope for Central European regions to find economic specialisations which can be based on intra-regional technological innovation (Map 8).
As explained, entrepreneurship activity, as measured by new businesses registered in 2004 is also considerably higher in city types A and B than in C and D. As expected therefore, entrepreneurship is greatest in the most competitive economic regions.
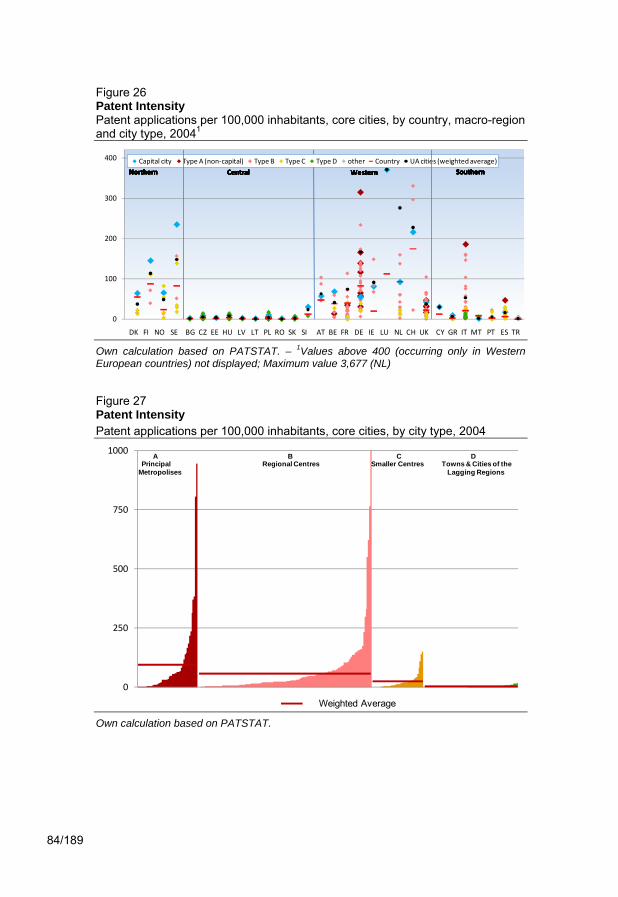
84/189
Figure 26 Patent Intensity Patent applications per 100,000 inhabitants, core cities, by country, macro-region and city type, 20041
Own calculation based on PATSTAT. – 1Values above 400 (occurring only in Western European countries) not displayed; Maximum value 3,677 (NL)
Figure 27 Patent Intensity Patent applications per 100,000 inhabitants, core cities, by city type, 2004
Own calculation based on PATSTAT.
0
100
200
300
400 Capital city Type A (non‐capital) Type B Type C Type D other Country UA cities (weighted average)
Northern Central Western Southern
DK FI NO SE BG CZ EE HU LV LT PL RO SK SI AT BE FR DE IE LU NL CH UK CY GR IT MT PT ES TR
Northern Central Western SouthernNorthern Central Western SouthernNorthern Central Western SouthernNorthern Central Western SouthernNorthern Central Western SouthernNorthern Central Western SouthernNorthern Central Western Southern
0
250
500
750
1000A B C D
Principal Regional Centres Smaller Centres Towns & Cities of theMetropolises Lagging Regions
Weighted Average

85/189
Map 8 Patent Intensity Patent applications per 100,000 inhabitants, 2004
Own calculation based on PATSTAT.

86/189
Box 2 Relevance of the Worldwide Patent Statistical Database (PATSTAT) of the European Patent Office (EPO)
Technological progress is one of the central reasons for differences in the economic dynamics of various industrial structures or regions. Patents present one of the few possibilities to quantify, at least approximately, technological progress. In this respect, patents have a number of advantages over other indicators: The data is available for long periods of time and is internationally comparable with regard to important issues. The data collected upon registering a patent is comprehensive and allows both an individual analysis at the level of the economic entities undergoing patenting and aggregated analyses for regions or technology fields.
Despite these advantages, the validity of patent statistics is not undisputed in scientific discourse (Griliches 1990). This is due to three main reasons:
(i) Only a fraction of innovation is actually patented. Many inventors do business without patenting their innovation, as registering a patent incurs significant cost. Many inventions remain unpatented since the detailed technical description within the patent specification would enable competitors to imitate the innovation.
(ii) The motives for patenting vary greatly: The protection of intellectual property with a view to exploiting an innovation in economic terms is not the only reason to register a patent. Other strategic motives also play an important role. A large patent stock can, for example, function as a useful bartering object, serve to keep competitors out of certain market segments, or help display know-how in a particular field (Jaffe 2000).
(iii) The intrinsic value of patents differs greatly: The technical and economic value of individual patents can vary considerably, thus restricting their comparability.
The database of the patent analysis is the “EPO Worldwide Patent Statistical Database” (PATSTAT) compiled by the European Patent Office (EPO). Patent registrations in 2004 (or, if unavailable, in 2003 or 2005) were analysed by registrant in individual cities. The patent intensity indicator was calculated on the basis of the total number of patent registrations per 100,000 inhabitants in the respective city. It should be noted that the location of the patent registration is not necessarily the place where the relevant research work for the patent was done. Larger cities profit in particular from large companies that register their patents centrally, although the actual innovation activity took place at other company locations.
3.2.4 Policy implications The analysis of economic indicators carried out in this section reveals
implications for “innovation”, which is defined as a particular core priority of cohesion policy by the Barca (2009) report and as a key focus of forthcoming EU activity by the EU Commission (2009a: 4). They can be summarised as follows.
(i) There is a high agglomeration of economic prosperity in cities across a European core zone of Western and Northern Europe, Northern Italy, parts of

87/189
Spain and the capital cities of Central Europe. To a great extent, prosperity here also combines with (technological) innovativity and entrepreneurial activity. Innovation, technological progress, and, as far as this can be measured by the data, knowledge spillover, are most prevalent in Europe’s existing hubs of economic activity. However, a number of relatively innovative locations within Central Europe clearly indicate that there is scope for Central European regions to find economic specialisations which can be based on intra-regional technological innovation.
The Barca (2009) report suggests that the existing diversity of industrial agglomerations and networks should be supported by cohesion policy, in order to arrive at a “smart specialisation” of cities and regions. Of course, in an ever-changing economy, regional specialisation can only last so long, before new technologies and completely new activities will take over. Over the past centuries, basic economic changes have been intertwined with a shift of the most advanced activity from one region to another. In regional economics it is known that, in fact, high specialisation can reach a “sclerotic” stage, in which the leading private and public decision-makers try to prevent new economic sectors from establishing within the region. On the other hand, especially for smaller cities, complete diversification is obviously no alternative, since a certain specialisation of regional economic clusters is a prerequisite of economic competitiveness and growth. In the concept of “smart specialisation”, such economic cores are understood as very flexible entities of industries and networks, which are spearheads of regional change.
In the place-based development strategy postulated by the Barca report, a clear distinction would be made between support of innovation and entrepreneurship in those regions, which are already economic hubs now and those, where competitive specialisations still need to be developed. The data analysed in this Second State of European Cities report can only measure overall technological innovation, but not identify the precise economic sectors of each city, in which innovation is most likely to occur. The findings of this analysis, however, support the rationale of a strategy, which, firstly, seeks to identify the economic core activities of a region and, secondly develops measures to support these actors and networks.
(ii) A specific characteristic of urban economic specialisation is tertiarisation. The location behaviour of services (including the administrations of large industrial corporations and state administrations) in particular leads to a global hierarchy of cities, which are clearly distinguished by their share of national and international economic control functions. In the urban system of Europe, concentration of economic prosperity combines with an agglomeration of specialised service industries, e.g. financial and business services. Analysis of Urban Audit data shows that in almost all European countries, the greatest concentrations of wealth are found in the capital cities, i.e. underlining that public and private actions interrelate in this agglomeration process. In most Western

88/189
European countries, a majority of central public and private sector administrative functions concentrate in a group of very large and capital cities here described as “Principal Metropolises” (Type A), while regional economic control functions agglomerate in those classified as Regional Centres (Type B). Among the Regional Centres, a more pronounced specialisation as administrative centres, entrepreneurial hubs and cultural centres can be observed. In Central Europe, there is not (yet) such a pronounced division between national and regional centres. In highly centralised public administrative systems, it will be very difficult to encourage distribution of economic control functions out of the capital cities. As part of an economic development strategy focusing on utilisation of regional capacity, however, it can be a goal to enhance the role of smaller cities as focal points of regional productive networks, e.g. by concentrating support of cluster management operations and research facilities in these “Towns and Cities of the Lagging Regions”.
3.3 Knowledge and creativity As explained in the first chapter, a number of publications have recently
initiated a new discussion about the impact of human capital, cultural diversity, and knowledge spillover in economic clusters and innovative “production environments” on regional economic performance.
Empirical analysis25 based on the Urban Audit data has shown that talent concentration, measured in terms of highly qualified working-age residents is linked with general economic output as measured by a European city’s regional GDP. Competition for highly qualified personnel seems to be particularly fierce among the second-tier economic cores (“Regional Centres”). While the analysis so far has shown that these indicators are important in explaining the overall position of cities, this section takes a look at frequency distributions of the most important indicators of knowledge and creativity, i.e. education and qualification standards, economic specialisation in creative activities, and cultural life and cultural diversity of the resident population. It uses information from the Urban Audit domains “Training and Education”, “Information Technology”, “Culture and Recreation” and “Demography”.
The following sections will describe three main subjects, firstly in relation to European regions and subsequently with regard to city types.
– Education standards and knowledge work (represented by proportion of working age population at university level, proportion of firms in ICT sector, students in university education)
– Cultural activity (represented by cinema attendance and tourist overnight stays)
25Similar to the analysis of city growth, components of urban economic prosperity were
examined by regression analysis. In a set of OLS estimations for all cities and for each basic city type, GDP per head in relation to the national average in 2004 was the de-pendent and 14 variables from different Urban Audit domains were independent variables.

89/189
– Cultural diversity (represented by the share of foreigners and the perceived standard of integration of foreigners)
In addition, the following section will attempt to use the analysis (Seidel-Schulze et al., 2009) derived from subjective information provided by the Perception Survey on quality of life in European cities (see below, Box 3) to describe foreigners’ state of integration, an important indicator for measuring “creativity” (Florida 2002). The end of this chapter will address the question to what extent the competitive position of cities depends on attracting knowledge workers engaged in innovative economic activities.
3.3.1 Education standards and knowledge-work in European cities Cities across Europe are characterised by an above-average agglomeration of
highly skilled working-age people in relation to respective national averages (Figure 28). National averages of working-age residents with university-level qualifications are somewhat higher in Northern and Western Europe (all above 10%) than in Central and Southern Europe (some above, some below 10%). The share of highly qualified people in cities varies greatly from country to country and between city types (Figure 29). While technological innovation is most prevalent in urban regions with high levels of economic activity, knowledge workers agglomerate in different types of city: not only in economic cores (Types A and B) but also in smaller cities in peripheral regions (Type C).
The results of this analysis would appear to demonstrate that the concept of the “creative class”, as defined by Florida (2002), offers a very basic explanation for a range of different types of urban economic specialisation. According to these results, highly skilled people concentrate in economically prosperous regions and prefer to live in smaller cities offering a range of assets, both in terms of personal life (e.g. more adequate surroundings for families) and economic “creativity” (e.g. in the ICT sector) ICT services – as an example of a particularly “creative” sector – are, again, more strongly represented in cities in Northern and Western Europe than in Central and Southern Europe. High agglomerations of ICT services can be observed in cities in the Netherlands, Norway, Sweden and the UK (Figure 37). They are especially concentrated among the “Regional Service Centres” (Type B1, Figure 29).
Quite interestingly, while manifold interrelationships between regional competitiveness and human capital are apparent, there is no evidence that engaging in higher education has an immediate or short-term effect on regional prosperity. There is no doubt that in the long term, Central European peripheral cities will particularly benefit from their active engagement in higher education, as this has attracted large numbers of students. As previously mentioned, since there is conclusive evidence demonstrating the role of knowledge workers in regional performance, cities must provide attractive conditions to encourage students to stay in the region after graduation.
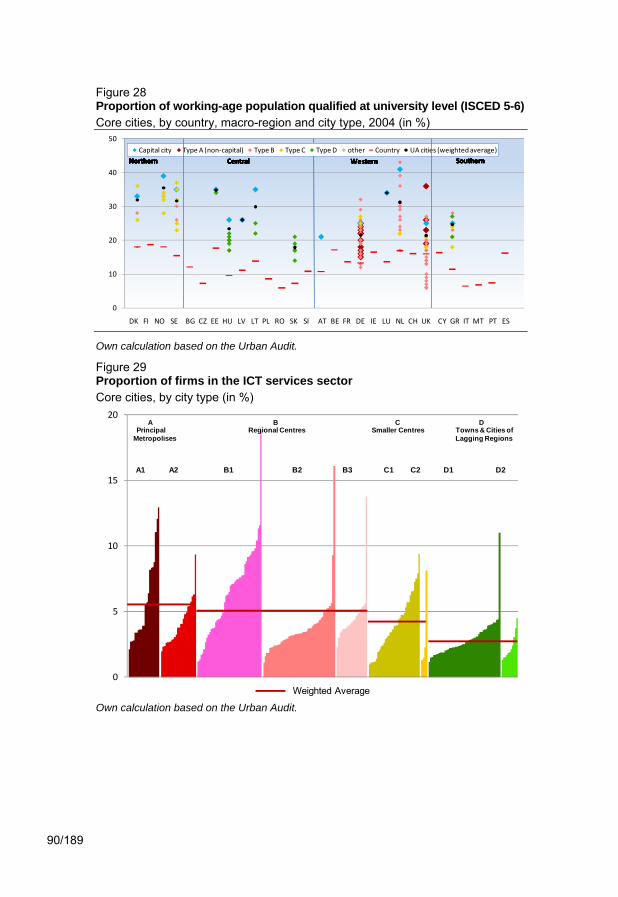
90/189
Figure 28 Proportion of working-age population qualified at university level (ISCED 5-6) Core cities, by country, macro-region and city type, 2004 (in %)
Own calculation based on the Urban Audit.
Figure 29 Proportion of firms in the ICT services sector Core cities, by city type (in %)
Own calculation based on the Urban Audit.
0
10
20
30
40
50Capital city Type A (non‐capital) Type B Type C Type D other Country UA cities (weighted average)
Northern Central Western Southern
DK FI NO SE BG CZ EE HU LV LT PL RO SK SI AT BE FR DE IE LU NL CH UK CY GR IT MT PT ES
Northern Central Western SouthernNorthern Central Western SouthernNorthern Central Western SouthernNorthern Central Western SouthernNorthern Central Western SouthernNorthern Central Western SouthernNorthern Central Western Southern
0
5
10
15
20
A1 A2 B1 B2 B3 C1 C2 D1 D2
Weighted Average
A B C DPrincipal Regional Centres Smaller Centres Towns & Cities of
Metropolises Lagging Regions

91/189
Figure 30 Students in university education (ISCED 5-6) per 1,000 inhabitants Core cities,by country, macro-region and city type
Own calculation based on the Urban Audit.
A comparative analysis of European regions reveals that the share of university students in relation to a city’s overall population varies least in Northern Europe, whereas it varies greatly from city to city across Central, Southern and Western Europe (Figure 30). Central Europe reports some of the highest national averages concerning the share of students in relation to the total population.
These findings again call for a regional economic development strategy of “smart specialisation”, in which development of close interrelations between existing firms, entrepreneurs, universities, research institutes and public administration are encouraged in order to support and develop regional strengths.
While it is very important to spend great effort in educating young academics, it is vital to develop their knowledge and creativity into a regional economic factor. In most parts of Western Europe, a reciprocal effect between economic growth and the generation and application of knowledge seems to be a characteristic of competitive cities. Still, since generation of innovation requires constant effort and is, in itself, the driving force of economic change, there is a wide scope of policy support with an urban focus even in the most prosperous regions of Europe. In Central Europe, it will be a task of cohesion policy to support local actors in identifying suitable economic sectors and developing strategies for regional knowledge-based growth.
3.3.2 Cultural activity Two Urban Audit indicators are used here to gauge cultural activity: annual
cinema attendance, which measures the activity of the resident population and tourist overnight stays, which measure the attractiveness of cities as business or leisure destinations. Cinema attendance has turned out to be an indicator of cultural activity, which is correlated with other measures of cultural life, e.g. theatre attendance, and with economic and demographic characteristics of cities.
0
100
200
300
400Capital city Type A (non‐capital) Type B Type C Type D other Country UA cities (weighted average)
Northern Central Western Southern
DK FI NO SE BG CZ EE HU LV LT PL RO SK SI AT BE FR DE IE LU NL CH UK CY GR IT MT PT ES TR
Northern Central Western SouthernNorthern Central Western SouthernNorthern Central Western SouthernNorthern Central Western SouthernNorthern Central Western SouthernNorthern Central Western SouthernNorthern Central Western Southern

92/189
Measured on the basis of cinema attendance, on average cultural activity is lowest in Central Europe, although in many cities, e.g. in Hungary and Poland, cinema attendance is higher than in a number of Western European cities (Figure 31).
Cinema attendance varies most significantly among cities in Southern and Western Europe. When comparing city types, average cinema attendance is fairly similar (about 5 visits to a cinema per year) among basic city types A, B, and C (Figure 32). Paris and Luxembourg stand out in that their populations go to the cinema on a particularly frequent basis. In smaller cities in lagging regions (Type D), cultural activity measured in this manner is considerably lower than in the other city types. The assessment of the Perception Survey on quality of life in European cities (cf. Box 3) gave rise to similar results. Residents in most cities (Types A and B) expressed greater satisfaction with their city’s cinema and theatre programmes than those living in Type D cities. It should be noted, however, that the Type D cities which featured in the Perception Survey were exclusively Central European cities.
In Southern and Western European cities, the tourist flow is far greater than in Central and Northern Europe. The highest national rate of tourist overnight stays per resident is reported by Cyprus and Malta (Figure 33), i.e. holiday destinations located in the Mediterranean Sea. In Southern Europe, most cities report below-average numbers of tourist overnight stays, i.e. tourism here is more “seaside- oriented”. In Spain, for example, Palma di Mallorca is the city with the highest number of tourist overnight stays. In Italy, Firenze and Venezia stand out as “cultural” tourist attractions with an above-average number of overnight stays. In Western Europe, tourism is more “urban”: in many cities here, tourist overnight stays per population are higher than in the countries on average. In the UK, Edinburgh stands out as a particularly attractive urban tourist destination. A comparison reveals that the number of tourist overnight stays is higher in Types A and B than in C and D. Smaller cities in lagging regions report particularly low numbers of tourist stays. Outliers are Funchal (Madeira) in Type B and Gozo (Malta) in Type D. These are seaside holiday resorts attracting a large number of “mainstream” tourists looking mainly for relaxation and not for urban cultural diversity.

93/189
Figure 31 Annual cinema attendance per resident Core cities, by country, macro-region and city type, 2004
Own calculation based on the Urban Audit.
Figure 32 Annual cinema attendance per resident Core cities, by city type, 2004
Own calculation based on the Urban Audit.
0
2
4
6
8
10
12
14
16
18Capital city Type A (non‐capital) Type B Type C Type D other Country UA cities (weighted average)
Northern Central Western Southern
DK FI NO SE BG CZ EE HU LV LT PL RO SK SI AT BE FR DE IE LU NL CH UK CY GR IT MT PT ES TR
Northern Central Western SouthernNorthern Central Western SouthernNorthern Central Western SouthernNorthern Central Western SouthernNorthern Central Western SouthernNorthern Central Western SouthernNorthern Central Western Southern
0
5
10
15
A B C DPrincipal Regional Centres Smaller Centres Towns & Cities of the
Metropolises Lagging Regions
A1 A2 B1 B2 B3 C1 C2 D1 D2
Weighted Average

94/189
Box 3 The Perception Survey on quality of life in European cities
The purpose of the Perception Survey is to enhance the database of the main Urban Audit by measuring local perceptions of the quality of life in European cities. As conducting surveys is quite an expensive task, the Perception Survey only included an initial selection of 31 Urban Audit cities in 2004 and 75 in 2006 respectively. The first survey in 2004 incorporated all capitals (EU15) and between one and three other cities in the larger Member States. The 2006 survey also included capitals and cities from the new Members States (EU27), Croatia and Turkey.
The methodology of the two surveys did not vary greatly. Gallup-Hungary conducted both surveys, carrying out phone interviews with 300 randomly selected individuals in each city in 2004; in 2006 this number increased to 500 in each city. The survey consisted of 23 questions about quality of life and satisfaction with regard to different issues (cf. European Commission 201026), i.e.
employment opportunities, housing costs, integration of immigrants, air quality and noise, cleanliness of the city public transport, green spaces and parks, safety, health services (doctors and hospitals), cities use of financial resources, and quality of life in their city in general today and in 5 years.
Respondents could choose between four categories on a scale of 1 to 4. To analyse the response to the 2006 Perception Survey in the context of this analysis, individual observations were grouped according to the four city types. Of course, the choice of cities in the Perception Survey does not by any means comprise all of the cities contained within the different city types. Nevertheless, an analysis by basic city type is possible. The number of interviews (1,007) is sufficient even in type C (Smaller Centres), which only accounts for two of the Perception Survey cities (cf. table X1 in the appendix). In addition, selected first results of the 2009 Perception Survey were analysed. Therefore, an analysis by basic city type has been conducted and used as a complementary source of information for several domains, as illustrated below.
26http://ec.europa.eu/regional_policy/themes/urban/audit/index_en.htm

95/189
Figure 33 Tourist overnight stays per resident population Core cities, by country, macro-region and city type, 20041
Own calculation based on the Urban Audit. – 1Maximum value at 39.9 (PT) not displayed
3.3.3 Cultural diversity Here, the share of non-nationals in relation to the overall population will be
applied as a measure of cultural diversity. The share of foreigners is very low in Central European cities (except for the Baltic countries, where the share of Russians is very high) (Figure 35). It is lower in Northern European countries (around 5%) than in the large countries of Western and Southern Europe (8-10% in Belgium, Germany, Greece and Spain). In Luxembourg and Switzerland, a very high share of the population is “non-national”.
In all cities there is a positive correlation between the share of foreigners and urban economic wealth, as measured by GDP per capita (r = 0.55, cf. Figure 34). A comparison of city types (Figure 36) also clearly demonstrates that economically vibrant cities attract the largest number of migrants, whereas the share of non-nationals and cultural diversity is low in peripheral locations.
In addition to the results of the previous sections, it has become clear that knowledge workers particularly agglomerate in economically successful cities. However, certain “creative” economic sectors also develop in more peripheral locations (Type C). Cultural activity and attraction of (business or leisure) tourists are central features of the core zone of the European economy (Types A and B). Furthermore, the analysis clearly reveals a close interrelationship between cultural diversity, as measured by the share of non-nationals in the resident population, and urban economic prosperity: In Europe, the most successful economic locations attract the largest number of non-national migrants.
0
4
8
12
16
20
24
28
32 Capital city Type A (non‐capital) Type B Type C Type D other Country UA cities (weighted average)
Northern Central Western Southern
DK FI NO SE BG CZ EE HU LV LT PL RO SK SI AT BE FR DE IE LU NL CH UK CY GR IT MT PT ES TR
Northern Central Western SouthernNorthern Central Western SouthernNorthern Central Western SouthernNorthern Central Western SouthernNorthern Central Western SouthernNorthern Central Western SouthernNorthern Central Western Southern

96/189
Figure 34 Economic wealth and share of foreigners in European cities 2004 Share of foreigners(in %)
GDP per head in PPS
Own calculation based on the Urban Audit. r = correlation coefficient, ***significant at 1%-level
Figure 35 Share of foreigners among total population Core cities, by country, macro-region and city type, 2004 (in %)1
Own calculation based on the Urban Audit. – 1Maximum value at 57.3 (LU) not displayed.
0
10
20
30
40Capital city Type A (non‐capital) Type B Type C Type D other Country UA cities (weighted average)
Northern Central Western Southern
DK FI NO SE BG CZ EE HU LV LT PL RO SK SI AT BE FR DE IE LU NL CH UK CY GR IT MT PT ES TR
Northern Central Western SouthernNorthern Central Western SouthernNorthern Central Western SouthernNorthern Central Western SouthernNorthern Central Western SouthernNorthern Central Western SouthernNorthern Central Western Southern
r = 0.55***

97/189
Figure 36 Share of foreigners among total population Core cities, by city type, 2004 (in %)
Own calculation based on the Urban Audit.
Of course, it is impossible here to determine the causal relation between these two indicators, i.e. to find an answer to the question if cities are competitive because they manage to attract non-national migrants, or if they attract non-national migrants because they are economically competitive. In any case, the results show that there is a close connection between the policy priorities “innovation” and “migration” as stated in the Barca (2009) report. To be attractive to international migrants, the population of regions must be tolerant to newcomers. In this respect, the results of the Perception Survey on quality of life in European Cities (cf. Box 3) shed further light on the state of integration of non-national migrants in European cities.
With regard to the statement: “Foreigners are well integrated in this city”, opinions are rather divided in Type D (Towns and Cities of the Lagging Regions) (Figure 37). On the one hand, by far the largest share of respondents in this city type are convinced that foreigners are not well integrated: 39% strongly disagree. On the other hand, a high share of respondents (21%) also strongly agree. In the case of Types A-C, the share of those who disagree, i.e. who think that foreigners are not well-integrated, is highest in Type C. However, the share of those who either strongly or somewhat agree is almost identical in all clusters (around 50%).Therefore, apart from a significantly larger group in Type D with a very strong opinion on integration problems among the resident population, i.e. in cities with a very low share of non-nationals, opinions on integration of foreigners do not vary greatly in the different types of city.
0
10
20
30
40
50
Weighted Average
A B C DPrincipal Regional Centres Smaller Centres Towns & Cities
Metropolises of theLagging Regions
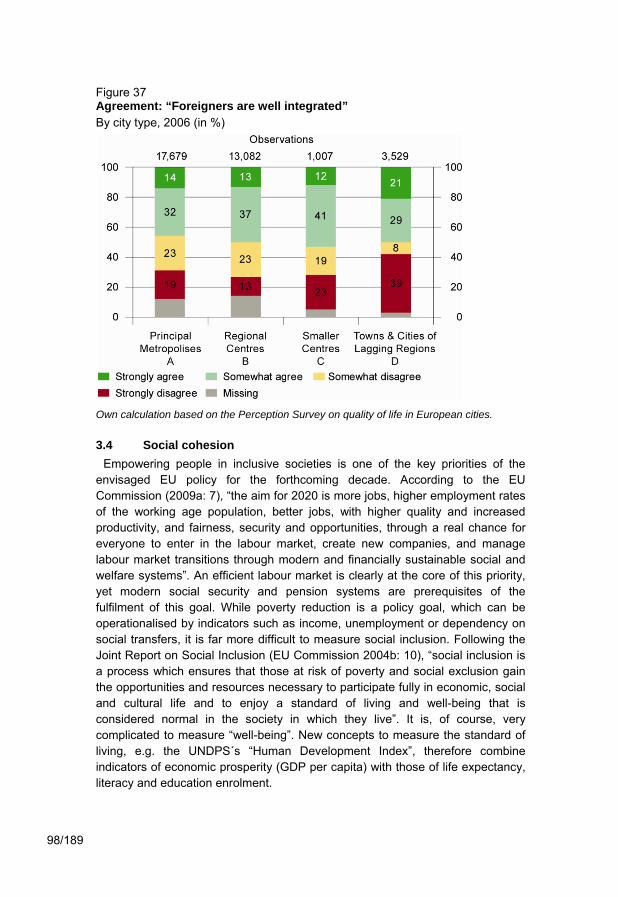
98/189
Figure 37 Agreement: “Foreigners are well integrated” By city type, 2006 (in %)
Own calculation based on the Perception Survey on quality of life in European cities.
3.4 Social cohesion Empowering people in inclusive societies is one of the key priorities of the
envisaged EU policy for the forthcoming decade. According to the EU Commission (2009a: 7), “the aim for 2020 is more jobs, higher employment rates of the working age population, better jobs, with higher quality and increased productivity, and fairness, security and opportunities, through a real chance for everyone to enter in the labour market, create new companies, and manage labour market transitions through modern and financially sustainable social and welfare systems”. An efficient labour market is clearly at the core of this priority, yet modern social security and pension systems are prerequisites of the fulfilment of this goal. While poverty reduction is a policy goal, which can be operationalised by indicators such as income, unemployment or dependency on social transfers, it is far more difficult to measure social inclusion. Following the Joint Report on Social Inclusion (EU Commission 2004b: 10), “social inclusion is a process which ensures that those at risk of poverty and social exclusion gain the opportunities and resources necessary to participate fully in economic, social and cultural life and to enjoy a standard of living and well-being that is considered normal in the society in which they live”. It is, of course, very complicated to measure “well-being”. New concepts to measure the standard of living, e.g. the UNDPS´s “Human Development Index”, therefore combine indicators of economic prosperity (GDP per capita) with those of life expectancy, literacy and education enrolment.

99/189
Barca (2009: 29-30) provides an operational definition of social inclusion “...as the extent to which, with reference to multidimensional outcomes, all individuals (and groups) can enjoy essential standards and the disparities between individuals (and groups) are socially acceptable, the process through which these results are achieved being participatory and fair”. In this report, it will not be possible to examine to what extent disparities between individuals and groups are acceptable. Yet, based on the Urban Audit indicator set and additional (subjective) information from the Perception Survey on quality of life in European cities an overview according to selected indicators of the standard of living will be given. Section 3.5 will focus on governance processes.
This section covers the various elements that comprise the Urban Audit domain “Social Aspects”, encompassing indicators concerning the social characteristics of the resident population and social and health infrastructure. It will also examine two additional indicators from the domain “Economy” (unemployment and employment rate).
A direct measure of income disparity, which is provided by the Urban Audit, the ratio between the top and bottom quintile of disposable annual household income, cannot be the main focus here, since only 73 cities reported on this indicator in both 2001 and 2004. More recent change in income disparity can, therefore, only be measured for a sub-sample of the Urban Audit. On average, this ratio decreased from 2.9 to 2.5 in the 73 cities delivering data in both years, i.e. in 2001 the top quintile of household income was 2.9 times as high as the bottom quintile; in 2004 it was 2.5 times as high. In 2004, intra-city disparities were somewhat higher than this average in the Principals Metropolises (2.6), the Smaller Centres (2.6) and in the Towns and Cities of the Lagging Regions (2.8). Disparities were below the average among the Regional Centres (2.3). Between 2001 and 2004 the ratio of income disparity remained stable in the Principal Metropolises, decreased in the Regional Centres (from 2.9 to 2.3) and Smaller Centres (from 3.4 to 2.3) and increased in the Towns and Cities of the Lagging Regions (from 2.5 to 2.8).
While this data only provides information for part of the Urban Audit cities it suggests that income disparity is not a typical “big city” problem in Europe, but an apparent characteristic of cities of very different size and in very different macro-regions. Also, while there has been an increase of income disparities among the Towns and Cities of the Lagging Regions, the overall disparity rate within these cities, which is not so much higher than among the other city types, would relativise the stark contrast between city types and macro-regions, which has been measured in absolute prosperity levels. Nevertheless, while information on intra-city income disparities is available for a representative share of “big cities” (20 out of 52), only 4 out of 82 Towns and Cities of the Lagging Regions provide the relevant information. Therefore, analysis of social cohesion in this report needs to refer to a range of more indirect measures of these issues.

100/189
3.4.1 Employment and unemployment The unemployment rate is one of the most important indicators in the field of
social cohesion. Employment represents participation in society and promotes peaceful social relations. In Northern Europe, unemployment rates are low (around 5%) (with the exception of Finland) and variation between cities is moderate. There is a very diverse picture in Central Europe. Unemployment is relatively low (below 10%) in some countries (Czech Republic, Hungary, Romania, Slovenia) and very high (around 19%) in other countries (Poland, Slovakia).
Figure 38 Unemployment rate By country, macro-region and city type, 2004 (in %)
Own calculation based on the Urban Audit.
National averages concerning unemployment also vary in Western and Southern Europe (around 5-11%) (Figure 38). It is hardly possible to decide, which level of unemployment in a city may be “acceptable”. For those who are looking for a job and cannot find adequate employment, this situation will, of course, always be inacceptable. In many countries of Central, Southern and Western Europe, there is a large number of cities with an above-average unemployment rate, which is clearly an “underutilisation of potential”, i.e. a reason for a place-based policy as defined by the Barca (2009) report.
As expected, among basic city types, unemployment is highest in cities from Type D (Towns and Cities of the Lagging Regions), among sub-types it is particularly high among the small group of Smaller Centres with Growing Population (Type C2). Accordingly, the results of the Perception Survey on quality of life in European cities (2006) show that in the Smaller Centres (basic Type C), only 12% and in the Towns and Cities of the Lagging Regions only 18% of the interviewees think it is easy to find a job in their city. In the Principal Metropolises, on the other hand, 37% think it is easy to find a job, in the Regional Centres 30%. While access to adequate employment is obviously not “easy” in most cities, the more vibrant labour markets of the larger agglomerations offer
0
10
20
30
40 Capital city Type A (non‐capital) Type B Type C Type D other Country UA cities (weighted average)
Northern Central Western Southern
DK FI NO SE BG CZ EE HU LV LT PL RO SK SI AT BE FR DE IE LU NL CH UK CY GR IT MT PT ES TR
Northern Central Western SouthernNorthern Central Western SouthernNorthern Central Western SouthernNorthern Central Western SouthernNorthern Central Western SouthernNorthern Central Western SouthernNorthern Central Western Southern

101/189
more opportunities than those of the more peripheral parts of Western Europe and the smaller cities of Central Europe.
It could be argued that in the internationally competitive “big” cities social exclusion in terms of unemployment might be displaced out of the central cities into the surrounding outer zone. Due to the process of gentrification of central city quarters in the most attractive big cities and capitals a reversal of the long-term suburbanisation process might take place, if a large shift of the more well-off population (back) into cities were about to set in. So far, however, the existing data allow no such conclusion. In the outer zones of the first- and second-tier urban agglomerations (Principals Metropolises and Regional Centres), on average, unemployment is lower than in the core cities (Figure 39).
Only in the smaller peripheral cities and in lagging regions unemployment in the outer zone is higher than in core cities. Particularly in the Towns and Cities of the Lagging Regions, where a relatively distinct overall suburbanisation process is observable (see above), the motives for out-migration might be quite different from those, which were characteristic for the population moving to the suburbs of Western European cities in the past decades, i.e. the desire for more spatious housing in a “greener” environment.
According to the results of the Perception Survey on quality of life in European cities, in 2009 it was difficult to find good housing at reasonable prices for the majority of the city population in all 17 cities from Central Europe taking part in the survey. As a whole, from all 75 cities in the survey in 2009 there are only 11 in which at least 50% thought it was easy to find good housing. While scarcity of affordable housing appears to be a problem of big cities throughout Europe, the resulting choices of household location may differ between European macro-regions and city types. As far as unemployment rates can indicate this process, so far no general large-scale replacement of the less well-off out of central cities seems to have taken place. However, if housing markets in many European cities are strained and if there is a trend of moving (back) to central city quarters, it can be expected that in many cities, to an increasing extent low-income households will be forced to settle in outer city areas. So far, more recent (2001-2004) change of average unemployment rates, however, shows no such large-scale replacement trend out of the core city areas of the very large cities. In the outer zones of Principal Metropolises, the unemployment rates on average decreased, while they increased very slightly (+0.3%-points) in the core cities. The only group to show an inner-outer divergence of average unemployment rates in this period are the Smaller Centres, where unemployment is higher and increased to a larger extent in the outer zones than in the core cities (Figures 39-40).
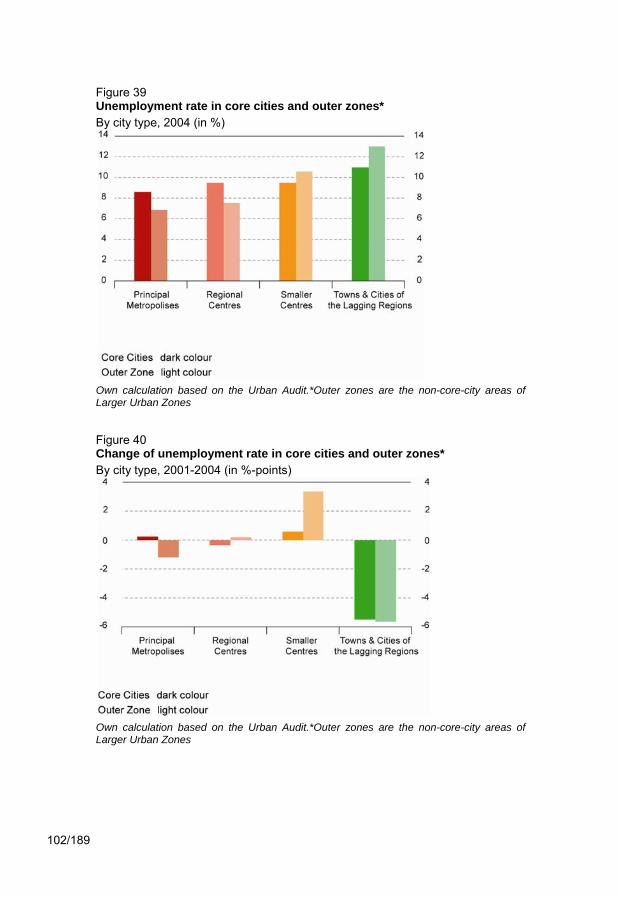
102/189
Figure 39 Unemployment rate in core cities and outer zones* By city type, 2004 (in %)
Own calculation based on the Urban Audit.*Outer zones are the non-core-city areas of Larger Urban Zones
Figure 40 Change of unemployment rate in core cities and outer zones* By city type, 2001-2004 (in %-points)
Own calculation based on the Urban Audit.*Outer zones are the non-core-city areas of Larger Urban Zones

103/189
Figure 41 Employment rate Ratio of employed persons to population of working age, by country, macro-region and city type, 2004 (in %)
Own calculation based on the Urban Audit.
Average unemployment in the Towns and Cities of the Lagging Regions decreased between 2001 and 2004, both in the core cities and outer zones. In many of the large European agglomerations, therefore, exclusion from the labour market in spite of high overall prosperity affects many working-age residents of the inner and outer urban zones. As Figure 50 reveals, particularly among the sub-types of National Capitals and Metropolises (A2) and the Regional Innovation Centres (B2) there are many cities with a relatively high unemployment rate. Among the National Capitals and Metropolises, these cities are located in Western and Central Europe. Regional Innovation Centres with an above-average unemployment rate are to be found in all European macro-regions.
An important indicator of labour market inclusion, the employment rate, represents the ratio of employed persons to the residential population of working age. As can be seen in Figure 41, the Northern European countries of Denmark, Sweden and Norway report the highest employment rates of over 70%, as do some Western European countries such as the Netherlands, Switzerland and the UK. In other parts of Europe, i.e. in Belgium, France and Germany, the national average employment rate is below 65%. In all Central European countries (with the exception of Slovenia), the average national employment rate is even lower, i.e. considerably below two thirds of the working-age population.
In a number of different types of cities from Northern, Southern and Western Europe, urban employment rates are below the national averages. With regard to social cohesion, an urban paradox is therefore apparent in that the employment rates of the resident population are relatively low in many cities, i.e. in those places where jobs are concentrated.
40
50
60
70
80
90Capital city Type A (non‐capital) Type B Type C Type D other Country UA cities (weighted average)
Northern Central Western Southern
DK FI NO SE BG CZ EE HU LV LT PL RO SK SI AT BE FR DE IE LU NL CH UK CY GR IT MT PT ES TR
Northern Central Western SouthernNorthern Central Western SouthernNorthern Central Western SouthernNorthern Central Western SouthernNorthern Central Western SouthernNorthern Central Western SouthernNorthern Central Western Southern
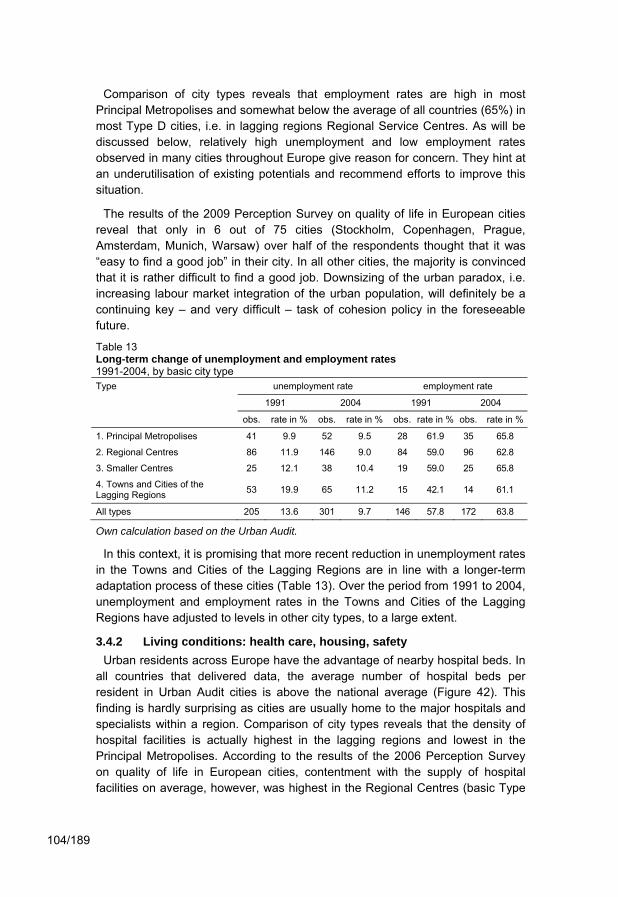
104/189
Comparison of city types reveals that employment rates are high in most Principal Metropolises and somewhat below the average of all countries (65%) in most Type D cities, i.e. in lagging regions Regional Service Centres. As will be discussed below, relatively high unemployment and low employment rates observed in many cities throughout Europe give reason for concern. They hint at an underutilisation of existing potentials and recommend efforts to improve this situation.
The results of the 2009 Perception Survey on quality of life in European cities reveal that only in 6 out of 75 cities (Stockholm, Copenhagen, Prague, Amsterdam, Munich, Warsaw) over half of the respondents thought that it was “easy to find a good job” in their city. In all other cities, the majority is convinced that it is rather difficult to find a good job. Downsizing of the urban paradox, i.e. increasing labour market integration of the urban population, will definitely be a continuing key – and very difficult – task of cohesion policy in the foreseeable future.
Table 13 Long-term change of unemployment and employment rates 1991-2004, by basic city type Type unemployment rate employment rate
1991 2004 1991 2004
obs. rate in % obs. rate in % obs. rate in % obs. rate in %
1. Principal Metropolises 41 9.9 52 9.5 28 61.9 35 65.8
2. Regional Centres 86 11.9 146 9.0 84 59.0 96 62.8
3. Smaller Centres 25 12.1 38 10.4 19 59.0 25 65.8
4. Towns and Cities of the Lagging Regions 53 19.9 65 11.2 15 42.1 14 61.1
All types 205 13.6 301 9.7 146 57.8 172 63.8
Own calculation based on the Urban Audit.
In this context, it is promising that more recent reduction in unemployment rates in the Towns and Cities of the Lagging Regions are in line with a longer-term adaptation process of these cities (Table 13). Over the period from 1991 to 2004, unemployment and employment rates in the Towns and Cities of the Lagging Regions have adjusted to levels in other city types, to a large extent.
3.4.2 Living conditions: health care, housing, safety Urban residents across Europe have the advantage of nearby hospital beds. In
all countries that delivered data, the average number of hospital beds per resident in Urban Audit cities is above the national average (Figure 42). This finding is hardly surprising as cities are usually home to the major hospitals and specialists within a region. Comparison of city types reveals that the density of hospital facilities is actually highest in the lagging regions and lowest in the Principal Metropolises. According to the results of the 2006 Perception Survey on quality of life in European cities, contentment with the supply of hospital facilities on average, however, was highest in the Regional Centres (basic Type
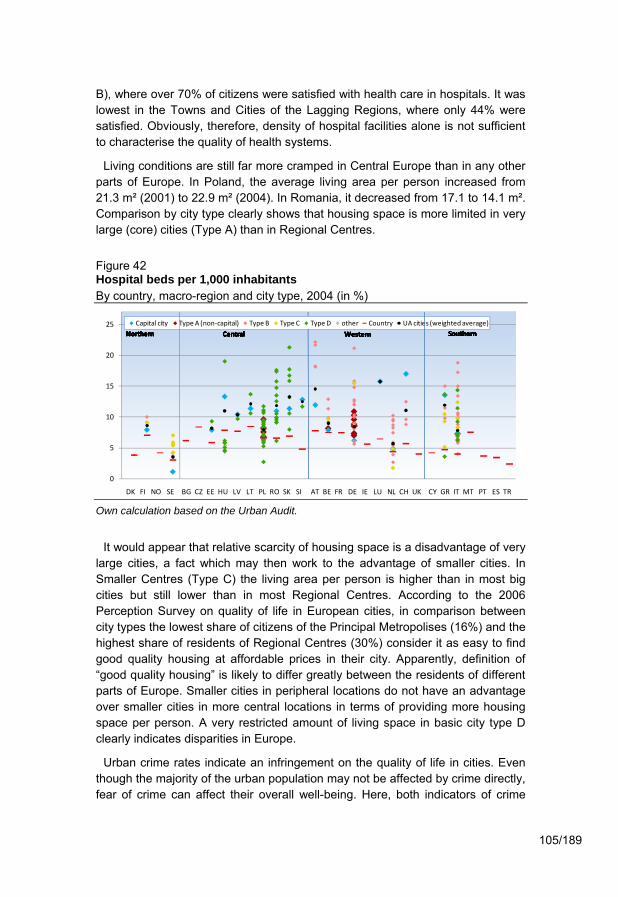
105/189
B), where over 70% of citizens were satisfied with health care in hospitals. It was lowest in the Towns and Cities of the Lagging Regions, where only 44% were satisfied. Obviously, therefore, density of hospital facilities alone is not sufficient to characterise the quality of health systems.
Living conditions are still far more cramped in Central Europe than in any other parts of Europe. In Poland, the average living area per person increased from 21.3 m² (2001) to 22.9 m² (2004). In Romania, it decreased from 17.1 to 14.1 m². Comparison by city type clearly shows that housing space is more limited in very large (core) cities (Type A) than in Regional Centres.
Figure 42 Hospital beds per 1,000 inhabitants By country, macro-region and city type, 2004 (in %)
Own calculation based on the Urban Audit.
It would appear that relative scarcity of housing space is a disadvantage of very
large cities, a fact which may then work to the advantage of smaller cities. In Smaller Centres (Type C) the living area per person is higher than in most big cities but still lower than in most Regional Centres. According to the 2006 Perception Survey on quality of life in European cities, in comparison between city types the lowest share of citizens of the Principal Metropolises (16%) and the highest share of residents of Regional Centres (30%) consider it as easy to find good quality housing at affordable prices in their city. Apparently, definition of “good quality housing” is likely to differ greatly between the residents of different parts of Europe. Smaller cities in peripheral locations do not have an advantage over smaller cities in more central locations in terms of providing more housing space per person. A very restricted amount of living space in basic city type D clearly indicates disparities in Europe.
Urban crime rates indicate an infringement on the quality of life in cities. Even though the majority of the urban population may not be affected by crime directly, fear of crime can affect their overall well-being. Here, both indicators of crime
0
5
10
15
20
25 Capital city Type A (non‐capital) Type B Type C Type D other Country UA cities (weighted average)
Northern Central Western Southern
DK FI NO SE BG CZ EE HU LV LT PL RO SK SI AT BE FR DE IE LU NL CH UK CY GR IT MT PT ES TR
Northern Central Western SouthernNorthern Central Western SouthernNorthern Central Western SouthernNorthern Central Western SouthernNorthern Central Western SouthernNorthern Central Western SouthernNorthern Central Western Southern

106/189
rates and of perceived safety will be analysed. Capital offence will be examined as an indicator of crime rates. It can be argued that in the statistics of murders and violent deaths there will be a far lower share of unreported cases than in the statistics of less serious crime. The reported figures can thus be expected to be comparable between European countries. According to this indicator, crime rates in cities vary in relation to national averages. However, the crime rate of most cities lies considerably above the national average. Measured by the number of murders and violent deaths per 1,000 inhabitants, there is relatively little variation in average crime rates between European countries (Figure 43).
Figure 43 Murders and violent deaths per 1,000 inhabitants1 By country, macro-region and city type, 2004
Own calculation based on the Urban Audit. – 1LV: including attempts of crime commitments
There is very little variation in urban murder rates between Northern European cities. In Central Europe, the urban murder rate varies a little more in Hungary, Poland and Slovakia. In Western Europe, urban murder rates exceed national averages in Belgium, Germany and Luxembourg. In the other countries, murder rates are relatively low. In Southern Europe, murder rates are very high in cities in Greece and Portugal. In fact, in Greece the average urban rate was over 30 murders per 100,000 inhabitants in 2004, while the national average was about 1. In some Italian cities, murders per 100,000 inhabitants are also relatively high (more than 10). While there are little differences between city types concerning the number of murders per resident, there is great variation within all four types. In general, although it might have been expected, no particular “big city” concentration of capital offence can be observed. At least according to this indicator, life in big cities is, therefore not more “dangerous” than in smaller cities. Perceived safety, however, is somewhat lower in the very large than in smaller cities. In the Principal Metropolises 43% of respondents to the 2006 Perception Survey on quality of life in European cities “always” feel safe in their city, in the Regional Centres 48%, in Smaller Centres 61% and in Towns and Cities of the Lagging Regions 48%. In the Perception Survey, overall safety in the city is contrasted with safety in the neighbourhood, where residents live. In
Capital city Type A (non‐capital) Type B Type C Type D other Country UA cities (weighted average)
Northern Central Western Southern
DK FI NO SE BG CZ EE HU LV LT PL RO SK SI AT BE FR DE IE LU NL CH UK CY GR IT MT PT ES TR
Northern Central Western SouthernNorthern Central Western SouthernNorthern Central Western SouthernNorthern Central Western SouthernNorthern Central Western SouthernNorthern Central Western SouthernNorthern Central Western Southern0.5
0.4
0.3
0.2
0.1
0.0
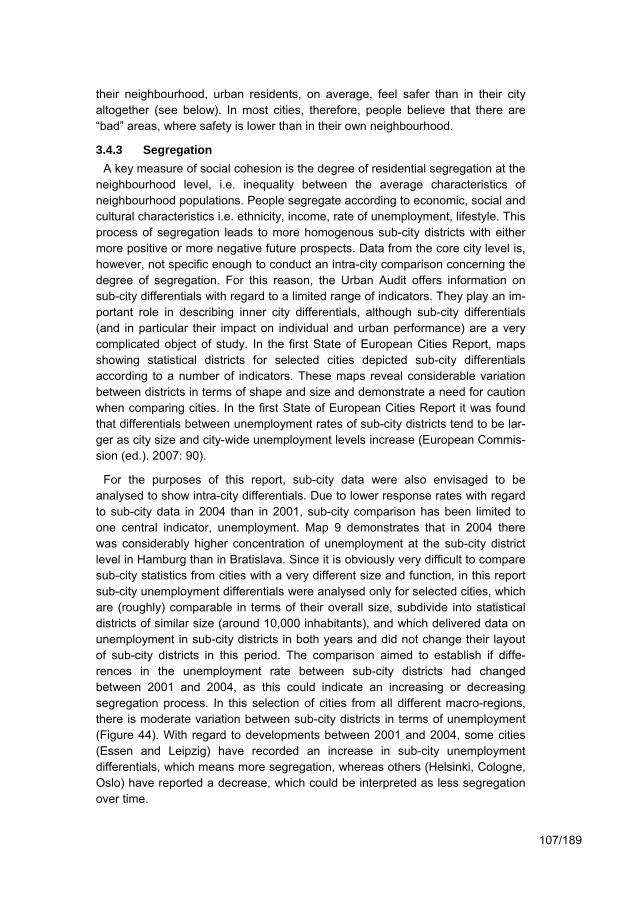
107/189
their neighbourhood, urban residents, on average, feel safer than in their city altogether (see below). In most cities, therefore, people believe that there are “bad” areas, where safety is lower than in their own neighbourhood.
3.4.3 Segregation A key measure of social cohesion is the degree of residential segregation at the
neighbourhood level, i.e. inequality between the average characteristics of neighbourhood populations. People segregate according to economic, social and cultural characteristics i.e. ethnicity, income, rate of unemployment, lifestyle. This process of segregation leads to more homogenous sub-city districts with either more positive or more negative future prospects. Data from the core city level is, however, not specific enough to conduct an intra-city comparison concerning the degree of segregation. For this reason, the Urban Audit offers information on sub-city differentials with regard to a limited range of indicators. They play an im-portant role in describing inner city differentials, although sub-city differentials (and in particular their impact on individual and urban performance) are a very complicated object of study. In the first State of European Cities Report, maps showing statistical districts for selected cities depicted sub-city differentials according to a number of indicators. These maps reveal considerable variation between districts in terms of shape and size and demonstrate a need for caution when comparing cities. In the first State of European Cities Report it was found that differentials between unemployment rates of sub-city districts tend to be lar-ger as city size and city-wide unemployment levels increase (European Commis-sion (ed.). 2007: 90).
For the purposes of this report, sub-city data were also envisaged to be analysed to show intra-city differentials. Due to lower response rates with regard to sub-city data in 2004 than in 2001, sub-city comparison has been limited to one central indicator, unemployment. Map 9 demonstrates that in 2004 there was considerably higher concentration of unemployment at the sub-city district level in Hamburg than in Bratislava. Since it is obviously very difficult to compare sub-city statistics from cities with a very different size and function, in this report sub-city unemployment differentials were analysed only for selected cities, which are (roughly) comparable in terms of their overall size, subdivide into statistical districts of similar size (around 10,000 inhabitants), and which delivered data on unemployment in sub-city districts in both years and did not change their layout of sub-city districts in this period. The comparison aimed to establish if diffe-rences in the unemployment rate between sub-city districts had changed between 2001 and 2004, as this could indicate an increasing or decreasing segregation process. In this selection of cities from all different macro-regions, there is moderate variation between sub-city districts in terms of unemployment (Figure 44). With regard to developments between 2001 and 2004, some cities (Essen and Leipzig) have recorded an increase in sub-city unemployment differentials, which means more segregation, whereas others (Helsinki, Cologne, Oslo) have reported a decrease, which could be interpreted as less segregation over time.
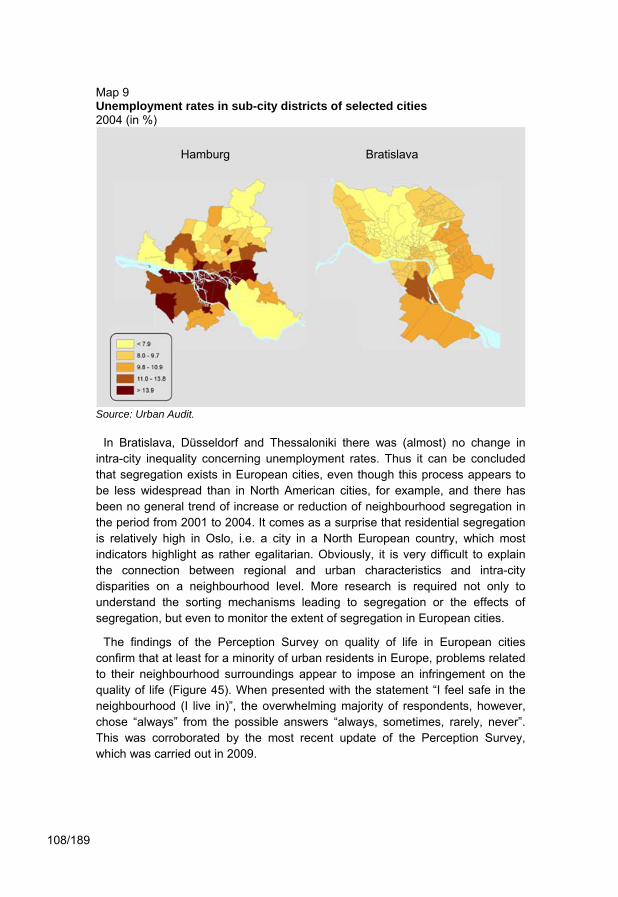
108/189
Map 9 Unemployment rates in sub-city districts of selected cities 2004 (in %)
Source: Urban Audit.
In Bratislava, Düsseldorf and Thessaloniki there was (almost) no change in intra-city inequality concerning unemployment rates. Thus it can be concluded that segregation exists in European cities, even though this process appears to be less widespread than in North American cities, for example, and there has been no general trend of increase or reduction of neighbourhood segregation in the period from 2001 to 2004. It comes as a surprise that residential segregation is relatively high in Oslo, i.e. a city in a North European country, which most indicators highlight as rather egalitarian. Obviously, it is very difficult to explain the connection between regional and urban characteristics and intra-city disparities on a neighbourhood level. More research is required not only to understand the sorting mechanisms leading to segregation or the effects of segregation, but even to monitor the extent of segregation in European cities.
The findings of the Perception Survey on quality of life in European cities confirm that at least for a minority of urban residents in Europe, problems related to their neighbourhood surroundings appear to impose an infringement on the quality of life (Figure 45). When presented with the statement “I feel safe in the neighbourhood (I live in)”, the overwhelming majority of respondents, however, chose “always” from the possible answers “always, sometimes, rarely, never”. This was corroborated by the most recent update of the Perception Survey, which was carried out in 2009.
Hamburg Bratislava

109/189
Figure 44 Sub-city differentials of unemployment Selected cities, 2001 and 2004 (Gini coefficient)*
Own calculation based on the Urban Audit. – *The Gini coefficient compares an empirical distribution with the hypothetical line of perfect equality. This line assumes that each element has the same share in the total summation of the values of a variable. The coefficient ranges from 0 to 1 (in this case 0 = identical unemployment rate in all districts, 1 = there is only one district with unemployed residents).
Among the 75 cities taking part in the survey, there are only nine (Ostrava, Istanbul, Prague, Vilnius, Riga, Bucarest, Athens, Burgas and Sofia), where not at least half of the population “always” feel safe in their neighbourhood. In Northern, Southern, and Western Europe, perceived safety in neighbourhoods barely differs between first- (Type A) and second-tier centres (Type B). Perceived neighbourhood safety is even higher in Peripheral Regions (Type III), where almost four out of five respondents “always” feel safe. In Types A-C, not one respondent reported feeling completely unsafe (i.e. “never” safe) in the neighbourhood. In Towns and Cities of the Lagging Regions (Type D), 1% of respondents “never” feel safe. A group of people thus perceive conditions in some residential neighbourhoods of the smaller cities in lagging regions as unsafe.
Additional information on the process of segregation is available from a study on German cities. An analysis based on micro-level information on household income from the German Socio-Economic Panel (GSOEP) established considerable neighbourhood-level segregation in German cities with regard to income. Yet over the entire period spanning from 1985 to 2005, the proportion of high- and low income groups27 among all households living in four different types
27High and low income groups were defined as households belonging to each year’s
highest and lowest quartile of household income.

110/189
of neighbourhood28 remained remarkably stable (Neumann 2008), i.e. inequality of average levels of household income between neighbourhoods has neither increased nor declined.
Figure 45 Statement: “I feel safe in the neighbourhood (in which I live)” By city type, 2006 (in %)
Own calculation based on the Perception Survey on quality of life in European cities.
3.4.4 Central findings and policy implications While the indicators analysed in this and the previous sections surely allow no
overall assessment of social inclusion in European cities, the results lead to a number of conclusions concerning the issues of poverty and its intra-city disparity, economic participation, integration of foreigners, and (perceived) safety.
First of all, as far as the available data on income disparity within cities allow such a conclusion, they suggest that there has been no general increase but rather a slight overall decrease of income disparity in European cities.
Measured by segregation on a neighbourhood level, the picture of intra-city disparity is highly diverse. It is very likely that by residential segregation urban poverty rates will solidify and social inclusion will be more difficult to achieve. However, just as segregation patterns differ between cities, there is no ready-
28Mixed commercial/residential areas; residential areas with mainly pre-war housing
stock; residential areas with mainly post-war housing stock; 1- and 2-family homes in residential areas.

111/189
made strategy to overcome intra-city disparities on a neighbourhood level. Recent research shows, for example, that it may be more effective to integrate neighbourhood-oriented measures into the “mainstream” of policy departments at the municipal level (e.g. social affairs, housing, economic development, town planning) than to create comprehensive “neighbourhood projects” focusing on single urban sub-districts (Robson 2004). However, the urban actions of the European Commission (URBAN I and URBAN II Community Initiatives) also demonstrate the potential leverage effect of focused "integrated" approach to urban development for the larger territorial area. In any case, only long-term urban development strategies can contribute somewhat to a reduction in neighbourhood disparity levels.
Unemployment rates differ between cities from most European macro-regions, with the exception of North Europe, where overall and urban unemployment rates are generally low. Unemployment is particularly high in smaller cities of Central Europe, but has declined there, considerably, since the beginning of the 1990s and continued to decline in the period from 2001 to 2004. In comparison between city types, unemployment is lowest in the most prosperous cities. There is no above-average concentration of unemployment in the very large cities. Regional Centres. It can, therefore, be argued that the overall agglomeration process in the European core zone is not accompanied by a simultaneously increasing degree of urban poverty or disparity, as far as the available indicators allow such generalisation.
Yet, employment rates of the resident population of all parts of Europe are relatively low in many cities. In particular, employment rates would be expected to be particularly high in the Principal Metropolises, but they are considerably higher in some of the second-tier Regional Centres. In order to secure economic prosperity and social stability, it will be a task for many of the large cities of Europe, but also for the smaller cities in lagging regions to encourage higher participation in the urban labour market among the resident population. While it can be expected that labour-oriented migration will continue to focus on large cities, smaller regional centres may find it increasingly difficult to compete for mobile workers. These cities in particular, will need to develop an overall strategy aiming both at encouraging labour market participation and entrepreneurship among the resident population and – to some extent - at attracting mobile labour and capital.
It may work to the advantage of the Regional Centres that it is easier for them to provide affordable housing, since apparently the housing situation is perceived as problematic by the urban population throughout Europe. Combination of a good quality public infrastructure, accessibility, a certain degree of economic specialisation and affordable high-quality housing may prove to be a considerable advantage of Regional Centres in competition with the large agglomerations and serve to prevent income disparity and poverty.

112/189
As it was shown by the example of hospital beds in relation to the resident population, provision of health infrastructure is an advantage of cities, which may become more of an important “pull-factor” of large and small cities in ageing societies. Since there do not appear to be very big differences between health care provision in very large and smaller cities, for many smaller cities good health sector services in combination with other aspects of the quality of life may turn into a further advantage in competition with the very large cities.
Crime is an infringement on the quality of life in cities more than in rural regions. There is, however, no direct relation between the size of an agglomeration and crime occurrence in relation to the overall population, at least as far as truly life-threatening crime is concerned. In the majority of cases, regardless of city type or size, city dwellers hence feel completely safe, where they live. On the other hand, a certain share of inhabitants feel unsafe in their surroundings, in all city types. While it is not a general urban phenomenon, for a minority of about 5-6% of the urban population, an improvement of safety would appear as a priority goal of future urban policy.
According to the Barca (2009) report, there is a particular scope for EU policy with a social inclusion objective under the priorities migration, children, skills and ageing. According to the report, an EU place-based approach can respond to the highly diverse way, in which migration flows affect places. Cohesion policy as suggested by the Barca report would support local authorities in urban and rural areas in adjusting public service in the fields of education, healthcare, transport, childcare, extension of skills, business support, urban renewal, and addressing special needs of migrants and people particularly affected by migration.
This analysis would strongly support this argument, since it was shown that attraction of foreigners is one of the factors securing urban prosperity already and is likely to improve in importance in the course of demographic ageing of European society on the one hand and increasing mobility on the other. For low-qualified outsiders, access to the European labour market is restricted. Within the EU, however, migration in the future is likely to comprise individuals representing a variety of skills. Integration of low-skilled migrants will continue to be a high priority objective for cities, for which EU support could be provided.
Since children (aged under 18) in Europe have a higher poverty risk than the total population, ensuring their social inclusion can also be considered as a core policy priority. As the Barca (2009: 147) report states, public interventions that matter for the social inclusion of children, e.g. education, housing, social services, urban planning, need to be tailored to places. In many cities, low birth rates show that cities are seen as “unfriendly” (or, perhaps, unaffordable) environments by many families with children. As mentioned before, under the conditions of demographic change it will become increasingly import for cities to ensure that the public infrastructure and the “urban landscape” provide attractive conditions for different age groups and family types, including households with children in particular. For example, cities may need help to overcome problems

113/189
arising from an increasing “demographic segregation”. In fashionable central city quarters dominated by childless working-age residents, e.g. it may be difficult to maintain public childcare facilities.
In general, as stated in the sections concerning “economy” and “knowledge”, matching the supply of skills with labour market demands will be a key task of future public policy with a particularly territorial dimension.
As the Barca (2009: 155) report maintains, there is also an obvious case of a place-based policy to combat the effects of demographic ageing. The report leaves it open if the issue should become a central concern of cohesion policy. It argues, nevertheless, that a policy for the elderly requires many innovations, which generates a significant scope for the exchange of experience and mutual learning to be ensured by the EU. Analysis in this report has given many arguments for a high priority of an increased social inclusion of the elderly in order to secure future prosperity of cities in particular.
3.5 Governance and civic involvement The first State of European Cities Report explored the administrative scope of
city governments by investigating both cities’ involvement in various policy areas and the degree of flexibility they possess when designing and implementing public sector interventions. From the outset, this kind of analysis was recognised as a challenge due to the complexity of local government structures in Europe and the lack of governance indicators and comparable data.
The current analysis aims to improve the level of knowledge about the scope of city administrations by identifying a series of governance-related indicators and to enhance the range of indicators available to analyse these questions by carrying out a survey among participants in the city panel.
The survey was concerned with the following policy fields:
– education and health services (and related funding), – development and/or management of infrastructure and network
services (water and energy supply, ICT, waste management, sustainable development) (and related funding),
– scope of urban planning and management of urban development, – ability of cities to cooperate with other cities.
As the “pioneering” nature of this task was clear from the outset, the survey was carried out as a “pilot exercise”, only involving the members of the city panel organised in preparation of this report. It is one of the aims of is part of the analysis to derive recommendations concerning the extent to which subsequent waves of the Urban Audit may comprise governance-related indicators.
This section is organised as follows: the first sub-section sketches the concept of urban governance relevant for this report. The second sub-section outlines the empirical approach. The third sub-section presents a descriptive analysis of

114/189
selected Urban Audit indicators on municipal income and expenditure. The fourth sub-section combines the different indicators using a revision of the methodical approach applied by the authors of the first report. Sub-section five shows selected results of the panel survey and the final sub-section summarises the main findings.
3.5.1 Urban governance – background and challenges Globalisation, European integration and decentralisation are processes that
affect the actions of national states, while at the same time it can be argued that today, public administrations have taken up a pro-active role in promoting economic internationalisation. Cities are, of course, bound up in these changes and must respond to the challenges posed by the resulting dislocation of traditional political communities and re-ordering of administrative levels and players.
European public policies, rules, procedures, conflict-solving mechanisms, debates and norms are now relevant to all cities in the EU. “Europeanisation” presents cities with a new structure of opportunities and incentives to engage with other players and promote their spatial or sectoral interests through both vertical and horizontal networks, i.e. those incorporating actors at the city level and those comprising different hierarchical levels of public administration. However, this process imposes new constraints, which limit cities´ political autonomy and cause a blurring of responsibilities with regard to national and regional institutions.
In this chapter, governance is used as a unitary concept, which makes reference to both “what” is done at the city level (e.g. what are the main policy fields and what financial resources are at their disposal) and “how” the city government carries out its duties (e.g. does it cooperate with citizens, professional associations, other government levels and other cities, does it adequately inform citizens and have accountability mechanisms been enforced29). Although simplistic, this distinction reflects also, to a certain extent, the dichotomy between the theoretical concepts of “government” and “governance” However, the latter term is widely used to refer to matters of both public administration and civic involvement and this generalisation will also be the practice in this section.
The institutional dimension of local government is usually regulated through constitutions or basic laws. There are several classifications of governance systems, which take different variables into account. From the point of view of central-local relations Loughlin (2004: 13-14) classifies the EU countries into federal, regionalised unitary, decentralised unitary, and centralised unitary
29The latter elements, subscribing also to the concept of “good governance”, are common
sense in some countries with a consolidated democratic system, e.g. France, while in younger democracies these good governance norms, although formally implemented, still need to be integrated into local frameworks.

115/189
systems. In each system there are one or more tiers. In accordance with the number of the governmental tiers in place, Hoorens (2008: 37-38) classifies countries in:
• two-governmental-tier-countries (one central, one sub-national): Bulgaria, Cyprus, Estonia, Finland, Lithuania, Luxembourg, Malta, Slovenia;
• three-governmental-tier-countries (one central, two sub-national): Austria, the Czech Republic, Denmark, Greece, Hungary, Ireland, Latvia, the Netherlands, Portugal, Romania, Slovakia, Sweden;
• four-governmental-tier-countries (one central, three sub-national): Belgium, France, Germany, Italy, Poland, Spain, the United Kingdom30.
These attempts at describing and analysing the relationships between the governmental tiers and the power of each of them reveal the complexity of the matter. City administrations play roles of varying importance and it is difficult to establish a clear-cut system of categorisation. Some major and capital cities are granted a special status that allows them not only to have their own institutional organisation but sometimes also to assume additional responsibilities and draw on additional resources (Hoorens 2008: 43). Furthermore, the power of a city administration is also determined by its capacity to influence regional and central government through various formal and informal arrangements. It is needless to say that operationalising these aspects by statistical indicators remains a challenging exercise.
At the city level, governance specifically relates to a city’s capacity to face the current, major challenges in a wider, i.e. national, European, global, macro-economic political/legislative framework, and the means it uses to meet them. Key issues at present are, as outlined by Lefèvre (2008):
• the vulnerability of urban economies, i.e. cities’ difficulty in maintaining their competitive position in a globalised world;
• the appeal of urban economies, i.e. maintaining a city’s appeal, a goal which currently involves a large range of diverse measures encompassing environmental and socio-cultural issues;
• cities’ ethnic and socio-cultural diversity, i.e. integrating diverse groups of foreign residents, who enrich the city but also bring specific problems with them.
In a globalised world, a city’s capacity to develop depends on its comparative and competitive advantages and the instruments individuals, firms and community have at their disposal to enhance these advantages. In light of this, it
30However, this classification does not give any indication of the influence of the municipal
level within the national government system. A more complex decentralisation index, focusing on regional and national governmental tiers, has been applied in a study by the Assembly of European Regions (AER 2009).

116/189
is paramount that city administrations possess a certain degree of autonomy and are allocated (see also Tortorella and Chiodini 2008: 182-183), powers and resources that enable them to set up an urban development strategy and make public services available to their citizens (Cittalia 2009: 84).
3.5.2 Approach The specific task of addressing the administrative and governance patterns of
European cities comprised
- a critical revision of the approach of the index of powers, an update of the analysis carried out in the first State of European Cities Report and
- an additional survey to determine (i) the mandate of city governments with regard to different policy fields, (ii) the accountability of city administrations, and (iii) the scope of internal and external co-operation.
The first major issue for statistical comparison is the degree of decentralisation in the various EU countries. Different levels and forms of decentralisation on the one hand, and different levels of spending power on the other, imply a very heterogeneous picture of European cities’ scope for decision-making and action. Furthermore, decentralisation has been the trend in virtually all EU Member States over the past 30 years, albeit in vastly different forms. It has been mainly understood as a strategy to alleviate administrative inefficiency, enhance transparency and to entrust the respective administrative tiers with the tasks they are best suited to fulfil. Supporters of decentralisation emphasise accountability, flexibility and efficiency, while opponents point out the complexity of public tasks, the risk of financial bottlenecks at sub-national levels and inefficiency due to over-bureaucracy and corruption. As a central question, it remains to be analysed what the most appropriate role is for city governments, taking into account their structure and the territory they administer, their (financial) resources and the responsibilities accorded to them.
The second issue for statistical analysis of the scope of city administrations is the notion of “power”. Power suggests more than merely financial strength and is a rather vague concept. The authors of the first State of European Cities Report defined “city power” as an index incorporating (i) the relative weight of cities in national governance systems (notably in terms of financial resources and responsibilities entrusted to cities by law) and (ii) the relative flexibility of city politics and administration to decide (i.e. the autonomy over taxation and policies affecting the respective territory). It is reasonable to maintain that this definition does not adequately encapsulate the meaning of “power”. In spite of the fact that the aforementioned issues are of enormous relevance to cities, “power” is an unsuitable description. In the literature, the term “powers” is more closely associated with the scope of a city’s entrusted authority, conveyed by budgetary

117/189
capacity, autonomy and size31. Since this concept is more suitable to the focus of this study, the following analysis will adopt the term “powers” and somewhat diversify its measurement. This comprises a more consistent qualitative interpretation of data and relationships and taking a closer look at the different components of an index of “powers”. In principle, the revised index of powers follows the approach that was outlined in the first State of European Cities Report. It is based on the components of weight and autonomy.
The index component “weight” has been defined by the following proxy variables:
- size (population), - structure and status (in the case of cities entrusted with additional
tasks in public administration, e.g. city states, or cities with less responsibility than comparable cities in a country), and
- spending power (i.e. the size of the budget and resources controlled by the city government).
The second index component, “autonomy”, was defined by the scope of autonomy with regard to taxation (control over income through local taxes) and shaping policies. The index was recalculated for this report with the data available from the 2004 Urban Audit and additional Eurostat data. The approach, as acknowledged by the authors of the first report, has major limitations. The very limited set of adequate variables related to governance and finance issues cannot do justice to the rather complex relationships determining a phenomenon such as the “powers” of city administrations32. In principle, more information about these “powers” could be gained by specific surveys. Yet, there are, of course, also soft factors such as personal attitudes or political capabilities, which may have an impact on the real “powers” of a city council, but which are very difficult to measure.
To give more depth to the analysis, a survey comprising 30 Urban Audit cities was carried out, which addresses mandate, accountability and cooperation. The following section provides the first part of the analysis by giving an overview of the relevant Urban Audit indicators, while the subsequent sections show the
31This differentiation between ‘power’ and ‘powers’ is also made by Canada’s World
(2008). 32After a further minor review (e.g. correcting the values for Weimar, Moers and some
other cities), the status adjustment was adopted from the first State of European Cities Report and addressed as a weight-associated variable (as in the first State of European Cities Report). For the overall index of powers, the values are firstly calculated by the mean of the scores of the individual variables and then cities are divided into four groups according to the quartiles of this “powers index”. Hence, the final index can take a value between one and four (cf. Table X8 in the appendix). Except for the correction factor, the scores represent a transformation of the distribution of the metrical variables into ordinal ranks according to quintiles (predefined thresholds in the case of total population). Even though these are ordinal scores the means was calculated to allow comparison with the results of the first State of European Cities Report. An additional ranking according to the index thresholds applied by the authors of the first State of European Cities Report, i.e. 1.5, 2, and 2.5, is given in the final column of Table X8 in the appendix.

118/189
results of the “city powers” analysis and the survey among city panel members. Obviously, as explained there are great limitations to an analysis of governance aspects, which is based on statistical indicators. Depending on the role of cities in administrative systems the scope of decision-makers at the city level to shape urban development may vary even among cities with a similar size and budget. Keeping these restrictions in mind, the following sections provide an update of the work from the first report and should be understood as a starting point for further investigation into the conditions and results of governance processes, which focuses on comparison between cities rather than on selected case studies, which prevail in this field of research.
3.5.3 Municipal income and expenditure In the Nordic countries (Denmark, Finland, Sweden and Norway), cities depend
more on local taxation (ranging from 40-70%) than the three other geographical regions. Of the four Nordic countries, Swedish cities acquire the largest share of their income by local taxation (Figure 46).
Figure 46 Proportion of municipal authority income derived from local taxation By country, macro-region and city type, 2004 (in %)
Own calculation based on the Urban Audit.
Variation in Central and Western Europe is much more pronounced, with local taxation rates ranging between zero and more than 70%. There is a clear distinction here between the Baltic states and other post-communist states. While in Estonia, Latvia and Lithuania, cities receive between approximately 40 and 70% from local taxation (falling exactly within the range of the Northern European countries), cities in all other countries only raise a minor share of their income locally. Western European countries exhibit a relatively heterogeneous pattern, ranging from 5% to 55%. Among the Southern Member and Non-Member States Greek and Turkish cities only derive a small share of their income from local taxation (under 10% in Greece and under 20% in Turkey), while in Italian, Spanish and Portuguese cities the local share is higher and there is greater variation between cities.
0
10
20
30
40
50
60
70
80
90Capital city Type A (non‐capital) Type B Type C Type D other Country UA cities (weighted average)
Northern Central Western Southern
DK FI NO SE BG CZ EE HU LV LT PL RO SK SI AT BE FR DE IE LU NL CH UK CY GR IT MT PT ES TR
Northern Central Western SouthernNorthern Central Western SouthernNorthern Central Western SouthernNorthern Central Western SouthernNorthern Central Western SouthernNorthern Central Western SouthernNorthern Central Western Southern
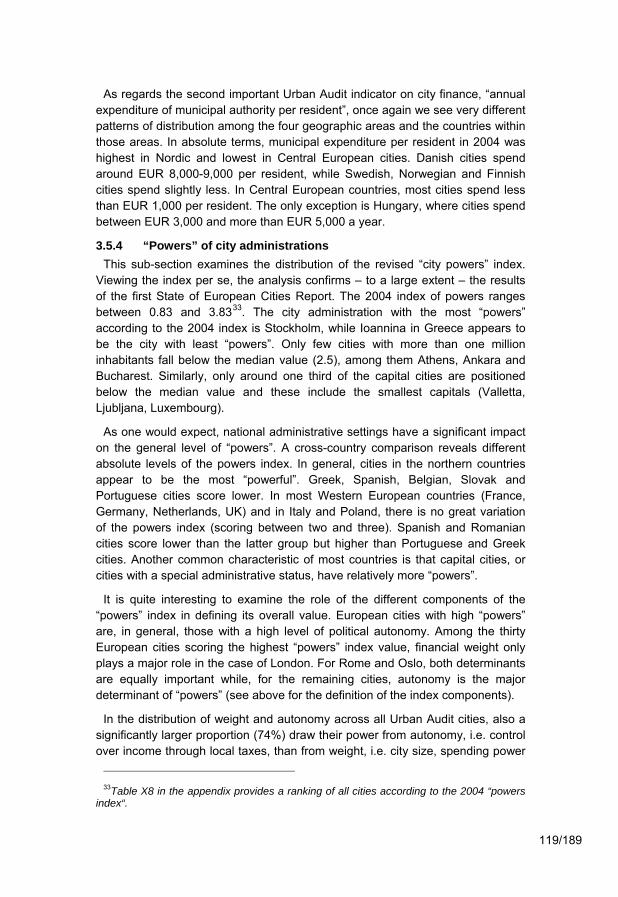
119/189
As regards the second important Urban Audit indicator on city finance, “annual expenditure of municipal authority per resident”, once again we see very different patterns of distribution among the four geographic areas and the countries within those areas. In absolute terms, municipal expenditure per resident in 2004 was highest in Nordic and lowest in Central European cities. Danish cities spend around EUR 8,000-9,000 per resident, while Swedish, Norwegian and Finnish cities spend slightly less. In Central European countries, most cities spend less than EUR 1,000 per resident. The only exception is Hungary, where cities spend between EUR 3,000 and more than EUR 5,000 a year.
3.5.4 “Powers” of city administrations This sub-section examines the distribution of the revised “city powers” index.
Viewing the index per se, the analysis confirms – to a large extent – the results of the first State of European Cities Report. The 2004 index of powers ranges between 0.83 and 3.8333. The city administration with the most “powers” according to the 2004 index is Stockholm, while Ioannina in Greece appears to be the city with least “powers”. Only few cities with more than one million inhabitants fall below the median value (2.5), among them Athens, Ankara and Bucharest. Similarly, only around one third of the capital cities are positioned below the median value and these include the smallest capitals (Valletta, Ljubljana, Luxembourg).
As one would expect, national administrative settings have a significant impact on the general level of “powers”. A cross-country comparison reveals different absolute levels of the powers index. In general, cities in the northern countries appear to be the most “powerful”. Greek, Spanish, Belgian, Slovak and Portuguese cities score lower. In most Western European countries (France, Germany, Netherlands, UK) and in Italy and Poland, there is no great variation of the powers index (scoring between two and three). Spanish and Romanian cities score lower than the latter group but higher than Portuguese and Greek cities. Another common characteristic of most countries is that capital cities, or cities with a special administrative status, have relatively more “powers”.
It is quite interesting to examine the role of the different components of the “powers” index in defining its overall value. European cities with high “powers” are, in general, those with a high level of political autonomy. Among the thirty European cities scoring the highest “powers” index value, financial weight only plays a major role in the case of London. For Rome and Oslo, both determinants are equally important while, for the remaining cities, autonomy is the major determinant of “powers” (see above for the definition of the index components).
In the distribution of weight and autonomy across all Urban Audit cities, also a significantly larger proportion (74%) draw their power from autonomy, i.e. control over income through local taxes, than from weight, i.e. city size, spending power
33Table X8 in the appendix provides a ranking of all cities according to the 2004 “powers
index“.

120/189
and administrative status. Furthermore, with regard to the cities with high “powers” (those above the median index value), 84% depend on autonomy rather than weight, whereas only 65% of cities with low “powers” (below the median index value) draw their “powers” mainly from autonomy. Initially, it may have been expected that there is a strong correlation between both sub-variables, i.e. that cities depend more or less evenly on weight and autonomy. Apparently, this is not the case.
Capitals differ from other cities in that their administrative “powers” often appear to be more dependent on weight than on autonomy. The reason could be that capital cities receive relatively larger financial contributions as they are entrusted with a greater number of tasks than ordinary cities. In such cases, the relative proportion between “weight” and “autonomy” seems to be likely to shift towards weight.
3.5.5 Modes of urban governance: survey results The survey among the members of the city panel incorporated questions about
the following governance elements34:
1. Cooperation (often called partnership) between city administration and non-public players/stakeholders (citizens, entrepreneurs, diverse associations, including foreigners), as well as other cities and conurbations, via diverse mechanisms, e.g. public consultations (through referenda, for example), ombudsman;
2. City development strategy/vision;
3. Legitimacy acquired through elections;
4. Accountability, i.e. holding policy-makers responsible;
5. Effectiveness/Efficiency: reaching objectives while making the best use of resources;
6. Coherence between policies and levels in terms of dividing and sharing the budget and responsibilities in various policy fields.
First of all, the survey results reveal a high degree of variation among the targeted cities with regard to most of the selected indicators. This confirms the existence of a great variety of administrative arrangements between the municipal, national, and – if existing – regional level within the various countries. Differences can be observed even between cities within the same national setting, such as France, for example.
Generally speaking, most cities have a strong mandate in policy fields such as water supply, waste water treatment and public transport, followed by primary
34The questionnaire is shown in the appendix.
121/189
education, culture and secondary education. Municipal authority is usually less pronounced in higher education, power supply and public health.
Accountability is distributed less diversely than mandate. Nearly all cities submit yearly income and expenditure statements and a large majority of cities prepare strategic visions and offer – to a greater or lesser extent – online services to their citizens. A smaller proportion of cities are actively involved in anti-corruption committees through their local parliaments and conduct citizens´ satisfaction surveys on a regular basis. Although citizen-elected mayors may indicate a more democratic approach towards local government, in terms of accountability, their source of legitimacy – whether elected or appointed – seems to be of little relevance, as in both cases mechanisms are in place to make them accountable for their activity. At the same time, although a number of cities have appointed a “city ombudsman” to monitor the appropriateness of municipal administrative acts, this practice has yet to be embraced across Europe.
Cooperation with NGOs is strongest in the fields of sports, cultural heritage and spatial planning and less intense in the fields of housing and public transport, while participation of non-governmental players (including individuals) is generally strong in policy consultation, moderate in policy implementation and rather limited in decisions on budget matters.
Figure 47 Involvement of citizens´ associations and commercial associations in policy matters Participation in..... (in %)
Own calculation based on survey among cities taking part in Urban Audit City Panel; 28 observations.

122/189
As may have been expected, the majority of cities surveyed often involve entrepreneurs, local citizens associations, commercial associations, chambers of commerce and trade unions in a policy’s planning and implementation phase, but to a significantly lesser extent in the financial decision-making process related to the respective policy field, i.e. in this respect, while new modes of regional governance (Fürst 2002) are being applied throughout Europe, the key position in the decision over (public) expenditure remains within the public administration (Figure 47).
Due to the increasing role of Public-Private Partnership, e.g. in infrastructure development, the role of private actors in this decision-making process may become more important in the future. It is not a trivial finding at all that so far, according to the members of the city panel, private influence on expenditure decisions in urban policy is still limited.
3.5.6 Results In this section, analysis of urban governance has focused on the scope of city
administrations to influence urban development and on modes of cooperation between city administrations and other actors (including cooperation between different city administrations or across administrative levels). Following the concept of the first State of European Cities Report, an index of “city powers” was derived from selected indicators of the Urban Audit. Apparently, the overall “powers” of cities according to this index largely depends on the national administrative setting. Within Europe, Northern European cities are those with the highest and Greek cities those with the lowest “powers”.
Size and administrative status play an important role in determining the overall “powers” of cities: almost all cities with more than one million inhabitants and most capital cities score high on the “powers” index. Yet, if the components of “weight”, i.e. size and administrative status, and “autonomy”, i.e. control over income through local taxes, are compared among all Urban Audit cities, most (non-capital) cities with a high overall “powers” index score particularly high on indicators of “autonomy” rather than “weight”. The “powers” of capital cities appear to be determined more by their “weight” within national administrative systems.
Due to the increasing role of Public-Private Partnership, e.g. in infrastructure development, the role of private actors in decisions over public expenditure may become more important in the future, even though involvement of private actors in public policy has been criticized because of the apparent lack of democratic legitimation of their action. According to the survey among city panel members, private influence on expenditure on strategic planning and policy implementation is common among European cities, yet decision about public expenditure is still predominantly confined to public administration.
The discussion about different concepts of “governance” and their policy implications in the political sciences is manifold. So far, overall measurement of

123/189
the characteristics of urban governance mechanisms is still by and large confined to individual case studies. As the analysis of selected indicators in the first and second State of European Cities Report demonstrates, however, certain aspects of the administrative setting of decision-making in urban policy can be operationalised for comparative research in the form of statistical indicators.
In comparative urban research, one issue arising from the analysis carried out in this report would be to examine if the overall administrative “powers” of cities interrelate with the degree of efficiency, in which urban policy is planned and implemented. The empirical base for such kind of analysis would ideally comprise, for example, information on the existence or non-existence of specific democratic instruments within the “local state” (such as local referenda, ombudsmen, regular reporting and audits) and on patterns of internal and external cooperation of city administrations with citizens, non-governmental organisations, conurbations or international partners.
A point to note is that in this analysis it has been very difficult for city representatives to determine the number of NGOs or other organised forms of civil society active at the city level. This might indicate that – although formal requirements are in place for public consultations and participation – the degree of genuine civic involvement in the policy-making process is lower in practice than in theory. It is advisable to extend the spectrum of quantifiable and harmonised information about the partnership between public administration and civil society and its impact on municipal government activity and, ultimately, performance. However, such an enhancement of the empirical base for the study of governance mechanisms would have to be conducted within a wider framework than the specifically defined objectives of the analysis carried out in preparation of this report.
3.6 Environment In order to assess different aspects of the environment, this chapter deals with
land use, air quality, environmental protection and commuting behaviour. Most of the indicators used for the analyses stem from the Urban Audit domains “Environmental Aspects” and “Travel & Transport”. Although some of aspects discussed in this chapter may be handled best at levels below the EU-level, “measures can be supported and strengthened by an integrated and coordinated approach at EU level“ as argued in the white paper on climate change (European Commission 2009c: 6). It would therefore be a task of cohesion policy to coordinate local measures aimed at adapting to climate change, since these are interdependent and extend across national borders (cf. Barca 2009: 138). This report can provide information, which may be useful for the preparation of an approach to improve coordination of local measures aiming at adapting to climate change by carrying out a survey of the environmental situation and environmental treatment in cities and countries across Europe, based on selected indicators from the Urban Audit. The observation here is based on indicators from the domains “Environmental Aspects” and “Travel & Transport”.

124/189
Analysis of the environmental situation is based on the indicators of land use, population density and air pollution; environmental treatment is measured on the basis of modes of waste treatment and transport.
3.6.1 Land use The analysis of the environmental situation in European cities starts with an
assessment of land use in all Urban Audit cities35. It is apparent that it is mainly the share of green space area that rises with total land area of the core cities, while housing and recreational area show only a small positive relationship (Figure 48)36. Note that this result tells little about accessibility of green areas, because it simply roots in different delimitations of core city areas, with some core cites comprising mainly of dense residential areas, while others include more green areas. The presence and preservation of green space influences the quality of life in the urban environment, particularly in areas of high housing density. Green space provides room for recreation and represents natural habitats, giving room for urban biodiversity (EU Commission 2004c). Green space may also lead to a reduction of the concentration of air pollutants such as PM10, leading to better air quality in cities with larger areas of green space [cf. 3.6.2].
Among the European regions, net residential density, i.e. the number of persons per land area used for housing, is lowest in Northern Europe and somewhat higher in the other parts of Europe. Not surprisingly, as far as national average values are available, net residential density is above the respective national averages in cities. Comparison for net residential density reveals that density is lowest by far in Smaller Centres (Type C), but relatively high in Type D (Figure 49). This picture changes to much lower densities, when comparing overall population density across Europe. A higher population density in cities compared to national averages is characteristic of urban settlements (Figure 50). A number of cities in Greece, Romania and Spain report the highest population densities among all European cities (up to 24,000 residents per km²).
In the vast majority of cities in all types, population density is below 5,000 inhabitants per km². However, there are some exceptions with more than 10,000 inhabitants per km². It is clear that relatively large housing area space per resident is characteristic of the more peripheral cities of type C.
35This section refers to the core city, since key indicators on air quality and waste
treatment are not available and land use indicators are only reported for a smaller number of cities at the LUZ level. In the Urban Audit, the core city is defined as the administrative town. In some cases, e.g. in France, where the corresponding administrative unit is small in area, alternative core city definitions have been applied (cf. European Communities 2004: 10). Since inadequate variation in “city” concepts is thus avoided, the available information on land use will be analysed here, even though difficulties in cross-country comparison need to be kept in mind.
36Besides green space, Figure 49 contains information on the size of the residential area. When comparing residential area and total land area, it becomes clear that the population density figures “net residential density” and “population density”, which are based on these differently defined areas, will differ greatly.

125/189
Figure 48 Distribution of land use among Urban Audit Cities Total land area and selected types of land use in core cities, 2004, by size class of total land area (average values, in km²)
Own calculation based on the Urban Audit. Bars in this graph overlap, i.e. the total land area in the biggest class is on average well above 600 square kilometres, green space is about 250 square kilometres and housing/residential area around 100 square kilometres. The smallest land area in the biggest class is used for recreational and sports purpose (around 50 square kilometres). Cities with no information on green space or with total land area larger 1000 square kilometres (Badajoz, Córdoba, Jönköping, Linköping, Örebrö, Roma, Tromsø, Umeå, Uppsala) are excluded.
However, congestion in the economic core agglomerations is not such a locational disadvantage that it leads to a flow of people and firms out of the core economic zone of Europe to the less densely populated peripheral zones. This congestion may lead to higher NO2 concentrations in denser areas. At the same time, higher density can help to preserve green space as it may prevent urban sprawl. It also enables cities to provide public transport and other public infrastructure more efficiently compared to the low density case.
0 200 400 600selected types of land use in km² on average
479 - 1000
221 - 478
131 - 220
80 - 130
7 - 79
size
cla
sses
(tot
al la
nd a
rea
in k
m²)
recreational and sports area housing/residential areagreen space total land area
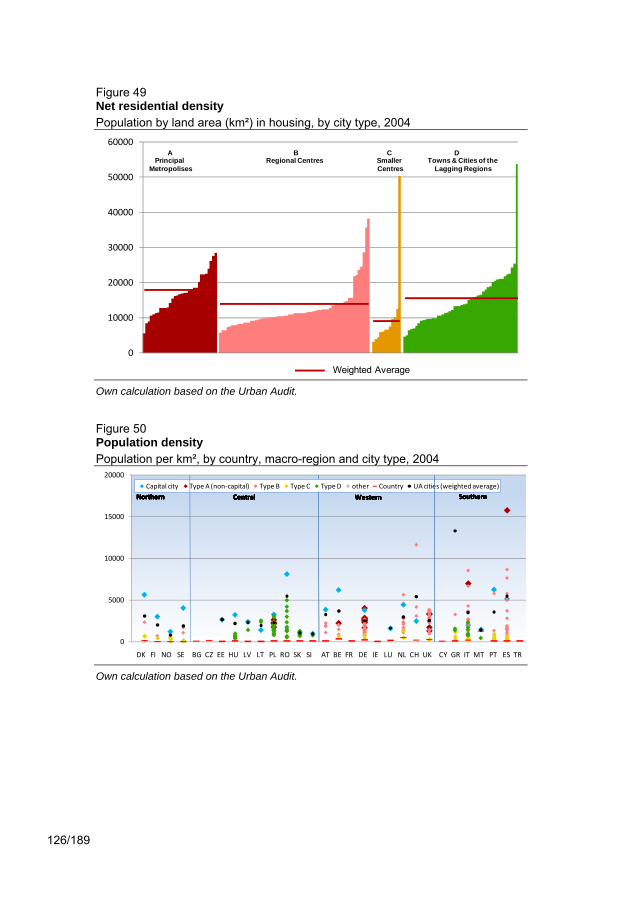
126/189
Figure 49 Net residential density Population by land area (km²) in housing, by city type, 2004
Own calculation based on the Urban Audit.
Figure 50 Population density Population per km², by country, macro-region and city type, 2004
Own calculation based on the Urban Audit.
0
10000
20000
30000
40000
50000
60000A B C D
Principal Regional Centres Smaller Towns & Cities of theMetropolises Centres Lagging Regions
Weighted Average
0
5000
10000
15000
20000Capital city Type A (non‐capital) Type B Type C Type D other Country UA cities (weighted average)
Northern Central Western Southern
DK FI NO SE BG CZ EE HU LV LT PL RO SK SI AT BE FR DE IE LU NL CH UK CY GR IT MT PT ES TR
Northern Central Western SouthernNorthern Central Western SouthernNorthern Central Western SouthernNorthern Central Western SouthernNorthern Central Western SouthernNorthern Central Western SouthernNorthern Central Western Southern

127/189
3.6.2 Air quality In terms of air pollution, two indicators will be analysed: NO2 and PM10
concentrations. Nitrogen Dioxide (NO2) pollutes the air mainly as a result of road traffic and energy production. For NO2, an hourly limit value of 200 micrograms/m3 has been set not to be exceeded more than 18 times a calendar year (European Parliament 2008). The effect of PM10 (particulate matter measuring less than 10µm in diameter) on human health has become apparent in recent years. PM10 concentration has been the subject of studies in most industrialised countries, especially in urban centres. There is some evidence that air pollutants and particularly smaller particles (PM2.5) have a negative influence on health inasmuch as they go hand in hand with higher mortality during long-time exposure (COMEAP 2009). In a conservative estimation, “ the average loss of life expectancy due to particulate matter in 2000 was estimated at approximately nine months for the EU countries where estimates were available based on modelling” (EEA 2007). For PM10, a limit value of 50 micrograms/m3 has been set not to be exceeded more than 35 times a calendar year (European Parliament 2008). The main sources of PM10, based on anthropogenic activities, are private households, energy producers, industrial plants and road traffic.
Table 14 Air pollution: UA cities with the highest number of days per year of poor air quality 2004 PM10 concentrations exceed 50 µg/m³ Days 1. Gaziantep (TR) 246
2. Thessaloniki (GR) 208
3. Miskolc (HU) 201
4. Kayseri (TR) 201
5. Denizli (TR) 200
6. Tirgu-Mures (RO) 194
7. Timişoara (RO) 186
8. Lefkosia (CY) 183
9. Athens (GR) 174
10. Torino (IT) 173
250 observations
Source: Urban Audit.
Table 14 shows the Urban Audit cities with the highest number of days of poor air quality with regard to PM10 concentrations. As the first State of European Cities Report established on the basis of the Urban Audit 2001, these indicators reveal that the highest pollution levels are to be found in Southern and Central European cities (cf. also Figure 51).

128/189
Figure 51 Population density and NO2 concentration 2004
Own calculation based on the Urban Audit. Includes: AT BE CH DE DK EE ES FI GR HU IT LT LV NL NO PL PT RO SE SI SK UK. r = correlation coefficient, ***significant at 1%-level
Figure 52 Number of days PM10 concentrations exceed 50 µg/m³ By country, macro-region and city type, 2004
Own calculation based on the Urban Audit.
0
20
40
60
80
100
0 5000 10000 15000 20000
0
50
100
150
200
250Capital city Type A (non‐capital) Type B Type C Type D other Country UA cities (weighted average)
Northern Central Western Southern
DK FI NO SE BG CZ EE HU LV LT PL RO SK SI AT BE FR DE IE LU NL CH UK CY GR IT MT PT ES TR
Northern Central Western SouthernNorthern Central Western SouthernNorthern Central Western SouthernNorthern Central Western SouthernNorthern Central Western SouthernNorthern Central Western SouthernNorthern Central Western Southern
r = 0.34***
population per km²
Annual average concentration of NO2 (µg/m3)

129/189
Concentration of NO2 is connected to population density, as Figure 52 suggests. Although this interrelation is driven by a relatively small number of very densely populated cities, it can be observed that in denser cities, the concentration of NO2 is higher than in cities with lower density.
Besides NO2 concentrations, as explained PM10 concentrations play an important role for urban air quality. In general, Northern and Western European cities report far fewer days on which PM10 values exceed 50 µg/m3 than cities in Southern and Central Europe. With some exceptions, all Northern and Western European cities record fewer than 50 days per year (Figure 52). In Southern and Central European countries, at least half of the cities in each country report PM10 concentration levels exceeding 50µg/m3 on more than 50 days per year. Some cities in Cyprus, Italy and Greece (Athens, Nicosia, Milan, Naples, Turin, Thessaloniki) still rank among the cities with the highest levels of air pollution. Cities from Poland and Romania are new entrants to this “top 10”. A monitoring process has been implemented, encompassing a Europe-wide selection of 32 cities, and a report by Berrini and Bono (2007) has provided an initial analysis of the situation. In their analysis, it is also mainly Southern European Cities that rank among the cities with the highest NO2 and PM10 concentrations in 2006/200737. Further research into the air quality of European cities and the interrelationship with the behaviour of people, firms and public administration is clearly necessary if we are to formulate concrete recommendations concerning strategies to improve environmental conditions. The existing evidence shows that air quality was unhealthy in one out of two days throughout 2004 in many cities, particularly in Central and Southern Europe.
A comparison reveals that air pollution also varies greatly within city types. Among the Principal Metropolises, Nicosia (CY), Athens (GR), Bucharest (RO), Krakow (PL) and Milan (IT) report the highest number of days with high PM10 concentration, while Edinburgh, Luxembourg and Copenhagen report the lowest. Type B and C contain the highest share of cities (about two thirds of all cities) which have recorded a very low number of days with high PM10 concentration (less than 25 days). Urban environment can slightly mitigate high PM10 concentrations, as Figure 53 suggests. There is a negative and significant relationship between the annual average concentration of PM10 and the proportion of green space in relation to total land area in the core city. This relationship remains even significant, when controlling for country and weather effects in a regression.
It is not only natural resources in form of green space that go hand in hand with lower PM10 values, but also climatic conditions. Figure 54 suggests (using a
37A difference is that in their study London and Paris also rank among the cities with bad
air quality. The use of a different indicator (annual means) in the case of NO2 concentration may explain the difference in results.

130/189
cross-median band to smooth the number of days of rain by calculating medians for equal intervals of cities along the abscissa) that those cities with fewer days of rain are the cities that exceed the 50 µg/m³ threshold for PM10 more often.
Figure 53 Green space and PM10
2004
Own calculation based on the Urban Audit. Includes: AT BE CH DE DK EE ES FI IE IT LT NL PL RO SE SI SK UK. r = correlation coefficient, ***significant at 1%-level
Thus air pollution is not per se a problem of large urban settlements; it is
obviously dependent on the way in which the environment is treated (in addition to natural conditions, which are highly influential, e.g. location in a mountain valley or on the coast) and on climatic conditions. The subjective assessment of air pollution confirms the aforementioned findings. According to the 2009 Perception Survey on quality of life in European cities, in 51 out of 75 cities over half of the respondents view air pollution and in 55 out of 75 cities view noise as big problems of their cities.
3.6.3 Environmental protection Waste and many waste treatment techniques pose a threat to the environment.
Therefore, the main objective of any environmental protection approach targeted at waste must be to prevent waste. Also, there is a direct link between waste management and adaption to climate change, since it has been shown that waste management can contribute to a reduction in greenhouse gas emissions (EEA 2008).
0
20
40
60
80
0 60 80 1004020
r = -0.27***
share of total land area in green space (in %)
Annual average concentration of PM10

131/189
Figure 54 Days of rain and PM10 2004
Own calculation based on the Urban Audit. Includes: AT CH CY DE DK EE ES FI HU IE IT NO PL PT SE SI SK TR UK. r = correlation coefficient, ***significant at 1%-level
Figure 56 shows commercial and domestic waste per head as a national average of the Urban Audit cities for the years 2001 and 2004. The cities in some European countries, such as Lithuania and Estonia, have reduced the tons of waste per head considerably between 2001 and 2004. Others, such as the Czech Republic have very low levels anyway, while other countries, such as Slovakia have very high levels of solid waste per head. However, because commercial waste is included, these figures have to be interpreted with care.
In case that waste cannot be prevented in the first place, it has to be treated or disposed of afterwards. The Urban Audit indicators differentiate between a range of waste disposal and treatment methods, including landfill, incineration and recycling. Landfill is the most common waste disposal method in European cities (Figures 56 and 57).
r = -0.46***
Days PM10 concentrations exceed 50 µg/m³
days of rain per annum
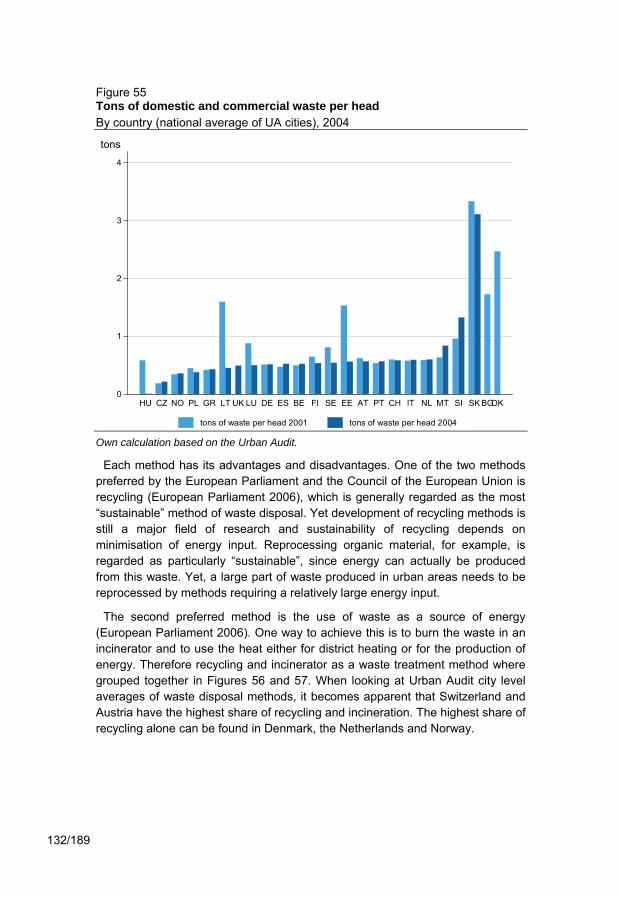
132/189
Figure 55 Tons of domestic and commercial waste per head By country (national average of UA cities), 2004
Own calculation based on the Urban Audit.
Each method has its advantages and disadvantages. One of the two methods preferred by the European Parliament and the Council of the European Union is recycling (European Parliament 2006), which is generally regarded as the most “sustainable” method of waste disposal. Yet development of recycling methods is still a major field of research and sustainability of recycling depends on minimisation of energy input. Reprocessing organic material, for example, is regarded as particularly “sustainable”, since energy can actually be produced from this waste. Yet, a large part of waste produced in urban areas needs to be reprocessed by methods requiring a relatively large energy input.
The second preferred method is the use of waste as a source of energy (European Parliament 2006). One way to achieve this is to burn the waste in an incinerator and to use the heat either for district heating or for the production of energy. Therefore recycling and incinerator as a waste treatment method where grouped together in Figures 56 and 57. When looking at Urban Audit city level averages of waste disposal methods, it becomes apparent that Switzerland and Austria have the highest share of recycling and incineration. The highest share of recycling alone can be found in Denmark, the Netherlands and Norway.
0
1
2
3
4
HU CZ NO PL GR LT UK LU DE ES BE FI SE EE AT PT CH IT NL MT SI SK BGDK
tons of waste per head 2001 tons of waste per head 2004
tons

133/189
Figure 56 Proportion of domestic and commercial solid waste disposal methods By country (national average of UA cities), 2004 (in %)
Own calculation based on the Urban Audit.
Figure 57 breaks these numbers down to the city level (albeit only cities with a core city population of over 250 000). Zürich and some German cities have the highest share of incineration plus recycling, without using landfill as a waste disposal method. The highest share of recycling alone can be found in Dresden, Valencia and Alicante.
The least preferable option among the waste disposal methods is landfill, although landfill surely comprises a range of methods (e.g. open dumping, sealed and recultivated landfill) with different environmental implications. In many countries in Northern and Western Europe as a whole (Denmark, Sweden, Norway, Austria, Belgium, Germany, Luxembourg, the Netherlands, Switzerland), only a very small proportion of all solid waste is processed by landfill, while this share is considerably higher in many cities. In most Central European Countries, over 80% of solid waste is still processed by landfill, although in a number of cities this figure is considerably lower. In Southern Europe, Portugal and Spain dispose a large amount of their waste in landfills (Figure 57).
0
100
80
60
40
20
MT LT HU LV CZ PL SK UK SI PT EE ES FI IT DE SE NL BE NO AT CH DK
landfill other methodsincinerator recycling
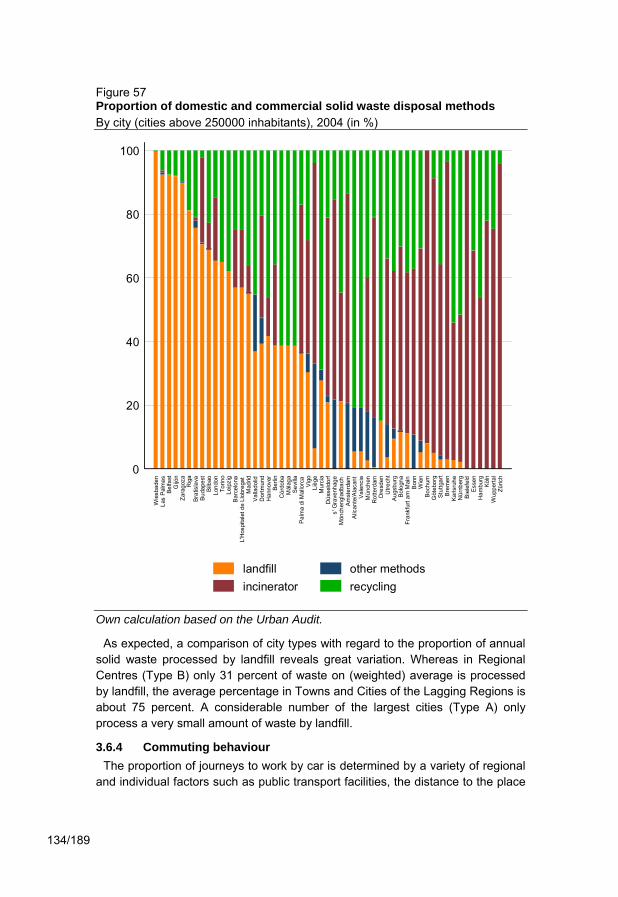
134/189
Figure 57 Proportion of domestic and commercial solid waste disposal methods By city (cities above 250000 inhabitants), 2004 (in %)
Own calculation based on the Urban Audit.
As expected, a comparison of city types with regard to the proportion of annual solid waste processed by landfill reveals great variation. Whereas in Regional Centres (Type B) only 31 percent of waste on (weighted) average is processed by landfill, the average percentage in Towns and Cities of the Lagging Regions is about 75 percent. A considerable number of the largest cities (Type A) only process a very small amount of waste by landfill.
3.6.4 Commuting behaviour The proportion of journeys to work by car is determined by a variety of regional
and individual factors such as public transport facilities, the distance to the place
0
100
80
60
40
20
Wie
sbad
enLa
s Pa
lmas
Belfa
stG
ijón
Zara
goza
Rig
aBr
atis
lava
Buda
pest
Bilb
aoLo
ndon
Torin
oLe
ipzi
gBa
rcel
ona
L'H
ospi
tale
t de
Llob
rega
tM
adrid
Valla
dolid
Dor
tmun
dH
anno
ver
Berli
nC
órdo
baM
álag
aSe
villa
Palm
a di
Mal
lorc
aVi
goLi
ège
Mur
cia
Düs
seld
orf
s' G
rave
nhag
eM
önch
engl
adba
chAm
ster
dam
Alic
ante
/Ala
cant
Vale
ncia
Mün
chen
Rot
terd
amD
resd
enU
trech
tAu
gsbu
rgBo
logn
aFr
ankf
urt a
m M
ain
Bonn
Wie
nBo
chum
Göt
ebor
gSt
uttg
art
Brem
enKa
rlsru
heN
ürnb
erg
Biel
efel
dEs
sen
Ham
burg
Köln
Wup
perta
lZü
rich
landfill other methodsincinerator recycling
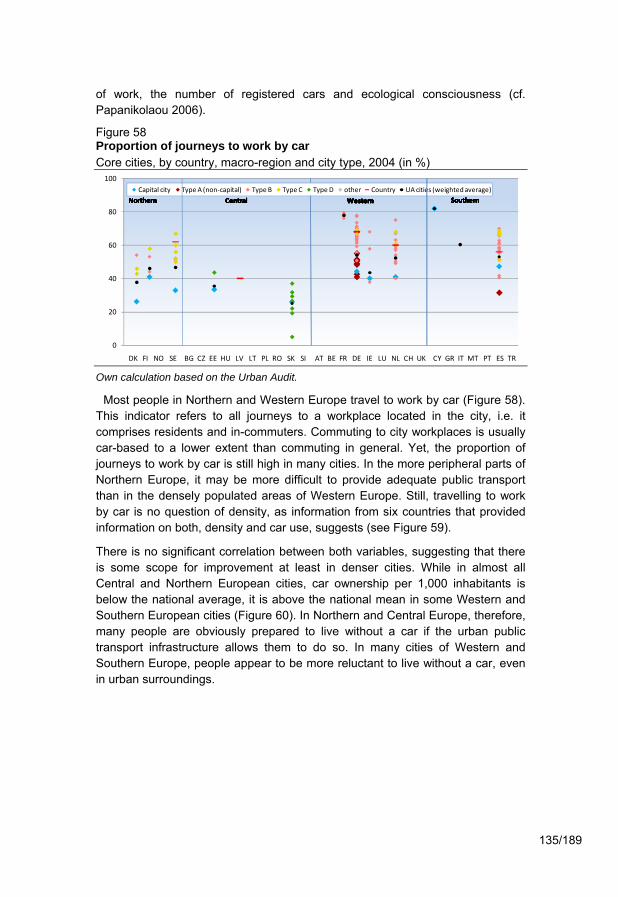
135/189
of work, the number of registered cars and ecological consciousness (cf. Papanikolaou 2006).
Figure 58 Proportion of journeys to work by car Core cities, by country, macro-region and city type, 2004 (in %)
Own calculation based on the Urban Audit.
Most people in Northern and Western Europe travel to work by car (Figure 58). This indicator refers to all journeys to a workplace located in the city, i.e. it comprises residents and in-commuters. Commuting to city workplaces is usually car-based to a lower extent than commuting in general. Yet, the proportion of journeys to work by car is still high in many cities. In the more peripheral parts of Northern Europe, it may be more difficult to provide adequate public transport than in the densely populated areas of Western Europe. Still, travelling to work by car is no question of density, as information from six countries that provided information on both, density and car use, suggests (see Figure 59).
There is no significant correlation between both variables, suggesting that there is some scope for improvement at least in denser cities. While in almost all Central and Northern European cities, car ownership per 1,000 inhabitants is below the national average, it is above the national mean in some Western and Southern European cities (Figure 60). In Northern and Central Europe, therefore, many people are obviously prepared to live without a car if the urban public transport infrastructure allows them to do so. In many cities of Western and Southern Europe, people appear to be more reluctant to live without a car, even in urban surroundings.
0
20
40
60
80
100Capital city Type A (non‐capital) Type B Type C Type D other Country UA cities (weighted average)
Northern Central Western Southern
DK FI NO SE BG CZ EE HU LV LT PL RO SK SI AT BE FR DE IE LU NL CH UK CY GR IT MT PT ES TR
Northern Central Western SouthernNorthern Central Western SouthernNorthern Central Western SouthernNorthern Central Western SouthernNorthern Central Western SouthernNorthern Central Western SouthernNorthern Central Western Southern

136/189
Figure 59 Population density and proportion of journeys to work by car Core cities, 2004
Own calculation based on the Urban Audit. Includes: DE EE FI IE NL SE SK, r = correlation coefficient
Figure 60 Number of registered cars per 1,000 population Core cities, by country, macro-region and city type
Own calculation based on the Urban Audit.
0
200
400
600
800
1000Capital city Type A (non‐capital) Type B Type C Type D other Country UA cities (weighted average)
Northern Central Western Southern
DK FI NO SE BG CZ EE HU LV LT PL RO SK SI AT BE FR DE IE LU NL CH UK CY GR IT MT PT ES TR
Northern Central Western SouthernNorthern Central Western SouthernNorthern Central Western SouthernNorthern Central Western SouthernNorthern Central Western SouthernNorthern Central Western SouthernNorthern Central Western Southern
r = 0.02
Proportion of journeys to work by car (in %)
population per km² in residential areas

137/189
In a number of Central, Southern and Western European countries (Hungary, Latvia, Slovakia, Slovenia, Italy, Spain, Belgium, Ireland), the highest urban car ownership rate is reported by capital cities, even though, arguably, public transport systems will be particularly well-functioning in these cities and parking space is scarce. Car ownership is known to be a general prosperity indicator and, apparently, the desire to own a car is high even among the residents of densely populated urban areas.
Only further improvements to intra-regional public transport systems are likely to be able to encourage more citizens of Western and Southern European cities to make greater use of public transport for commuting and leisure purposes, even if they own a car.
The analysis in this section provided, firstly, an assessment of the air quality in relation to other characteristics of urban settlements. Due to obvious (but limited) self-cleaning capacities of the atmosphere, depending on regional climatic conditions (e.g. rainfall), there is some scope to improve the air quality and biodiversity within cities by implementing a land-use planning, which allocates a certain share of the urban area to green space. Depending on climatic conditions, green space should provide corridors for the inflow of fresh air into cities. Yet, even though land-use planning may support the self-cleaning capacities of urban environments, adaption to climate change obviously requires reduction of pollutant emission. Great variation of urban air pollution within countries, especially in Central and Southern Europe reveals that it is highly advisable for EU policy to coordinate measures between cities and across countries in order to meet the targets of emission reduction, e.g. a 20% cut by 2020. In EU policy, efforts to reduce greenhouse gas emissions are closely linked with those to increase the share of renewable energy and to improve energy efficiency (EEA 2009a). In the past decades, EU policy has contributed to a considerable cut in pollutant emission. However, as the survey based on the Urban Audit shows, continuous effort is necessary to improve the environmental situation. While these efforts affect European society as a whole, the results need to be monitored particularly closely in cities, where pollutant emission concentrates.
The second part of this section was concerned with variation in environmental treatment. Comparison between countries, macro-regions and city types reveals that there is, of course, no conflict between an increase in prosperity and adaption to climate change. In fact, as far as waste treatment is concerned, the highest recycling rates are to be found in some of the most prosperous cities of Europe. It is clearly possible to overcome the “paradox of affluence” (EEA 2009b) caused by the environmental impact of the production of goods and services. As the European Environment Agency states: “The more successful mitigation efforts are in cutting emissions, the less extensive our need for adaption” (EEA 2009a: 11). Following the argumentation of the EEA (2009b: 80), even though the objectives of cohesion policy are clear, in some cases projects

138/189
supported by EU Structural Funds may cause unintended side-effects. For example, measures to increase accessibility and traffic flows may exacerbate problems of noise and air pollution. Assessing the positive and negative effects of cohesion policy, including its environmental impact, is therefore an ongoing task.
The results shown in this section suggest a strong case for a support of international cooperation in developing strategies to adapt urban environments to climate change within a strong urban focus of EU policy. A guideline to this policy has been provided by the Thematic Strategy on the Urban Environment (European Commission 2006c) as well as the Leipzig Charter on Sustainable European Cities (Informal Ministerial Meeting on Urban Development and Territorial Cohesion 2007).

139/189
4. Conclusions This chapter highlights the findings of the analysis and points out the
implications regarding key priorities of EU policy. Key messages are emphasised as “headlines”.
Urban Audit typology provides basis for comparison between European cities
It was one of the main tasks of this report to examine current city characteristics by revising the city typology from the first State of European Cities report and adapting the revised typology to an updated analysis of urban trends and dynamics in Europe. Comparison between the revised typology and the typology from the first report reveals that statistical analysis based on the 2004 period Urban Audit by and large corroborates the key features of the first typology, which used data from 2001. However, the current typology is characterised by a more pronounced distinction between the core zone of the European economy, the more peripheral parts of Western Europe and the non-capital cities of Central Europe. This more distinct core-periphery progression of the revised typology was an outcome of an analysis, which was based on an indicator set comprising the Urban Audit domains of Demography, Economic Aspects, Training and Education, and Environment. By emphasising the structural differences between European macro-regions, the revised typology provides the basis for a discussion about measures of cohesion policy, which can be adjusted very accurately to the regional setting of cities in Europe. Hence, the typology differentiates among European cities according to size, function and (macro-) region. In other words, in Europe-wide comparison, cities should to be classified firstly according to their basic regional embeddedness within the European territory and secondly in terms of their more specific function. Therefore, a two-layer classification was derived by grouping cities into four basic types and into nine more specific sub-types.
By grouping cities with similar problems and challenges together, a typology opens the opportunity to survey cities, to “compare the comparable” and to draw correct policy conclusions. A typology is also useful with regard to the concept of monitoring, which becomes increasingly important in policies. It will also support the emergence of an “evaluation culture” and a commitment to learn from comparison and partnership with similar cities.
Population decline and growth exist simultaneously in European city system
There is a very diverse picture of population growth and decline in different types of cities and in different parts of Europe. Depending on fertility rates and migration flows, cities face demographic challenges such as an overall decline in population, a shrinking of the total sum of working-age residents and an increase in the share of old-age residents. On average, in the period from 2001 to 2004, the largest growth in population was taking place in those urban regions, which

140/189
already represent the largest agglomeration of population and economic wealth in Europe. They are mainly situated in the Western European core zone and around selected large and capital cities of the other European macro-regions. Other cities or whole regions have to deal with decline and it will be one of the central fields of regional policy action to support these cities in the process of adaptation to these changes.
Challenges and potentials evoked by ageing of population Long-term demographic change so far has affected different regions to varying
degrees. A relatively large number of “big cities” report birth surpluses, because many families with children decide to live in cities. On the other hand, there are cities and regions where low birth rates show that cities are seen as “unfriendly” (or unaffordable) environments by many families with children. Meanwhile, many cities are home to a large and growing number of senior citizens. Under the conditions of demographic change it will become increasingly important for cities to ensure that the public infrastructure and the “urban landscape” provide attractive conditions for different age groups and family types. Therefore, a (city specific) provision of an adequate infrastructure, e.g. schools and day care facilities for children, local services for senior citizens, is a crucial part of a place-based policy concerned with meeting the challenges of demographic change (i.e. the policy priorities “children” and “ageing”). National policy may be supported by the EU in providing favourable conditions for different age groups and family types locally.
By dealing with these challenges the high potential of the ageing knowledge-society should be taken into account. Analysis in this report has given many arguments for a high priority of an increased social inclusion of the elderly in order to secure the future prosperity of cities. There is a wide scope for public policy to encourage labour market participation of older working-age residents and to improve the living conditions of senior citizens in cities, including the outer zones of agglomerations. Smaller cities may benefit from being given support to develop their own economic specialisations in an ageing knowledge-society.
Economic prosperity is highly concentrated, but the potential for growth exists across all types of territories
In line with population concentration, there is also a high agglomeration of economic prosperity in cities across a European core zone of Western and Northern Europe, Northern Italy, parts of Spain and the capital cities of Central Europe. Prosperity here combines with (technological) innovativity and entrepreneurial activity. A number of relatively innovative locations within Central Europe indicate that there is scope for Central European regions to find economic specialisations, which can be based on technological innovation. The conditions for economic prosperity are improving in some Central European regions. Many big cities in Central Europe and a number of capitals are highly competitive, many smaller Central European cities in more remote regions,

141/189
however, are rather unlikely to catch up with Western European conditions in the near future.
Taking into account that cities and regions have different economic profiles it is an advisable strategy for cohesion policy to support the existing diversity of industrial agglomerations and networks in order to arrive at a “smart specialisation” of cities and regions. While concentration of economic activity appears to be a driver of economic progress this can be based on different economic sectors and found at different stages of the regional economic evolution process. In fact the potential for growth exists across all types of territories.
To avoid vulnerability to economic change and crises, in this concept, economic cores are understood as very flexible entities of industries and networks, which need to adapt to changing markets and overall conditions continuously. The data analysed in this report cannot identify the precise economic sectors of each city, in which innovation is most likely to occur. The analysis, however, supports the rationale of a strategy, which, firstly, seeks to identify the economic core activities of a region and, secondly develops measures to support these actors and networks.
The recent world-wide financial and economic crisis has hit Europe hard. Most and for all it has demonstrated the degree of international economic interconnectedness and the dependency of national and regional economies on the flawless functioning of global economic interchange. In the EU 2020 strategy, which is being designed as successor to the Lisbon Strategy, the EU therefore seeks to meet the challenges of globalisation and interdependence in a pro-active way. The EU 2020 aim is for Europe to lead, compete and prosper as a knowledge-based, connected, greener and more inclusive economy. It is, therefore, one of the strategic goals to provide more attractive framework conditions for innovation and creativity.
Since regional interchange can be supportive to innovation, the findings of this report call for a regional economic development strategy of “smart specialisation”, in which development of close interrelations between existing firms, entrepreneurs, universities, research institutes and public administration are encouraged in order to support and develop regional strengths. As focal points of regional innovation networks, cities provide the education and research infrastructure and the best conditions for creative minds to meet and exchange knowledge and opinions. European policy in support of “smart specialisation”, therefore, will incorporate action to provide favourable conditions for education, research and exchange particularly in cities.
In prosperous cities the standard of qualification is high There is a relationship between the standard of qualification of the working-age
population and urban economic performance, i.e. economic prosperity in Urban Audit cities (in relation to their national averages) increases parallel to the share

142/189
of highly qualified working-age residents. Agglomeration of highly skilled people can be observed both in large cities within the most prosperous regions and in smaller cities in more peripheral regions. Highly skilled people often prefer to live in smaller cities for their assets and amenity value, in terms of personal lifestyle choice and for reasons of economic creativity.
In the future, more in-depth research on the assumption that “creativity” is key to urban competitiveness, will be required. Progress in the provision of indicators on inter-firm relations is needed in order to examine the role of knowledge spillover as a factor of urban competitiveness more directly.
There is an urban dimension to innovation-oriented cohesion policy, since spatial proximity between economic actors is likely to be one of the different factors, which are favourable for the diffusion of knowledge and its application in economic activity, even though high-quality information and communication technology is widely available. There are great efforts in educating young academics in cities throughout Europe. Quite interestingly, while manifold interrelationships between regional competitiveness and human capital are apparent, there is no evidence that engaging in higher education has a short-term effect on regional prosperity. Cities therefore must provide attractive conditions to encourage students to stay in the area after they graduate. In the long run, in Central Europe, it will be particularly vital to develop the knowledge and creativity of young academics into a regional economic factor. However, generation of innovation requires constant effort and there is, therefore, scope for policy support with an urban focus even in the most prosperous regions of Europe. It will be a task of urban and regional policy in all regions to support “smart specialisation" - development of close interrelationships between existing firms, enterprises, universities, research institutes and public administrations as a way to support and develop regional strengths.
There is a close connection between the policy priorities “innovation” and “migration”. In Europe, even today the most successful economic locations attract the largest number of non-national migrants. Migration as a factor of economic growth is likely to increase in importance under the conditions of demographic change. There is, therefore, scope for EU policy to support cities in developing attractive conditions for mobile “knowledge workers”.
Social inclusion is a key priority of the urban dimension of cohesion policy It is one of the priorities of cohesion policy to support and improve social
inclusion. In the current discussion about concentration of resources on a limited number of narrowly defined core priorities social inclusion is envisaged to be such a priority, together with innovation and promotion of employment.
Social inclusion can be defined as the extent to which all individuals (and groups) can enjoy essential standards and the disparities between individuals (and groups) are acceptable. The indicators analysed in this report allow no overall assessment of social inclusion in European cities, but the results lead to a

143/189
number of conclusions concerning the issues of poverty and its intra-city disparity, economic participation, integration of foreigners, and (perceived) safety. As far as the available data on income disparity within cities allow such a conclusion, they suggest that there has been no general increase but rather a slight overall decrease of income disparity in European cities. Unemployment is lowest in the core areas and outer zones of the most prosperous cities. It is particularly high in smaller cities of Central Europe but has declined there, considerably, since the beginning of the 1990s and continued to decline in the period from 2001 to 2004.
No general conclusion about the degree of disparities between sub-city districts or the extent, to which such disparities are deemed “acceptable” by the resident population, can be made. It is very likely that by residential segregation urban poverty rates will solidify and social inclusion will be more difficult to achieve. However, just as segregation patterns differ between cities, there is no ready-made strategy to overcome intra-city disparities on a neighbourhood level. Responsibility for neighbourhood-oriented programmes would ideally be located at the relevant departments of municipal administrations, which may be supported by “external intervention” from national governments and the EU. In neighbourhood-oriented policy, more attention needs to be paid to the effects of segregation according to age and family type. Progress in policy aiming at a long-term reduction of intra-city disparities depends on further research, which comprises both monitoring of segregation at the sub-city aggregate level and analysis of the sorting mechanisms leading to segregation and the effects of segregation.
Urban paradox persists: jobs concentrate in cities, but many city residents do not participate in the labour market
It has been described as an urban paradox that while cities are characterised by high concentrations of wealth and employment in leading economic sectors, they also tend to concentrate a high number of unemployed residents, i.e. wealth is not adequately translated into job creation. By and large, since the 1990s this paradoxical situation has persisted in European cities, yet the share of those not participating in creation of value has not – as might have been suspected – increased. It is a long-lasting characteristic of the urban paradox that employment rates of the resident population of all parts of Europe are relatively low in many cities, i.e. in places where jobs are concentrated. Therefore, in order to secure economic prosperity and social stability, it will be a task for many of the large cities of Europe, but also for the smaller cities in peripheral regions to encourage higher participation in the urban labour market among the resident population. Smaller cities in particular will need to develop strategies aiming both at encouraging labour market participation and entrepreneurship among the resident population and – to some extent - at attracting mobile labour and capital. Combination of a good quality public infrastructure, accessibility, a certain degree of economic specialisation and affordable high quality housing may prove

144/189
to be a considerable advantage of smaller cities in competition with the large agglomerations and may serve to prevent income disparity and poverty. Since there do not appear to be very big differences between health care provision in very large and smaller cities, for many smaller cities good health sector services in combination with other aspects of the quality of life may turn into a further advantage in competition with the very large cities under the conditions of demographic change. It may also be an advantage of smaller cities that they are deemed “safer” by urban residents, even though measured by crime rates (at least as far as murder and violent crime is concerned) large cities are not more “dangerous” than smaller cities.
Scope of most city administrations is more dependent on political autonomy than on city size and budget
In European comparison, national administrative settings have a significant impact on the scope of action of city administrations. Powerful European city administrations are, in general, those with a high level of political autonomy, here defined as control over its budget by local taxation. A “city powers” index has been applied, which is based on the components of “weight” and “autonomy”. The “weight” component is defined by size (population), status (for cities entrusted with additional tasks in the public administration, e.g. city states, or for cities with less responsibility than comparable cities in a country) and spending power (size of the budget). The “autonomy” component has been defined by the scope of autonomy in taxation (control over income through local taxes).
It may have been expected that the overall scope of city administrations, as measurable by an index of “city powers”, depends more or less evenly on size and autonomy in taxation. Yet, a significantly larger proportion of Urban Audit cities with a relatively high value of the “powers index” appear to draw their scope to govern their own concerns more from autonomy than from size.
Great differences in quality and treatment of the urban environment Urban Audit cities show great variation both concerning environmental quality,
e.g. land use and air pollution, and concerning environmental treatment, e.g. car use and waste processing. In respect to land use, these differences manifest in the large variation in total land area and green space among cities. Biodiversity is related to the air quality in the city, as NO2 concentrations are negatively correlated with the proportion of green space in the core city area. A similar relationship between air pollution and the way in which settlements are geographically organised is found for PM10, the concentration of which is positively correlated with the population density of the urban settlements. Comparison among European cities shows that while air quality depends to a considerably extent on the climatic and topographic setting, which are highly influential on the concentration of air pollutants, environmental treatment makes a difference.

145/189
Land-use planning obviously provides scope to improve the environmental quality for urban residents, yet reduction of pollutant emission is the key goal of environmental policy. Great variation of air pollution particularly among cities of Central and Southern Europe suggests that there is scope for inter-city and cross-country cooperation in developing strategies aiming at adapting to climate change.
Car ownership on average is highest among Western European cities, while it is lowest among many Central and Southern European cities. Even though there are relatively less cars in relation to the total population in cities of Central and Southern Europe, depending on the age and condition of the vehicle stock they might nevertheless be a major source of air pollution. Since it appears that car ownership is a prosperity indicator, it would not be a likely main policy goal to disencourage car ownership in order to improve environmental quality, but to provide incentives for the use of other modes of transport.
Waste treatment is an indicator of regional progress in environmental protection. On average, Western (and Northern) European cities have the highest recycling share in commercial and domestic waste treatment. As the diversity of achievements and challenges concerning environmental standards and environmental treatment reveals, to achieve reduction of pollution, enhancement of environmental awareness and a more sustainable treatment of the environment, integrated environmental management strategies are required (EU Commission 2007b). Objectives of environmental sustainability need to be incorporated into overall development strategies for innovation, competitiveness, growth and employment. Specific measures depend on the type of city and region within Europe. Many large cities show that environmental sustainability, e.g. by recycling a large share of waste and avoiding air pollution, can be achieved and must be an integral part of an urban development strategy for all cities in the forthcoming decades. As part of this strategy, preserving and developing green space serves to improve air quality and to preserve urban biodiversity, which itself also might raise awareness of the importance of environmental protection among the urban population. Definitely, as high recycling rates and relatively high air quality in very prosperous large cities of Northern and Western Europe reveal, there is no conflict between the objectives of economic growth and adapting to climate change. EU policy may support inter-city and international cooperation in developing strategies to combine knowledge-based growth and environmental protection.
European city statistics: a vital information tool for European policy As diagnosed in the consultation document on the future EU 2020 strategy
(European Commission 2009a), European policy must be built on a good analysis of the constraints facing policy-makers in the coming years, and on the correct identification of the upcoming challenges. Since the achievement of key policy goals, i.e. support of knowledge-based economic growth, social inclusion and environmental sustainability, depends on the success of many measures

146/189
with a particular urban focus, continuing efforts to improve the knowledge-base on urban conditions are required.
To improve usability of the Urban Audit as a policy-oriented information tool further, the indicator set itself and the instruments for analysis and display are currently being advanced. Among the Urban Audit cities, an additional annual data collection with a reduced catalogue of variables will be added in order to provide complete time-series of key indicators. The total data collection, comprising more than 300 variables, will be continued every third year. A further Large City Audit, launched in 2006, includes all ‘non-Urban Audit cities’ with more than 100 000 inhabitants in the EU. For these 250 cities, a reduced set of 50 variables is collected. As from 2010, a GIS-based information tool on the Internet, the Urban Atlas, will improve usability of the Urban Audit considerably. The Atlas, which is supported of the European Regional Development Fund (ERDF), will provide maps of the Urban Audit LUZs of all EU capitals and a large sample of large and medium-sized cities participating in the Urban Audit. Allowing display of Urban Audit data in different kinds of maps, it will be a useful tool for planners and policy-makers in particular. Furthermore, Eurostat is preparing a web-based dissemination tool called “Cities’ and Regions’ Profile” (CARP) based on Urban Audit data (for an overview of new developments cf. Box X2 in the appendix).

147/189
References AER Assembly of European Regions (2009), From subsidiarity to success: The impact of decentralisation on economic growth, Strasbourg: AER.
Alberti, M. (2009), Advances in Urban Ecology. Integrating Humans and Ecological Processes in Urban Ecosystems. Berlin: Springer.
Augurzky, B. and U. Neumann (2005), Economic resources of senior citizens. Regional economic and fiscal effects of promoting the senior citizens economy in North Rhine-Westphalia. Study commissioned by the Ministry of Health, Social Affairs, Women and Family of the State of NRW. Gelsenkirchen: IAT.
Barca, F. (2009), An agenda for a reformed cohesion policy. A place-based approach to meeting European Union challenges and expectations. Independent Report prepared at the request of Danuta Hübner, Comissioner for Regional Policy. Internet: http://ec.europa.eu/regional_policy/policy/future/pdf/report_barca_v0306.pdf. Download 12 January 2010.
Bauer, T. K., J.P. Haisken-DeNew and C.M. Schmidt (2004), International Labor Migration, Economic Growth and Labor Markets. RWI Discussion Papers 20. Essen: RWI.
Berrini, M. and L. Bono (2007), Urban Ecosystem Europe. Report 2007. An integrated assessment of the sustainability of 32 European cities. Milano: Ambiente Italia.
Berry, B.J.L. (1976), The Counterurbanization Process: Urban America since 1970. In: Berry, B.J.L. (ed.), Urbanization and Counterurbanization. Urban Affairs Annual Reviews 11:17-30. Beverley Hills: Sage.
BMVBS (ed.) (2010), Quartiers-Impulse: Neue Wege zur Verbesserung der lokalen Standortbedingungen. BMVBS-Online-Publikation 01/10. Berlin: BMVBS. Internet: www.bbsr.bund.de
BMVBS/BBSR (ed.) (2009), Stadtquartiere für Jung und Alt - Europäische Fallstudien. Werkstatt: Praxis 63. Bonn: BMVBS/BBSR.
Camagni, R. (ed.) (1991), Innovation Networks. Spatial Perspectives. London: Belhaven.
Canada’s World (2008), The Power of Cities – Canada’s Cities are Part of a new Global Force for Social, Economic and Environmental Change, Vancouver: Simon Fraser University.
Cittalia (2009), Le politiche urbane degli stati europei, Francia, Germania, Regno Unito e Spagna a confronto. Roma: Cittalia.
COMEAP Committee on the Medical Effects of Air Pollutants (2009), Long-Term Exposure to Air Pollution: Effect on Mortality. Chilton: Health Protection Agency.
EEA European Environment Agency (2007), Air pollution in Europe 1990–2004; EEA Report No 2/2007. Copenhagen: EEA.
EEA European Environment Agency (2008), Better management of municipal waste will reduce greenhouse gas emissions. EEA Briefing 1/2008. Copenhagen: EEA.
EEA European Environment Agency (2009a), EEA Signals 2009. Key Environmental Issues Facing Europe. Copenhagen: EEA.
EEA European Environment Agency (2009b), Ensuring quality of life in Europe's cities and towns. Tackling the environmental challenges driven by European and global change. EEA Report 5/2009. Copenhagen: EEA.
Ellison, G., E. Glaeser and W. Kerr (2007), What Causes Industry Agglomeration? Evidence from Coagglomeration Patterns. NBER Working Paper 13068.

148/189
ESPON Monitoring Committee (ed.) (2009), ESPON 2013 database. First Interim Report. Luxembourg: ESPON.
European Commission (2001), European Governance. A White Paper. Brussels: EU Commission.
European Commission (2004a), Interim Territorial Cohesion Report (Preliminary Results of ESPON and EU Commission studies). Luxembourg: Office for Official Publications of the
European Commission (2004b), Joint report on social inclusion 2004. Brussels: DG Employment and social affairs. Social security & social integration.
European Commission (2004c), Towards a thematic strategy on the urban environment Communication from the Commission to the Council, the European Parliament, the European Economic and Social Committee and the Committee of the regions, COM(2004)60, Brussels: EU Commission.
European Commission (2006a), Commission decision of 4 August 2006 drawing up the list of regions eligible for funding from the Structural Funds under the Convergence objective for the period 2007-2013. Official Journal of the European Union L243/44. Luxembourg: Office for Official Publications of the European Communities.
European Commission (2006b), Communication from the Commission to the Council and European Parliament. Cohesion Policy and cities: the urban contribution to growth and jobs in the regions. COM(2006) 385 final. Brussels: EU Commission.
European Commission (2006c), Communication from the Commission to the Council and European Parliament on Thematic Strategy on the Urban Environment. COM(2005) 718 final. Brussels: EU Commission.
European Commission (2007a), European Regional and Urban Statistics. Reference Guide. Eurostat Methodologies and working papers. Luxembourg: Office for Official Publications of the European Communities.
European Commission (2007b), Integrated Environmental Management. Guidance in relation to the Thematic Strategy of the Urban Environment. Technical Report 2007-013. Brussels.
European Commission (ed.) (2007) State of European Cities Report. Adding value to the European Urban Audit. Study Contracted by the European Commission. Prepared by Ecotec Research and Consulting, NordRegio and Eurofutures. Brussels: EU Commission, DG Regio.
European Commission (2008a), Green Paper on Territorial Cohesion. Turning territorial diversity into strength. SEC(2008) 2550. Brussels: EU Commission. DG regional Policy.
European Commission (2008b), Growing Regions, growing Europe. Fifth progress report on economic and social cohesion. Brussels: EU Commission.
European Commission (2009a), Commission Working Document. Consultation on the Future “EU 2020” Strategy. COM(2009)647 final. Brussels: EU Commission.
European Commission (2009b), Urban Atlas: Europe's eye in the sky provides cities with tools for smart development. Press Release IP/09/65. Brussels: EU Commission.
European Commission (2009c), White Paper “Adapting to climate change: Towards a European framework for action”. COM(2009) 147 final. Brussels: EU Commission.
European Commission (2010), Survey on perception of quality of life in 75 European cities. Brussels: EU Commission.
European Communities (2004), Urban Audit Methodological Handbook. 2004 edition. Luxembourg: Office for Official Publications of the European Communities.

149/189
European Parliament (2006), Directive 2008/50/EC of the European Parliament and of the Council of 5 April 2006 on waste, DIRECTIVE 2006/12/EC. Strasbourg.
European Parliament (2008), Directive 2008/50/EC of the European Parliament and of the Council of 21 May 2008 on ambient air quality and cleaner air for Europe, DIRECTIVE 2008/50/EC. Strasbourg.
Florida, R. (2002), The Rise of the Creative Class. New York: Basic Books.
Florida, R. (2005), Cities and the creative class. New York, London: Routledge.
Florida, R., C. Mellander and K. Stolarick (2008), Inside the black box of regional development – human capital, the creative class and tolerance. Journal of Economic Geography 8: 615-649.
Friedmann, J. (1986), The world city hypothesis. Development and Change 17: 69-83.
Fürst, D. & J. Knieling (eds.) (2002), regional governance: New modes of self-government in the Euro-pean Community. Hannover: ARL.
Griliches, Z. (1990), Patent Statistics as Economic Indicators: A Survey. Journal of Economic Literature 28: 1661-1707.
Herrschel, T. and P. Newman (2003), Die Governance europäischer Stadtregionen. Informationen zur Raumentwicklung 8/9 03: 543-555.
Hoorens, D. (2008), Sub-national Governments in the European Union. Organisation, responsibilities and finance, Paris: Dexia Editions.
Informal Ministerial Meeting on Urban Development and Territorial Cohesion (2007), Leipzig Charter on Sustainable European Cities. Leipzig: BMVBS.
Jaffe, A.B. (2000), The U.S. Patent System in Transition: Policy Innovation and the Innovation Process. Research Policy: 531-557
Krugman, P. (1991), Geography and Trade. Cambridge, Mass.: MIT Press.
Lefèvre, C. (1998), Metropolitan Government and Governance in Western European Countries. International Journal of Urban and regional Research 22 (1): 9-25.
Lefèvre, C. (2008), Gouvernance et Performance Economique: Etude Comparée De Londres, New York Et Tokyo: Enseignements Pour La Region Ile-De-France, Paris.
Marshall, A. (1920), Principles of economics. 8th edition. London: Macmillan
Malecki, E. (1991), Technology and Economic Development. The Dynamics of Local, regional and National Change. Harlow: Longman.
Malecki, E. (1994), Entrepreneurship in Regional and Local Development. International Regional Science Review 16: 119-153.
Möller, J. and A. Tubadji (2009), The Creative Class, Bohemians and Local Labor Market Performance – A Micro-data Panel Study for Germany 1975-2004. ZEW Discussion Paper 08-135. Mannheim: ZEW.
Neumann, U. (2008), Intra-urban polarisation due to tertiarisation of the urban labour market? Evidence from urban regions in Germany. In: Wrocław University of Economics (ed.), Globalization Impact on Regional and Urban Statistics. 25th SCORUS Conference Proceedings. Wrocław.
Neumann, U., L. Trettin and F. Welter (2008), Fostering entrepreneurship in distressed urban neighbourhoods. International Entrepreneurship and Management Journal 4: 109-128.
OECD (2006), Competitive Cities in the Global Economy. OECD Territorial Reviews. Paris: OECD.

150/189
Papanikolaou, G. (2006), Spatial and individual influence on commuting behaviour in Germany. ERSA Conference Papers 06p468. Vienna: ERSA.
Porter, M. E. (1998), On Competition. Boston: Havard Business School Press.
Porter, M. E. (1990), The Competitive Advantage of Nations. New York: Free Press
Porter, M.E. (2003), The Economic Performance of regions. Regional Studies 37 (6/7): 549-578.
Redding, S. J. (2009), Economic Geography: A Review of the Theoretical and Empirical Literature. CEPR Discussion Paper 7126. London: CEPR.
Robson, B. (2004), Area-based policy evaluation. In: OECD (2004), Evaluating local economic and employment development. How to assess what works among programmes and policies: 199-220. Paris.
Sassen, S. (1991), The global city: New York. London. Tokyo. Princeton: UP.
Schmidt, C.M. (2005), Population Economics in an Era of Demographic Change –Many Questions, Some Answers, and a Lot of Opportunity. Presidential Address at the Annual Conference of ESPE, Paris, June 18th, 2005.
Scott, A.J. (2006), Entrepreneurship, Innovation and Industrial Development: Geography and the Creative Field Revisited. Small Business Economics 26: 1-24.
Seidel-Schulze, A., B. Grabow und V. Tosch (2009), Lebenszufriedenheit in europäischen Städten. Auswertung des Urban Audit European Perception Survey. Difu Papers. Berlin: Difu.
Taylor, P. J. (2005), Leading World Cities: Empirical Evaluations of Urban Nodes in Multiple Networks. Urban Studies 42 (9): 1593-1608.
Tortorella, W. and L. Chiodini (2008), Rapporto Cittalia 2008, Ripartire dalle città. Roma: Cittalia.
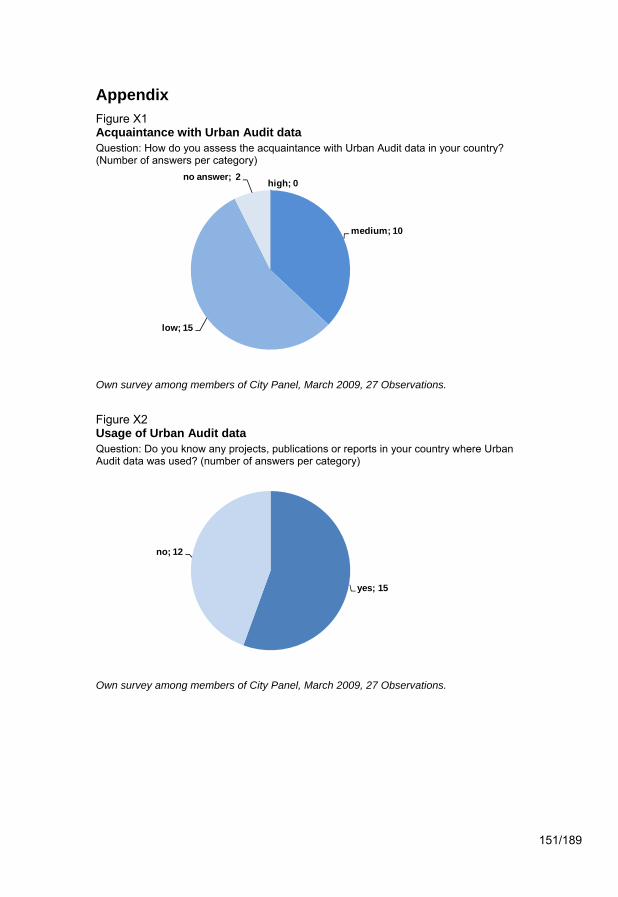
151/189
Appendix Figure X1 Acquaintance with Urban Audit data Question: How do you assess the acquaintance with Urban Audit data in your country? (Number of answers per category)
Own survey among members of City Panel, March 2009, 27 Observations.
Figure X2 Usage of Urban Audit data Question: Do you know any projects, publications or reports in your country where Urban Audit data was used? (number of answers per category)
Own survey among members of City Panel, March 2009, 27 Observations.
high; 0
medium; 10
low; 15
no answer; 2
yes; 15
no; 12
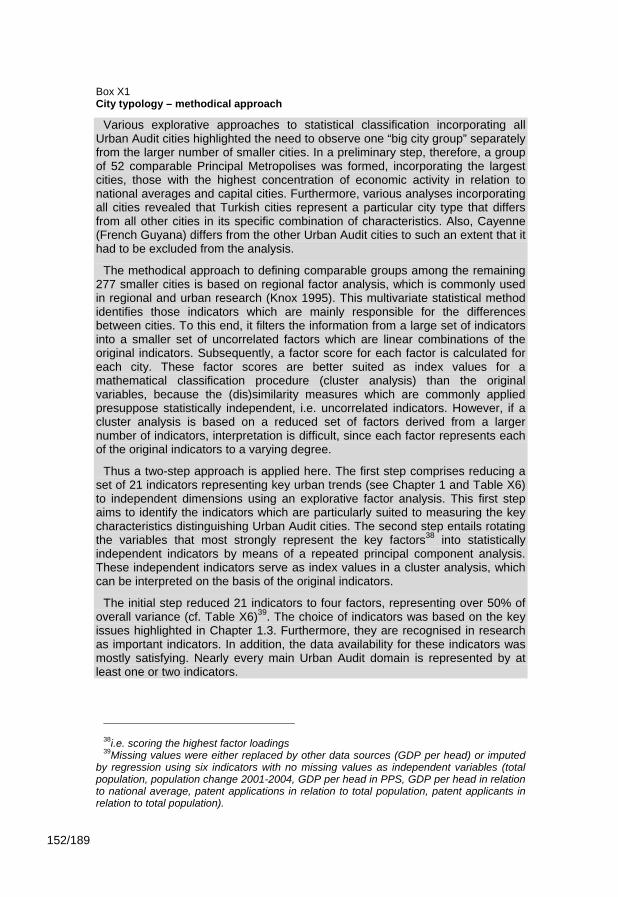
152/189
Box X1 City typology – methodical approach
Various explorative approaches to statistical classification incorporating all Urban Audit cities highlighted the need to observe one “big city group” separately from the larger number of smaller cities. In a preliminary step, therefore, a group of 52 comparable Principal Metropolises was formed, incorporating the largest cities, those with the highest concentration of economic activity in relation to national averages and capital cities. Furthermore, various analyses incorporating all cities revealed that Turkish cities represent a particular city type that differs from all other cities in its specific combination of characteristics. Also, Cayenne (French Guyana) differs from the other Urban Audit cities to such an extent that it had to be excluded from the analysis.
The methodical approach to defining comparable groups among the remaining 277 smaller cities is based on regional factor analysis, which is commonly used in regional and urban research (Knox 1995). This multivariate statistical method identifies those indicators which are mainly responsible for the differences between cities. To this end, it filters the information from a large set of indicators into a smaller set of uncorrelated factors which are linear combinations of the original indicators. Subsequently, a factor score for each factor is calculated for each city. These factor scores are better suited as index values for a mathematical classification procedure (cluster analysis) than the original variables, because the (dis)similarity measures which are commonly applied presuppose statistically independent, i.e. uncorrelated indicators. However, if a cluster analysis is based on a reduced set of factors derived from a larger number of indicators, interpretation is difficult, since each factor represents each of the original indicators to a varying degree.
Thus a two-step approach is applied here. The first step comprises reducing a set of 21 indicators representing key urban trends (see Chapter 1 and Table X6) to independent dimensions using an explorative factor analysis. This first step aims to identify the indicators which are particularly suited to measuring the key characteristics distinguishing Urban Audit cities. The second step entails rotating the variables that most strongly represent the key factors38 into statistically independent indicators by means of a repeated principal component analysis. These independent indicators serve as index values in a cluster analysis, which can be interpreted on the basis of the original indicators.
The initial step reduced 21 indicators to four factors, representing over 50% of overall variance (cf. Table X6)39. The choice of indicators was based on the key issues highlighted in Chapter 1.3. Furthermore, they are recognised in research as important indicators. In addition, the data availability for these indicators was mostly satisfying. Nearly every main Urban Audit domain is represented by at least one or two indicators.
38i.e. scoring the highest factor loadings 39Missing values were either replaced by other data sources (GDP per head) or imputed
by regression using six indicators with no missing values as independent variables (total population, population change 2001-2004, GDP per head in PPS, GDP per head in relation to national average, patent applications in relation to total population, patent applicants in relation to total population).

153/189
With regard to questions on governance and civic involvement, research work in preparation for this report, discussion with the panel of experts and the city panel workshop in Berlin all determined that Europe comprises a very complex pattern of administrative structures, which makes it very difficult to measure “city power” on the basis of single statistical indicators. Due to the complexity of the interrelationships between administrative structure, city power and the structural characteristics of cities, the decision was made not to incorporate measures of civic involvement within the set of indicators used for structural clustering. All other domains of the Urban Audit, however, are represented in the set. The 21 indicators include
- five indicators representing “Demography” (total population, age groups 0-4, 35-44, >75, population in core city in relation to LUZ),
- five indicators representing “Economic Aspects” (GDP per head in PPS, patent intensity, new businesses in % of all companies, share of employment in services, unemployment rate)40,
- three representing “Environment” (population density, no. of days PM10 concentration exceeds 50 µg per m³, solid waste processed by landfill),
- three representing “Social Aspects” (total population change 2001-2004, natural population change 2004, murders and violent deaths per 100,000 residents),
- two representing “Training and Education” (working-age population qualified at university level, students in university education),
- one representing “Information Society” (local companies that provide ICT services), one “Travel and Transport” (multi-modal accessibility), and one “Culture and Recreation” (cinema attendance).
In the first step of the analysis, four factors were derived from an initial 21 indicators41. Based on the results of the explorative factor analysis, the indicators which most strongly represented the key factors were chosen to function as the index values of a cluster analysis. Statistical clustering of cities is, therefore, based on four indicators42: population density, proportion of the total population aged 0-4, GDP per head (in PPS), and working-age resident population with a university degree.These indicators helped derive three clusters comprising smaller cities43.
40Out of five indicators representing economic aspects, only three have been taken from
the Urban Audit exclusively. For 290 out of 356 cities, missing data on GDP in PPS per head has been replaced by data on NUTS 3 regions available from Eurostat via the internet. Patent intensity (applications per 100,000 inhabitants) was calculated by RWI using data from the European Patent Office (EPO).
41The four factors (principal components, varimax rotation) represent 52% of the variance of the 21 indicators.
42For 290 cities, missing data on GDP in PPS per head was replaced by data on NUTS 3 regions available from Eurostat via the internet. There were no missing values for total population. For the following number of cities (out of a total of 356) missing values were imputed by regression; population density: 89, population aged 0-4: 60, working-age population with a university degree: 215.
43Clustering was carried out in three steps: 1. hierarchical clustering according to Ward’s method, 2. subsequent optimisation using k-means clustering, 3. final correction using dis-criminant analysis.

154/189
Box X2 Technical recommendations
The technical recommendations summarise (I) the results of the discussion during the City Panel Workshop in March 2009 in Berlin and (II) new developments regarding the Urban Audit and give an assessment of these initiatives by the consortium.
(I) Results of the Urban Audit City Panel Workshop To consider user views in this report, a City Panel comprising 35 participants
from 32 cities in 24 different European countries was convened (cf. table X 7 for a list of members and the workshop programme). The main event was a two-day workshop held in Berlin in March 2009, where city panel members discussed various issues relating to the Urban Audit with the consortium responsible for this report. These included data availability, collection of data and response rates as well as the use of Urban Audit data and typologies. Some of the main results of this discussion are:
(i) The data collection process and willingness to collaborate in the Urban Audit varies greatly among participating countries. This was not only stated by participants of the city panel but also became clear during preparation of the second State of European Cities Report. Due to delays in delivery of national data from National Statistical offices, even in April 2009, not all data from the 2004 data collection was available for scientific use. National response rates in the 2004 collection vary from 99 percent to only 14 percent. Response rates are among the central issues, which must be improved in the near future to enhance the Urban Audit and ensure it as a widely accepted database.
(ii) The data collection process, including data transmission of Urban Audit data from cities to Eurostat, has been conducted thus far by a National Urban Audit Coordinator (NUAC). In most of the countries involved, the NUAC is an employee of the national statistical office, which, apparently, often implies insufficient interest and expertise in city statistics. Therefore, collaboration and communication between Urban Audit cities and NUACs should be improved. Furthermore, NUACs could be supported in their role by forming teams of two to five representatives per country, all functioning as contact persons for Eurostat. These staff could assist the NUAC by assuming responsibility for delivering data. Should there be sufficient interest on the part of users, they also could provide information on the development of the Urban Audit in Europe and advise national users about the Urban Audit. Building up national user groups could be crucial to improving the situation concerning data and possibly lead to the implementation of a local system of data compilation. There are a few countries, such as Germany, which have already formed Urban Audit Working Groups that meet once a year to share their experiences on new developments in the UA.
(iii) A Eurostat initiative to provide an annual data collection of a smaller set of about 40 key variables could improve response rates, data quality and usability.
(iv) City panel participants were in favour of further efforts to harmonise definitions of spatial units, especially with regard to core cities and LUZ. It was also suggested to determine a method of modelling core city-LUZ interrelations within the Urban Audit.
(v) Metadata are a key precondition of the usability of the Urban Audit. Variables must be defined in the same way in each country to prevent errors. If a

155/189
country is unable to deliver data using these methods, the Urban Audit data website should provide footnotes specifying this, if data not applicable to the exact definition will be admitted to the collection. The website should provide an updated Urban Audit Methodological Handbook for each round of the data collection, which should be easy to find and available for download.
(vi) Data should be made more widely available by offering a large range of file formats for download. Cities also expressed a strong desire to be able to download the whole data set in one step so that they can work with the raw data.
(II) The Urban Audit: perspectives for the future The future development of the Urban Audit will depend, firstly, on political
support in the European Commission. It will further depend on the willingness of countries and people in charge to support and enhance the whole instrument. By now, the Urban Audit has been used mainly by European institutions and the European Commission, in particular Directorate General for Regional Policy, and Eurostat to survey the development of the European city system. Of course, there is a lower demand for international comparisons in individual Urban Audit Cities than in the European context, but representatives of the city panel confirmed that the lack of topical focus and the large amount of missing values often prevent them from using UA data. This argument was emphasised both by experts from statistical offices and research institutions.
According to this experience, Eurostat is already restructuring the Urban Audit data collection. It is the objective of the European Commission and Eurostat to strengthen the Urban Audit data base as a reporting tool also for cities. Therefore, it needs to be embedded more on the city level. Eurostat is responsible for the operational background of the Urban Audit. The tasks of Eurostat in the Urban Audit are manifold and range from data concept and design, data collection and estimation to dissemination. Based on this experience, Eurostat has been improving all processes comprising the Urban Audit constantly, from data collection to dissemination.
Future modifications intended will be summarised in the following. These modification plans correspond with the recommendations given by experts during the Urban Audit City Panel and would be supported by the consortium.
Improving data quality and topicality To improve data quality and topical focus, Eurostat will modify the data
collection process fundamentally. The following steps will be taken:
(i) An annual Urban Audit will be provided. In 2010, an annual data collection with a reduced catalogue of variables will take place. It covers the reference years 2005, 2006, 2007 and 2008 and incorporates all Urban Audit cities at three spatial levels (core city, larger urban zone, kernel). The list of variables will be reduced to a set of around 40 variables. They will be marked as "annual" in the variable list.
(ii) The exhaustive Urban Audit data collection comprising more than 300 variables will be continued every third year. The reference year for the collection round in 2010 will be 2008. Data will be collected at three spatial levels: core city, larger urban zone and kernel. The national level is a new level but an important one. This became obvious in the preparation of the first and second State of European Cities Reports. Often statements about European cities were not significant until incorporating comparable data at the national level.

156/189
(iii) A new development is the Large City Audit (LCA), which incorporates all “non-Urban Audit” cities in the EU with more than 100,000 inhabitants. The Large City Audit starts with data from 2008. The variables will be marked as "LCA" in the Urban Audit variable list and refer to the core city level as well as the larger urban zone.
From the point of view of the consortium preparing the second State of European Cities Report an annual data collection of a reduced set will be a valuable change in the data collection process and will serve to meet the needs of users. To get certainty about the quality of the annual data collection, an assessment should be carried out. The assumption that lower data requirements (less variables, variables that are easy to collect) lead to more complete data needs to be verified. There is also a demand for evaluating the Larger City Audit. As a new tool, which is obviously essential as the base for the Urban Atlas (see below), the “Large City Audit” is another “new” data collection. For users who are not “insiders” this may be quite confusing.
Legislative basis The Urban Audit data collection has been a voluntary task of National Statistical
Offices in cooperation with Eurostat, but in order to improve data quality it is now being discussed how the contribution of countries could be encouraged and strengthened. The issue of a legislative basis of the Urban Audit has been discussed and a draft version was presented by Eurostat at the meeting of the National Urban Audit coordinators in October 2009 in Luxemburg. The discussion has passed over now to the National Urban Audit coordinators and will be called again in consultation between NUACs and Eurostat in 2010.
Data on the perceived quality of life The Perception Survey on quality of life in European cities (see chapter 3.4)
gives interesting information about a high number of Urban Audit cities, which cannot be drawn from the variable set of the Urban Audit. The first and the second surveys took place in 2004 and 2006.
This third survey was conducted at the end of 2009 in 75 large European cities, based on an extended questionnaire. The survey forms part of the Flash Eurobarometer series, carried out via ad hoc telephone interviews on a range of issues of interest to the services of the European Commission. As part of a framework contract this particular survey has been conducted by Gallup-Hungary. It has been coordinated by the Directorates-General for Regional Policy and Communication, the latter being responsible for Eurobarometer methodology and any related questions.
From the point of view of the consortium this is an important supplement to the UA database and needs to be kept and developed.
The Urban Atlas The Atlas is a GIS-based dataset, which is supported by the European
Regional Development Fund (ERDF). It will provide maps of the Urban Audit LUZs of all EU capitals and a large sample of large and medium-sized cities participating in the Urban Audit. The project has been supported by European space technology and is part of the implementation of the Global Monitoring of Environment and Security (GMES) service. It will be possible to derive land cover/land use related indicators from the Urban Atlas, complementing the information already available in the Urban Audit.

157/189
The Urban Atlas data and maps provide a pan-European classification of city zones, allowing for comparable information on density of residential areas, commercial and industrial zones, extent of green areas, exposure to flood risks and monitoring of urban sprawl which is important for public transport planning in suburban areas” (EU Commission 2009b).
CARP Eurostat is preparing a web-based dissemination tool called “Cities’ and
Regions’ Profile” (CARP) based on Urban Audit data. It was intended to be opened in 2009 with tables, graphs, maps and a short textual profile in order to intensify the diffusion of information to data collectors, administrations and policy-makers. The provision of up-to date-tools that conform to user’s need is an important objective and it is quite probable that more than one tool is needed to illustrate urban issues. Nevertheless, it should be considered carefully how many different systems should be offered and - if they are offered - how they could be disseminated to encourage usage.
A final recommendation is to intensify coordination between different data collections at the European level. In the course of preparation of the Second State of European Cities Report, a variety of additional statistical sources, e.g. regional statistics from Eurostat at the country and NUTS 3 level, was referred to. There is scope to combine this existing information with the Urban Audit data base. Harmonisation between the Urban Audit and other data collections on a European level, e.g. the ESPON data base (ESPON Monitoring Committee (ed.) 2009), would greatly enhance usability and acceptance of European statistical sources with a regional reference.

158/189
Table X1 List of cities within city types
A1 Leading European Capitals and Metropolises Amsterdam (P), Bremen, Bristol, Bruxelles/Brussel (P), Dublin (P), Düsseldorf, Edinburgh, Frankfurt
am Main, Glasgow (P), Hamburg (P), Hannover, Helsinki (P), Köln, København (P), London (P), Luxembourg (P), Milano, München (P), Nürnberg, Oslo, Paris (P), Stockholm (P), Stuttgart, Wien (P)
A2 National Capitals and Metropolises Antwerpen (P), Athina (P), Barcelona (P), Berlin (P), Bern, Bratislava (P), Bucuresti (P), Budapest
(P), Essen (P), Gdańsk (P), Kraków (P), Leeds, Lefkosia (P), Lisboa (P), Ljubljana (P), Lyon, Łódz, Madrid (P), Poznan, Praha (P), Riga (P), Roma (P), Sofia (P), Tallinn (P), Valletta (P), Vilnius (P), Warszawa (P), Wrocław
B1 Regional Service Centres Aalborg (P), Aix-en-Provence, Amiens, Arnhem, Belfast (P), Bergen, Besançon, Birmingham, Bonn,
Bordeaux (P), Bradford, Breda, Brescia, Caen, Cardiff (P), Charleroi, Clermont-Ferrand, Cork, Coventry, Dijon, Eindhoven, Enschede, Exeter, Funchal, Galway, Gent, Gravesham, Grenoble, Göteborg, Irakleio (P), Kingston-upon-Hull, Lausanne, Le Havre, Leeuwarden, Leicester, Lens - Liévin, Lille, Limerick, Limoges, Lincoln, Liverpool, Liège (P), Malmö (P), Manchester (P), Marseille (P), Metz, Montpellier, Nancy, Nantes, Napoli, Newcastle upon Tyne, Nice, Nottingham, Oporto, Orléans, Palermo (P), Poitiers, Portsmouth, Reims, Rennes (P), Rotterdam (P), Rouen, Saint-Etienne, Sheffield, Stevenage, Stoke-on-trent, Strasbourg, Tilburg, Toulon, Toulouse, Tours, Utrecht, Wirral, Wolverhampton, Worcester, s' Gravenhage
B2 Regional Innovation Centres Aberdeen, Ancona, Augsburg, Bari, Bielefeld, Bochum, Bologna (P), Brugge, Cagliari, Cambridge,
Cremona, Darmstadt, Dortmund (P), Erfurt, Firenze, Freiburg im Breisgau, Genova, Genève, Graz (P), Göttingen, Halle an der Saale, Heerlen, Karlsruhe, Kiel, Koblenz, Leipzig (P), Magdeburg, Mainz, Modena, Moers, Mönchengladbach, Mülheim a.d.Ruhr, Oulu (P), Padova, Pescara, Plzen, Regensburg, Saarbrücken, Schwerin, Torino (P), Trento, Trier, Trieste, Turku, Venezia, Verona (P), Vigo, Volos, Wiesbaden, Wuppertal, Zürich
B3 Regional Centres with Growing Population Alicante/Alacant, Bilbao, Dresden, Gijón, Groningen, Innsbruck, L'Hospitalet de Llobregat, Las
Palmas, Linz, Logroño, Málaga (P), Nijmegen, Oviedo (P), Palma di Mallorca, Pamplona/Iruña, Potsdam, Salzburg, Santa Cruz de Tenerife, Santander, Sevilla, Thessaloniki, Valencia, Valladolid, Vitoria/Gasteiz
C1 Smaller Administrative Centres Aarhus, Apeldoorn, Aveiro, Badajoz, Coimbra, Córdoba, Derry, Faro, Foggia, Frankfurt (Oder) (P),
Jönköping, Kalamata, Kavala, Kecskemét, Kristiansand, L’Aquila, Linköping, Murcia, Namur, Odense, Örebro, Perugia, Ponta Delgada, Potenza, Santiago de Compostela, Sassari, Stavanger, Tampere, Toledo, Tromsø, Trondheim, Umeå, Uppsala, Weimar, Wrexham, Zaragoza
C2 Smaller Centres with Growing Population Ajaccio, Almere, Braga (P), Fort-de-France, Larisa, Pointe-a-Pitre, Saint Denis, Setubal D1 Cities in the Process of Structural Adaption Alba Iulia, Arad, Banska Bystrica, Białystok (P), Brno, Bydgoszcz, Campobasso, Caserta, Catania,
Catanzaro, Ceske Budejovice, Cluj-Napoca (P), Częstochowa, Debrecen, Gorzów Wielkopolski, Gozo, Gyõr, Hradec Kralove, Ioannina, Jelenia Góra, Jihlava, Kalisz, Karlovy Vary, Katowice, Kaunas, Kielce, Kładno, Konin, Kosice (P), Koszalin, Liberec, Liepaja, Lublin, Maribor, Miskolc (P), Nitra, Nyíregyháza, Olomouc, Olsztyn, Opole, Oradea, Ostrava (P), Panevezys, Pardubice, Patra, Pleven, Plock, Prešov, Pécs, Reggio di Calabria, Rzeszów, Salerno, Sibiu, Szczecin, Szeged, Székesfehérvár, Taranto, Timisoara, Toruń, Trencin, Trnava, Usti nad Labem, Vidin, Zielona Góra, Zilina, Zlin, Żory
D2 Less developed towns and cities Bacau, Braila, Burgas (P), Calarasi, Craiova, Giurgiu, Nowy Sącz, Piatra Neamt (P), Plovdiv, Radom,
Ruse, Suwalki, Targu Mures, Tartu, Varna
Own calculation based on the Urban Audit (2004). P = City takes part in Perception Survey on quality of life in European cities

159/189
Table X2 Selected key characteristics of Urban Audit cities in comparison By country, in alphabetical order, 2004*
Country City Total Population
Population <5 (in %)
Av. ann. pop. ch. 01-04 (in %)
Regional GDP per head in PPS (in 1,000)**
Patent Intensity (Appl. per 100,000 inh.)
Population Densitiy (inh. per km²)
AT Graz 235,477 4.5 1.4 32.8 87 1,846 AT Innsbruck 114,561 4.4 0.3 29.9 45 1,092 AT Linz 185,530 4.5 0.4 35.5 103 1,933 AT Salzburg 145,680 4.5 0.7 34.2 47 2,219 AT Wien 1,598,626 4.9 1.0 37.7 57 3,855 BE Antwerpen 455,148 5.9 0.5 32.9 13 2,226 BE Brugge 117,025 4.7 0.1 24.9 16 846 BE Brussells 999,899 6.8 0.7 51.9 68 6,196 BE Charleroi 200,608 5.9 0.0 19.9 5 1,965 BE Gent 229,344 5.4 0.5 30.2 59 1,468 BE Liège 360,361 5.4 21.0 4 2,007 BE Namur 106,213 5.3 0.3 20 7 27 605 BG Burgas 189,529 -0.5 8.3 0 BG Pleven 115,354 -1.8 5.4 0 BG Plovdiv 341,464 0.3 6.6 1 BG Ruse 158,201 -0.7 6.5 2 BG Sofia 1,138,950 1.4 15.2 2 BG Varna 312,026 -0.1 8.2 1 BG Vidin 53,488 -2.3 5.2 0 CH Bern 127,519 3.9 -0.3 216 2,472 CH Genève 184,758 4.8 1.3 22 11,627 CH Lausanne 126,815 5.0 0.5 330 3,068 CH Zürich 364,528 4.3 0.1 296 4,153 CY Lefkosia 213,500 5.2 2.1 16.8 30 CZ Ceske Budejov. 94,622 -0.9 14.5 1 CZ Hradec Kralove 94,694 -0.8 14.6 1 CZ Jihlava 49,865 -0.6 13.9 0 CZ Kladno 69,355 -0.8 15.4 3 CZ Karlovy Vary 51,537 -1.1 12.6 2 CZ Liberec 97,400 -0.6 13.1 14 CZ Olomouc 100,752 -0.6 12.8 4 CZ Pardubice 88,415 -0.9 13.6 1 CZ Plzen 162,627 -0.7 15.7 0CZ Praha 1,170,571 0.0 33.4 8 CZ Usti nad Labem 93,859 -0.6 13.4 1 CZ Zlin 78,599 -0.9 13.0 0
All cities on average 401,843 5.2 0.5 21.8 52 2,281 *Since the latest update considered in this report (February 2009), further cities from Bulgaria (Stara Zagora), Croatia (Osijek, Rijeka, Slavonski Brod, Split, Zagreb) and Switzerland (Basel, Biel/Bienne, Lugano, Luzern, St. Gallen, Winterthur) have been added to the Urban Audit. Data from these cities is not displayed here. **Regional GDP per head in PPS: UA 2004 data for cities from CY, DE (except Göttingen, Saarbrücken), EE, FI, MT, PT (except Lisboa), SE (Linköping, Orebrö, Uppsala), SK; NUTS 2 data for cities from TR; NUTS 3 data for all other cities.
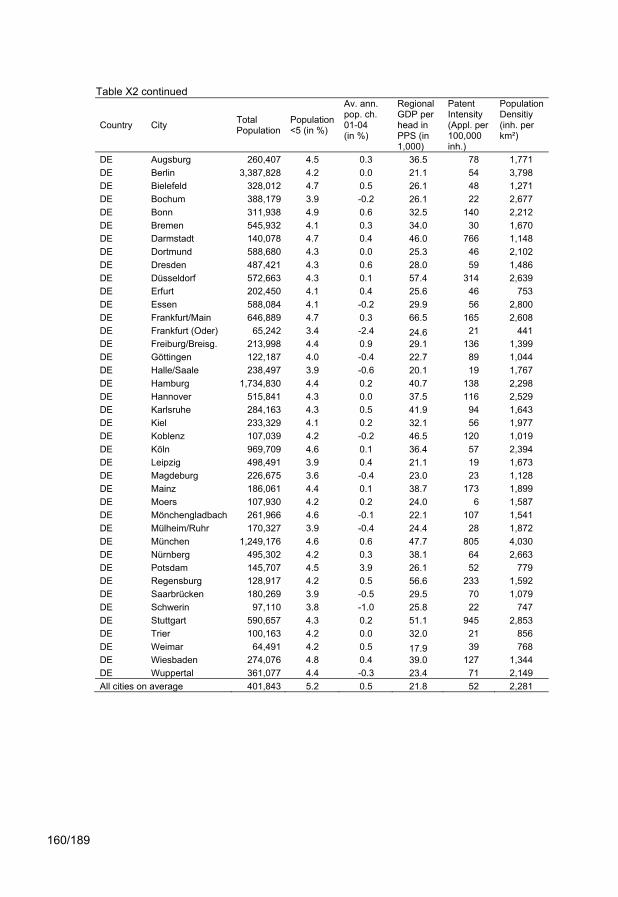
160/189
Table X2 continued
Country City Total Population
Population <5 (in %)
Av. ann. pop. ch. 01-04 (in %)
Regional GDP per head in PPS (in 1,000)
Patent Intensity (Appl. per 100,000 inh.)
Population Densitiy (inh. per km²)
DE Augsburg 260,407 4.5 0.3 36.5 78 1,771 DE Berlin 3,387,828 4.2 0.0 21.1 54 3,798 DE Bielefeld 328,012 4.7 0.5 26.1 48 1,271 DE Bochum 388,179 3.9 -0.2 26.1 22 2,677 DE Bonn 311,938 4.9 0.6 32.5 140 2,212 DE Bremen 545,932 4.1 0.3 34.0 30 1,670 DE Darmstadt 140,078 4.7 0.4 46.0 766 1,148 DE Dortmund 588,680 4.3 0.0 25.3 46 2,102 DE Dresden 487,421 4.3 0.6 28.0 59 1,486 DE Düsseldorf 572,663 4.3 0.1 57.4 314 2,639 DE Erfurt 202,450 4.1 0.4 25.6 46 753 DE Essen 588,084 4.1 -0.2 29.9 56 2,800 DE Frankfurt/Main 646,889 4.7 0.3 66.5 165 2,608 DE Frankfurt (Oder) 65,242 3.4 -2.4 24.6 21 441 DE Freiburg/Breisg. 213,998 4.4 0.9 29.1 136 1,399 DE Göttingen 122,187 4.0 -0.4 22.7 89 1,044 DE Halle/Saale 238,497 3.9 -0.6 20.1 19 1,767 DE Hamburg 1,734,830 4.4 0.2 40.7 138 2,298 DE Hannover 515,841 4.3 0.0 37.5 116 2,529 DE Karlsruhe 284,163 4.3 0.5 41.9 94 1,643 DE Kiel 233,329 4.1 0.2 32.1 56 1,977 DE Koblenz 107,039 4.2 -0.2 46.5 120 1,019 DE Köln 969,709 4.6 0.1 36.4 57 2,394 DE Leipzig 498,491 3.9 0.4 21.1 19 1,673 DE Magdeburg 226,675 3.6 -0.4 23.0 23 1,128 DE Mainz 186,061 4.4 0.1 38.7 173 1,899 DE Moers 107,930 4.2 0.2 24.0 6 1,587 DE Mönchengladbach 261,966 4.6 -0.1 22.1 107 1,541 DE Mülheim/Ruhr 170,327 3.9 -0.4 24.4 28 1,872 DE München 1,249,176 4.6 0.6 47.7 805 4,030 DE Nürnberg 495,302 4.2 0.3 38.1 64 2,663 DE Potsdam 145,707 4.5 3.9 26.1 52 779 DE Regensburg 128,917 4.2 0.5 56.6 233 1,592 DE Saarbrücken 180,269 3.9 -0.5 29.5 70 1,079 DE Schwerin 97,110 3.8 -1.0 25.8 22 747 DE Stuttgart 590,657 4.3 0.2 51.1 945 2,853 DE Trier 100,163 4.2 0.0 32.0 21 856 DE Weimar 64,491 4.2 0.5 17.9 39 768 DE Wiesbaden 274,076 4.8 0.4 39.0 127 1,344 DE Wuppertal 361,077 4.4 -0.3 23.4 71 2,149 All cities on average 401,843 5.2 0.5 21.8 52 2,281

161/189
Table X2 continued
Country City Total Population
Population <5 (in %)
Av. ann. pop. ch. 01-04 (in %)
Regional GDP per head in PPS (in 1,000)
Patent Intensity (Appl. per 100,000 inh.)
Population Densitiy (inh. per km²)
DK Aalborg 163,231 5.6 0.3 24.4 16 2,332 DK Aarhus 293,510 6.4 0.8 26.0 13 621 DK København 501,664 6.4 0.2 39.1 64 5,630 DK Odense 185,206 6.1 0.3 25.3 22 634 EE Tallinn 392,306 4.4 -0.6 21.1 3 2,647 EE Tartu 100,482 5.6 -0.2 12.6 4 2,681 ES Alicante/Alacant 310,330 4.6 1.9 19.4 17 1,539 ES Badajoz 139,135 5.1 1.4 14.1 5 95 ES Barcelona 1,578,546 4.1 1.6 25.9 46 15,770 ES Bilbao 352,317 3.8 -0.2 26.3 4 8,656 ES Córdoba 319,692 5.1 0.5 14.8 1 255 ES Gijón 271,039 3.0 0.1 18.9 4 1,494 ES Las Palmas 376,953 5.0 2.1 19.9 3 3,705 ES L'Hospitalet de L. 250,536 4.1 0.8 25.9 29 20,107 ES Logroño 141,568 4.8 2.1 23.7 10 1,779 ES Madrid 3,099,834 3.9 1.8 28.7 17 5,127 ES Málaga 547,731 4.9 1.5 17.4 5 1,390 ES Murcia 398,815 5.8 2.5 18.4 6 450 ES Oviedo 209,495 3.4 1.4 18.9 2 1,122 ES Palma di Mallorca 368,974 5.2 3.5 24.4 4 1,891 ES Pamplona/Iruña 191,865 4.8 1.4 27.5 24 7,641 ES Santa Cruz de T. 219,446 4.0 0.3 19.7 5 1,463 ES Santander 183,799 3.7 0.6 21.3 2 5,297 ES Santiago de Com. 92,298 3.7 0.8 18.4 21 419 ES Sevilla 704,203 4.8 1.0 17.2 5 4,983 ES Toledo 73,485 4.7 2.5 16.8 29 317 ES Valencia 785,732 4.6 2.1 20.5 18 5,764 ES Valladolid 321,713 3.8 0.5 22.7 4 1,630 ES Vigo 292,059 4.2 0.4 17.7 7 2,791 ES Vitoria/Gasteiz 223,702 4.3 1.1 30.2 12 808 ES Zaragoza 638,799 4.4 1.3 23.7 10 601 FI Helsinki 559,716 0.0 41.1 145 3,008 FI Oulu 124,588 0.4 37.8 39 FI Tampere 199,823 0.3 33.2 110 382 FI Turku 174,618 0.2 29.2 71 709 FR Aix-en-Provence 343,611 1.1 24.1 20 FR Ajaccio 68,438 2.5 21.2 6 FR Amiens 171,979 0.1 19.7 30 FR Besançon 174,794 0.8 22.8 31 FR Bordeaux 700,027 2.0 23.8 6 All cities on average 401,843 5.2 0.5 21.8 52 2,281
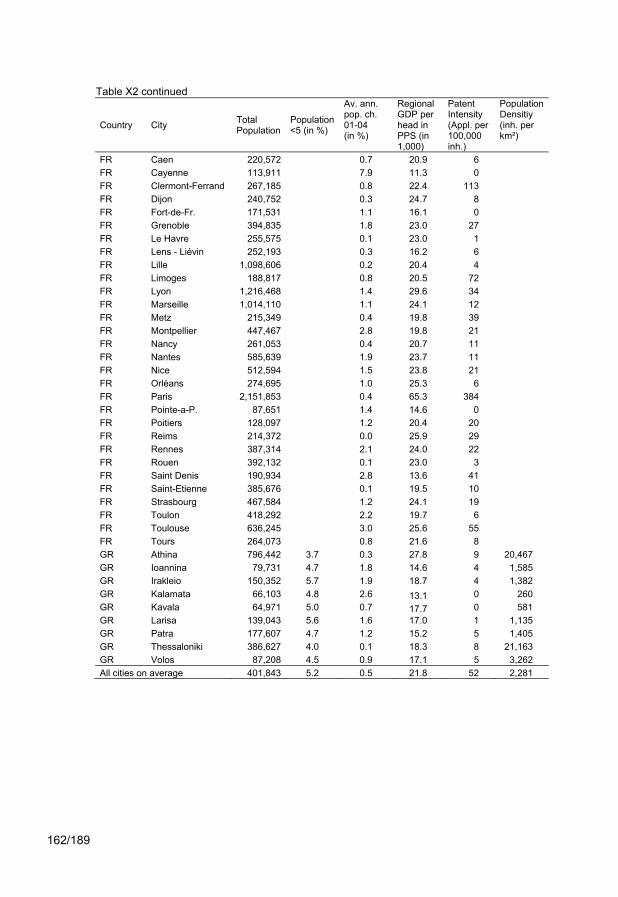
162/189
Table X2 continued
Country City Total Population
Population <5 (in %)
Av. ann. pop. ch. 01-04 (in %)
Regional GDP per head in PPS (in 1,000)
Patent Intensity (Appl. per 100,000 inh.)
Population Densitiy (inh. per km²)
FR Caen 220,572 0.7 20.9 6 FR Cayenne 113,911 7.9 11.3 0 FR Clermont-Ferrand 267,185 0.8 22.4 113 FR Dijon 240,752 0.3 24.7 8 FR Fort-de-Fr. 171,531 1.1 16.1 0 FR Grenoble 394,835 1.8 23.0 27 FR Le Havre 255,575 0.1 23.0 1 FR Lens - Liévin 252,193 0.3 16.2 6 FR Lille 1,098,606 0.2 20.4 4 FR Limoges 188,817 0.8 20.5 72 FR Lyon 1,216,468 1.4 29.6 34 FR Marseille 1,014,110 1.1 24.1 12 FR Metz 215,349 0.4 19.8 39 FR Montpellier 447,467 2.8 19.8 21 FR Nancy 261,053 0.4 20.7 11 FR Nantes 585,639 1.9 23.7 11 FR Nice 512,594 1.5 23.8 21 FR Orléans 274,695 1.0 25.3 6 FR Paris 2,151,853 0.4 65.3 384 FR Pointe-a-P. 87,651 1.4 14.6 0 FR Poitiers 128,097 1.2 20.4 20 FR Reims 214,372 0.0 25.9 29 FR Rennes 387,314 2.1 24.0 22 FR Rouen 392,132 0.1 23.0 3 FR Saint Denis 190,934 2.8 13.6 41 FR Saint-Etienne 385,676 0.1 19.5 10 FR Strasbourg 467,584 1.2 24.1 19 FR Toulon 418,292 2.2 19.7 6 FR Toulouse 636,245 3.0 25.6 55 FR Tours 264,073 0.8 21.6 8 GR Athina 796,442 3.7 0.3 27.8 9 20,467 GR Ioannina 79,731 4.7 1.8 14.6 4 1,585 GR Irakleio 150,352 5.7 1.9 18.7 4 1,382 GR Kalamata 66,103 4.8 2.6 13.1 0 260 GR Kavala 64,971 5.0 0.7 17.7 0 581 GR Larisa 139,043 5.6 1.6 17.0 1 1,135 GR Patra 177,607 4.7 1.2 15.2 5 1,405 GR Thessaloniki 386,627 4.0 0.1 18.3 8 21,163 GR Volos 87,208 4.5 0.9 17.1 5 3,262 All cities on average 401,843 5.2 0.5 21.8 52 2,281
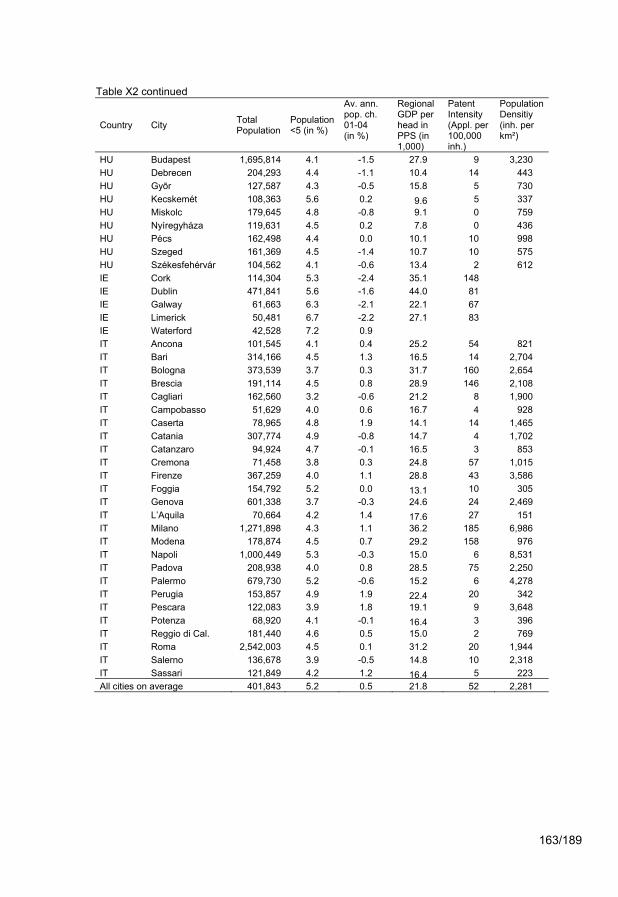
163/189
Table X2 continued
Country City Total Population
Population <5 (in %)
Av. ann. pop. ch. 01-04 (in %)
Regional GDP per head in PPS (in 1,000)
Patent Intensity (Appl. per 100,000 inh.)
Population Densitiy (inh. per km²)
HU Budapest 1,695,814 4.1 -1.5 27.9 9 3,230 HU Debrecen 204,293 4.4 -1.1 10.4 14 443 HU Gyõr 127,587 4.3 -0.5 15.8 5 730 HU Kecskemét 108,363 5.6 0.2 9.6 5 337 HU Miskolc 179,645 4.8 -0.8 9.1 0 759 HU Nyíregyháza 119,631 4.5 0.2 7.8 0 436 HU Pécs 162,498 4.4 0.0 10.1 10 998 HU Szeged 161,369 4.5 -1.4 10.7 10 575 HU Székesfehérvár 104,562 4.1 -0.6 13.4 2 612 IE Cork 114,304 5.3 -2.4 35.1 148 IE Dublin 471,841 5.6 -1.6 44.0 81 IE Galway 61,663 6.3 -2.1 22.1 67 IE Limerick 50,481 6.7 -2.2 27.1 83 IE Waterford 42,528 7.2 0.9 IT Ancona 101,545 4.1 0.4 25.2 54 821 IT Bari 314,166 4.5 1.3 16.5 14 2,704 IT Bologna 373,539 3.7 0.3 31.7 160 2,654 IT Brescia 191,114 4.5 0.8 28.9 146 2,108 IT Cagliari 162,560 3.2 -0.6 21.2 8 1,900 IT Campobasso 51,629 4.0 0.6 16.7 4 928 IT Caserta 78,965 4.8 1.9 14.1 14 1,465 IT Catania 307,774 4.9 -0.8 14.7 4 1,702 IT Catanzaro 94,924 4.7 -0.1 16.5 3 853 IT Cremona 71,458 3.8 0.3 24.8 57 1,015 IT Firenze 367,259 4.0 1.1 28.8 43 3,586 IT Foggia 154,792 5.2 0.0 13.1 10 305 IT Genova 601,338 3.7 -0.3 24.6 24 2,469 IT L’Aquila 70,664 4.2 1.4 17.6 27 151 IT Milano 1,271,898 4.3 1.1 36.2 185 6,986 IT Modena 178,874 4.5 0.7 29.2 158 976 IT Napoli 1,000,449 5.3 -0.3 15.0 6 8,531 IT Padova 208,938 4.0 0.8 28.5 75 2,250 IT Palermo 679,730 5.2 -0.6 15.2 6 4,278 IT Perugia 153,857 4.9 1.9 22.4 20 342 IT Pescara 122,083 3.9 1.8 19.1 9 3,648 IT Potenza 68,920 4.1 -0.1 16.4 3 396 IT Reggio di Cal. 181,440 4.6 0.5 15.0 2 769 IT Roma 2,542,003 4.5 0.1 31.2 20 1,944 IT Salerno 136,678 3.9 -0.5 14.8 10 2,318 IT Sassari 121,849 4.2 1.2 16.4 5 223 All cities on average 401,843 5.2 0.5 21.8 52 2,281

164/189
Table X2 continued
Country City Total Population
Population <5 (in %)
Av. ann. pop. ch. 01-04 (in %)
Regional GDP per head in PPS (in 1,000)
Patent Intensity (Appl. per 100,000 inh.)
Population Densitiy (inh. per km²)
IT Taranto 199,131 3.9 -0.5 15.6 7 950 IT Torino 867,857 4.1 1.4 26.4 103 6,667 IT Trento 108,577 4.9 1.7 27.2 81 688 IT Trieste 207,069 3.6 -0.6 27.1 30 2,465 IT Venezia 271,663 3.9 0.0 27.1 27 653 IT Verona 258,115 4.3 0.8 27.9 42 1,249 LT Kaunas 368,913 4.3 -0.9 10.4 1 2,555 LT Panevezys 117,593 4.3 -0.6 9.1 0 2,395 LT Vilnius 552,800 4.4 -0.1 16.0 1 1,407 LU Luxembourg 83,226 5.5 2.8 54.9 371 1,617 LV Liepaja 86,476 4.6 -0.8 8.7 0 1,432 LV Riga 735,241 3.9 -0.9 18.1 2 2,394 MT Gozo 31,964 4.6 1.2 11.0 6 472 MT Valletta 209,422 4.4 15.9 1 1,479 NL Almere 170,704 8.3 2.5 20.7 11 1,267 NL Amsterdam 739,104 6.3 0.2 44.8 92 4,439 NL Apeldoorn 156,000 6.1 0.2 22.2 21 458 NL Arnhem 141,601 6.0 0.5 26.6 159 1,442 NL Breda 166,035 6.2 0.5 30.6 23 1,297 NL Eindhoven 207,870 5.8 0.7 28.1 3677 2,365 NL Enschede 152,989 5.8 0.6 22.9 29 1,081 NL Groningen 179,185 5.1 0.9 60 2,270 NL Heerlen 93,523 4.8 -0.6 26.2 551 2,087 NL Leeuwarden 91,354 5.5 0.3 24.2 14 1,153 NL Nijmegen 157,466 5.4 0.6 26.6 29 2,907 NL Rotterdam 598,923 6.1 0.2 29.9 137 2,912 NL Tilburg 198,767 6.2 0.5 24.4 42 1,692 NL s‘ Gravenhage 469,059 6.5 2.0 31.8 2 5,626 NL Utrecht 270,244 6.7 1.8 34.0 60 2,781 NO Bergen 237,430 6.6 0.9 13 534 NO Kristiansand 75,280 6.4 1.0 16 291 NO Oslo 521,886 6.6 0.9 65 1,225 NO Stavanger 112,405 6.9 1.1 82 394 NO Tromsø 61,897 7.0 1.0 3 25 NO Trondheim 154,351 6.5 0.9 54 480 All cities on average 401,843 5.2 0.5 21.8 52 2,281
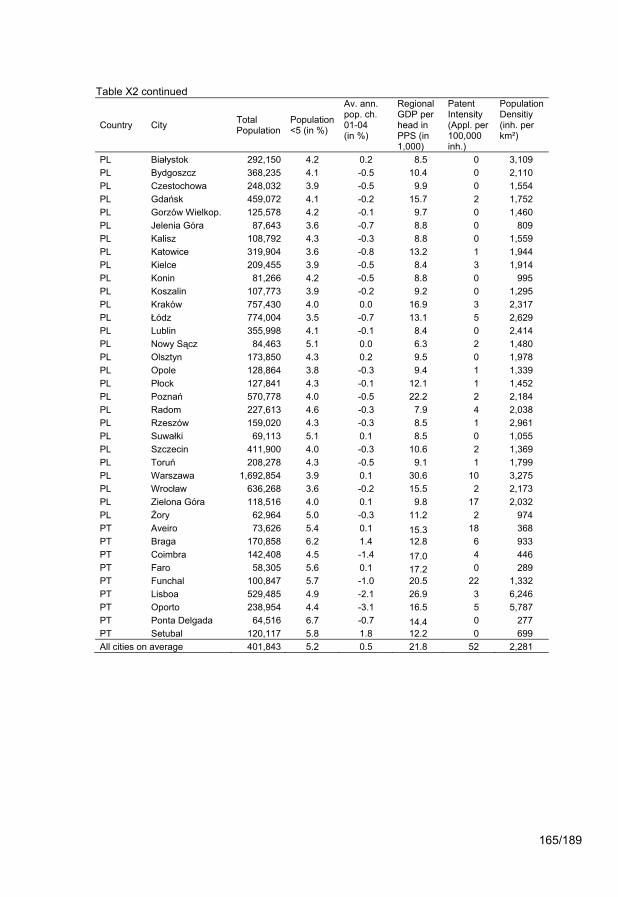
165/189
Table X2 continued
Country City Total Population
Population <5 (in %)
Av. ann. pop. ch. 01-04 (in %)
Regional GDP per head in PPS (in 1,000)
Patent Intensity (Appl. per 100,000 inh.)
Population Densitiy (inh. per km²)
PL Białystok 292,150 4.2 0.2 8.5 0 3,109 PL Bydgoszcz 368,235 4.1 -0.5 10.4 0 2,110 PL Czestochowa 248,032 3.9 -0.5 9.9 0 1,554 PL Gdańsk 459,072 4.1 -0.2 15.7 2 1,752 PL Gorzów Wielkop. 125,578 4.2 -0.1 9.7 0 1,460 PL Jelenia Góra 87,643 3.6 -0.7 8.8 0 809 PL Kalisz 108,792 4.3 -0.3 8.8 0 1,559 PL Katowice 319,904 3.6 -0.8 13.2 1 1,944 PL Kielce 209,455 3.9 -0.5 8.4 3 1,914 PL Konin 81,266 4.2 -0.5 8.8 0 995 PL Koszalin 107,773 3.9 -0.2 9.2 0 1,295 PL Kraków 757,430 4.0 0.0 16.9 3 2,317 PL Łódz 774,004 3.5 -0.7 13.1 5 2,629 PL Lublin 355,998 4.1 -0.1 8.4 0 2,414 PL Nowy Sącz 84,463 5.1 0.0 6.3 2 1,480 PL Olsztyn 173,850 4.3 0.2 9.5 0 1,978 PL Opole 128,864 3.8 -0.3 9.4 1 1,339 PL Płock 127,841 4.3 -0.1 12.1 1 1,452 PL Poznań 570,778 4.0 -0.5 22.2 2 2,184 PL Radom 227,613 4.6 -0.3 7.9 4 2,038 PL Rzeszów 159,020 4.3 -0.3 8.5 1 2,961 PL Suwałki 69,113 5.1 0.1 8.5 0 1,055 PL Szczecin 411,900 4.0 -0.3 10.6 2 1,369 PL Toruń 208,278 4.3 -0.5 9.1 1 1,799 PL Warszawa 1,692,854 3.9 0.1 30.6 10 3,275 PL Wrocław 636,268 3.6 -0.2 15.5 2 2,173 PL Zielona Góra 118,516 4.0 0.1 9.8 17 2,032 PL Żory 62,964 5.0 -0.3 11.2 2 974 PT Aveiro 73,626 5.4 0.1 15.3 18 368 PT Braga 170,858 6.2 1.4 12.8 6 933 PT Coimbra 142,408 4.5 -1.4 17.0 4 446 PT Faro 58,305 5.6 0.1 17.2 0 289 PT Funchal 100,847 5.7 -1.0 20.5 22 1,332 PT Lisboa 529,485 4.9 -2.1 26.9 3 6,246 PT Oporto 238,954 4.4 -3.1 16.5 5 5,787 PT Ponta Delgada 64,516 6.7 -0.7 14.4 0 277 PT Setubal 120,117 5.8 1.8 12.2 0 699 All cities on average 401,843 5.2 0.5 21.8 52 2,281
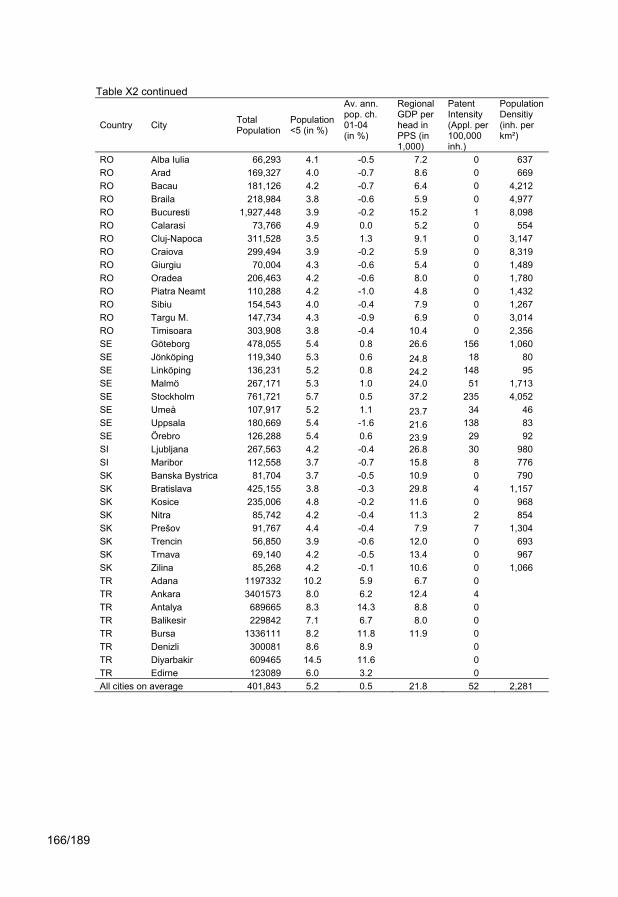
166/189
Table X2 continued
Country City Total Population
Population <5 (in %)
Av. ann. pop. ch. 01-04 (in %)
Regional GDP per head in PPS (in 1,000)
Patent Intensity (Appl. per 100,000 inh.)
Population Densitiy (inh. per km²)
RO Alba Iulia 66,293 4.1 -0.5 7.2 0 637 RO Arad 169,327 4.0 -0.7 8.6 0 669 RO Bacau 181,126 4.2 -0.7 6.4 0 4,212 RO Braila 218,984 3.8 -0.6 5.9 0 4,977 RO Bucuresti 1,927,448 3.9 -0.2 15.2 1 8,098 RO Calarasi 73,766 4.9 0.0 5.2 0 554 RO Cluj-Napoca 311,528 3.5 1.3 9.1 0 3,147 RO Craiova 299,494 3.9 -0.2 5.9 0 8,319 RO Giurgiu 70,004 4.3 -0.6 5.4 0 1,489 RO Oradea 206,463 4.2 -0.6 8.0 0 1,780 RO Piatra Neamt 110,288 4.2 -1.0 4.8 0 1,432 RO Sibiu 154,543 4.0 -0.4 7.9 0 1,267 RO Targu M. 147,734 4.3 -0.9 6.9 0 3,014 RO Timisoara 303,908 3.8 -0.4 10.4 0 2,356 SE Göteborg 478,055 5.4 0.8 26.6 156 1,060 SE Jönköping 119,340 5.3 0.6 24.8 18 80 SE Linköping 136,231 5.2 0.8 24.2 148 95 SE Malmö 267,171 5.3 1.0 24.0 51 1,713 SE Stockholm 761,721 5.7 0.5 37.2 235 4,052 SE Umeå 107,917 5.2 1.1 23.7 34 46 SE Uppsala 180,669 5.4 -1.6 21.6 138 83 SE Örebro 126,288 5.4 0.6 23.9 29 92 SI Ljubljana 267,563 4.2 -0.4 26.8 30 980 SI Maribor 112,558 3.7 -0.7 15.8 8 776 SK Banska Bystrica 81,704 3.7 -0.5 10.9 0 790 SK Bratislava 425,155 3.8 -0.3 29.8 4 1,157 SK Kosice 235,006 4.8 -0.2 11.6 0 968 SK Nitra 85,742 4.2 -0.4 11.3 2 854 SK Prešov 91,767 4.4 -0.4 7.9 7 1,304 SK Trencin 56,850 3.9 -0.6 12.0 0 693 SK Trnava 69,140 4.2 -0.5 13.4 0 967 SK Zilina 85,268 4.2 -0.1 10.6 0 1,066 TR Adana 1197332 10.2 5.9 6.7 0 TR Ankara 3401573 8.0 6.2 12.4 4 TR Antalya 689665 8.3 14.3 8.8 0 TR Balikesir 229842 7.1 6.7 8.0 0 TR Bursa 1336111 8.2 11.8 11.9 0 TR Denizli 300081 8.6 8.9 0 TR Diyarbakir 609465 14.5 11.6 0 TR Edirne 123089 6.0 3.2 0 All cities on average 401,843 5.2 0.5 21.8 52 2,281

167/189
Table X2 continued
Country City Total Population
Population <5 (in %)
Av. ann. pop. ch. 01-04 (in %)
Regional GDP per head in PPS (in 1,000)
Patent Intensity (Appl. per 100,000 inh.)
Population Densitiy (inh. per km²)
TR Erzurum 405733 11.6 12.4 4.3 0 TR Gaziantep 945804 13.3 10.8 4.6 0 TR Hatay 149919 11.3 3.5 5.3 0 TR Istanbul 9897599 8.6 12.4 15.3 2 TR Izmir 2386759 7.2 6.9 11.5 0 TR Kars 76420 11.9 -2.6 0 TR Kastamonu 67102 7.1 3.9 6.5 0 TR Kayseri 572170 10.0 6.0 5.7 0 TR Kocaeli 191471 8.8 -2.2 12.5 2 TR Konya 829636 10.8 11.7 5.7 0 TR Malatya 420920 9.8 10.5 4.6 0 TR Manisa 234156 8.1 9.2 6.8 4 TR Nevsehir 72841 9.5 7.3 0 TR Samsun 379933 9.5 4.6 5.7 0 TR Siirt 109271 17.1 11.2 0 TR Trabzon 230618 8.4 7.3 4.8 0 TR Van 336700 17.1 18.4 3.0 0 TR Zonguldak 96504 7.7 -7.5 9.7 0 UK Aberdeen 203,500 4.6 -1.4 30.5 61 1,094 UK Belfast 268,978 5.9 -1.0 38.0 19 2,445 UK Birmingham 992,400 7.1 0.5 26.7 15 3,703 UK Bradford 481,100 7.3 1.0 21.0 16 1,340 UK Bristol 393,900 5.7 1.2 36.6 46 3,367 UK Cambridge 118,500 4.5 3.0 25.4 623 2,890 UK Cardiff 316,800 5.5 1.2 29.3 22 2,279 UK Coventry 304,200 5.9 0.0 25.6 24 3,104 UK Derry 106,889 7.2 0.6 17.4 12 281 UK Edinburgh 453,700 4.7 0.4 42.4 32 1,719 UK Exeter 115,200 4.7 1.2 20.9 15 2,400 UK Glasgow 577,700 5.2 0.0 35.5 30 3,301 UK Gravesham 94,900 5.7 -0.3 22.4 0 940 UK Kingston-on-Hull 248,500 5.6 0.0 24.9 16 3,451 UK Leeds 719,600 5.4 0.2 31.1 16 1,304 UK Leicester 285,100 6.8 0.6 30.5 33 3,853 UK Lincoln 86,500 5.4 0.4 19.7 65 2,403 UK Liverpool 444,500 5.3 0.4 23.6 10 2,744 All cities on average 401,843 5.2 0.5 21.8 52 2,281

168/189
Table X2 continued
Country City Total Population
Population <5 (in %)
Av. ann. pop. ch. 01-04 (in %)
Regional GDP per head in PPS (in 1,000)
Patent Intensity (Appl. per 100,000 inh.)
Population Densitiy (inh. per km²)
UK London 7,429,200 6.5 1.2 72.5 42 UK Manchester 437,000 6.1 1.5 30.3 65 3,767 UK Newcastle on T. 269,500 5.2 1.3 23.9 25 2,343 UK Nottingham 275,100 5.5 0.5 37.5 47 3,668 UK Portsmouth 188,500 5.5 0.3 29.1 7 3,307 UK Sheffield 516,100 5.4 0.2 23.4 22 1,391 UK Stevenage 79,000 6.5 -0.3 31.2 48 3,160 UK Stoke-on-trent 238,000 5.8 -0.1 21.6 45 2,559 UK Wirral 313,100 5.5 -0.1 16.0 9 1,423 UK Wolverhampton 239,100 5.9 0.0 22.3 7 3,465 UK Worcester 93,600 6.1 0.1 23.1 104 2,836 UK Wrexham 130,200 5.6 0.5 23.2 5 258 All cities on average 401,843 5.2 0.5 21.8 52 2,281
Table X3 Change in the number of cities participating in the Urban Audit “Old” Cities (UA 2001) “New” Cities (UA 2004)* Old & New Cities
Cities Pop. (mil)
Average pop. per
city Cities Pop.
(mil)
Average pop. per
city Cities Pop.
(mil)
Average pop. per
city
EU15 189 79.8 422.236 39 8.5 218.559 228 90.3 395.904
CC12 69 23.3 338.187 23 2.6 111.065 92 25.5 277.524
EU27 258 103.1 399.758 62 11.1 178.682 320 115.8 361.870
*Own calculation based on the Urban Audit (2004), update from February 2009; pop. = population
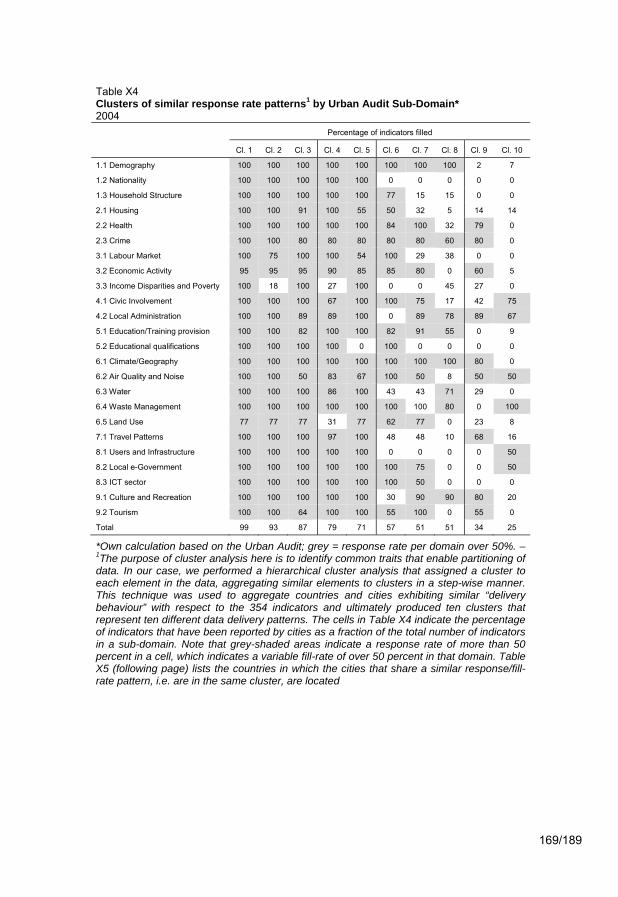
169/189
Table X4 Clusters of similar response rate patterns1 by Urban Audit Sub-Domain* 2004 Percentage of indicators filled
Cl. 1 Cl. 2 Cl. 3 Cl. 4 Cl. 5 Cl. 6 Cl. 7 Cl. 8 Cl. 9 Cl. 10
1.1 Demography 100 100 100 100 100 100 100 100 2 7
1.2 Nationality 100 100 100 100 100 0 0 0 0 0
1.3 Household Structure 100 100 100 100 100 77 15 15 0 0
2.1 Housing 100 100 91 100 55 50 32 5 14 14
2.2 Health 100 100 100 100 100 84 100 32 79 0
2.3 Crime 100 100 80 80 80 80 80 60 80 0
3.1 Labour Market 100 75 100 100 54 100 29 38 0 0
3.2 Economic Activity 95 95 95 90 85 85 80 0 60 5
3.3 Income Disparities and Poverty 100 18 100 27 100 0 0 45 27 0
4.1 Civic Involvement 100 100 100 67 100 100 75 17 42 75
4.2 Local Administration 100 100 89 89 100 0 89 78 89 67
5.1 Education/Training provision 100 100 82 100 100 82 91 55 0 9
5.2 Educational qualifications 100 100 100 100 0 100 0 0 0 0
6.1 Climate/Geography 100 100 100 100 100 100 100 100 80 0
6.2 Air Quality and Noise 100 100 50 83 67 100 50 8 50 50
6.3 Water 100 100 100 86 100 43 43 71 29 0
6.4 Waste Management 100 100 100 100 100 100 100 80 0 100
6.5 Land Use 77 77 77 31 77 62 77 0 23 8
7.1 Travel Patterns 100 100 100 97 100 48 48 10 68 16
8.1 Users and Infrastructure 100 100 100 100 100 0 0 0 0 50
8.2 Local e-Government 100 100 100 100 100 100 75 0 0 50
8.3 ICT sector 100 100 100 100 100 100 50 0 0 0
9.1 Culture and Recreation 100 100 100 100 100 30 90 90 80 20
9.2 Tourism 100 100 64 100 100 55 100 0 55 0
Total 99 93 87 79 71 57 51 51 34 25
*Own calculation based on the Urban Audit; grey = response rate per domain over 50%. – 1The purpose of cluster analysis here is to identify common traits that enable partitioning of data. In our case, we performed a hierarchical cluster analysis that assigned a cluster to each element in the data, aggregating similar elements to clusters in a step-wise manner. This technique was used to aggregate countries and cities exhibiting similar “delivery behaviour” with respect to the 354 indicators and ultimately produced ten clusters that represent ten different data delivery patterns. The cells in Table X4 indicate the percentage of indicators that have been reported by cities as a fraction of the total number of indicators in a sub-domain. Note that grey-shaded areas indicate a response rate of more than 50 percent in a cell, which indicates a variable fill-rate of over 50 percent in that domain. Table X5 (following page) lists the countries in which the cities that share a similar response/fill-rate pattern, i.e. are in the same cluster, are located

170/189
Table X5 Countries and cities within clusters of similar response rate Cluster
Cl. 1 Cl. 2 Cl. 3 Cl. 4 Cl. 5 Cl. 6 Cl. 7 Cl. 8 Cl. 9 Cl. 10
Number of cities in the cluster 82 14 40 25 58 28 28 26 35 21
Country and number of cities from that country in the corresponding cluster
AT: 5 FI: 4 DE: 40 ES: 25 CH: 4 UK: 28 PL: 28 TR: 26 FR: 35 BG: 7
BE: 7 HU: 9 IT: 31 CZ: 14
CY: 1 LV: 1 PT: 9
DK: 4 RO: 14
EE: 2
GR: 9
IE: 5
IT: 1
LT: 3
LU: 1
LV: 1
MT: 2
NL: 15
NO: 6
SE: 8
SI: 2
SK: 8
UK: 2

171/189
Table X6 Dimensions of intra-city differentials in Europe 2004 – factor loadings* Indicator UA Domain Factor
1. Economic agglomer
ation
2. Age structure and fertility
3. Talent
4. Size and
density
total resident population Demography .673
population aged 0-4 (in %) Demography .886
population aged 35-44 (in %) Demography .511
population aged > 75 (in %) Demography .723 -.482
population core city/LUZ relation Demography -.497
total population change 2001-2004 (in%) Social Aspects .514 .618
natural population change 2004 (in %) Social Aspects .899
murders and violent deaths per 1,000 population
Social Aspects
GDP per head in PPS Economy .889
patent intensity Economy (compiled by RWI) .804
new businesses (in %) Economy
employment in services (in %) Economy .608 .475
unemployment rate (in %) Economy -.738
local companies that provide ICT services (in % of all companies)
Information Technology .447 .470
working-age population qualified at university level (in %)
Training & Education .814
students in university education per 1,000 inhabitants
Training & Education
multi-modal accessibility (EU27 =100) Travel & Transport. .648
population density Environment .900
no. of days PM10 concentration >50 µg per m³
Environment
solid waste processed by landfill (in %) Environment -.484
annual cinema attendance Culture & Recreation .618 .439
explained variance (in %) 23 13 9 7
Own calculation based on Urban Audit (2004 period); *only loadings above 0.4 and below -0.4 are shown; 277 observations

172/189
Table X7 Cities and institutions represented in the Urban Audit City Panel 2009
Country Position/Company City
1 Austria Vienna Municipal Department 5 - Finance, Budget and Statistics (MA 5)
Wien
2 Belgium Research Assistant , University of Liege - LEPUR Liege
3 Research Assistant, Université Libre de Bruxelles Bruxelles
4Czech Republic
Project Manager, Czech Statistical Office Prag
5 Denmark Head of Section, Statistics Copenhagen, City of Copenhagen
Copenhagen
6 Estonia Head of Development Service, Department of Urban Planning and Land Survey, Tartu
Tartu
7 Finland City of Helsinki Head of information services Helsinki
8 Researcher, City of Helsinki Urban Facts Helsinki
9 Research manager, City of Oulu Oulu
10 France Economist, Agence d'urbanisme lyonnaise Lyon
11CEO, Agence de développement et d’urbanisme de Lille Métropole
Lille
12Head of URBACT Secretariat Saint Denis la
Plaine
13 Germany Projektleiter, Amt für Statistik und Wahlen, Stadt Frankfurt am Main
Frankfurt
14Abteilungsleiter, Amt für Stadtentwicklung und Statistik, Stadt Köln
Köln
15Senatsverwaltung für Stadtentwicklung Referat Stadtentwicklungsplanung
Berlin
16 Greece Mayor's consultant, EU Project's Department, Municipality of Kavala
Kavala
17
Hungary Head of Section, Dissemination and Information Servicxe, Debrecen, Hungarian Central Statistical Office
Debrecen
18 Ireland Research Manager, International Relations & Research
Dublin
19 Italy Dipartimento di Scienza della Politica e Sociologia, University of Florence
Florence
20Director of Torino Internazionale Torino
21 Latvia Senior Officer, Analystical Planning Division Riga
22Lithuania Strategic Planning Department, City of Kaunas Kaunas
23 Netherlands Head of Research Department, City of Eindhoven Eindhoven
24 Poland Elder Specialist, Statistical Office in Poznań, Branch in Kalisz
Kalisz
25 Portugal Head of Studies Department, Porto City Council Porto

173/189
Table X7 continued
26 Romania Expert, National Institute of Statistics Bukarest
27Slovakia Architect responsible for Kosice 2013 investment
projects Kosice
28Slovenia Deputy Director of Development, Ljubljana Urban
Region Ljubljana
29Sweden Analyst
Jönköping Municipality Sweden Jönköping
30City Administrative Services Department, Jönköping Municipality
Jönköping
31Switzerland Sektionsleiter Wirtschaft / Informatik, Statistikdienste
der Stadt Bern Bern
32Spain Responsible of studies Department, City council of
Gijón Gijón
33Técnico del Observatorio Socioeconómico Santa Cruz de
Tenerife
34United Kingdom
Economic Strategy Officer, Regional Development, Hull City Council
Hull
35Head of Data Management and Analysis Greater London Authority
London

174/189
Table X8 City powers index 2004 Code City Index scores* Powers
index mean of scores 1-6
Powers index ranking of city values according to quartiles 1-4
For informa-tion only ranking of city values according to thresholds from first State of European Cities Report
1. Popu- lation
2. Annual expen-diture per resident
3. Proportion of municipal authority income of local taxation
4. Local taxes & contributions in relation to total taxes & contributions
5. Local government expenditure in relation to total government expenditure
6. Correct-ion factor: administra-tive structure
dk004c Aalborg 2 5 5 5 5 0 3.67 4 4 dk002c Aarhus 2 5 5 5 5 0 3.67 4 4 uk016c Aberdeen 2 3 3 4 4 0 2.67 4 4 tr002c Adana 4 1 2 3 3 0 2.17 2 3 fr202c Aix-en-Pr. 2 3 5 2 3 0 2.50 3 4 fr027c Ajaccio 1 4 3 2 3 0 2.17 2 3 ro014c Alba Iulia 1 3 3 2 3 0 2.00 2 3 es021c Alicante 2 3 3 2 2 0 2.00 2 3 nl514c Alkmaar 1 3 3 5 5 0 2.83 4 4 nl519c Almelo 1 3 3 5 5 0 2.83 4 4 nl011c Almere 2 1 1 5 5 0 2.33 2 3 fr014c Amiens 2 3 4 2 3 0 2.33 2 3 nl002c Amsterdam 3 1 1 5 5 0 2.50 3 4 it017c Ancona 2 3 5 4 4 0 3.00 4 4 tr001c Ankara 4 1 1 3 3 0 2.00 2 3 tr003c Antalya 3 1 2 3 3 0 2.00 2 3 be002c Antwerpen 2 4 4 1 1 0 2.00 2 3 nl014c Apeldoorn 2 1 1 5 5 0 2.33 2 3 ro008c Arad 2 3 3 2 3 0 2.17 2 3 nl009c Arnhem 2 1 1 5 5 0 2.33 2 3 gr001c Athina 3 1 1 1 1 0 1.17 1 1 de033c Augsburg 2 3 3 2 2 0 2.00 2 3 pt008c Aveiro 1 2 5 1 1 0 1.67 1 2 ro007c Bacau 2 3 3 2 3 0 2.17 2 3 es017c Badajoz 2 3 3 2 2 0 2.00 2 3 tr004c Balikesir 2 1 1 3 3 0 1.67 1 2 sk003c Banska By. 1 2 1 2 2 0 1.33 1 1 es002c Barcelona 4 3 3 2 2 1 2.50 3 4 it008c Bari 2 3 3 4 4 0 2.67 4 4 uk012c Belfast 2 3 3 4 4 -1 2.50 3 4 no002c Bergen 2 5 5 3 4 0 3.17 4 4 de001c Berlin 4 3 3 2 2 1 2.50 3 4 ch004c Bern fr025c Besançon 2 4 3 2 3 0 2.33 2 3 pl011c Bialystok 2 2 2 5 4 0 2.50 3 4 de017c Bielefeld 2 4 3 2 2 0 2.17 2 3 es019c Bilbao 2 3 3 2 2 0 2.00 2 3 uk002c Birmingham 3 3 3 4 4 0 2.83 4 4 de015c Bochum 2 4 3 2 2 0 2.17 2 3 it009c Bologna 2 3 5 4 4 0 3.00 4 4 de034c Bonn 2 4 4 2 2 0 2.33 2 3
Own calculation based on the Urban Audit and regional statistics from Eurostat; *Score 1 (City population): < 100,000 = 1, 100,000- 500,000 = 2, 500,000-1 Million = 3, 1-5 Million = 4, over 5 Million = 5; Scores 2-6: ranking of city values according to quintiles

175/189
Table X8 continued fr007c Bordeaux 3 4 4 2 3 0 2.67 4 4 uk005c Bradford 2 3 3 4 4 0 2.67 4 4 pt003c Braga 2 2 5 1 1 0 1.83 1 2 ro005c Braila 2 3 3 2 3 0 2.17 2 3 sk001c Bratislava 2 2 2 2 2 1 1.83 1 2 nl012c Breda 2 1 1 5 5 0 2.33 2 3 de012c Bremen 3 3 3 2 2 1 2.33 2 3 it029c Brescia 2 3 4 4 4 0 2.83 4 4 uk011c Bristol 2 3 3 4 4 0 2.67 4 4 cz002c Brno 2 3 3 3 3 0 2.33 2 3 be006c Brugge 2 3 1 1 1 0 1.33 1 1 be001c Bruxelles 3 4 4 1 1 1 2.33 2 3 ro001c Bucuresti 4 1 1 2 3 1 2.00 2 3 hu001c Budapest 4 5 2 3 3 1 3.00 4 4 bg004c Burgas 2 3 3 2 2 0 2.00 2 3 tr005c Bursa 4 1 2 3 3 0 2.17 2 3 pl008c Bydgoszcz 2 2 3 5 4 0 2.67 4 4 fr023c Caen 2 3 4 2 3 0 2.33 2 3 it027c Cagliari 2 3 3 4 4 0 2.67 4 4 ro012c Calarasi 1 3 2 2 3 0 1.83 1 2 uk017c Cambridge 2 3 3 4 4 0 2.67 4 4 it020c Campobass 1 3 3 4 4 0 2.50 3 4 uk009c Cardiff 2 3 3 4 4 0 2.67 4 4 it021c Caserta 1 4 3 4 4 0 2.67 4 4 it024c Catanzaro 1 3 3 4 4 0 2.50 3 4 fr031c Cayenne 2 3 5 2 3 0 2.50 3 4 cz008c Ceske 1 3 3 3 3 0 2.17 2 3 be004c Charleroi 2 3 3 1 1 0 1.67 1 2 fr022c Clermont-F. 2 3 4 2 3 0 2.33 2 3 ro002c Cluj-Napoca 2 3 3 2 3 0 2.17 2 3 pt005c Coimbra 2 2 5 1 1 0 1.83 1 2 es020c Córdoba 2 3 3 2 2 0 2.00 2 3 ie002c Cork 2 3 3 5 5 -1 2.83 4 4 uk025c Coventry 2 3 3 4 4 0 2.67 4 4 ro004c Craiova 2 3 3 2 2 0 2.00 2 3 it013c Cremona 1 3 5 4 4 0 2.83 4 4 pl024c Czestochow 2 2 3 5 4 0 2.67 4 4 de025c Darmstadt 2 5 3 2 2 0 2.33 2 3 hu005c Debrecen 2 5 3 3 3 0 2.67 4 4 tr006c Denizli 2 1 1 3 3 0 1.67 1 2 uk015c Derry 2 3 3 4 4 -1 2.50 3 4 nl513c Deventer 1 3 3 5 5 0 2.83 4 4 fr020c Dijon 2 3 5 2 3 0 2.50 3 4 tr007c Diyarbakir 3 1 1 3 3 0 1.83 1 2 de010c Dortmund 3 4 3 2 2 0 2.33 2 3 de009c Dresden 2 3 2 2 2 0 1.83 1 2 ie001c Dublin 2 3 3 5 5 -1 2.83 4 4 de011c Düsseldorf 3 5 5 2 2 0 2.83 4 4 uk007c Edinburgh 2 3 3 4 4 0 2.67 4 4 tr008c Edirne 2 1 1 3 3 0 1.67 1 2 nl005c Eindhoven 2 3 3 5 5 0 3.00 4 4 nl008c Enschede 2 3 3 5 5 0 3.00 4 4 de032c Erfurt 2 3 2 2 2 0 1.83 1 2 tr009c Erzurum 2 1 1 3 3 0 1.67 1 2

176/189
Table X8 continued de006c Essen 3 5 3 2 2 0 2.50 3 4 uk018c Exeter 2 3 3 4 4 0 2.67 4 4 it007c Firenze 2 4 4 4 4 0 3.00 4 4 it031c Foggia 2 4 3 4 4 0 2.83 4 4 fr030c Fort-de-Fr. 2 4 5 2 3 0 2.67 4 4 de029c Frankfurt/O. 1 4 1 2 2 0 1.67 1 2 de005c Frankurt/M. 3 5 5 2 2 0 2.83 4 4 de027c Freiburg 2 4 4 2 2 0 2.33 2 3 pt004c Funchal 2 2 4 1 1 0 1.67 1 2 ie004c Galway 1 3 3 5 5 -1 2.67 4 4 tr010c Gaziantep 3 1 1 3 3 0 1.83 1 2 pl006c Gdansk 2 2 2 5 4 0 2.50 3 4 ch002c Genève it006c Genova 3 3 4 4 4 0 3.00 4 4 be003c Gent 2 4 4 1 1 0 2.00 2 3 es023c Gijón 2 3 3 2 2 0 2.00 2 3 ro013c Giurgiu 1 3 3 2 3 0 2.00 2 3 uk004c Glasgow 3 3 3 4 4 0 2.83 4 4 pl017c Gorzow 2 2 2 5 4 0 2.50 3 4 se002c Göteborg 2 5 5 5 5 0 3.67 4 4 de021c Göttingen 2 5 3 2 2 0 2.33 2 3 mt002c Gozo 1 3 3 1 1 0 1.50 1 2 uk020c Gravesham 1 3 3 4 4 0 2.50 3 4 at002c Graz 2 4 3 2 2 0 2.17 2 3 fr026c Grenoble 2 4 4 2 3 0 2.50 3 4 nl007c Groningen 2 1 1 5 5 0 2.33 2 3 hu007c Gyor 2 5 3 3 3 0 2.67 4 4 de018c Halle/ Saale 2 4 1 2 2 0 1.83 1 2 de002c Hamburg 4 3 3 2 2 1 2.50 3 4 de013c Hannover 3 5 3 2 2 0 2.50 3 4 tr011c Hatay 2 1 1 3 3 0 1.67 1 2 nl010c Heerlen 1 1 2 5 5 0 2.33 2 3 nl516c Helmond 1 3 3 5 5 0 2.83 4 4 fi001c Helsinki 3 5 5 5 5 0 3.83 4 4 es024c Hospitalet 2 3 3 2 2 0 2.00 2 3 cz009c Hradec 1 3 3 3 3 0 2.17 2 3 at005c Innsbruck 2 3 3 2 2 0 2.00 2 3 gr007c Ioannina 1 1 1 1 1 0 0.83 1 1 gr004c Irakleio 2 1 1 1 1 0 1.00 1 1 tr012c Istanbul 5 1 2 3 3 0 2.33 2 3 tr013c Izmir 4 1 2 3 3 0 2.17 2 3 pl019c Jelenia Gora 1 2 2 5 4 0 2.33 2 3 cz014c Jihlava 1 3 3 3 3 0 2.17 2 3 se004c Jönköping 2 5 5 5 5 0 3.67 4 4 gr009c Kalamata 1 1 1 1 1 0 0.83 1 1 pl027c Kalisz 2 2 2 5 4 0 2.50 3 4 cz013c Karlovy Vary 1 3 3 3 3 0 2.17 2 3 de035c Karlsruhe 2 4 4 2 2 0 2.33 2 3 tr014c Kars 1 1 2 3 3 0 1.67 1 2 tr015c Kastamonu 1 1 1 3 3 0 1.50 1 2 pl010c Katowice 2 2 3 5 4 0 2.67 4 4 lt002c Kaunas 2 1 5 3 3 0 2.33 2 3 gr008c Kavala 1 1 1 1 1 0 0.83 1 1

177/189
Table X8 continued tr016c Kayseri 3 1 1 3 3 0 1.83 1 2 hu008c Kecskemét 2 5 3 3 3 0 2.67 4 4 de039c Kiel 2 4 2 2 2 0 2.00 2 3 pl012c Kielce 2 2 2 5 4 0 2.50 3 4 uk026c K.-up. Hull 2 3 3 4 4 0 2.67 4 4 cz012c Kladno 1 3 3 3 3 0 2.17 2 3 dk001c København 3 5 5 5 5 0 3.83 4 4 tr017c Kocaeli 2 3 1 3 3 0 2.00 2 3 de004c Köln 3 4 4 2 2 0 2.50 3 4 pl022c Konin 1 2 3 5 4 0 2.50 3 4 tr018c Konya 3 2 1 3 3 0 2.00 2 3 sk002c Kosice 2 2 3 3 3 0 2.17 2 3 pl028c Koszalin 2 2 2 5 4 0 2.50 3 4 pl003c Krakow 3 2 3 5 4 0 2.83 4 4 no005c Kristiansand 1 5 5 3 4 0 3.00 4 4 it018c L’Aquila 1 3 4 4 4 0 2.67 4 4 gr005c Larisa 2 1 1 1 1 0 1.00 1 1 es008c Las Palmas 2 3 3 2 2 0 2.00 2 3 ch005c Lausanne fr012c Le Havre 2 3 4 2 3 0 2.33 2 3 uk003c Leeds 3 3 3 4 4 0 2.83 4 4 nl015c Leeuwarden 1 1 1 5 5 0 2.17 2 3 cy001c Lefkosia 2 2 2 1 1 0 1.33 1 1 uk014c Leicester 2 3 3 4 4 0 2.67 4 4 de008c Leipzig 2 3 2 2 2 0 1.83 1 2 nl520c Lelystad 1 3 3 5 5 0 2.83 4 4 fr207c Lens - Liévin 2 3 4 2 3 0 2.33 2 3 cz007c Liberec 1 3 3 3 3 0 2.17 2 3 be005c Liège 2 3 3 1 1 0 1.67 1 2 lv002c Liepaja 1 2 5 3 3 0 2.33 2 3 fr009c Lille 4 4 4 2 3 0 2.83 4 4 ie003c Limerick 1 3 3 5 5 -1 2.67 4 4 fr024c Limoges 2 3 4 2 3 0 2.33 2 3 uk019c Lincoln 1 3 3 4 4 0 2.50 3 4 se007c Linköping 2 5 5 5 5 0 3.67 4 4 at003c Linz 2 3 3 2 2 0 2.00 2 3 pt001c Lisboa 3 2 5 1 1 0 2.00 2 3 uk006c Liverpool 2 3 3 4 4 0 2.67 4 4 si001c Ljubljana 2 3 1 2 3 0 1.83 1 2 es018c Logroño 2 3 3 2 2 0 2.00 2 3 uk001c London 5 3 3 4 4 1 3.33 4 4 pl009c Lublin 2 2 2 5 4 0 2.50 3 4 lu001c Luxembourg 1 3 3 1 1 0 1.50 1 2 fr003c Lyon 4 4 4 2 3 0 2.83 4 4 es001c Madrid 4 3 3 2 2 1 2.50 3 4 de019c Magdeburg 2 4 2 2 2 0 2.00 2 3 de037c Mainz 2 5 4 2 2 0 2.50 3 4 es006c Málaga 3 3 3 2 2 0 2.17 2 3 tr019c Malatya 2 1 2 3 3 0 1.83 1 2 se003c Malmö 2 5 5 5 5 0 3.67 4 4 uk008c Manchester 2 3 3 4 4 0 2.67 4 4 tr020c Manisa 2 1 1 3 3 0 1.67 1 2 si002c Maribor 2 2 5 2 3 0 2.33 2 3 fr203c Marseille 4 4 4 2 3 0 2.83 4 4

178/189
Table X8 continued fr017c Metz 2 3 4 2 3 0 2.33 2 3 it002c Milano 4 5 1 4 4 0 3.00 4 4 hu002c Miskolc 2 5 5 3 3 0 3.00 4 4 it030c Modena 2 3 5 4 4 0 3.00 4 4 de023c Moers 2 3 3 2 2 0 2.00 2 3 de036c Mönchenglb. 2 4 4 2 2 0 2.33 2 3 fr010c Montpellier 2 3 4 2 3 0 2.33 2 3 de022c Mülheim/R. 2 4 4 2 2 0 2.33 2 3 de003c München 4 5 4 2 2 0 2.83 4 4 es007c Murcia 2 3 3 2 2 0 2.00 2 3 be007c Namur 2 3 1 1 1 0 1.33 1 1 fr016c Nancy 2 4 4 2 3 0 2.50 3 4 fr008c Nantes 3 4 4 2 3 0 2.67 4 4 it003c Napoli 3 3 3 4 4 0 2.83 4 4 tr021c Nevsehir 1 1 1 3 3 0 1.50 1 2 uk013c Newcastle 2 3 3 4 4 0 2.67 4 4 fr205c Nice 3 4 5 2 3 0 2.83 4 4 sk004c Nitra 1 1 1 2 2 0 1.17 1 1 uk029c Nottingham 2 3 3 4 4 0 2.67 4 4 pl020c Nowy Sacz 1 2 2 5 4 0 2.33 2 3 de014c Nürnberg 2 4 3 2 2 0 2.17 2 3 hu003c Nyiregyhaza 2 5 4 3 3 0 2.83 4 4 dk003c Odense 2 5 5 5 5 0 3.67 4 4 cz006c Olomouc 2 3 3 3 3 0 2.33 2 3 pl014c Olsztyn 2 2 2 5 4 0 2.50 3 4 pl016c Opole 2 2 2 5 4 0 2.50 3 4 pt002c Oporto 2 3 4 1 1 0 1.83 1 2 ro006c Oradea 2 3 3 2 3 0 2.17 2 3 se008c Örebro 2 5 5 5 5 0 3.67 4 4 fr019c Orléans 2 4 5 2 3 0 2.67 4 4 hr004c Osijek 2 3 3 3 3 0 2.33 2 3 no001c Oslo 3 5 5 3 4 0 3.33 4 4 cz003c Ostrava 2 3 3 3 3 -1 2.17 2 3 fi004c Oulu 2 5 5 5 5 0 3.67 4 4 es013c Oviedo 2 3 3 2 2 0 2.00 2 3 it028c Padova 2 3 4 4 4 0 2.83 4 4 it005c Palermo 3 3 3 4 4 0 2.83 4 4 es010c Palma 2 3 3 2 2 0 2.00 2 3 es014c Pamplona 2 3 3 2 2 0 2.00 2 3 lt003c Panevezys 2 1 4 3 3 0 2.17 2 3 cz010c Pardubice 1 3 3 3 3 0 2.17 2 3 fr001c Paris 4 4 4 2 3 1 3.00 4 4 gr003c Patra 2 1 1 1 1 0 1.00 1 1 hu004c Pecs 2 5 2 3 3 0 2.50 3 4 it016c Perugia 2 3 5 4 4 0 3.00 4 4 it019c Pescara 2 3 3 4 4 0 2.67 4 4 ro011c Piatra Neamt 2 3 3 2 3 0 2.17 2 3 bg005c Pleven 1 3 3 2 2 0 1.83 1 2 bg002c Plovdiv 2 3 3 2 2 0 2.00 2 3 cz004c Plzen 2 3 3 3 3 0 2.33 2 3 fr029c Pointe-a-P. 1 3 5 2 3 0 2.33 2 3 fr021c Poitiers 2 3 4 2 3 0 2.33 2 3 pt007c Ponta D. 1 2 3 1 1 0 1.33 1 1 uk023c Portsmouth 2 3 3 4 4 0 2.67 4 4

179/189
Table X8 continued it023c Potenza 1 4 3 4 4 0 2.67 4 4 de041c Potsdam 2 4 2 2 2 0 2.00 2 3 pl005c Poznan 3 2 3 5 4 0 2.83 4 4 cz001c Praha 4 3 3 3 3 1 2.83 4 4 sk005c PreSov 1 2 4 2 2 0 1.83 1 2 pl025c Radom 2 2 2 5 4 0 2.50 3 4 de028c Regensburg 2 4 4 2 2 0 2.33 2 3 it025c Reg.
C l b i2 3 2 4 4 0 2.50 3 4
fr018c Reims 2 3 5 2 3 0 2.50 3 4 fr013c Rennes 2 3 4 2 3 0 2.33 2 3 lv001c Riga 3 2 5 3 3 0 2.67 4 4 hr002c Rijeka 2 3 3 3 3 0 2.33 2 3 it001c Roma 4 4 4 4 4 0 3.33 4 4 nl003c Rotterdam 3 1 1 5 5 0 2.50 3 4 fr015c Rouen 2 3 5 2 3 0 2.50 3 4 bg006c Ruse 1 3 3 2 2 0 1.83 1 2 pl015c Rzeszow 2 2 2 5 4 0 2.50 3 4 nl001c s' Gravenh. 2 1 2 5 5 0 2.50 3 4 de040c Saarbrucken 2 4 3 2 2 0 2.17 2 3 fr028c Saint Denis 2 3 5 2 3 0 2.50 3 4 fr011c Saint-Et. 2 3 4 2 3 0 2.33 2 3 it032c Salerno 2 3 3 4 4 0 2.67 4 4 at004c Salzburg 2 4 3 2 2 0 2.17 2 3 tr022c Samsun 2 1 2 3 3 0 1.83 1 2 es025c Santa C./T. 2 3 3 2 2 0 2.00 2 3 es015c Santander 2 3 3 2 2 0 2.00 2 3 it026c Sassari 2 3 2 4 4 0 2.50 3 4 nl518c Schiedam 1 3 3 5 5 0 2.83 4 4 de031c Schwerin 1 4 1 2 2 0 1.67 1 2 pt006c Setúbal 2 2 5 1 1 0 1.83 1 2 es004c Sevilla 3 3 3 2 2 0 2.17 2 3 uk010c Sheffield 3 3 3 4 4 0 2.83 4 4 ro009c Sibiu 2 3 3 2 3 0 2.17 2 3 tr023c Siirt 2 1 1 3 3 0 1.67 1 2 hr003c Slavonski 2 3 3 3 3 0 2.33 2 3 bg001c Sofia 3 3 2 2 2 0 2.00 2 3 hr005c Split 3 3 3 3 3 0 2.50 3 4 no004c Stavanger 2 5 5 3 4 0 3.17 4 4 uk021c Stevenage 1 3 3 4 4 0 2.50 3 4 se001c Stockholm 3 5 5 5 5 0 3.83 4 4 uk027c Stoke-on-T. 2 3 3 4 4 0 2.67 4 4 fr006c Strasbourg 2 5 4 2 3 0 2.67 4 4 de007c Stuttgart 3 4 5 2 2 0 2.67 4 4 pl021c Suwalki 1 2 2 5 4 0 2.33 2 3 pl007c Szczecin 2 2 2 5 4 0 2.50 3 4 hu006c Szeged 2 5 2 3 3 0 2.50 3 4 hu009c Székesf. 2 5 3 3 3 0 2.67 4 4 ee001c Tallinn 2 2 5 3 3 0 2.50 3 4 fi002c Tampere 2 5 5 5 5 0 3.67 4 4 it022c Taranto 2 5 1 4 4 0 2.67 4 4 ro010c Targu Mures 2 3 3 2 3 0 2.17 2 3 ee002c Tartu 2 2 5 3 3 0 2.50 3 4 gr002c Thessaloniki 2 1 1 1 1 0 1.00 1 1 nl006c Tilburg 2 1 1 5 5 0 2.33 2 3

180/189
Table X8 continued ro003c Timisoara 2 3 3 2 3 0 2.17 2 3 es016c Toledo 1 3 3 2 2 0 1.83 1 2 it004c Torino 3 4 3 4 4 0 3.00 4 4 pl013c Torun 2 2 2 5 4 0 2.50 3 4 fr004c Toulouse 3 3 4 2 3 0 2.50 3 4 fr035c Tours 2 3 4 2 3 0 2.33 2 3 tr024c Trabzon 2 1 1 3 3 0 1.67 1 2 sk008c Trencín 1 2 3 2 2 0 1.67 1 2 it014c Trento 2 4 1 4 4 0 2.50 3 4 de026c Trier 2 5 3 2 2 0 2.33 2 3 it015c Trieste 2 3 3 4 4 0 2.67 4 4 sk007c Trnava 1 2 3 2 2 0 1.67 1 2 no006c Tromsø 1 5 5 3 4 0 3.00 4 4 no003c Trondheim 2 5 5 3 4 0 3.17 4 4 fi003c Turku 2 5 5 5 5 0 3.67 4 4 se005c Umeå 2 5 5 5 5 0 3.67 4 4 se006c Uppsala 2 5 5 5 5 0 3.67 4 4 cz005c Usti n. Lab. 1 3 3 3 3 0 2.17 2 3 nl004c Utrecht 2 1 1 5 5 0 2.33 2 3 es003c Valencia 3 3 3 2 2 0 2.17 2 3 es009c Valladolid 2 3 3 2 2 0 2.00 2 3 mt001c Valletta 2 3 3 1 1 0 1.67 1 2 tr025c Van 2 1 1 3 3 0 1.67 1 2 bg003c Varna 2 3 4 2 2 0 2.17 2 3 it011c Venezia 2 4 5 4 4 0 3.17 4 4 nl515c Venlo 1 3 3 5 5 0 2.83 4 4 it012c Verona 2 3 4 4 4 0 2.83 4 4 bg007c Vidin 1 3 2 2 2 0 1.67 1 2 es022c Vigo 2 3 3 1 1 0 1.67 1 2 lt001c Vilnius 3 1 5 3 3 0 2.50 3 4 es012c Vitoria/G. 2 3 3 2 2 0 2.00 2 3 gr006c Volos 1 1 1 1 1 0 0.83 1 1 pl001c Warszawa 4 3 2 5 4 1 3.17 4 4 ie005c Waterford 1 3 3 5 5 0 2.83 4 4 de030c Weimar 1 3 1 2 2 0 1.50 1 2 at001c Wien 4 5 1 2 2 1 2.50 3 4 uk030c Wirral 2 3 3 4 4 0 2.67 4 4 uk028c Wolverh. 2 3 3 4 4 0 2.67 4 4 uk024c Worcester 1 3 3 4 4 0 2.50 3 4 uk022c Wrexham 2 3 3 4 4 0 2.67 4 4 pl004c Wroclaw 3 2 2 5 4 0 2.67 4 4 de016c Wuppertal 2 5 3 2 2 0 2.33 2 3 hr001c Zagreb 3 3 3 3 3 0 2.50 3 4 es005c Zaragoza 3 3 3 2 2 0 2.17 2 3 pl018c Zielona Gora 2 2 2 5 4 0 2.50 3 4 sk006c Zilina 1 3 1 2 2 0 1.50 1 2 cz011c Zlin 1 3 3 3 3 0 2.17 2 3 tr026c Zonguldak 1 2 2 3 3 0 1.83 1 2 pl023c Zory 1 2 2 5 4 0 2.33 2 3 ch001c Zürich

181/189
Programme of City Panel Workshop in Berlin

182/189

183/189

184/189
Questionnaire on Governance
Questionnaire: Urban Governance
Dear Sir or Madam, the consortium consisting of the RWI Essen, DIFU, NEA and PRAC has been assigned by the European Commission to elaborate the second ‘State of European Cities report’ (Urban Audit Analysis II). The major part of the analysis is based on the new 2004 databank of the Urban Audit, collected and hosted by Eurostat. For the specific field of 'Urban Governance', the European Commission wishes to deepen the analysis implying a further data collection among a sample of Urban Audit cities. In this connection we are aware that the EU member countries have very different systems of fiscal decentralisation and that any data and information on urban governance have to be related to the individual systems of public finance. Your national Urban Audit Contact point recommended to include your city and to contact you in this connection. A corresponding reference letter from the European Commission is attached. We would be grateful if you could support us with the requested data and information. We assure you to deal with the information received confidentially and not to disclose names of the interviewees. If you have queries or questions appear not sufficiently clear, don't hesitate to contact me at e-mail: [email protected], phone: 0049-6196-654168 or fax: 0049-6196-654178. Thank you for co-operation! Yours faithfully Rolf Bergs Policy Research & Consultancy - Bergs and Issa Partnership Co. (PRAC) Im Hopfengarten 19 B D-65812 Bad Soden Germany www.prac.de

185/189
Questionnaire on Governance
Part 1: Budget and mandate 1. Please indicate to what extent the city government is responsible for the following communal policy fields (in terms of budget and/or mandate)?
Fully
res
-po
nsib
le
to a
larg
e ex
tent
to a
min
or
exte
nt
Not
re
spon
-sib
le
Form al primary education
Form al secondary education1
Tertiary education
Public health2
Water supply
Waste water treatment
Power supply
Urban public transport
Culture
2. What is the present number of staff (full-tim e equivalent) on the payroll of the municipal budget?
Number
1 For primary and secondary educatio n: compulsory education 2 Such as hospitals, out-patient service , first aid stations, socio-medical services like drug rehabilita tio n e tc .

186/189
Questionnaire on Governance
Questionnaire on Governance
Part 2: Accountability and citizen orientation 3. Does your city administration offer online services for the citizens (e-administration)?
No online service available
only information (e.g. download of by-laws, forms etc.)
information and formal application and authorization 4. Which of the following reports are published (printed or over the internet) by your city administration:
Reg
ular
ly
not
regu
larl
y
not a
t all
Performance delivery report1
Budgetary income and expenditure statement 5. Are the municipality's income and expenditure statements subject to regular audits?
Yes No 6. How often does your city administration examine consumer/citizen satisfaction by means of surveys?
quarterly six-monthly yearly irregularly2 not at all 7.1 Does a published overall strategic development vision of your city exist? 3
Yes No 7.2 If yes: Is or was there a public debate on that strategic vision?
Yes No 8.1 How many civic associations are registered in your city?Number
1 The notion is adopted from the Urban Governance Index (Habitat). As an overall report for all administrative departments or as individual reports for all departments 2 less frequent than yearly 3 The emphasis of this question is on ‚overall’ and ‚published’. We are aware that most cities pursue different sectoral strategies. Here we are rather interested, whether a long-run vision for the city as such exists and whether it is published (in print or on the Internet).

187/189
8.2 What is the share of citizens being volontarily engaged?%
8.3 What is the share of citizens being member of sports clubs?1 %
9.1 Is an anti-corruption committee represented in your city parliament?
Yes No 9.2 If yes: what is the outreach of its mandate?
Registration of corruption and complaint Active fight against corruption
10. Do citizens have the opportunity to lay claim to an ombudsman for dispute resolving?
Yes No 11. What is the role of the mayor?
Representative of the citizens of the city
Representative of the state in the city
Part 3: Co-operation 12.1 Is your city actively involved in European networks and cooperation?
Twinning2 with other cities EUROCITIES
URBACT CEMR
Interreg IIIB Interreg IIIC
Structural Fund Objectives 1 and 2 Others 12.2 If your city maintains partnership with other cities (twinning), what is the number of partner cities?
1 2
3-5 > 5
1 This question is included, based on the assumption that sports fosters social cohesion of neighborhoods. 2 jumelage

188/189
Questionnaire on Governance
13. In which of the following policy fields is your city administration cooperating with non-governmental organisations (e.g. as counsellors in the city administration)?
Spatial planning Transport
Economic development Housing
Labour market Health services
City marketing Sports
Cultural heritage None
Others 14. In what way do non-governmental actors participate in matters of urban interest? Type of actor Consultation on
(strategic) goalsDecision concerning public expenditure Policy implementation
Individuals
Entrepreneurs
Local citizens’ associations
Commercial associations
Religious organisations Social volontary organisations
Chambers
Trade unions
Other

189/189
Questionnaire on Governance
15. Can you describe briefly the forms and intensity of co-operation between the city and non-governmental organisations (in terms of strategic planning and civic involvement)?
16. Does your city formally cooperate with its conurbations and the wider region on issues like spatial planning, transport, facility sharing, cultural heritage, place marketing etc.?
Spatial planning Cultural heritage
Transport Place marketing
Facility sharing Waste treatment
Business zones R&D and cluster development
Environmental management1 Others Author of the questionnaire: R. Bergs
email: [email protected] Institution: PRAC
2008
1 E.g. Local Agenda 21, contribution to a lleviating c limate change e tc .