Embed Size (px)
Citation preview
Published 21 February 2019
Prolific Offenders1
Criminal Pathway: Custodial Sentences & Offender Needs
Main points
• Over a quarter (28%) of prolific offenders received their first custodial sentence before
the age of 18. A further 48% received a first custodial sentence at the age of 18 or
above and 24% have never received an immediate custodial sentence.
• Over three-fifths (62%) of prolific offenders who have never received an immediate
custodial sentence were aged between 16 and 26 on their last sentencing occasion.
• Just over half (53%) of prolific offenders who received a short custodial sentence as their first immediate custodial sentence received only sentences of 12 months or less for all further custodial sentences in their criminal pathway.
• 94% of prolific offenders in the analysis had at least one spell claiming out-of-work benefits, compared to 73% of non-prolific offenders. While 72% of prolific offenders had at least one P45 employment spell, the corresponding figure for non-prolific offenders is higher, at 85%.
As reported in a previous prolific offender analytical paper, there were around 492,000 offenders that meet the relevant criteria of a prolific offender during 2000 to 2016. These offenders were responsible for around 9.5 million crimes during their criminal pathway, an average of 19 offences per prolific offender.
This is the third in a series of analytical papers looking at prolific offenders, which will focus
on their custodial sentences and socio-economic backgrounds. A series of future analyses
are planned which will provide greater insight into prolific offenders, with the potential to
explore amongst other things, the effectiveness of different sentence types and their needs
as offenders.
1 The full definition of prolific offenders can be found at the link
https://www.gov.uk/government/uploads/system/uploads/attachment_data/file/659655/prolific-offenders-2017.pdf
2
1. Prolific Offenders who have never had a custodial sentence
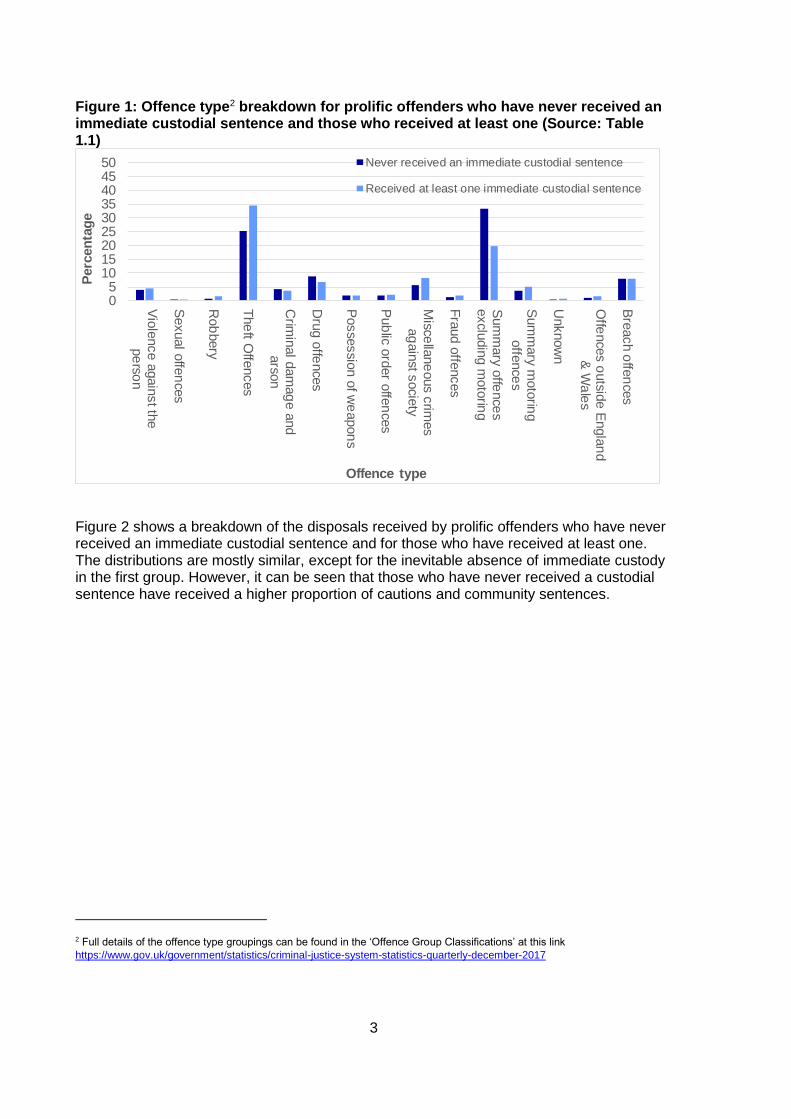
As reported in the last prolific offender analytical paper, almost a quarter (24%) of prolific offenders have never been sentenced to prison during their criminal pathway. These offenders accounted for 1.2 million cautions and non-custodial convictions. Over three-fifths (62%) of prolific offenders who have never received a custodial sentence were aged between 16 and 26 at their last sentencing occasion. By contrast, those who have received at least one custodial sentence are more broadly distributed in age, with 70% aged between 22 and 45 at their last sentencing occasion. Prolific offenders who have never received a custodial sentence have typically received fewer convictions and cautions than those who have had a custodial sentence. Just over three quarters (77%) of prolific offenders who have never received a custodial sentence had between 4 and 11 previous convictions and cautions, whereas two thirds (67%) of those who had a custodial sentence had 15 or more previous convictions and cautions. This is partly due to the younger age distribution of those with no custodial sentence, but may also indicate that custodial sentences are more likely to be given to offenders who have a higher number of previous cautions and convictions. Figure 1 illustrates the offence types for prolific offenders who have never received an immediate custodial sentence and for those who have received at least one. It shows that theft and summary non-motoring offences are the most common offence types for both groups of prolific offenders, with a greater proportion of theft offences amongst those who received at least one custodial sentence, and conversely a greater proportion of summary non-motoring offences by those who never received a custodial sentence.
3
Figure 1: Offence type2 breakdown for prolific offenders who have never received an immediate custodial sentence and those who received at least one (Source: Table 1.1)
05
101520253035404550
Vio
lence a
gain
st th
epe
rso
n
Sexual o
ffen
ces
Rob
bery
The
ft Offe
nces
Crim
inal d
am
ag
e a
nd
ars
on
Dru
g o
ffences
Possessio
n o
f we
apon
s
Pub
lic o
rder o
ffen
ces
Mis
ce
llane
ous c
rimes
ag
ain
st socie
ty
Fra
ud
offe
nces
Sum
mary
offe
nce
sexclu
din
g m
oto
ring
Sum
mary
moto
ring
offe
nce
s
Unknow
n
Offe
nces o
uts
ide E
ngla
nd
& W
ale
s
Bre
ach o
ffen
ces
Perc
en
tag
e
Offence type
Never received an immediate custodial sentence
Received at least one immediate custodial sentence
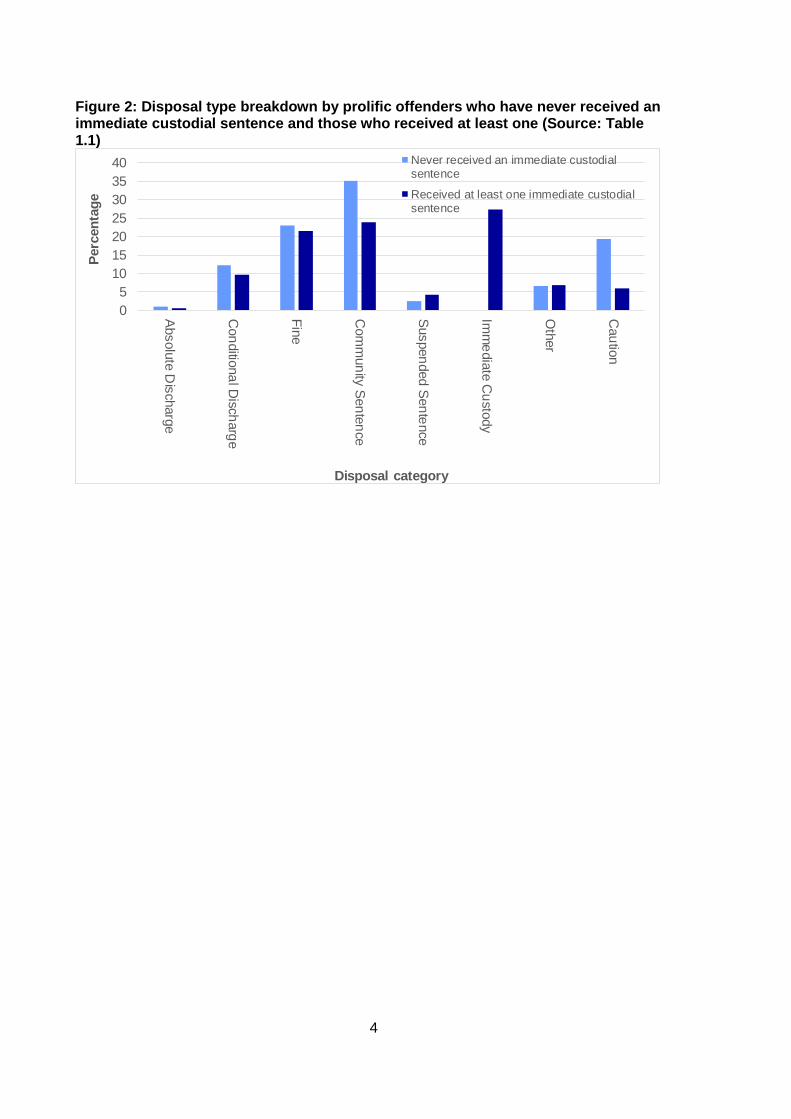
Figure 2 shows a breakdown of the disposals received by prolific offenders who have never received an immediate custodial sentence and for those who have received at least one. The distributions are mostly similar, except for the inevitable absence of immediate custody in the first group. However, it can be seen that those who have never received a custodial sentence have received a higher proportion of cautions and community sentences.
2 Full details of the offence type groupings can be found in the ‘Offence Group Classifications’ at this link
https://www.gov.uk/government/statistics/criminal-justice-system-statistics-quarterly-december-2017
4
Figure 2: Disposal type breakdown by prolific offenders who have never received an immediate custodial sentence and those who received at least one (Source: Table 1.1)
0
5
10
15
20
25
30
35
40
Absolu
te D
isch
arg
e
Con
ditio
na
l Disch
arg
e
Fin
e
Com
mun
ity S
en
ten
ce
Suspen
ded S
en
tence
Imm
edia
te C
usto
dy
Oth
er
Cau
tion
Perc
en
tag
e
Disposal category
Never received an immediate custodialsentence
Received at least one immediate custodialsentence
5
2. Prolific Offenders whose first custodial sentence began before they were 18
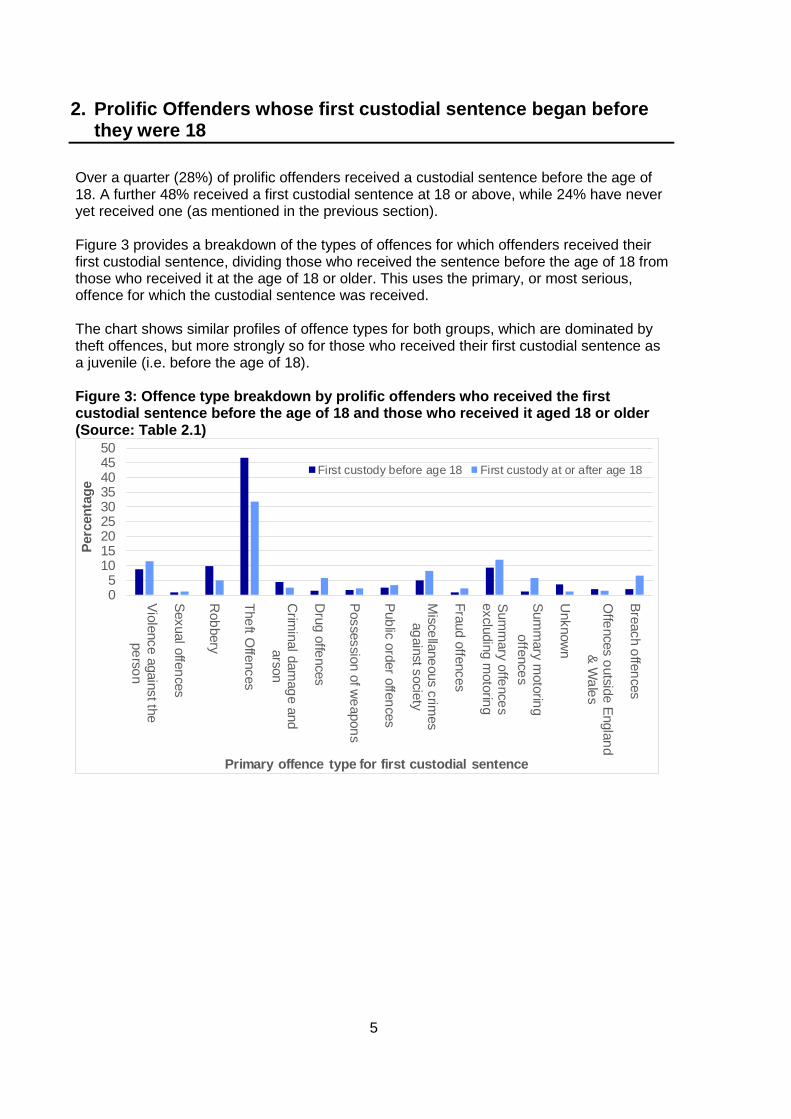
Over a quarter (28%) of prolific offenders received a custodial sentence before the age of 18. A further 48% received a first custodial sentence at 18 or above, while 24% have never yet received one (as mentioned in the previous section). Figure 3 provides a breakdown of the types of offences for which offenders received their first custodial sentence, dividing those who received the sentence before the age of 18 from those who received it at the age of 18 or older. This uses the primary, or most serious, offence for which the custodial sentence was received. The chart shows similar profiles of offence types for both groups, which are dominated by theft offences, but more strongly so for those who received their first custodial sentence as a juvenile (i.e. before the age of 18). Figure 3: Offence type breakdown by prolific offenders who received the first custodial sentence before the age of 18 and those who received it aged 18 or older (Source: Table 2.1)
05
101520253035404550
Vio
lence a
gain
st th
epe
rso
n
Sexual o
ffen
ces
Rob
bery
The
ft Offe
nces
Crim
inal d
am
ag
e a
nd
arso
n
Dru
g o
ffence
s
Possessio
n o
f we
apon
s
Pub
lic o
rder o
ffen
ces
Mis
ce
llane
ous c
rimes
ag
ain
st socie
ty
Fra
ud
offe
nces
Sum
mary
offe
nce
sexclu
din
g m
oto
ring
Sum
mary m
oto
ring
offe
nce
s
Unknow
n
Offe
nce
s o
utsid
e E
ngla
nd
& W
ale
s
Bre
ach o
ffen
ces
Perc
en
tag
e
Primary offence type for first custodial sentence
First custody before age 18 First custody at or after age 18
6
3. Short Custodial Sentences given to Prolific Offenders
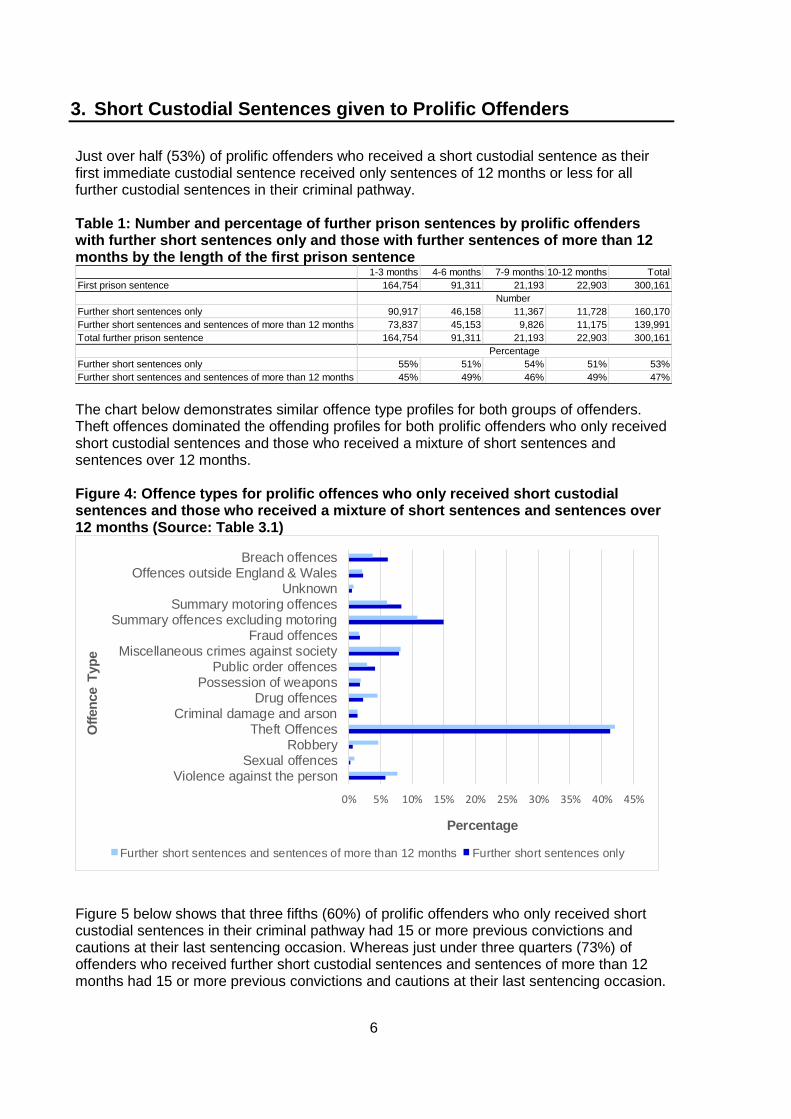
Just over half (53%) of prolific offenders who received a short custodial sentence as their first immediate custodial sentence received only sentences of 12 months or less for all further custodial sentences in their criminal pathway. Table 1: Number and percentage of further prison sentences by prolific offenders with further short sentences only and those with further sentences of more than 12 months by the length of the first prison sentence
1-3 months 4-6 months 7-9 months 10-12 months Total
First prison sentence 164,754 91,311 21,193 22,903 300,161
Further short sentences only 90,917 46,158 11,367 11,728 160,170
Further short sentences and sentences of more than 12 months 73,837 45,153 9,826 11,175 139,991
Total further prison sentence 164,754 91,311 21,193 22,903 300,161
Further short sentences only 55% 51% 54% 51% 53%
Further short sentences and sentences of more than 12 months 45% 49% 46% 49% 47%
Number
Percentage
The chart below demonstrates similar offence type profiles for both groups of offenders. Theft offences dominated the offending profiles for both prolific offenders who only received short custodial sentences and those who received a mixture of short sentences and sentences over 12 months. Figure 4: Offence types for prolific offences who only received short custodial sentences and those who received a mixture of short sentences and sentences over 12 months (Source: Table 3.1)
0% 5% 10% 15% 20% 25% 30% 35% 40% 45%
Violence against the personSexual offences
RobberyTheft Offences
Criminal damage and arsonDrug offences
Possession of weaponsPublic order offences
Miscellaneous crimes against societyFraud offences
Summary offences excluding motoringSummary motoring offences
UnknownOffences outside England & Wales
Breach offences
Percentage
Off
en
ce T
yp
e
Further short sentences and sentences of more than 12 months Further short sentences only
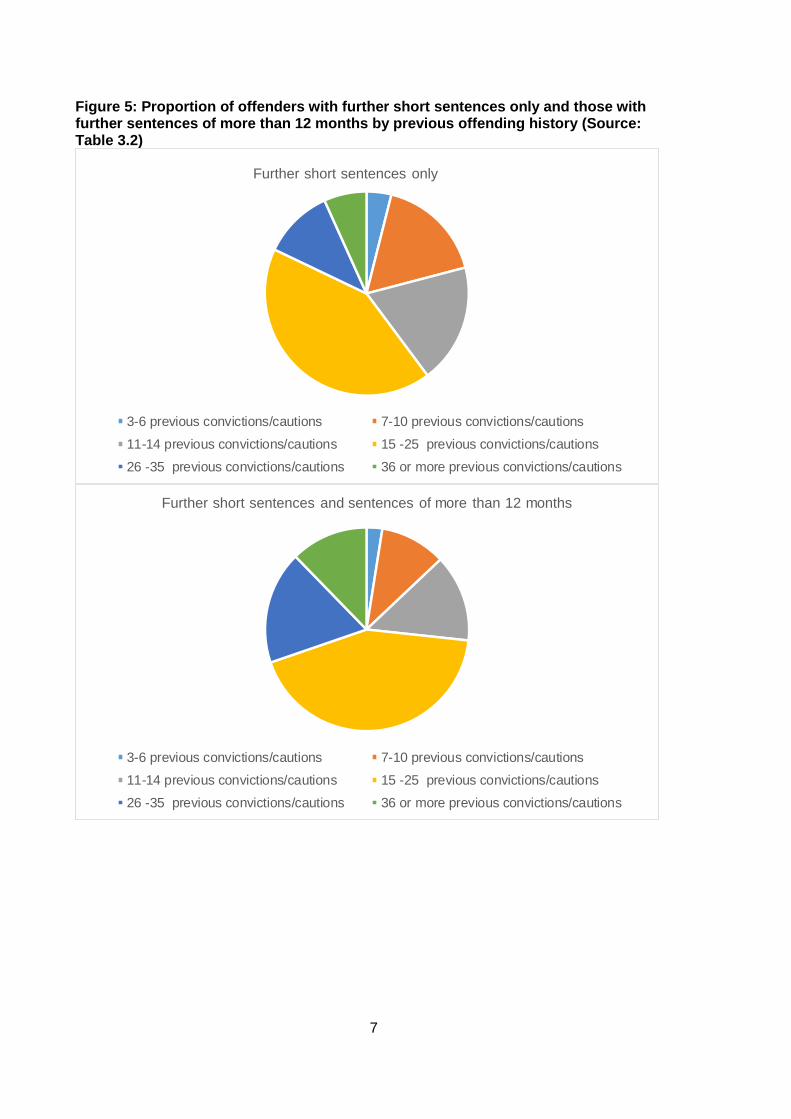
Figure 5 below shows that three fifths (60%) of prolific offenders who only received short custodial sentences in their criminal pathway had 15 or more previous convictions and cautions at their last sentencing occasion. Whereas just under three quarters (73%) of offenders who received further short custodial sentences and sentences of more than 12 months had 15 or more previous convictions and cautions at their last sentencing occasion.
7
Figure 5: Proportion of offenders with further short sentences only and those with further sentences of more than 12 months by previous offending history (Source: Table 3.2)
Further short sentences only
3-6 previous convictions/cautions 7-10 previous convictions/cautions
11-14 previous convictions/cautions 15 -25 previous convictions/cautions
26 -35 previous convictions/cautions 36 or more previous convictions/cautions
Further short sentences and sentences of more than 12 months
3-6 previous convictions/cautions 7-10 previous convictions/cautions
11-14 previous convictions/cautions 15 -25 previous convictions/cautions
26 -35 previous convictions/cautions 36 or more previous convictions/cautions
8
4. Prolific Offenders Needs – P45 employment and Out-of-Work Benefits
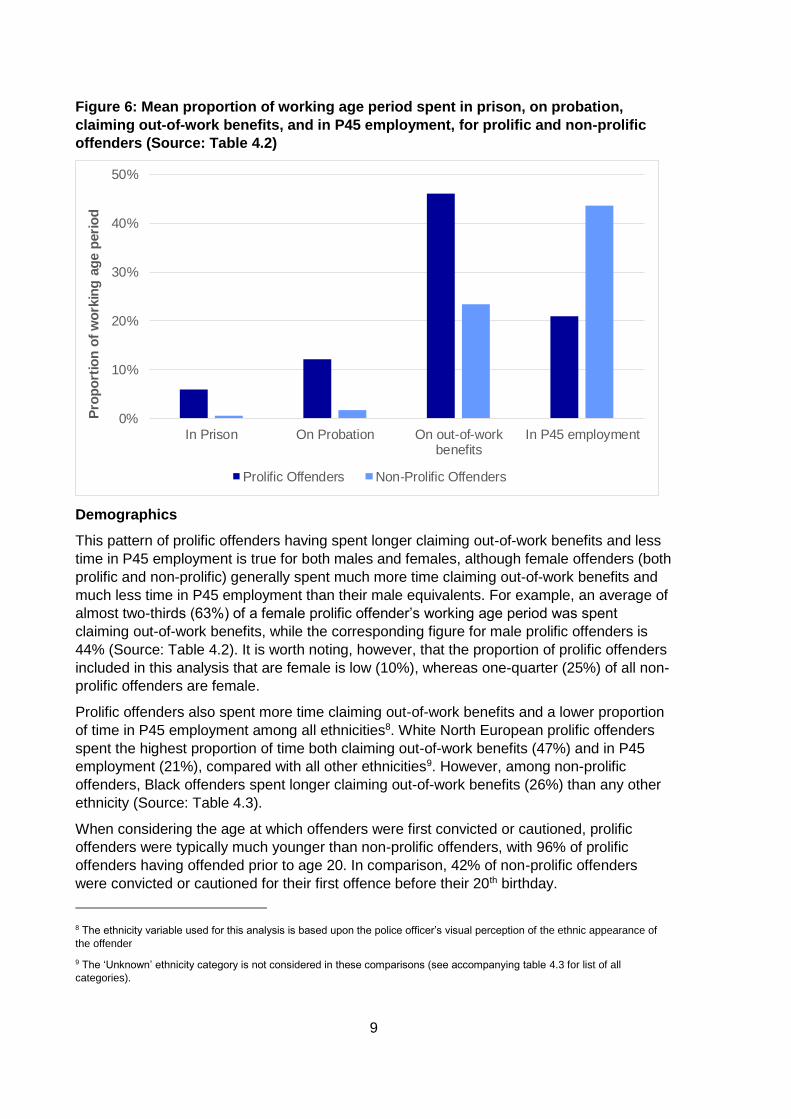
Based on analysis of MoJ/DWP/HMRC linked data3, prolific offenders have spent on
average almost half (46%) of their working age period4 claiming out-of-work benefits5,
compared with a much lower proportion (23%) for non-prolific offenders. When considering
P45 employment6, the converse is true, with prolific offenders averaging approximately one-
fifth (21%) of their time in P45 employment, compared with 44% for non-prolific offenders.
Prolific offenders also spent considerably more of their working lives in prison (6% vs 1%)
and on probation (12% vs 2%), on average, than non-prolific offenders (Source: Table 4.27).
94% of prolific offenders in the analysis had at least one spell claiming out-of-work benefits,
compared to 73% of non-prolific offenders. Conversely, while 72% of prolific offenders had
at least one P45 employment spell, the corresponding figure for non-prolific offenders is
higher, at 85% (Source: Table 4.1).
3 The 4.2 million offenders considered in this analysis comprise all those who received at least one caution or conviction for an
offence recorded in England or Wales on the Police National Computer (PNC) between 2000 and mid-2015, and who were
successfully matched to at least one (National Benefits Database) benefit and/or P45 employment record, as part of the
2014/15 MoJ/DWP/HMRC data share. They must also have been of working age at some point during the period analysed
(see 4 below). Further details of the data share and methodology can be found in the accompanying annex.
4 Data for offenders in relation to prison, probation, out-of-work benefits, and P45 employment spells over the period
01/01/2000-30/11/2014, was used for this analysis. Within this period, any time in which an offender was of working age
(assumed between their 16th and 65th birthdays) was considered, and is referred to as their ‘working age period’ in this paper.
Only that portion of an offender’s working age which falls within this coverage period is considered.
5 The out-of-work benefits included in this analysis are Jobseeker's Allowance, Employment Support Allowance, Income
Support, Incapacity Benefit, Passported Incapacity Benefit and Severe Disablement Allowance.
6 Where the term ‘P45 employment’ is used in this paper this relates to the PAYE P45 form that an employee receives from
their employer when they stop working for them. More specifically, the HMRC P45 data set used for this analysis includes the
start and end date of each employment spell for matched offenders. P45 employment does not include self-employment and
some low paid employment may also be excluded. This analysis considers P45 employment spells not recorded as having
finished by the end of the coverage period to be continuing. P14 data has not been used to validate whether any of these
spells ended sooner.
7 Source references refer to the tables accompanying this paper
9
Figure 6: Mean proportion of working age period spent in prison, on probation,
claiming out-of-work benefits, and in P45 employment, for prolific and non-prolific
offenders (Source: Table 4.2)
0%
10%
20%
30%
40%
50%
In Prison On Probation On out-of-workbenefits
In P45 employment
Pro
po
rtio
n o
f w
ork
ing
ag
e p
eri
od
Prolific Offenders Non-Prolific Offenders
Demographics
This pattern of prolific offenders having spent longer claiming out-of-work benefits and less
time in P45 employment is true for both males and females, although female offenders (both
prolific and non-prolific) generally spent much more time claiming out-of-work benefits and
much less time in P45 employment than their male equivalents. For example, an average of
almost two-thirds (63%) of a female prolific offender’s working age period was spent
claiming out-of-work benefits, while the corresponding figure for male prolific offenders is
44% (Source: Table 4.2). It is worth noting, however, that the proportion of prolific offenders
included in this analysis that are female is low (10%), whereas one-quarter (25%) of all non-
prolific offenders are female.
Prolific offenders also spent more time claiming out-of-work benefits and a lower proportion
of time in P45 employment among all ethnicities8. White North European prolific offenders
spent the highest proportion of time both claiming out-of-work benefits (47%) and in P45
employment (21%), compared with all other ethnicities9. However, among non-prolific
offenders, Black offenders spent longer claiming out-of-work benefits (26%) than any other
ethnicity (Source: Table 4.3).
When considering the age at which offenders were first convicted or cautioned, prolific
offenders were typically much younger than non-prolific offenders, with 96% of prolific
offenders having offended prior to age 20. In comparison, 42% of non-prolific offenders
were convicted or cautioned for their first offence before their 20th birthday.
8 The ethnicity variable used for this analysis is based upon the police officer’s visual perception of the ethnic appearance of
the offender
9 The ‘Unknown’ ethnicity category is not considered in these comparisons (see accompanying table 4.3 for list of all
categories).
10
Non-prolific offenders who first offended before age 16 spent more time claiming out-of-
work benefits and less in P45 employment compared with those who first offended aged 20
- 24, but the opposite is true for prolific offenders. For example, among prolific offenders, the
proportion of their working age period spent claiming out-of-work benefits increases from
43% for those who first offended prior to age 16, up to an average of 63% for the 20-24 age
range. Among non-prolific offenders, it fell from 25% to 21% over the same age bands
(Source: Table 4.4).
Experience of prison
Those who have never served custodial sentences have typically spent more time in P45
employment and less time claiming out-of-work benefits than those who have been in
prison. This is true for both prolific and non-prolific offenders. However, the differences seen
are smaller among prolific offenders. For example, the proportion of time spent in P45
employment among prolific offenders is 19% for those who have been in prison and 26% for
those that have not, a gap of 7 percentage points. The corresponding gap is much greater,
at 13 percentage points (32% for those that have been in prison, 45% for those that have
not), among non-prolific offenders (Source: Table 4.5).
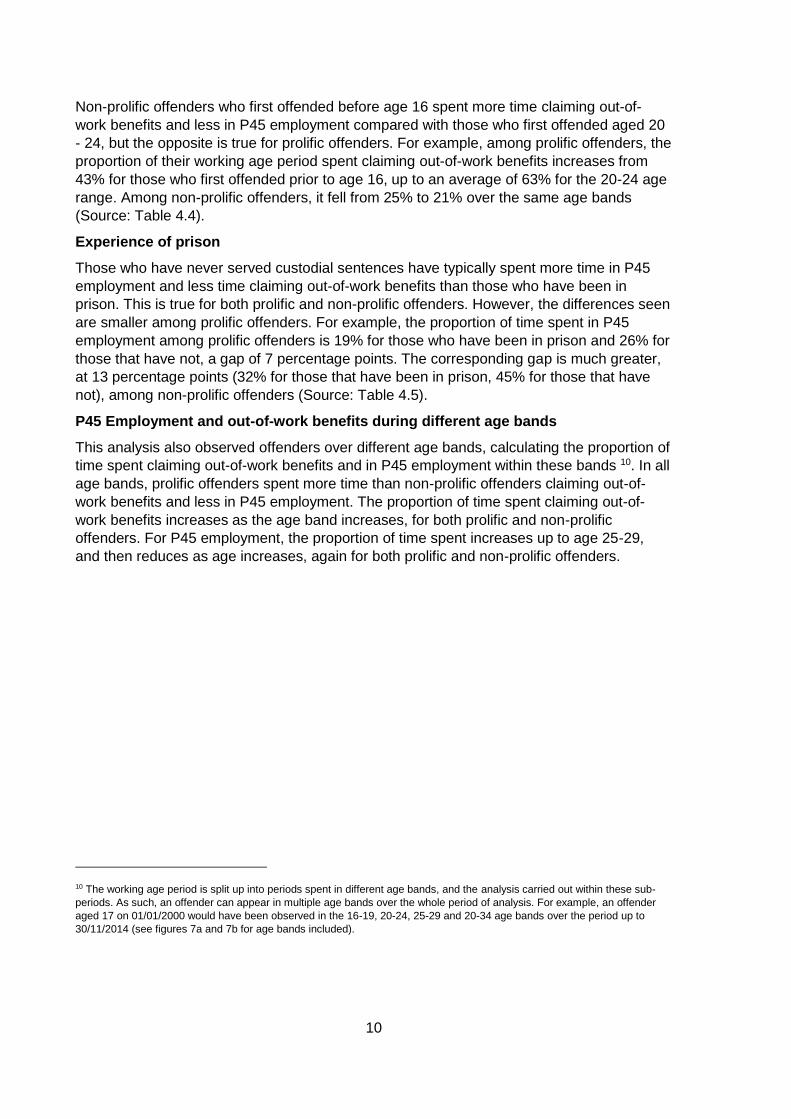
P45 Employment and out-of-work benefits during different age bands
This analysis also observed offenders over different age bands, calculating the proportion of
time spent claiming out-of-work benefits and in P45 employment within these bands 10. In all
age bands, prolific offenders spent more time than non-prolific offenders claiming out-of-
work benefits and less in P45 employment. The proportion of time spent claiming out-of-
work benefits increases as the age band increases, for both prolific and non-prolific
offenders. For P45 employment, the proportion of time spent increases up to age 25-29,
and then reduces as age increases, again for both prolific and non-prolific offenders.
10 The working age period is split up into periods spent in different age bands, and the analysis carried out within these sub-
periods. As such, an offender can appear in multiple age bands over the whole period of analysis. For example, an offender
aged 17 on 01/01/2000 would have been observed in the 16-19, 20-24, 25-29 and 20-34 age bands over the period up to
30/11/2014 (see figures 7a and 7b for age bands included).
11
Figure 7a: Mean proportion of working age period spent in prison, on probation,
claiming out-of-work benefits, and in P45 employment, while in different age bands
(Source: Table 4.6)
0%
10%
20%
30%
40%
50%
60%
Wholeworking
ageperiod
16-19 20-24 25-29 30-34 35-44 45-54 55-64
Pro
po
rtio
n o
f p
eri
od
an
d a
ge b
an
d
Period and age band in which offender is observed
Prolific Offenders
In Prison On Probation On out-of-work benefits In P45 employment
Figure 7b: Mean proportion of working age period spent in prison, on probation,
claiming out-of-work benefits, and in P45 employment, while in different age bands
(Source: Table 4.6)
0%
10%
20%
30%
40%
50%
60%
Wholeworking
ageperiod
16-19 20-24 25-29 30-34 35-44 45-54 55-64
Pro
po
rtio
n o
f p
eri
od
an
d a
ge b
an
d
Period and age band in which offender is observed
Non-Prolific Offenders
In Prison On Probation On out-of-work benefits In P45 employment
12
5. Consultation 1 Response – Defining Severity of Offending
The Ministry of Justice launched a consultation in November 2018 to seek users’ views on
formally establishing a method to define the severity of offending by prolific offenders. No
responses to this consultation were received.
The method proposed was:
- Group offending into the following 9 severity levels:
• Severity Level 1 – Includes all offences with a fine as the maximum sentence available
• Severity Level 2 – includes all offences with a custodial sentence of 3 months or less as the maximum sentence available
• Severity Level 3 – includes all offences with a custodial sentence of more than 3 months but 6 months or less as the maximum sentence available
• Severity Level 4 – includes all offences with a custodial sentence of more than 6 months but 1 year or less as the maximum sentence available
• Severity Level 5 – includes all offences with a custodial sentence of more than 1 year but 2 years or less as the maximum sentence available
• Severity Level 6 – includes all offences with a custodial sentence of more than 2 years but 5 years or less as the maximum sentence available
• Severity Level 7 – includes all offences with a custodial sentence of more than 5 years but 10 years or less as the maximum sentence available
• Severity Level 8 – includes all offences with a custodial sentence of more than 10 years as the maximum sentence available
• Severity Level 9 – includes all offences with an indeterminate custodial sentence as the maximum sentence available
- In addition, the type of court, will be taken into account when assigning a level of
severity. For example, a shoplifting offence sentenced in the magistrates’ court could attract a maximum sentence of 6 months in prison and so would be assigned severity level 3. However, the same offence sentenced in the Crown Court could attract a maximum sentence of 7 years and so would be assigned severity level 7.
Following an exploration of these severity groupings we have decided to investigate this methodology further to ensure that the groupings selected are representative of the offending population and accurate. We will present our findings in a re-consultation.
13
6. Consultation 2 Response – Methodology to look at offending over time
The Ministry of Justice launched a consultation in November 2018 to seek users’ views on
formally establishing a method to look at offending over time. No response to this
consultation was received.
We will therefore use the following method to investigate offending over time by prolific
offenders:
- look at the offending progression of prolific offenders by tenths of the period from
their first caution or conviction to their last caution or conviction irrespective of how
long an individual has been criminally active for. So, for example, an offender
committing offences over a 20-month period will have a decile time period of every 2
months, whereas another offender committing offences over a 20 year period will
have a decile time period of every 2 years.
- In addition, the results will be weighted by applying an equal weight to each
individual offender.
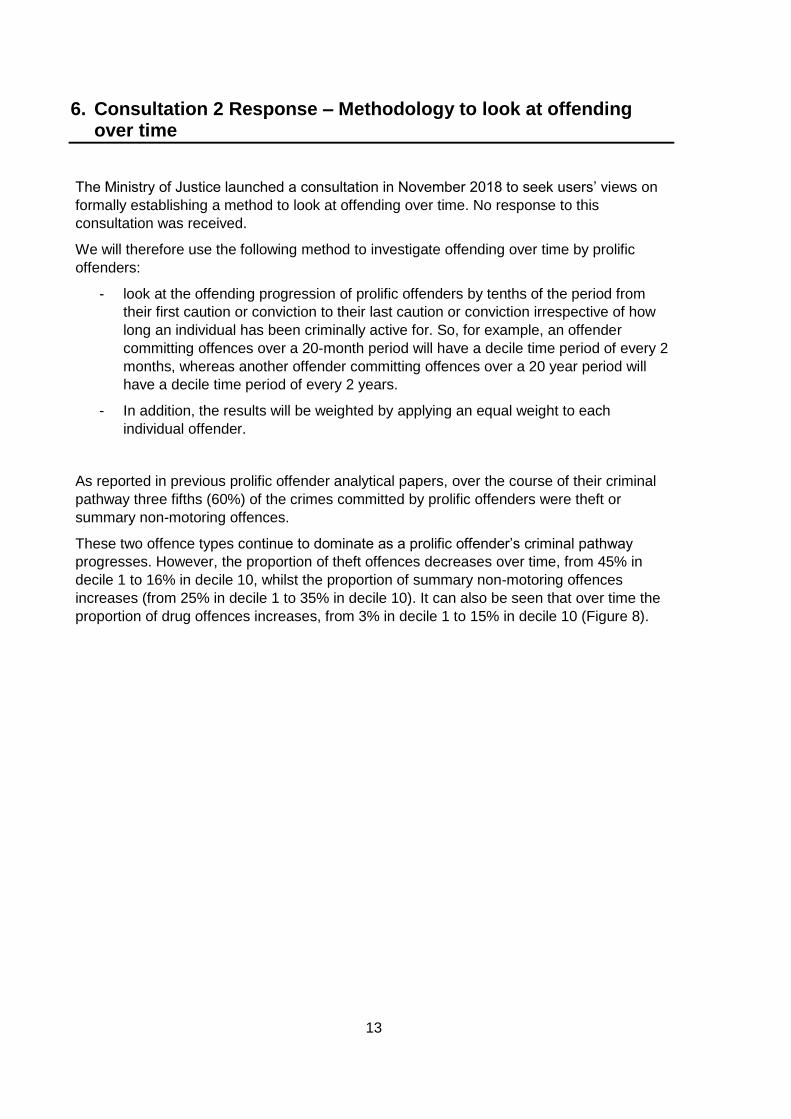
As reported in previous prolific offender analytical papers, over the course of their criminal
pathway three fifths (60%) of the crimes committed by prolific offenders were theft or
summary non-motoring offences.
These two offence types continue to dominate as a prolific offender’s criminal pathway
progresses. However, the proportion of theft offences decreases over time, from 45% in
decile 1 to 16% in decile 10, whilst the proportion of summary non-motoring offences
increases (from 25% in decile 1 to 35% in decile 10). It can also be seen that over time the
proportion of drug offences increases, from 3% in decile 1 to 15% in decile 10 (Figure 8).
14
Figure 8: Prolific offending criminal pathway by offence type
0% 10% 20% 30% 40% 50% 60% 70% 80% 90% 100%
Period 1
Period 2
Period 3
Period 4
Period 5
Period 6
Period 7
Period 8
Period 9
Period 10
Offence Type Proportions
Off
en
din
g H
isto
ry P
eri
od
(D
eciles)
01 Violence against the person 02 Sexual offences 03 Robbery
04 Theft Offences 05 Criminal damage and arson 06 Drug offences
07 Possession of weapons 08 Public order offences 09 Miscellaneous crimes against society
10 Fraud offences 11 Summary offences excluding motoring 12 Summary motoring offences
21 Offences outside England & Wales
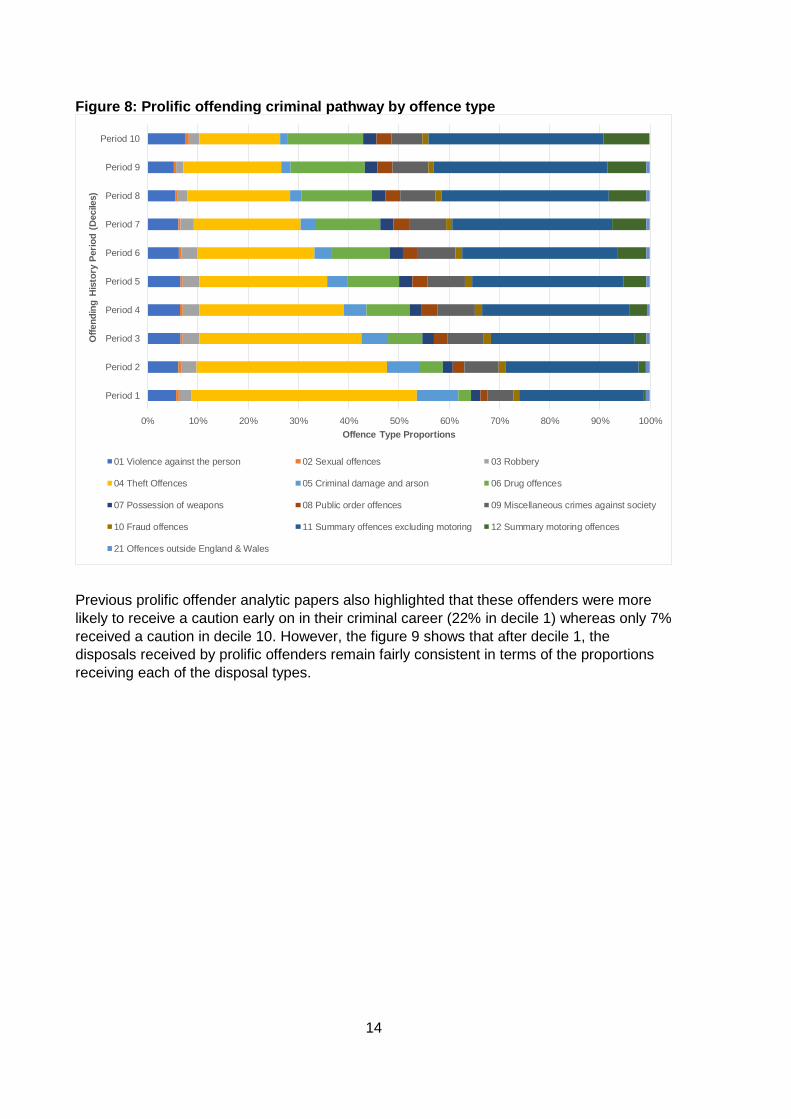
Previous prolific offender analytic papers also highlighted that these offenders were more
likely to receive a caution early on in their criminal career (22% in decile 1) whereas only 7%
received a caution in decile 10. However, the figure 9 shows that after decile 1, the
disposals received by prolific offenders remain fairly consistent in terms of the proportions
receiving each of the disposal types.
15
Figure 9: Prolific offending criminal pathway by disposal type
0% 10% 20% 30% 40% 50% 60% 70% 80% 90% 100%
Period 1
Period 2
Period 3
Period 4
Period 5
Period 6
Period 7
Period 8
Period 9
Period 10
Disposal Proportions
Off
en
din
g H
isto
ry P
eri
od
(D
eciles)
08-Caution 09-Absolute discharge 10-Conditional discharge 11-Fine
12-Community sentences 13-Suspended sentence 14-Immediate custody 15-Other
16
Annex – P45 employment and Out-of-Work Benefits
The offender, employment and out-of-work benefit data used for this analysis is taken from
an administrative data share between the Ministry of Justice (MoJ), the Department for
Work and Pensions (DWP) and Her Majesty’s Revenue and Customs (HMRC), linking
offender data to P45 employment data and benefit data. This data share includes 4.7 million
offenders who have received at least one caution or conviction for a recordable offence on
the Police National Computer (PNC) between 2000 and mid-2015, and who were
successfully matched to at least one benefit and/or P45 employment record.
The coverage period for the National Benefits Database (NBD), in which out-of-work
benefits are recorded, goes up to 30/11/2014, while the P45 data set goes up to February
2015. As such, the common coverage period of the PNC, NBD and P45 data sets is from
01/01/2000 up to 30/11/2014. The working age period considered in this analysis of prolific
offenders relates to any time over this common coverage period in which the offender was
of working age (assumed to be between their 16th and 65th birthdays).
Of the 4.7 million offenders in the data share, 4.2 million have at least one PNC record for
an offence in England and Wales, and were also of working age at some point over the
period 01/01/2000 to 30/11/2014. These are the offenders considered in this analysis, with
those offenders having neither a NBD benefit spell nor a P45 employment spell recorded
over the common coverage period being excluded.
Prolific offenders were identified by reference to the definition in the following link: https://assets.publishing.service.gov.uk/government/uploads/system/uploads/attachment_data/file/659655/prolific-offenders-2017.pdf. There is a total of 491,525 offenders identified as prolific in the above publication. Of these, 406,325 (83%) were identified in the group considered in this analysis. As part of the checks completed prior to the main analysis, bias testing was carried out to check whether these 406,325 prolific offenders are representative of the wider cohort of prolific offenders, and no substantive differences were identified. For more details on data sources or the methodology used to carry out this analysis, please contact [email protected].
17
Further information
The data presented in this publication are experimental.
Experimental Statistics status
Experimental statistics are produced under the remit of the Code of Practice for Official
Statistics. They are produced impartially and are free from political influence. More
information can be found on the UK Statistics Authority website, accessible via the link
below.
https://www.statisticsauthority.gov.uk/monitoring-and-assessment/code-of-practice/
Contact
Press enquiries should be directed to the Ministry of Justice press office:
Tel: 020 3334 3536
Email: [email protected]
Other enquiries about these statistics should be directed to the Justice Statistics Analytical
Services division of the Ministry of Justice:
David Dawson, Ministry of Justice, 7th Floor, 102 Petty France, London, SW1H 9AJ
Email: [email protected]
© Crown copyright
Produced by the Ministry of Justice
Alternative formats are available on request from [email protected]


![G151 ELS SSEENNTTEENNCCIINNGG - WordPress.com€¦ · (a) Describe the sentences available for adult offenders [18] (b) Discuss the advantages and disadvantages of custodial sentences](https://img.pdfslide.net/doc/110x75/5ebb545ef5622c4b6923416c/g151-els-sseenntteenncciinngg-a-describe-the-sentences-available-for-adult-offenders.jpg)