Embed Size (px)
Citation preview
Promoting Student Engagement in Science, Technology, Engineering, and Math:
An Evaluation of the Bridges After-School and Enrichment Program
Evaluation Report
September 2014
Prepared by: Youth Studies, Inc 155 Water Street Brooklyn, NY 11201
Bridges (2013-14) Evaluation Report Page 2
Table of Contents
Executive Summary ......................................................................................................................... 3
Background ...................................................................................................................................... 5
Description of Evaluation Process ................................................................................................... 7
Participant Outcome Findings ......................................................................................................... 9
Students’ Familiarity with Various Bridge Types ....................................................................... 9
Students’ Understanding of the Effects of Common Forces on Objects ................................... 11
Students’ Ability to Read and Interpret a Timeline ................................................................... 13
Students’ Ability to Generate Measurement Data ..................................................................... 15
Students’ Understanding of the Scientific Inquiry Process ....................................................... 17
Students’ Confidence in their Ability to Succeed in Math and Science .................................... 19
Students’ Future-oriented Motivation to Pursue Science Careers ............................................. 20
References ..................................................................................................................................... 22
Appendix A: Bridges Participant Assessment ............................................................................... 23
Bridges (2013-14) Evaluation Report Page 3
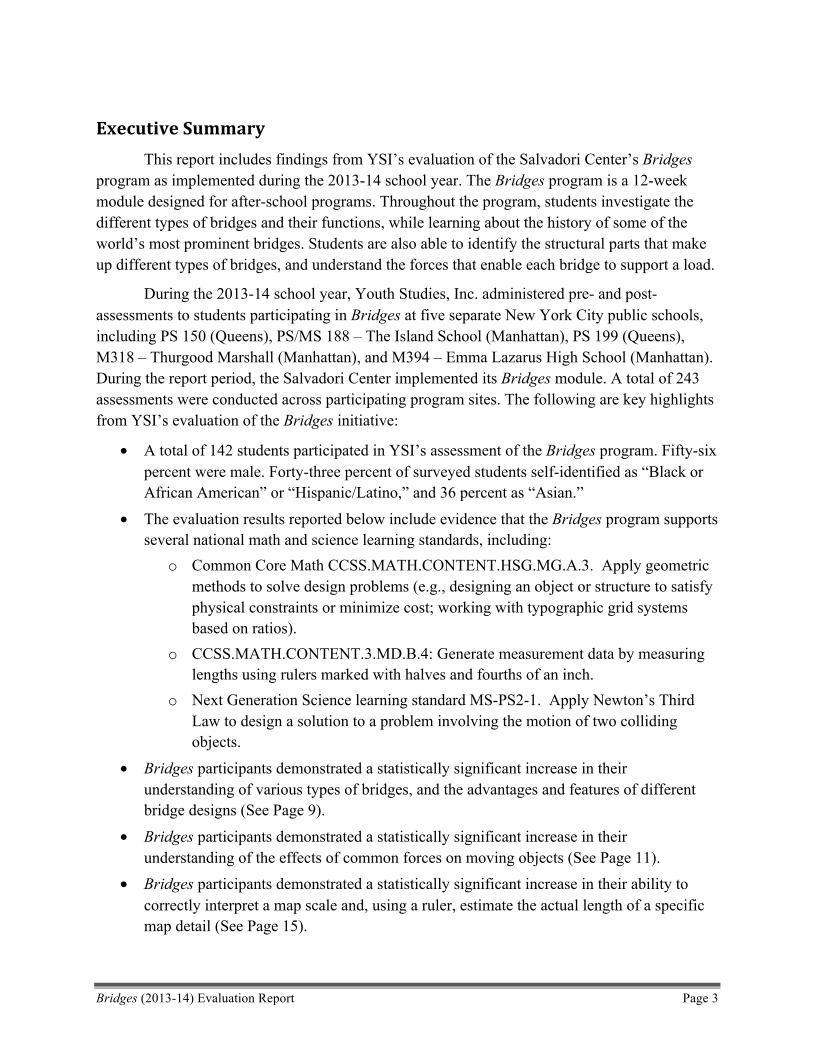
Executive Summary
This report includes findings from YSI’s evaluation of the Salvadori Center’s Bridges program as implemented during the 2013-14 school year. The Bridges program is a 12-week module designed for after-school programs. Throughout the program, students investigate the different types of bridges and their functions, while learning about the history of some of the world’s most prominent bridges. Students are also able to identify the structural parts that make up different types of bridges, and understand the forces that enable each bridge to support a load.
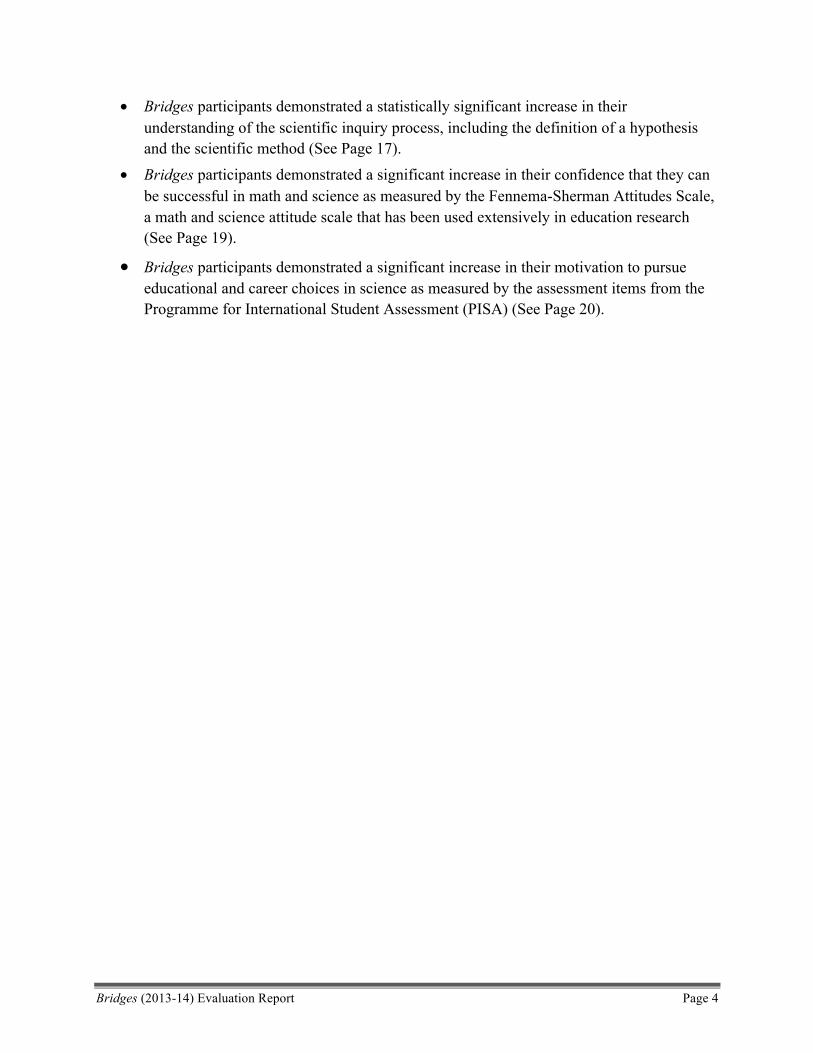
During the 2013-14 school year, Youth Studies, Inc. administered pre- and post-assessments to students participating in Bridges at five separate New York City public schools, including PS 150 (Queens), PS/MS 188 – The Island School (Manhattan), PS 199 (Queens), M318 – Thurgood Marshall (Manhattan), and M394 – Emma Lazarus High School (Manhattan). During the report period, the Salvadori Center implemented its Bridges module. A total of 243 assessments were conducted across participating program sites. The following are key highlights from YSI’s evaluation of the Bridges initiative:
• A total of 142 students participated in YSI’s assessment of the Bridges program. Fifty-six percent were male. Forty-three percent of surveyed students self-identified as “Black or African American” or “Hispanic/Latino,” and 36 percent as “Asian.”
• The evaluation results reported below include evidence that the Bridges program supports several national math and science learning standards, including:
o Common Core Math CCSS.MATH.CONTENT.HSG.MG.A.3. Apply geometric methods to solve design problems (e.g., designing an object or structure to satisfy physical constraints or minimize cost; working with typographic grid systems based on ratios).
o CCSS.MATH.CONTENT.3.MD.B.4: Generate measurement data by measuring lengths using rulers marked with halves and fourths of an inch.
o Next Generation Science learning standard MS-PS2-1. Apply Newton’s Third Law to design a solution to a problem involving the motion of two colliding objects.
• Bridges participants demonstrated a statistically significant increase in their understanding of various types of bridges, and the advantages and features of different bridge designs (See Page 9).
• Bridges participants demonstrated a statistically significant increase in their understanding of the effects of common forces on moving objects (See Page 11).
• Bridges participants demonstrated a statistically significant increase in their ability to correctly interpret a map scale and, using a ruler, estimate the actual length of a specific map detail (See Page 15).
Bridges (2013-14) Evaluation Report Page 4
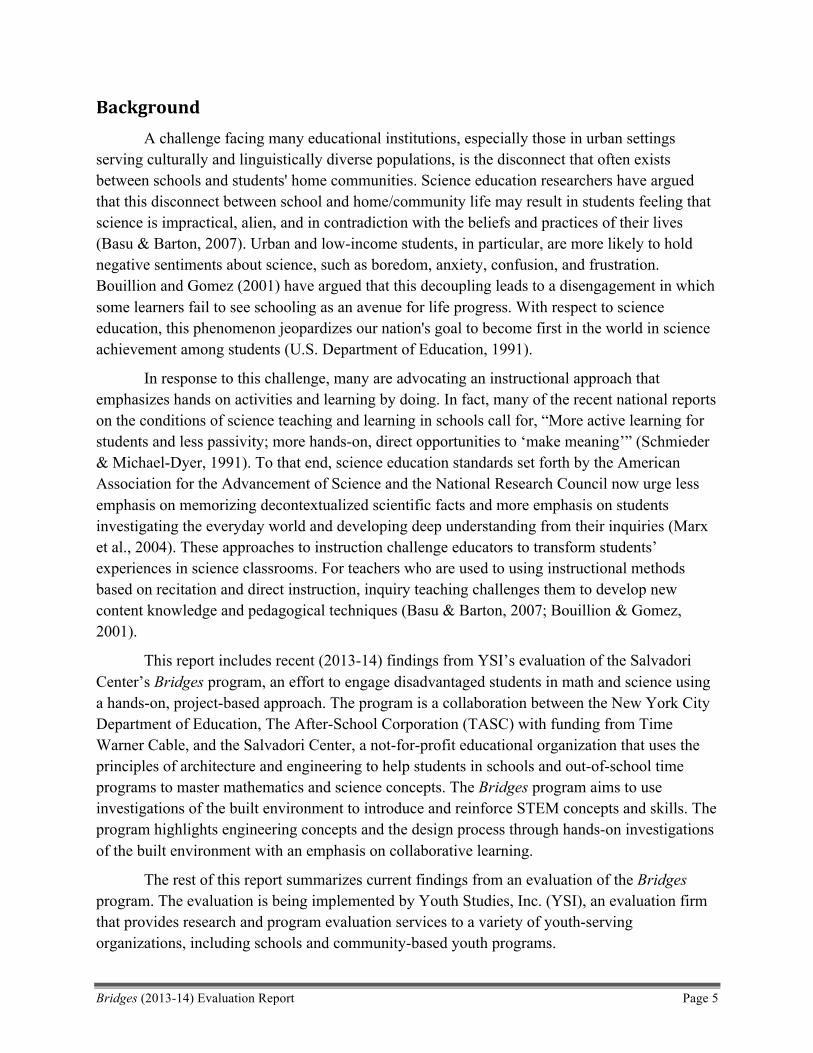
• Bridges participants demonstrated a statistically significant increase in their understanding of the scientific inquiry process, including the definition of a hypothesis and the scientific method (See Page 17).
• Bridges participants demonstrated a significant increase in their confidence that they can be successful in math and science as measured by the Fennema-Sherman Attitudes Scale, a math and science attitude scale that has been used extensively in education research (See Page 19).
• Bridges participants demonstrated a significant increase in their motivation to pursue educational and career choices in science as measured by the assessment items from the Programme for International Student Assessment (PISA) (See Page 20).
Bridges (2013-14) Evaluation Report Page 5
Background A challenge facing many educational institutions, especially those in urban settings serving culturally and linguistically diverse populations, is the disconnect that often exists between schools and students' home communities. Science education researchers have argued that this disconnect between school and home/community life may result in students feeling that science is impractical, alien, and in contradiction with the beliefs and practices of their lives (Basu & Barton, 2007). Urban and low-income students, in particular, are more likely to hold negative sentiments about science, such as boredom, anxiety, confusion, and frustration. Bouillion and Gomez (2001) have argued that this decoupling leads to a disengagement in which some learners fail to see schooling as an avenue for life progress. With respect to science education, this phenomenon jeopardizes our nation's goal to become first in the world in science achievement among students (U.S. Department of Education, 1991).
In response to this challenge, many are advocating an instructional approach that emphasizes hands on activities and learning by doing. In fact, many of the recent national reports on the conditions of science teaching and learning in schools call for, “More active learning for students and less passivity; more hands-on, direct opportunities to ‘make meaning’” (Schmieder & Michael-Dyer, 1991). To that end, science education standards set forth by the American Association for the Advancement of Science and the National Research Council now urge less emphasis on memorizing decontextualized scientific facts and more emphasis on students investigating the everyday world and developing deep understanding from their inquiries (Marx et al., 2004). These approaches to instruction challenge educators to transform students’ experiences in science classrooms. For teachers who are used to using instructional methods based on recitation and direct instruction, inquiry teaching challenges them to develop new content knowledge and pedagogical techniques (Basu & Barton, 2007; Bouillion & Gomez, 2001).
This report includes recent (2013-14) findings from YSI’s evaluation of the Salvadori Center’s Bridges program, an effort to engage disadvantaged students in math and science using a hands-on, project-based approach. The program is a collaboration between the New York City Department of Education, The After-School Corporation (TASC) with funding from Time Warner Cable, and the Salvadori Center, a not-for-profit educational organization that uses the principles of architecture and engineering to help students in schools and out-of-school time programs to master mathematics and science concepts. The Bridges program aims to use investigations of the built environment to introduce and reinforce STEM concepts and skills. The program highlights engineering concepts and the design process through hands-on investigations of the built environment with an emphasis on collaborative learning.
The rest of this report summarizes current findings from an evaluation of the Bridges program. The evaluation is being implemented by Youth Studies, Inc. (YSI), an evaluation firm that provides research and program evaluation services to a variety of youth-serving organizations, including schools and community-based youth programs.
Bridges (2013-14) Evaluation Report Page 6
The Bridges program uses hands-on activities and design challenges to foster student learning and exploration of various topics relating to the history, design, and construction of bridges. Throughout the module, students investigate the different types of bridges and their functions, while learning about the history of some of the world’s most prominent bridges. Students are also able to identify the structural parts that make up different types of bridges, and understand the forces that enable different bridge types to support a load.
This curriculum is aligned to the Common Core Math Standards and the New York State Standards for Math, Science, and Technology. Each lesson uses a collaborative, hands-on, project-based approach. Activities in Sessions 1 through 7 enhance the skills of measurement, observation, classification, and drawing conclusions based on the results of a controlled experiment. In Sessions 8 through 12, students explore a real-world application of the collaborative processes used in project development and construction by designing a scaled prototype of a model bridge under a given set of constraints. Students analyze and interpret the relative strength of a different truss bridge designs by testing their load-bearing capacities, and using these findings to modify their design and build an improved version of their model.
Below we provide an overview of the structure and schedule of the Bridges program:
Session 1: Bridge to Understanding Students learn what a bridge is and how bridges are part of the built environment.
Session 2: Paper Bridges Students learn the defining characteristics and primary functions of different types of bridges.
Session 3: Tension, Compression and Span Length Students learn how tension, compression, and span length affect the strength and stability of a beam bridge. Session 4: Why Bridges Stand Up
Students learn how the shape of a bridge affects the way it distributes load and how much load it can bear.
Session 5: Arch Bridges Students learn the history of arch bridges and explore the forces that allow them to support a load. Session 6: Truss Bridges
Students learn what a truss system is and how trusses dissipate the loads to many different points on a bridge.
Session 7: Suspension Bridges Students learn how the forces acting on a suspension bridge allow it to support a load.
Bridges (2013-14) Evaluation Report Page 7
Session 8: Developing a Site Plan Students learn how architects and engineers apply math, science, technology, and engineering design skills to solve problems and meet the needs of the local community. Sessions 9 and 10: Truss Bridge Design Challenge, Part 1
Students learn how to design, construct, and analyze the cost of a scale model truss bridge. Sessions 11 and 12: Truss Bridge Design Challenge, Part 2
Students learn how the appropriateness of a bridge’s design is based in part on the load it needs to support, and how testing the load-bearing capacity of a prototype design can lead to improvements in the final model.
Description of Evaluation Process Participant Assessments
YSI developed pre- and post-participation student assessments that were administered by Salvadori instructors during the first and final Bridges sessions, at participating schools. In addition to basic background questions (e.g. gender, age, and ethnicity), the pre- and post-assessments included standardized measures of: 1) students’ familiarity with various types of bridges and their relative benefits; 2) students’ understanding of the effects of common forces on objects; 3) students’ ability to read and interpret a chronological timeline; 4) students’ ability to generate measurement data using a ruler; 5) student understanding of the scientific inquiry process; 6) students’ confidence in their ability to succeed in math and science; and 7) students’ future-oriented motivation to pursue math and science careers.
A total of 142 students participated in YSI’s assessment of the Bridges program. Of those 142 students, 101 completed both a pre- and post-test assessment. The remaining 41 students participated in the pre-test only (32) or only submitted a post-test assessment (9). Table 1 below includes a list of the schools participating in Bridges during the study period and the number of students from each program who participated in at least one of the assessments.
Table 1. Participating Schools
Participating School # of Students PS 150 19 PS 188 – The Island School 13 PS 199 20 IS 318 – Math, Science and Technology Through Art 21 M 394 – Emma Lazarus High School 69
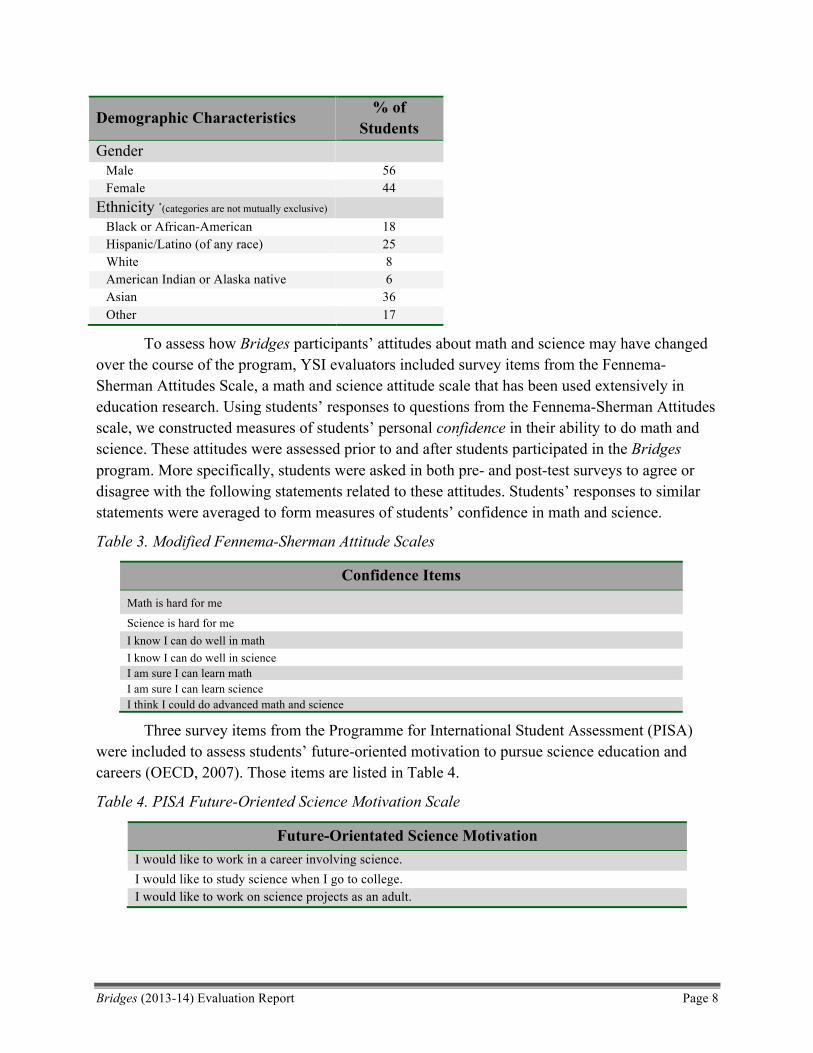
As seen in Table 2, 56 percent of students assessed were male. Moreover, 36 percent of participating students self-identified as “Asian,” 25 percent as “Hispanic/Latino,” and 18 percent as “Black or African-American.”
Table 2. Background Characteristics of BRIDGES Participants
Bridges (2013-14) Evaluation Report Page 8
Demographic Characteristics % of Students
Gender Male 56 Female 44 Ethnicity *(categories are not mutually exclusive) Black or African-American 18 Hispanic/Latino (of any race) 25 White 8 American Indian or Alaska native 6 Asian 36 Other 17
To assess how Bridges participants’ attitudes about math and science may have changed over the course of the program, YSI evaluators included survey items from the Fennema-Sherman Attitudes Scale, a math and science attitude scale that has been used extensively in education research. Using students’ responses to questions from the Fennema-Sherman Attitudes scale, we constructed measures of students’ personal confidence in their ability to do math and science. These attitudes were assessed prior to and after students participated in the Bridges program. More specifically, students were asked in both pre- and post-test surveys to agree or disagree with the following statements related to these attitudes. Students’ responses to similar statements were averaged to form measures of students’ confidence in math and science.
Table 3. Modified Fennema-Sherman Attitude Scales
Confidence Items
Math is hard for me
Science is hard for me I know I can do well in math I know I can do well in science I am sure I can learn math I am sure I can learn science I think I could do advanced math and science
Three survey items from the Programme for International Student Assessment (PISA) were included to assess students’ future-oriented motivation to pursue science education and careers (OECD, 2007). Those items are listed in Table 4.
Table 4. PISA Future-Oriented Science Motivation Scale
Future-Orientated Science Motivation I would like to work in a career involving science. I would like to study science when I go to college. I would like to work on science projects as an adult.
Bridges (2013-14) Evaluation Report Page 9
Participant Outcome Findings Bridges participants were surveyed at the beginning and conclusion of the 12-week
program cycle during the 2013-14 school year. In addition to basic background questions (e.g. gender, age, and ethnicity), the pre- and post-assessments included standardized measures of: 1) students’ familiarity with various types of bridges and their relative benefits; 2) students’ understanding of the effects of common forces on objects; 3) students’ ability to read and interpret a chronological timeline; 4) students’ ability to generate measurement data using a ruler; 5) student understanding of the scientific inquiry process; 6) students’ confidence in their ability to succeed in math and science; and 7) students’ future-oriented motivation to pursue math and science careers.
Students’ Familiarity with Various Bridge Types
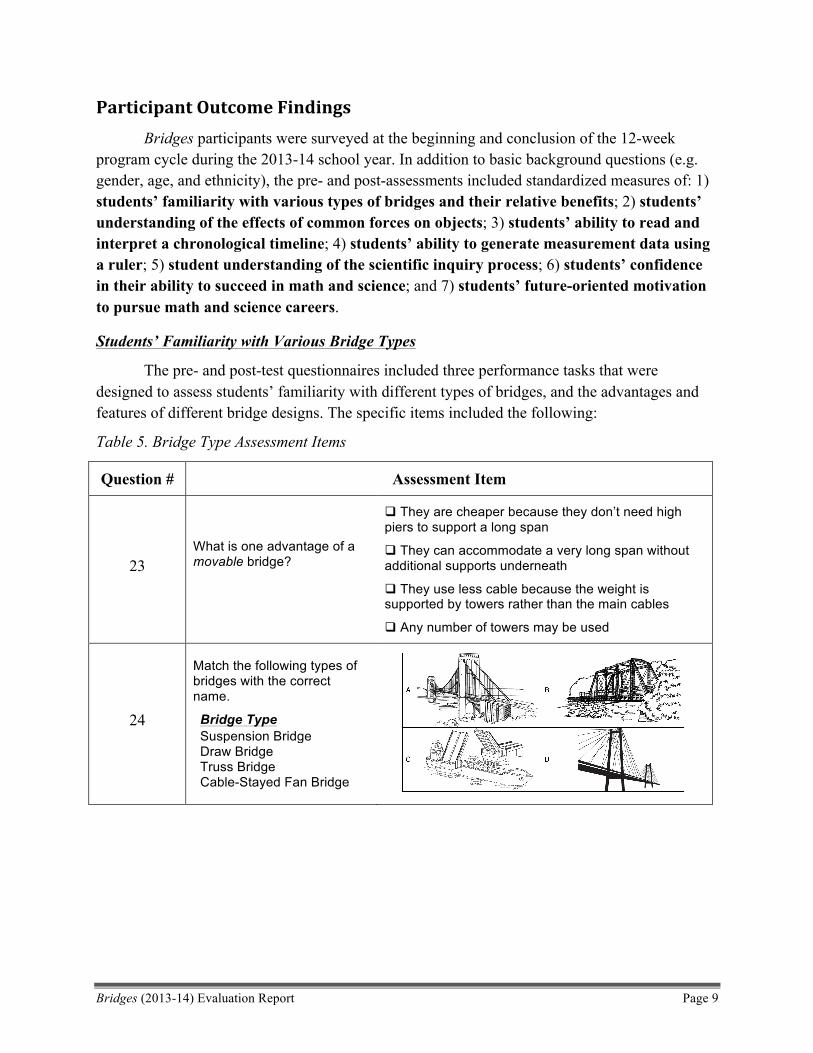
The pre- and post-test questionnaires included three performance tasks that were designed to assess students’ familiarity with different types of bridges, and the advantages and features of different bridge designs. The specific items included the following:
Table 5. Bridge Type Assessment Items
Question # Assessment Item
23 What is one advantage of a movable bridge?
q They are cheaper because they don’t need high piers to support a long span
q They can accommodate a very long span without additional supports underneath
q They use less cable because the weight is supported by towers rather than the main cables
q Any number of towers may be used
24
Match the following types of bridges with the correct name.
Bridge Type
Suspension Bridge Draw Bridge Truss Bridge Cable-Stayed Fan Bridge
Bridges (2013-14) Evaluation Report Page 10
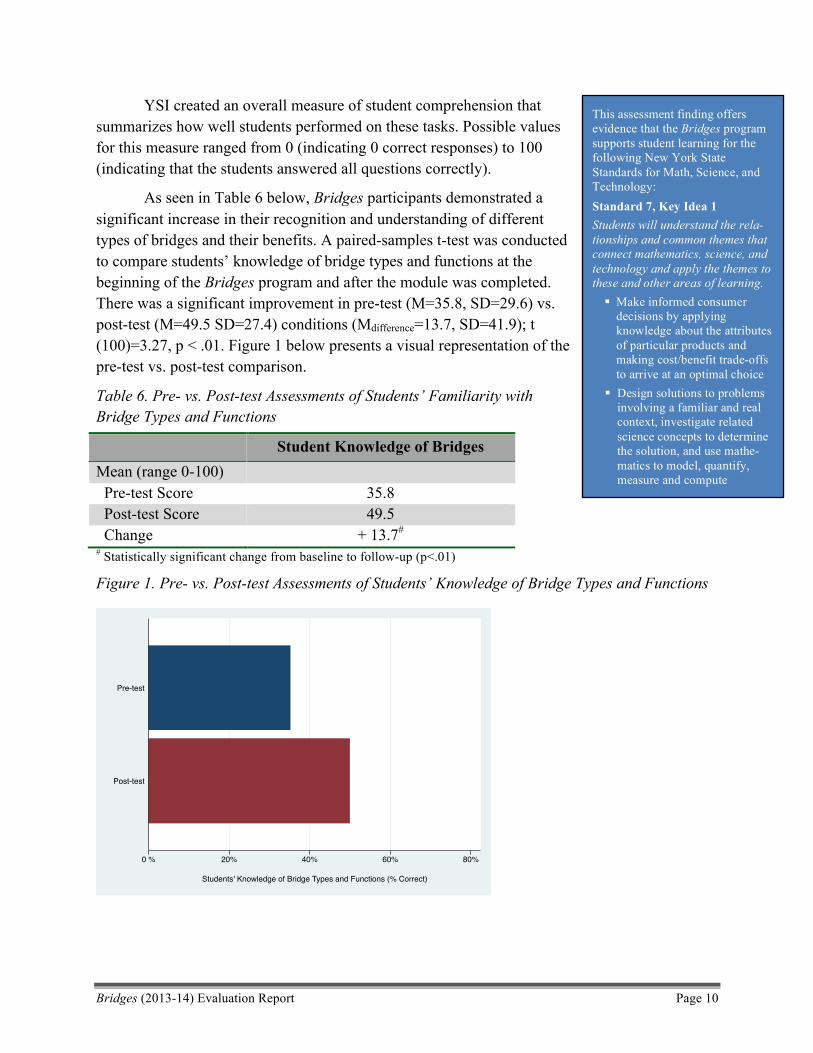
YSI created an overall measure of student comprehension that summarizes how well students performed on these tasks. Possible values for this measure ranged from 0 (indicating 0 correct responses) to 100 (indicating that the students answered all questions correctly).
As seen in Table 6 below, Bridges participants demonstrated a significant increase in their recognition and understanding of different types of bridges and their benefits. A paired-samples t-test was conducted to compare students’ knowledge of bridge types and functions at the beginning of the Bridges program and after the module was completed. There was a significant improvement in pre-test (M=35.8, SD=29.6) vs. post-test (M=49.5 SD=27.4) conditions (Mdifference=13.7, SD=41.9); t (100)=3.27, p < .01. Figure 1 below presents a visual representation of the pre-test vs. post-test comparison.
Table 6. Pre- vs. Post-test Assessments of Students’ Familiarity with Bridge Types and Functions
Student Knowledge of Bridges Mean (range 0-100) Pre-test Score 35.8 Post-test Score 49.5 Change + 13.7# # Statistically significant change from baseline to follow-up (p<.01)
Figure 1. Pre- vs. Post-test Assessments of Students’ Knowledge of Bridge Types and Functions
0 % 20% 40% 60% 80%
Students' Knowledge of Bridge Types and Functions (% Correct)
Post-test
Pre-test
This assessment finding offers evidence that the Bridges program supports student learning for the following New York State Standards for Math, Science, and Technology: Standard 7, Key Idea 1 Students will understand the rela-tionships and common themes that connect mathematics, science, and technology and apply the themes to these and other areas of learning. § Make informed consumer
decisions by applying knowledge about the attributes of particular products and making cost/benefit trade-offs to arrive at an optimal choice
§ Design solutions to problems involving a familiar and real context, investigate related science concepts to determine the solution, and use mathe-matics to model, quantify, measure and compute
Bridges (2013-14) Evaluation Report Page 11
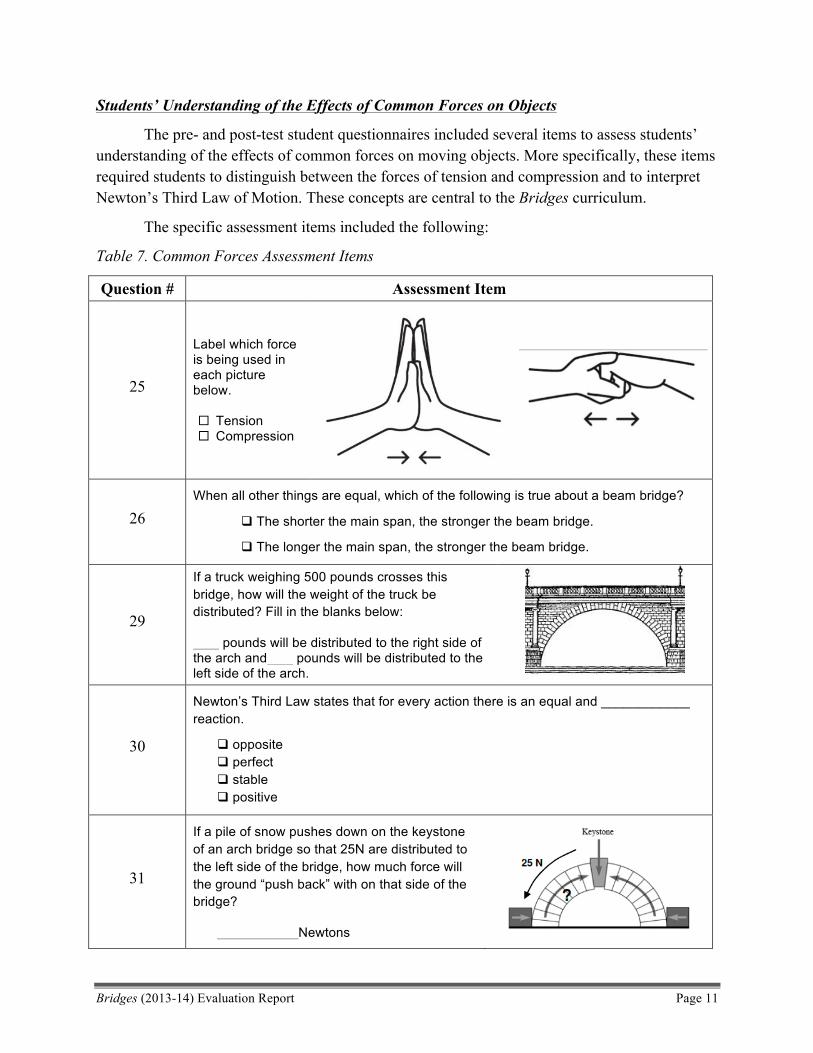
Students’ Understanding of the Effects of Common Forces on Objects
The pre- and post-test student questionnaires included several items to assess students’ understanding of the effects of common forces on moving objects. More specifically, these items required students to distinguish between the forces of tension and compression and to interpret Newton’s Third Law of Motion. These concepts are central to the Bridges curriculum.
The specific assessment items included the following:
Table 7. Common Forces Assessment Items
Question # Assessment Item
25
Label which force is being used in each picture below. ¨ Tension ¨ Compression
26 When all other things are equal, which of the following is true about a beam bridge?
q The shorter the main span, the stronger the beam bridge.
q The longer the main span, the stronger the beam bridge.
29
If a truck weighing 500 pounds crosses this bridge, how will the weight of the truck be distributed? Fill in the blanks below:
pounds will be distributed to the right side of the arch and pounds will be distributed to the left side of the arch.
30
Newton’s Third Law states that for every action there is an equal and ____________ reaction.
q opposite q perfect q stable q positive
31
If a pile of snow pushes down on the keystone of an arch bridge so that 25N are distributed to the left side of the bridge, how much force will the ground “push back” with on that side of the bridge?
Newtons
Bridges (2013-14) Evaluation Report Page 12
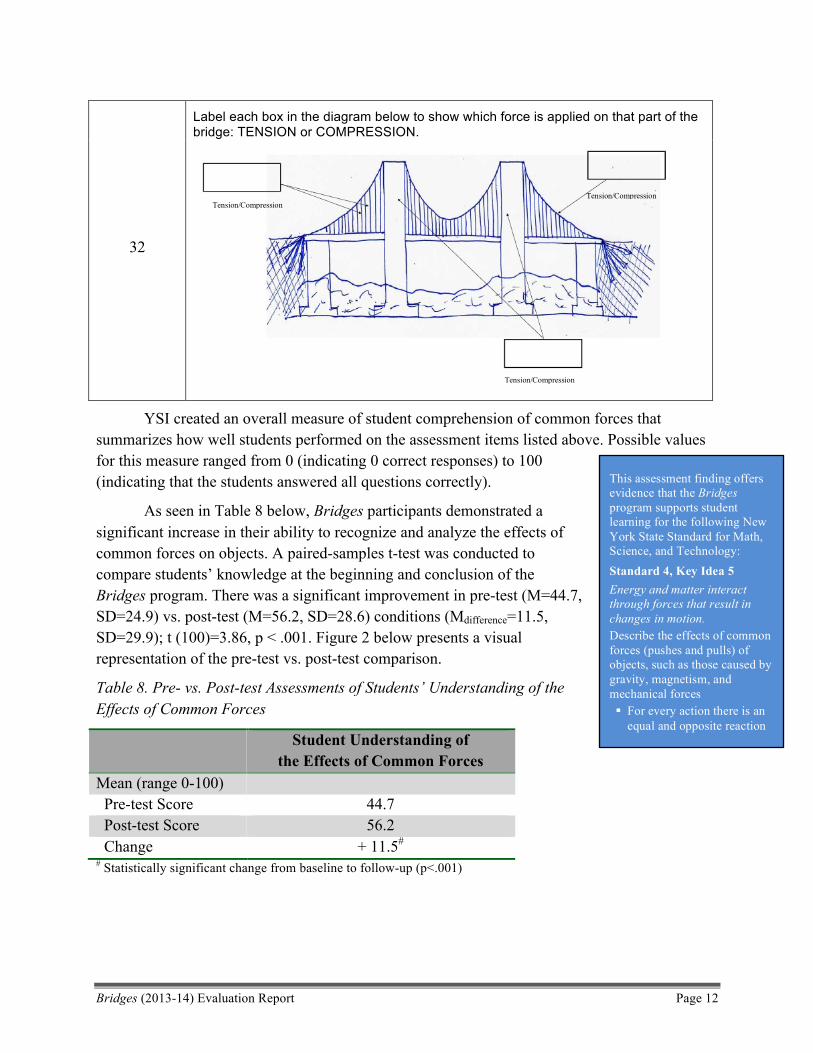
32
Label each box in the diagram below to show which force is applied on that part of the bridge: TENSION or COMPRESSION.
YSI created an overall measure of student comprehension of common forces that summarizes how well students performed on the assessment items listed above. Possible values for this measure ranged from 0 (indicating 0 correct responses) to 100 (indicating that the students answered all questions correctly).
As seen in Table 8 below, Bridges participants demonstrated a significant increase in their ability to recognize and analyze the effects of common forces on objects. A paired-samples t-test was conducted to compare students’ knowledge at the beginning and conclusion of the Bridges program. There was a significant improvement in pre-test (M=44.7, SD=24.9) vs. post-test (M=56.2, SD=28.6) conditions (Mdifference=11.5, SD=29.9); t (100)=3.86, p < .001. Figure 2 below presents a visual representation of the pre-test vs. post-test comparison.
Table 8. Pre- vs. Post-test Assessments of Students’ Understanding of the Effects of Common Forces
Student Understanding of the Effects of Common Forces
Mean (range 0-100) Pre-test Score 44.7 Post-test Score 56.2 Change + 11.5# # Statistically significant change from baseline to follow-up (p<.001)
Tension/Compression Tension/Compression
Tension/Compression
This assessment finding offers evidence that the Bridges program supports student learning for the following New York State Standard for Math, Science, and Technology: Standard 4, Key Idea 5 Energy and matter interact through forces that result in changes in motion. Describe the effects of common forces (pushes and pulls) of objects, such as those caused by gravity, magnetism, and mechanical forces § For every action there is an
equal and opposite reaction
Bridges (2013-14) Evaluation Report Page 13
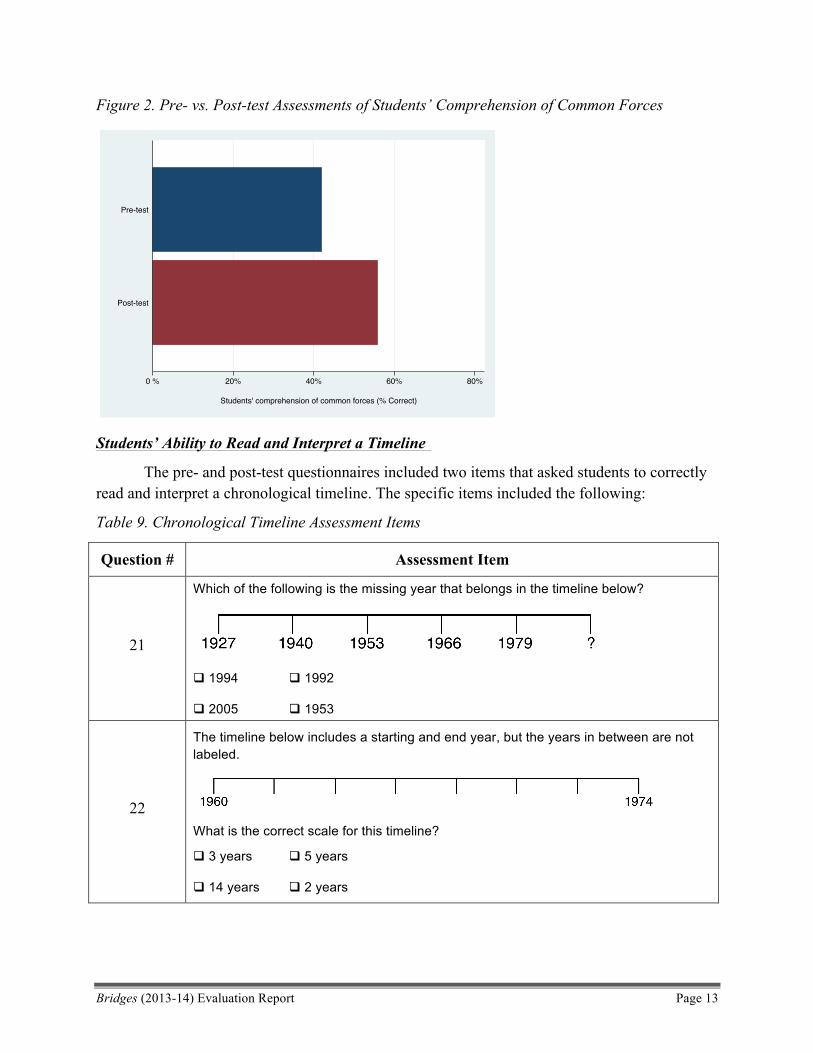
Figure 2. Pre- vs. Post-test Assessments of Students’ Comprehension of Common Forces
Students’ Ability to Read and Interpret a Timeline
The pre- and post-test questionnaires included two items that asked students to correctly read and interpret a chronological timeline. The specific items included the following:
Table 9. Chronological Timeline Assessment Items
Question # Assessment Item
21
Which of the following is the missing year that belongs in the timeline below?
q 1994 q 1992
q 2005 q 1953
22
The timeline below includes a starting and end year, but the years in between are not labeled.
What is the correct scale for this timeline?
q 3 years q 5 years
q 14 years q 2 years
0 % 20% 40% 60% 80%
Students' comprehension of common forces (% Correct)
Post-test
Pre-test
Bridges (2013-14) Evaluation Report Page 14
YSI created a measure of students’ ability to correctly interpret a chronological timeline using the items above. Possible values for this measure ranged from 0 (indicating 0 correct responses) to 100 (indicating that the students answered all questions correctly).
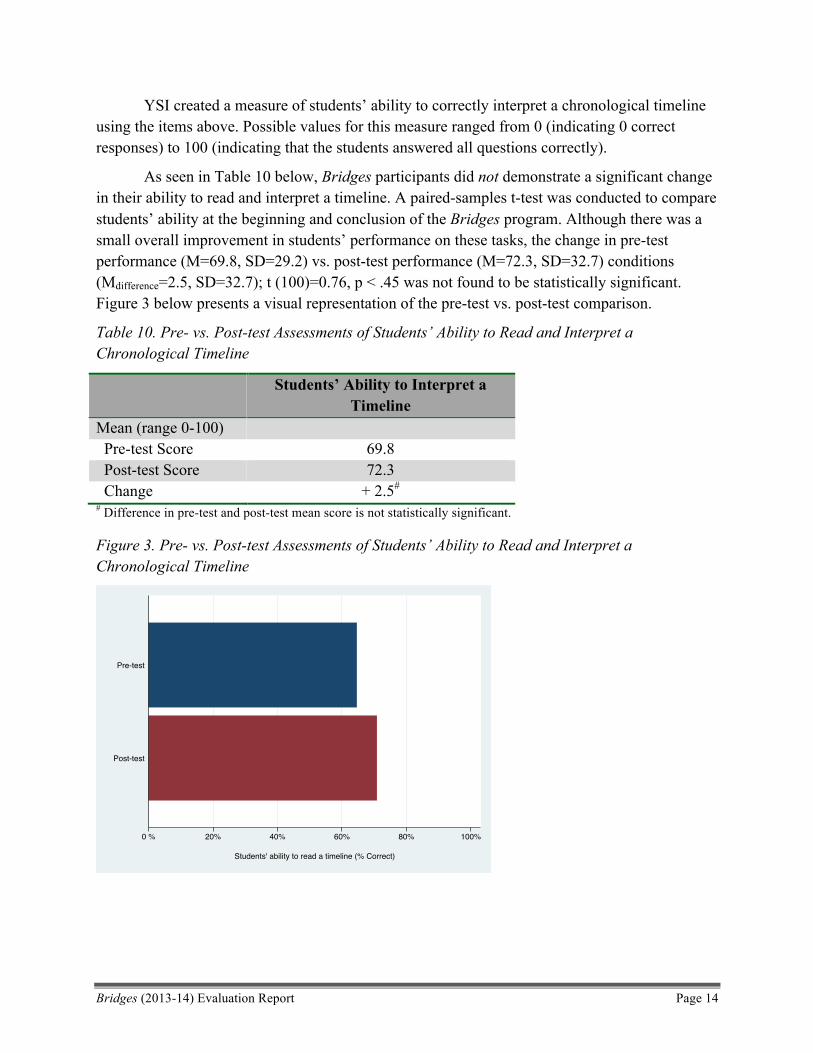
As seen in Table 10 below, Bridges participants did not demonstrate a significant change in their ability to read and interpret a timeline. A paired-samples t-test was conducted to compare students’ ability at the beginning and conclusion of the Bridges program. Although there was a small overall improvement in students’ performance on these tasks, the change in pre-test performance (M=69.8, SD=29.2) vs. post-test performance (M=72.3, SD=32.7) conditions (Mdifference=2.5, SD=32.7); t (100)=0.76, p < .45 was not found to be statistically significant. Figure 3 below presents a visual representation of the pre-test vs. post-test comparison.
Table 10. Pre- vs. Post-test Assessments of Students’ Ability to Read and Interpret a Chronological Timeline
Students’ Ability to Interpret a Timeline
Mean (range 0-100) Pre-test Score 69.8 Post-test Score 72.3 Change + 2.5# # Difference in pre-test and post-test mean score is not statistically significant.
Figure 3. Pre- vs. Post-test Assessments of Students’ Ability to Read and Interpret a Chronological Timeline
0 % 20% 40% 60% 80% 100%
Students' ability to read a timeline (% Correct)
Post-test
Pre-test
Bridges (2013-14) Evaluation Report Page 15
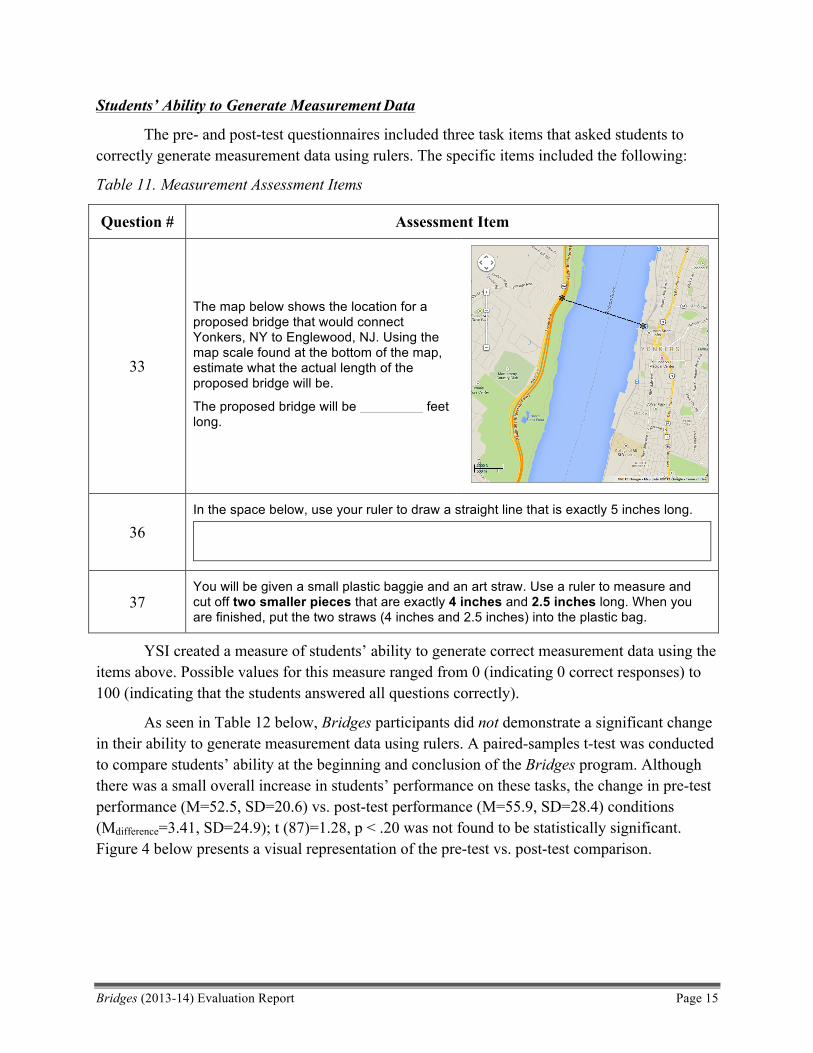
Students’ Ability to Generate Measurement Data
The pre- and post-test questionnaires included three task items that asked students to correctly generate measurement data using rulers. The specific items included the following:
Table 11. Measurement Assessment Items
Question # Assessment Item
33
The map below shows the location for a proposed bridge that would connect Yonkers, NY to Englewood, NJ. Using the map scale found at the bottom of the map, estimate what the actual length of the proposed bridge will be.
The proposed bridge will be feet long.
36 In the space below, use your ruler to draw a straight line that is exactly 5 inches long.
37 You will be given a small plastic baggie and an art straw. Use a ruler to measure and cut off two smaller pieces that are exactly 4 inches and 2.5 inches long. When you are finished, put the two straws (4 inches and 2.5 inches) into the plastic bag.
YSI created a measure of students’ ability to generate correct measurement data using the items above. Possible values for this measure ranged from 0 (indicating 0 correct responses) to 100 (indicating that the students answered all questions correctly).
As seen in Table 12 below, Bridges participants did not demonstrate a significant change in their ability to generate measurement data using rulers. A paired-samples t-test was conducted to compare students’ ability at the beginning and conclusion of the Bridges program. Although there was a small overall increase in students’ performance on these tasks, the change in pre-test performance (M=52.5, SD=20.6) vs. post-test performance (M=55.9, SD=28.4) conditions (Mdifference=3.41, SD=24.9); t (87)=1.28, p < .20 was not found to be statistically significant. Figure 4 below presents a visual representation of the pre-test vs. post-test comparison.
Bridges (2013-14) Evaluation Report Page 16
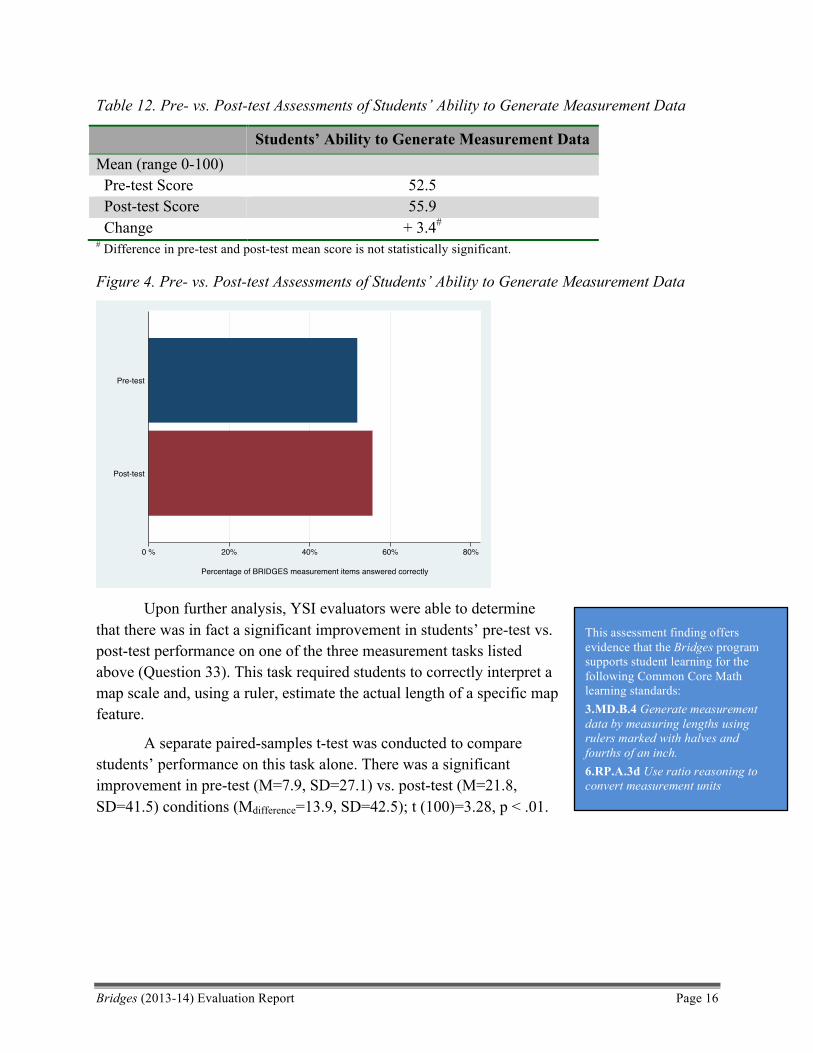
Table 12. Pre- vs. Post-test Assessments of Students’ Ability to Generate Measurement Data
Students’ Ability to Generate Measurement Data Mean (range 0-100) Pre-test Score 52.5 Post-test Score 55.9 Change + 3.4# # Difference in pre-test and post-test mean score is not statistically significant.
Figure 4. Pre- vs. Post-test Assessments of Students’ Ability to Generate Measurement Data
Upon further analysis, YSI evaluators were able to determine that there was in fact a significant improvement in students’ pre-test vs. post-test performance on one of the three measurement tasks listed above (Question 33). This task required students to correctly interpret a map scale and, using a ruler, estimate the actual length of a specific map feature.
A separate paired-samples t-test was conducted to compare students’ performance on this task alone. There was a significant improvement in pre-test (M=7.9, SD=27.1) vs. post-test (M=21.8, SD=41.5) conditions (Mdifference=13.9, SD=42.5); t (100)=3.28, p < .01.
0 % 20% 40% 60% 80%
Percentage of BRIDGES measurement items answered correctly
Post-test
Pre-test
This assessment finding offers evidence that the Bridges program supports student learning for the following Common Core Math learning standards: 3.MD.B.4 Generate measurement data by measuring lengths using rulers marked with halves and fourths of an inch. 6.RP.A.3d Use ratio reasoning to convert measurement units
Bridges (2013-14) Evaluation Report Page 17
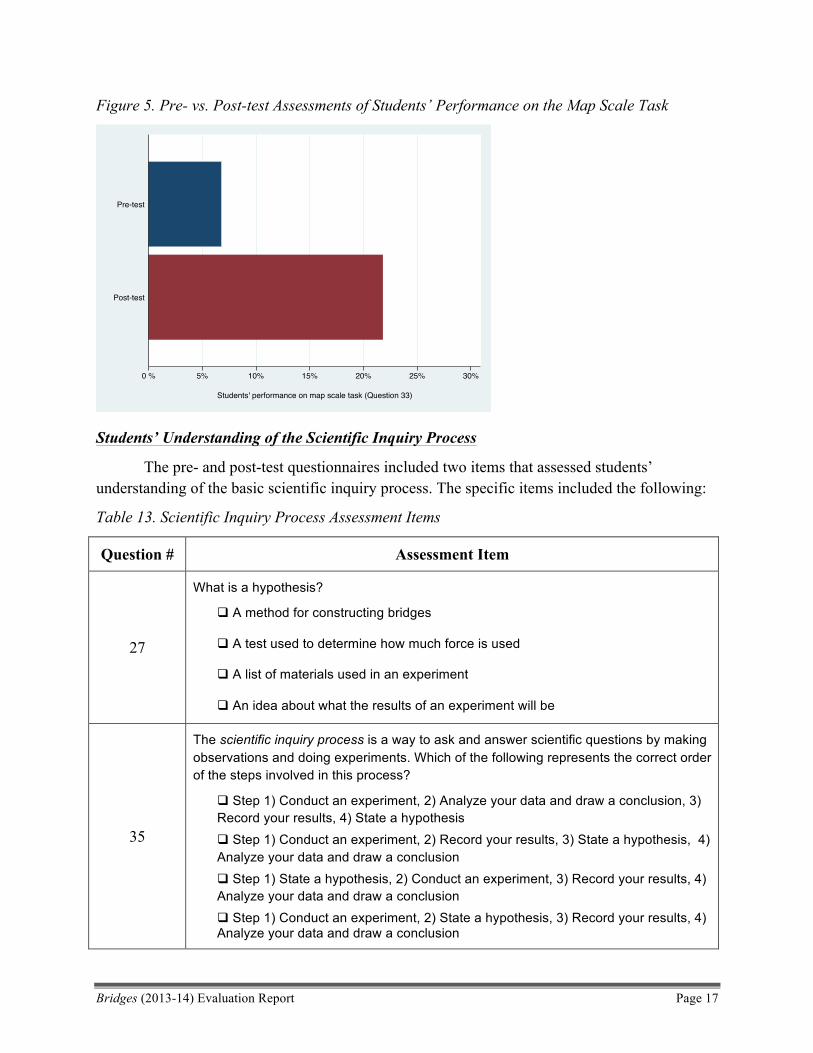
Figure 5. Pre- vs. Post-test Assessments of Students’ Performance on the Map Scale Task
Students’ Understanding of the Scientific Inquiry Process
The pre- and post-test questionnaires included two items that assessed students’ understanding of the basic scientific inquiry process. The specific items included the following:
Table 13. Scientific Inquiry Process Assessment Items
Question # Assessment Item
27
What is a hypothesis?
q A method for constructing bridges
q A test used to determine how much force is used
q A list of materials used in an experiment
q An idea about what the results of an experiment will be
35
The scientific inquiry process is a way to ask and answer scientific questions by making observations and doing experiments. Which of the following represents the correct order of the steps involved in this process?
q Step 1) Conduct an experiment, 2) Analyze your data and draw a conclusion, 3) Record your results, 4) State a hypothesis q Step 1) Conduct an experiment, 2) Record your results, 3) State a hypothesis, 4) Analyze your data and draw a conclusion q Step 1) State a hypothesis, 2) Conduct an experiment, 3) Record your results, 4) Analyze your data and draw a conclusion q Step 1) Conduct an experiment, 2) State a hypothesis, 3) Record your results, 4) Analyze your data and draw a conclusion
0 % 5% 10% 15% 20% 25% 30%
Students' performance on map scale task (Question 33)
Post-test
Pre-test
Bridges (2013-14) Evaluation Report Page 18
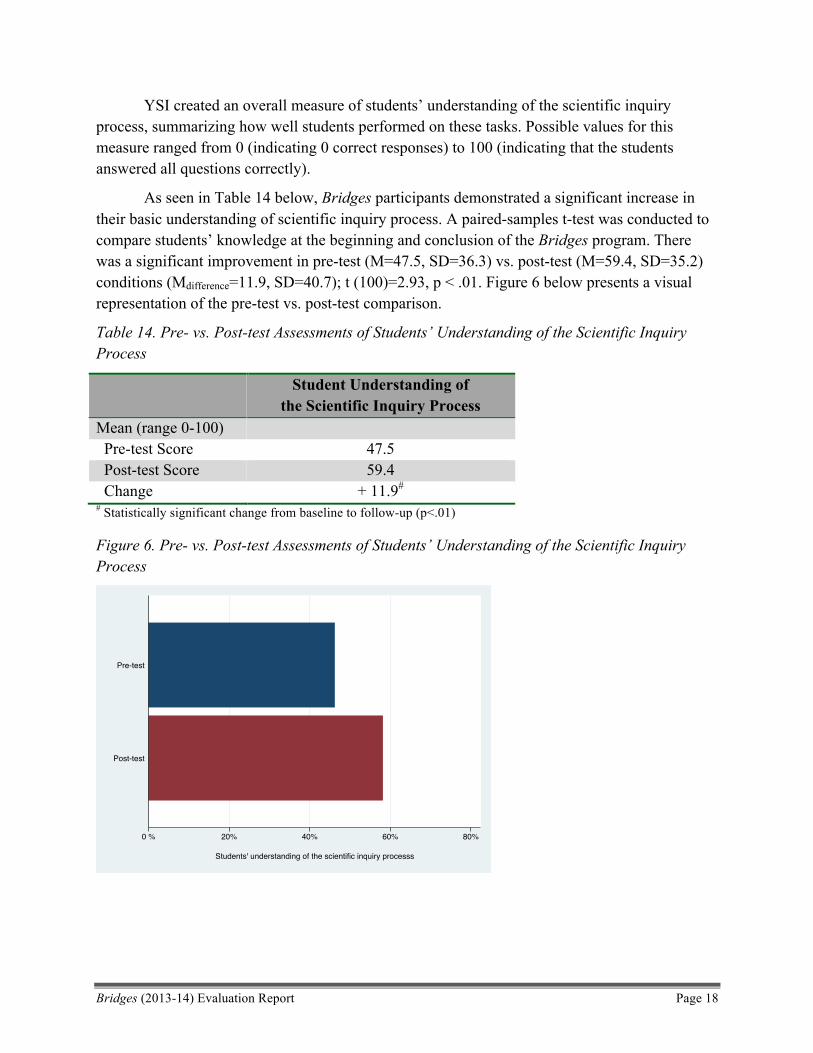
YSI created an overall measure of students’ understanding of the scientific inquiry process, summarizing how well students performed on these tasks. Possible values for this measure ranged from 0 (indicating 0 correct responses) to 100 (indicating that the students answered all questions correctly).
As seen in Table 14 below, Bridges participants demonstrated a significant increase in their basic understanding of scientific inquiry process. A paired-samples t-test was conducted to compare students’ knowledge at the beginning and conclusion of the Bridges program. There was a significant improvement in pre-test (M=47.5, SD=36.3) vs. post-test (M=59.4, SD=35.2) conditions (Mdifference=11.9, SD=40.7); t (100)=2.93, p < .01. Figure 6 below presents a visual representation of the pre-test vs. post-test comparison.
Table 14. Pre- vs. Post-test Assessments of Students’ Understanding of the Scientific Inquiry Process
Student Understanding of the Scientific Inquiry Process
Mean (range 0-100) Pre-test Score 47.5 Post-test Score 59.4 Change + 11.9# # Statistically significant change from baseline to follow-up (p<.01)
Figure 6. Pre- vs. Post-test Assessments of Students’ Understanding of the Scientific Inquiry Process
0 % 20% 40% 60% 80%
Students' understanding of the scientific inquiry processs
Post-test
Pre-test
Bridges (2013-14) Evaluation Report Page 19
Students’ Confidence in their Ability to Succeed in Math and Science
To assess how Bridges students’ attitudes about math and science may have changed during the year they participated in the program, evaluators administered a modified version of the Fennema-Sherman Attitudes Scale (see description above). Responses to this assessment were used to develop a measure of students’ personal confidence in their ability to do math and science. These attitudes were assessed prior to and after students participated in Bridges. The assessment items included:
Table 15. Student Confidence Items
Question # Confidence Item (Answer Choices: Strongly Disagree, Disagree, Agree, Strongly Agree)
6 I am sure I can learn math 7 I know I can do well in science 8 I think I could do advanced math and science 9 Math is hard for me
10 I know I can do well in math 13 Science is hard for me 15 I am sure I can learn science
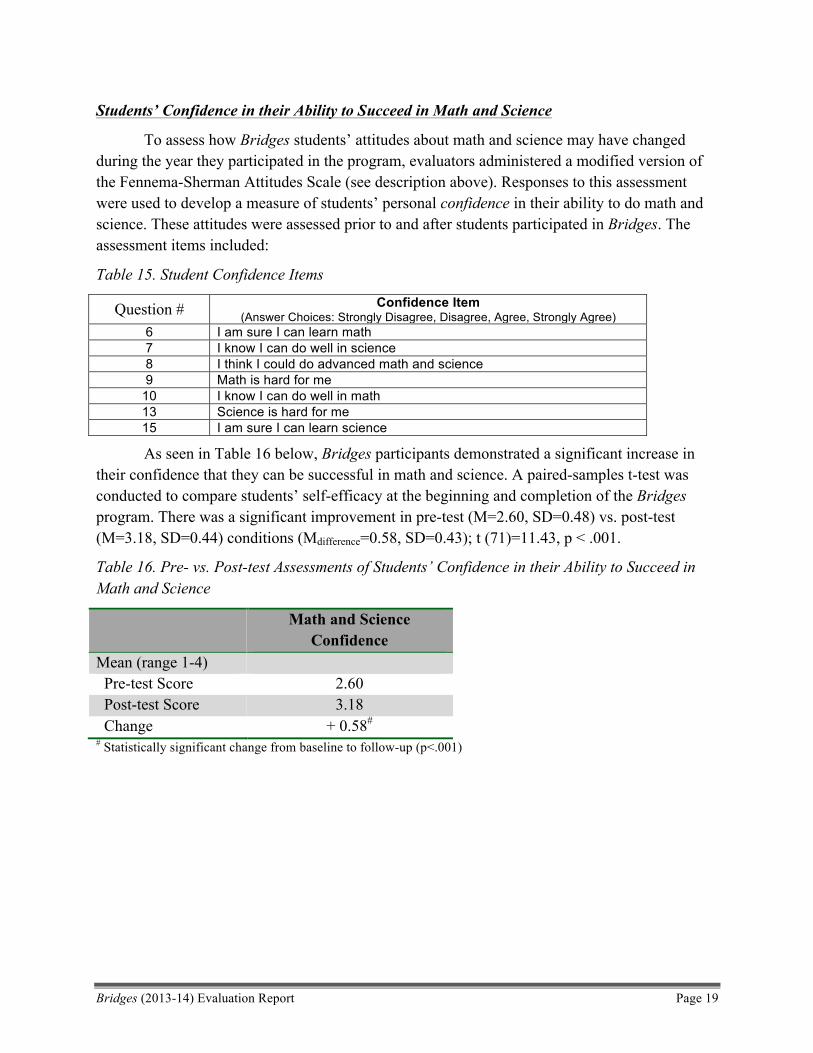
As seen in Table 16 below, Bridges participants demonstrated a significant increase in their confidence that they can be successful in math and science. A paired-samples t-test was conducted to compare students’ self-efficacy at the beginning and completion of the Bridges program. There was a significant improvement in pre-test (M=2.60, SD=0.48) vs. post-test (M=3.18, SD=0.44) conditions (Mdifference=0.58, SD=0.43); t (71)=11.43, p < .001.
Table 16. Pre- vs. Post-test Assessments of Students’ Confidence in their Ability to Succeed in Math and Science
Math and Science Confidence
Mean (range 1-4) Pre-test Score 2.60 Post-test Score 3.18 Change + 0.58# # Statistically significant change from baseline to follow-up (p<.001)
Bridges (2013-14) Evaluation Report Page 20
Figure 7. Pre- vs. Post-test Assessments of Students’ Confidence in their Ability to Succeed in Math and Science
Students’ Future-oriented Motivation to Pursue Science Careers
The Bridges participant survey included three items to measure students’ motivation to pursue future education and careers in math and science. These items included:
Table 17. Future-Oriented Motivation Assessment Items
Question # Motivation Item (Answer Choices: Strongly Disagree, Disagree, Agree, Strongly Agree)
11 I would like to work in a career involving science. 12 I would like to study science when I go to college. 14 I would like to work on science projects as an adult.
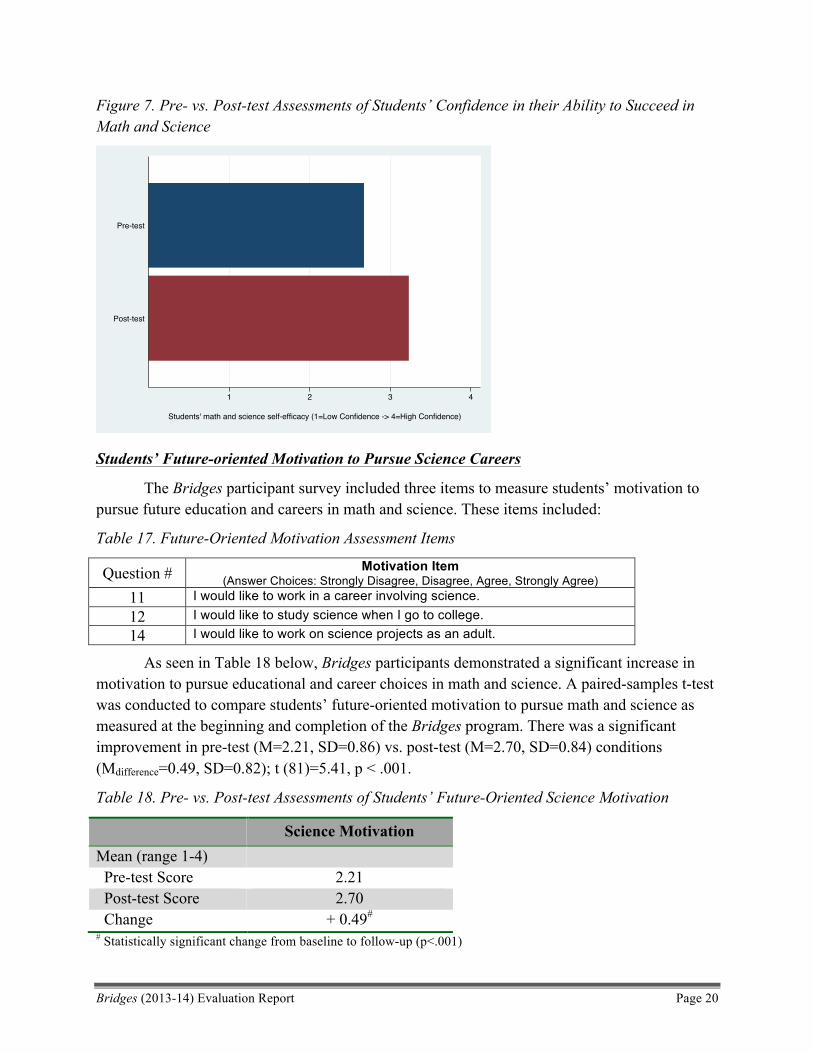
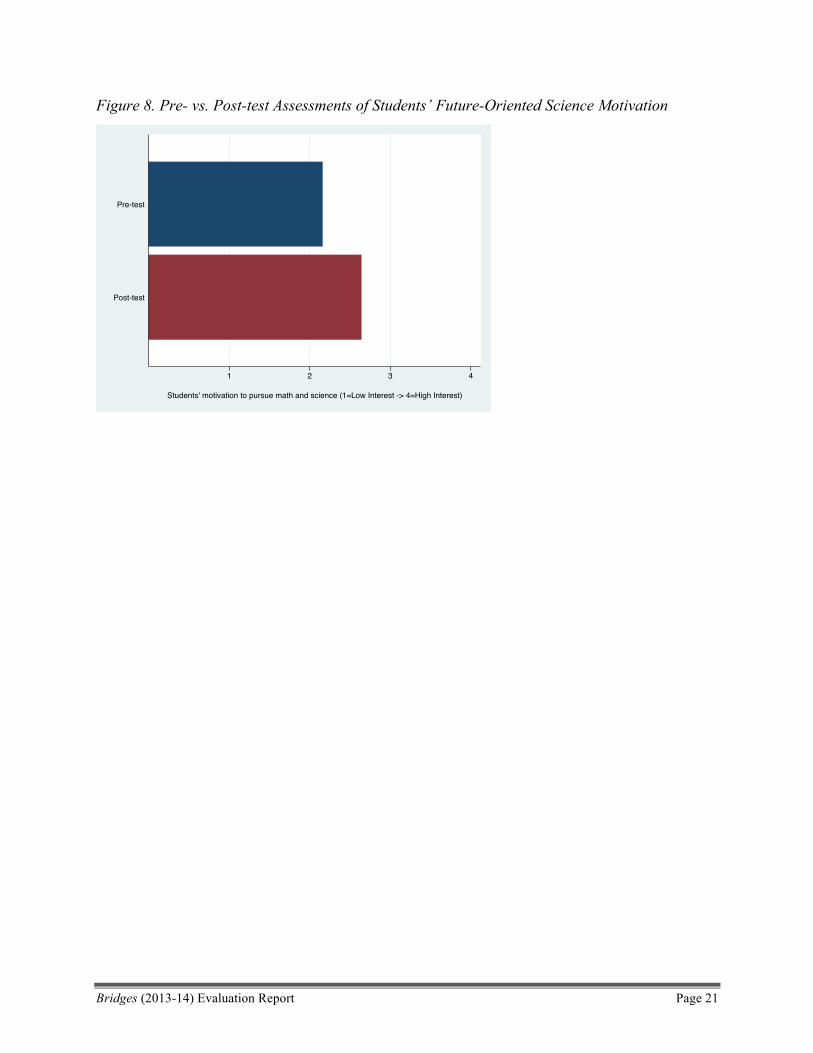
As seen in Table 18 below, Bridges participants demonstrated a significant increase in motivation to pursue educational and career choices in math and science. A paired-samples t-test was conducted to compare students’ future-oriented motivation to pursue math and science as measured at the beginning and completion of the Bridges program. There was a significant improvement in pre-test (M=2.21, SD=0.86) vs. post-test (M=2.70, SD=0.84) conditions (Mdifference=0.49, SD=0.82); t (81)=5.41, p < .001.
Table 18. Pre- vs. Post-test Assessments of Students’ Future-Oriented Science Motivation
Science Motivation Mean (range 1-4) Pre-test Score 2.21 Post-test Score 2.70 Change + 0.49# # Statistically significant change from baseline to follow-up (p<.001)
1 2 3 4
Students' math and science self-efficacy (1=Low Confidence -> 4=High Confidence)
Post-test
Pre-test
Bridges (2013-14) Evaluation Report Page 21
Figure 8. Pre- vs. Post-test Assessments of Students’ Future-Oriented Science Motivation
1 2 3 4
Students' motivation to pursue math and science (1=Low Interest -> 4=High Interest)
Post-test
Pre-test
Bridges (2013-14) Evaluation Report Page 22
References Basu, S. J., & Barton, A. C. (2007). Developing a sustained interest in science among urban
minority youth. Journal of Research in Science Teaching, 44 (3), 466-489.
Bouillion, L. M., & Gomez, L. M. (2001). Connecting school and community with science learning: Real world problems and school-community partnerships as contextual scaffolds. Journal of Research in Science Teaching, 38 (8), 878-898.
Hamre, B.K., Pianta, R.C., Mashburn, A.J., & Downer, J.T. (2007). Building a science of classrooms: Application of the CLASS framework in over 4,000 US early childhood and elementary classrooms. Charlottesville, VA: University of Virginia, Center for Advanced Study of Teaching and Learning.
Marx, R. W., Blumenfeld, P. C., Krajcik, J. S., Fishman, B., Soloway, E., Geier, R., et al. (2004). Inquiry-based science in the middle grades: Assessment of learning in urban systemic reform. Journal of Research in Science Teaching, 41 (10), 1063-1080.
Organization for Economic Cooperation and Development (OECD). (2001). Knowledge and Skills for Life: First Results from the OECD Programme for International Student Assessment (PISA), 2000. Paris: OECD.
Pechman, E.M., Mielke, M.B., Russell, C.A., White, R.N., & Cooc, N. (2008). Out-of-School Time (OST) Observation Instrument: Report of the validation study. Washington, DC: Policy Studies Associates.
Schmieder, A. A., & Michael-Dyer, G. (1991). State of the scene of science education in the nation. Public Health Service National Conference.
U.S. Department of Education. (1991). America 2000: An education strategy (Tech. Rep.). Washington, DC: U.S. Department of Education.
Appendix A: Bridges Participant Assessment
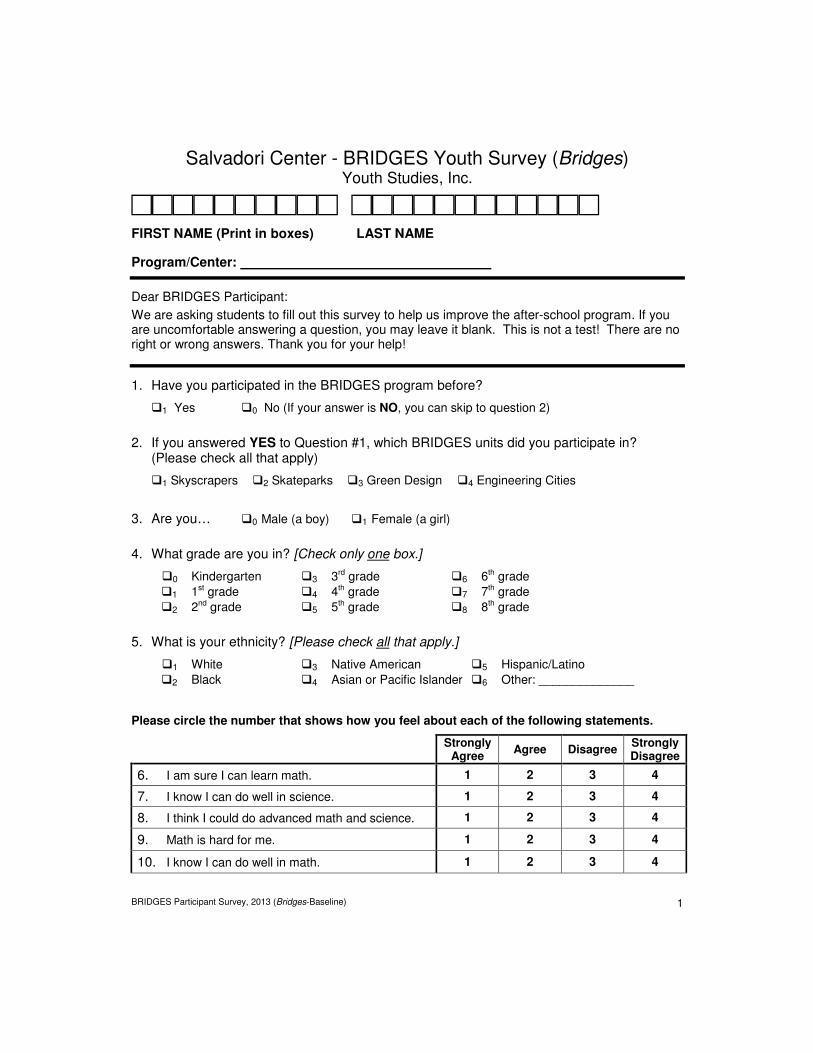
BRIDGES Participant Survey, 2013 (Bridges-Baseline) 1
Salvadori Center - BRIDGES Youth Survey (Bridges)
Youth Studies, Inc.
□□□□□□□□□□ □□□□□□□□□□□□ FIRST NAME (Print in boxes) LAST NAME
Program/Center:
Dear BRIDGES Participant:
We are asking students to fill out this survey to help us improve the after-school program. If you are uncomfortable answering a question, you may leave it blank. This is not a test! There are no right or wrong answers. Thank you for your help!
1. Have you participated in the BRIDGES program before?
!1 Yes !0 No (If your answer is NO, you can skip to question 2)
2. If you answered YES to Question #1, which BRIDGES units did you participate in? (Please check all that apply)
!1 Skyscrapers !2 Skateparks !3 Green Design !4 Engineering Cities
3. Are you… !0 Male (a boy) !1 Female (a girl)
4. What grade are you in? [Check only one box.]
!0 Kindergarten !3 3rd grade !6 6th grade !1 1st grade !4 4th grade !7 7th grade !2 2nd grade !5 5th grade !8 8th grade
5. What is your ethnicity? [Please check all that apply.]
!1 White !3 Native American !5 Hispanic/Latino !2 Black !4 Asian or Pacific Islander !6 Other: ______________
Please circle the number that shows how you feel about each of the following statements.
Strongly Agree
Agree Disagree Strongly Disagree
6. I am sure I can learn math. 1 2 3 4
7. I know I can do well in science. 1 2 3 4
8. I think I could do advanced math and science. 1 2 3 4
9. Math is hard for me. 1 2 3 4
10. I know I can do well in math. 1 2 3 4
25
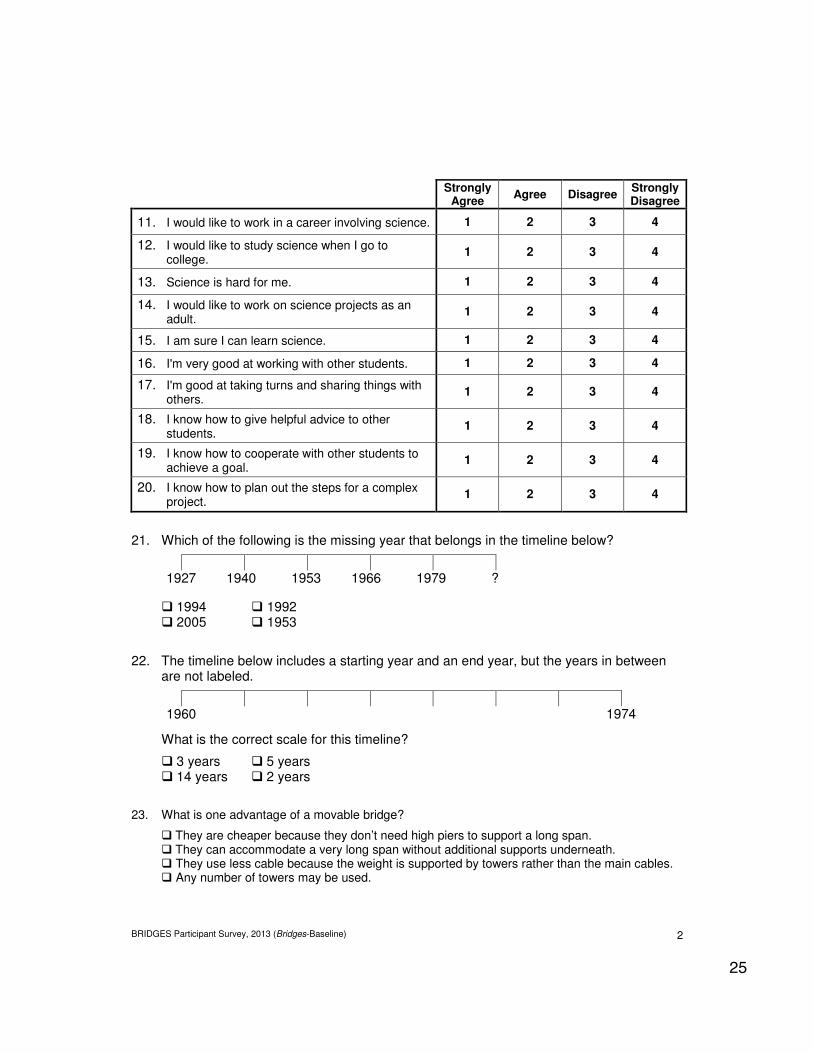
BRIDGES Participant Survey, 2013 (Bridges-Baseline) 2
Strongly Agree
Agree Disagree Strongly Disagree
11. I would like to work in a career involving science. 1 2 3 4
12. I would like to study science when I go to college.
1 2 3 4
13. Science is hard for me. 1 2 3 4
14. I would like to work on science projects as an adult.
1 2 3 4
15. I am sure I can learn science. 1 2 3 4
16. I'm very good at working with other students. 1 2 3 4
17. I'm good at taking turns and sharing things with others.
1 2 3 4
18. I know how to give helpful advice to other students.
1 2 3 4
19. I know how to cooperate with other students to achieve a goal.
1 2 3 4
20. I know how to plan out the steps for a complex project.
1 2 3 4
21. Which of the following is the missing year that belongs in the timeline below?
1927 1940 1953 1966 1979 ?
! 1994 ! 1992 ! 2005 ! 1953
22. The timeline below includes a starting year and an end year, but the years in between are not labeled.
1960 1974
What is the correct scale for this timeline?
! 3 years ! 5 years ! 14 years ! 2 years
23. What is one advantage of a movable bridge?
! They are cheaper because they don’t need high piers to support a long span. ! They can accommodate a very long span without additional supports underneath. ! They use less cable because the weight is supported by towers rather than the main cables. ! Any number of towers may be used.
26
BRIDGES Participant Survey, 2013 (Bridges-Baseline) 3
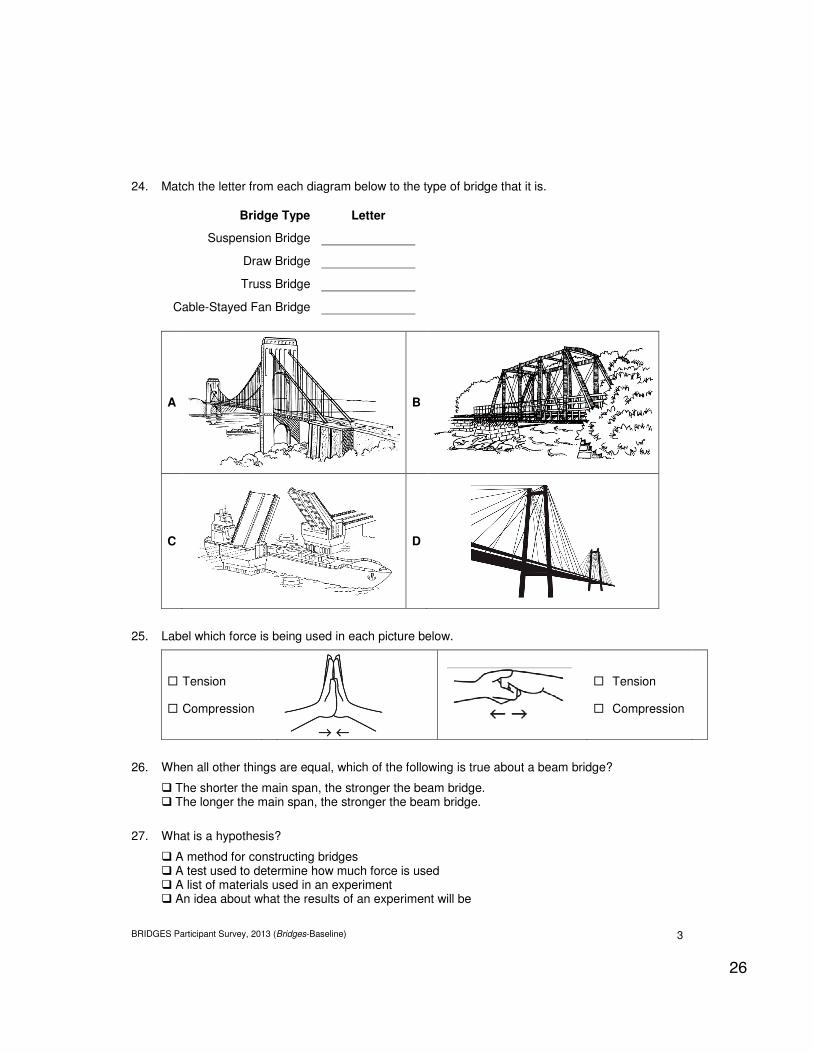
24. Match the letter from each diagram below to the type of bridge that it is.
Bridge Type Letter
Suspension Bridge
Draw Bridge
Truss Bridge
Cable-Stayed Fan Bridge
A
B
C
D
25. Label which force is being used in each picture below.
! Tension
! Compression
! Tension
! Compression
26. When all other things are equal, which of the following is true about a beam bridge?
" The shorter the main span, the stronger the beam bridge. " The longer the main span, the stronger the beam bridge.
27. What is a hypothesis?
" A method for constructing bridges " A test used to determine how much force is used " A list of materials used in an experiment " An idea about what the results of an experiment will be
27
BRIDGES Participant Survey, 2013 (Bridges-Baseline) 4
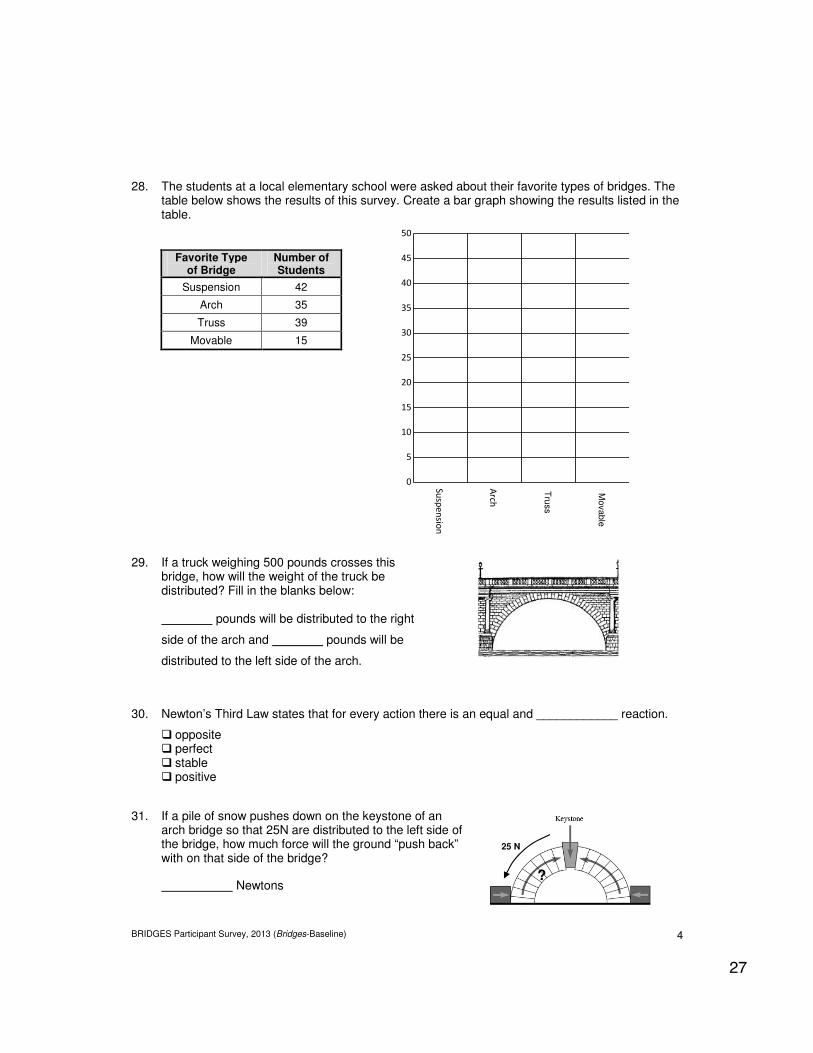
28. The students at a local elementary school were asked about their favorite types of bridges. The table below shows the results of this survey. Create a bar graph showing the results listed in the table.
Favorite Type of Bridge
Number of Students
Suspension 42
Arch 35
Truss 39
Movable 15
Cantilever
Arch
Trestle
20
15
10
5
0 Suspension
50
45
40
35
30
25
29. If a truck weighing 500 pounds crosses this
bridge, how will the weight of the truck be distributed? Fill in the blanks below:
pounds will be distributed to the right
side of the arch and pounds will be
distributed to the left side of the arch.
30. Newton’s Third Law states that for every action there is an equal and ____________ reaction.
! opposite ! perfect ! stable ! positive
31. If a pile of snow pushes down on the keystone of an arch bridge so that 25N are distributed to the left side of the bridge, how much force will the ground “push back” with on that side of the bridge?
Newtons
Tru
ss
Mova
ble
25 N
?
28
BRIDGES Participant Survey, 2013 (Bridges-Baseline) 5
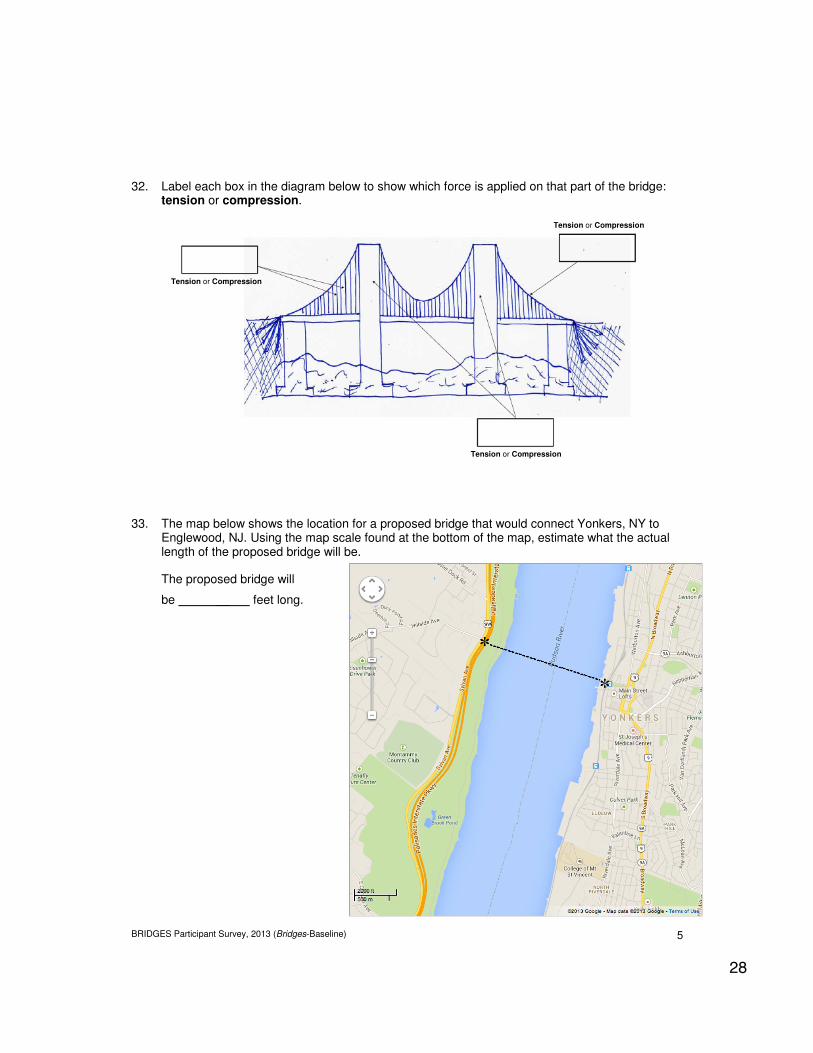
32. Label each box in the diagram below to show which force is applied on that part of the bridge: tension or compression.
33. The map below shows the location for a proposed bridge that would connect Yonkers, NY to
Englewood, NJ. Using the map scale found at the bottom of the map, estimate what the actual length of the proposed bridge will be.
The proposed bridge will
be __ feet long.
Tension or Compression
Tension or Compression
Tension or Compression
29
BRIDGES Participant Survey, 2013 (Bridges-Baseline) 6
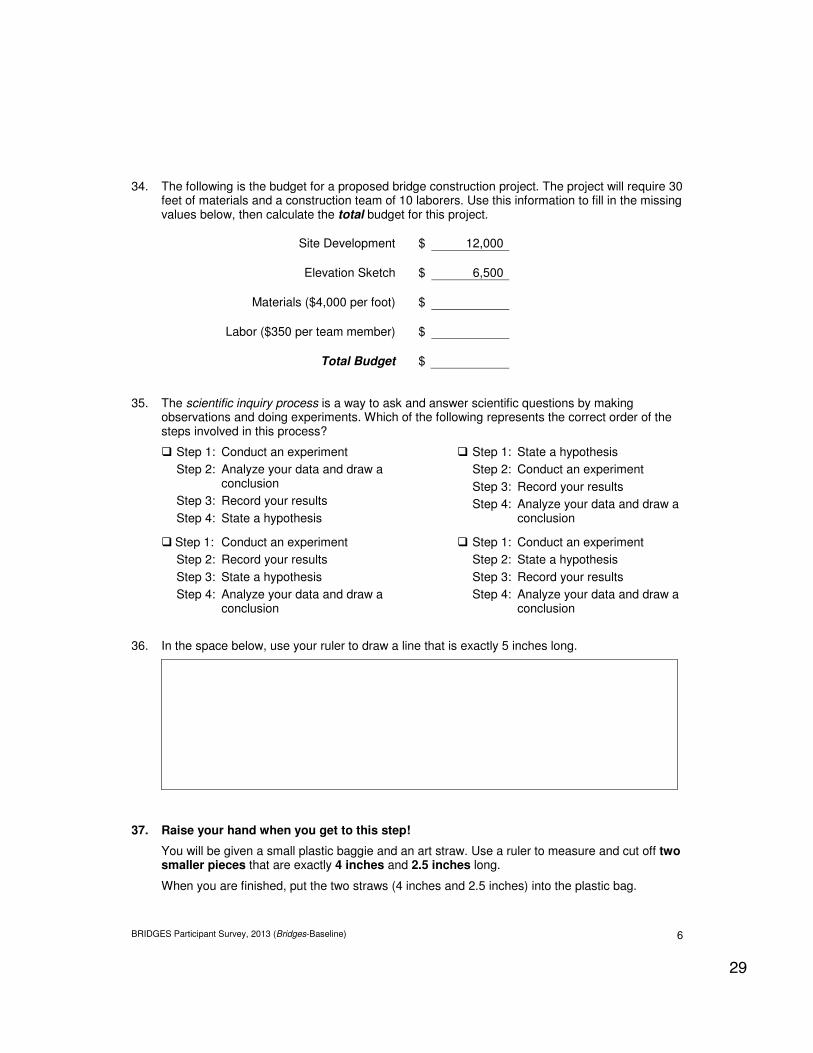
34. The following is the budget for a proposed bridge construction project. The project will require 30 feet of materials and a construction team of 10 laborers. Use this information to fill in the missing values below, then calculate the total budget for this project.
Site Development $ 12,000
Elevation Sketch $ 6,500
Materials ($4,000 per foot) $
Labor ($350 per team member) $
Total Budget $
35. The scientific inquiry process is a way to ask and answer scientific questions by making observations and doing experiments. Which of the following represents the correct order of the steps involved in this process?
! Step 1: Conduct an experiment
Step 2: Analyze your data and draw a conclusion
Step 3: Record your results
Step 4: State a hypothesis
! Step 1: Conduct an experiment
Step 2: Record your results
Step 3: State a hypothesis
Step 4: Analyze your data and draw a conclusion
! Step 1: State a hypothesis
Step 2: Conduct an experiment
Step 3: Record your results
Step 4: Analyze your data and draw a conclusion
! Step 1: Conduct an experiment
Step 2: State a hypothesis
Step 3: Record your results
Step 4: Analyze your data and draw a conclusion
36. In the space below, use your ruler to draw a line that is exactly 5 inches long.
37. Raise your hand when you get to this step!
You will be given a small plastic baggie and an art straw. Use a ruler to measure and cut off two smaller pieces that are exactly 4 inches and 2.5 inches long.
When you are finished, put the two straws (4 inches and 2.5 inches) into the plastic bag.