Embed Size (px)
Citation preview
New York State Energy Research and Development Authority
Final Report August 2012
Proof-of-Concept for Co-Digestion of Food Waste, Fats, Oil and Grease, and Wastewater Sludge Cake to Create Renewable EnergyPilot-scale Demonstration of Spectrum BioEnergy’s BioBeetle Biogas System at Albany County Sewer District’s South Wastewater Treatment Plant
No. 12-22
NYSERDA’s Promise to New Yorkers:New Yorkers can count on NYSERDA for objective, reliable, energy-related solutions delivered by accessible, dedicated professionals.
OurMission: Advance innovative energy solutions in ways that improve New York’s economy and environment.
OurVision: Serve as a catalyst—advancing energy innovation and technology, transforming New York’s economy, and empowering people to choose clean and efficient energy as part of their everyday lives.
OurCoreValues: Objectivity, integrity, public service, and innovation.
Our PortfoliosNYSERDA programs are organized into five portfolios, each representing a complementary group of offerings with common areas of energy-related focus and objectives.
Energy Efficiency & Renewable Programs Helping New York to achieve its aggressive clean energy goals –
including programs for consumers (commercial, municipal, institutional, industrial, residential, and transportation), renewable power suppliers, and programs designed to support market transformation.
Energy Technology Innovation & Business Development
Helping to stimulate a vibrant innovation ecosystem and a clean energy economy in New York – including programs to support product research, development, and demonstrations, clean-energy business development, and the knowledge-based community at the Saratoga Technology + Energy Park®.
Energy Education and Workforce Development
Helping to build a generation of New Yorkers ready to lead and work in a clean energy economy – including consumer behavior, youth education, and workforce development and training programs for existing and emerging technologies.
Energy and the Environment
Helping to assess and mitigate the environmental impacts of energy production and use – including environmental research and development, regional initiatives to improve environmental sustainability, and West Valley Site Management.
Energy Data, Planning and Policy
Helping to ensure that policy-makers and consumers have objective and reliable information to make informed energy decisions – including State Energy Planning, policy analysis to support the Regional Greenhouse Gas Initiative, and other energy initiatives; and a range of energy data reporting including Patterns and Trends.
Proof-of-ConCePt for Co-Digestion of fooD Waste, fats, oil anD grease, anD WasteWater sluDge
Cake to Create reneWable energy
Pilot-sCale Demonstration of sPeCtrum bioenergy’s biobeetle biogas
system at albany County seWer DistriCt’s south WasteWater treatment Plant
Final ReportPrepared for the
neW york state energy researCh anD
DeveloPment authority
Albany, NY nyserda.ny.gov
Kathleen O’Connor, P.E.Senior Project Manager
Prepared by:
sPeCtrum bioenergy
Brooklyn, NY
Suma Reddy Project Manager
NYSERDA NYSERDA 23143 August 2012Report 12-22
2
NOTICE This report was prepared by Spectrum BioEnergy in the course of performing work contracted for
and sponsored by the New York State Energy Research and Development Authority and the Albany
County Sewer District (hereafter the “Sponsors”). The opinions expressed in this report do not
necessarily reflect those of the Sponsors or the State of New York, and reference to any specific
product, service, process, or method does not constitute an implied or expressed recommendation or
endorsement of it. Further, the Sponsors and the State of New York make no warranties or
representations, expressed or implied, as to the fitness for particular purpose or merchantability of
any product, apparatus, or service, or the usefulness, completeness, or accuracy of any processes,
methods, or other information contained, described, disclosed, or referred to in this report. The
Sponsors, the State of New York, and the contractor make no representation that the use of any
product, apparatus, process, method or other information will not infringe privately owned rights
and will assume no liability for any loss, injury, or damage resulting from, or occurring in connection
with, the use of information contained, described, disclosed, or referred to in this report.
3
ACKNOWLEDGMENTS
We would like to express our utmost gratitude to our sponsors, the New York State Energy &
Research Development Authority and the Albany County Sewer District, for their unwavering
support and tireless assistance as we pursued this project. In addition, we would like to
acknowledge our partners: Baker Commodities, Bimbo Bakery, the City of Watervliet, and Price
Chopper Supermarkets, and thank them for their help and generosity.
4
ABSTRACT
Keywords: anaerobic digestion, BioBeetle System, biogas, biosolids, renewable energy, sludge cake,
waste management, wastewater treatment
Anaerobic digestion (AD) is a series of processes in which microorganisms break down organic
wastes from municipal, industrial, agricultural, and/or other applications in the absence of oxygen.
The resulting products are biogas, which can be used as a renewable source of energy, and a
nutrient-rich digestate that may be used as a fertilizer.
In this project, Spectrum BioEnergy (SBE) evaluated the potential of using anaerobic digestion as
part of a low-cost, integrated waste management solution for municipal and other waste streams. A
variety of organic wastes were co-digested in SBE’s BioBeetle Biogas System, including sludge cake
from the municipal wastewater treatment facility, as well as produce, household food waste, bakery,
and fats, oils, and grease (FOG). The demonstration occurred at Albany County Sewer District’s
South Wastewater Treatment Plant.
The system was operated for more than ten weeks, during which time the feedstock composition was
altered on a weekly basis. Biogas yields were up to five times greater when high-energy waste
streams (bakery waste and FOG) were co-digested with sludge cake, as compared to digesting sludge
cake as the sole feedstock.
A preliminary analysis of the cost savings associated with integrated AD was performed.
Additionally, SBE outlined the steps required to achieve categorization of the digestate as Class A
Biosolids, which would allow for unrestricted use as a home, lawn, and/or garden fertilizer. Upon
conclusion of the demonstration it was determined that anaerobic digestion has the potential to be
integrated in to a municipality’s conventional waste management process, while providing
environmental and other benefits that reduce the overall costs of the waste management process.
5
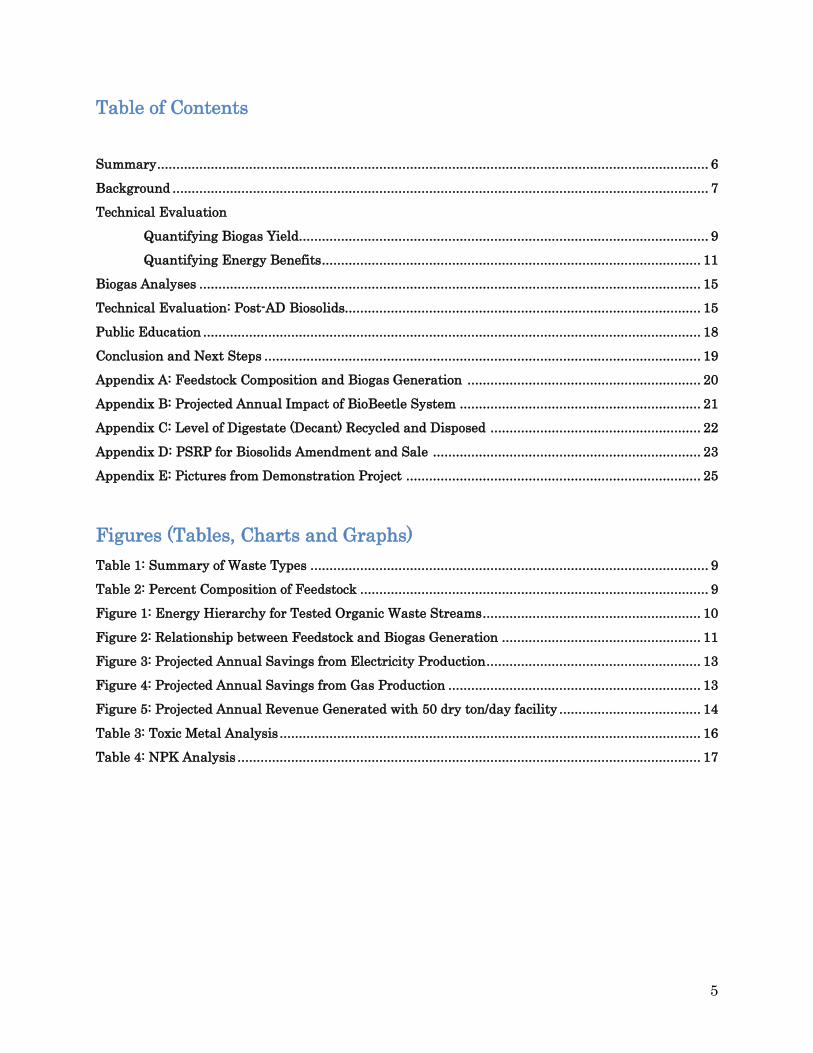
Table of Contents
Summary ................................................................................................................................................ 6
Background ............................................................................................................................................ 7
Technical Evaluation
Quantifying Biogas Yield........................................................................................................... 9
Quantifying Energy Benefits ................................................................................................... 11
Biogas Analyses ................................................................................................................................... 15
Technical Evaluation: Post-AD Biosolids............................................................................................. 15
Public Education .................................................................................................................................. 18
Conclusion and Next Steps .................................................................................................................. 19
Appendix A: Feedstock Composition and Biogas Generation ............................................................. 20
Appendix B: Projected Annual Impact of BioBeetle System ............................................................... 21
Appendix C: Level of Digestate (Decant) Recycled and Disposed ....................................................... 22
Appendix D: PSRP for Biosolids Amendment and Sale ...................................................................... 23
Appendix E: Pictures from Demonstration Project ............................................................................. 25
Figures (Tables, Charts and Graphs) Table 1: Summary of Waste Types ........................................................................................................ 9
Table 2: Percent Composition of Feedstock ........................................................................................... 9
Figure 1: Energy Hierarchy for Tested Organic Waste Streams ......................................................... 10
Figure 2: Relationship between Feedstock and Biogas Generation .................................................... 11
Figure 3: Projected Annual Savings from Electricity Production ........................................................ 13
Figure 4: Projected Annual Savings from Gas Production .................................................................. 13
Figure 5: Projected Annual Revenue Generated with 50 dry ton/day facility ..................................... 14
Table 3: Toxic Metal Analysis .............................................................................................................. 16
Table 4: NPK Analysis ......................................................................................................................... 17
6
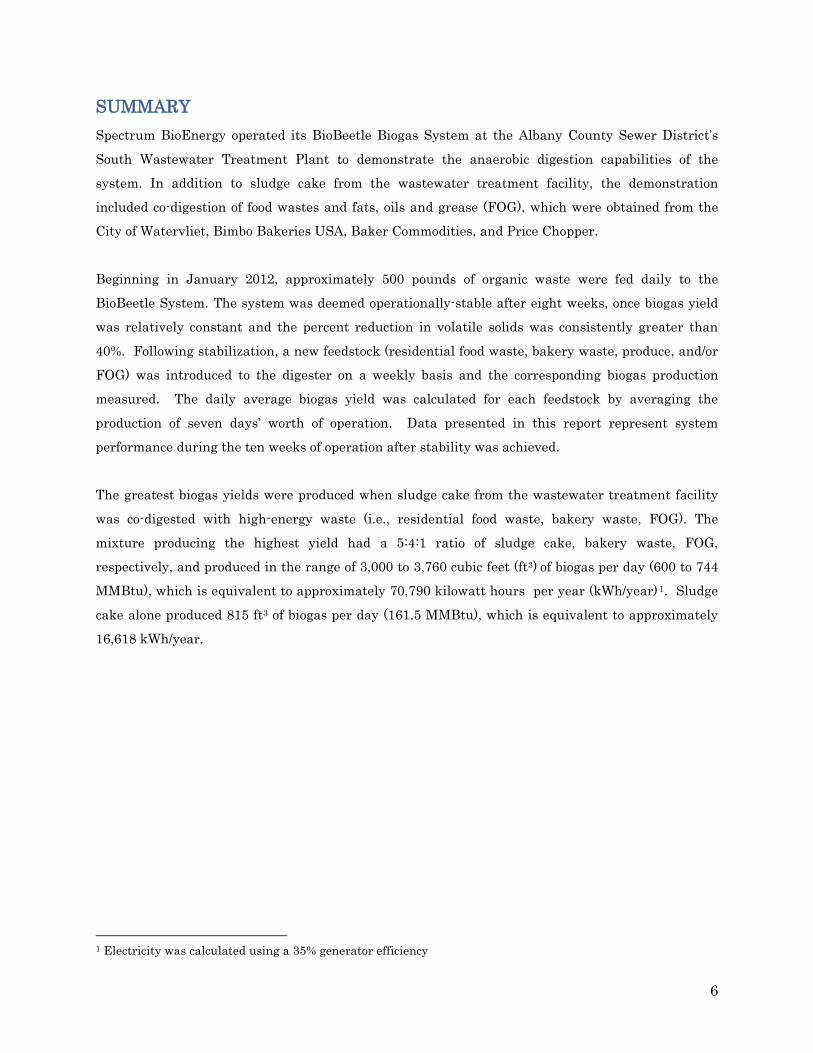
SUMMARY Spectrum BioEnergy operated its BioBeetle Biogas System at the Albany County Sewer District’s
South Wastewater Treatment Plant to demonstrate the anaerobic digestion capabilities of the
system. In addition to sludge cake from the wastewater treatment facility, the demonstration
included co-digestion of food wastes and fats, oils and grease (FOG), which were obtained from the
City of Watervliet, Bimbo Bakeries USA, Baker Commodities, and Price Chopper.
Beginning in January 2012, approximately 500 pounds of organic waste were fed daily to the
BioBeetle System. The system was deemed operationally-stable after eight weeks, once biogas yield
was relatively constant and the percent reduction in volatile solids was consistently greater than
40%. Following stabilization, a new feedstock (residential food waste, bakery waste, produce, and/or
FOG) was introduced to the digester on a weekly basis and the corresponding biogas production
measured. The daily average biogas yield was calculated for each feedstock by averaging the
production of seven days’ worth of operation. Data presented in this report represent system
performance during the ten weeks of operation after stability was achieved.
The greatest biogas yields were produced when sludge cake from the wastewater treatment facility
was co-digested with high-energy waste (i.e., residential food waste, bakery waste, FOG). The
mixture producing the highest yield had a 5:4:1 ratio of sludge cake, bakery waste, FOG,
respectively, and produced in the range of 3,000 to 3,760 cubic feet (ft3) of biogas per day (600 to 744
MMBtu), which is equivalent to approximately 70,790 kilowatt hours per year (kWh/year)1. Sludge
cake alone produced 815 ft3
of biogas per day (161.5 MMBtu), which is equivalent to approximately
16,618 kWh/year.
1 Electricity was calculated using a 35% generator efficiency
7
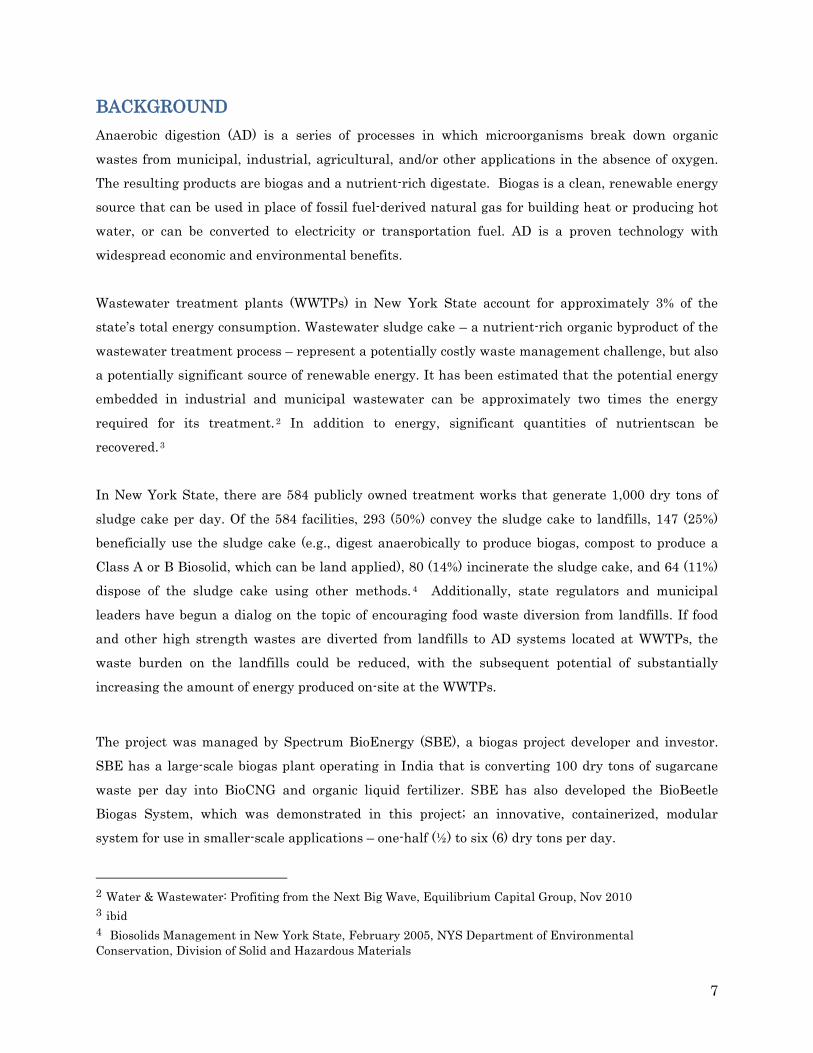
BACKGROUND Anaerobic digestion (AD) is a series of processes in which microorganisms break down organic
wastes from municipal, industrial, agricultural, and/or other applications in the absence of oxygen.
The resulting products are biogas and a nutrient-rich digestate. Biogas is a clean, renewable energy
source that can be used in place of fossil fuel-derived natural gas for building heat or producing hot
water, or can be converted to electricity or transportation fuel. AD is a proven technology with
widespread economic and environmental benefits.
Wastewater treatment plants (WWTPs) in New York State account for approximately 3% of the
state’s total energy consumption. Wastewater sludge cake – a nutrient-rich organic byproduct of the
wastewater treatment process – represent a potentially costly waste management challenge, but also
a potentially significant source of renewable energy. It has been estimated that the potential energy
embedded in industrial and municipal wastewater can be approximately two times the energy
required for its treatment.2 In addition to energy, significant quantities of nutrientscan be
recovered.3
In New York State, there are 584 publicly owned treatment works that generate 1,000 dry tons of
sludge cake per day. Of the 584 facilities, 293 (50%) convey the sludge cake to landfills, 147 (25%)
beneficially use the sludge cake (e.g., digest anaerobically to produce biogas, compost to produce a
Class A or B Biosolid, which can be land applied), 80 (14%) incinerate the sludge cake, and 64 (11%)
dispose of the sludge cake using other methods. 4
Additionally, state regulators and municipal
leaders have begun a dialog on the topic of encouraging food waste diversion from landfills. If food
and other high strength wastes are diverted from landfills to AD systems located at WWTPs, the
waste burden on the landfills could be reduced, with the subsequent potential of substantially
increasing the amount of energy produced on-site at the WWTPs.
The project was managed by Spectrum BioEnergy (SBE), a biogas project developer and investor.
SBE has a large-scale biogas plant operating in India that is converting 100 dry tons of sugarcane
waste per day into BioCNG and organic liquid fertilizer. SBE has also developed the BioBeetle
Biogas System, which was demonstrated in this project; an innovative, containerized, modular
system for use in smaller-scale applications – one-half (½) to six (6) dry tons per day.
2 Water & Wastewater: Profiting from the Next Big Wave, Equilibrium Capital Group, Nov 2010 3 ibid 4 Biosolids Management in New York State, February 2005, NYS Department of Environmental Conservation, Division of Solid and Hazardous Materials
8
This project also included multiple partners, as follows:
• The Albany County Sewer District (ACSD): The ASCD has provided wastewater services
since 1974. In 2011, the District treated an average of 51.5 million gallons of wastewater per
day. All sludge cake generated by the ASCD are incinerated the at County’s South and
North wastewater treatment plants. Additionally, the District collects sludge cake from
several smaller communities, which is also incinerated at the North plant.
• The City of Watervliet: Under the direction of Mayor Mike Manning, the City is a leader in
promoting green initiatives. In 2012, the City initiated the Watervliet Organic Waste
("WOW”) program, with the goal of diverting residential organic waste from landfills.
• Bimbo Bakeries USA: Bimbo Bakeries USAs originated in 1994 when, Grupo Bimbo, its
parent company, purchased La Hacienda, a California tortilla company. Today, Bimbo
Bakeries USA operates 33 bakeries and employs more than 15,000 associates; it is the
nation’s largest baking company.
• Price Chopper: Price Chopper dates back to 1900. Today, the chain’s 128-store footprint
extends beyond New York and Massachusetts, into Vermont, Connecticut, Pennsylvania, and
New Hampshire.
• Baker Commodities Inc.: Baker Commodities is one of the nation’s leading providers of
rendering and grease removal services. Baker Commodities has more than 21 facilities
across the United States that convert animal by-products into commercial commodities such
as high-protein ingredients for poultry feed and pet food, and tallow, a valuable ingredient in
soaps, paints, cosmetics, and more.
9
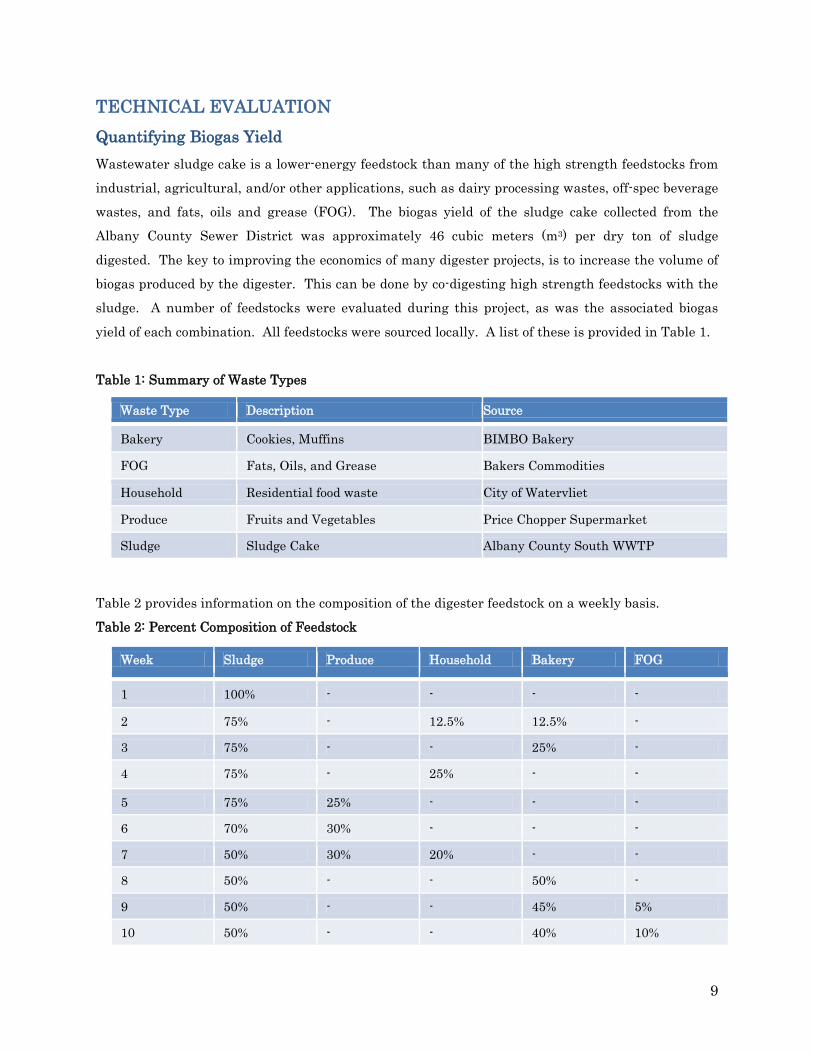
TECHNICAL EVALUATION Quantifying Biogas Yield Wastewater sludge cake is a lower-energy feedstock than many of the high strength feedstocks from
industrial, agricultural, and/or other applications, such as dairy processing wastes, off-spec beverage
wastes, and fats, oils and grease (FOG). The biogas yield of the sludge cake collected from the
Albany County Sewer District was approximately 46 cubic meters (m3) per dry ton of sludge
digested. The key to improving the economics of many digester projects, is to increase the volume of
biogas produced by the digester. This can be done by co-digesting high strength feedstocks with the
sludge. A number of feedstocks were evaluated during this project, as was the associated biogas
yield of each combination. All feedstocks were sourced locally. A list of these is provided in Table 1.
Table 1: Summary of Waste Types
Waste Type Description Source
Bakery Cookies, Muffins BIMBO Bakery
FOG Fats, Oils, and Grease Bakers Commodities
Household Residential food waste City of Watervliet
Produce Fruits and Vegetables Price Chopper Supermarket
Sludge Sludge Cake Albany County South WWTP
Table 2 provides information on the composition of the digester feedstock on a weekly basis.
Table 2: Percent Composition of Feedstock
Week
1
2
3
5
7
Sludge Produce
100% -
75% -
75% -
75% 25%
50% 30%
Household
-
12.5%
-
Bakery FOG
- -
12.5% -
25% -
- -
- -
4 75% - 25% - -
-
6 70% 30% - - -
20%
8 50% - - 50% -
9 50% - - 45% 5%
10 50% - - 40% 10%
10
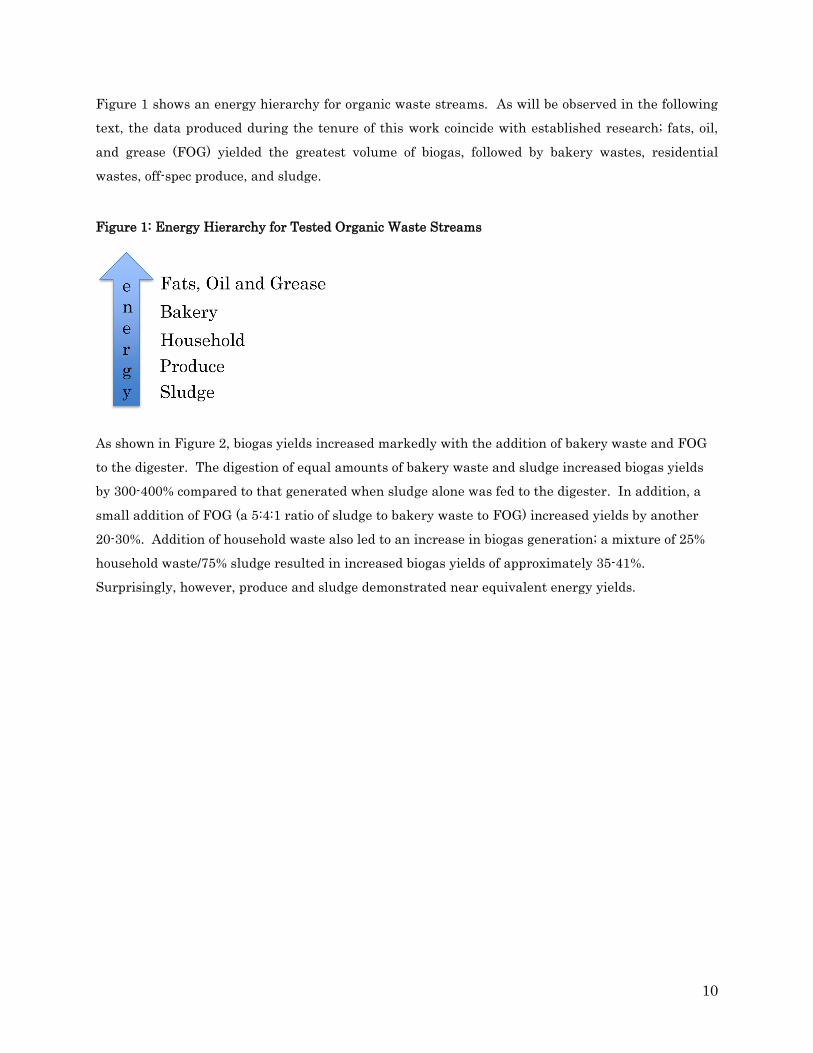
Figure 1 shows an energy hierarchy for organic waste streams. As will be observed in the following
text, the data produced during the tenure of this work coincide with established research; fats, oil,
and grease (FOG) yielded the greatest volume of biogas, followed by bakery wastes, residential
wastes, off-spec produce, and sludge.
Figure 1: Energy Hierarchy for Tested Organic Waste Streams
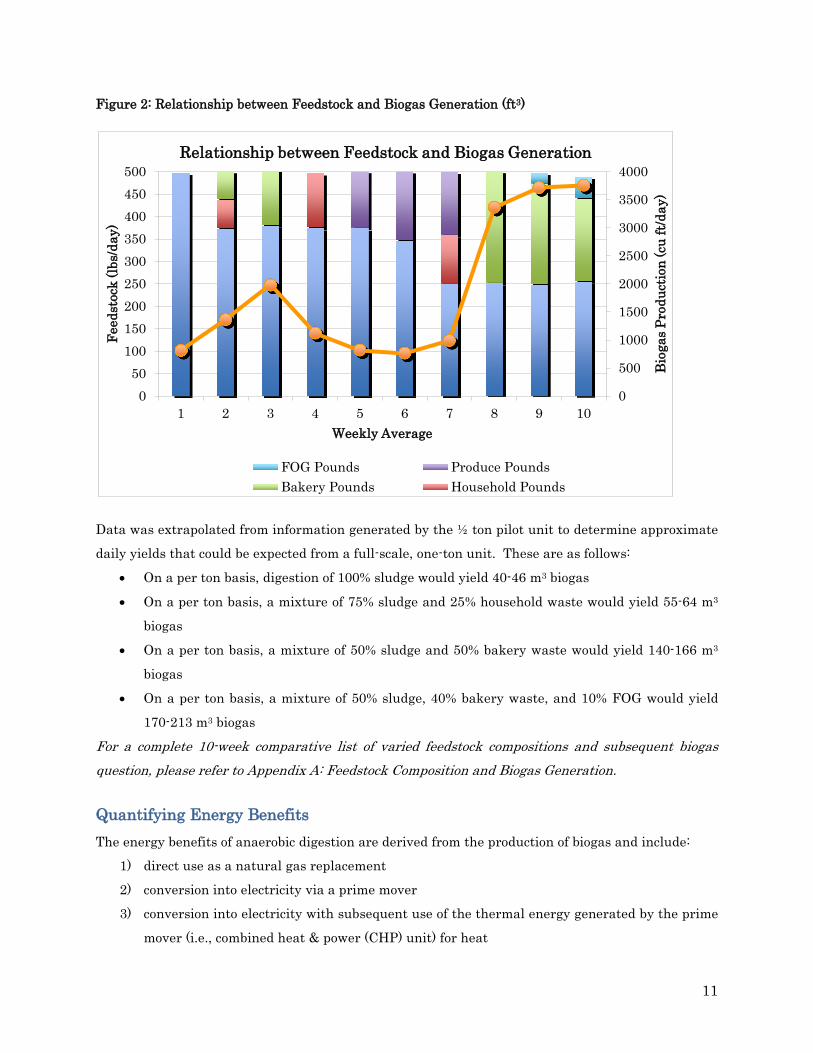
As shown in Figure 2, biogas yields increased markedly with the addition of bakery waste and FOG
to the digester. The digestion of equal amounts of bakery waste and sludge increased biogas yields
by 300-400% compared to that generated when sludge alone was fed to the digester. In addition, a
small addition of FOG (a 5:4:1 ratio of sludge to bakery waste to FOG) increased yields by another
20-30%. Addition of household waste also led to an increase in biogas generation; a mixture of 25%
household waste/75% sludge resulted in increased biogas yields of approximately 35-41%.
Surprisingly, however, produce and sludge demonstrated near equivalent energy yields.
11
Figure 2: Relationship between Feedstock and Biogas Generation (ft3
)
0
500
1000
1500
2000
2500
3000
3500
4000
0 50
100 150 200 250 300 350 400 450 500
1 2 3 4 5 6 7 8 9 10
Bio
gas P
rodu
ctio
n (c
u ft
/day
)
Feed
stoc
k (lb
s/da
y)
Weekly Average
Relationship between Feedstock and Biogas Generation
FOG Pounds Produce Pounds Bakery Pounds Household Pounds
Data was extrapolated from information generated by the ½ ton pilot unit to determine approximate
daily yields that could be expected from a full-scale, one-ton unit. These are as follows:
• On a per ton basis, digestion of 100% sludge would yield 40-46 m3
• On a per ton basis, a mixture of 75% sludge and 25% household waste would yield 55-64 m
biogas 3
• On a per ton basis, a mixture of 50% sludge and 50% bakery waste would yield 140-166 m
biogas 3
• On a per ton basis, a mixture of 50% sludge, 40% bakery waste, and 10% FOG would yield
170-213 m
biogas
3
For a complete 10-week comparative list of varied feedstock compositions and subsequent biogas question, please refer to Appendix A: Feedstock Composition and Biogas Generation.
biogas
Quantifying Energy Benefits The energy benefits of anaerobic digestion are derived from the production of biogas and include:
1) direct use as a natural gas replacement
2) conversion into electricity via a prime mover
3) conversion into electricity with subsequent use of the thermal energy generated by the prime
mover (i.e., combined heat & power (CHP) unit) for heat
12
4) upgrade to pipeline quality gas and inject into existing natural gas pipelines
5) compress into renewable transportation fuel.
Onsite use of the biogas-derived energy would enable a WWTP to reduce, or even eliminate, the need
to purchase electricity and fuel from off-site sources, potentially representing a significant reduction
in the cost of operations of the WWTP.
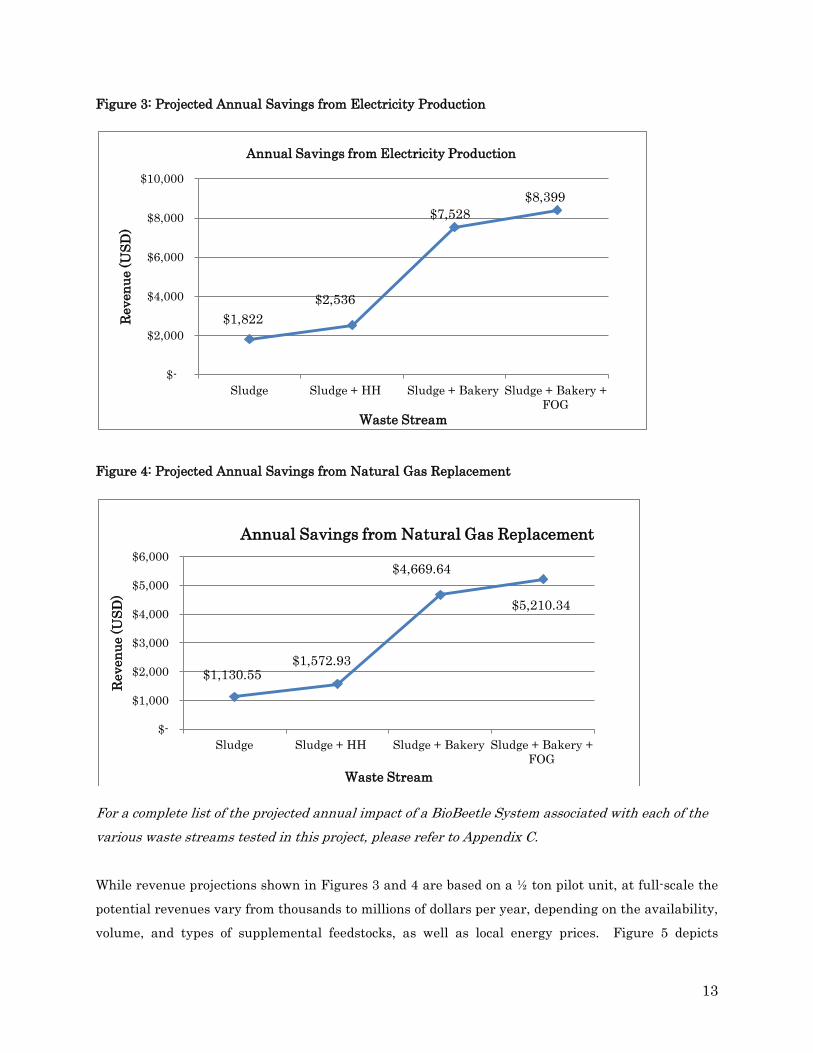
Figures 3 and 4 depict projected annual electricity and gas revenues from a ½ ton per day BioBeetle
unit. The projected revenues assume a natural gas cost of $7.00/MMBtu 5, an electricity cost of
$0.11/kWh6, 35% generator efficiency, and use of 10% of the generated biogas to maintain a system
temperature of approximately 35o
C. Costs associated with capital expenditures, financing,
operations and maintenance, and digestate management are not reflected in the projected revenues.
On the other hand, the potential revenues from tipping fees and Class A or B Biosolids sales are also
not reflected in the figures. The waste streams identified on the x-axis of the figures are defined as
follows:
• Sludge = 100% sludge
• Sludge + Household (HH) = a mixture of 75% sludge and 25% household waste
• Sludge + Bakery = a mixture of 50% sludge and 50% bakery waste
• Sludge + Bakery + FOG = a mixture of 50% sludge, 40% bakery waste, and 10% FOG
5 Negotiated gas rate for Albany County Sewer District for October 2012 – October 2014 6 Estimated electricity rate for Albany County Sewer District
13
Figure 3: Projected Annual Savings from Electricity Production
Figure 4: Projected Annual Savings from Natural Gas Replacement
For a complete list of the projected annual impact of a BioBeetle System associated with each of the various waste streams tested in this project, please refer to Appendix C.
While revenue projections shown in Figures 3 and 4 are based on a ½ ton pilot unit, at full-scale the
potential revenues vary from thousands to millions of dollars per year, depending on the availability,
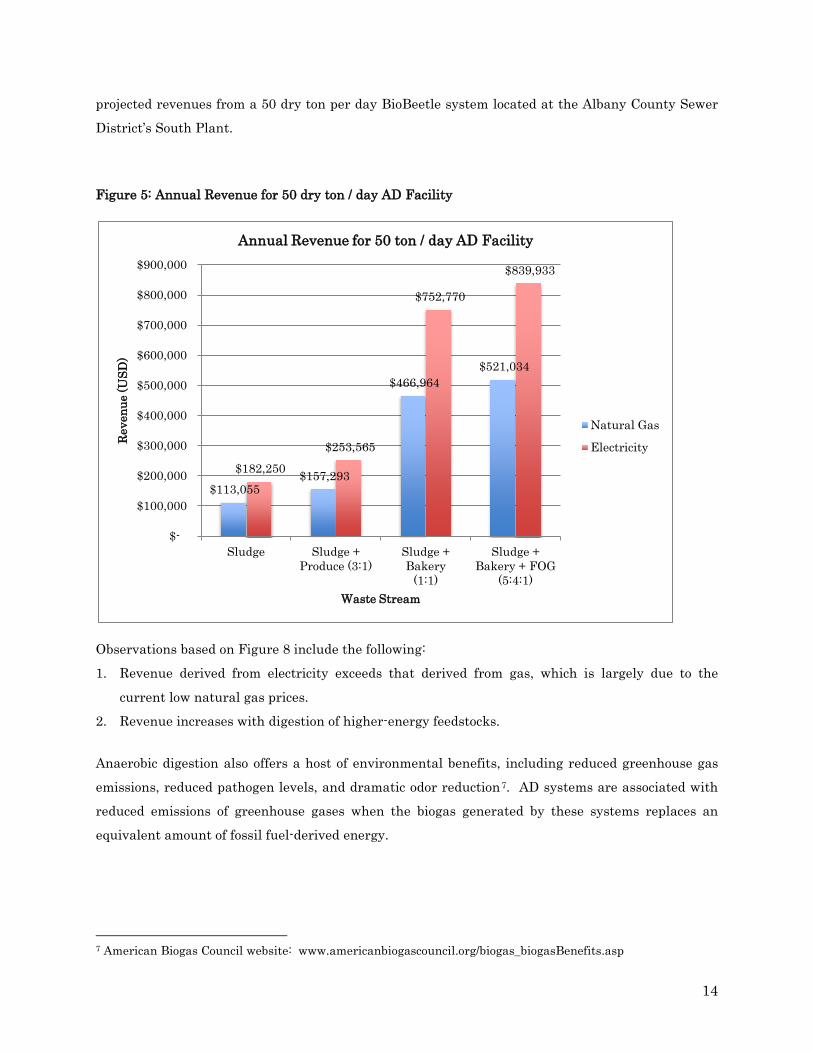
volume, and types of supplemental feedstocks, as well as local energy prices. Figure 5 depicts
$1,822 $2,536
$7,528 $8,399
$-
$2,000
$4,000
$6,000
$8,000
$10,000
Sludge Sludge + HH Sludge + Bakery Sludge + Bakery + FOG
Rev
enue
(USD
)
Waste Stream
Annual Savings from Electricity Production
$1,130.55 $1,572.93
$4,669.64
$5,210.34
$-
$1,000
$2,000
$3,000
$4,000
$5,000
$6,000
Sludge Sludge + HH Sludge + Bakery Sludge + Bakery + FOG
Rev
enue
(USD
)
Waste Stream
Annual Savings from Natural Gas Replacement
14
projected revenues from a 50 dry ton per day BioBeetle system located at the Albany County Sewer
District’s South Plant.
Figure 5: Annual Revenue for 50 dry ton / day AD Facility
$113,055 $157,293
$466,964 $521,034
$182,250 $253,565
$752,770
$839,933
$-
$100,000
$200,000
$300,000
$400,000
$500,000
$600,000
$700,000
$800,000
$900,000
Sludge Sludge + Produce (3:1)
Sludge + Bakery
(1:1)
Sludge + Bakery + FOG
(5:4:1)
Rev
enue
(USD
)
Waste Stream
Annual Revenue for 50 ton / day AD Facility
Natural Gas
Electricity
Observations based on Figure 8 include the following:
1. Revenue derived from electricity exceeds that derived from gas, which is largely due to the
current low natural gas prices.
2. Revenue increases with digestion of higher-energy feedstocks.
Anaerobic digestion also offers a host of environmental benefits, including reduced greenhouse gas
emissions, reduced pathogen levels, and dramatic odor reduction7
. AD systems are associated with
reduced emissions of greenhouse gases when the biogas generated by these systems replaces an
equivalent amount of fossil fuel-derived energy.
7 American Biogas Council website: www.americanbiogascouncil.org/biogas_biogasBenefits.asp
15
Biogas Analyses The average composition of the biogas produced by the BioBeetle unit during the project was
consistent with values from published literature, as follows:
• CH4: 59.7 +/- 0.52
• CO2: 37.9 +/- 0.40
• N2: 1.9 +/- 0.38 Hydrogen sulfide (H2S) analysis was also performed on the biogas. The concentration was 110,000
ppbV
, which was higher than expected, due to a non-working hydrogen sulfide removal system. This
could easily be remedied through replacement of the iron sponges in the system.
In a large-scale application the raw biogas would likely be treated (depending on the intended end-
use) via one-or-more of the following processes:
1) H2S removal
2) Moisture removal
3) Siloxane removal
4) Removal of CO2 , N2 and O2
Post-AD Biosolids Analyses During the course of the demonstration project, 40-60% of the post-AD biosolids (also referred to as
digestate) generated by the BioBeetle System were recirculated to the head of the WWTP; a daily
average of approximately 112 gallons. (Please refer to Appendix C for more information.) For a
larger-scale project, the post-AD biosolids would have to be disposed of in an alternate manner. In
order to land apply or compost the biosolids, rather than send them to a landfill, compliance with
EPA standards would be required. Therefore, post-AD biosolids samples from the BioBeetle System
were tested for heavy metals and pathogen concentration. Samples were also sent for NPK analysis.
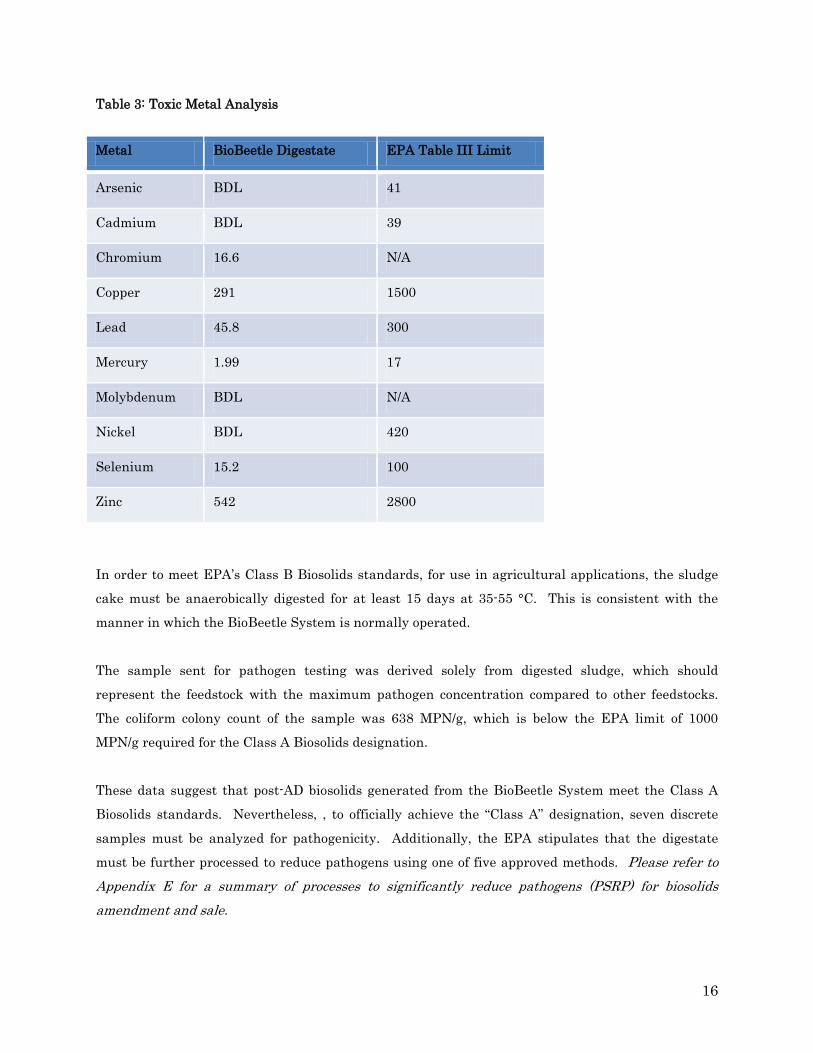
The results of the heavy metals analyses are presented in Table 3. All toxic metals were found to be
well below EPA’s Table III limit, which is their most stringent standard for a biosolid given a “Class
A” designation. A Class A Biosolid can be used in an unrestricted manner on lawns and in home
gardens. [Note: the tested samples were derived from co-digested sludge and bakery waste (at a 1 to
1 ratio).]
16
Table 3: Toxic Metal Analysis
Metal BioBeetle Digestate EPA Table III Limit
Arsenic BDL 41
Cadmium BDL 39
Chromium 16.6 N/A
Copper 291 1500
Lead 45.8 300
Mercury 1.99 17
Molybdenum BDL N/A
Nickel BDL 420
Selenium 15.2 100
Zinc 542 2800
In order to meet EPA’s Class B Biosolids standards, for use in agricultural applications, the sludge
cake must be anaerobically digested for at least 15 days at 35-55 °C. This is consistent with the
manner in which the BioBeetle System is normally operated.
The sample sent for pathogen testing was derived solely from digested sludge, which should
represent the feedstock with the maximum pathogen concentration compared to other feedstocks.
The coliform colony count of the sample was 638 MPN/g, which is below the EPA limit of 1000
MPN/g required for the Class A Biosolids designation.
These data suggest that post-AD biosolids generated from the BioBeetle System meet the Class A
Biosolids standards. Nevertheless, , to officially achieve the “Class A” designation, seven discrete
samples must be analyzed for pathogenicity. Additionally, the EPA stipulates that the digestate
must be further processed to reduce pathogens using one of five approved methods. Please refer to Appendix E for a summary of processes to significantly reduce pathogens (PSRP) for biosolids amendment and sale.
17
Therefore, for a full-scale, it would be necessary to further identify the steps and costs associated
with treating the post-AD biosolids to meet Class A Biosolids standards. It would also be necessary
to perform vector attraction reduction (VAR). It would then be possible to determine if achieving
Class A Biosolids standards is feasible and perhaps even profitable.
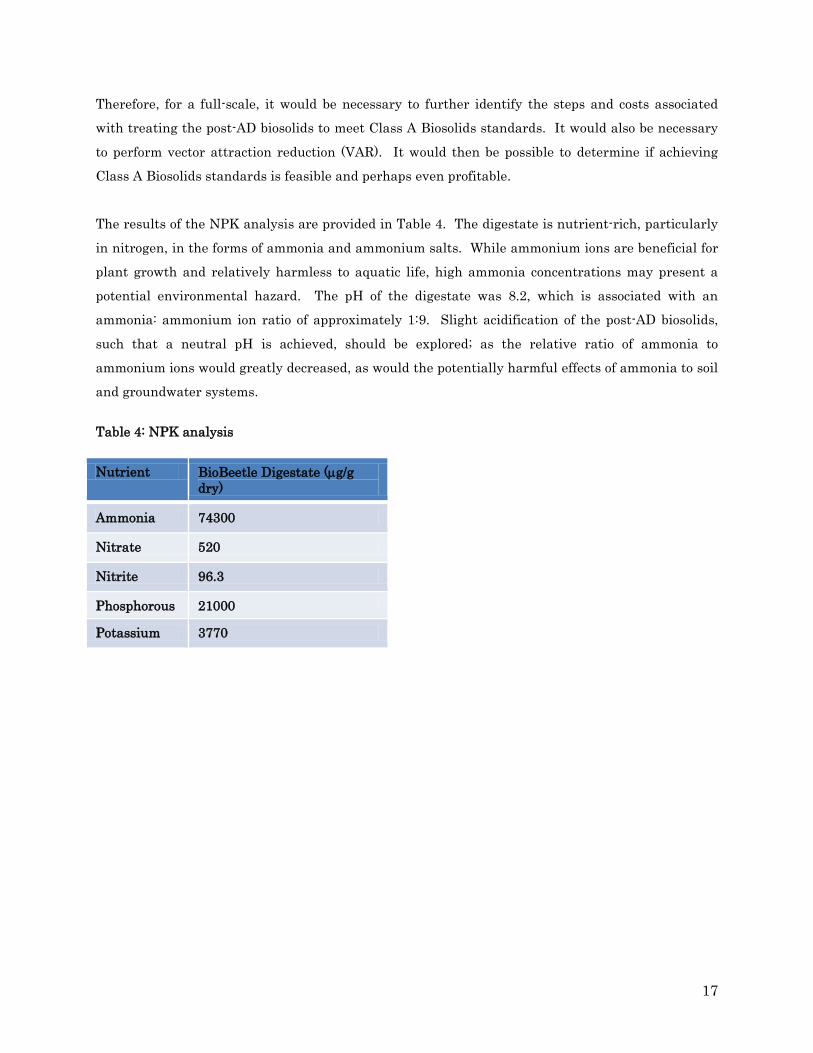
The results of the NPK analysis are provided in Table 4. The digestate is nutrient-rich, particularly
in nitrogen, in the forms of ammonia and ammonium salts. While ammonium ions are beneficial for
plant growth and relatively harmless to aquatic life, high ammonia concentrations may present a
potential environmental hazard. The pH of the digestate was 8.2, which is associated with an
ammonia: ammonium ion ratio of approximately 1:9. Slight acidification of the post-AD biosolids,
such that a neutral pH is achieved, should be explored; as the relative ratio of ammonia to
ammonium ions would greatly decreased, as would the potentially harmful effects of ammonia to soil
and groundwater systems.
Table 4: NPK analysis Nutrient BioBeetle Digestate (µg/g
dry)
Ammonia 74300
Nitrate 520
Nitrite 96.3
Phosphorous 21000
Potassium 3770
18
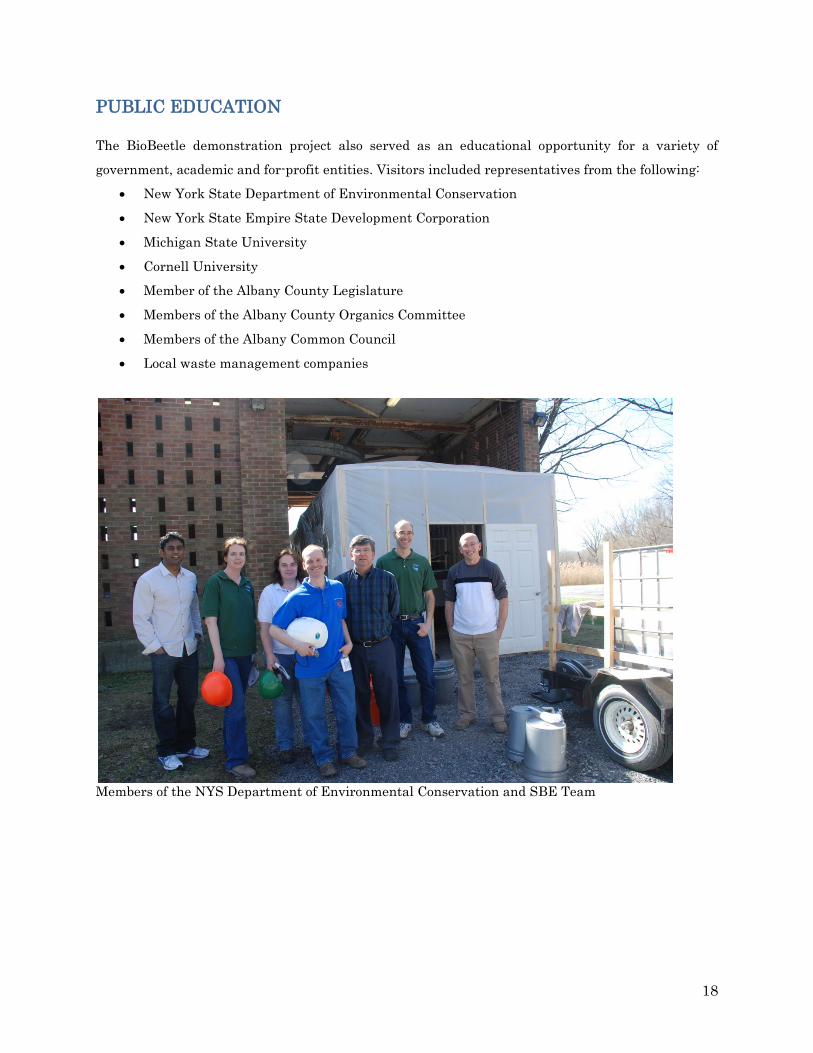
PUBLIC EDUCATION The BioBeetle demonstration project also served as an educational opportunity for a variety of
government, academic and for-profit entities. Visitors included representatives from the following:
• New York State Department of Environmental Conservation
• New York State Empire State Development Corporation
• Michigan State University
• Cornell University
• Member of the Albany County Legislature
• Members of the Albany County Organics Committee
• Members of the Albany Common Council
• Local waste management companies
Members of the NYS Department of Environmental Conservation and SBE Team
19
CONCLUSIONS The project successfully demonstrated the potential of using anaerobic digestion as part of a low-cost,
integrated waste management solution for municipal and other waste streams. The key conclusions
from the project are as follows:
1. It is technically feasible to co-digest a variety of organic wastes in the BioBeetle System
along with sludge cake from a municipal wastewater treatment facility. These included
produce-, household-, and bakery-waste, as well as fats, oils, and grease (FOG).
2. The co-digestion of food wastes and FOG with sludge cake resulted in up to a 5 time increase
in biogas yield. The waste streams with the highest energy potential were FOG and bakery
waste, followed by household waste, and, lastly, produce and sludge cake.
3. The co-digestion of food wastes and FOG with sludge cake resulted in up to a 5 time increase
in revenues generated by the system.
SBE’s ultimate goal is to develop a commercial-scale biogas plant at a wastewater treatment plant
that is capable of co-digest sludge cake and regionally-derived organic waste. To this end, SBE plans
to perform an analysis to gauge the technical, logistic, and economic feasibility of developing such a
project at the Albany County Sewer District’s South WWTP.
20
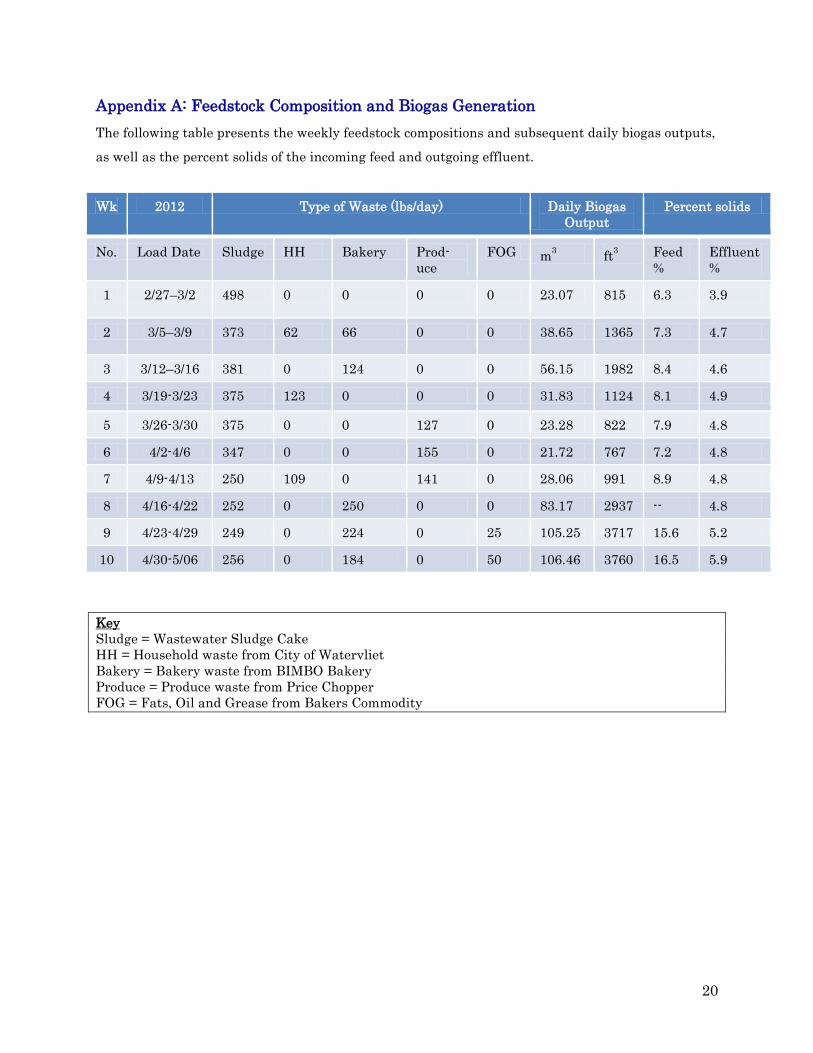
Appendix A: Feedstock Composition and Biogas Generation
The following table presents the weekly feedstock compositions and subsequent daily biogas outputs,
as well as the percent solids of the incoming feed and outgoing effluent.
Wk 2012 Type of Waste (lbs/day) Daily Biogas
Output Percent solids
No. Load Date Sludge HH Bakery Prod-uce
FOG m ft3 Feed %
3 Effluent %
1 2/27–3/2 498 0 0 0 0 23.07 815 6.3 3.9
2 3/5–3/9 373 62 66 0 0 38.65 1365 7.3 4.7
3 3/12–3/16 381 0 124 0 0 56.15 1982 8.4 4.6
4 3/19-3/23 375 123 0 0 0 31.83 1124 8.1 4.9
5 3/26-3/30 375 0 0 127 0 23.28 822 7.9 4.8
6 4/2-4/6 347 0 0 155 0 21.72 767 7.2 4.8
7 4/9-4/13 250 109 0 141 0 28.06 991 8.9 4.8
8 4/16-4/22 252 0 250 0 0 83.17 2937 -- 4.8
9 4/23-4/29 249 0 224 0 25 105.25 3717 15.6 5.2
10 4/30-5/06 256 0 184 0 50 106.46 3760 16.5 5.9
Sludge = Wastewater Sludge Cake Key
HH = Household waste from City of Watervliet Bakery = Bakery waste from BIMBO Bakery Produce = Produce waste from Price Chopper FOG = Fats, Oil and Grease from Bakers Commodity
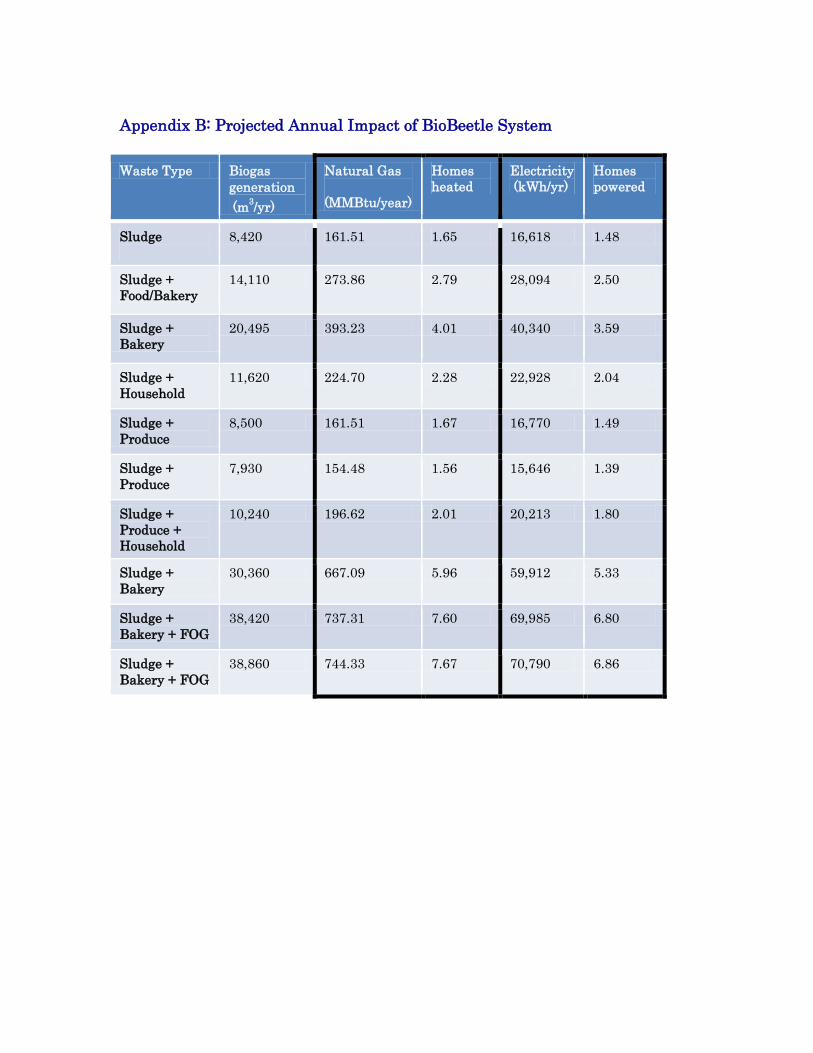
Appendix B: Projected Annual Impact of BioBeetle System Waste Type Biogas
(m
generation
3
Natural Gas
/yr) (MMBtu/year)
Homes heated
Electricity (kWh/yr)
Homes powered
Sludge
8,420 161.51 1.65 16,618 1.48
Sludge + Food/Bakery
14,110 273.86 2.79 28,094 2.50
Sludge + Bakery
20,495 393.23 4.01 40,340 3.59
Sludge + Household
11,620 224.70 2.28 22,928 2.04
Sludge + Produce
8,500 161.51 1.67 16,770 1.49
Sludge + Produce
7,930 154.48 1.56 15,646 1.39
Sludge + Produce + Household
10,240 196.62 2.01 20,213 1.80
Sludge + Bakery
30,360 667.09 5.96 59,912 5.33
Sludge + Bakery + FOG
38,420 737.31 7.60 69,985 6.80
Sludge + Bakery + FOG
38,860 744.33 7.67 70,790 6.86
22
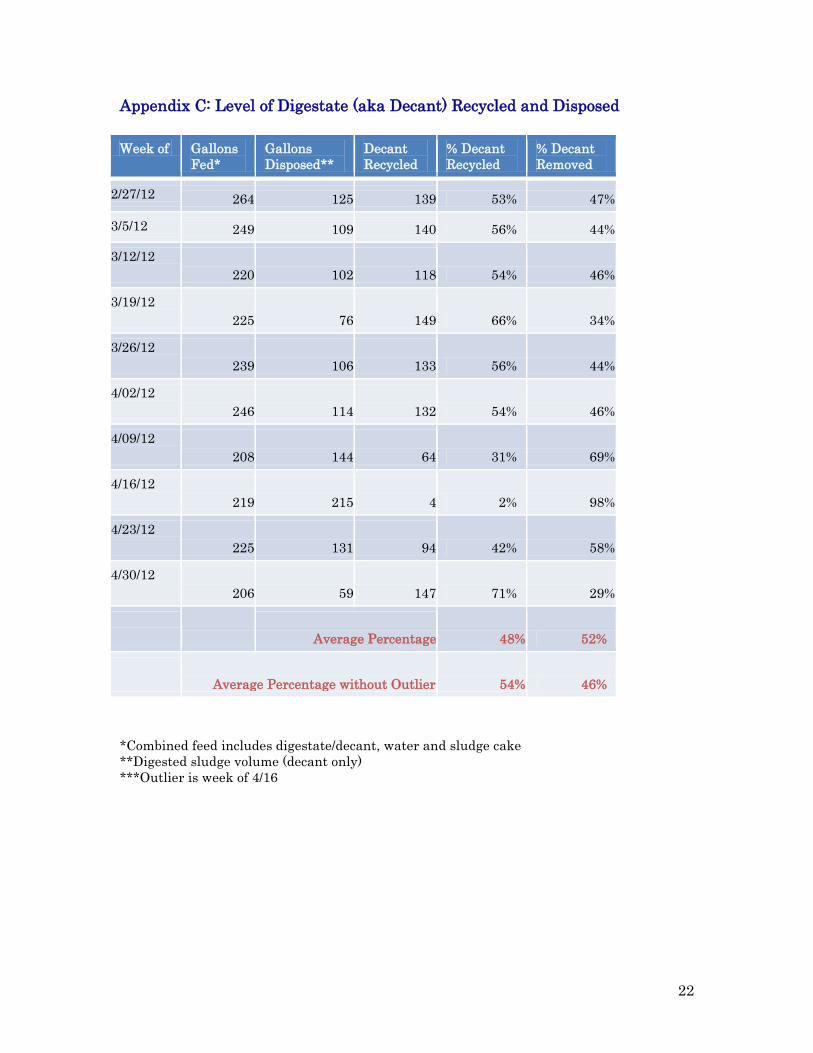
Appendix C: Level of Digestate (aka Decant) Recycled and Disposed Week of Gallons
Fed* Gallons Disposed**
Decant Recycled
% Decant Recycled
% Decant Removed
2/27/12 264 125 139 53% 47%
3/5/12 249 109 140 56% 44%
3/12/12 220 102 118 54% 46%
3/19/12 225 76 149 66% 34%
3/26/12 239 106 133 56% 44%
4/02/12 246 114 132 54% 46%
4/09/12 208 144 64 31% 69%
4/16/12 219 215 4 2% 98%
4/23/12 225 131 94 42% 58%
4/30/12 206 59 147 71% 29%
Average Percentage 48% 52%
Average Percentage without Outlier 54% 46%
*Combined feed includes digestate/decant, water and sludge cake **Digested sludge volume (decant only) ***Outlier is week of 4/16
23
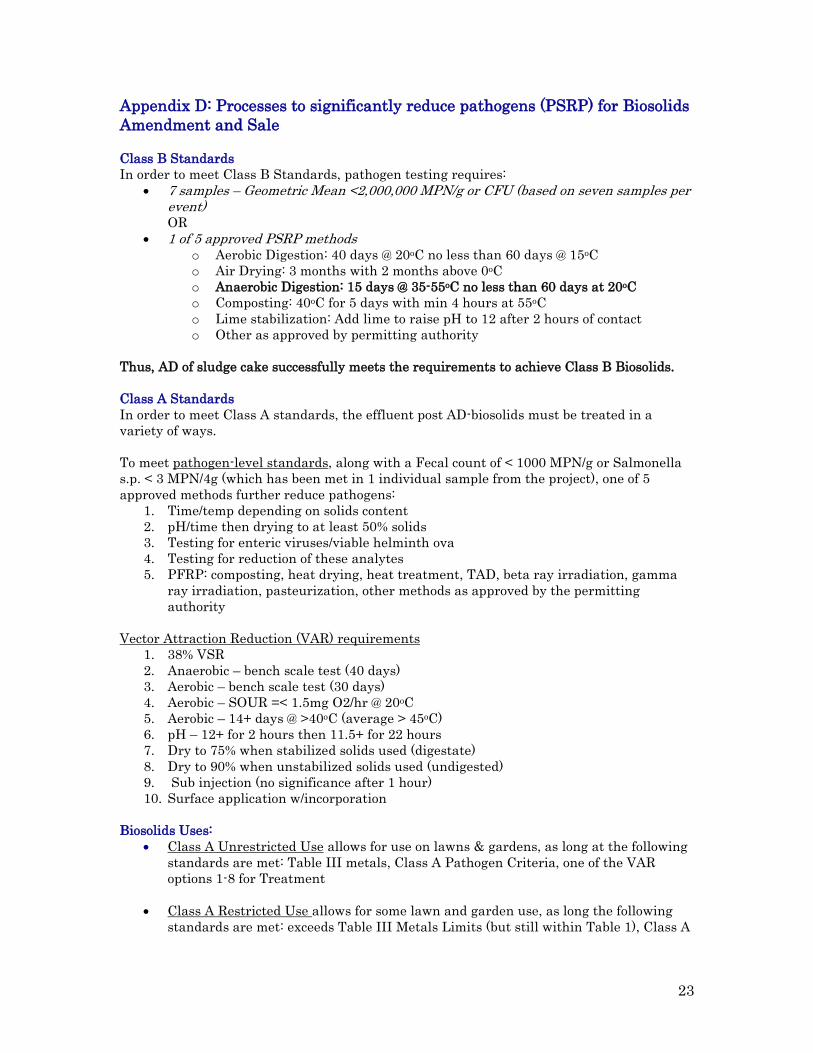
Appendix D: Processes to significantly reduce pathogens (PSRP) for Biosolids Amendment and Sale Class B Standards In order to meet Class B Standards, pathogen testing requires:
• 7 samples – Geometric Mean <2,000,000 MPN/g or CFU (based on seven samples per event) OR
• 1 of 5 approved PSRP methods o Aerobic Digestion: 40 days @ 20oC no less than 60 days @ 15oC o Air Drying: 3 months with 2 months above 0oC o Anaerobic Digestion: 15 days @ 35-55oC no less than 60 days at 20oC o Composting: 40oC for 5 days with min 4 hours at 55oC o Lime stabilization: Add lime to raise pH to 12 after 2 hours of contact o Other as approved by permitting authority
Thus, AD of sludge cake successfully meets the requirements to achieve Class B Biosolids. Class A Standards In order to meet Class A standards, the effluent post AD-biosolids must be treated in a variety of ways. To meet pathogen-level standards, along with a Fecal count of < 1000 MPN/g or Salmonella s.p. < 3 MPN/4g (which has been met in 1 individual sample from the project), one of 5 approved methods further reduce pathogens:
1. Time/temp depending on solids content 2. pH/time then drying to at least 50% solids 3. Testing for enteric viruses/viable helminth ova 4. Testing for reduction of these analytes 5. PFRP: composting, heat drying, heat treatment, TAD, beta ray irradiation, gamma
ray irradiation, pasteurization, other methods as approved by the permitting authority
Vector Attraction Reduction (VAR) requirements
1. 38% VSR 2. Anaerobic – bench scale test (40 days) 3. Aerobic – bench scale test (30 days) 4. Aerobic – SOUR =< 1.5mg O2/hr @ 20oC 5. Aerobic – 14+ days @ >40oC (average > 45oC) 6. pH – 12+ for 2 hours then 11.5+ for 22 hours 7. Dry to 75% when stabilized solids used (digestate) 8. Dry to 90% when unstabilized solids used (undigested) 9. Sub injection (no significance after 1 hour) 10. Surface application w/incorporation
Biosolids Uses:
• Class A Unrestricted Use allows for use on lawns & gardens, as long at the following standards are met: Table III metals, Class A Pathogen Criteria, one of the VAR options 1-8 for Treatment
• Class A Restricted Use allows for some lawn and garden use, as long the following standards are met: exceeds Table III Metals Limits (but still within Table 1), Class A

24
Pathogen criteria, one of the VAR for Treatment, and is subject to annual pollutant loading limits (APLR)
• Class B Restricted Use (agricultural)
25
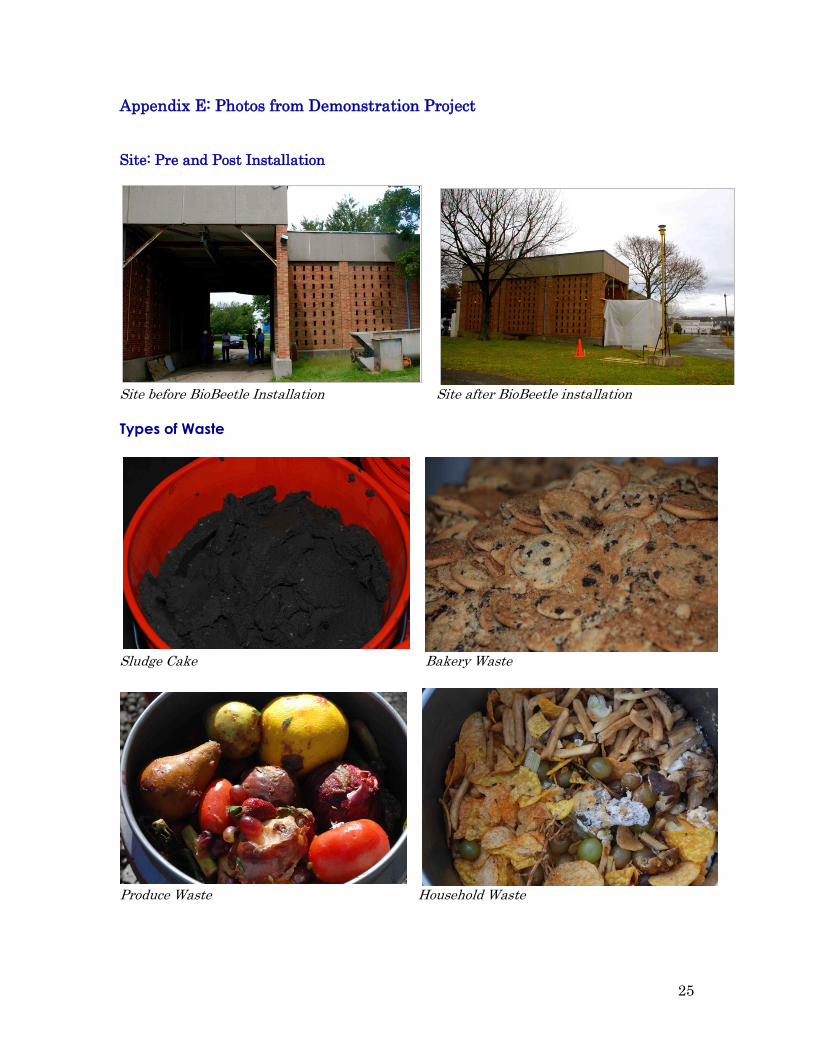
Appendix E: Photos from Demonstration Project Site: Pre and Post Installation
Site before BioBeetle Installation Site after BioBeetle installation Types of Waste
Sludge Cake Bakery Waste
Produce Waste Household Waste
26
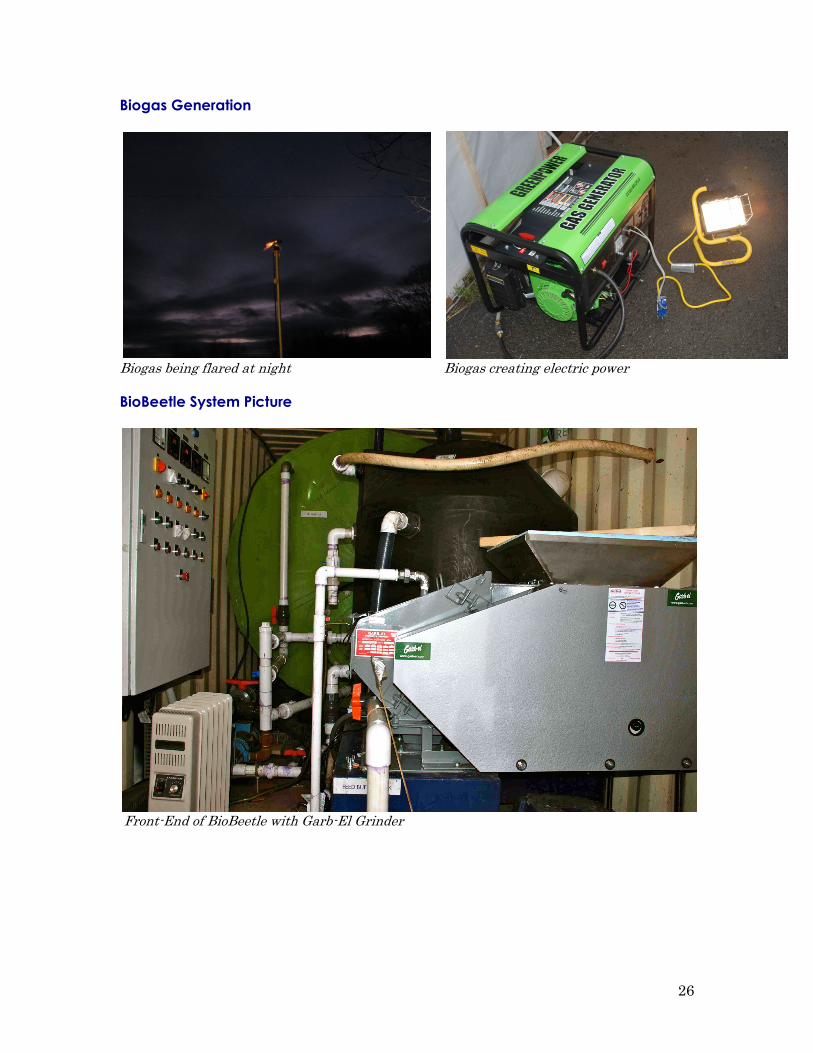
Biogas Generation
Biogas being flared at night Biogas creating electric power BioBeetle System Picture
Front-End of BioBeetle with Garb-El Grinder
NYSERDA, a public benefit corporation, offers objective information and analysis, innovative programs, technical expertise and funding to help New Yorkers increase energy efficiency, save money, use renewable energy, and reduce their reliance on fossil fuels. NYSERDA professionals work to protect our environment and create clean-energy jobs. NYSERDA has been developing partnerships to advance innovative energy solutions in New York since 1975.
To learn more about NYSERDA programs and funding opportunities visit nyserda.ny.gov
NewYorkStateEnergyResearchand
DevelopmentAuthority
17 Columbia CircleAlbany, New York 12203-6399
tollfree:1 (866) NYSERDAlocal: (518) 862-1090fax: (518) 862-1091
Proof-of-Concept for Co-Digestion of Food Waste, Fats, Oil and Grease, and Wastewater Sludge Cake to Create Renewable Energy
Final Report August 2012
NewYorkStateEnergyResearchandDevelopmentAuthority
Francis J. Murray, Jr., President and CEO
StateofNewYork
Andrew M. Cuomo, Governor