Embed Size (px)
Citation preview
Scholars' Mine Scholars' Mine
Masters Theses Student Theses and Dissertations
Fall 2007
Properties of alkaline-resistant calcium-iron-phosphate glasses Properties of alkaline-resistant calcium-iron-phosphate glasses
Jiawanjun Shi
Follow this and additional works at: https://scholarsmine.mst.edu/masters_theses
Part of the Ceramic Materials Commons
Department: Department:
Recommended Citation Recommended Citation Shi, Jiawanjun, "Properties of alkaline-resistant calcium-iron-phosphate glasses" (2007). Masters Theses. 6828. https://scholarsmine.mst.edu/masters_theses/6828
This thesis is brought to you by Scholars' Mine, a service of the Missouri S&T Library and Learning Resources. This work is protected by U. S. Copyright Law. Unauthorized use including reproduction for redistribution requires the permission of the copyright holder. For more information, please contact [email protected].

PROPERTIES OF ALKALINE-RESISTANT
CALCIUM-IRON-PHOSPHATE GLASSES
by
JIAWANJUN SHI
A THESIS
Presented to the Faculty of the Graduate School of the
UNIVERSITY OF MISSOURI-ROLLA
In Partial Fulfillment of the Requirements for the Degree
MASTER OF SCIENCE IN CERAMIC ENGINEERING
2007
Approved by
_______________________________ _______________________________ Richard K. Brow, Advisor Delbert E. Day
_______________________________ Matthew J. O'Keefe

iii
ABSTRACT
The physical properties and alkaline corrosion resistant properties of calcium-
iron-phosphate glasses were studied. The addition of Fe2O3 decreases the thermal
expansion coefficient and increases the glass fiber’s Young’s modulus in comparison
with the addition of CaO. Bulk glass dissolution behavior in alkaline Lawrence solution
was studied by weight loss experiments, Raman spectroscopy, and analytical scanning
electron microscopy. The corrosion of glass powder in NaOH solution was studied by X-
ray diffraction, infrared spectroscopy and high pressure liquid chromatography. The
results show that the dissolution rate decreases when the phosphate chain length
decreases. Calcium oxide can improve the glass durability in high pH solutions in
comparison with ferric oxide. Phase equilibrium modeling was used to explain the
formation of corrosion products, including hydroxyl apatite and Fe2O3.
iv
ACKNOWLEDGMENTS
My deepest thanks go to my advisor, Dr. Richard K. Brow, for all the guidance
and inspiration he has given me throughout the research. From him, I learned the
important elements to do research: to be strict at every detail and to treat every one nicely
and honestly. I really feel happy and lucky to work in Dr Brow’s group for two and half
years. His wisdom and experience have had a profound impact on my view of glass
science and engineering.
I wish to thank my advisory committee members, Dr. Delbert E. Day, and Dr.
Matthew J. O'Keefe for their time and expert guidance.
I do appreciate the support and love from my family, my mother Xiaoxia, my
spouse Hao Zhang and my beloved angel Acacia.
I also had great help from Signo T. Reis, Eric Bohannan, Clarissa Vierrether, and
all the members of my research group.
I would like to gratefully acknowledge the Department of Energy (Award
Number DE-FC36-04G0 14046), the University Transportation Center, and MoSci, Inc.,
for their financial support.
v
TABLE OF CONTENTS
Page
ABSTRACT ....................................................................................................................... iii
ACKNOWLEDGMENTS ................................................................................................. iv
LIST OF ILLUSTRATIONS ............................................................................................ vii
LIST OF TABLES .............................................................................................................. x
1. INTRODUCTION ...................................................................................................... 1
1.1. CORROSION STUDIES OF CEMENT REINFORCEMENT GLASS FIBERS ............................................................................................................... 1
1.2. PHOSPHATE GLASS STRUCTURE AND PROPERTIES ............................. 3
1.2.1. Glass Forming and Fiber Pulling Ability. ................................................ 3
1.2.2. Phosphate Glass Structure ........................................................................ 3
1.2.3. Composition Effects on Glass Structure .................................................. 5
1.2.4. Corrosion Study of Phosphate Glass. ....................................................... 7
1.3. SUMMARY AND THESIS STATEMENT ..................................................... 10
2. EXPERIMENTAL PROCEDURES ........................................................................ 11
2.1. SAMPLE PREPARATION .............................................................................. 11
2.2. PHYSICAL PROPERTIES CHARACTERIZATION ..................................... 13
2.3. CHEMICAL DURABILITY TESTS ............................................................... 13
2.4. SAMPLE CHARACTERIZATION ................................................................. 14
3. RESULTS ................................................................................................................. 16
3.1. GLASS AND FIBER FORMATION ............................................................... 16
3.2. PHYSICAL PROPERTIES .............................................................................. 17
3.3. CORROSION BEHAVIOR .............................................................................. 20
vi
3.3.1. Bulk Glass in Lawrence Solution.. ......................................................... 20
3.3.2. Glass Powder in NaOH Solution. ........................................................... 28
4. DISCUSSION .......................................................................................................... 40
4.1. PROPERTIES ................................................................................................... 40
4.1.1. Glass Formation. ................................................................................... 40
4.1.2. Physical Properties. ................................................................................ 40
4.2. CORROSION ANALYSIS .............................................................................. 41
4.2.1. Dissolution Study. .................................................................................. 41
4.2.2. Corrosion Mechanism. ........................................................................... 43
5. CONCLUSION ........................................................................................................ 50
6. FUTURE WORK ..................................................................................................... 51
BIBLIOGRAPHY ............................................................................................................. 52
VITA ................................................................................................................................ 55
vii
LIST OF ILLUSTRATIONS
Page
Figure 1.1. Composition of Calcium Iron Phosphate Glasses [16].................................... 4
Figure 1.2. Phosphate Tetrahedral Sites that can Exists in Phosphate Glasses ................. 4
Figure 1.3. Idealized Structure for Iron Pyrophosphate Glass [13]. .................................. 6
Figure 1.4. The Structure Of Na+, Ca2+ Modified Phosphate Glass [24]. .......................... 7
Figure 3.1. Composition and Glass Forming Ability of Calcium Iron Phosphate Glasses .......................................................................................................... 16 Figure 3.2. XRD Pattern of the As-made CFP52 Glass Showing the Presence of Ca2P2O7 Crystals ........................................................................................... 17 Figure 3.3. Density of Calcium Iron Phosphate Glasses ................................................. 19
Figure 3.4. Young’s Modulus of Calcium Iron Phosphate Glasses ................................. 19
Figure 3.5. Average Thermal Expansion Coefficient between 100°C and 500°C for Calcium Iron Phosphate Glasses .............................................................. 20 Figure 3.6. Weight Loss of Ca-Fe-Metaphosphate (O/P=3.00) Glasses in LS at 80°C ... 21
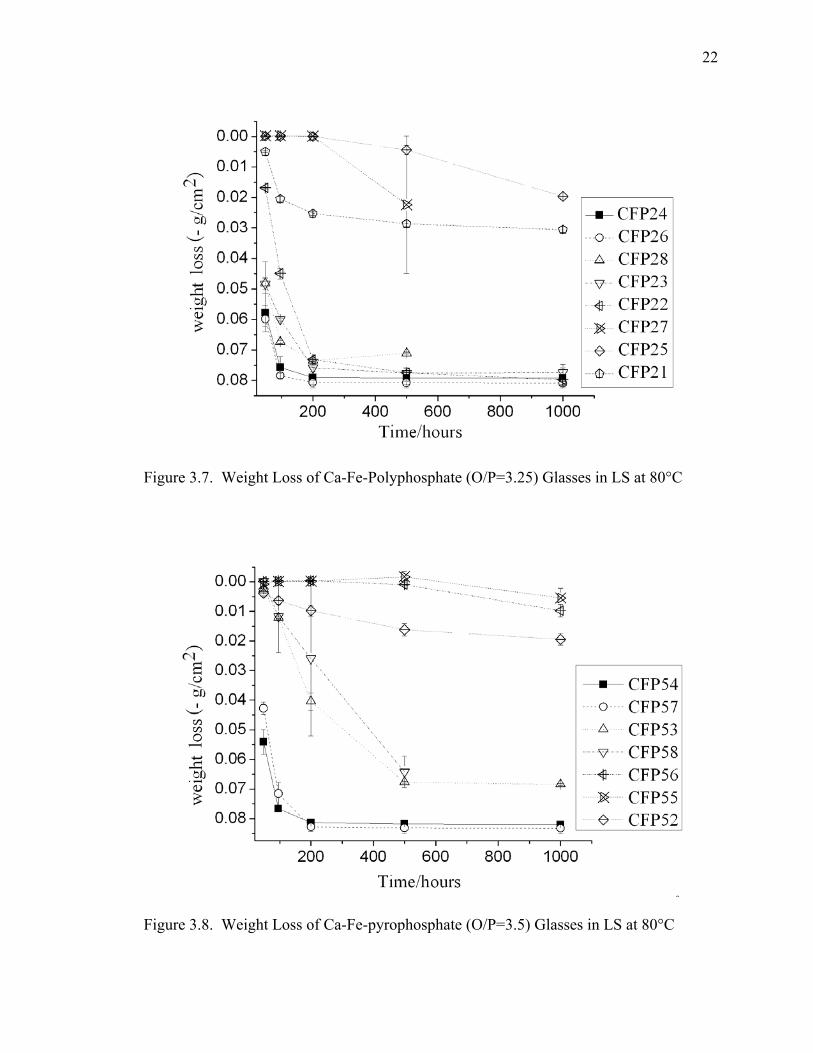
Figure 3.7. Weight Loss of Ca-Fe-Polyphosphate (O/P=3.25) Glasses in LS at 80°C ... 22
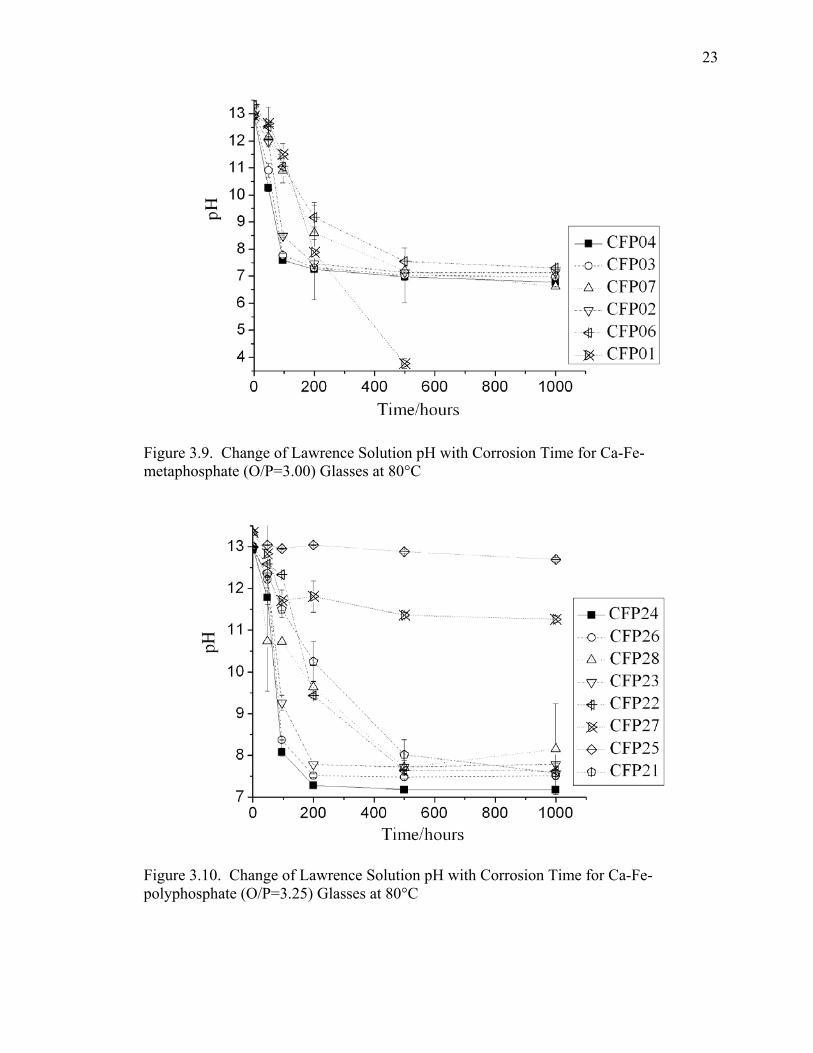
Figure 3.8. Weight Loss of Ca-Fe-pyrophosphate (O/P=3.5) Glasses in LS at 80°C ..... 22
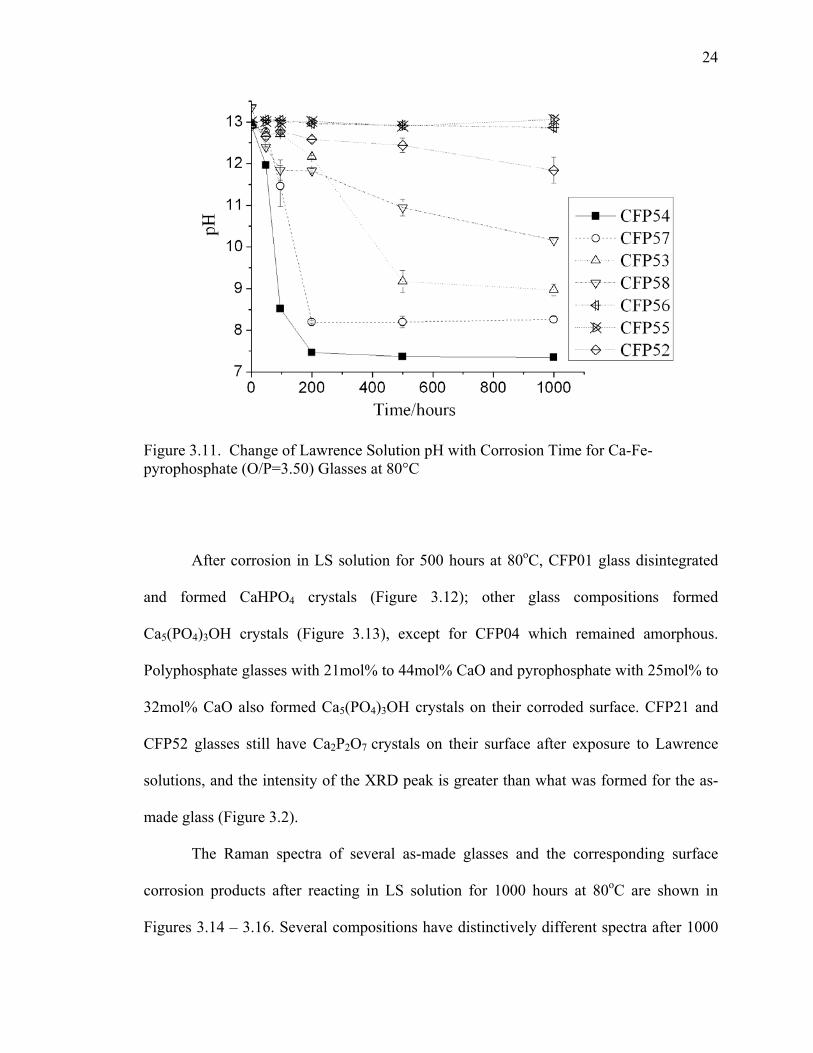
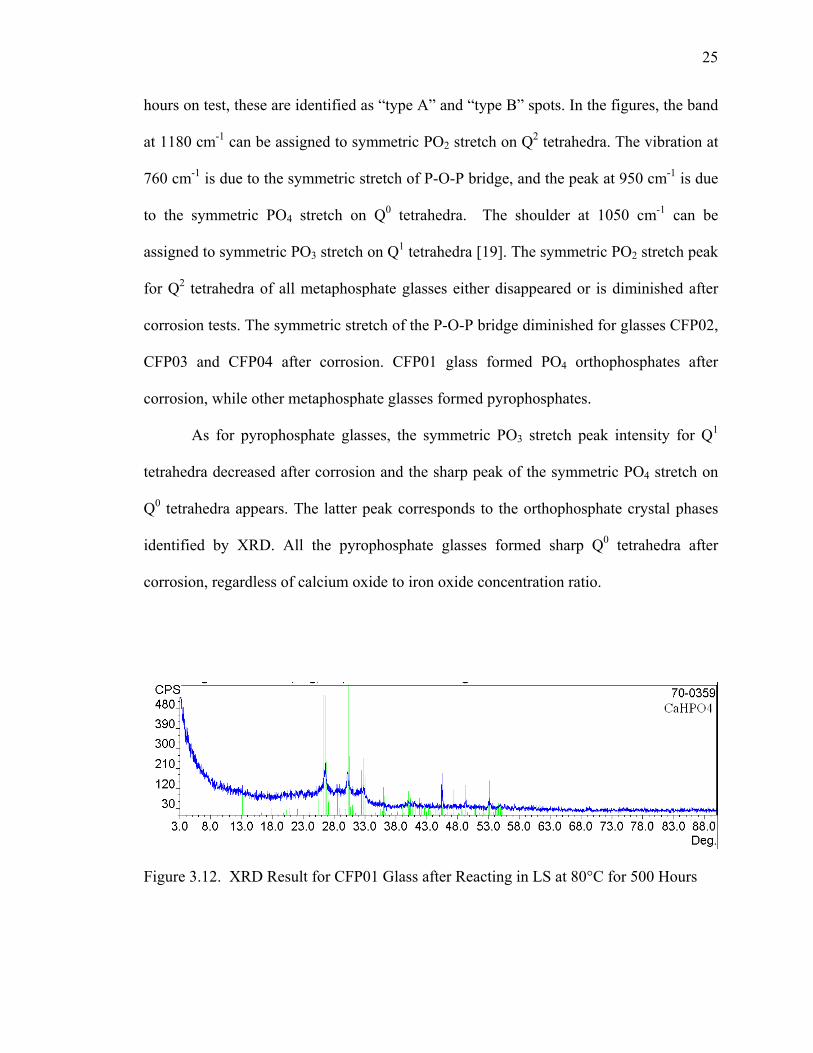
Figure 3.9. Change of Lawrence Solution pH with Corrosion Time for Ca-Fe-metaphosphate (O/P=3.00) Glasses at 80°C ....................................... 23 Figure 3.10. Change of Lawrence Solution pH with Corrosion Time for Ca-Fe-polyphosphate (O/P=3.25) Glasses at 80°C ...................................... 23 Figure 3.11. Change of Lawrence Solution pH with Corrosion Time for Ca-Fe-pyrophosphate (O/P=3.50) Glasses at 80°C .................................... 24 Figure 3.12. XRD Result for CFP01 Glass after Reacting in LS at 80°C for 500 Hours ........................................................................................................... 25
viii
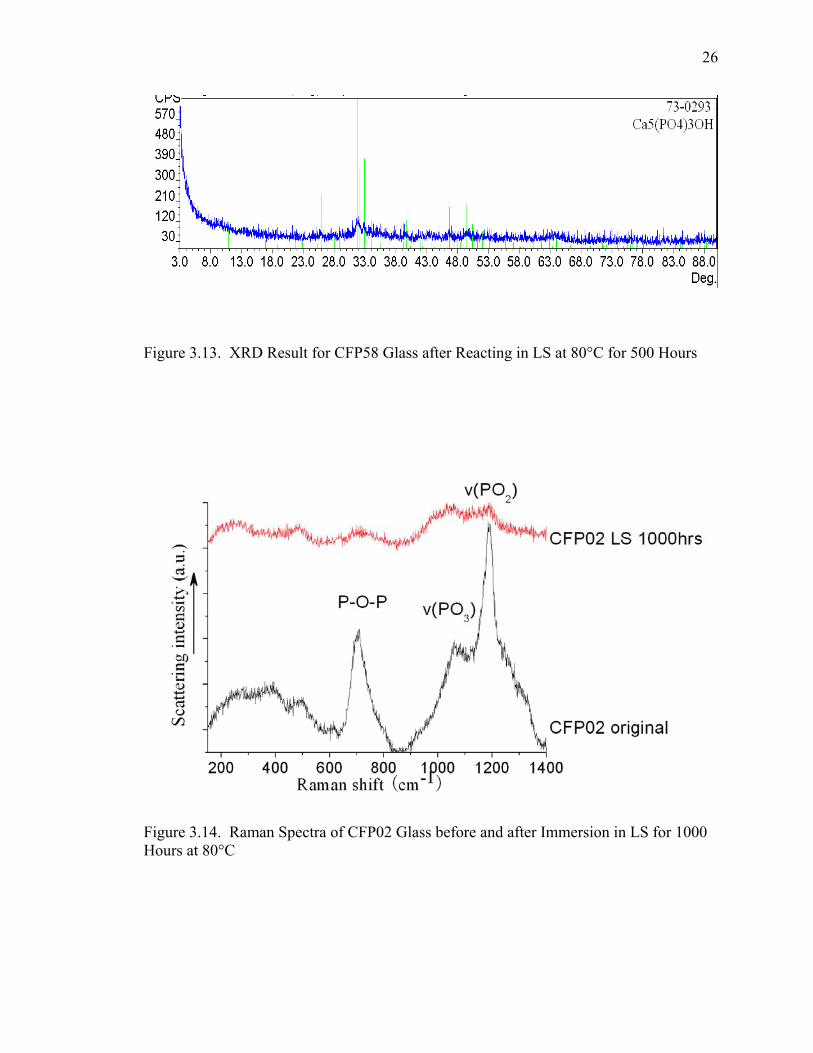
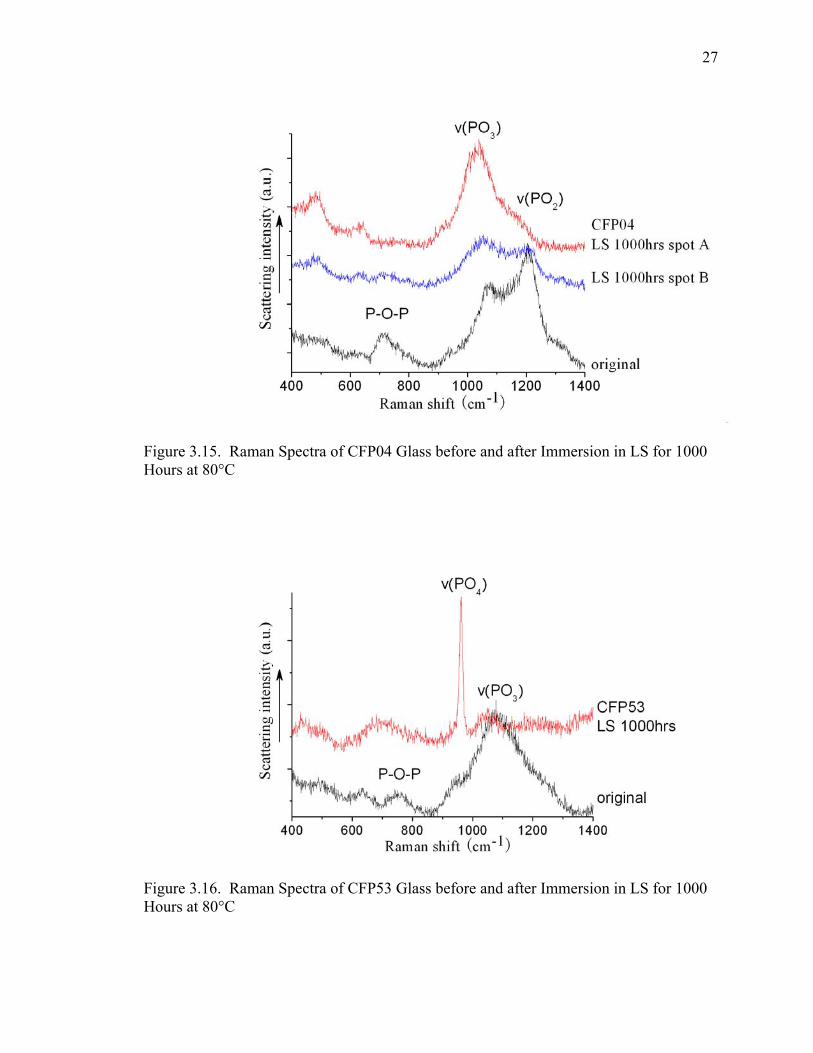
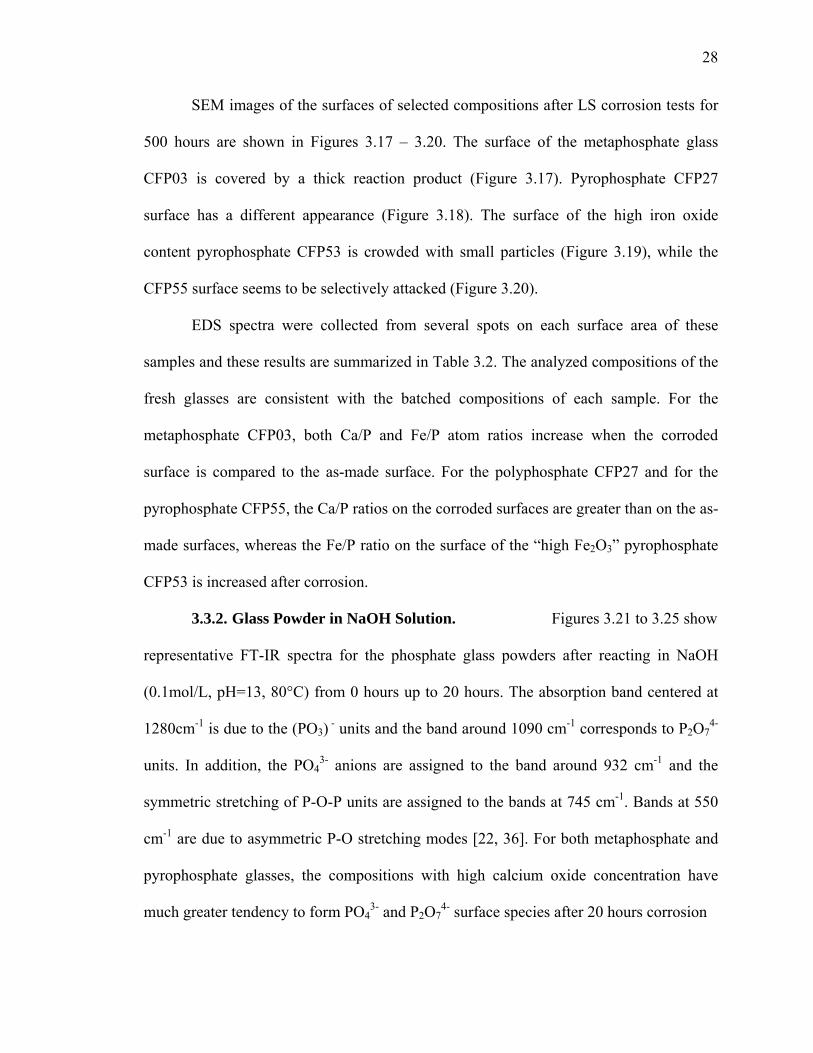
Figure 3.13. XRD Result for CFP58 Glass after Reacting in LS at 80°C for 500 Hours ........................................................................................................... 26 Figure 3.14. Raman Spectra of CFP02 Glass before and after Immersion in LS for 1000 Hours at 80°C ..................................................................................... 26 Figure 3.15. Raman Spectra of CFP04 Glass before and after Immersion in LS for 1000 Hours at 80°C ..................................................................................... 27 Figure 3.16. Raman Spectra of CFP53 Glass before and after Immersion in LS for 1000 Hours at 80°C ..................................................................................... 27 Figure 3.17. SEM Image of CFP03 Glass Surface after Corrosion for 500 Hours in LS ................................................................................................................ 29 Figure 3.18. SEM Image of CFP27 Glass Surface after Corrosion for 500 Hours in LS ................................................................................................................ 29 Figure 3.19. SEM Image of CFP53 Glass Surface after Corrosion for 500 Hours in LS ................................................................................................................ 30 Figure 3.20. SEM Image of CFP55 Glass Surface after Corrosion for 500 Hours in LS ................................................................................................................ 30 Figure 3.21. The Infrared Spectra of CFP02 Glass Powder before and after Immersion in NaOH from 2 Hours to 20 Hours ............................................................ 31 Figure 3.22. The Infrared Spectra of CFP04 Glass Powder before and after Immersion in NaOH from 2 Hours to 20 Hours ............................................................ 32 Figure 3.23. The Infrared Spectra of CFP22 Glass Powder before and after Immersion in NaOH from 2 Hours to 20 Hours ............................................................ 32 Figure 3.24. The Infrared Spectra of CFP53 Glass Powder before and after Immersion in NaOH From 2 Hours To 20 Hours ......................................................... 33 Figure 3.25. The Infrared Spectra of CFP55 Glass Powder before and after Immersion in NaOH from 2 Hours to 20 Hours ............................................................ 33 Figure 3.26. The Infrared Spectra of CFP03 Glass Powder before and after Immersion in LS and NaOH Solutions for 20 Hours .................................................... 34 Figure 3.27. The Infrared Spectra of CFP53 Glass Powder before and after Immersion in LS and NaOH Solutions for 20 Hours .................................................... 35
ix
Figure 3.28. XRD Result for CFP54 Glass after Immersion in NaOH at 80°C for 20 Hours .............................................................................................. 35
Figure 3.29. Surface Corrosion Products Identified by XRD on Glasses after Reactions.. ................................................................................................... 36 Figure 3.30. Chromatograms for NaOH Solutions after Immersion of Different Glasses for 8 Hours at 80°C ........................................................................ 37 Figure 3.31. Total Concentration of Phosphate Released into NaOH Solution at 80°C . 39
Figure 4.1. Classification of Ca-iron-phosphate Glass Compositions. ............................ 41
Figure 4.2. Equilibrium Modeling of Predominant Calcium Phase for CFP Glass in LS Solution ................................................................................................... 44 Figure 4.3. Equilibrium Modeling of Predominant Iron Phases for CFP Glass in LS Solution ................................................................................................... 44 Figure 4.4. Dissolution Rates of Glasses which are Immersed in LS for 48 Hours at 80°C Depend on the Compositions ........................................................... 45 Figure 4.5. Dissolution Rates of Glasses which are Immersed in LS for 500 Hours at 80°C Depend on the Compositions ........................................................... 45 Figure 4.6. pH Values of LS Solutions in which Glasses Immersed for 500 Hours at 80°C Depend on the Compositions ........................................................... 46 Figure 4.7. Dissolution Rates of Glasses vs. pH of LS after 500 Hours at 80°C............. 46
x
LIST OF TABLES
Page
Table 2.1. Batched Compositions (mole %) of CaO-Fe2O3-P2O5 Glasses ...................... 12
Table 3.1. Properties of Calcium Iron Phosphate Glasses ............................................... 18
Table 3.2. EDS Analyses from As-made Glass Surfaces and Corroded Glass Surfaces (after 500 hours in LS) .................................................................... 31
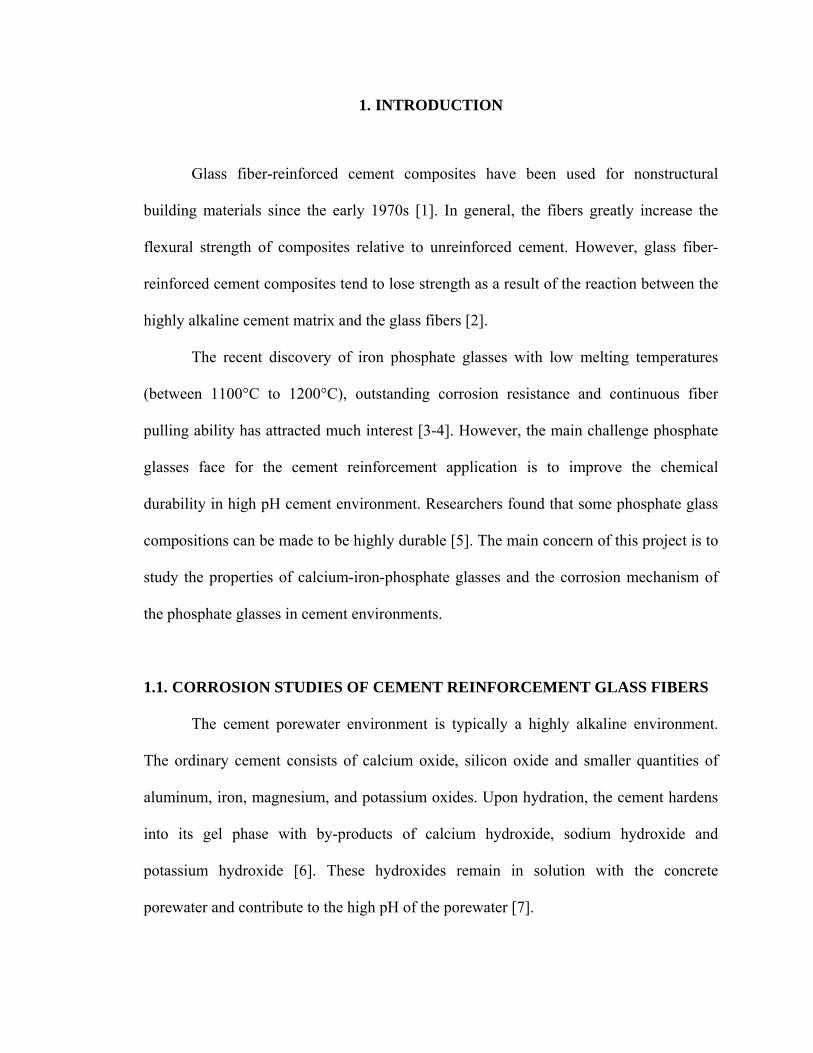
1. INTRODUCTION
Glass fiber-reinforced cement composites have been used for nonstructural
building materials since the early 1970s [1]. In general, the fibers greatly increase the
flexural strength of composites relative to unreinforced cement. However, glass fiber-
reinforced cement composites tend to lose strength as a result of the reaction between the
highly alkaline cement matrix and the glass fibers [2].
The recent discovery of iron phosphate glasses with low melting temperatures
(between 1100°C to 1200°C), outstanding corrosion resistance and continuous fiber
pulling ability has attracted much interest [3-4]. However, the main challenge phosphate
glasses face for the cement reinforcement application is to improve the chemical
durability in high pH cement environment. Researchers found that some phosphate glass
compositions can be made to be highly durable [5]. The main concern of this project is to
study the properties of calcium-iron-phosphate glasses and the corrosion mechanism of
the phosphate glasses in cement environments.
1.1. CORROSION STUDIES OF CEMENT REINFORCEMENT GLASS FIBERS
The cement porewater environment is typically a highly alkaline environment.
The ordinary cement consists of calcium oxide, silicon oxide and smaller quantities of
aluminum, iron, magnesium, and potassium oxides. Upon hydration, the cement hardens
into its gel phase with by-products of calcium hydroxide, sodium hydroxide and
potassium hydroxide [6]. These hydroxides remain in solution with the concrete
porewater and contribute to the high pH of the porewater [7].
2
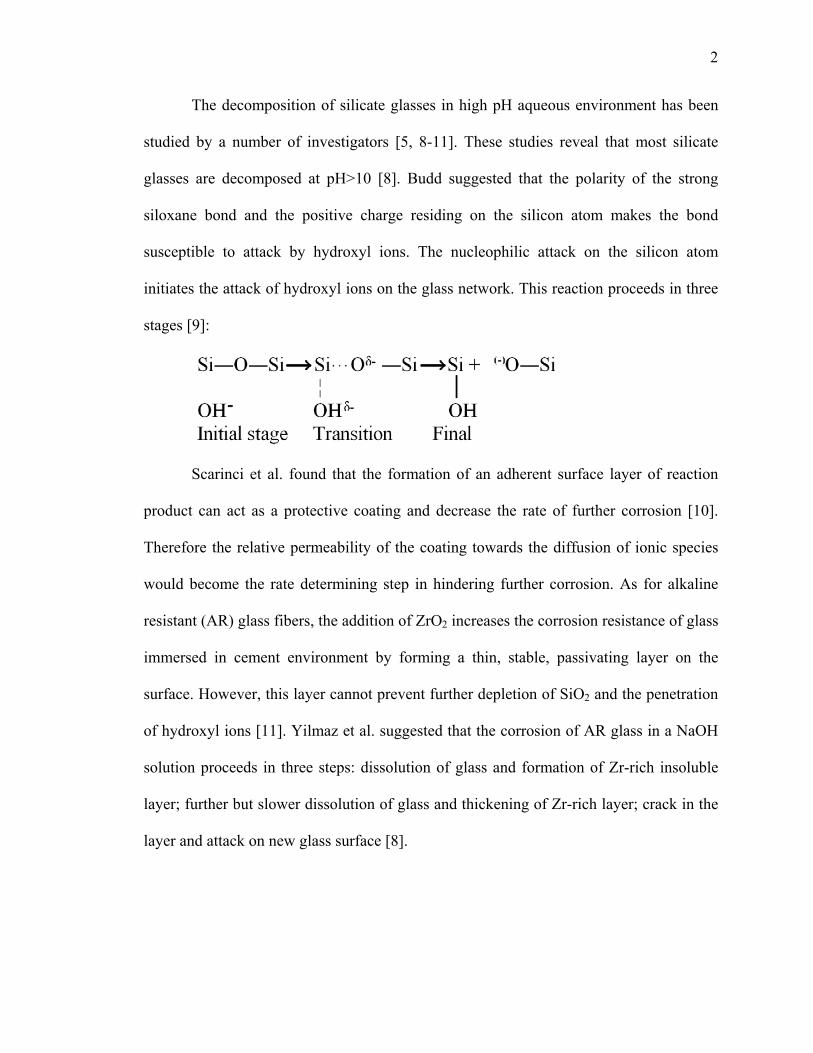
The decomposition of silicate glasses in high pH aqueous environment has been
studied by a number of investigators [5, 8-11]. These studies reveal that most silicate
glasses are decomposed at pH>10 [8]. Budd suggested that the polarity of the strong
siloxane bond and the positive charge residing on the silicon atom makes the bond
susceptible to attack by hydroxyl ions. The nucleophilic attack on the silicon atom
initiates the attack of hydroxyl ions on the glass network. This reaction proceeds in three
stages [9]:
Scarinci et al. found that the formation of an adherent surface layer of reaction
product can act as a protective coating and decrease the rate of further corrosion [10].
Therefore the relative permeability of the coating towards the diffusion of ionic species
would become the rate determining step in hindering further corrosion. As for alkaline
resistant (AR) glass fibers, the addition of ZrO2 increases the corrosion resistance of glass
immersed in cement environment by forming a thin, stable, passivating layer on the
surface. However, this layer cannot prevent further depletion of SiO2 and the penetration
of hydroxyl ions [11]. Yilmaz et al. suggested that the corrosion of AR glass in a NaOH
solution proceeds in three steps: dissolution of glass and formation of Zr-rich insoluble
layer; further but slower dissolution of glass and thickening of Zr-rich layer; crack in the
layer and attack on new glass surface [8].
3
1.2. PHOSPHATE GLASS STRUCTURE AND PROPERTIES
1.2.1. Glass Forming and Fiber Pulling Ability The addition of certain metal
oxides which are not glass forming oxides can hinder glass formation while other oxides
have a minimal effect [12]. Yu et al. found that increasing Fe2O3 and soda content in
phosphate glasses could increase melting temperature as well as the tendency for
devitrification [13].
Meadowcroft et al. showed that the ease of formation of several monovalent and
divalent phosphate glasses could be related to the heat of formation of the solid glass
[14]: when the heat of formation is small, the phosphate chains would distribute widely,
and the glass would form with ease.
In general, the glass formation tendency decreases with increasing O/P ratio [15].
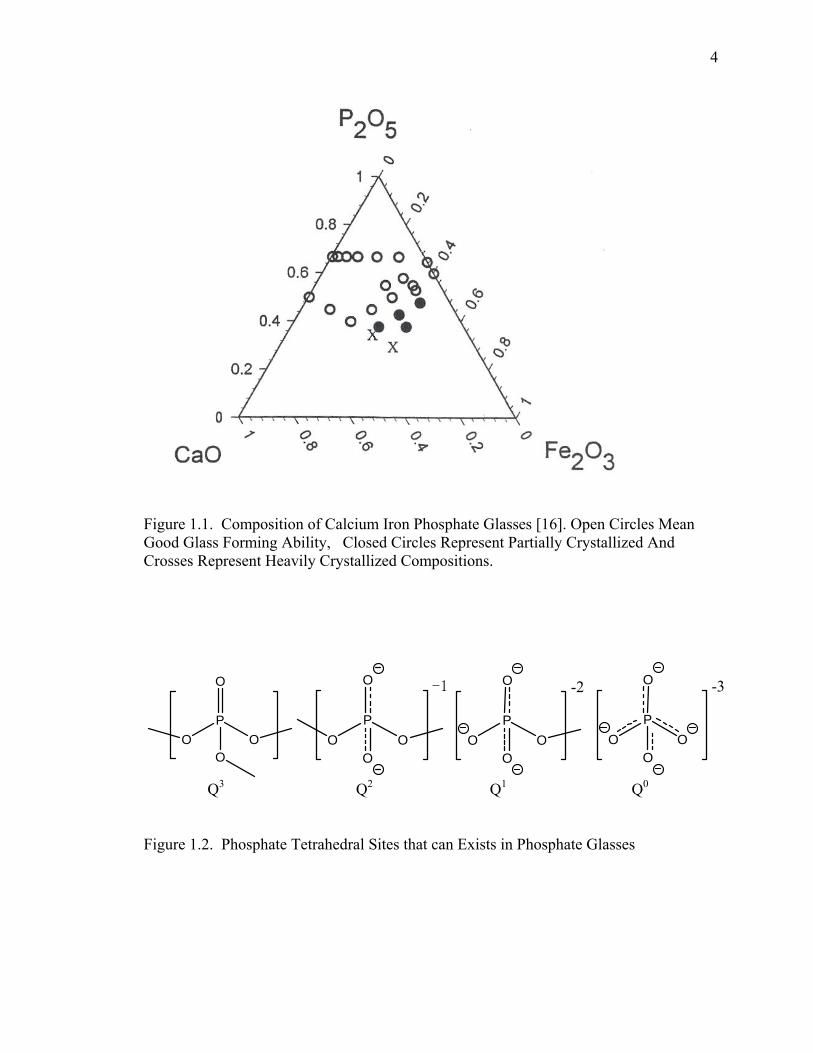
Brow et al. studied the glass forming ability of compositions of calcium iron phosphate
glasses as shown in Figure 1.1 [16].
Phosphate glass fibers could be pulled in the temperature range with low viscosity
so that they would not break off at the nozzle tip [17]. Fe-phosphate melt viscosity
increases rapidly with small decreases in temperature, which makes it difficult to pull
fibers from the melt without encountering some surface crystallization [18].
1.2.2. Phosphate Glass Structure. Phosphate glasses can be made with a range
of structures, from a cross linked network of Q3 tetrahedra to polymer-like
metaphosphate chains of Q2 tetrahedra to invert glasses based on small pyro (Q1) and
orthophosphate (Q0) anions, depending on the O/P ratio as set by glass composition [19].
Figure 1.2 shows the types of different phosphate tetrahedra.
4
Figure 1.1. Composition of Calcium Iron Phosphate Glasses [16]. Open Circles Mean Good Glass Forming Ability, Closed Circles Represent Partially Crystallized And Crosses Represent Heavily Crystallized Compositions.
Q3 Q2 Q1 Q0
Figure 1.2. Phosphate Tetrahedral Sites that can Exists in Phosphate Glasses
OP
OO
O
OP
O
O
O
-1
OP
O
O
O
-2
OP
O
O
O
-3
5
It is expected that phosphate glasses with different structures would have different
corrosion behavior. Marino et al. concluded that pyrophosphate glasses are relatively
stable compared with other types of phosphate glasses [20].
1.2.3. Composition Effects on Glass Structure. Because the addition of
appropriate modifying oxides into the parent P2O5 network can dramatically improve the
physical and chemical properties [21], it is essential to understand the structural changes
brought about by these network modifiers.
P2O5 network consists of corner-sharing Q3 PO4 tetrahedra; each PO4 tetrahedron
has a P=O double bond. The structural instability arises from the energetic imbalance
between the dπ-pπ bonding character in the terminal P=O and the bridging P-O-P
configurations which tends to break up the cross-linking network [22].
Yu et al. studied the effect of iron addition on the phosphate glass structure [13].
Their XPS spectra show a gradual reduction in the concentration of bridging P-O-P bonds
with increasing Fe2O3 concentration, which indicates that P-O-Fe (II) or P-O-Fe (III)
bonds replace P-O-P bonds. The iron (II) ions are found to be in octahedral coordination,
whereas the iron (III) ions are in tetrahedral and octahedral coordination or distorted
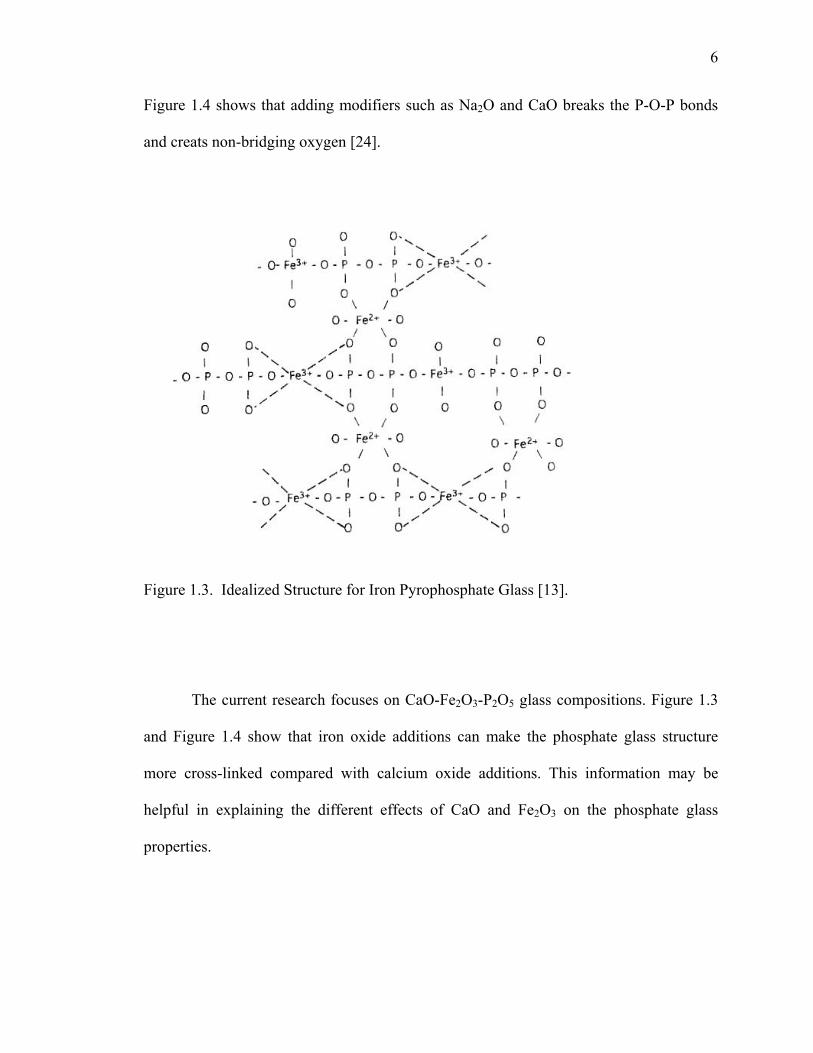
octahedral coordination. Figure 1.3 shows an idealized structure of iron phosphate glass
whose composition is close to the pyrophosphate which has good chemical durability
[13]. Fang et al. showed that the higher Fe2+ ion concentration in the glass would make
the glass structure closer to the crystalline Fe3(P2O7)2 [23].
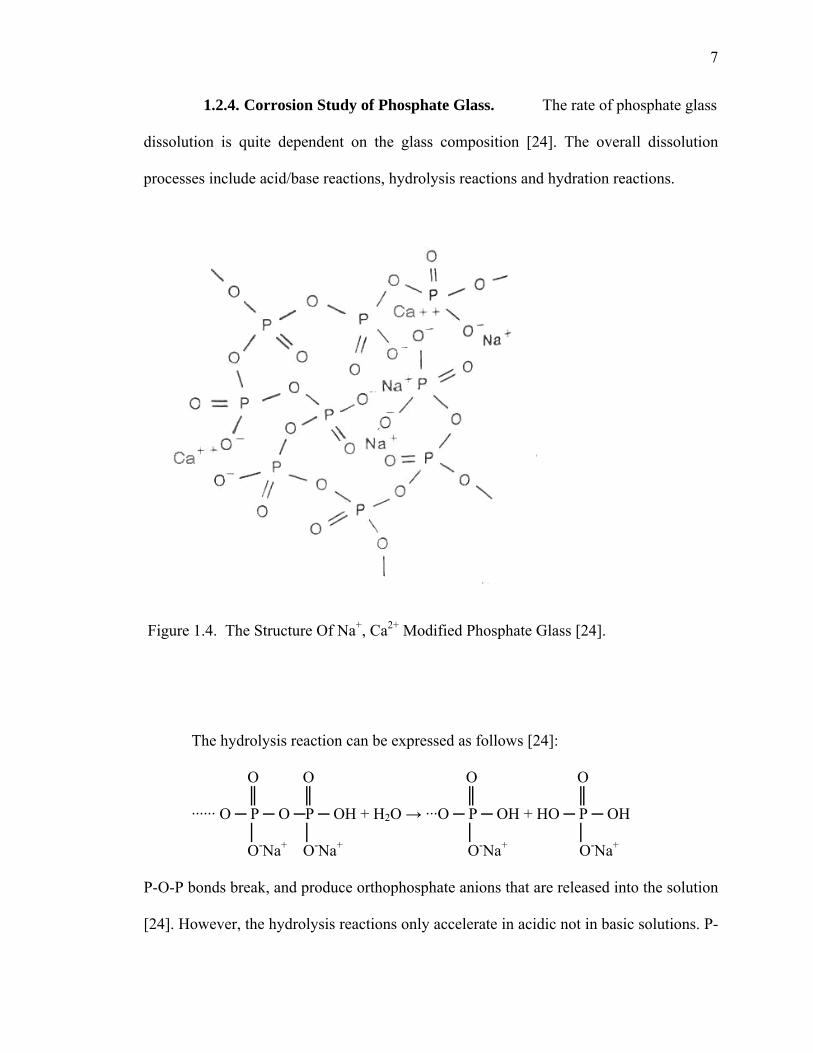
Marino et al. showed that the network modifiers, like Li2O, Na2O, BaO, CaO and
so on, offered sufficient numbers of non-bridging oxygen for the glass network, therefore
those intermediates (Al2O3, B2O3 and ZnO) tended to act as glass network formers [20].
6
Figure 1.4 shows that adding modifiers such as Na2O and CaO breaks the P-O-P bonds
and creats non-bridging oxygen [24].
Figure 1.3. Idealized Structure for Iron Pyrophosphate Glass [13].
The current research focuses on CaO-Fe2O3-P2O5 glass compositions. Figure 1.3
and Figure 1.4 show that iron oxide additions can make the phosphate glass structure
more cross-linked compared with calcium oxide additions. This information may be
helpful in explaining the different effects of CaO and Fe2O3 on the phosphate glass
properties.
7
1.2.4. Corrosion Study of Phosphate Glass. The rate of phosphate glass
dissolution is quite dependent on the glass composition [24]. The overall dissolution
processes include acid/base reactions, hydrolysis reactions and hydration reactions.
Figure 1.4. The Structure Of Na+, Ca2+ Modified Phosphate Glass [24].
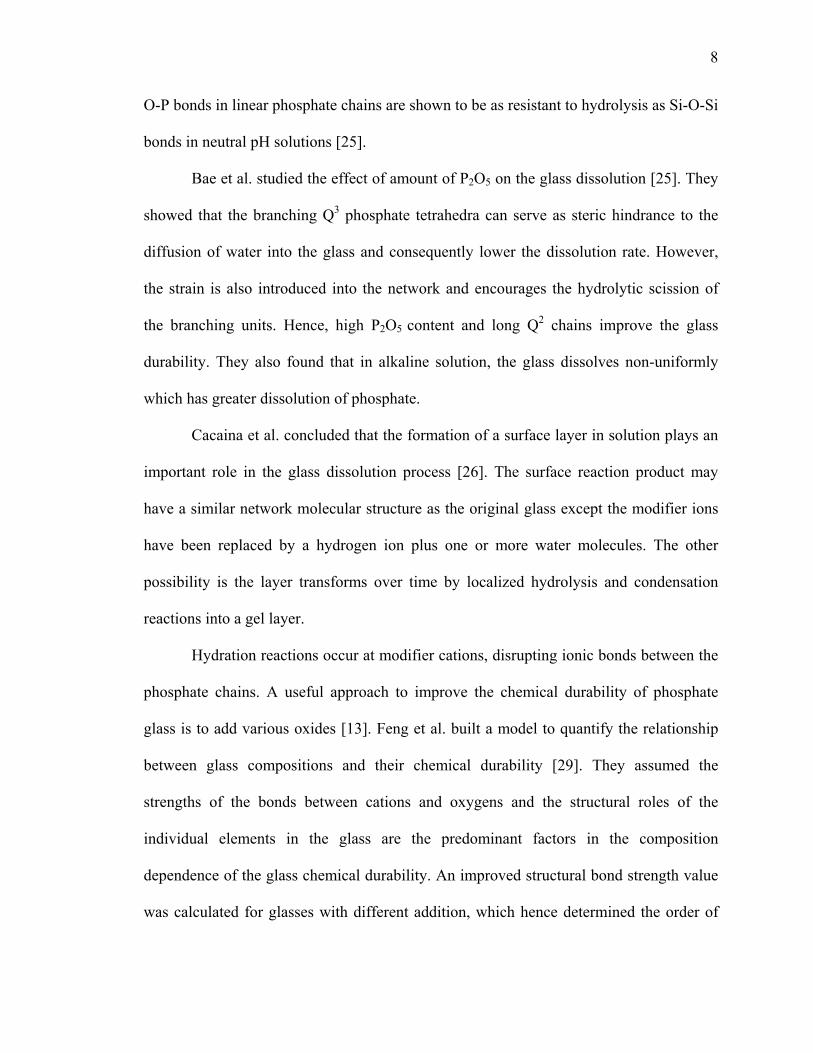
The hydrolysis reaction can be expressed as follows [24]:
O O O O ║ ║ ║ ║ ······ O ─ P ─ O ─P ─ OH + H2O → ···O ─ P ─ OH + HO ─ P ─ OH │ │ │ │ O-Na+ O-Na+ O-Na+ O-Na+
P-O-P bonds break, and produce orthophosphate anions that are released into the solution
[24]. However, the hydrolysis reactions only accelerate in acidic not in basic solutions. P-
8
O-P bonds in linear phosphate chains are shown to be as resistant to hydrolysis as Si-O-Si
bonds in neutral pH solutions [25].
Bae et al. studied the effect of amount of P2O5 on the glass dissolution [25]. They
showed that the branching Q3 phosphate tetrahedra can serve as steric hindrance to the
diffusion of water into the glass and consequently lower the dissolution rate. However,
the strain is also introduced into the network and encourages the hydrolytic scission of
the branching units. Hence, high P2O5 content and long Q2 chains improve the glass
durability. They also found that in alkaline solution, the glass dissolves non-uniformly
which has greater dissolution of phosphate.
Cacaina et al. concluded that the formation of a surface layer in solution plays an
important role in the glass dissolution process [26]. The surface reaction product may
have a similar network molecular structure as the original glass except the modifier ions
have been replaced by a hydrogen ion plus one or more water molecules. The other
possibility is the layer transforms over time by localized hydrolysis and condensation
reactions into a gel layer.
Hydration reactions occur at modifier cations, disrupting ionic bonds between the
phosphate chains. A useful approach to improve the chemical durability of phosphate
glass is to add various oxides [13]. Feng et al. built a model to quantify the relationship
between glass compositions and their chemical durability [29]. They assumed the
strengths of the bonds between cations and oxygens and the structural roles of the
individual elements in the glass are the predominant factors in the composition
dependence of the glass chemical durability. An improved structural bond strength value
was calculated for glasses with different addition, which hence determined the order of
9
effectiveness of these oxides additions for improving glass durability. The order of
increasing effectiveness is expressed as Al2O3> B2O3>ZrO2> SiO2>Fe2O3> CaO.
Many researchers found the addition of iron will improve durability for phosphate
glass [13, 25, 30-34]. Several researchers concluded that Fe3+ cations can enter in the
glass network with four-fold coordination and form stable P-O-Fe covalent bonds and
consequently increase the chemical durability [30, 31]. Yu et al. studied the relationship
between iron valence and the ability of iron addition to improve glass durability [13]. The
results show that the concentration of iron (II) decreases with increasing iron content and
the improvement in chemical durability. This is because iron (II) and iron (III) have
different roles in the structure of glasses. However, adding iron sites can pin the structure,
then shorten the average polyphosphate chain length. According to the previous analyses
on the mechanism and kinetics of dissolution for phosphate glass composition, the
optimum O/P ratio would be close to 3.5, which corresponds to the Q1 structure [15, 20].
Also, because the ferric iron has a radius of 0.64Å which is much smaller than OH- or
H3O+ ion, iron will block the diffusion of larger hydroxonium through the modifier
channels and therefore improve the chemical durability [30, 31].
Bunker et al. suggested that the divalent cation as Ca2+ can serve as ionic cross-
links between the nonbridging oxygens of two different phosphate chains, and
accordingly increase chemical durability. On the other hand, when divalent cation content
reaches a certain point, because the polymer chains can only accommodate a limited
number of chelate cross links, there is no further increase in chemical durability [24].
Chromatographic techniques have been used to study the structure and dissolution
of phosphate glasses since the 1950s [27]. The technique of high pressure liquid
10
chromatography (HPLC) can be used to quantitatively measure the type and distribution
of phosphate tetrahedral chains and rings dissolved from the solids [28]. For most metal
phosphates, HPLC provides accurate information because these solids dissolve in high
pH solutions containing EDTA without breaking the bridging P-O-P bonds[28]. Sales et
al. used HPLC to obtain useful information about the structure of amorphous phosphate
solids, such as chain lengths and distribution of different phosphate chains, which other
techniques cannot get [5, 12, 27].
1.3. SUMMARY AND THESIS STATEMENT
Low cost and superior properties have made phosphate glass a good candidate for
cement reinforcement applications. The current biggest challenges are to know how
phosphate glass reacts in cement environment and then to improve the chemical
durability. Many researchers have studied the corrosion mechanism of phosphate glasses
in neutral solution, but very few have done these studies in high alkaline environments.
This thesis will explore this new area and try to answer questions about how phosphate
glasses react in alkaline environments. From the previous result of compositional effects
on phosphate glass structure and properties, both ferric oxide and calcium oxide can
improve the chemical durability. This project will continue the study of the composition
effects and do the comparison. Also, in this thesis, the effect of different phosphate chain-
lengths on the glass durability will be discussed.
11
2. EXPERIMENTAL PROCEDURES
2.1. SAMPLE PREPARATION
Glasses were prepared from reagent grade CaCO3, Fe2O3, and NH4H2PO4 (Fisher
Scientific Inc.). All components were weighed on a balance that provided measurements
accurate to ±0.01g. Components were mixed thoroughly in aluminosilicate crucibles, and
then preheated at 900°C for 1 hour in order to burn out NH3 and CO2. The batch
materials were then melted at 1200°C for 2 hours. Melts were poured into copper molds
and the glasses annealed at 450°C for 6 hours. Samples for corrosion studies were cut
with a diamond saw to dimensions about 0.5×1×2cm3, then polished to 600 grit finish
with SiC paper on all surfaces; water was used as a lubricant.
Samples of each glass were ground using a mortar and pestle and sieved to
produce powders with particle sizes in the range of approximately 125-150 μm. These
particles were used for accelerated corrosion tests and infrared samples.
Glass fibers were pulled from melts to produce samples for measuring Young’s
modulus. Melts were held in aluminosilicate crucibles at 1300°C for one hour, and then
removed from the furnace. A silica rod was used to pull fibers from the melt surface. The
glass fiber diameters were around 200μm.
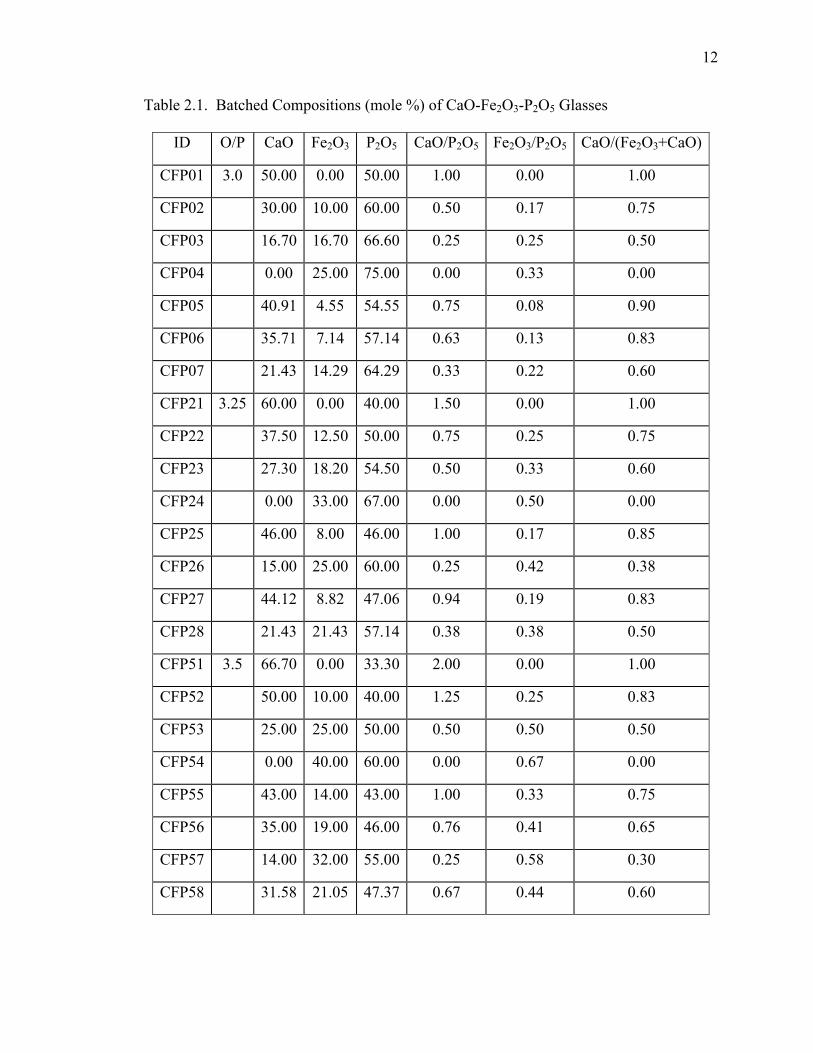
Table 2.1 shows the batched compositions of glasses prepared in this study. The
glasses are classified according to their O/P atom ratio, thus falling into three
compositional groups: metaphosphate (O/P=3.0), polyphosphate (O/P=3.25), and
pyrophosphate (O/P=3.5) glasses.
12
Table 2.1. Batched Compositions (mole %) of CaO-Fe2O3-P2O5 Glasses
ID O/P CaO Fe2O3 P2O5 CaO/P2O5 Fe2O3/P2O5 CaO/(Fe2O3+CaO)
CFP01 3.0 50.00 0.00 50.00 1.00 0.00 1.00
CFP02 30.00 10.00 60.00 0.50 0.17 0.75
CFP03 16.70 16.70 66.60 0.25 0.25 0.50
CFP04 0.00 25.00 75.00 0.00 0.33 0.00
CFP05 40.91 4.55 54.55 0.75 0.08 0.90
CFP06 35.71 7.14 57.14 0.63 0.13 0.83
CFP07 21.43 14.29 64.29 0.33 0.22 0.60
CFP21 3.25 60.00 0.00 40.00 1.50 0.00 1.00
CFP22 37.50 12.50 50.00 0.75 0.25 0.75
CFP23 27.30 18.20 54.50 0.50 0.33 0.60
CFP24 0.00 33.00 67.00 0.00 0.50 0.00
CFP25 46.00 8.00 46.00 1.00 0.17 0.85
CFP26 15.00 25.00 60.00 0.25 0.42 0.38
CFP27 44.12 8.82 47.06 0.94 0.19 0.83
CFP28 21.43 21.43 57.14 0.38 0.38 0.50
CFP51 3.5 66.70 0.00 33.30 2.00 0.00 1.00
CFP52 50.00 10.00 40.00 1.25 0.25 0.83
CFP53 25.00 25.00 50.00 0.50 0.50 0.50
CFP54 0.00 40.00 60.00 0.00 0.67 0.00
CFP55 43.00 14.00 43.00 1.00 0.33 0.75
CFP56 35.00 19.00 46.00 0.76 0.41 0.65
CFP57 14.00 32.00 55.00 0.25 0.58 0.30
CFP58 31.58 21.05 47.37 0.67 0.44 0.60
13
2.2. PHYSICAL PROPERTIES CHARACTERIZATION
Physical property measurements on glass samples included density (ρ), coefficient
of thermal expansion (CTE) and Young’s modulus. Glass density was determined by the
Archimedes method using DI water as the buoyancy liquid. Density was measured on
two samples for each composition, with an uncertainty of ±0.003g/cm3. Thermal
expansion coefficient was measured in air using an Orton 1600 dilatometer at a ramp rate
of 5°C /min. The linear CTE was calculated from the length change between 100°C to
500°C for each glass. The CTE of a glass run twice varied by 5%. The glass transition
temperature (Tg) and dilatometric softening temperatures (Td) were determined from the
dilatometry results. They are accurate to ±3°C. Young’s modulus was measured on fibers
pulled from each melt using an ultrasonic acoustic pulse technique, (Panatherm 5010,
Panametrics, Inc., Waltham, Massachusetts). Ten different fibers were evaluated for each
compositions and the average is reported.
2.3. CHEMICAL DURABILITY TESTS
Dissolution rates were measured gravimetrically on monolithic samples (two
samples for each glass composition) held in Lawrence solution (LS) at 80°C for up to
1000 hours. Lawrence Solution is prepared from 0.88 g/l NaOH, 3.45 g/l KOH, and 0.48
g/l Ca(OH)2 suspended in distilled water and has a pH of approximately 13.0. It is used as
a synthetic cementitious environment [34]. The glass surface area-to-solution volume
ratios were set to 0.07cm-1. Glass powders were suspended in NaOH solution (pH=13,
0.1 molar/L ) from 2 hours up to 20 hours at 80°C and the glass surface area-to-solution
volume ratios were set to 0.21cm-1. Weight change measurements were made using a
14
Sartorius scale with 10-5g resolution. The solution temperatures were maintained at 80°C
to accelerate the reaction with the glass. The dissolution rates were obtained by dividing
the weight loss by the surface areas and the immersion time. The pH values of the
solutions were measured by the Accumet pH meter AR25. For accuracy, each dissolution
experiment was repeated.
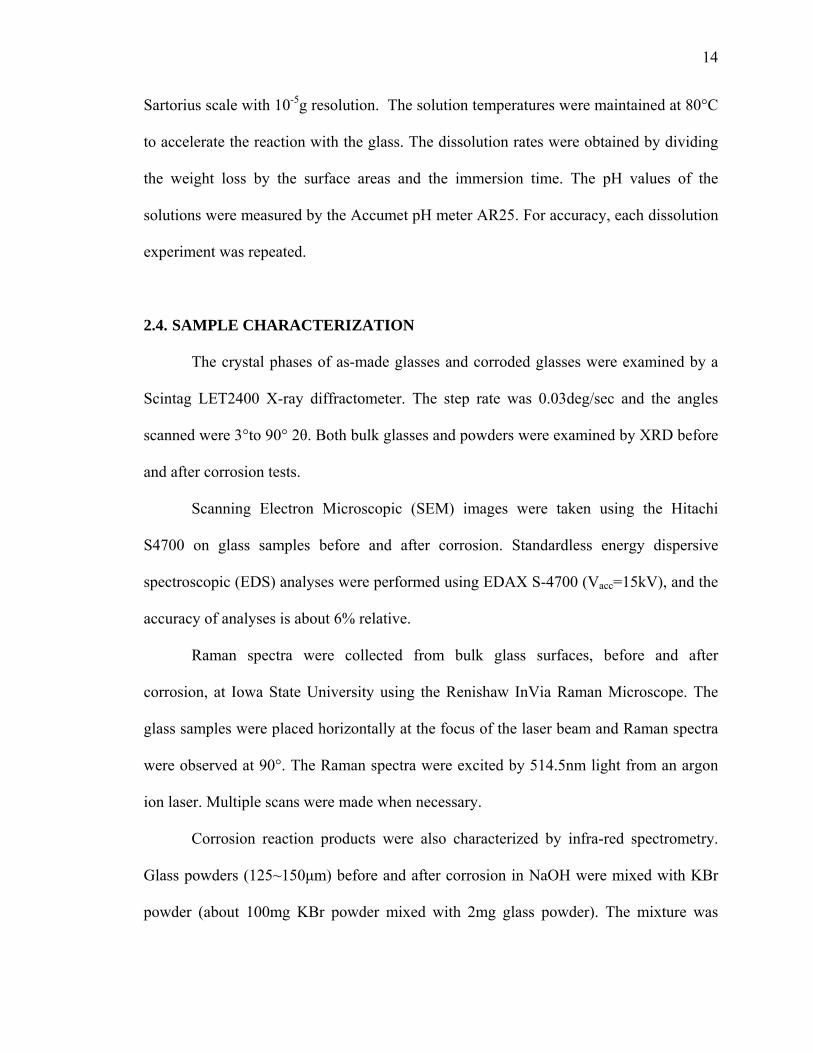
2.4. SAMPLE CHARACTERIZATION
The crystal phases of as-made glasses and corroded glasses were examined by a
Scintag LET2400 X-ray diffractometer. The step rate was 0.03deg/sec and the angles
scanned were 3°to 90° 2θ. Both bulk glasses and powders were examined by XRD before
and after corrosion tests.
Scanning Electron Microscopic (SEM) images were taken using the Hitachi
S4700 on glass samples before and after corrosion. Standardless energy dispersive
spectroscopic (EDS) analyses were performed using EDAX S-4700 (Vacc=15kV), and the
accuracy of analyses is about 6% relative.
Raman spectra were collected from bulk glass surfaces, before and after
corrosion, at Iowa State University using the Renishaw InVia Raman Microscope. The
glass samples were placed horizontally at the focus of the laser beam and Raman spectra
were observed at 90°. The Raman spectra were excited by 514.5nm light from an argon
ion laser. Multiple scans were made when necessary.
Corrosion reaction products were also characterized by infra-red spectrometry.
Glass powders (125~150μm) before and after corrosion in NaOH were mixed with KBr
powder (about 100mg KBr powder mixed with 2mg glass powder). The mixture was
15
pressed to form a disk (~1cm diameter) using Carver 22400-227 laboratory press. Infra-
red spectra were collected in the transmission mode using the Perkin Elmer 1760-x
spectrometer.
High Pressure Liquid Chromatography (HPLC) experiments were done to study
the phosphate anions released into solution [35]. NaOH solutions at different corrosion
times are filtered by ~0.2μm filter paper and later by an Altech IC-Chelate cation filter
cartridge to remove any additional free cations or particles. All the solutions were tested
either fresh or refrigerated at ~3°C to stabilize the distribution of phosphate chains in
solutions. The HPLC system is a modified Dionex ion chromatography system (AD25
detector and GP50 gradient pump). The effluents are 0.22M NaCl and 5mM EDTA and
the reagent stream consists of a 5:1 mixture of 5.7×10⁻³ M ammonium molybdate,
(NH4)6Mo7O24·4H2O, in 1.8 M H2SO4 and 0.05 M ascorbic acid containing 5 vol%
acetone. The NaCl solution concentration is progressively ramped from 5mM to 0.53mM
molar after the sample injection, which causes the phosphate chains to systematically
release form the column from shortest to longest. The sample stream then reacts with
reagent in a custom built 10 meter long Teflon reaction coil at 150°C to form a blue
solution which passes through a UV-VIS spectrometer and absorbance is measured at
660nm. Using a series of standard solutions and Beer’s Law, a calibration curve relating
peak area is to PO4 concentration was determined.
16
3. RESULTS
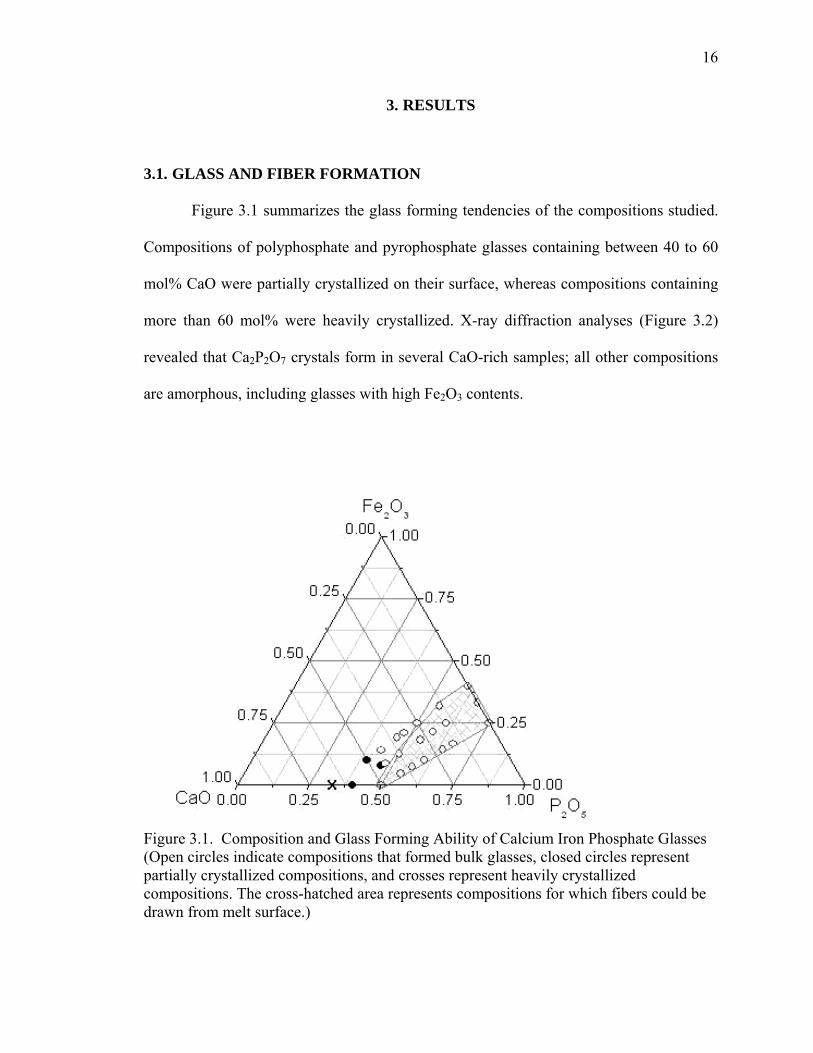
3.1. GLASS AND FIBER FORMATION
Figure 3.1 summarizes the glass forming tendencies of the compositions studied.
Compositions of polyphosphate and pyrophosphate glasses containing between 40 to 60
mol% CaO were partially crystallized on their surface, whereas compositions containing
more than 60 mol% were heavily crystallized. X-ray diffraction analyses (Figure 3.2)
revealed that Ca2P2O7 crystals form in several CaO-rich samples; all other compositions
are amorphous, including glasses with high Fe2O3 contents.
Figure 3.1. Composition and Glass Forming Ability of Calcium Iron Phosphate Glasses (Open circles indicate compositions that formed bulk glasses, closed circles represent partially crystallized compositions, and crosses represent heavily crystallized compositions. The cross-hatched area represents compositions for which fibers could be drawn from melt surface.)
17
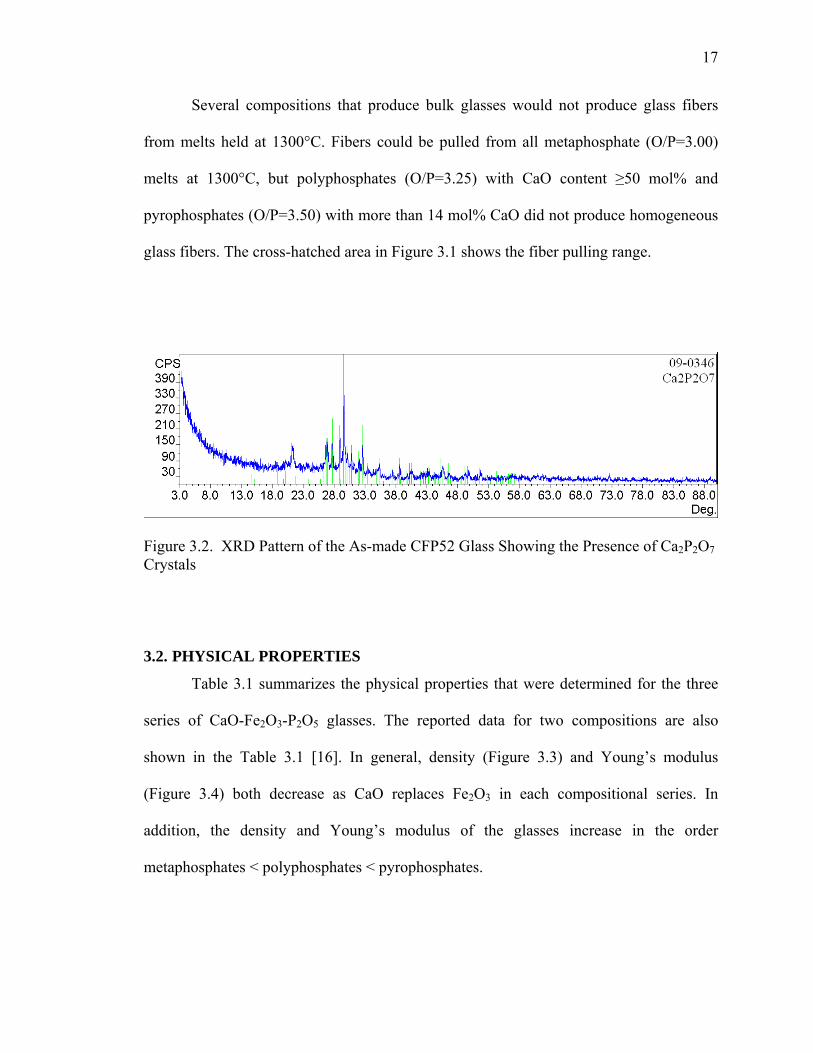
Several compositions that produce bulk glasses would not produce glass fibers
from melts held at 1300°C. Fibers could be pulled from all metaphosphate (O/P=3.00)
melts at 1300°C, but polyphosphates (O/P=3.25) with CaO content ≥50 mol% and
pyrophosphates (O/P=3.50) with more than 14 mol% CaO did not produce homogeneous
glass fibers. The cross-hatched area in Figure 3.1 shows the fiber pulling range.
Figure 3.2. XRD Pattern of the As-made CFP52 Glass Showing the Presence of Ca2P2O7 Crystals
3.2. PHYSICAL PROPERTIES
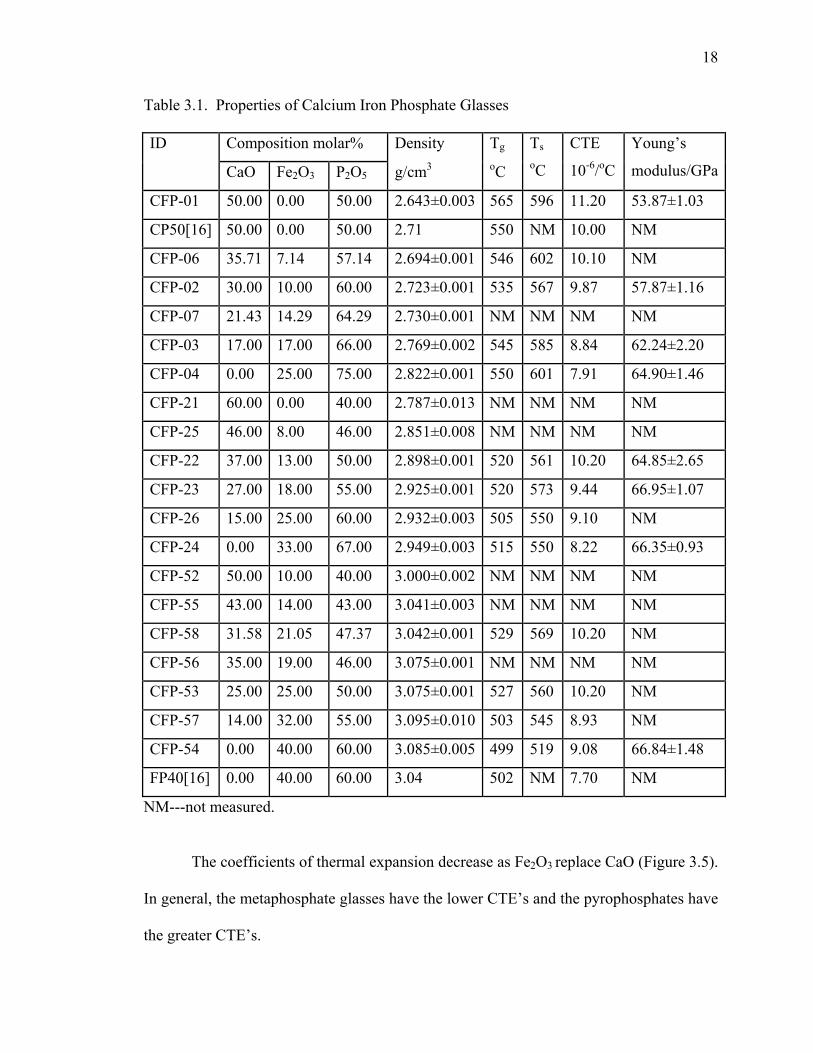
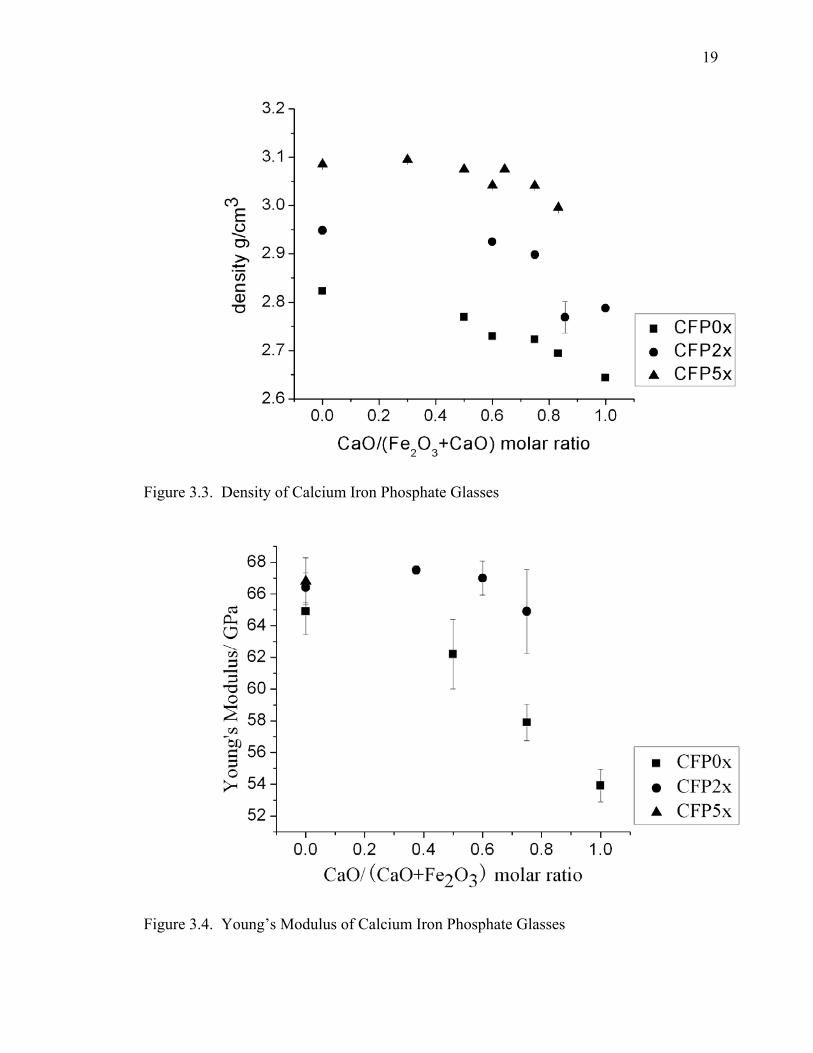
Table 3.1 summarizes the physical properties that were determined for the three
series of CaO-Fe2O3-P2O5 glasses. The reported data for two compositions are also
shown in the Table 3.1 [16]. In general, density (Figure 3.3) and Young’s modulus
(Figure 3.4) both decrease as CaO replaces Fe2O3 in each compositional series. In
addition, the density and Young’s modulus of the glasses increase in the order
metaphosphates < polyphosphates < pyrophosphates.
18
Table 3.1. Properties of Calcium Iron Phosphate Glasses
ID Composition molar% Density Tg Ts
oC
CTE
10-6/oC
Young’s
modulus/GPaCaO Fe2O3 P2O5 g/cm3 oC
CFP-01 50.00 0.00 50.00 2.643±0.003 565 596 11.20 53.87±1.03
CP50[16] 50.00 0.00 50.00 2.71 550 NM 10.00 NM
CFP-06 35.71 7.14 57.14 2.694±0.001 546 602 10.10 NM
CFP-02 30.00 10.00 60.00 2.723±0.001 535 567 9.87 57.87±1.16
CFP-07 21.43 14.29 64.29 2.730±0.001 NM NM NM NM
CFP-03 17.00 17.00 66.00 2.769±0.002 545 585 8.84 62.24±2.20
CFP-04 0.00 25.00 75.00 2.822±0.001 550 601 7.91 64.90±1.46
CFP-21 60.00 0.00 40.00 2.787±0.013 NM NM NM NM
CFP-25 46.00 8.00 46.00 2.851±0.008 NM NM NM NM
CFP-22 37.00 13.00 50.00 2.898±0.001 520 561 10.20 64.85±2.65
CFP-23 27.00 18.00 55.00 2.925±0.001 520 573 9.44 66.95±1.07
CFP-26 15.00 25.00 60.00 2.932±0.003 505 550 9.10 NM
CFP-24 0.00 33.00 67.00 2.949±0.003 515 550 8.22 66.35±0.93
CFP-52 50.00 10.00 40.00 3.000±0.002 NM NM NM NM
CFP-55 43.00 14.00 43.00 3.041±0.003 NM NM NM NM
CFP-58 31.58 21.05 47.37 3.042±0.001 529 569 10.20 NM
CFP-56 35.00 19.00 46.00 3.075±0.001 NM NM NM NM
CFP-53 25.00 25.00 50.00 3.075±0.001 527 560 10.20 NM
CFP-57 14.00 32.00 55.00 3.095±0.010 503 545 8.93 NM
CFP-54 0.00 40.00 60.00 3.085±0.005 499 519 9.08 66.84±1.48
FP40[16] 0.00 40.00 60.00 3.04 502 NM 7.70 NM
NM---not measured.
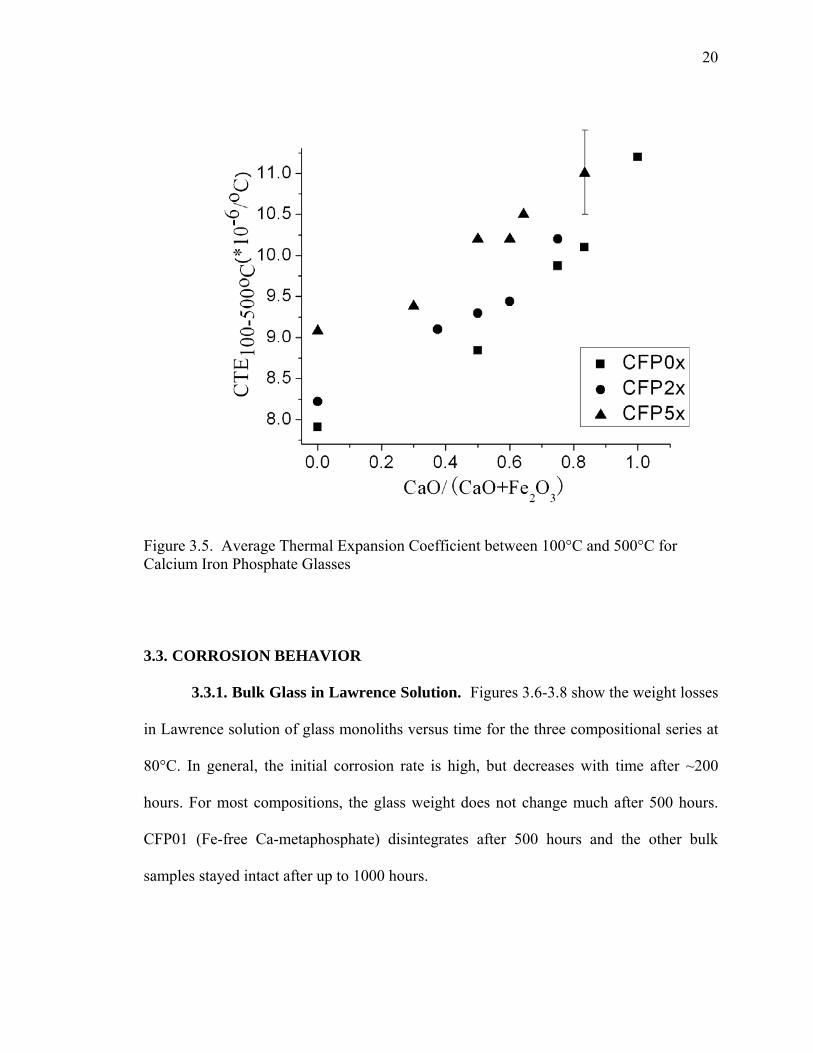
The coefficients of thermal expansion decrease as Fe2O3 replace CaO (Figure 3.5).
In general, the metaphosphate glasses have the lower CTE’s and the pyrophosphates have
the greater CTE’s.
19
Figure 3.3. Density of Calcium Iron Phosphate Glasses
Figure 3.4. Young’s Modulus of Calcium Iron Phosphate Glasses
20
Figure 3.5. Average Thermal Expansion Coefficient between 100°C and 500°C for Calcium Iron Phosphate Glasses
3.3. CORROSION BEHAVIOR
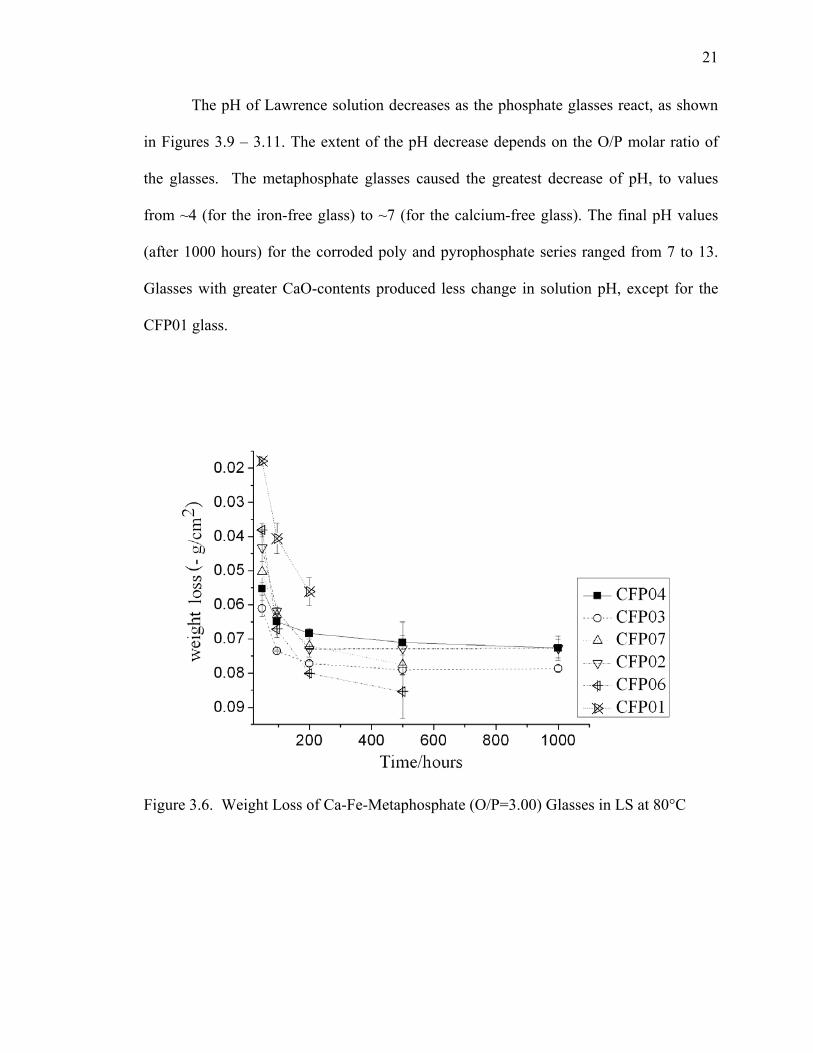
3.3.1. Bulk Glass in Lawrence Solution. Figures 3.6-3.8 show the weight losses
in Lawrence solution of glass monoliths versus time for the three compositional series at
80°C. In general, the initial corrosion rate is high, but decreases with time after ~200
hours. For most compositions, the glass weight does not change much after 500 hours.
CFP01 (Fe-free Ca-metaphosphate) disintegrates after 500 hours and the other bulk
samples stayed intact after up to 1000 hours.
21
The pH of Lawrence solution decreases as the phosphate glasses react, as shown
in Figures 3.9 – 3.11. The extent of the pH decrease depends on the O/P molar ratio of
the glasses. The metaphosphate glasses caused the greatest decrease of pH, to values
from ~4 (for the iron-free glass) to ~7 (for the calcium-free glass). The final pH values
(after 1000 hours) for the corroded poly and pyrophosphate series ranged from 7 to 13.
Glasses with greater CaO-contents produced less change in solution pH, except for the
CFP01 glass.
Figure 3.6. Weight Loss of Ca-Fe-Metaphosphate (O/P=3.00) Glasses in LS at 80°C
22
Figure 3.7. Weight Loss of Ca-Fe-Polyphosphate (O/P=3.25) Glasses in LS at 80°C
Figure 3.8. Weight Loss of Ca-Fe-pyrophosphate (O/P=3.5) Glasses in LS at 80°C
23
Figure 3.9. Change of Lawrence Solution pH with Corrosion Time for Ca-Fe-metaphosphate (O/P=3.00) Glasses at 80°C
Figure 3.10. Change of Lawrence Solution pH with Corrosion Time for Ca-Fe-polyphosphate (O/P=3.25) Glasses at 80°C
24
Figure 3.11. Change of Lawrence Solution pH with Corrosion Time for Ca-Fe-pyrophosphate (O/P=3.50) Glasses at 80°C
After corrosion in LS solution for 500 hours at 80oC, CFP01 glass disintegrated
and formed CaHPO4 crystals (Figure 3.12); other glass compositions formed
Ca5(PO4)3OH crystals (Figure 3.13), except for CFP04 which remained amorphous.
Polyphosphate glasses with 21mol% to 44mol% CaO and pyrophosphate with 25mol% to
32mol% CaO also formed Ca5(PO4)3OH crystals on their corroded surface. CFP21 and
CFP52 glasses still have Ca2P2O7 crystals on their surface after exposure to Lawrence
solutions, and the intensity of the XRD peak is greater than what was formed for the as-
made glass (Figure 3.2).
The Raman spectra of several as-made glasses and the corresponding surface
corrosion products after reacting in LS solution for 1000 hours at 80oC are shown in
Figures 3.14 – 3.16. Several compositions have distinctively different spectra after 1000
25
hours on test, these are identified as “type A” and “type B” spots. In the figures, the band
at 1180 cm-1 can be assigned to symmetric PO2 stretch on Q2 tetrahedra. The vibration at
760 cm-1 is due to the symmetric stretch of P-O-P bridge, and the peak at 950 cm-1 is due
to the symmetric PO4 stretch on Q0 tetrahedra. The shoulder at 1050 cm-1 can be
assigned to symmetric PO3 stretch on Q1 tetrahedra [19]. The symmetric PO2 stretch peak
for Q2 tetrahedra of all metaphosphate glasses either disappeared or is diminished after
corrosion tests. The symmetric stretch of the P-O-P bridge diminished for glasses CFP02,
CFP03 and CFP04 after corrosion. CFP01 glass formed PO4 orthophosphates after
corrosion, while other metaphosphate glasses formed pyrophosphates.
As for pyrophosphate glasses, the symmetric PO3 stretch peak intensity for Q1
tetrahedra decreased after corrosion and the sharp peak of the symmetric PO4 stretch on
Q0 tetrahedra appears. The latter peak corresponds to the orthophosphate crystal phases
identified by XRD. All the pyrophosphate glasses formed sharp Q0 tetrahedra after
corrosion, regardless of calcium oxide to iron oxide concentration ratio.
Figure 3.12. XRD Result for CFP01 Glass after Reacting in LS at 80°C for 500 Hours
26
Figure 3.13. XRD Result for CFP58 Glass after Reacting in LS at 80°C for 500 Hours
Figure 3.14. Raman Spectra of CFP02 Glass before and after Immersion in LS for 1000 Hours at 80°C
27
Figure 3.15. Raman Spectra of CFP04 Glass before and after Immersion in LS for 1000 Hours at 80°C
Figure 3.16. Raman Spectra of CFP53 Glass before and after Immersion in LS for 1000 Hours at 80°C
28
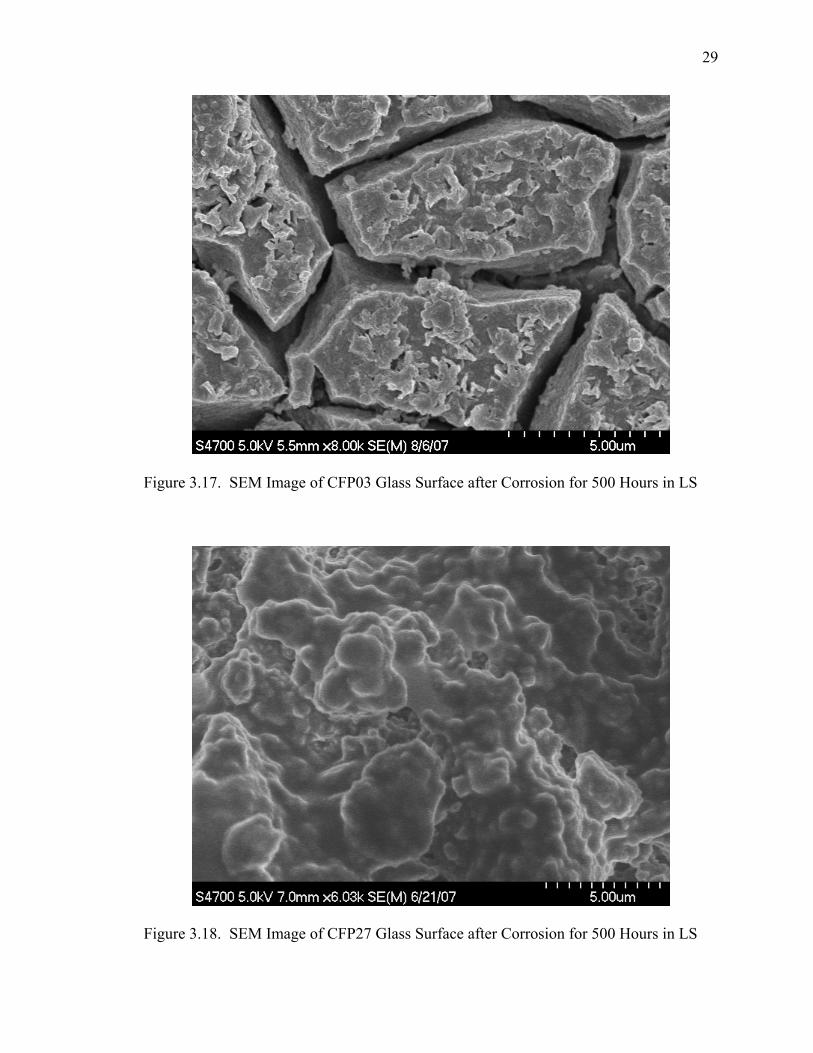
SEM images of the surfaces of selected compositions after LS corrosion tests for
500 hours are shown in Figures 3.17 – 3.20. The surface of the metaphosphate glass
CFP03 is covered by a thick reaction product (Figure 3.17). Pyrophosphate CFP27
surface has a different appearance (Figure 3.18). The surface of the high iron oxide
content pyrophosphate CFP53 is crowded with small particles (Figure 3.19), while the
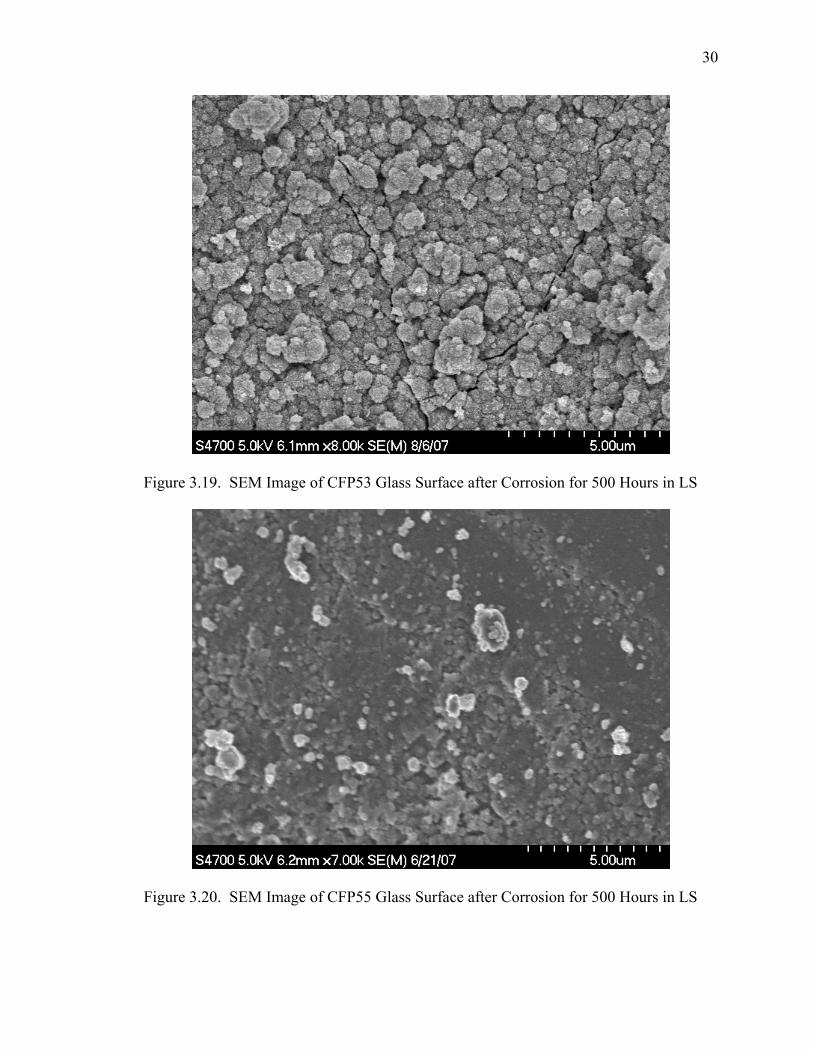
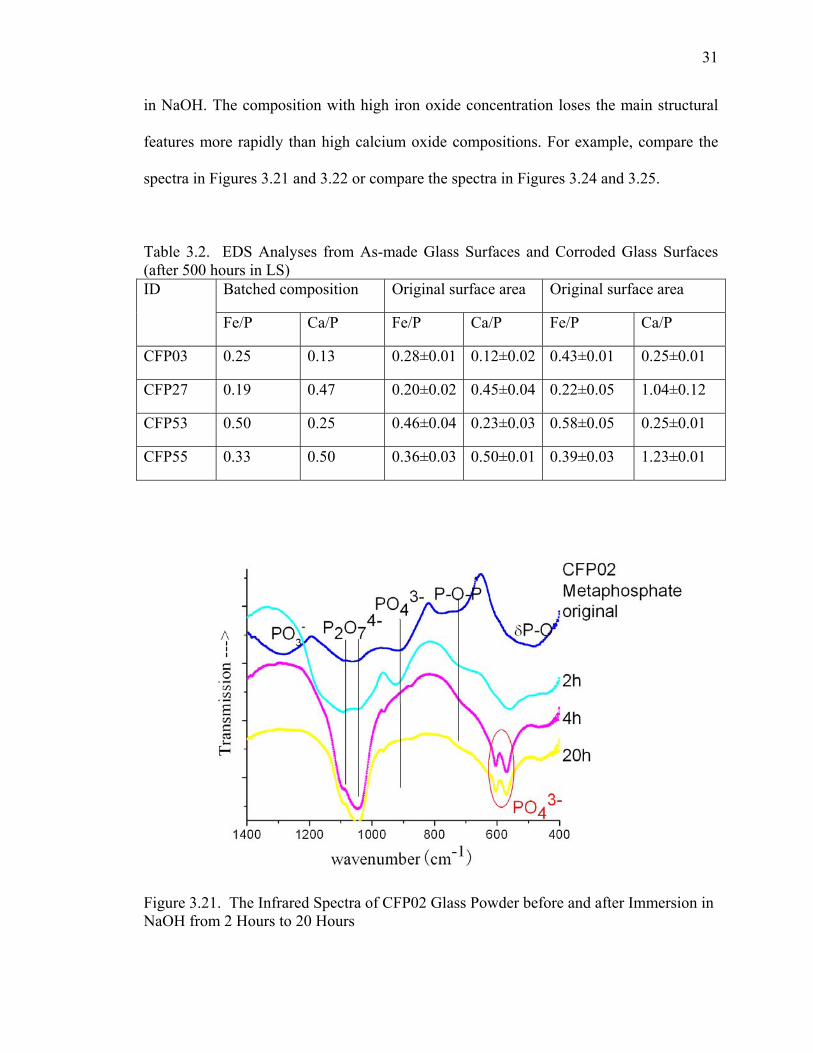
CFP55 surface seems to be selectively attacked (Figure 3.20).
EDS spectra were collected from several spots on each surface area of these
samples and these results are summarized in Table 3.2. The analyzed compositions of the
fresh glasses are consistent with the batched compositions of each sample. For the
metaphosphate CFP03, both Ca/P and Fe/P atom ratios increase when the corroded
surface is compared to the as-made surface. For the polyphosphate CFP27 and for the
pyrophosphate CFP55, the Ca/P ratios on the corroded surfaces are greater than on the as-
made surfaces, whereas the Fe/P ratio on the surface of the “high Fe2O3” pyrophosphate
CFP53 is increased after corrosion.
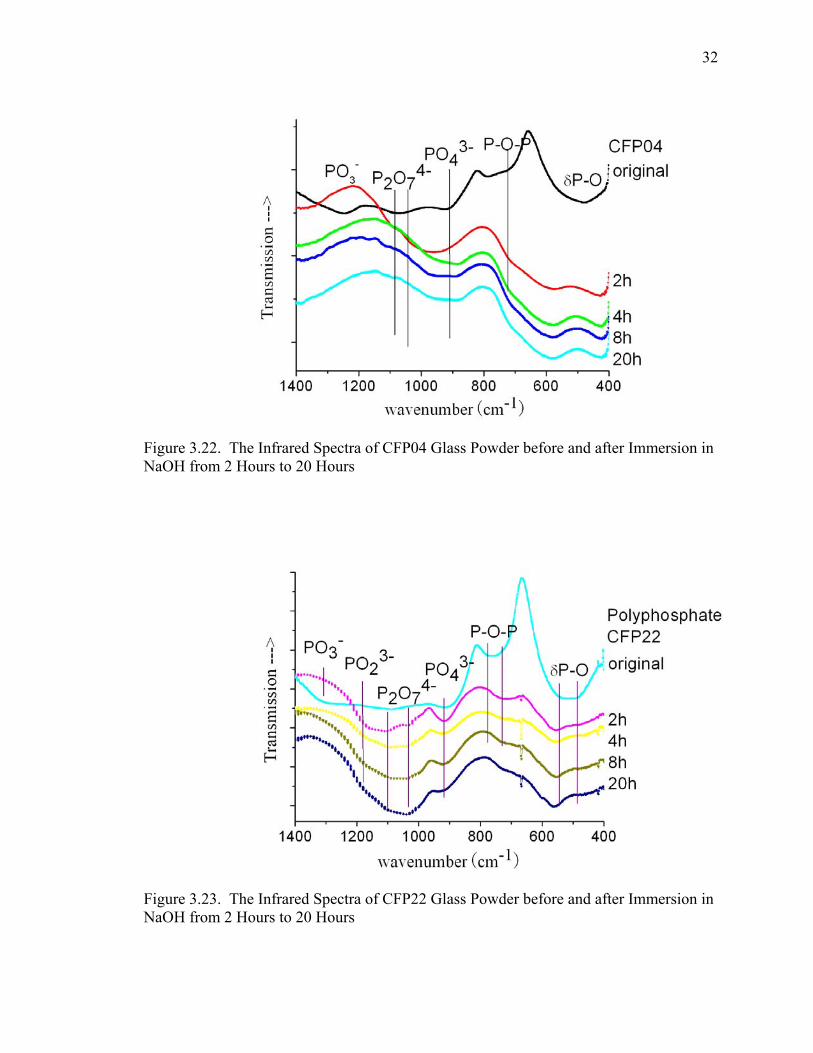
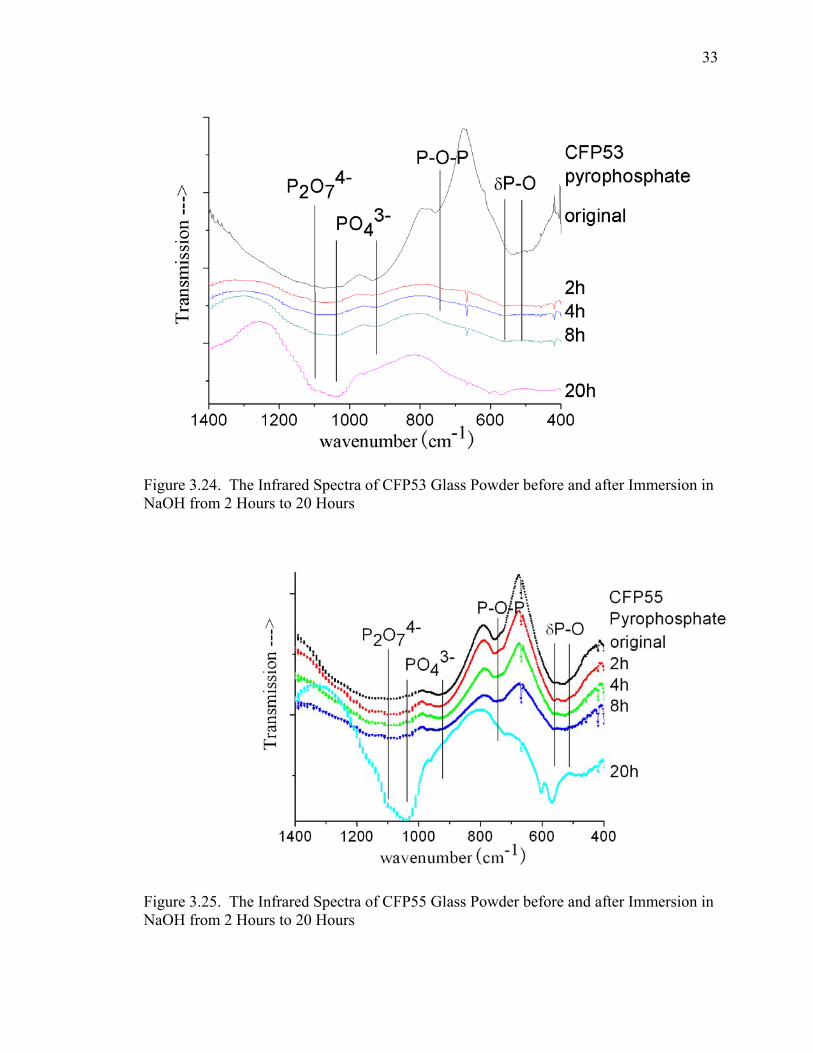
3.3.2. Glass Powder in NaOH Solution. Figures 3.21 to 3.25 show
representative FT-IR spectra for the phosphate glass powders after reacting in NaOH
(0.1mol/L, pH=13, 80°C) from 0 hours up to 20 hours. The absorption band centered at
1280cm-1 is due to the (PO3) - units and the band around 1090 cm-1 corresponds to P2O74-
units. In addition, the PO43- anions are assigned to the band around 932 cm-1 and the
symmetric stretching of P-O-P units are assigned to the bands at 745 cm-1. Bands at 550
cm-1 are due to asymmetric P-O stretching modes [22, 36]. For both metaphosphate and
pyrophosphate glasses, the compositions with high calcium oxide concentration have
much greater tendency to form PO43- and P2O7
4- surface species after 20 hours corrosion
29
Figure 3.17. SEM Image of CFP03 Glass Surface after Corrosion for 500 Hours in LS
Figure 3.18. SEM Image of CFP27 Glass Surface after Corrosion for 500 Hours in LS
30
Figure 3.19. SEM Image of CFP53 Glass Surface after Corrosion for 500 Hours in LS
Figure 3.20. SEM Image of CFP55 Glass Surface after Corrosion for 500 Hours in LS
31
in NaOH. The composition with high iron oxide concentration loses the main structural
features more rapidly than high calcium oxide compositions. For example, compare the
spectra in Figures 3.21 and 3.22 or compare the spectra in Figures 3.24 and 3.25.
Table 3.2. EDS Analyses from As-made Glass Surfaces and Corroded Glass Surfaces (after 500 hours in LS) ID Batched composition Original surface area Original surface area
Fe/P Ca/P Fe/P Ca/P Fe/P Ca/P
CFP03 0.25 0.13 0.28±0.01 0.12±0.02 0.43±0.01 0.25±0.01
CFP27 0.19 0.47 0.20±0.02 0.45±0.04 0.22±0.05 1.04±0.12
CFP53 0.50 0.25 0.46±0.04 0.23±0.03 0.58±0.05 0.25±0.01
CFP55 0.33 0.50 0.36±0.03 0.50±0.01 0.39±0.03 1.23±0.01
Figure 3.21. The Infrared Spectra of CFP02 Glass Powder before and after Immersion in NaOH from 2 Hours to 20 Hours
32
Figure 3.22. The Infrared Spectra of CFP04 Glass Powder before and after Immersion in NaOH from 2 Hours to 20 Hours
Figure 3.23. The Infrared Spectra of CFP22 Glass Powder before and after Immersion in NaOH from 2 Hours to 20 Hours
33
Figure 3.24. The Infrared Spectra of CFP53 Glass Powder before and after Immersion in NaOH from 2 Hours to 20 Hours
Figure 3.25. The Infrared Spectra of CFP55 Glass Powder before and after Immersion in NaOH from 2 Hours to 20 Hours
34
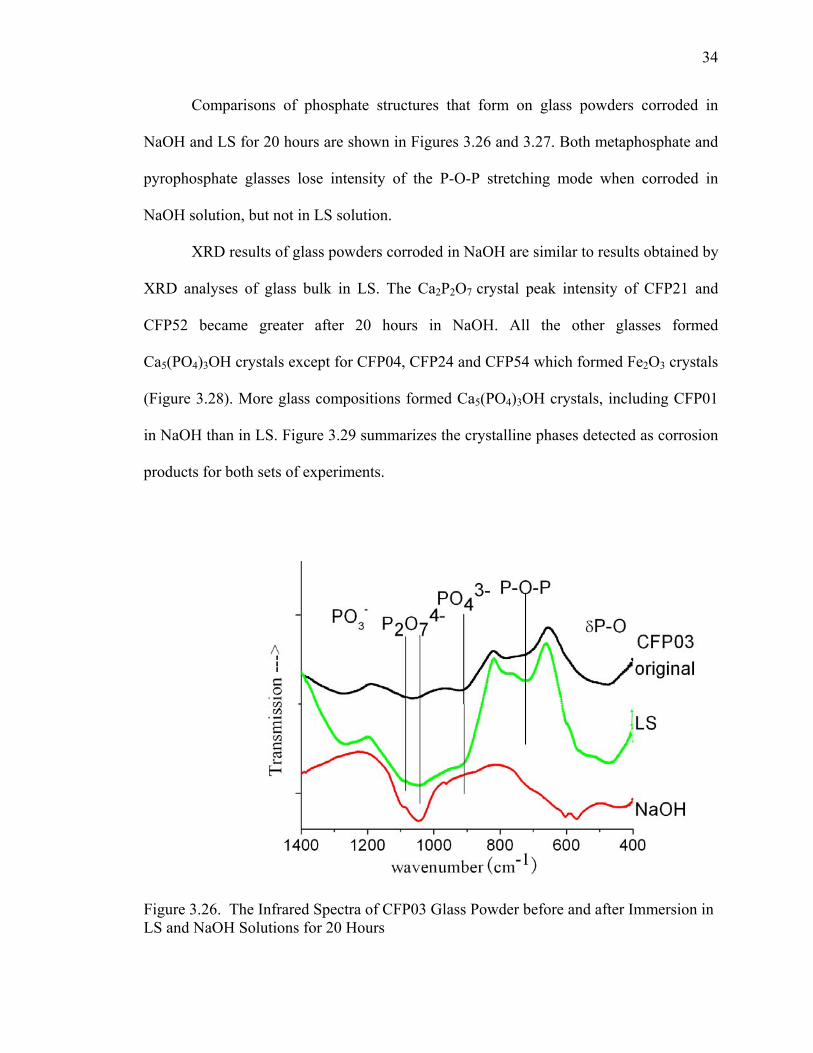
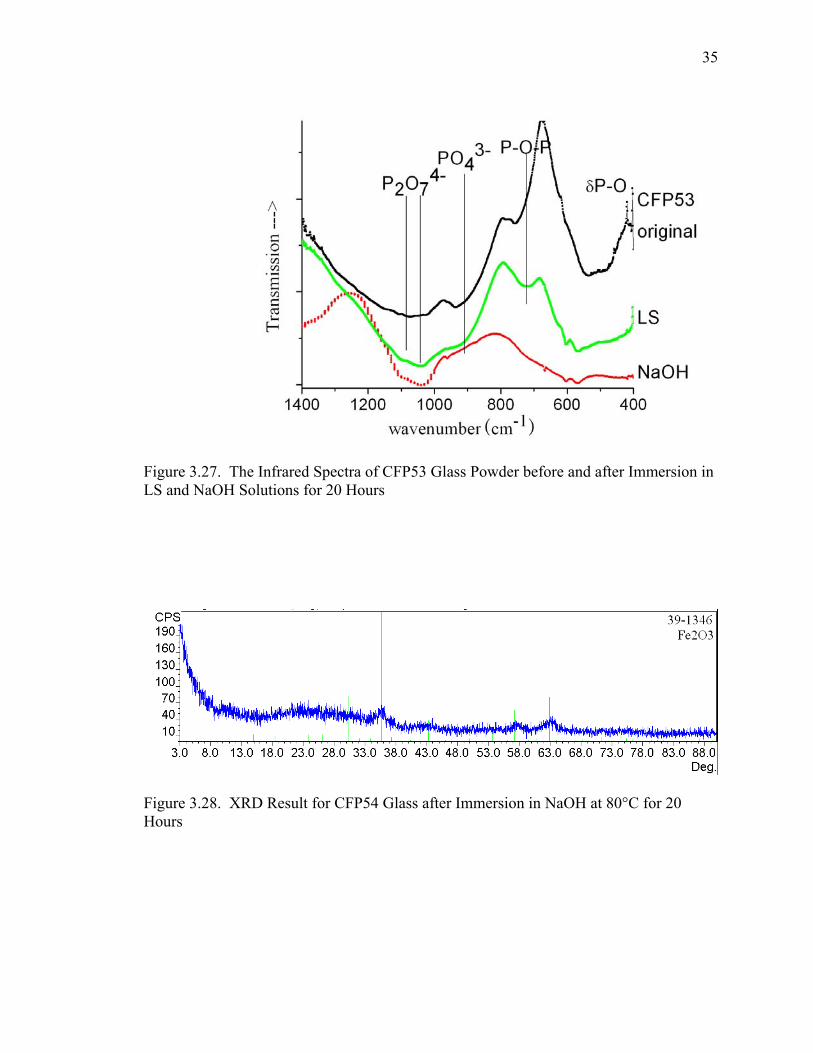
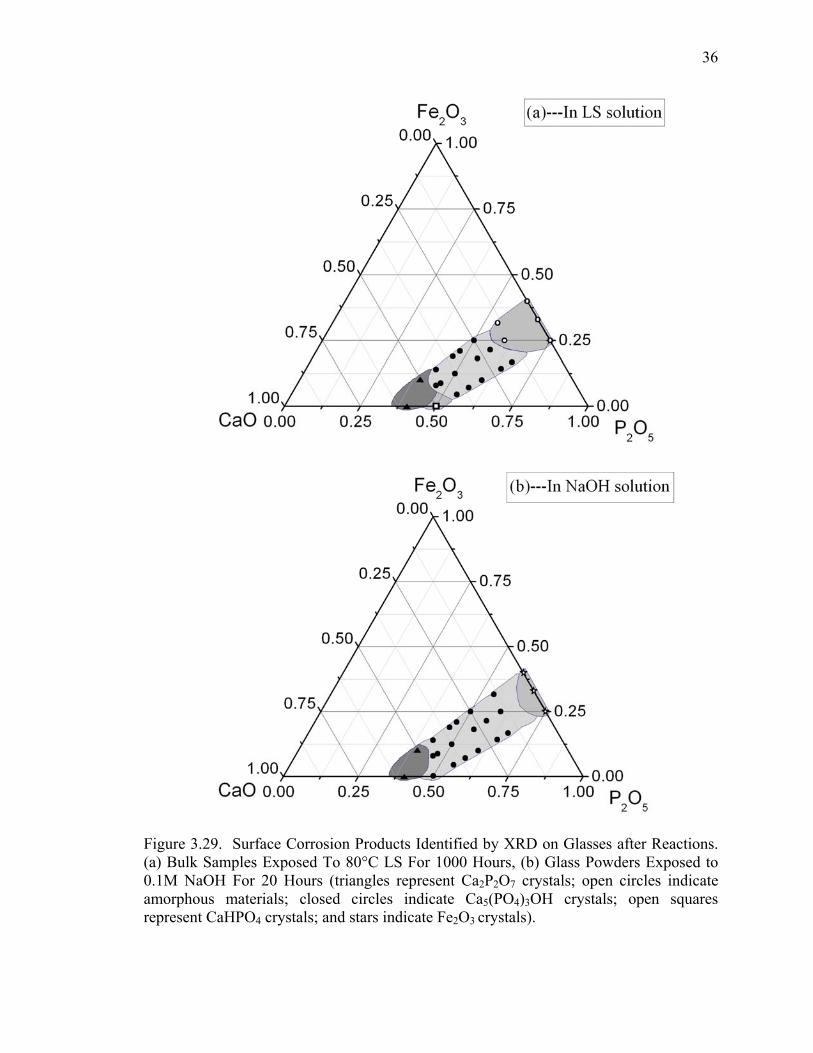
Comparisons of phosphate structures that form on glass powders corroded in
NaOH and LS for 20 hours are shown in Figures 3.26 and 3.27. Both metaphosphate and
pyrophosphate glasses lose intensity of the P-O-P stretching mode when corroded in
NaOH solution, but not in LS solution.
XRD results of glass powders corroded in NaOH are similar to results obtained by
XRD analyses of glass bulk in LS. The Ca2P2O7 crystal peak intensity of CFP21 and
CFP52 became greater after 20 hours in NaOH. All the other glasses formed
Ca5(PO4)3OH crystals except for CFP04, CFP24 and CFP54 which formed Fe2O3 crystals
(Figure 3.28). More glass compositions formed Ca5(PO4)3OH crystals, including CFP01
in NaOH than in LS. Figure 3.29 summarizes the crystalline phases detected as corrosion
products for both sets of experiments.
Figure 3.26. The Infrared Spectra of CFP03 Glass Powder before and after Immersion in LS and NaOH Solutions for 20 Hours
35
Figure 3.27. The Infrared Spectra of CFP53 Glass Powder before and after Immersion in LS and NaOH Solutions for 20 Hours
Figure 3.28. XRD Result for CFP54 Glass after Immersion in NaOH at 80°C for 20 Hours
36
Figure 3.29. Surface Corrosion Products Identified by XRD on Glasses after Reactions. (a) Bulk Samples Exposed To 80°C LS For 1000 Hours, (b) Glass Powders Exposed to 0.1M NaOH For 20 Hours (triangles represent Ca2P2O7 crystals; open circles indicate amorphous materials; closed circles indicate Ca5(PO4)3OH crystals; open squares represent CaHPO4 crystals; and stars indicate Fe2O3 crystals).
37
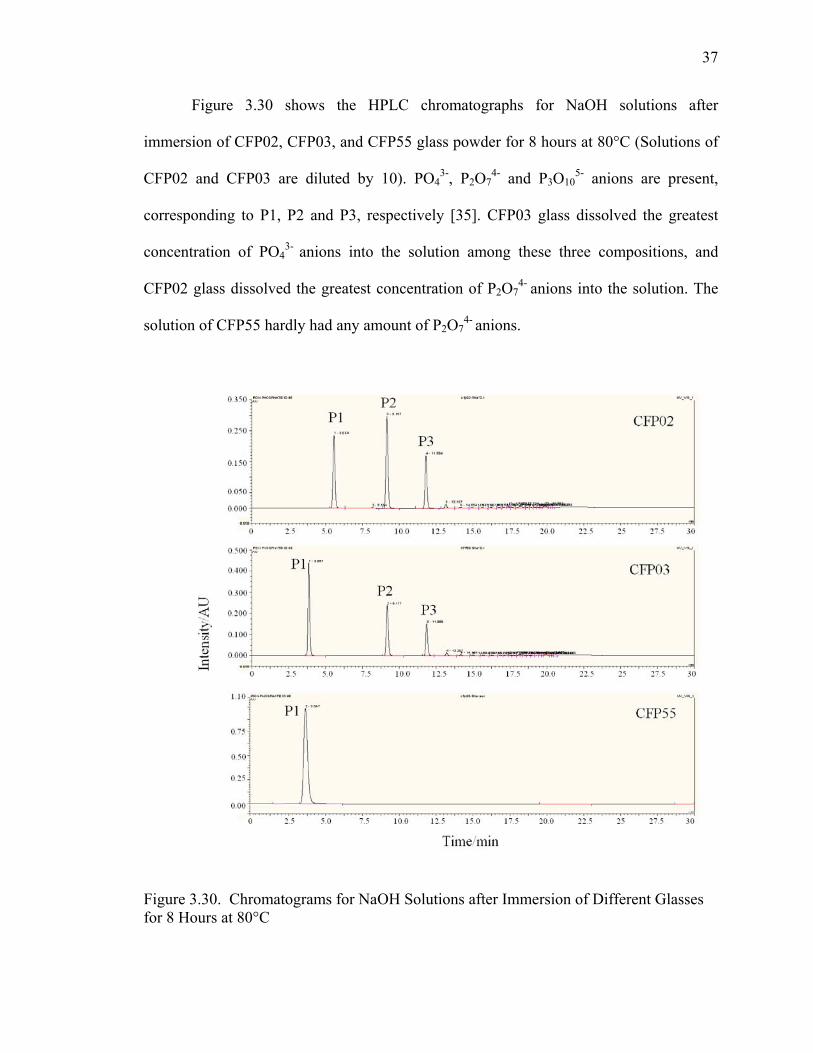
Figure 3.30 shows the HPLC chromatographs for NaOH solutions after
immersion of CFP02, CFP03, and CFP55 glass powder for 8 hours at 80°C (Solutions of
CFP02 and CFP03 are diluted by 10). PO43-, P2O7
4- and P3O105- anions are present,
corresponding to P1, P2 and P3, respectively [35]. CFP03 glass dissolved the greatest
concentration of PO43- anions into the solution among these three compositions, and
CFP02 glass dissolved the greatest concentration of P2O74- anions into the solution. The
solution of CFP55 hardly had any amount of P2O74- anions.
Figure 3.30. Chromatograms for NaOH Solutions after Immersion of Different Glasses for 8 Hours at 80°C
38
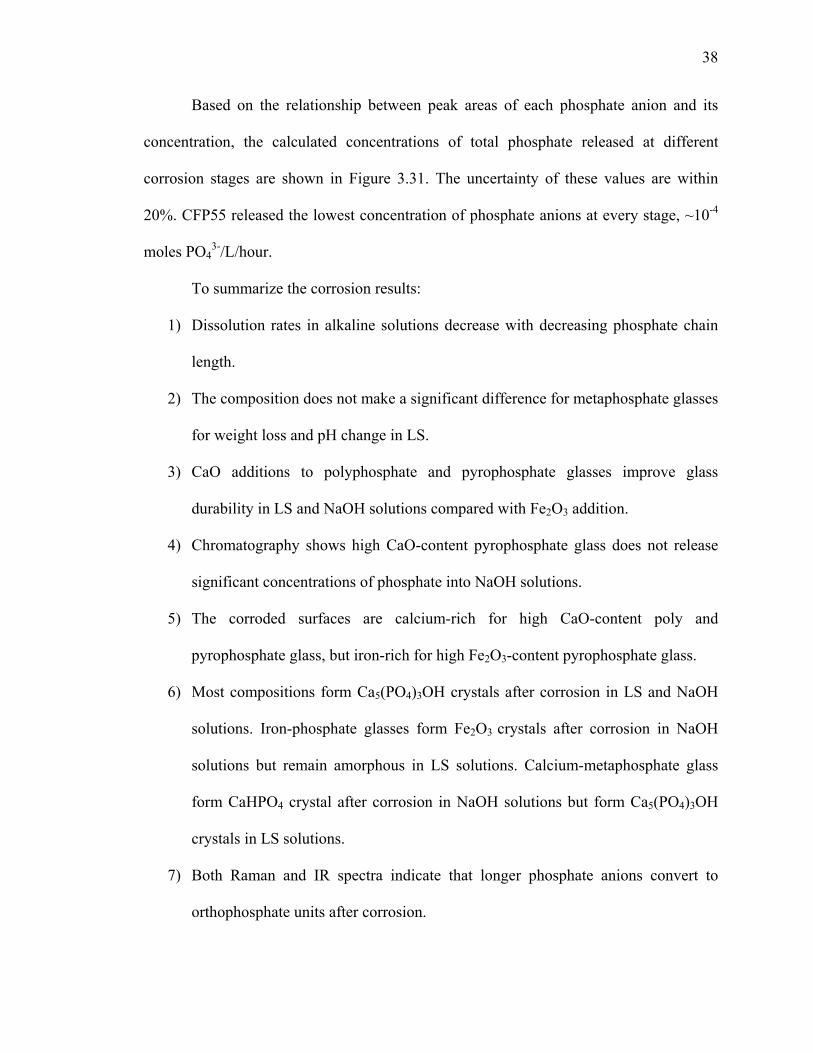
Based on the relationship between peak areas of each phosphate anion and its
concentration, the calculated concentrations of total phosphate released at different
corrosion stages are shown in Figure 3.31. The uncertainty of these values are within
20%. CFP55 released the lowest concentration of phosphate anions at every stage, ~10-4
moles PO43-/L/hour.
To summarize the corrosion results:
1) Dissolution rates in alkaline solutions decrease with decreasing phosphate chain
length.
2) The composition does not make a significant difference for metaphosphate glasses
for weight loss and pH change in LS.
3) CaO additions to polyphosphate and pyrophosphate glasses improve glass
durability in LS and NaOH solutions compared with Fe2O3 addition.
4) Chromatography shows high CaO-content pyrophosphate glass does not release
significant concentrations of phosphate into NaOH solutions.
5) The corroded surfaces are calcium-rich for high CaO-content poly and
pyrophosphate glass, but iron-rich for high Fe2O3-content pyrophosphate glass.
6) Most compositions form Ca5(PO4)3OH crystals after corrosion in LS and NaOH
solutions. Iron-phosphate glasses form Fe2O3 crystals after corrosion in NaOH
solutions but remain amorphous in LS solutions. Calcium-metaphosphate glass
form CaHPO4 crystal after corrosion in NaOH solutions but form Ca5(PO4)3OH
crystals in LS solutions.
7) Both Raman and IR spectra indicate that longer phosphate anions convert to
orthophosphate units after corrosion.
39
Figure 3.31. Total Concentration of Phosphate Released into NaOH Solution at 80 °C
40
4. DISCUSSION
4.1. PROPERTIES
4.1.1. Glass Formation. The XRD analyses of bulk samples showed that all of
the compositions have good glass forming ability expect for glasses CFP21 and CFP52
which formed Ca2P2O7 crystals upon quenching. This confirms Meadoweroft’s theory
that ease of formation of monovalent and divalent phosphate glasses could be related to
the heat of formation of the solid glass [12, 14]. Because the heat of formation of iron
phosphate (14 kJ/mol·atoms) is lower than that of calcium phosphate (55 kJ/mol·atoms),
the iron phosphate chains would distribute more broadly, and Fe2O3-rich glasses would
form more easily [12]. In addition, these results confirm the previous research that the
glass formation tendency decreases with increasing O/P ratio [15].
4.1.2. Physical Properties. The density of a glass depends on molecular weight
and packing volume. From Figure 3.3, it is concluded that density increases as the length
of phosphate chains decreases. Compared with the CaO content, the Fe2O3 content will
decrease the thermal expansion as shown in Figure 3.5. This is consistent with the
previous research that found the addition of Fe2O3 leads to the formation of strong Fe-O-
P bonds, which make the phosphate network much tighter and more cross-linked as
shown in Figure 1.3 [4, 13, 37]. The iron additions can strengthen the cross-bonding
between the polyphosphate chains and strengthen the bonding of the ends of these chains
to the surrounding glass structure [5].
Figure 3.4 shows that iron oxide increases the Young’s modulus of the Ca-Fe-
phosphate glasses. This is similar to the effect on thermal expansion, in which iron
41
additions strengthen the cross bonding between the phosphate chains and the ends of
these chains to the surrounding glass structure.
4.2. CORROSION ANALYSIS
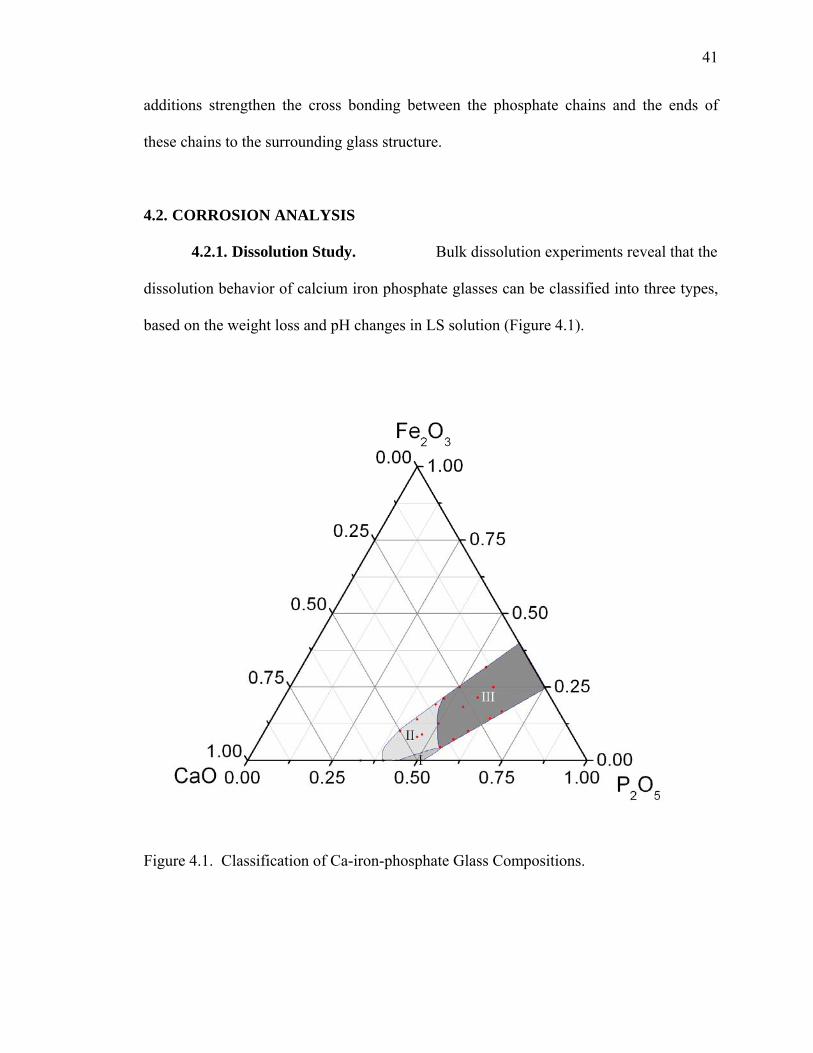
4.2.1. Dissolution Study. Bulk dissolution experiments reveal that the
dissolution behavior of calcium iron phosphate glasses can be classified into three types,
based on the weight loss and pH changes in LS solution (Figure 4.1).
Figure 4.1. Classification of Ca-iron-phosphate Glass Compositions.
42
The type I behavior is represented by the glass CFP01. This calcium phosphate
glass forms CaHPO4 crystals after 500 hours and the pH of solution decreases to as low
as 4. (In NaOH solutions, CFP01 powders formed Ca5(PO4)3OH crystals after 20 hours.)
Type II glasses include the CaO-rich poly and pyrophosphate compositions.
These are relatively stable compositions. The weight losses after 500 hours corrosion in
LS are all less than 0.03g/cm2 and the pH of the LS does not change much (< 1.5 units)
except for CFP21. CFP27 glass formed Ca5(PO4)3OH crystals on its surface, and CFP21
and CFP52 grew more Ca2P2O7 crystals.
The Fe2O3-rich poly and pyrophosphate glasses and Fe2O3-containing
Metaphosphate glasses exhibit type III corrosion behavior. The weight losses after 500
hours corrosion in LS are greater between 0.06g/cm2 to 0.09g/cm2, and the solution pH
dropped to ~7. The corrosion species on the glass surfaces were either Ca5(PO4)3OH
crystals or amorphous.
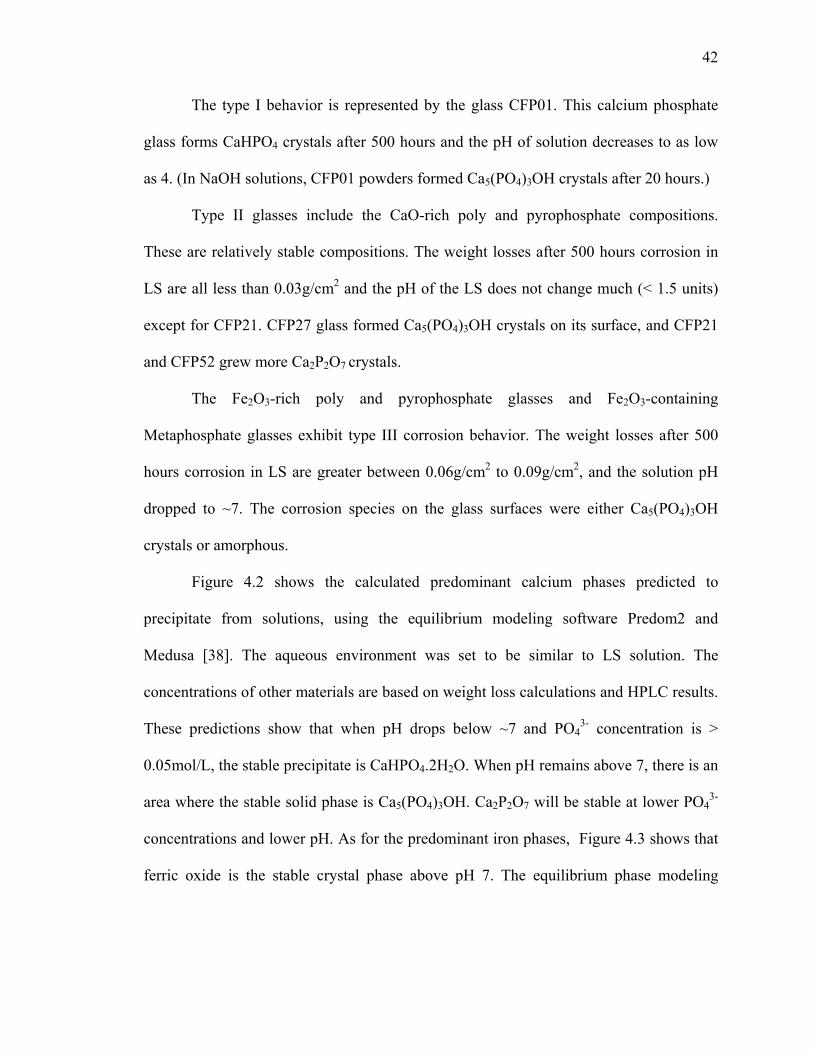
Figure 4.2 shows the calculated predominant calcium phases predicted to
precipitate from solutions, using the equilibrium modeling software Predom2 and
Medusa [38]. The aqueous environment was set to be similar to LS solution. The
concentrations of other materials are based on weight loss calculations and HPLC results.
These predictions show that when pH drops below ~7 and PO43- concentration is >
0.05mol/L, the stable precipitate is CaHPO4.2H2O. When pH remains above 7, there is an
area where the stable solid phase is Ca5(PO4)3OH. Ca2P2O7 will be stable at lower PO43-
concentrations and lower pH. As for the predominant iron phases, Figure 4.3 shows that
ferric oxide is the stable crystal phase above pH 7. The equilibrium phase modeling
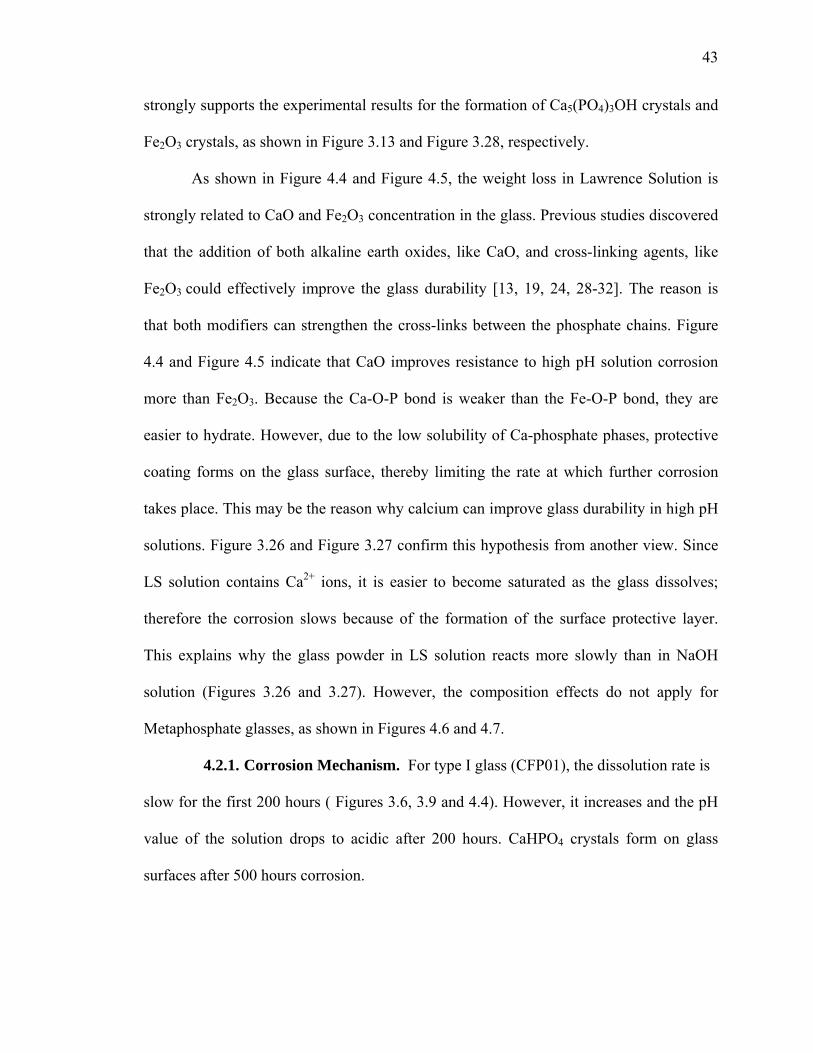
43
strongly supports the experimental results for the formation of Ca5(PO4)3OH crystals and
Fe2O3 crystals, as shown in Figure 3.13 and Figure 3.28, respectively.
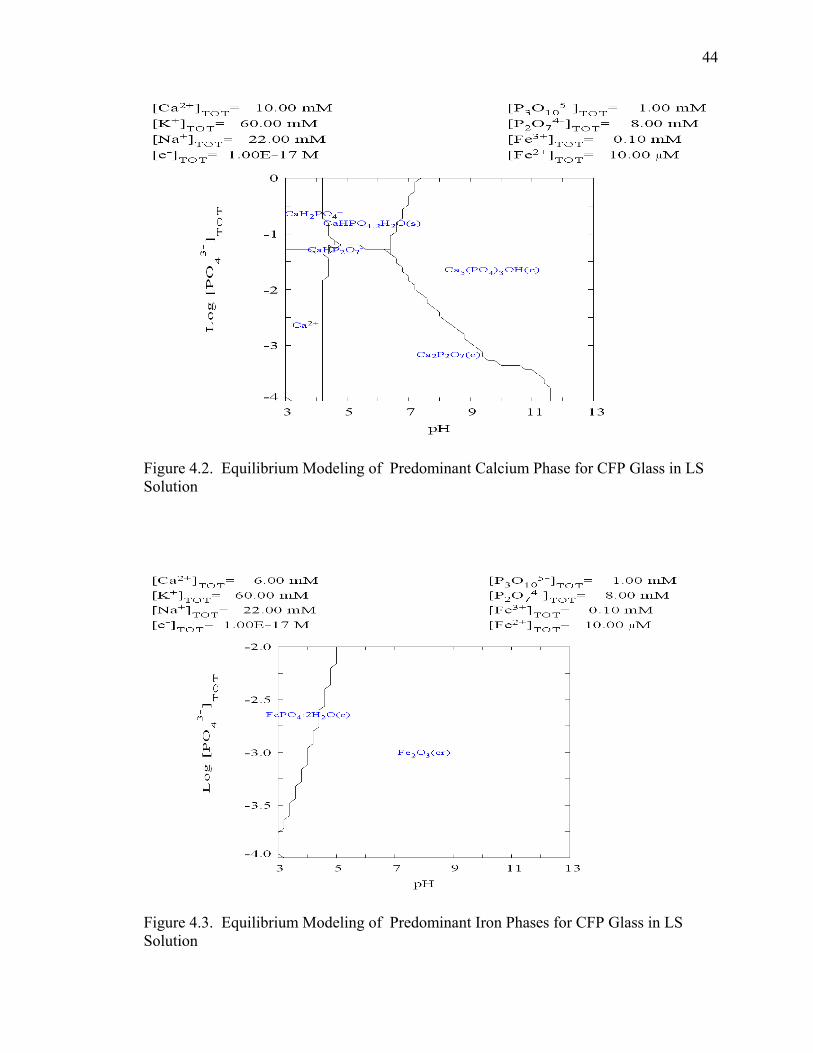
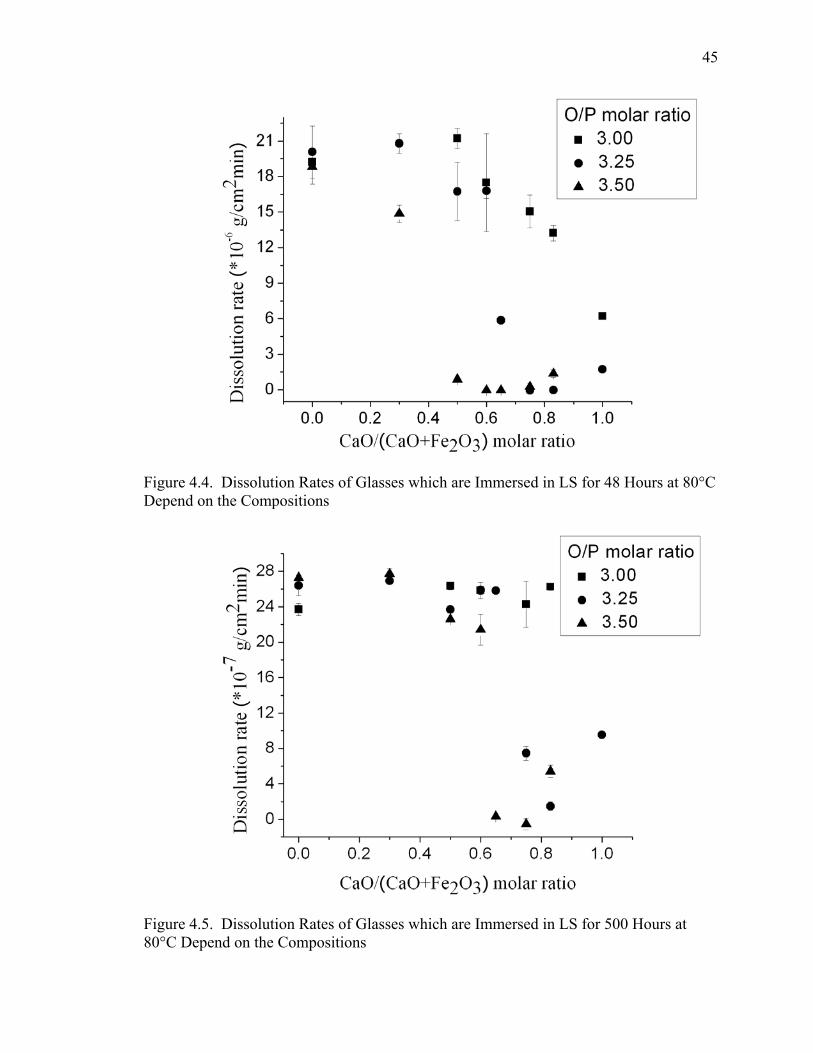
As shown in Figure 4.4 and Figure 4.5, the weight loss in Lawrence Solution is
strongly related to CaO and Fe2O3 concentration in the glass. Previous studies discovered
that the addition of both alkaline earth oxides, like CaO, and cross-linking agents, like
Fe2O3 could effectively improve the glass durability [13, 19, 24, 28-32]. The reason is
that both modifiers can strengthen the cross-links between the phosphate chains. Figure
4.4 and Figure 4.5 indicate that CaO improves resistance to high pH solution corrosion
more than Fe2O3. Because the Ca-O-P bond is weaker than the Fe-O-P bond, they are
easier to hydrate. However, due to the low solubility of Ca-phosphate phases, protective
coating forms on the glass surface, thereby limiting the rate at which further corrosion
takes place. This may be the reason why calcium can improve glass durability in high pH
solutions. Figure 3.26 and Figure 3.27 confirm this hypothesis from another view. Since
LS solution contains Ca2+ ions, it is easier to become saturated as the glass dissolves;
therefore the corrosion slows because of the formation of the surface protective layer.
This explains why the glass powder in LS solution reacts more slowly than in NaOH
solution (Figures 3.26 and 3.27). However, the composition effects do not apply for
Metaphosphate glasses, as shown in Figures 4.6 and 4.7.
4.2.1. Corrosion Mechanism. For type I glass (CFP01), the dissolution rate is
slow for the first 200 hours ( Figures 3.6, 3.9 and 4.4). However, it increases and the pH
value of the solution drops to acidic after 200 hours. CaHPO4 crystals form on glass
surfaces after 500 hours corrosion.
44
Figure 4.2. Equilibrium Modeling of Predominant Calcium Phase for CFP Glass in LS Solution
Figure 4.3. Equilibrium Modeling of Predominant Iron Phases for CFP Glass in LS Solution
45
Figure 4.4. Dissolution Rates of Glasses which are Immersed in LS for 48 Hours at 80°C Depend on the Compositions
Figure 4.5. Dissolution Rates of Glasses which are Immersed in LS for 500 Hours at 80°C Depend on the Compositions
46
Figure 4.6. pH Values of LS Solutions in which Glasses Immersed for 500 Hours at 80°C Depend on the Compositions
Figure 4.7. Dissolution Rates of Glasses vs. pH of LS after 500 Hours at 80°C
47
The corrosion process depends on chain hydrolysis [24], where hydroxyl ions
attack the long phosphate chains, to release orthophosphate anions and form CaHPO4
crystals. The H+ ions released into the solution as a result of the chain hydrolysis causes
the solution pH to drop. This reaction continues, the glass continues to dissolve and
solution pH decreases. Bunker et al. indicated that the rate of phosphate chain hydrolysis
dissolution is accelerated in both acid and basic solutions, but more durable around pH7
[24]. This explains the CFP01 glass dissolved dramatically after the solution pH drop
below 7. The main chemical reactions are shown as follows:
O O O O ║ ║ ║ ║ ······ O ─ P ─ O ─P ─ OH + OH- → ···O ─ P ─ OH + HO ─ P ─ O- │ │ │ │ O- O- O- O-
O ║ HO ─ P ─ O- → (PO4)3- + H+
│ O-
For type III glasses, XRD results showed that Ca5(PO4)3OH crystals form on
corroded surfaces, except for CFP04 which does not contain calcium oxide. However, the
Raman spectra of CFP02 and CFP03 do not have PO4 crystals after corrosion while
CFP53 does. This means Ca5(PO4)3OH crystals form by different ways. For
metaphosphate glasses (CFP02 and CFP03), the crystals loosely attached to the surface
and hence are easily peeled off. But for pyrophosphate glass (CFP53), the crystals are
still attached to the surface. Comparing Figures 3.17 and 3.19, the surface of CFP03 is
much more fragile than that of CFP53. This also explains why when metaphosphate glass
are immersed in LS solution, the pH continues to drop until neutral, whereas the pH of
48
solution of CFP53glass only dropped to about 9. The surface coating protection is more
effective on pyrophosphate glasses than on metaphosphate glasses. The IR results of
glass powder in NaOH solution showed that CFP 02, CFP04 and CFP 53 dissolved
quickly, as the main phosphate structure (P-O-P symmetric stretching and PO3- vibration)
disappear after just two hours of corrosion (Figures 3.21, 3.22 and 3.24). The IR spectra
(Figure 3.22) also showed that high Fe2O3 content compositions like CFP 04 tend to be
destroyed by alkaline solutions more easily than high CaO content compositions like
CFP02 (Figure 3.21). Combining with XRD results that the formation of Fe2O3 crystals
on Fe-phosphate glasses after 20 hours corrosion in NaOH, it may be concluded that iron
oxide released from corroding glass reacts with hydroxyl ions and precipitated out the
Fe2O3 crystals, while glasses with higher concentrations of calcium oxide would form a
protective Ca-phosphate coating on the glass surface. The main chemical reactions are
shown as follows:
5Ca2+ + OH- + (PO4)3- → Ca5(PO4)3OH
Fe3+ + 3OH- → Fe(OH)3 → 21 Fe2O3 + 2
3 H2O
HPLC results showed that type II glass (CFP55) releases very small amounts of
PO43- to the NaOH solution; again this result confirmed the conclusion that high CaO
content in pyrophosphate glass composition is helpful to form protective surface layer
and hinder further reaction.
For metaphosphate glasses, the dissolution behavior does not change significantly
when the CaO and Fe2O3 concentrations change. Both Fe3+ and Ca2+ react with the OH-,
phosphate chain structure beaks up and releases different kinds of phosphate anions,
resulting in the formation of Ca5(PO4)3OH and Fe2O3. The reaction keeps going until the
49
solution pH reaches ~7. Most of the reaction products are loosely attached to the glass
surface, whether amorphous or crystalline. Afterwards, these products break up and new
glass surface is exposed to alkaline attack.
For the pyrophosphate glass, when CaO concentration is high, well-adhered
Ca5(PO4)3OH forms on the glass surface and very few PO43- anions are released to the
solution, indicating that a strong protective layer has formed to hinder further reaction. So
iron oxides do not have much chance to participate in the reaction with alkaline solutions.
EDS (Table 3.2) shows Ca/P increases after corrosion, while the Fe/P remained the same.
When iron oxide concentration is high, Fe3+ will precipitate as Fe2O3 (Figure 4.3).
50
5. CONCLUSION
1) Compared with calcium oxide addition to the phosphate glasses, iron oxide addition
can improve the glass and fiber forming ability, decrease thermal expansion and
increase Young’s modulus. This is because of the cross-link effect of iron oxide.
2) Dissolution rate in alkaline solution decreases with phosphate chain length.
3) Calcium oxide addition can improve glass durability in pyrophosphate glasses, the
glass structure remains after corrosion, low concentration of phosphate anions are
released to the solution. This is because calcium can form a protective layer of
Ca5(PO4)3OH on the glass surface which hinders the further reaction.
4) The effect of calcium oxide on corrosion resistance is not as remarkable in
metaphosphate glasses as pyrophosphates. Most metaphosphate glasses hydrolyze in
high pH solution, forming orthophosphate anions and releasing H+ ions, which
decrease the solution pH.
51
6. FUTURE WORK
1) Chromatography tests can be done for more compositions to analyze the release of
phosphate anions into the alkaline solutions. The results can be used to study the
corrosion mechanism quantitively.
2) Other elements can be added to the glass composition to produce glass fibers with
high mechanical strength as well as high chemical durability.
52
BIBLIOGRAPHY
[1] A. J. Majumdar, and R. W. Nurse , “Invited review: glass fiber reinforced cement,” Mater. Sci. Engng, 15 107-127 (1974).
[2] L. J. Larner, K. Speakman, and A. J Majumdar, “Chemical interactions between
glass fibers and cement,” Journal of Non-Crystalline Solids, 20(1) 43-74 1976. [3] S. T. Reis, M. Karabulut, and D. E Day, “Chemical durability and structure of
zinc-iron phosphate glasses,” Journal of Non-Crystalline Solids, 292(1-3) 150-157 (2001).
[4] B. Kumar and S. Lin, “Redox state of iron and its related effects in the CaO-P2O5-
Fe2O3 glasses,” J. Am. Ceram. Soc., 74(1) 226-28 (1991).
[5] B. C. Sales, and L. A Boatner, “Physical and chemical characteristics of lead-iron phosphate nuclear waste glasses,” Journal of Non-Crystalline Solids, 79(1-2) 83-116 (1986).
[6] T. R. Gentry, “Life assessment of glass fiber reinforced composites in Portland
cement concrete,” Proceedings of the American Society for Composites, Technical Conference, 16 446-457 (2001).
[7] S. Diamond, “Effects of two Danish flyashes on alkali contents of pore solutions
cement flyash pastes,” Cement and Concrete Research, 11 383-394 (1981). [8] V. T. Yilmaz and F. P. Glasser, “Reaction of alkali-resistant glass fibers with
cement, part 1,” Glass Technology, 32 91-98 (1991). [9] S. M. Budd, “The mechanisms of chemical reaction between silicate glass and
attacking agents,” Physics and Chemistry of Glasses, 2 111-114 (1961). [10] G. Scarinci, D. Soraru, G. Grassi, G. Stafferri and C. Badini, “Portland cement
reinforced with new alkali resistant glass fibres,” Proc. 8th Int. Congr on the Chem of Cement, 6 381-383 (1986).
[11] V. T. Yilmaz, “Chemical attack on alkali-resistant glass fibers in a hydrating
cement matrix,” J. Non-Cryst. Solids, 151 236-244 (1992). [12] B. C. Sales, L. A. Boatner and J. O. Ramey, “Intermediate range order in simple
metal phosphate glasses,” J. Non-Cryst. Solids, 232-234 107-112 (1998). [13] X. Yu, D. E. Day, G. J. Long, and R. K. Brow, “Properties and structure of
sodium iron phosphate glasses,” J. Non-Cryst. Solids, 215 21-31 (1997).
53
[14] T. R. Meadowcroft and F. D. Richardson, “Structural and thermodynamic aspects of phosphate glasses,” Trans. Faraday Soc, 61 54-70 (1965).
[15] D. E. Day, Z. Wu, C. S. Ray and P. Hrma, “Chemically durable iron phosphate
glass waste forms,” J. Non-Cryst. Solids, 241 1-12 (1998). [16] R.K. Brow, D.R. Tallant, S.V. Crowder, S.K. Saha, H. Jain, A. Mcintyre and D. E.
Day, “ Advanced materials for aerospace and biomedical applications,” Sandia Report 96-2772, (1996).
[17] L. Keenhner, B.C. Tischendorf and J. U. Otaigbe, “Durable fibers from phosphate
glasses,” Glass Technol, 42 168-170 (2001). [18] A. J. Lang. “Failure characteristics and durability of phosphate glass,” M.S.
Thesis, University of Missouri-Rolla, 2003. [19] R. K. Brow, “Review: the structure of simple phosphate glasses,” J. Non-Cryst.
Solids, 263 1-28 (2000). [20] A. E. Marino, S. R. Arrasmith, L. L. Gregg, S. D. Jacobs, Guorong Chen and
Yongjuan Duo, “Durable phosphate glasses with lower transition temperatues,” J. Non-Cryst. Solids, 289 37-41 (2001).
[21] K. Suzuya, C. K. Loong, D. L. Price, B. C. Sales and L. A. Boatner, “The
structure of lead indium phosphate and lead scandium phosphate glasses,” J. Non-Cryst. Solids, 258 48-56 (1999).
[22] J. R. Van Wazer, Phosphorus and its compounds, Interscience, New York, 1958. [23] X. Fang, C. S. Ray, A. M. Milankovic and D. E. Day, “Iron redox equilibrium,
structure and properties of iron phosphate glasses,” J. Non-Cryst. Solids, 283 162-172 (2001).
[24] B. C. Bunker, G. W. Arnold and J. A. Wilder, “Phosphate glass dissolution in
aqueous solutions,” J. Non-Cryst. Solids, 64 291-316 (1984). [25] B.S. Bae and M.C. Weinberg, “Chemical durability of copper phosphate glasses,”
Glass Technology, 35 83-88 (1994). [26] D. Cacaina and S. Simon, “calcium influence on dissolution rates of potassium
phosphate glasses,” Journal of Optoelectronics and Advanced Materials, 5 191-194 (2003).
[27] A. E. R. Westman, and P. A. Gartaganis , “Constitution of sodium, potassium, and
lithium phosphate glasses,” Journal of the American Ceramic Society, 40 293-299 (1957).
54
[28] B. C. Sales, L. A. Boatner and J. O. Ramey, “Chromatographic studies of the structure of amorphous phosphates,” J. Non-Cryst. Solids, 263-264 155-166 (2000).
[29] X. Feng, and T. B. Metzger, “A glass durability model based on understanding
glass chemistry and structural configurations of the glass constituents,” Materials Research Society Symposium Proceedings, 432 27-38 (1997).
[30] J. Clement, G. Avila, M. Navarro, S. Martinez, M.P. Ginebra and J.A. Planell,
“Chemical durability and mechanical properties of calcium phosphate glasses with addition of Fe2O3, TiO2 and ZnO,” Key Engineering Materials, 192-195 621-624 (2001).
[31] Y.M. Moustafa, “Characterization of iron oxycholoride potassium phosphate
glasses,” J. Phys. D, 32 2278-2286 (1999). [32] G.N. Greaves, S.J. Gurman, L.F. Gladden, B. C. Sales and R.N. Jenkins, “A
structural basis for the corrosion resistance of lead iron phosphate glasses,” Philosophical Magazine B, 58 271-283 (1988).
[33] I.W. Donald, B.L. Metcalfe, S.K. Fong and L.A. Gerrard, “The influence of Fe2O3
and B2O3 additions on the thermal properties, crystallization kinetics and durability of a sodium aluminum phosphate glass,” J. Non-Cryst. Solids, 352 2993-3001 (2006).
[34] Ohtomo, Koichiro, Yoshimura, and Takuji, “Alkali resistant glass compositions
and alkali resistant glass fibers prepared therefrom,” U.S. Pat. No. 3,973,974 (1976).
[35] B. C. Sales, L. A. Boatner and J. O. Ramey, “Chromatographic studies of the
structures of amorphous phosphates: a review,” J. Non-Cryst. Solids, 263 155-166 (2000).
[36] R. A. Nyquist, C. L. Putzig, and M. A. Leugers, The handbook of infrared and
Raman spectra of inorganic compounds and organic salts, Academic Press, San Diego, 1997.
[37] P.E. Gray and L. C. Klein, “The chemical durability of sodium ultraphosphate
glasses,” Glass Technol, 24 202-206 (1983). [38] http://www.kemi.kth.se/medusa/ Medusa and Predom2 software, July 2007.
55
VITA
Jiawanjun Shi was born on Oct 3rd, 1981 in P. R. China to Yougang Shi and
Xiaoxia Wang. She graduated from Tianjin University with her B.S. with major in
ceramic science and engineering in June of 2003. She began her graduate work in
January of 2005 at the University of Missouri-Rolla and received an M.S. in Ceramic
Engineering in December of 2007.