Embed Size (px)
Citation preview

PROPERTIES OF MYELINATED FIBERS IN FROG
SCIATIC NERVE AND IN SPINAL CORD AS
EXAMINED WITH MICRO-ELECTRODES*
ICHIJI TASAKI
Central Institute for the Deaf St. Louis, Mo. U.S.A.
In 1951, during the period from February to May, Huxley and I made aseries of observations, using glass micro-electrodes (Ling and Gerard, 1949Nastuk and Hogkin, 1950), on the action potentials recorded from inside the frogmotor nerve fiber. A large motor fiber was isolated from a sciatic-gastrocnemius
preparation, and the operated region of the preparation, immersed in Ringer's fluid,was brought under a polarizing microscope with an objective lens of water-immer-sion type. A micro-electrode of below 0.5 micron in diameter, held by means of amicro-manipulator, was pushed into the nerve fiber, and the potential differencebetween the intra-cellular electrode and the outside fluid medium was recordedwith a cathode-ray oscillograph used in conjunction with a DC amplifier. Action
potentials were elicited from the fiber by induction shocks applied to the proximalnerve trunk. Muscular contractions were taken as an index of the propagation ofimpulses across the impaled region. The main features of the results obtainedare as follows:
1. When the tip of the micro-electrode was just under the layer of myelinor when a dimpling of myelin into the axis-cylinder was seen at the tip ofthe micro-electrode, there was practically no measurable resting potential .But a propagated nerve impulse could very often evoke sizable monophasicaction potentials (generally not exceeding 30 mV in peak value) . At thisstage, propagation of impulses across the impaled region was not impaired.
2. When the tip of the micro-electrode was introduced deep inside theaxis-cylinder, a resting potential of 10 to 40 mV was observed. The action
potentials observed at this stage were large at the beginning (20 to 40 mV),but soon a notch appeared at the peak of the action potential . As timeelapsed, this notch became more pronounced, and generally within 2 to 5minutes after introduction of the micro-electrode, a stage was reached atwhich the part of action potential following the notch suddenly disappeared .Propagation across the impaled region was blocked at this moment .The first part of the present investigation is an extension of the above-
stated experiments done in England. In order to correlate the action potentialsobserved with an internal electrode with the action currents recorded with the
Received for publication September 22, 1952.*This work was carried out under Contract Noonr -272 between the Office of Naval
Research and Central Institute for the Deaf.
73

74 I. TASAKI
partition method (Tasaki and Takeuchi, 1941; Huxley and Stampfli, 1950), thelongitudinal currents flowing through the axis-cylinder and the potentials ofthe axis-cylinder was recorded simultaneously at the same internode. The re-sults obtained are somewhat different from those obtained by Woodbury (1952)who recorded full-sized resting and action potentials from undissected fibers inthe nerve trunk.
Next, a method was developed by which a constant current for polarizingthe nerve fiber could be sent into the same micro-electrode that was measur-ing the action potential. It was also found possible to excite single fibers bystimulating currents applied through an intra-cellular electrode.
Finally, using micro-electrodes, electrical responses were recorded from in-dividual fibers in the dorsal column of the frog spinal cord. The general charac-ter of the action potentials observed was much the same as that of the action
potentials recorded by K. Frank* (personal communication) from individual fibersin cat spinal cord by the same technique. By the method of polarization withan internal electrode and also by measuring the variation in threshold along afiber in the most superficial layer of the dorsal funiculus, direct physiologicalevidence was obtained indicating that there are nodes of Ranvier in the centralnervous system and they play the same role as in peripheral nerves.
METHODS
1. Micro-electrode. Since the myelinated nerve fibers of the frog are 2 to 12microns in diameter, recording action potentials from inside these fibers is moredifficult than recording from muscle fibers of 100 microns diameter (Nastuk andHodgkin, 1950). In those large skeletal muscle fibers a considerable length ofthe micro-electrode near its tip can be introduced into the protoplasm. Hence,the capacitative flow of current through the extremely thin wall of the micro-electrode is considered to play some role in improving the response of this highresistance electrode to rapidly changing voltages. With isolated single nervefibers, however, it seemed highly probable that such leakage of current throughthe wall of the micro-electrode reduces the response of this electrode to highfrequency alternating currents.
With a view to examining this point, the following simple observation wasmade (fig. 1). A micro-electrode, drawn from glass tubing about 1 mm. inoutside diameter and about 0.2 mm. thick to a tip of about one fourth of a
FIG. 1. Experimental arrange-ment used for measuring electric im-
pedance of a micro-electrode (left),and two examples of the results ofsuch measurements (right).
*National Institutes of Health, Bethesda, Md., U.S.A.

MYELINATED FIBERS IN FROG SCIATIC NERVE AND IN SPINAL CORD 75
micron and filled with a 3 molar potasium chloride solution, was held with asmall clamp made of plastic and its tip was immersed in frog Ringer's solu-tion. A piece of silver wire of 100 microns in diameter and 15 cm. long wasused for connecting the grid of the cathode-follower and the electrode. Another
piece of silver wire was immersed in the fluid (in the Petri dish), and an ACvoltage of about 150 mV peak-to-peak was applied between the ground and thewire immersed in the dish. The impedance of the micro-electrode was determinedby measuring the voltage across a low resistance (130 kilohms) inserted in the
circuit.
The diagram on the right-hand side of fig. 1 shows two examples of suchmeasurements. The impedance at 250 cycles per second agreed fairly well withthe DC resistance of the electrode. As the frequency went up, the impedancefell rapidly, and at about 5000 cycles per second it reached a value of 1/10 to1/20 of the DC resistance. When a commercial resistor of 20 megohms replacedthe micro-electrode, a fairly constant value was obtained up to this frequency.Therefore the measurements are reliable in this frequency range.
These measurements indicate that, in recording action potentials of a nervefiber with a micro-electrode, leakage of current through the wall of the electrodecan actually cause a considerable distortion in shape and a reduction in theabsolute value (cf. Woodbury, 1952). When the tip of a micro-electrode isimmersed in ringer, a nearly stationary state is reached in the electrode verysoon, the KCl solution near the tip of the electrode being diluted by Ringer.The high DC resistance of such a micro-electrode is due mainly to the lowelectrolyte concentration near the tip. (Note that NaCl in frog ringer is ap-
proximately 0.12 molar.) Since the impedance of the electrode does not increaseappreciably during the course of measurement (5 to 100 minutes), it is clearthat the region of high specific resistance (namely low electrolyte content) islocalized in the region near the very tip of the micro-electrode where the glasswall is extremely thin. Capacitative flow of current through this part of theelectrode, which undoubtedly accounts for the curves in fig. 1, right, gives us aconsiderable difficulty in determining the absolute value and the exact time-course of the action potentials recorded with this type of internal electrode.
2. Cathode-follower, amplifier and cathode-ray oscillograph. In early ex-
periments electric responses of a single nerve fiber were recorded simul-taneously with three independent channels of amplifier and cathode-ray os-cillograph. The first channel was used for recording action potentials from insidethe fiber with a micro-electrode, the second channel for photographing actioncurrents flowing through the axis-cylinder, and the third channel for recordingDC potentials from inside the fiber. The difference between the first and thirdchannels is simply that the third channel has a lower voltage sensitivity buta DC amplifier so that it records resting potentials as well as action potentials.Each of these amplifiers was preceded by a cathode-follower stage, the vacuumtube used being RCA 1620 in triode connection (approximately 4×10-11 ampere
grid current). In many of the later experiments, only one or two of thesethree channels were used for recording responses. In all the records presented
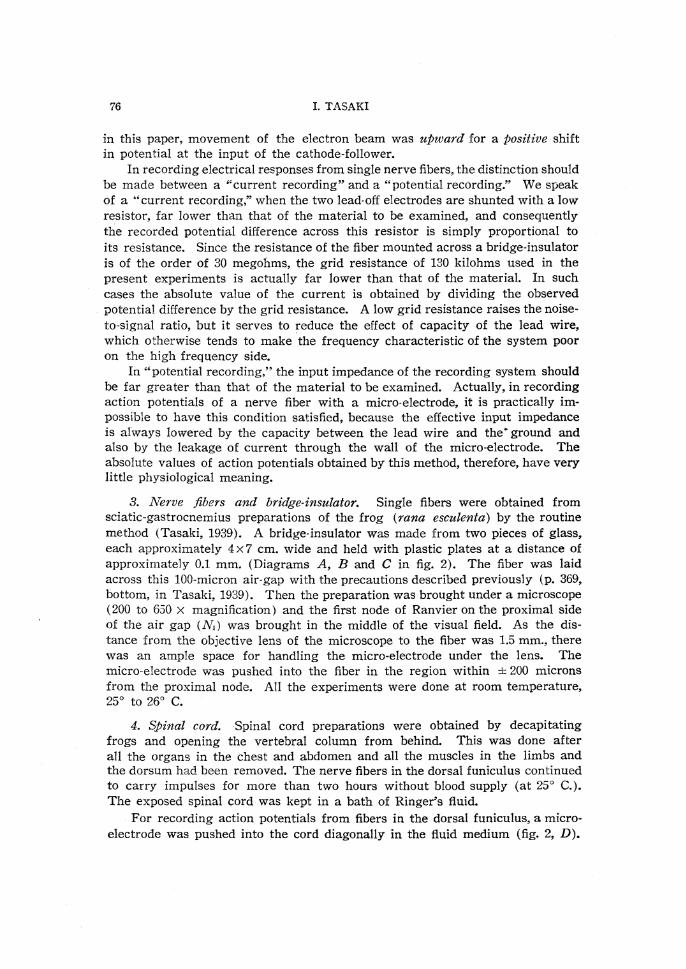
76 I. TASAKI
in this paper, movement of the electron beam was upward for a positive shiftin potential at the input of the cathode-follower.
In recording electrical responses from single nerve fibers, the distinction shouldbe made between a "current recording" and a "potential recording." We speakof a "current recording," when the two lead-off electrodes are shunted with a lowresistor, far lower than that of the material to be examined, and consequentlythe recorded potential difference across this resistor is simply proportional toits resistance. Since the resistance of the fiber mounted across a bridge-insulatoris of the order of 30 megohms, the grid resistance of 130 kilohms used in the
present experiments is actually far lower than that of the material. In suchcases the absolute value of the current is obtained by dividing the observed
potential difference by the grid resistance. A low grid resistance raises the noise-to-signal ratio, but it serves to reduce the effect of capacity of the lead wire,which otherwise tends to make the frequency characteristic of the system pooron the high frequency side.
In "potential recording," the input impedance of the recording system shouldbe far greater than that of the material to be examined. Actually, in recordingaction potentials of a nerve fiber with a micro-electrode, it is practically im-
possible to have this condition satisfied, because the effective input impedanceis always lowered by the capacity between the lead wire and the ground andalso by the leakage of current through the wall of the micro-electrode. Theabsolute values of action potentials obtained by this method, therefore, have verylittle physiological meaning.
3. Nerve fibers and bridge-insulator. Single fibers were obtained fromsciatic-gastrocnemius preparations of the frog (rana esculenta) by the routinemethod (Tasaki, 1939). A bridge-insulator was made from two pieces of glass,each approximately 4×7 cm. wide and held with plastic plates at a distance of
approximately 0.1 mm. (Diagrams A, B and C in fig. 2). The fiber was laidacross this 100-micron air-gap with the precautions described previously (p. 369,bottom, in Tasaki, 1939). Then the preparation was brought under a microscope
(200 to 650×magnification)and the first node of Ranvier on the proximal side
of the air gap (N1) was brought in the middle of the visual field. As the dis-tance from the objective lens of the microscope to the fiber was 1.5 mm., therewas an ample space for handling the micro-electrode under the lens. Themicro-electrode was pushed into the fiber in the region within±200 microns
from the proximal node. All the experiments were done at room temperature,
25° to 26° C.
4. Spinal cord. Spinal cord preparations were obtained by decapitatingfrogs and opening the vertebral column from behind. This was done after
all the organs in the chest and abdomen and all the muscles in the limbs andthe dorsum had been removed. The nerve fibers in the dorsal funiculus continued
to carry impulses for more than two hours without blood supply (at 25° C.).
The exposed spinal cord was kept in a bath of Ringer's fluid.
For recording action potentials from fibers in the dorsal funiculus, a micro-electrode was pushed into the cord diagonally in the fluid medium (fig. 2, D).

MYELINATED FIBERS IN FROG SCIATIC NERVE AND IN SPINAL CORD 77
FIG. 2. Experimental arrangements used for simultaneous recording of longitudinal ac-tion currents and action potentials from inside a nerve fiber (A), for stimulating a nervefiber with an internal electrode (B), for recording subthreshold responses of a node (C), forrecording action potentials from inside individual fibers in the spinal cord (D) and formeasuring thresholds of a fiber in the superficial layer of the spinal cord (E). P stands fora polarizing circuit, R for a high resistance (120 megohms), r for a low resistance (0.13megohm), V for the first stage of a potential recording device, G for the first stage of a
current recording system, M for a micro-electrode, E for a pair of stimulating electrodes,S for the output of a square wave generator, C for a relatively large glass capillary and N'sfor nodes of Ranvier of the single nerve fiber. All the diagrams are drawn out of proportion.
This was done under a binocular microscope (20×). The Huid in the dish was
grounded, and the sciatic nerve was stimulated with induction shocks from atransformer with an ungrounded secondary coil.
For threshold measurements on the fibers in the dorsal funiculus, a glasscapillary of approximately 25 microns inside diameter was used to apply rec-tangular current pulses to the surface of the spinal cord. The capillary wasfilled with frog ringer and a fine silver wire, wound in a spiral at the end,conveyed the stimulating pulses from the output of a multi-vibrator to the ca-
pillary. The resistance of such a stimulating electrode was approximately 500kilohms. The index of nerve excitation was single fiber responses led off froma group of approximately ten fibers entering the gastrocnemius muscle. Sinceonly those fibers situated in the most superficial layer of the dorsal column gaveresponses on stimulation, many of those ten fibers did not give any response.To avoid possible contamination by reflex responses in the efferent nerve fibers,the 7th, 8th and 9th ventral roots were cut. The operated region of the musclenerve was suspended in the layer of paraffin oil floating above the Ringer's fluid
(fig. 2, E). The distal portion of the nerve was led to an amplifier with an inputresistance of approximately 1 megohm.

78 I. TASAKI
RESULTS
Part I. Fibers in the Peripheral Nerve
1. Action Potentials recorded from inside the myelin sheath. In this seriesof experiments, the experimental set-up shown in fig. 2, A, was used. The fiberwas so mounted on the bridge-insulator that the proximal two-thirds of the in-ternode to be examined was immersed in the Ringer's fluid on the proximal sideof the air-gap. While attempts were being made to push a micro-electrode intothe layer of myelin, induction shocks were applied to the proximal nerve trunkat a rate of 3 to 4 per sec. By means of a loudspeaker operated by the outputof the first (voltage) channel, sudden changes in potential of the micro-electrodewere made audible. A micro-electrode with a DC resistance of 20 to 40 megohmswas introduced into the fiber at a point 20 to 200 microns away from the firstnode on the proximal side of the bridge-insulator. The electrode was heldhorizontal and was brought to the fiber from the side. The tip of the electrodewas pushed against the surface of the fiber, not perpendicularly, but at a rela-tively sharp angle (from 20 to 40 degrees between the axis of the fiber and theelectrode). This generally resulted in a dimpling of the myelin layer into theaxis-cylinder.
Generally when the dimpling of the myelin layer into the axis-cylinder wasslight, neither a resting potential nor an action potential was observed onthe oscillograph. But sometimes it happened that a small action potential,below 5 mV peak value, recurred at the frequency of stimulation. When this smallresponse appeared there was practically no observable change in the time-courseof the action current recorded from the same internode (see fig. 3, record A).
When the micro-electrode was pushed still further into the axis-cylinder,relatively large action potentials, generally 5 to 20 mV peak value, appearedwithout any noticeable change in the action current of the same internode (G)or in the DC potential of the micro-electrode (fig. 3, B).
FIG. 3. Simultaneous records of
action potentials (V) with an internal
electrode, longitudinal action currents
(G) and resting potentials (DC) of asingle nerve fiber. Record A was taken
when the micro-electrodes, pushed into
the mylin sheath at a point about 150
microns distal to the node, began to
pick up action potentials. B was takenafter the electrode had been pushed a
little deeper into the axis-cylinder. In
C, the micro-electrode went still deeper
and a resting potential appears in this
record. The amplification for the upper-
most channel is reduced by 10 db. D
to F show progressive changes in the
records during the period of about two
minutes. Time markers, 1 msec.

MYELINATED FIBERS IN FROG SCIATIC NERVE AND IN SPINAL CORD 79
Then a further push or a slight jiggling of the micro-electrode caused some-times a sudden shift in the base-line of the DC channel (fig. 3, C). At the mo-ment when this sudden shift took place the observed action potential was largest
(20 to 40 mV peak value). This stage was immediately followed by a progressivedeterioration both in the action potential and in the action current.
As the action potential recorded from inside the fiber became progressively-smaller, a notch appeared near the peak of the response. As time elapsed thisnotch became clearer and clearer (fig. 3, D and E). The action current recordstaken simultaneously from the same internode (fig. 2, channel G) indicated veryclearly that this appearance of a notch was due to delay in conduction across theinternode under investigation. At the moment when a clear notch appeared onthe potential (V) channel, a reversal in the direction of the longitudinal currentwas always observed. Since this reversal of the longitudinal current is a signof the spread of the physiologically active region to the distal side of thebridge-insulator (Tasaki and Takeuchi, 1941), there is no doubt that the startof the second hump following the notch is due to the activity of the node (N2in fig. 2) on the distal side of the bridge-insulator.
At variable time (1 to 10 minutes) after the appearance of the resting po-tential in the third DC channel, the second hump in the action potential recorddropped out completely. The simultaneous record of action currents showedthat nervous conduction was blocked at this moment.
The conduction block was always preceded by a visible change in the shapeof the nearest node of Ranvier (N1, in fig. 2). It was a surprise to see that anerve impulse could travel across a node at which the gap in the myelin sheath,had become many times wider than normal.
There were also many cases in which a resting potential failed to appear atall. This apparently shows that a thin layer of myelin over the tip of themicro-electrode is capable of maintaining a large DC potential (due to its highDC resistance). The tip of the electrode covered with a thin film of myelin can
pass completely through axis-cylinder and reach the myelin sheath again beforethe film is perforated. It was my impression that in the present series of ex-
periments the resting potential failed to appear more frequently than in theprevious experiments done with Huxley in a cold British winter. It may be thatthe difference in room temperature caused this difference by changing the vis-cosity or the stiffness of the myelin.
2. Recording action potentials from inside a node of Ranvier. Although the
gap between the myelin sheath at the node is generally a little less than 1micron in width, it is possible to introduce a micro-electrode right into this naked
portion of the axis-cylinder. It is, however, difficult to obtain large action po-tentials from this part of the fiber. The injury current arising from perfora-tion of the nodal membrane seems to depress the activity of the fiber veryrapidly.
Figure 4 gives an example of such observations. Record A in this figure,shows the time-course of the action current taken across the bridge-insulator. Thistypical binodal configuration has been described previously (Tasaki and Take-

80 I. TASAKT
FIG. 4. Effect of a micro-electrode pushed into a node of Ranvier. A: electrode stillin Ringer around the fiber. B: electrode in the node. C: record taken while the electrodewas being withdrawn the disturbance in the upper record ( V) is due to movement of theelectrode. D: immediately after withdrawal of the electrode. E: three minutes after with-drawal. Note the quick recovery in the longitudinal action current (G). The bar at thetop subtends 2.5 mV;the next bar for the action current records
, 2.5×10⁻⁹ A. Time mark-
ers, 1 msec.
uchi, 1941). When a micro-electrode was pushed into the node, an action po-
tential associated with a very slight resting potential (about 9 mV in this case)was observed (Record B). At this moment the longitudinal action current wasalready very small, indicating that the node into which the electrode had justbeen inserted was practically inexcitable. Then the micro-electrode was pulledout (record C). This almost immediately (within 0.3 sec. in this case) restorednervous conduction across this node (record D). About three minutes later,the response of the injured node recovered almost to normal.
The fact that a micro-electrode inserted into a node of Ranvier caused a
quick deterioration of the resting and the action potentials may reasonably beattributed to lack of the sealing effect of myelin. Where myelin is present itapparently reduces the leakage of current through the hole made by the puncture.The rapid recovery in the function of the node after removal of the electrodeindicates that the structure of the nodal membrane is not rigid.
3. Polarization of a nerve fiber with an internal electrode. To send a con-stant current into a nerve fiber through a micro-electrode, a simple device il-lustrated in fig. 2, A, was used. The resistance, R, connected between the gridof the cathode-follower and the ground (120 megohms in most cases) reducedthe observed size of the action potential slightly. But the absolute value of theobserved potential had only little physiological meaning, and, since the noiselevel of our action potential record was still low enough, this reduction inthe spike height did not cause any serious trouble in our recording. Now,closure of the polarizing circuit, P in the figure, caused a current which flowedthrough the micro-electrode and traversed the surface membrane of the nerve
fiber.Attention should be called in this procedure to the fact that there is a po-
tential difference between the silver wire in the micro-electrode (with 3 molarKCl in it) and the ground electrode (a silver wire in Ringer-agar gel). Themicro-electrode was generally 60 to 80 mV negative relative to the groundelectrode. The resting potential of the nerve fiber also caused a constant currentthrough the grid resistance, R, when the micro-elctrode was inserted into the fiber.

MYELINATED FIBERS IN FROG SCIATIC NERVE AND IN SPINAL CORD 81
The experimental procedure of this series of experiments was as follows:First, a single nerve fiber was mounted on a bridge-insulator and, with the tipof the micro-electrode kept in Ringer's fluid, a record of action current was taken,
(fig. 5, top left). At this time, the resistance (R in the figure) was left discon-nected and the polarizing voltage (P) was adjusted to cancel the electrode poten-tial. Then the micro-electrode was pushed gradually into the myelin-covered.
portion of the fiber until a resting potential appeared on the DC channel. The re-sponses of the fiber to induction shocks applied to the proximal nerve trunkdeteriorated gradually, as was described before. Next the resistance (R) wasconnected to the grid of the cathode-follower, and, by changing the polarizingvoltage (P), direct currents of varying intensities were sent into the micro-elec-trode (the lower column of fig. 5).
FIG. 5. Effect of constant
currents sent into a nerve fiber
through a micro-electrode. A
positive polarizing current isa current that flows outwards
through the tip of the micro-
electrode. Time markers, 1 msec.
When a current was made to flow outward through the micro-electrode in-serted in the axis-cylinder, namely when the tip of the electrode behaved as asource of current, responses of the fiber, which were already small due to the
progressive deterioration, became still smaller. With currents flowing the oppositedirection, namely with the micro-electrode behaving as a sink of current, recoveryin the size of response was always observed. The intensity of current givenin the figure was calculated simply by dividing the shift in the polarizing voltage
(P) by the total resistance in the circuit (the sum of R and the DC resistance ofthe micro-electrode). At a certain adequate intensity, just critical conductionof impulses across this impaled region was always observed.
It was mentioned in the early part of this paper that, when the tip of themicro-electrode had just penetrated the myelin sheath, action potentials withoutany associated resting potential could be observed. Passage of a constant currentthrough such an electrode covered with a thin film of myelin did not bring

8 2 I. TASAKI
about any appreciable change in the size of responses. An increase in the polar-izing voltage merely caused an irregular noise in the output.
4. Excitation of a nerve fiber with a micro-electrode. In stimulating a singlenerve fiber by a current pulse applied through an internal electrode, leakage ofcurrent through the wall of the electrode, mentioned under "Method," againcomplicates to the time course of the applied current pulse. When the tip ofthe electrode is inserted deep in the nerve fiber, a rectangular voltage pulseapplied to the electrode tends to send into the fiber a current pulse with a sharpinitial peak. When, on the contrary, just the tip of the electrode is introducedinto the axis-cylinder, the leakage through the wall of the electrode tends to roundoff the initial phase of the current. The qualitative aspects of the experimentalresults obtained by this method, however, are still of some interest.
When a micro-electrode was pushed into the myelin-covered portion of anerve fiber and action potentials without any associated resting potential werebeing observed through the electrode, the condition of the fiber was foundto be stable enough to obtain a steady threshold value for a period of five toten minutes. On such occasions, current pulses which were applied to the fiberwith the micro-electrode connected to the anode of the stimulator (the cathodebeing connected to the surrounding fluid medium) gave clear responses in thecurrent-recording channel (G) connected to the same or to the adjacent internode.The threshold voltage measured by this method varied considerably from ex-
periment to experiment, but with micro-electrodes of 20 to 40 megohm DC re-sistance, it was generally between 100 and 500 mV. As in the case of excitationwith extra-cellular electrodes, the latency became shorter with increasing stimulusstrength.
When the micro-electrode inserted in the myelin layer was connected tothe cathode of the stimulating circuit, responses appeared only after the endof the applied voltage pulse (see the last record in fig. 6). The threshold forsuch a break excitation was much higher than that for a make excitation,and repeated excitation by such strong break stimuli caused gradual deteriora-
FIG. 6. Electric stimulation of a nerve fiber
with an internal electrode. The micro-electrode
was pushed into the myelin sheath at a point
about 10 microns away from a node (proximal
to N1 in fig. 2). No resting potential was observed.
Rectangular voltage pulses were applied between
the micro-electrode and the fluid medium. The
threshold stimulus strength was 205 mV; the two
records in this column were obtained at interval
of 0.3 sec. with the same stimulus intensity. The
negative voltage in the last record indicates
that the micro-electrode was now connected to
the stimulating cathode. Time markers, 1 msec.
apart.
MYELINATED FIBERS IN FROG SCIATIC NERVE AND IN SPINAL CORD 83
tion of the nerve responses.The experiments in which the micro-electrode for stimulation was pushed
into one of the nodes of Ranvier of the nerve fiber gave results quite differentfrom what has been mentioned above. Since an electrode inserted directly intothe node is causes rapid deterioration of the activity of the node, experimentswere slightly difficult to perform and the results seemed confusing in the earlystages of the experiments. But, when the following procedure was adopted,consistent results were obtained.
First, with the tip of the micro-electrode kept in Ringer's fluid, relativelystrong voltage pulses (0.5 volt in most cases) were applied between the groundand the micro-electrode synchronously with the sweep of the oscillograph. Thenthe electrode was gradually brought close to the surface of the node, and pho-tographic records were taken of the figures on the screen of the oscillographwhile the electrode was being pushed into the node. The electrode was alwayswithdrawn within one or two seconds after the start of responses on the os-cillograph.
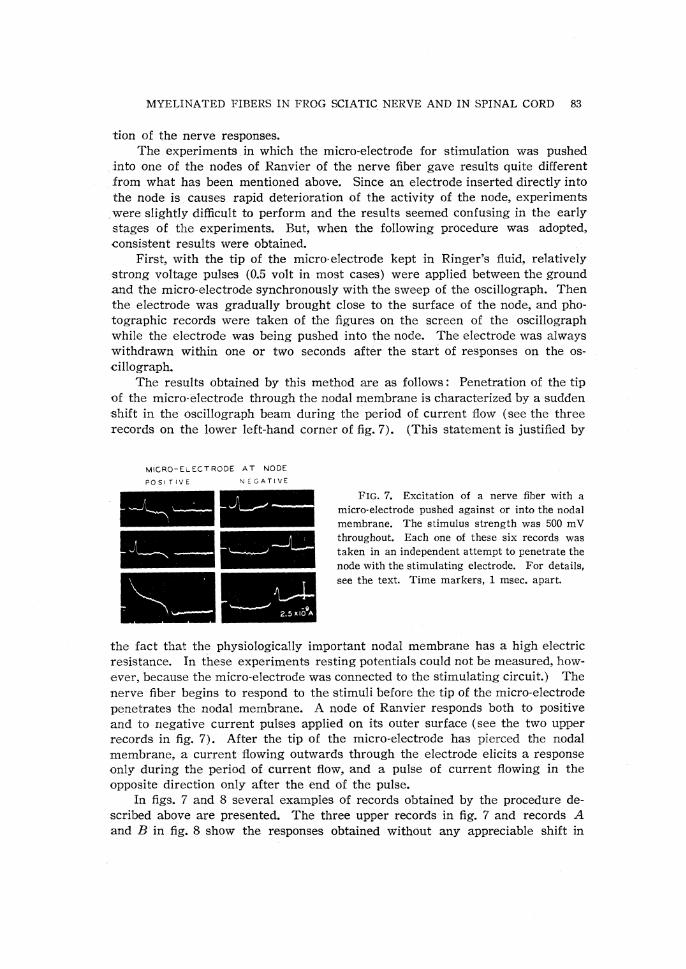
The results obtained by this method are as follows: Penetration of the tipof the micro-electrode through the nodal membrane is characterized by a suddenshift in the oscillograph beam during the period of current flow (see the threerecords on the lower left-hand corner of fig. 7). (This statement is justified by
FIG. 7. Excitation of a nerve fiber with a
micro-electrode pushed against or into the nodal
membrane. The stimulus strength was 500 mV
throughout. Each one of these six records was
taken in an independent attempt to penetrate the
node with the stimulating electrode. For details,
see the text. Time markers, 1 msec. apart.
the fact that the physiologically important nodal membrane has a high electricresistance. In these experiments resting potentials could not be measured, how-ever, because the micro-electrode was connected to the stimulating circuit.) Thenerve fiber begins to respond to the stimuli before the tip of the micro-electrode
penetrates the nodal membrane. A node of Ranvier responds both to positiveand to negative current pulses applied on its outer surface (see the two upperrecords in fig. 7). After the tip of the micro-electrode has pierced the nodalmembrane, a current flowing outwards through the electrode elicits a responseonly during the period of current flow, and a pulse of current flowing in theopposite direction only after the end of the pulse.
In figs. 7 and 8 several examples of records obtained by the procedure de-scribed above are presented. The three upper records in fig. 7 and records Aand B in fig. 8 show the responses obtained without any appreciable shift in

84 I. TASAKI
the base-line during the period of current flow. The first upward movementof the oscillograph line in these responses indicates that the stimulating currentis actually exciting primarily the node (N1) to which the currents are applied.
When the tip of the micro-electrode was inside the nodal membrane, acurrent pulse flowing inwards through the electrode caused a downward deflec-tion, as shown by the two lower records in the right-hand column of fig. 7.During the pulse there was no sign of activity, but, after the end of the pulsea response appeared at this node. With pulses of current flowing outwardthrough the tip of the electrode inserted into the axis-cylinder through the nodalmembrane, it was slightly difficult to demonstrate that there was a responseduring the period of current flow. The superimposed record C in fig. 8 shows
FIG. 8. The same as fig. 7, but taken
from a different preparation. Time marker,
msec.
such a response. The lower curve in this record was taken within half a secondafter penetration of the electrode through the nodal membrane, and the uppercurve approximately 2.5 seconds after the first recording. The difference betweenthese two curves is considered to be due to a response which deteriorated very.rapidly. Judging from the direction of the current, this difference is due main-ly to the response of the node N2 (fig. 2, B) on the distal side of the bridge-insulator. Apparently this distal node was excited by the action current fromthe node N1 (which is completely masked by the shock artefact) and by directspread of the stimulating current to N2. The record at the left bottom of fig. 7was taken apparently after deterioration of those responses.
Record D in fig. 8 is one of the two rare records showing penetration ofthe electrode during the period of current flow. The first response in this pho-tograph is the one induced while the tip was still outside the nodal membrane;it is a make-response to a cathodal (micro-electrode negative) stimulus. Thesharp downward deflection which appears about half a millisecond after thestart of the current pulse indicates that the penetration occurred at this moment.As the micro-electrode was negative in this case, another (break) response wasinitiated by the termination of the current pulse.
The above-mentioned finding that a node of Ranvier can be excited both byanodal and cathodal current pulses applied through a micro-electrode placeddirectly on its outer surface can reasonably be interpreted as follows: In thistype of experiment, the short cylindrical surface of the axis-cylinder does notbehave as a uniform functional unit. One part of the membrane is traversed
MYELINATED FIBERS IN FROG SCIATIC NERVE AND IN SPINAL CORD 85
by an outward-directed current, while the remaining part is subjected to acurrent flowing in the opposite direction. There is therefore very little netcurrent flow spreading along the axis-cylinder toward the adjacent node . Thepart of the nodal membrane subjected to an outward-directed current can in-itiate a response which, by virtue of the process of restimulation by local circuits ,eventually brings the whole nodal membrane into the active state.
The break excitation observed with the micro-electrode inserted in the myelinsheath or in the axis-cylinder should naturally be attributed primarily to thestart of a transient current in the opposite direction on withdrawal of the im-
posed current, due to the capacities of the myelin sheath and of the nodalmembrane.
5. Subthreshold responses. It has been shown by Takeuchi and myself (1942)that, in stimulation of a single nerve fiber, small electrical responses of variablesizes appear at the site of stimulation. These responses have a relatively smallrestimulating effect upon the adjacent node of Ranvier and they are not followedby any detectable refractoriness. According to our interpretation of the conceptof "local response" first introduced by Rushton (1937), we examined whether thesesmall responses could actually be a complete depolarization of a small areawithin one node of Ranvier. As the test we made gave negative results, weconcluded that they could not be "local" responses.
According to Hodgkin, Huxley and Katz (1949), however, a "subthreshold"response in invertebrate nerve fibers (Hodgkin, 1937) is not an all-or-none re-sponse in a small area. It is followed by a period of supernormal excitabilityinstead of a subnormal, refractory period. Since such a period of supernormalexcitability exists also in the myelinated fiber, our previous explanation of thesmall subthreshold responses is, as has been pointed out by several Britishphysiologists, certainly wrong. Later on, Tasaki and Mizuguchi (1948), Castilloand Stark (1951), Huxley and Strnpfli. (1951), Schoeffli and Erlanger (1951) ,Woodbury (1952) and others demonstrated subthreshold responses under variousexperimental conditions.
Using the experimental set-up of fig. 2. C, an attempt was made to recordsubthreshold responses of a node simultaneously with current- and potential-recording devices. A micro-electrode was introduced into the myelin-covered
portion of the fiber, generally at a point 20 to 40 microns proximal to the nodeN1 in fig. 2. Short rectangular voltage pulses (approximately 0.1 msec. dura-tion) were applied at a frequency of 3 to 4 per second. The intensity of theshock was so adjusted that full-sized responses were obtained in 30 to 50
per cent of the trials. When the micro-electrode was pushed deep into the axis-cylinder, namely, when the node was slightly depolarized by the puncture withthe electrode but still capable of developing large action potentials, photographicrecords as shown in fig. 9 were often obtained. In this record, the full-sizedaction potential appeared simultaneously with the full-sized action current
(which caused a downward deflection in the lower record), and the small,subthreshold action potential was associated with a small, subthreshold actioncurrent.

86 I. TASAKI
FIG. 9. Superimposed records show a subthreshold response
of a node of Ranvier. The experimental set-up of figure 2, C,
was used. The micro-electrode was pushed into the fiber at a
point approximately 35 microns proximal to the node NI. Timemarker, 0.5 msec.
It should be mentioned in this connection that, in a fresh non-depolarizednode, variable subthreshold action potentials were so small that they were almostundetectable by this very sensitive method. It is likely that in our previousexperiments (1942) the node under investigation was in a slightly depolarizedstate which could give relatively large subthreshold responses.
6. Recording action potentials from small myelinated fibers. All the experi-ments stated up to this time were done on single large motor nerve fibers whichwere 9 to 12 microns in diameter. Since all these experiments showed that amicro-electrode was a powerful tool for recording action potentials from largenerve fibers, it seemed desirable to know whether or not this tool was applicableto smaller myelinated fibers. First, attempts were made to record action poten-tials from inside an isolated small motor nerve fiber (Tasaki and Kano, 1942)which is known to cause a slow muscular contraction and small monophasicmuscle action potentials on stimulation. It was found easy to obtain a responseof approximately 10 mV from those fibers of 4 to 5 microns in diameter. Justas in large motor fibers, action potentials deteriorated when a resting potentialappeared on the DC channel. When action potentials without any associatedresting potential were observed, the fiber continued to conduct impulses formore than 30 minutes.
In fig. 10 is given an example of responses recorded from a small fiber.Three fibers entering the gastrocnemius muscle were isolated; their diameterswere 11, 4 and 3 microns respectively (measured under a low-power microscope).Action current records taken across a bridge-insulator (the lower records in thefigure) show how the intensity of action current and the rate of conduction
FIG. 10. Simultaneous records of action poten-tials (taken with a micro-electrode) and action cur-rents (led off by a bridge-insulator) from a threefiber preparation. Conduction distance, approximately35 mm. Time marker, msec.

MYELINATED FIBERS IN FROG SCIATIC NERVE AND IN SPINAL CORD 87
differed among these three fibers. A micro-electrode was first inserted into thelargest fiber (left column in the figure). The action potential started almostsimultaneously with the largest action current. Then the electrode was with-drawn and pushed into the smaller fiber. The action potential now startedsimultaneously with the second peak in the action current record (right column).All these observations showed very clearly that recording action potentials from3 to 4 micron fibers with micro-electrodes was actually possible and practical.
Next, attempts were made to record single fiber responses from an intactnerve trunk with a micro-electrode, just as in Woodbury's experiments. A nervetrunk was immersed in a bath of Ringer's fluid and a micro-electrode was pushedinto the nerve through a small hole made in the epineurium. Unmistakablesingle-fiber responses were easily obtained on stiumlation of the nerve at oneend. The responses from the surrounding fibers were not disturbing, becausethe fluid medium in the dish reduced the undesired potentials and the sensi-tivity of the amplifier could be kept low enough to avoid recording them. The
properties of the nerve fibers examined by this method were not in any respectdifferent from what has been seen in isolated single fibers. Working on themost proximal part of the sciatic nerve (plexus ischiococcygeus), it was possibleto obtain single-fiber responses with a micro-electrode pushed through an in-tact epineurium.
Figure 11 shows an example of an unpleasant complication which was en-countered in applying the micro-electrode technique to the whole nerve trunk.Responses from two different fibers were recorded with a single micro-electrode.Five records in this figure were taken in the order of sequence presented inthe figure at varying stimulus strengths which can be seen from the differentsizes of the shock artefacts. These were undoubtedly the responses of twodifferent fibers, large and small, with the rates of conduction in the ratio ofapproximately 3.5 to 1. Apparently the micro-electrode had penetrated entirelythrough the larger fiber and the tip had reached the neighboring smaller fiber.It was mentioned in the Method section of this paper that a potential changecould be recorded through the thin wall of a micro-electrode.
The experimental data presented in this section indicate that a glass micro-electrode is a powerful tool for recording single fiber responses from an undis-sected nerve trunk. But for a quantitative study on the properties of the my-elinated fiber this method involves a number of diffi-culties which are hard to overcome. Woodbury (1952)states that he obtained resting potentials of more than 50mV and action potentials of above 100 mV. He used anelectronic device to improve the high-frequency charac-teristic of his recording system but it is difficult tobelieve that his method of adding some potential to the
FIG. 11. Responses of two different nerve fibers in an intactsciatic nerve recorded with one micro-electrode.

88 I. TASAKI
output of his amplifier is actually adequate for improving the characteristic ofthis complicated recording system. In our own experiments mentioned above
(done on 33 isolated large motor fibers and a number of nerve trunks), noresting potential above 40 mV was encountered.
Part II. Fibers in the Dorsal Column of the Spinal Cord
1. Recording action potentials from fibers in the dorsal funiculus. Action
potentials from fibers in the dorsal funiculus were recorded with a micro-electrodepushed into the spinal cord through a hole made in the pia or sometimes withan electrode pushed through the pia. Stimuli (induction shocks) were appliedto the proximal part of the sciatic nerve at a point approximately 30 mm. awayfrom the entry of the 7th spinal root. The whole spinal cord was immersed inRinger's fluid in a Petri dish.
Five examples of the records obtained by this method are presented in fig.12. In taking these records, the stimulus strength was adjusted to the thresholdfor the fiber from which the action potentials were recorded. As in the recordstaken from peripheral nerve fibers, spontaneous variations in the latency andoccasional failure of response are seen in these records.
FIG. 12. Five examples of single-fiber responses obtained from the dorsal funiculus ofthe frog. Experimental set-up of fig. 2, D, was used. The spike heights of these responsesare 6 mV, 3.5 mV, 3 mV, 7 mV and 1.5 mV respectively (from preparation 1 to 5). Recordnumber 4 shows an injury discharge arising at the region of the micro-electrode. Severalsweeps are superimposed. Time markers, msec.
The peak value of the action potential obtained by this method ranged from1.5 to 8 mV (sampled from 21 fibers). This value seems slightly smaller than
the corresponding value for the large motor nerve fiber. This would not besurprising, however, since the fibers in the dorsal funiculus are smaller thanthe motor fibers and micro-electrodes were introduced into those fibers withoutany visual control. The resting potential ranged from zero to 20 mV when theseaction potentials were observed. Whenever there was a distinct resting potential,the action potential underwent a progressive deterioration. This deterioration ofthe action potential proceeded on some occasions fairly rapidly and on otheroccasions rather slowly (in 10 to 15 minutes). Action potentials without associatedresting potential generally showed no progressive change within 10 to 15 minutes.

MYELINATED FIBERS IN FROG SCIATIC NERVE AND IN SPINAL CORD 89
The average rate of conduction along these fibers ranged from 15 to 25m/sec. Since the major portion of the fiber is outside the spinal cord, the rate
just mentioned indicates that we are here dealing with large and medium-sized(afferent) fibers in the sciatic nerve. The duration of the spike was in mostcases something like one msec.; but in one occasion (record 5 in fig. 12) amuch longer spike duration was observed.
2. Polarization of a single fiber in the dorsal funiculus. It was mentioned inthe preceding section that when a resting potential was recorded together withthe action potential, with a micro-electrode inserted into the dorsal part of thespinal cord, the impaled fiber showed a progressive deterioration in its abilityto develop action potentials. Records A to D in fig. 13 illustrate this. A notch
FIG. 13. Progressive deterioration in theaction potentials from a fiber in the dorsal fu-niculus (A to D) and restoration of the responseby constant currents applied through the record-ing micro-electrode. Time marker, 1000 cyclesper sec.
in the course of action potential, which was just visible at the beginning, be-came clearer and clearer as time elapsed. About three minutes after the startof the observation, the elevation following the notch began to drop out oncein every two to three sweeps. According to the results of the experimentsmade on excised motor nerve fibers, this change in the shape of the action
potential indicated block of conduction across the impaled region.When the conduction was completely blocked, a constant current of 3 to
20×10-9 ampere was sent into the fiber through the micro-electrode (see Method
section) in such a direction that the surface membrane of the fiber could bere-polarized by the current. Just as in fibers in the peripheral nerve, this
procedure brought the nerve fiber to the initial or a still better state. As timeelapsed, the intensity of current needed for restoration of conduction increased
gradually. This property again was common to the fibers in the peripheralnerve and those in the spinal cord.
When the micro-electrode inserted into the spinal cord was giving action
potentials without associated resting potential, the passage of a current of theintensity mentioned above increased the noise level of the oscillograph recordbut generally no appreciable increase in the spike height was observed. Fromour experience with the isolated single nerve fiber, we believe that the tip ofthe micro-electrode was covered, on such occasions, with a thin film of myelin.
It is interesting to note that, in anodal polarization of a single fiber in thedorsal funiculus with an internal electrode, more than one notch can appear in
90
I
, TASAKI
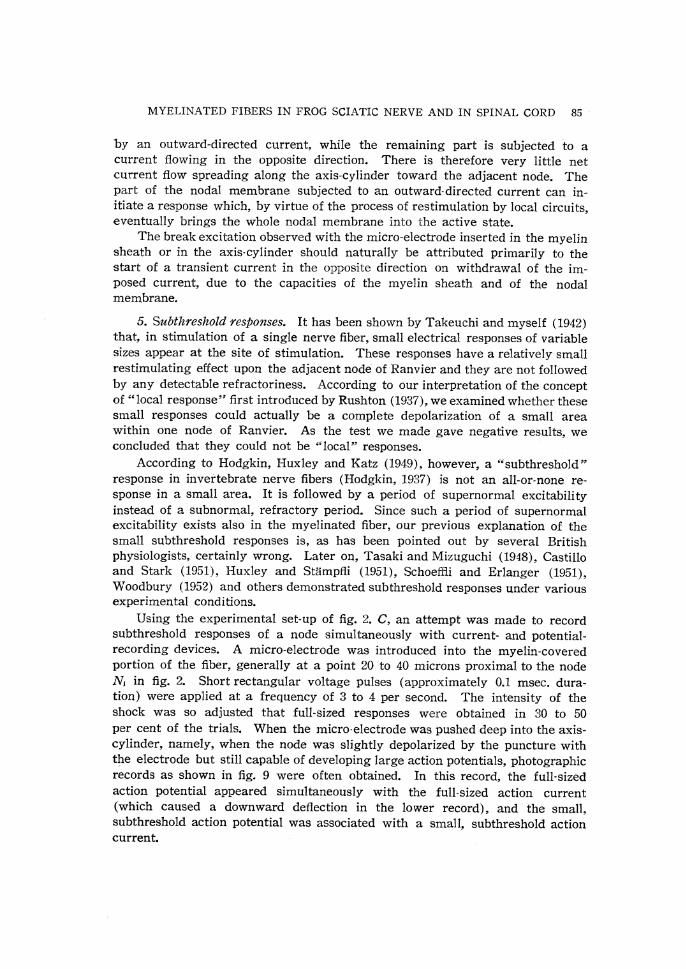
FIG. 14. Same as fig. 13. Note the num-
ber of the steps in the largest response in
record E. Time marker, 1000 cycles per
sec.
action potential records. An example of such records is furnished in fig. 14.Records A and B in this figure show the progressive decline in the spike heightwhich followed the appearance of a resting potential (about 20 mV in this case).Then the fiber was re-polarized with a constant current of 5 to 10×10-9 amperes,
and at various intensities two to four successive sweeps of the oscillographwere photographed on one frame of film. From these superimposed photo-
graphs, it seems to me safe to conclude that the highest action potential in recordD shows three discontinuities (in its slope ), or three notches.
In 1934, Erlanger and Blair made a similar observation on fibers in the peri-
pheral nerve and stressed the importance of the nodes of Ranvier in nervousconduction under anelectrotonus. Now we have strong evidence for believingthat the process of nervous conduction in the fibers in the spinal cord is similarto that in the peripheral nerve.
3. Measurement of threshold along individual fibers in the dorsal funiculus.Ono (1934), working under direction of Kubo, demonstrated that the threshold foran excised single nerve fiber, measured with an electrode of 10 to 100 micronsin diameter that was moved along the fiber, shows a sharp minimum at everynode of Ranvier. Since all the experiments described so far attest to a strik-ing similarity between fibers in the sciatic nerve and those in the dorsal funiculus,it seemed interesting to find whether or not individual fibers near the surfaceof the dorsal column of the spinal cord show a regular variation in thresholdlike the fibers in peripheral nerves.
The movable electrode used for this purpose was a glass capillary havinga tip of approximately 25 microns inside diameter and 40 microns outside dia-meter. The tip of this capillary was smoothed by grinding it on a fine oil-stone. This precaution was taken to avoid inflicting mechanical injury on the
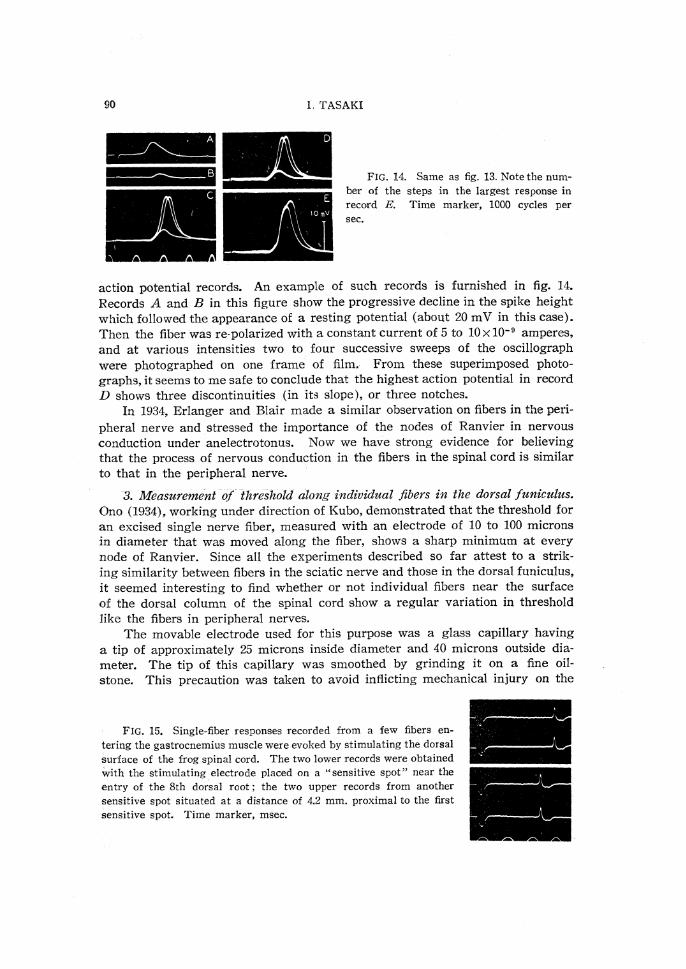
FIG. 15. Single-fiber responses recorded from a few fibers en-
tering the gastrocnemius muscle were evoked by stimulating the dorsal
surface of the frog spinal cord. The two lower records were obtained
with the stimulating electrode placed on a "sensitive spot" near the
entry of the 8th dorsal root; the two upper records from another
sensitive spot situated at a distance of 4.2 mm. proximal to the first
sensitive spot. Time marker, msec.

MYELINATED FIBERS IN FROG SCIATIC NERVE AND IN SPINAL CORD 91
nerve fibers in the cord when the electrode was moved along the surface of the pia. Stimulating currents, rectangular pulses of approximately 0.1 msec. dura-tion in most cases, were always applied through the intact pia. The stimulating electrode was connected to the cathode of a square wave generator. The anode of the stimulating circuit was in the bath of Ringer's fluid in which the spinal cord was immersed. The index of excitation was single fiber responses (fig. 15) from the nerve fibers entering the gastrocnemius muscle by way of the dorsal roots (see Method).
It was possible to demonstrate by this method that the threshold for an individual fiber in the dorsal funiculus shows a marked variation along its course.In favorable cases the course of the fiber could be traced for a stretch of 3 mm. or even more
(see fig. 16) ; the points at which the stimuli applied through the glass capillary gave single-fiber responses were found to lie on a long straight line, and all these highly sensitive spots
gave responses in one and the same single fiber (see fig. 15). The spacing between these sensi-tive spots was in general fairly regular. It was usually between 200 and 300 microns ; but di-stances of about 400 microns or more were also encountered in some preparations (in the frog). The point of interest in these experiments is that at the point half-way between these highly sensi-tive spots the fiber was practically insensitive to the stimulating current.
The absolute value of the current needed for this stimulation is also of some interest. For
pulses of 0.1 msec. duration, the threshold intensity ranged from 1.5 to 4.5 microamperes. This value is slightly less than the current intensity required for excitation of a single excised nerve fiber immersed in a volume of Ringer's fluid (Tasaki, 1950).
FIG. 16. Distribution of
the "sensitive spots" on the
dorsal surface of a bull frog
spinal cord. Single-fiber re-
sponses in the muscle nerve
were taken as the index of ex-
citation.
The classical theory of electricity tells us that the potential V at the tip of a
glass capillary of radius r through which a current of the intensity I is flowingis given approximately by
where S is the specific resistance of the fluid medium. According to the argu-ment developed previously, the potential V at the tip of a capillary, which is in contact with a node, should exceed, in order to stimulate the fiber, ap-
proximately one half of the threshold value obtained by the method of bridge-insu-lators. The rheobase of a single fiber mounted on bridge-insulator is generally between 25 and 40 mV regardless of the fiber type ; it is slightly greater in small fibers than in large ones and for shorter pulse duration it invariably

92 I.TASAKI
tends to become larger. According to this argument based on the data taken
from isolated single nerve fibers, therefore, the threshold voltage V at the tip of
the electrode should be of the order of 30 mV. Introducing this value andthe specific resistance of frog ringer for S, namely 102 ohm-cm., we find that the
threshold intensity of the current I measured with a glass capillary of radiusr placed directly on a node should be approximately
I≒4r milliamperes.
For a capillary having a tip of 25 microns diameter, namely r=1.25×10⁻³ cm.,
I should be approximately 5 microamperes. This calculated value agrees roughlywith the threshold obtained by the direct measurements mentioned above.
In the simplified argument above, we assume the fiber in the dorsal funi-culus to be imbedded in a continuous conducting medium with uniform spe-cific resistance. Undoubtedly, the white matter of the spinal cord has a specificresistance greater than that of frog ringer. This situation probably accountsfor the fact that the fibers in the dorsal funiculus show a threshold value a littlelower than the calculated value. Thus it seems to me safe to conclude thatthe sensitive spots along the fiber in the dorsal funiculus show practically thesame threshold value as the nodes of Ranvier of the fibers in the sciatic nerve.
The situation that the specific resistance (or rather the impedance) of thespinal cord is larger than that of the Ringer's fluid in which the cord is im-mersed tends to make the potential field generated by the stimulating currentin the cord decay more sharply than in a uniform conducting medium and con-sequently to make the variation of threshold along the fiber more pronounced.Actually, the threshold at the point half way between two neighboring sensitivespots was so high that it was practically impossible to get a response at all.The current intensity was varied by steps of 1 db. (11 per cent), and, to avoidunduly strong stimulation, it was not allowed to exceed 12 db. (400 per cent)above the threshold for the sensitive spots. In a certain stretch between twosensitive spots, this intensity was found to be ineffective. In the correspondingexperiments on the peripheral nerve fiber, the threshold along the fiber variedmore than 30 db. (Tasaki, 1950). A similar result was obtained by Lussier andRushton (1952) on individual fibers in an intact peripheral nerve.
By the technique described above it was not possible to trace the course ofa single fiber in the dorsal funiculus down to a spinal root. The threshold washigher near the two ends of a series of sensitive spots, and no response wasobtained from outside this region. This indicates that the fiber under in-vestigation no longer stayed in the most superficial layer at both ends of thesensitive region. Sometimes a tendency was seen that the course of the fiberapproached gradually to the mid-line of the spinal cord as it went upwards inthe dorsal funiculus.
Few attempts were made to estimate the conduction rate of the fibers inthe dorsal funiculus. Since the maximum length available in the cord wasonly 2 to 4 mm., the measurement was not accurate ; but, for fibers having arate of about 25 misec. in the sciatic nerve, the average rate in the cord wasfound to be slightly less than 10 m/sec.

MYELINATED FIBERS IN FROG SCIATIC NERVE AND IN SPINAL CORD 93
Most of these threshold measurements were made on small green frogs,
but a few experiments done on larger bull frogs indicated that for this kind ofexperiment the larger frogs are better than the smaller ones.
DISCUSSION
The experimental results described in Part I of this paper hardly requireany comment. All these new data confirm and substantiate the conclusionswe had reached previously (Tasaki and Takeuchi, 1941 and 1942). The nodesof Ranvier are only places in the myelinated nerve fiber at which the pro-cess of excitation can occur. The myelin sheath or a layer of myelin showsa high resistance to direct currents, but transient current pulses can flowthrough this layer. A pulse of outward-directed current sent through the nodalmembrane, or through a part of this membrane, can elicit a large responsewhich raises the potential of the axoplasm inside this membrane for a period ofabout 1 msec. This positive variation in the potential of the axoplasm spreadsalong the cable-like structure of the nternode. In a normal nerve fiber thiswave causes a strong outward-directed current through the adjacent node ofRanvier, strong enough to excite it in a very short time. This process of re-stimulation by the action current is generally referred to as the saltatory conduc-tion (see also Tasaki and Mizuguchi, 1948; Huxley and Stampfli, 1949).
The term "saltatory" caused a misunderstanding among some physiologists
(e.g. Bullock, 1951; Woodbury, 1952; Laporte, 1952). It is not correct to interpretthis term as meaning that an impulse jumps across each internode at an almostinfinite speed. On the contrary, a large part of the internodal conductiontime is spent in the above-mentioned spread of the potential wave along theinternode (Hodler, Stampfli and Tasaki, 1952). One of the conclusions in Huxleyand Stampfli's paper (1949), "the conduction time of the longitudinal actioncurrent is constant in each internode," is not quite correct.
The experimental results mentioned in Part II give us very strong physio-logical evidence against the belief that there are no nodes of Ranvier in the mye-linated fibers in the central nervous system (cf. Grundfest, 1937). Histologicalevidence against this wide-spread belief was presented recently by Huxley andStampfli and by Hess and Young (1949). According to Hess and Young, theinternodal length of the fibers in the spinal cord is proportional to the fiberdiameter, just as in peripheral nerves. The relatively short internodal distance in the fibers of the dorsal funiculus and the low conduction rate agree,at least qualitatively, with the histological finding that the fibers in this part ofthe spinal cord are smaller than in their path in the peripheral nerves.
CONCLUSIONS
1. Using micro-electrodes, resting and action potentials were recorded frominside isolated myelinated nerve fibers. The observed resting potential variedfrom zero to 30 mV, and the peak value of the action potential was less than30-40 mV. These low values are attributed to mechanical injury of the fibersby the electrode.
94 I. TASAKI
2. Action potentials of 1 to 30 mV (peak value) were frequently recordedwhen no resting potential was observed with the micro-electrode inserted intothe axis-cylinder. This phenomenon is ascribed to the high DC resistance of athin film of myelin that is assumed to have covered the tip of the electrode.
3. Difficulties in recording action potentials from inside small myelinatedfibers were encountered and are discussed.
4. By polarizing single nerve fibers in the dorsal funiculus, physiologicalevidence was secured that show the presence of nodes of Ranvier in the centralnervous system.
5. The threshold for a single fiber in the dorsal funiculus was found to varyconsiderably along its course. The nodes of Ranvier of the fiber could be located
by this method.6. The myelinated nerve in the central nervous system are very similar
to those in the peripheral nerves.
My thanks are due to Dr. Hallowell Davis for his help in preparing this paper forpublication.
REFERENCES
1. BULLOCK, T. H. Ann. Rev. Physiol. 13: 261-280, 1951.2. CASTILLO-NICOLAU, J. DEL AND STARK, L. J. Physiol. 114: 19 P, 1951.3. ERLANGER, J. AND BLAIR, E. A. Am. J. Physiol. 110: 287-311, 1934.4. GRUNDFEST, H. Ann. Rev. Physiol. 9: 477-506, 1947.5. HESS, A. AND YOUNG, J. Z. Nature 164: 490-493, 1949.6. HODGKIN, A. L. Proc. Roy. Soc. B. 126: 87-121, 1938.7. HODGKIN, A. L., HUXLEY, A. F. AND KATZ, B. Arch. Sc. Physiol. 3: 129, 1949.8. HODLER, J., STAMPFLI, R. AND TASAKI, I. Am. J. Physiol. in press.9. HUXLEY, A. F. AND STAMPFLI, R. J. Physiol. 108: 315-339, 1949; 112: 476-495, 1951.
10. HUXLEY, A. F. AND TASAKI, I. in preparation.11. KATO, G. Cold Spring Harbor Symposia on Quantitative Biology 4 202-213, 1936.12. LAPORTE, Y. I. Gen. Physiol. 35: 323-342, 1951.13. LING, G. AND GERARD, R. W. J. Cell. Comp. Physiol. 34: 382-396, 1949.14. LUSSIER, J. J. AND RUSHTON, W. A. H. J. Physiol. 117: 87-108, 1952.15. NASTUK, W. L. AND HODGKIN, A. L. J. Cell. Comp. Physiol. 35: 39-73, 1950.16. ONO, S. IN KATO, G. Microphysiology of Nerve, Tokyo, 1934.17. RUSHTON, W. A. H. Proc. Roy. Soc. B. 124: 210-243, 1937.18. SCHOEFFLE, G. M. AND ERLANGER, J . Am. J. Physiol. 167: 134-146, 1951.19. TASAKI, I. Am. J. Physiol. 125: 367-379, 1939.20. TASAKI, I. AND KANO, H. Japan. J. Med. Sci. III Biophysics 9: 17, 1942.21. TASAKI, I. AND MIZUGUCHI, K. J. Neurophysiol. 11: 295-303, 1938.22. TASAKI, I. AND TAKEUCHI, T. Pfliigers Arch. f. ges. Physiol. 244: 696-711, 1941; 245 :
764-771, 1942.23. WOODBURY, J. W. J. Cell. Comp. Physiol. 39: 323-339, 1952.