Embed Size (px)
Citation preview

1
Properties of Skeletal Muscle
Maryam Maheri
Kiana Kayoda, Nazalia, Emerald Bocobo
NPB 101 L section 008
TA: Ashneel Krishna
1/29/2015

2
Introduction:
In the Properties of Skeletal Muscle lab, we will be working on excitation-contraction
coupling. In this phenomenon electrical stimulus will convert to mechanical response. Muscle
tissue can form the structure of many organs in the animal body and they are required for
movement and force generation. There are three types of muscle based on their mechanism of
control and structure. skeletal muscle and cardiac muscle are striated, smooth muscle is
non-striated. skeletal muscle is voluntary, cardiac muscle and smooth muscle are
involuntary. We focused on the function of skeletal muscle in this lab. Skeletal muscle is
attached to to bone and allows us to walk and move. Skeletal Muscle is made up of muscle fibers
(muscle cells). Muscle cells, or muscle fibers contain smaller units called myofibrils. Myofibrils
are made of the thin actin proteins filaments and thick myosin protein filaments. Overlapping of
these two filaments will forms A band (made up of thick filaments along with portions of
thin filaments that) and I bands which together create the sarcomere; the contractile unit
(Martini 2012 pg. 293-295). In order for muscle to contract, actin and myosin must bind and
form cross bridges. This explains the Sliding-Filament Theory. This theory proposes that
contractile elements (thick and thin filaments) slide past each other during contraction and
muscle fibers change length without the filaments actually changing in length (Martini,2012 pg.
298).
Two different methods were used for stimulating gastrocnemius muscle in order to
compare the effects of neuronal stimulation (indirect) and muscular (direct). One method was to
stimulate the gastrocnemius directly with electrodes. Other method was to stimulate indirectly by
sending electrical current to the sciatic nerve. The sciatic nerve innervates the gastrocnemius
indirectly. Each neuron will recruit multiple muscle fibers. This mechanism is called Stimulation
neuromuscular interaction.

3
When an action potential is travels down the axon of a motor neuron and reaches the
axon terminal, acetylcholine is released into the neuromuscular junction. Acetylcholine will bind
to nicotinic receptors on the motor end plate, allowing positive ion to enter. Depolarization of
postsynaptic membrane travels across the muscle fiber and spreads into the T-tubules. Calcium is
eventually released into the cytosol of the muscle fiber and causes a conformational change of
the troponin and tropomyosin proteins. This allows cross bridges to form between actin and
myosin filaments, and a contraction ensues (Martini, 2012 pg. 300-305).
The purpose of this experiment is to observe effects of direct stimulation of
gastrocnemius muscle on frog, analyze the effects of stimulus intensity and stimulus frequency
on contraction and investigate effects of acetylcholine blockade on muscle activity. According
to everything that was discussed in above we hypothesize that as stimulus intensity and
frequency are increased, the muscle tension will increase as well, until it will lead to fatigue.
Since tubocurare competes with acetylcholine for binding sites on the nicotinic receptors we
expect to see smaller contractile response from the gastrocnemius after injecting tubocurare. We
expect to see stronger stimulus intensity to the gastrocnemius muscle when we are stimulating it
directly.
Materials & Methods:
Equipment set up : 1 medium length surgical scissors, 1-2 hemostats or forceps, 2 glass
dissecting probes, a 9 inch length of string, a 4-inch length of string, a cup of Ringer’s saline
solution, an eyedropper, and 2 hook electrodes. Biopac Student Lab Software. (Bautista &
Korber 2009, P.10).

4
The gastrocnemius will be tied to a muscle transducer that will record the tension
generated with different levels of frequencies and voltages. As we give electrical stimulation, we
will keep the frog hydrated with Frog Ringer’s solution which contains Ca2+
. We connected the
muscle to a transducer. We stimulated by increasing the voltage to find out the threshold and
maximum values. Next part of this lab we were calculating the change in voltage compare on the
first part and our recordings.
In other parts of the lab temporal and spatial summation, the effects of an acetylcholine
receptor blocking agent (tubocurare) and the effects of direct stimulation on skeletal muscle was
observed. A baseline tension of 20-30 grams was maintained. In the next part the gastrocnemius
muscle was injected with tubocurare. Muscle tension was measured every 2 minutes for 10
minutes. In the last part the effect of direct electrical stimulation to muscle was observed. Two
needle electrodes were used. One was inserted about 5mm from each end of the muscle (Bautista
& Korber 2009, P.15-16). There were no significant changes from the lab manual. We skipped
part 1-3 on page 14.
Results:
Threshold and Maximum
In this section of the experiment, we searched for the lowest voltage that could stimulate
the sciatic nerve (threshold, V max). This voltage can produce a twitch in the gastrocnemius
muscle of the frog. A recording devise (Biopac) was used to keep the record of data. The
threshold was measured at 0.24 V, which generated a tension of 21.23 grams. As we increased
the voltage, the twitch length increased until it reached a plateau at 0.3V. We started with a
voltage of 0.1V. Results are shown in table 1 below.
5
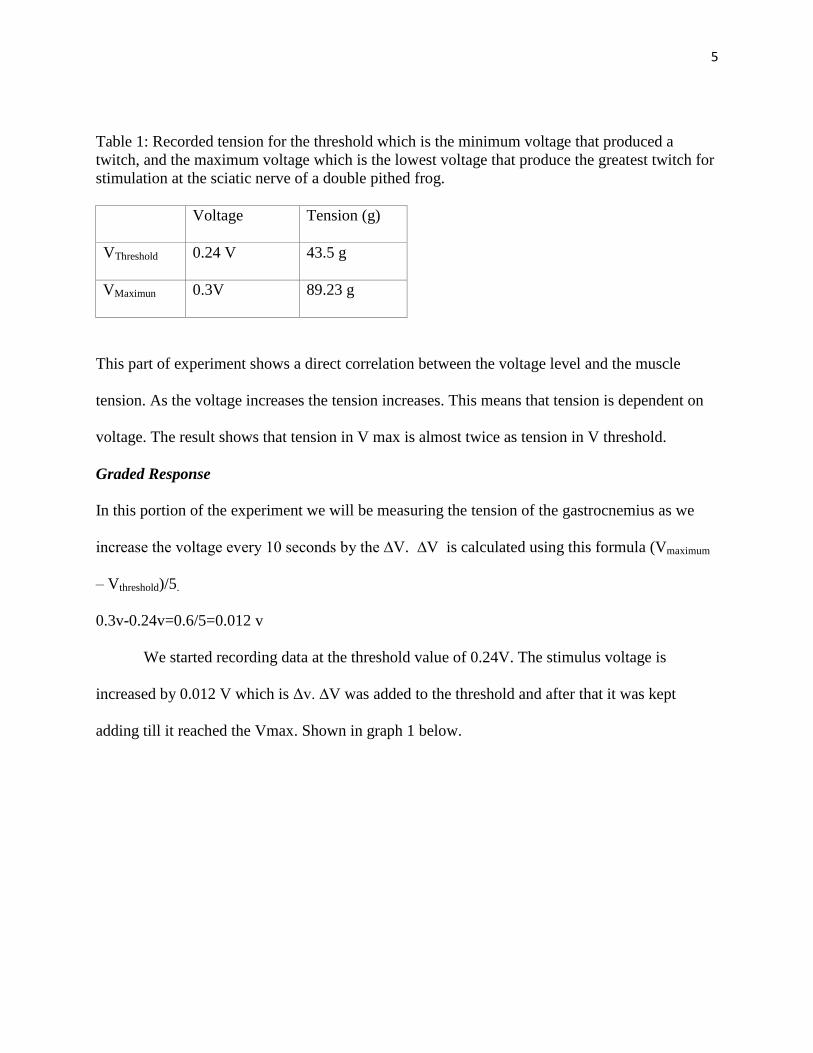
Table 1: Recorded tension for the threshold which is the minimum voltage that produced a
twitch, and the maximum voltage which is the lowest voltage that produce the greatest twitch for
stimulation at the sciatic nerve of a double pithed frog.
Voltage Tension (g)
VThresVVV VThreshold 0.24 V 43.5 g
VMaximun 0.3V 89.23 g
This part of experiment shows a direct correlation between the voltage level and the muscle
tension. As the voltage increases the tension increases. This means that tension is dependent on
voltage. The result shows that tension in V max is almost twice as tension in V threshold.
Graded Response
In this portion of the experiment we will be measuring the tension of the gastrocnemius as we
increase the voltage every 10 seconds by the ∆V. ∆V is calculated using this formula (Vmaximum
– Vthreshold)/5.
0.3v-0.24v=0.6/5=0.012 v
We started recording data at the threshold value of 0.24V. The stimulus voltage is
increased by 0.012 V which is Δv. ∆V was added to the threshold and after that it was kept
adding till it reached the Vmax. Shown in graph 1 below.

6
Graph 1: this graph shows a positive correlation between voltage and tension. An increase in
voltage creates a greater muscle tension; so increasing voltage means increasing tension. This
data was collected via stimulation of the sciatic nerve of a double pithed frog.
As the voltage increases the muscle tension increases. The tension produced by the Vmax is
84.08 grams.
Summation
In this part the effect of stimulus frequency on muscle activity is observed. In this section, we
provided a constant stimulus at our Vmaximum, while changing the frequency every 15 seconds to
0.5,1, 2, 4, 8, 15, and 25pps. We let the frog rest for while to recover between increasing the
frequencies. We set the baseline tension to 20-30 grams (Frog Tension = 19.62 grams). The only
parameter that was changing in this part of lab was frequency. Shown in graph 2 below.
26.5
63.1
82.4 81.9 82.6 84.8
0
10
20
30
40
50
60
70
80
90
0.22 0.24 0.26 0.28 0.3 0.32
Ten
sio
n (
g)
Voltage (V)
Voltage (V) vs Tension (g) Graded Response

7
Graph 2: increasing the frequency of the stimulation on the sciatic nerve of the frog can cause
summation and that end up increasing the tension. Increasing frequency also increased number of
twitches. There is a slightly decreased from 8 pps to 15pps (101.6- 100.6) that can be due to the
muscle fatigue. The mean of 4 peaks were obtained for the first 3 frequencies (0.5, 1,2pps) and
for the rest, maximum peak was measured for data collecting in this section. For the 4,8,15 and
25 pps the mean was not measured because the twitches fused.
Paralysis
W didn’t get to do this part of the lab. We were not able to get any data from our frog. The
muscle could have been fatigue or we didn’t add enough saline water. Data were collected from
other groups. For this section 0.25 ml of tubocurare was injected into the gastrocnemius muscle.
Voltage was set to Vmaximun. Some data on twitches were collected before the tubocurare was
injected. After the injection the muscle twitches were recorded for 10 minutes. In this part
tension of the twitches were slowly decreasing. Average of 4 peaks has been calculated. 4
twitches were chosen in 10-15 second intervals, every 2 minutes for 10 minutes. Shown in graph
3 below.
75.8 74.5 74.75 71.1
101.6 100.6 106.6
0
20
40
60
80
100
120
0 5 10 15 20 25 30
Ten
sio
n (
g)
Stimulus frequency (pps)
Tension (g) vs Stimulus frequency (pps)

8
Graph 3: the muscle tension for control portion was measured and it was 35.49 g. Two minutes
into the trial, after injection is done a slight increase in tension is observed (from 35.49 g to
38.45g). By four minutes the tension dropped to 27.17 g. From 6-8 minutes twitches were the
same. By 10 minutes, the twitches were barely observable (more like a flat line)
Direct Stimulation
Our group didn’t get any data and we looked at other group’s data for this section. In this section
electrodes were placed directly about 5mm from each end of gastrocnemius muscle. The changes
in tension were recorded as we increased the voltage. Vthrehold was recorded by direct stimulation.
Voltage was increased till the first twitch was observed. This part was done after injecting
tubocurare so barley any change from Vthrehold to 10 XVmax was observed. Shown in graph 4 below.
35.49 38.45
27.17 21.36 19.39 18.51
0 5
10 15 20 25 30 35 40 45
0 2 4 6 8 10 12
Ten
sio
n (
g)
Time(sec)
Tension (g) vs Time (s) Tubocurare Injection

9
Graph 4: Vmax when the sciatic nerve was stimulated was 0.3v and tension measured to be
84.08g. When gastrocnemius muscle was directly stimulated the threshold voltage recorded to be
2.6V with a 22.72 g tension. 10 X maximum voltage were calculated to be 3.0V with a 23.94g
tension. Voltage was then increased and passes 3.0v however an increase in tension was not
seen. Due to vague notes the Vmax measured is unclear however tensions didn’t increase passed
23.94 g.
Table 2: comparison of voltages and tensions obtained from direct stimulation to indirect
stimulation.
Voltage V Tension g Method
Vthreshold 2.6 V 22.72 g Direct stimulation
V10XMaximum 3.0 V 23.94 g Direct stimulation
VMax measured X V 23.94 g Direct stimulation
Vmax from graded
response graph
0.3V 84.8 g Indirect
stimulation
0
10
20
30
40
50
60
70
80
90
0.3 (Vmax from indirect
stimulation)
2.6 (V threshold direct)
3 direct stim(10x max indirect)
X ( v max direct unknown value )
Ten
sio
n (
g)
Voltage (v)
Voltage vs Tension: Direct &Indirect Stimulation
Series1

10
Discussion:
Muscle contractions are essential for normal functioning in life. Contraction happens
after muscle fiber is stimulated and it increases its tension. Action potentials are necessary in
creating a response in muscle fibers. They are called electrical impulses and have an all-or-none
response (Michael, 2012 pg.132). First, action potentials must travel down the axon of motor
neurons. Then the depolarization at the pre-synaptic neural terminal triggers voltage-gated
calcium channels to open and Ca2+
influx. The Ca2+
activates the release of acetylcholine into the
synaptic cleft. The acetylcholine binds to the acetylcholine receptors on the motor end plate and
causes an influx of Na+. When the excitatory post synaptic potential reaches threshold, an action
potential starts throughout the muscle fiber via T tubules that triggers the release of Ca2+
in the
sarcoplasmic reticulum (SR). Calcium ions bind to troponin on actin filaments which causes
tropomyosin to remove and that will make the cross bridge binding sites on actin available to
bind. The myosin cross bridges attach to the actin. This prosses uses ATP (Michael, 2012
pg.127-128). Ca2+
is taken up by the SR in the absence of action potential. In this case
tropomyosin returns into blocking position, and contraction is complete (Martini, 2012 pg. 300-
303). Absence of ATP or an inability to remove calcium results in a rigor complex (D.G Allen
2008).
In this lab we stimulate the sciatic nerve directly. We will be looking at the basic skeletal
muscle function of the gastrocnemius muscle in frog. By isolating the sciatic nerve, we can give
an electrical current with electrodes attached to the muscle fibers of the gastrocnemius, getting
electrical impulses from the brain going down the spinal cord and see the results of contraction
(efferent). In this lab we expect to see an increase in tension/twitch as we increase the voltage

11
with a constant frequency because we are recruiting more motor neurons. At some point the
tension that was created will reach its maximum and all of the motor neurons will be involved;
this type of summation is called spatial summation. When we have that voltage with the max
tension we can increase the frequency and that will produce temporal summation, where we will
expect to see the twitches summed together producing more tension. Keeping the stimulus at a
high frequency can result in fatigue. Muscle fibers are limited in generating force.
In the first part of this lab gastrocnemius contraction was created by stimulating the
sciatic nerve. Motor neurons in the sciatic nerve are cable of innervating gastrocnemius muscle
fibers. Voltage (stimulation strength) was increased in order to observe the smallest twitch and
also to observe the maximum tension produced by the gastrocnemius. Changes in voltage to the
sciatic nerve affect how strongly the gastrocnemius muscle will be contracted. The higher the
stimulation, the more acetylcholine is released by the motor neuron in the synaptic cleft. The
higher Ach in synaptic cleft the more binding to the nicotinic receptors and this will cause a
greater depolarization. This will cause the release of more Ca2+
into the cytosol. Higher level of
Ca2+
in cytosol means there are more Ca2+
to bind to more myosin binding sites on actin and this
will cause more cross bridges and a stronger muscle contraction. Thus, the more Ca2+
presents
the faster the speed in muscle contraction. Stronger contractions also recruit of more motor units
until it reach their limit. This process was shown in table 1. Threshold (smallest visible twitch)
was 0.24V and the maximum voltage was seen at 0.3V. This can show that 0.24 V was strong
enough to convert the electrical signal to a chemical for the contraction to start. The Vmax is the
point that after that no matter how much the voltage and the strength of stimulation is increased
the tension stays constant and doesn’t get any bigger than what it is. This experiment support the
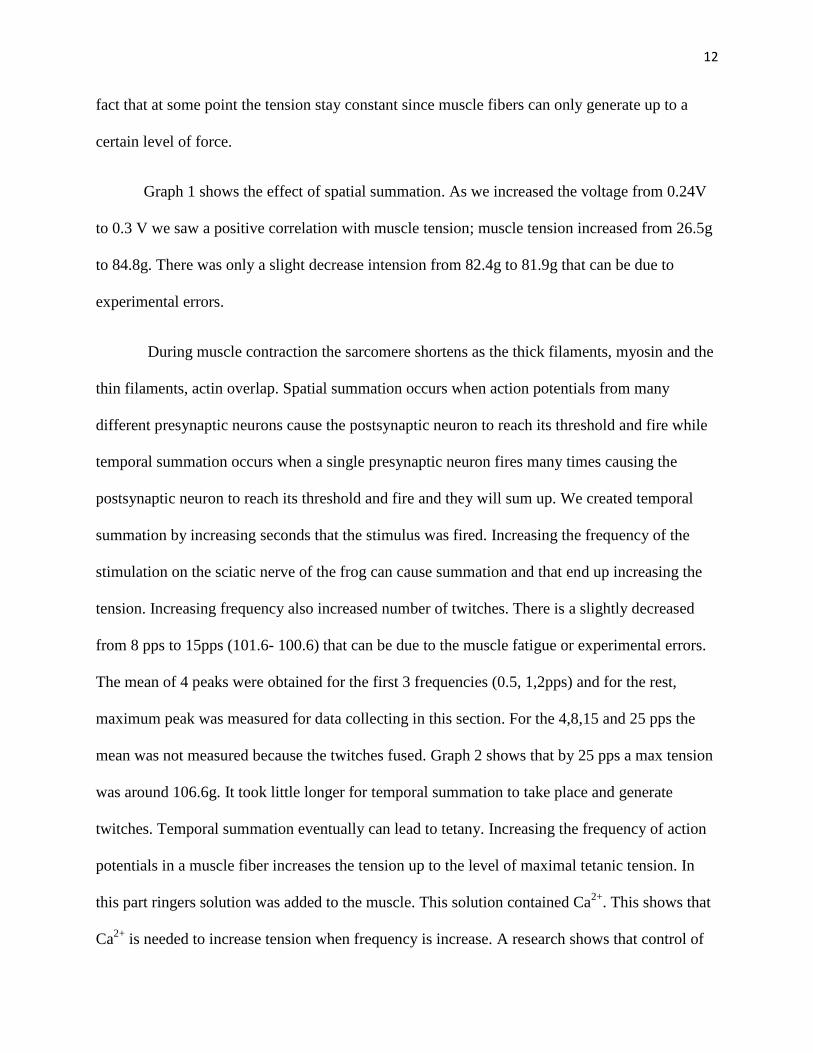
12
fact that at some point the tension stay constant since muscle fibers can only generate up to a
certain level of force.
Graph 1 shows the effect of spatial summation. As we increased the voltage from 0.24V
to 0.3 V we saw a positive correlation with muscle tension; muscle tension increased from 26.5g
to 84.8g. There was only a slight decrease intension from 82.4g to 81.9g that can be due to
experimental errors.
During muscle contraction the sarcomere shortens as the thick filaments, myosin and the
thin filaments, actin overlap. Spatial summation occurs when action potentials from many
different presynaptic neurons cause the postsynaptic neuron to reach its threshold and fire while
temporal summation occurs when a single presynaptic neuron fires many times causing the
postsynaptic neuron to reach its threshold and fire and they will sum up. We created temporal
summation by increasing seconds that the stimulus was fired. Increasing the frequency of the
stimulation on the sciatic nerve of the frog can cause summation and that end up increasing the
tension. Increasing frequency also increased number of twitches. There is a slightly decreased
from 8 pps to 15pps (101.6- 100.6) that can be due to the muscle fatigue or experimental errors.
The mean of 4 peaks were obtained for the first 3 frequencies (0.5, 1,2pps) and for the rest,
maximum peak was measured for data collecting in this section. For the 4,8,15 and 25 pps the
mean was not measured because the twitches fused. Graph 2 shows that by 25 pps a max tension
was around 106.6g. It took little longer for temporal summation to take place and generate
twitches. Temporal summation eventually can lead to tetany. Increasing the frequency of action
potentials in a muscle fiber increases the tension up to the level of maximal tetanic tension. In
this part ringers solution was added to the muscle. This solution contained Ca2+
. This shows that
Ca2+
is needed to increase tension when frequency is increase. A research shows that control of

13
contraction and relaxation of muscles is achieved by 3 mechanisms of Ca2+
. First mechanism is
in the cardiac and skeletal muscle by activating troponin, tropomyosin on the actin filaments.
The second mechanism is in smooth muscle where Ca2+
, together with calmodulin (CaM),
activates myosin light-chain kinase, which (through phosphorylation of the myosin light chains)
initiates muscle contraction. The third mechanism consists of direct binding of Ca2+
to myosin
which regulates contraction in muscles. This research also states that the speed of muscle
contraction and relaxation is critically dependent on the Ca2+
(Heinrich, et al. 2000).
In the next part of this lab we worked on paralyzing the muscle. Due to muscle fatigue or not
adding enough ringers saline solution our group wasn’t able to collect any data in this section.
Tubocurare was injected directly into the gastrocnemius muscle of the frog. Tubocurare is a
paralytic agent. This solution affects the neuromuscular junction by competing with Ach for
binding sites on nicotinic receptors. Binding of Tubocurare to nicotinic receptors prevents Ach to
bind so no action potential will generate to start muscle contraction. Our data in graph 3 shows
that as we increased the voltage, muscle tension decreased. The muscle tension for control
portion was measured to be 35.49 g. Two minutes into the trial, after injection was done a slight
increase in tension is observed (from 35.49 g to 38.45g) that could be due to experimental errors.
By four minutes the tension dropped to 27.17 g. From 6-8 minutes twitches were the same. By
10 minutes, the twitches were barely observable (more like a flat line). Tubocurare in some
levels can be lethal; however it was able to recover in this lab and the muscle was used in the last
portion of experiment. Kordik, Biilbring and Burn Observed that tubocurarine has an inhibitory
action as low as 10-6
g/ml (Margaret. et al. 1958).
As it was discussed before, stimulation travels down the axon to the neuromuscular
junction in order for excitation-contraction coupling to occur. In the last part of experiment

14
electricity was directly used to stimulate the gastrocnemius muscle. This will be an all or none
response (Michael, 2012 pg.132). Electricity was used instead of Ach to stimulate gastrocnemius
muscle directly. As it was stated before Ca2+
is required in the presynaptic terminal to releases
the Ach in cleft. It could be a good conclusion that Ca2+
is not needed since Ach is no more
needed during direct stimulation however Ca2+
is needed for myosin binding sites on actin to be
activated. When ringers staline solution is not added, muscle contracts until the intracellular Ca2+
deplete. Graph 4 shows that Vmax when the sciatic nerve was stimulated was 0.3v and tension
measured to be 84.08g (table 1). When gastrocnemius muscle was directly stimulated the
threshold voltage recorded to be 2.6V with a 22.72 g tension. 10 X maximum voltage were
calculated to be 3.0v with a 23.94g tension. Voltage was then increased and passes 3.0v however
an increase in tension was not seen. Due to vague notes the Vmax measured is unclear however
tensions didn’t increase passed 23.94 g. comparing the data from this section to the first section
shows that a greater voltage is needed to stimulate muscle directly. This is shown in table 2.
The results of this experiment proved that Calcium is necessary in producing muscle
twitches. With The absence of ringers saltine solution small or no responses was observed. We
observed that an increase in voltage results in Threshold and increasing of frequency will increases
the occurrence of tetany. We observed the inhibitory effects of tubocurare.

15
Works Cited 1. Martini, Fredric. In Anatomy & Physiology, by Martini, 294. Pearson, 2012, PP 293-
295,300-305.
2. E. Bautista, J. Korber, Properties of Skeletal Muscle. NPB 101L Systemic Physiology Lab
Manual. (Mason, OH: Cengage Learning, ed. 2, 2009), 9-17. [second edition].
3. Johnson, Michael. Human Biology. pearson, 2012, PP 132,127,128.
4. D. G. Allen, G. D. Lamb , H. Westerblad. "Skeletal Muscle Fatigue: Cellular
Mechanisms." American Journal Physiology, 2008.
5. Martin W. Berchtold, Heinrich Brinkmeier , Markus Müntener. "Calcium Ion in Skeletal
Muscle: Its Crucial Role for Muscle Function, Plasticity, and Disease." American
physilogical society, 2000.
6. Day, Burn and Margaret. "The Action of Tubocurareand acetylcholine on Ciliary
Movement." The Journal of Physiology, 1958: 7.

16
Appendix
Raw Data
Graph 1
Screenshot of our raw data from tension readings of gastrocnemius muscle contractions with
increasing voltage stimulus.
Graph 2
Screenshot of our raw data from tension readings of gastrocnemius muscle contractions at
frequencies of 0.5, 1.0, 2, 4, 8, 15, and 25pps over time. Stimulation of 15 seconds interval.
17
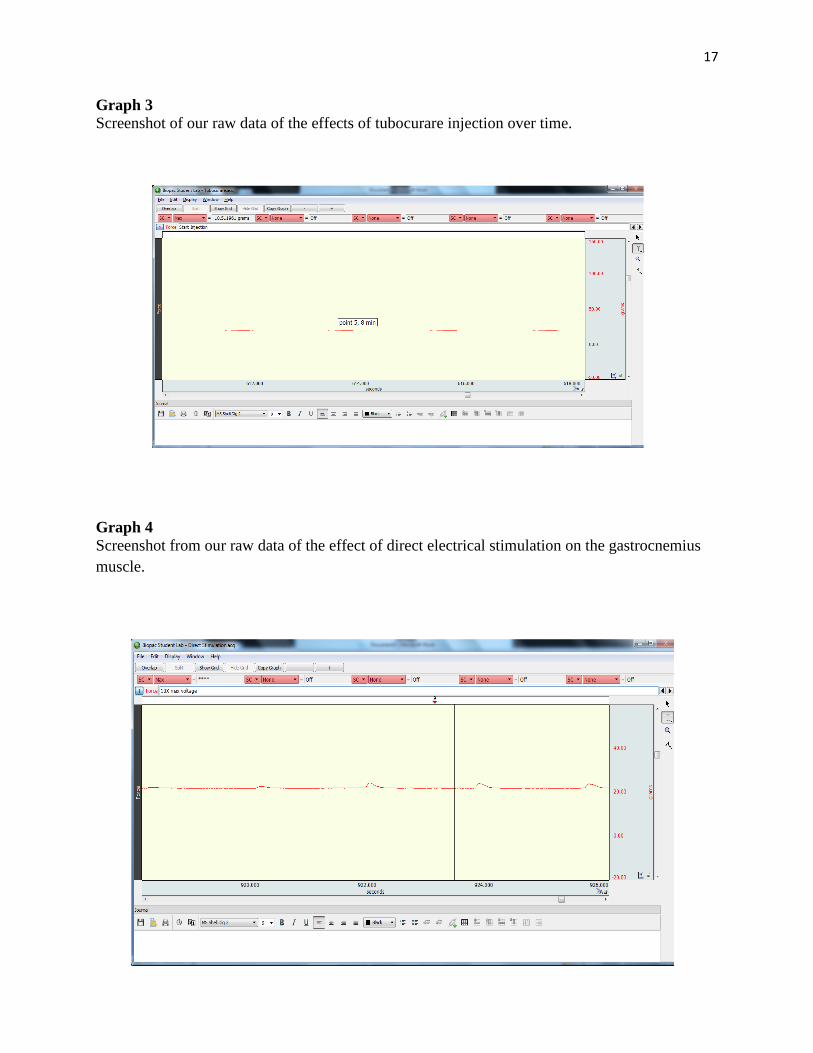
Graph 3
Screenshot of our raw data of the effects of tubocurare injection over time.
Graph 4
Screenshot from our raw data of the effect of direct electrical stimulation on the gastrocnemius
muscle.