Embed Size (px)
Citation preview

EThekwini Property Market Review 2007/2008
PPRROOPPEERRTTYY MMAARRKKEETT RREEVVIIEEWW
TTHHEE DDUURRBBAANN MMEETTRROO RREEGGIIOONN
ETHEKWINI MUNICIPALITY
ECONOMIC DEVELOPMENT UNIT
2007-2008
DDOOCCUUMMEENNTT PPRREEPPAARREEDD BBYY::
Viruly Consulting (Pty) Ltd
Contribution from Ramesh Amrit (2006)
(Letchimah Daya Mandindi)
LDM PROPERTY RESEARCHA Division of LETCHMIAH ⏐ DAYA ⏐ MANDINDI

EThekwini Property Market Review 2007/2008
0046/07/FV Page 2 24/10/2007
CONTENTS
EXECUTIVE SUMMARY 4
1. INTRODUCTION 6
1.1 THE BRIEF 7
1.2 REPORT STRUCTURE 7
2. THE SOUTH AFRICAN PROPERTY MARKET 8
2.1 THE MACRO ENVIRONMENT 8
2.2 MACRO PROPERTY TRENDS 10
3. THE ETHEKWINI MUNICIPALITY IN CONTEXT 16
3.1 THE ECONOMY 17
3.2 THE NODAL PROPERTY MARKET 21
3.2.1 THE DURBAN CBD 23
3.2.2 THE CENTRAL NODE 25
3.2.3 THE WESTERN NODES 26
3.2.4 THE NORTHERN NODES 29
3.2.5 THE SOUTHERN NODES 32
3.3 THE SIZE OF THE COMMERCIAL MARKET 34
4. PROPERTY MARKET INDICATORS 37
4.1 THE DURBAN CBD 38
4.2 THE CENTRAL NODES 39
4.3 THE WESTERN NODES 40
4.4 THE NORTHERN NODES 44
4.5 THE SOUTHERN NODES 46
5. INVESTMENT INCENTIVES AND URBAN REGENERATION 48
5.1 REGENERATION PROJECTS 50
5.2 THE POINT WATERFRONT 51
5.3 THE DURBAN INVESTMENT AGENCY 51
5.4 THE URBAN DEVELOPMENT ZONE 53
6. CONCLUDING REMARKS 55
7. REFERENCES AND NOTES 57
All care has been taken in the preparation of this document and the information contained
herein has been derived from sources believed to be accurate and reliable. Viruly Consulting
(Pty) Limited does not assume responsibility for any error, omission or opinion expressed as
well as investment decisions based on this information.

EThekwini Property Market Review 2007/2008
0046/07/FV Page 3 24/10/2007
EXECUTIVE SUMMARY
The South African property market is benefiting from a strong macro-economic
environment, characterized by a stable inflation rate and improved prospects for
economic growth. This is translating into a decline in vacancy rates, and rising
rentals and capital values in most sectors of the South African property market.
The eThekwini Municipality is underpinned by strengthening conditions in the
manufacturing, chemical and tourism sectors. Moreover, the expected growth of
the harbour will continue to pose opportunities and challenges for the demand of
suitably located land.
The eThekwini retail, office and industrial markets are currently showing strong
growth mainly due to the favourable macro commercial market fundamentals and
this has resulted in positive real investment returns in most sectors of the market.
Although the 2005 investment returns produced by the Investment Property Data
Bank (IPD) were at their highest since the data was collated in 1995, IPD indices
reporting returns to December 2006 show a slight downward adjustment in
returns, the sharpest decline being in retail which has dipped below the 30%
level. Industrial and office returns have experienced less of a drop with industrial
sector remaining above the 30% level and the office sector also showing relative
stability.
From a micro perspective, demand for industrial and office space remains buoyant
in major nodes of the eThekwini market. Such nodes include the Berea,
Umhlanga/La Lucia Ridge and Westville. Moreover, the CBD is also showing
increased demand, especially from smaller tenants, and ABSA’s decision to
reinvest in the CBD, through an upgrade to their existing building, and Standard
Bank’s decision to relocate to the Kingsmead Office node is reflective of renewed
investor confidence and the efficacy of incentives created by the UDZ tax
accelerated depreciation allowances.
Added to this, nodes such as Kingsmead are being supported by public sector
initiatives. These include the recently completed ICC Arena, being the extension
to the existing convention centre. Kingsmead is also expected to benefit from the

EThekwini Property Market Review 2007/2008
0046/07/FV Page 4 24/10/2007
development of a proposed international sports precinct supported by the
eThekwini municipality and its joint partnerships and Durban Investment
Promotion Agency. Such organisations are also involved in facilitating urban
regeneration projects such as Warwick Junction, the Point development, and the
Beachfront. The flagship development of uShaka Marine Theme Park has provided
a catalyst for the further development of the Point into a vibrant mixed-use
development. Therefore, it can be argued, that the market is benefiting from
improved market conditions resulting from strong market fundamentals and
appropriate public sector interventions. The future spatial form of the local
economy is also being influenced by the forthcoming development of the Dube
Trade Port and the King Shaka International Airport.
A disaggregation of market statistics suggests that rentals are generally on the
rise reflecting higher building costs and strong market fundamentals. In
Umhlanga/La Lucia and Westville, rentals for newer stock are driving peak rentals
to levels above R100/m² gross for new stock.
The retail market is also showing signs of strong investment returns and this is
being matched with proposals for new retail developments, especially in areas
that in the past have been under-catered for. Reflecting national trends, interest
in this sector is extending into new nodes such as Umlazi and other townships in
the municipal area.
Consequently, development activity is also spreading itself to the southern
commercial nodes. These nodes have for decades provided good locations for
industrial sector tenants that need to be located in the South Durban Basin and
the port. With the proposed relocation of Durban International airport, the
potential exists for good industrial land to be released into the market. However,
there are question marks over the future use of this land due to its potential to
accommodate port expansion.
The future success of the metropolitan property market will also rely on ensuring
that appropriate city integration is realised, and this will mean the integration of
‘home, work and play’ for different income groups. This will also require a careful
assessment of transportation requirements, a sector which seems to be lagging
EThekwini Property Market Review 2007/2008
0046/07/FV Page 5 24/10/2007
behind in the urban restructuring process. The challenge lies in ensuring that
households are able to seek locations that optimise the ability to secure
employment.
For the South African property investor, the challenge will lie in correctly reading
the major trends that drive the municipal economic base and developing
properties that support the municipal economic trajectory. Success in achieving
this requires an appropriate co-ordination between the private and public sectors.
1. INTRODUCTION
The role of the eThekwini Municipality’s Economic Development Unit (EDU) is to
guide the municipality in optimising economic development, job creation and
redistribution opportunities for the residents of the eThekwini region. A specialised
unit has also been set up to focus on private investment and development
promotions. This unit has the following roles:
To advise the local government on issues affecting the private sector and
investment.
To implement local government programmes to support private sector
development and investment.
To advise potential investors on issues affecting their business interests in the
Durban Metro Area (eThekwini Municipality).
This report aims to assist the EDU’s role in encouraging private sector investment
through the dissemination of market information to investors. The report primarily
considers the status of the Durban Property Market as well as development and
investment opportunities in the municipal property sector.

EThekwini Property Market Review 2007/2008
0046/07/FV Page 6 24/10/2007
1.1 THE BRIEF
The report is focused on the following:
An introduction to the property investment environment that includes a broad
overview of the macro South African commercial property market, paying
special attention to the major market trends impacting on the South African
property market.
Economic development, land strategy and other objectives of the eThekwini
municipality that may optimise property development and investment.
Emphasis on special features of Durban and other regional attributes such as
tourism attractions and its unique features.
Discussing the prime industrial, office and retail property nodes of Durban.
Providing updates on major property and infrastructural projects.
Highlighting institutional and other factors that investors should take into
account when considering entering the Durban property market.
1.2 REPORT STRUCTURE
The report is structured as follows:
Section 2: The section will discuss macro trends affecting the property market in
the Durban property market.
Section 3: Introduction to eThekwini Municipality – the administrative local
government of the Durban property market – an overview of the socio-economic
profile of the municipality, and general characteristics of the region. The section
will also introduce the main commercial and industrial nodes of the municipality -
their characteristics and general development trends.
Section 4: Analyses the property market nodes, characteristics, property
indicators and parameters of the different nodes in the urban property market.
Section 5: Discusses political objectives that support property development as
well as important policies in place from government level. Major development

EThekwini Property Market Review 2007/2008
0046/07/FV Page 7 24/10/2007
projects led by the public sector and supported by the private sector in eThekwini
will also be emphasised.
Section 6: Provides concluding remarks.
2. THE SOUTH AFRICAN PROPERTY MARKET
The macro economic environment has a significant impact on micro property
trends in South African cities, especially in determining the level of development
activity and where this activity occurs. But at the same time the demand for
commercial space is a function of the performance and future prospects of the
local economic base. The economic development of the municipality will have a
spatial dimension which the municipality is in a position to influence. Yet, cities
around the world are finding it increasingly difficult to foresee and react to such
trends.
2.1 THE MACRO ENVIRONMENT
The macro property market operates within an institutional framework that
comprises four main environments; these are of a socio-political, economic,
financial, technological and infrastructural nature. To this, one can add issues
such as lifestyle as illustrated in the Figure 1. This institutional environment
influences the property market by determining:
The type of investments that occur;
The property cycle and its various peaks and lows;
Where developments occur; and
Who has access to land?
EThekwini Property Market Review 2007/2008
0046/07/FV Page 8 24/10/2007
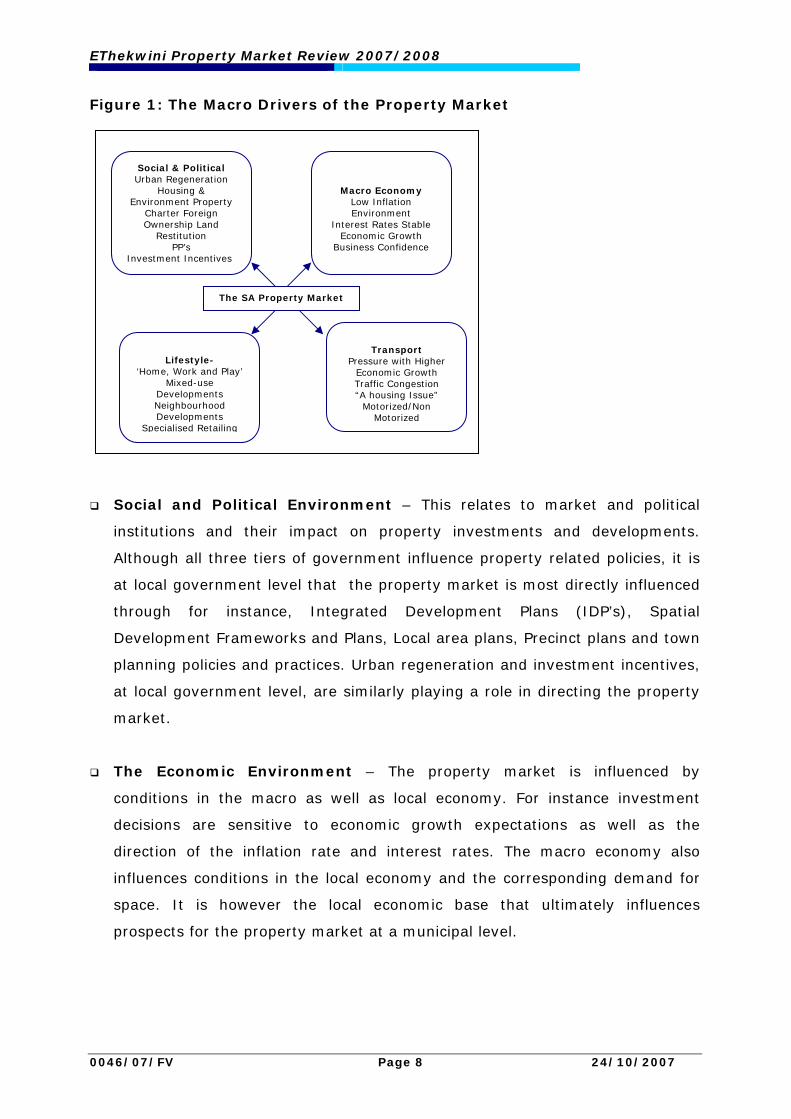
Figure 1: The Macro Drivers of the Property Market
Social and Political Environment – This relates to market and political
institutions and their impact on property investments and developments.
Although all three tiers of government influence property related policies, it is
at local government level that the property market is most directly influenced
through for instance, Integrated Development Plans (IDP’s), Spatial
Development Frameworks and Plans, Local area plans, Precinct plans and town
planning policies and practices. Urban regeneration and investment incentives,
at local government level, are similarly playing a role in directing the property
market.
The Economic Environment – The property market is influenced by
conditions in the macro as well as local economy. For instance investment
decisions are sensitive to economic growth expectations as well as the
direction of the inflation rate and interest rates. The macro economy also
influences conditions in the local economy and the corresponding demand for
space. It is however the local economic base that ultimately influences
prospects for the property market at a municipal level.
Social & Political Urban Regeneration
Housing & Environment Property
Charter Foreign Ownership Land
Restitution PP’s
Investment Incentives
Macro Economy Low Inflation Environment
Interest Rates Stable Economic Growth
Business Confidence
Lifestyle-
‘Home, Work and Play’ Mixed-use
Developments Neighbourhood Developments
Specialised Retailing
Transport
Pressure with Higher Economic Growth Traffic Congestion “A housing Issue”
Motorized/Non Motorized
The SA Property Market

EThekwini Property Market Review 2007/2008
0046/07/FV Page 9 24/10/2007
Transport and Infrastructural Environment - Infrastructure provision has
a strong influence on property development and investment decisions. For
instance, traffic congestion is becoming a critical issue in many South African
cities and has started to influence locational decisions by businesses and
households. Levels of traffic congestion have become of significance in the
northern commercial nodes of La Lucia/Ridge Umhlanga and Mount
Edgecombe. Although the trend remains unclear, there are indications that
traffic congestion and other infrastructural impediments could in due course
shift investors and tenants back to the Central Business District (CBD) and its
periphery, where infrastructure seems to be adequate. A further point is that
stricter environmental regulations could also make CBD “brownfield
developments” attractive.
2.2 MACRO PROPERTY TRENDS
This section of the report looks at the macro drivers of the property market and
how these will in due course impact on the Durban property market.
As already mentioned, the relatively good performance of the Macro economy is
underpinning the Durban Property Market. The challenge will lie in ensuring that
the Durban market captures these benefits and that the property market plays a
role in improving economic efficiencies.
The drivers for the different components of the market differ for the office, retail
and industrial markets.
The Retail Sector
The retail property sector is both dictated by trends at the macro and
micro level. Macro economic parameters influence consumption
expenditure and therefore national retail sales.
From a micro perspective, retail developments are influenced by the
performance of shopping centre catchment areas or the buying power of
nodes. In turn this is driven by the performance of specific residential
areas. Locational issues are also of importance, with for instance the CBD
EThekwini Property Market Review 2007/2008
0046/07/FV Page 10 24/10/2007
playing an important role in attracting retailers across the municipal area
and beyond.
The overall market view seems to be that the Durban property market
continues to offer significant retailing opportunities. This being equally
true for the higher income northern nodes and the lower income township
market. Large shopping centres such as The Pavilion and Gateway have
expanded, and investors are eyeing the southern nodes of the municipal
area, which have not received significant investor interest in recent years.
Several shopping centres have been proposed in and around the
Amanzimtoti area.
The Office Sector
The office sector is mainly driven by conditions in the local economy as
well as the attractiveness of a city as an office location. In the early
2000’s the macro office sector in general experienced depressed
conditions mainly reflecting a period of heightened oversupply, high
vacancy rates and a resulting decline in rental increases. This not only
affected the already depressed CBD market, but also impacted on the
performance of decentralised nodes. From 2004 onwards the sector
stabilised with vacancies starting to decline, this in turn has led to
improved prospects for rental increases and development potentials. The
vacancy trends are discussed in greater detail in other sections of this
report.
The past decade has seen a decentralization of office nodes in most South
African office markets –this in turn has left CBD’s with high vacancy rates
and low levels of investor interest. Yet, the scenario is changing with the
capital value of properties in such nodes rapidly rising and new investors
entering the market. Although there has been a growth on decentralised
office space Durban’s national share of office space in real terms has been
shrinking when compared with other centres. This suggests that growth in
decentralised nodes is more firmly linked to movement away from the
CBD rather than the absorption of new space.

EThekwini Property Market Review 2007/2008
0046/07/FV Page 11 24/10/2007
The Industrial Sector
The industrial sector tends to be a market that is not as speculative as the
office market and retail markets. Most developments in this sector of the
market tend to be tenant-driven and highly dependent on the
performance of the local manufacturing sector. This sector is also showing
an upswing, after a period of high vacancies and low rental increases.
Market data suggests that there is a shortage in the supply of well-located
industrial space and that there is demand for industrial land in the
different commercial nodes of the municipality.
The Durban property market has been at the forefront of the national
industrial sector recovery with nodes such as Briardene and Riverhorse
Valley Business Estate showing rising demand. Large national tenants
have also been keen to take up space with good highway frontage and
exposure.
Future growth of the sector will rely on the municipality stimulating
sectors that have good long-term prospects and to ensure that such
sectors are appropriately clustered. The expected growth in the port will
also remain an important parameter in determining the future demand for
industrial space.
Mixed-use Developments
The focus on mixed-use developments, which includes business estates,
with other uses is growing in popularity. Such developments are an
attempt to create an attractive life style. Mixed-use developments can
either be of a private sector nature, or created through specific public
sector interventions. The Umhlanga Node, through its New Town Centre,
is possibly a good example of this trend, with further investment being
planned in this area.
The Point Waterfront also offers an opportunity for the development of
such a mixed-use development. But, such developments come with
numerous challenges and sometimes contradictions. This relates to both
the challenges of accommodating different uses in close proximity to each

EThekwini Property Market Review 2007/2008
0046/07/FV Page 12 24/10/2007
other, and the need to create true mixed-use environments in support of
new urban lifestyle choices. Experience around the country suggests that
the success of mixed use developments is influenced by the size of such
developments and ensuring that the phasing occurs in an appropriate
fashion.
The further challenge lies in ensuring that such mixed-use developments
occur in different parts of the city. While in the more affluent areas such
developments are often initiated by the private sector, in lower income
areas this role often needs to be initiated by the public sector.
The Investment Property Data Bank (IPD) provides the following disaggregated
figures for the South African property market.
The table below illustrates the trend in property returns over an eleven-year
period.
Table 1: Total Returns for the Property Market
95 96 97 98 99 00 01 02 03 04 05 06
Retail 16.9 17.2 23.0 9.1 17.9 10.4 13.4 11.0 17.4 26.1 33.0 27.4
Offices 14.8 9.9 12.8 1.6 9.5 12.7 7.8 5.1 8.5 16.7 24.5 24.5
Industrial 13.5 17.9 16.8 2.1 8.3 7.1 7.5 8.8 17.5 24.4 33.1 31.1
Other 15.2 16.9 18.1 5.1 24.9 16.6 10.0 20.5 25.4 27.5 26.0 22.0
All property
15.3 14.1 17.5 5.1 13.7 11.2 10.6 9.5 15.1 23.4 30.1 26.7
Source: IPD, 2006
The strong returns achieved for all property sectors from 2003 to 2005 were
driven largely by the substantial reduction in interest rates and the accompanying
reduction of property capitalisation rates. This placed upward pressure on both
yields and capital values.
In 2006, the industrial sector outperformed the market as a whole recording total
returns of 31.1%, (this takes into account both capital growth and income
return). Although the strengthening of the Rand has continued to negatively
EThekwini Property Market Review 2007/2008
0046/07/FV Page 13 24/10/2007
impact on this sector, investors in this sector of the market continue to search for
land with appropriate infrastructure. But generally, it is the retail sector that
outperformed the market in recent years, on the back of declining interest rates.
Recent figures suggest that whilst the performance of the retail and industrial
sectors retracted somewhat in 2006 the performance of the office sector remained
stable.
In understanding the possible direction of future returns, consideration should be
given to expected supply. In this regard, building plans passed and completed
require analysis.
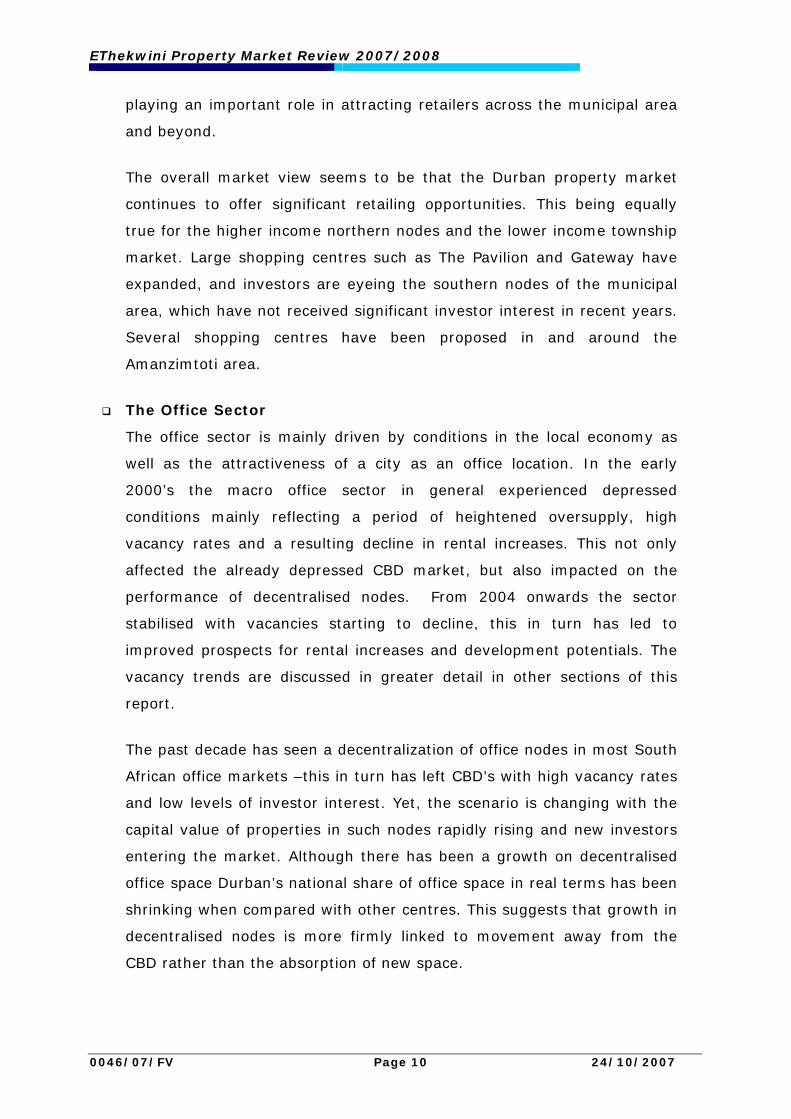
Graph 1: National Property Market
(Total building Plans passed for the Non-residential Property Sectors)
Source: Stats SA
Building plans passed have been on the rise in the past two years reflecting an
improvement in market conditions at a national level.
The value of buildings completed for the six metropolitan municipalities
contributed 71.0% or R27 588, 8 million to the total value of buildings completed
in South Africa.
0
50,000
100,000
150,000
200,000
250,000
1987
1988
1989
1990
1991
1992
1993
1994
1995
1996
1997
1998
1999
2000
2001
2002
2003
2004
2005
2006
2007
m2
Industrial Office Shopping

EThekwini Property Market Review 2007/2008
0046/07/FV Page 14 24/10/2007
A comparison of building plans completed in 2005 and 2006 shows that:
240,319 sqm of non-residential space was completed in 2006.
The industrial sector was responsible for 64% of total building activity,
followed by the office sector (19.89%) and shopping sector (16.36%).
The Durban-North, South and central areas showed no building activity growth
in 2006, while the Outer West operational area saw a growth of 6.51% largely
driven by the shopping sector.
The South operational sector saw a 0.38% growth in building activity driven by
the industrial sector.
This is summarized in the table below.
Table 2: Building Plans Completed for the eThekwini Municipality
Building Plans Completed - (Sqm) eThekwini Municipality 2005 2006 2005 2006 2005 2006 2005 2006
Office Shopping Industrial Total %
Chng Durban - North, South Central 11,092 7,844 26,465 17,625 114,262 83,477 151,819 108,946
-0.28
Inner West Operational 14,404 22,531 - 389 22,709 18,415 37,113 41,335 0.11 North - Operational 40,017 17,424 8,358 14,546 11,987 16,249 60,362 48,219
-0.20
Outer West Operational 899 - - 6,755 - - 899 6,755 6.51 South Operational 1,055 - 759 - 23,573 35,064 25,387 35,064 0.38
275,580 240,319 -
0.13
Source: Stats SA
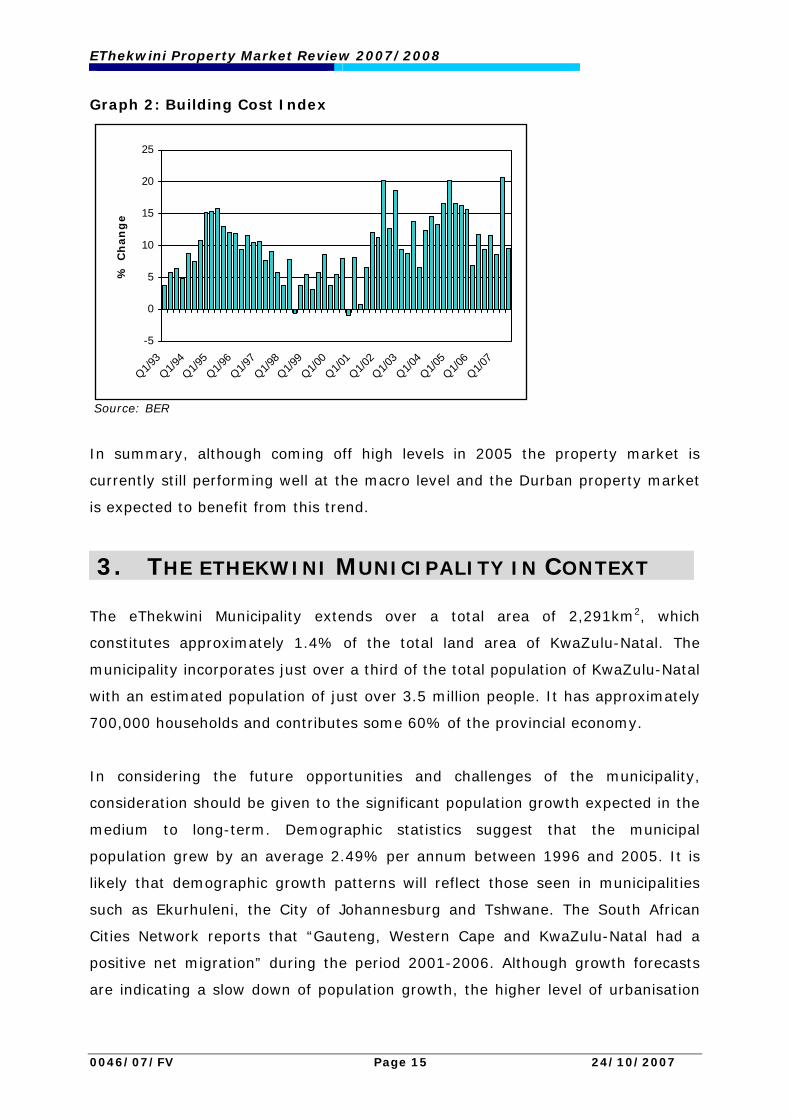
The building sector is also taking cognisance of rising building costs which could
affect the future viability of projects and the forecasts for future growth in
building activity. See graph 2.
EThekwini Property Market Review 2007/2008
0046/07/FV Page 15 24/10/2007
Graph 2: Building Cost Index
Source: BER
In summary, although coming off high levels in 2005 the property market is
currently still performing well at the macro level and the Durban property market
is expected to benefit from this trend.
3. THE ETHEKWINI MUNICIPALITY IN CONTEXT
The eThekwini Municipality extends over a total area of 2,291km2, which
constitutes approximately 1.4% of the total land area of KwaZulu-Natal. The
municipality incorporates just over a third of the total population of KwaZulu-Natal
with an estimated population of just over 3.5 million people. It has approximately
700,000 households and contributes some 60% of the provincial economy.
In considering the future opportunities and challenges of the municipality,
consideration should be given to the significant population growth expected in the
medium to long-term. Demographic statistics suggest that the municipal
population grew by an average 2.49% per annum between 1996 and 2005. It is
likely that demographic growth patterns will reflect those seen in municipalities
such as Ekurhuleni, the City of Johannesburg and Tshwane. The South African
Cities Network reports that “Gauteng, Western Cape and KwaZulu-Natal had a
positive net migration” during the period 2001-2006. Although growth forecasts
are indicating a slow down of population growth, the higher level of urbanisation
-5
0
5
10
15
20
25
Q1/93
Q1/94Q1/9
5Q1/9
6Q1/9
7Q1/9
8Q1/9
9Q1/0
0Q1/0
1Q1/0
2Q1/0
3Q1/0
4Q1/0
5Q1/0
6Q1/0
7
% C
han
ge

EThekwini Property Market Review 2007/2008
0046/07/FV Page 16 24/10/2007
in the province is expected to provide new challenges for the local property
market. It can be argued that demand for residential land will intensify, resulting
in a growing contention whether land should be used for commercial or residential
purposes.
3.1 THE ECONOMY
The eThekwini Municipality is home to South Africa‘s largest and busiets port and
the second largest industrial hub after Gauteng.
Durban plays an important role as the trade route for export and import industries
in South Africa, especially from eastern markets.
The main access route to the municipality is via the N2 freeway, which links the
municipality to the southern regions of the Eastern Cape and the northern regions
towards Mpumalanga. The N3 freeway is a direct link between the municipality
and neighbouring Pietermaritzburg as well as to the Western provinces – directly
leading to the Johannesburg market.
The Integrated Development Plan (IDP) Review of 2007/2008 indicates that the
City’s economic growth rate has performed increasingly well over the past few
years and is currently growing at a rate of 5.3% per annum, which is well in
excess of the national average . However, this is tempered by a need to double
per capita income, which experienced decline from 1990 through 1999. Currently
the City’s per capita income is R34 875 per annum, being higher than the South
African average at R17, 756. The municipality has set an economic growth target
of 7.5% being a suggested target required to address the creation of 18, 000 new
jobs before 2010 and to achieve the city’s strategic vision.
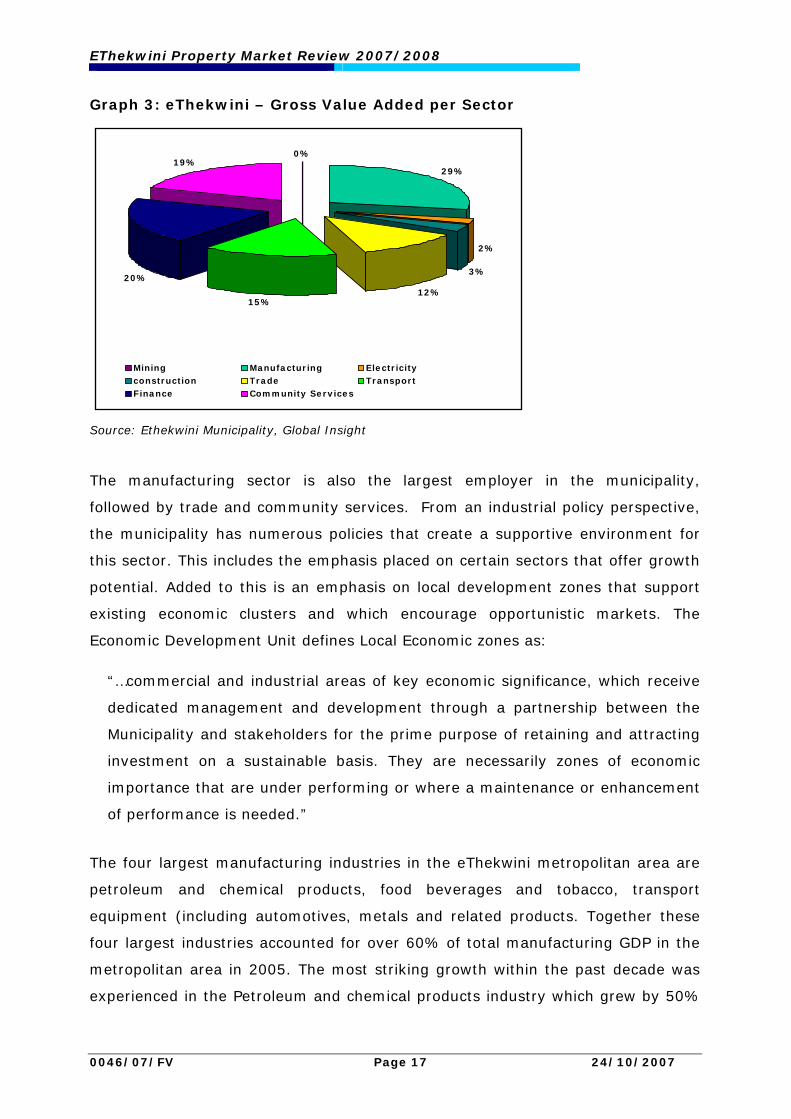
In considering the structure of the local economy; manufacturing, tourism,
finance and transport are the major economic contributors to the local economy,
with the manufacturing sector playing a dominant role; this is illustrated in the
graph below.
EThekwini Property Market Review 2007/2008
0046/07/FV Page 17 24/10/2007
0%
29%
3%
12%15%
19%
2%
20%
Mining Manufacturing Electricityconstruction Trade TransportFinance Community Services
Graph 3: eThekwini – Gross Value Added per Sector
Source: Ethekwini Municipality, Global Insight
The manufacturing sector is also the largest employer in the municipality,
followed by trade and community services. From an industrial policy perspective,
the municipality has numerous policies that create a supportive environment for
this sector. This includes the emphasis placed on certain sectors that offer growth
potential. Added to this is an emphasis on local development zones that support
existing economic clusters and which encourage opportunistic markets. The
Economic Development Unit defines Local Economic zones as:
“…commercial and industrial areas of key economic significance, which receive
dedicated management and development through a partnership between the
Municipality and stakeholders for the prime purpose of retaining and attracting
investment on a sustainable basis. They are necessarily zones of economic
importance that are under performing or where a maintenance or enhancement
of performance is needed.”
The four largest manufacturing industries in the eThekwini metropolitan area are
petroleum and chemical products, food beverages and tobacco, transport
equipment (including automotives, metals and related products. Together these
four largest industries accounted for over 60% of total manufacturing GDP in the
metropolitan area in 2005. The most striking growth within the past decade was
experienced in the Petroleum and chemical products industry which grew by 50%

EThekwini Property Market Review 2007/2008
0046/07/FV Page 18 24/10/2007
in the past seven years. The automotive industry in the metropolitan area and in
the province is based around the output of the Toyota SA plant in Prospecton.
Toyota South Africa is the country’s biggest car producer with the largest
domestic market share.
These interventions are complemented with spatial incentives such as the recently
initiated Urban Development Zones (UDZ’s) which aim at stimulating property
investments in demarcated areas – UDZ’S details will be discussed in later
sections of the report.
The services sector, more specifically finance, business and real estate; wholesale
and retail trade and transport and communication have grown in relative
importance. The eThekwini Municipality reflects the largest share of the national
transport and communication industry of any single metropolitan area in South
Africa.
It is estimated that the informal sector in Durban employs approximately 25% of
the municipal labour force. This is equivalent to approximately 300,000 people,
and the challenge lies in formulating industrial and urban development policies
that support this sector of the market, and here the built environment has a role
to play.
The ward workshops held during the previous IDP review (2005/2006) process
indicated that households in the municipality were most in need of:
Housing and household services;
Safety and security;
Jobs/economic development;
Community infrastructure;
Health services;
Governance issues;
Transport;
Education and
Social issues and employment opportunities
This collates with information collected through the Municipality’s annual Quality

EThekwini Property Market Review 2007/2008
0046/07/FV Page 19 24/10/2007
of Life Survey referred to in the 2007/2008 review. This survey indicates that the
problems that are of most concern to residents are:
Poverty
Unemployment
Crime and feeling unsafe
Health problems
In addition the spatial analysis of needs has indicated that communities who are
worse off are located in the historically under-invested township areas where a
great deal of informal dwelling infill has occurred, and similarly that communities
on the rural periphery have the lowest level of service access. The future of the
property market will to a degree lie in improving the townships and integrating
these areas in the overall economy.
Thus, the challenges faced by the eThekwini municipality include the need to
strengthen its economic base and creating conditions that will translate in
improved socio-economic conditions for all. The key challenges to development
are identified as being:
Low economic growth and high unemployment
Poor access to basic household services;
High levels of poverty;
Low levels of literacy and skills development;
HIV/AIDS;
Crime
Unsustainable development practices and,
Ineffective and inward looking local government
Responding to these needs, the long-term development framework for the city
aims to accomplish a balance between meeting basic needs, strengthening the
economy and building appropriate human skills. More specifically, this translates
into interventions that stimulate:
Sustainable economic growth and job creation;
Fully serviced, well-maintained, quality environments;

EThekwini Property Market Review 2007/2008
0046/07/FV Page 20 24/10/2007
Safe and secure environments;
Healthy and empowered citizens;
Embracing culture diversity;
Sustaining the natural built environment and
Democratising local government.
South Africa has experienced a tourism boom since the 1990’s. KwaZulu-Natal
has the largest number of trips from domestic tourists in the country and is
capturing a growing share of international tourism. In 2005, KwaZulu Natal
attracted 11.6 tourism trips – 32% share of the South African Tourism Market.
The municipality was visited by 1.1 million foreign tourists or approximately 16%
of foreign tourists in South Africa. The municipality’s significant source markets
are from Africa (56%) and Europe (33%). The Durban hotel market is the third
most important in South Africa, after Cape Town and Johannesburg.
Looking ahead, the municipality wishes to stimulate economic growth in key
activity sectors aligned with the KwaZulu- Natal Industrial Development Strategy,
namely the automotive sector, ICT, tourism, agriculture and agri-processing,
chemicals, creative industries, clothing and textiles, and wood, pulp and paper.
With the maritime sector playing an important role in the local economy, this
sector will also receive strong focus.
The development of the King Shaka International Airport and Dube Trade Port,
together with its proposed Free Trade Zone, is the most important economic
project for the region and is projected to provide between 150 000 to 240 000
direct and indirect job opportunities.
3.2 THE NODAL PROPERTY MARKET
The Durban property market expanded from the traditional Central Business
District (CBD) focussed around the port. With time the city developed to the
south, the west, and more recently to the northern regions of the municipality.
The eThekwini Municipality area forms the consolidation of a number of areas that
previously functioned as separate local authority areas. Historically the CBD has
EThekwini Property Market Review 2007/2008
0046/07/FV Page 21 24/10/2007
played the role of a traditional service centre to the municipal region with most
offices and retail outlets situated in the node. Secondary commercial nodes
developed in relation to this centre and included commercial developments on the
Berea, which attracted some of the first commercial nodes outside of the CBD. To
this can be added Westville, Pinetown, Kloof and Hillcrest further to the west
Durban North, and line suburbs in the south. Pinetown/New Germany has been
historically important as an industrial node. Umhlanga and Amamzimtoti are two
coastal nodes respectively north and south of the CBD which historically
performed a service and tourism function. The Southern nodes are primarily of an
industrial nature and are located around the development of the port and the
airport. In addition a number of township areas were developed as a result of
apartheid spatial organisation. These include Umlazi and Chatsworth in the south
and Phoenix and KwaMashu in the North.
Growth in the past decade has consolidated to the north of the CBD with the
creation of a significant commercial cluster, which includes the commercial nodes
of La Lucia/Umhlanga and Mount Edgecombe. Industrial nodes located in this
northern region include Briardine, Springfield Park, Umgeni and the fast
developing Riverhorse Valley Business Estate.
The important point is that these different functional areas largely complement
each other and offer different opportunities for tenants and property investors
alike.
Thus, the main property market nodes of the Durban Metro can be broadly
divided into the following functional areas:
Table 3: The Nodal Property Market
Node Areas
CBD Durban CBD
Central nodes Berea, Musgrave and other centrally located commercial nodes.
Western nodes Westville, Pinetown, including industrial nodes such as New
Germany, West and Mahogany Ridge, Cato Ridge, etc.
Northern nodes Umhlanga/La Lucia Ridge. Mount Edgecombe, Briardine,
Springfield Park, Riverhorse Valley Business Estate.

EThekwini Property Market Review 2007/2008
0046/07/FV Page 22 24/10/2007
33..22..11 TTHHEE DDUURRBBAANN CCBBDD
The Durban CBD was the first major commercial node established in eThekwini.
Like other major CBD’s in South Africa, the decentralisation of commercial
property developments have in recent decades negatively impacted on CBD
vacancy rates and property values. The characteristic of investors in this market
has also changed with smaller, private investors, playing a more pronounced role.
The positive impacts of urban regeneration initiatives are starting to be felt with
vacancies declining and investors showing greater interest in investment
opportunities. A further positive trend has been the rise in the number of
renovations seen in the CBD, with investors taking advantage of Urban
Development Zone (UDZ) fiscal advantages. Of importance is that ABSA, a
leading financial bank has relocated its operations and consolidating most of their
current decentralised departments to the CBD on Smith and Gardiner Street.
The retail sector continues to play a critical role in the CBD, serving different
income groups, and anchoring the property market; the retail offering is also
highly accessible to shoppers without private transport. The Workshop and the
Wheel Shopping Centres are important shopping destinations in this node, but
street level retail in much of the CBD plays a critical role.
The CBD office sector caters both the private and public
sectors with the movement of the province. While the
public sector plays an important role in maintaining the
market in the CBD, this will be reduced with the
movement of provincial department to Pietermaritzburg.
Micro-locational issues such as the affordability of space, makes it attractive for
tenants to either stay, relocate or expand in the CBD.
In general the CBD shows a shortage of A-grade office space, with by far most of
the rentable office space being in the C-grade category. This is largely related to
the age of buildings, the quality of infrastructure, and perceptions of locality,
when compared to new decentralised nodes. The exit of corporates from the CBD

EThekwini Property Market Review 2007/2008
0046/07/FV Page 23 24/10/2007
is also associated with a shift to private ownership. Parking has also become a
problem in the CBD related primarily to increasing car ownership. This has
stimulated the construction of additional parking in new developments including
part of the redevelopment of the Old Mutual building on Gardiner Street to
provide 857 parking bays in conjunction with a new retail arcade.
Industrial developments extend to the southern nodes of the municipality,
adjacent to the CBD, this also means that the CBD offers industrial space in
relatively close proximity.
The CBD is complemented by recent investment on its
northern edge. While interest in the Kingsmead office park
began slowly, take up has resulted in some of the last
available sites reaching the R1000/m² mark. Although
effectively an office park development, it tends to complement
the offering of the CBD. Also on the northern edges of the
CBD is the Durban ICC, a premier convention centre that has
recently undergone a major extension with the development
of the ICC Arena. These and other initiatives, suggest that the Durban CBD
continues to offer a vibrant property market offering both commercial and
residential opportunities. Such opportunities are being strengthened by urban
regeneration policies such as the Urban Development Zone Tax Incentives (to be
discussed later in the report).
A number of key events may influence the future of the CBD.
Increasing traffic congestion, particularly in the north and potentially around
other nodes, may result in a shift back towards the centre;
Rising income levels and increased investment keen to service township areas
may negatively affect CBD rejuvenation;
The success of strategic projects within the Inner City may unlock further
investment;
Land shortage and environmental pressure on new “greenfield” developments
means that in future developers will target land that has already been
developed, encouraging new developments or renovations in the CBD.
EThekwini Property Market Review 2007/2008
0046/07/FV Page 24 24/10/2007
33..22..22 TTHHEE CCEENNTTRRAALL NNOODDEESS
The central node comprises the Berea and adjacent areas. The Berea comprises a
number of nodal areas that have typically concentrated around shopping centres
with the retail sector playing an important role. The Berea has a strong upper
income residential component, which acts as a critical anchor, especially for the
retail sector. The Berea is readily accessible through N3 via Berea Road, and is
well linked with the city centre and the western suburbs such as Westville.
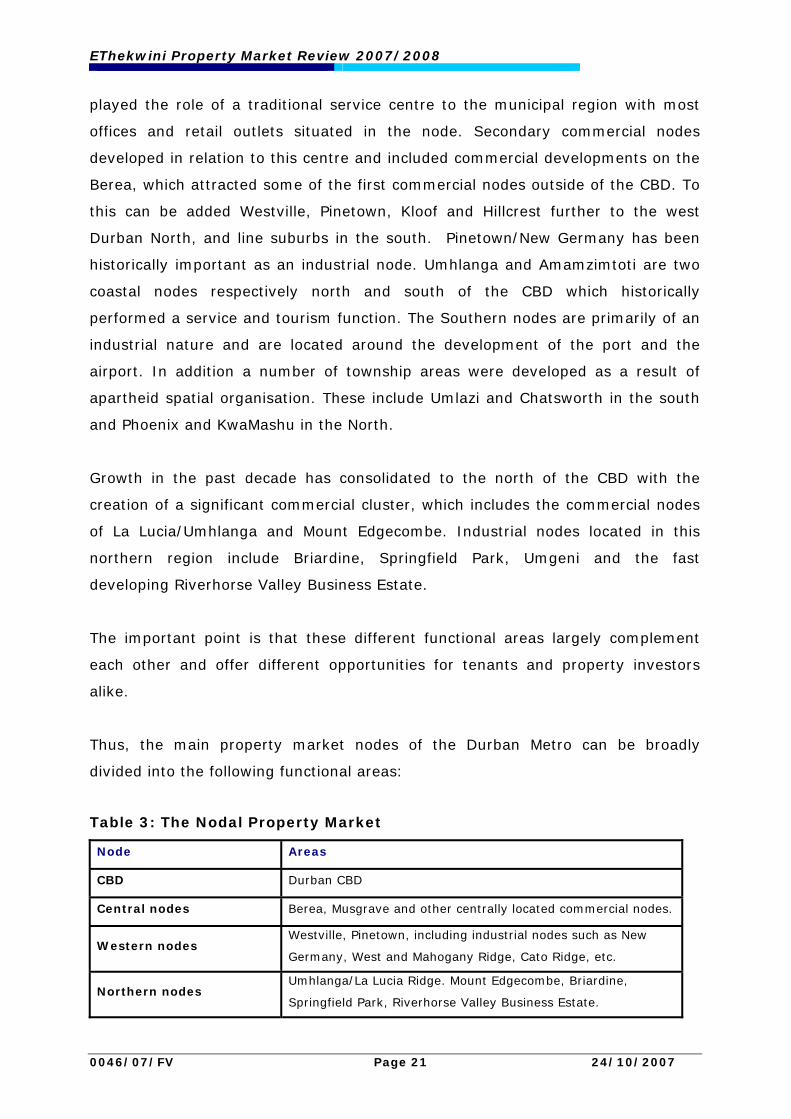
The Musgrave Centre was developed in 1956 and has
since been an important retailing facility in the Durban
market, and has generated commercial growth along
Musgrave and Essenwood Roads and is relatively
central on the Berea.
Musgrave Road provides a link with the Florida Road strip to the north, which
operates in conjunction with Windermere, Stamfordhill, and Umgeni roads to
provide a mix of office, hospitality, discount and high end retail, and light
industrial activity in close proximity to each other. There has been strong demand
for office and retail space to locate here in recent years. Most of these
are converted homes.
Since the availability of land on the Berea is limited, new developments are more
likely to occur through renovations and the conversion of residential to office
space. However, high property prices being demanded for residential property on
the Berea may however, have started to affect the viability of this.
Davenport Centre, south of Berea Road and close to the residential area of
Glenwood, has also encouraged the incremental concentration of commercial
development in its environs.
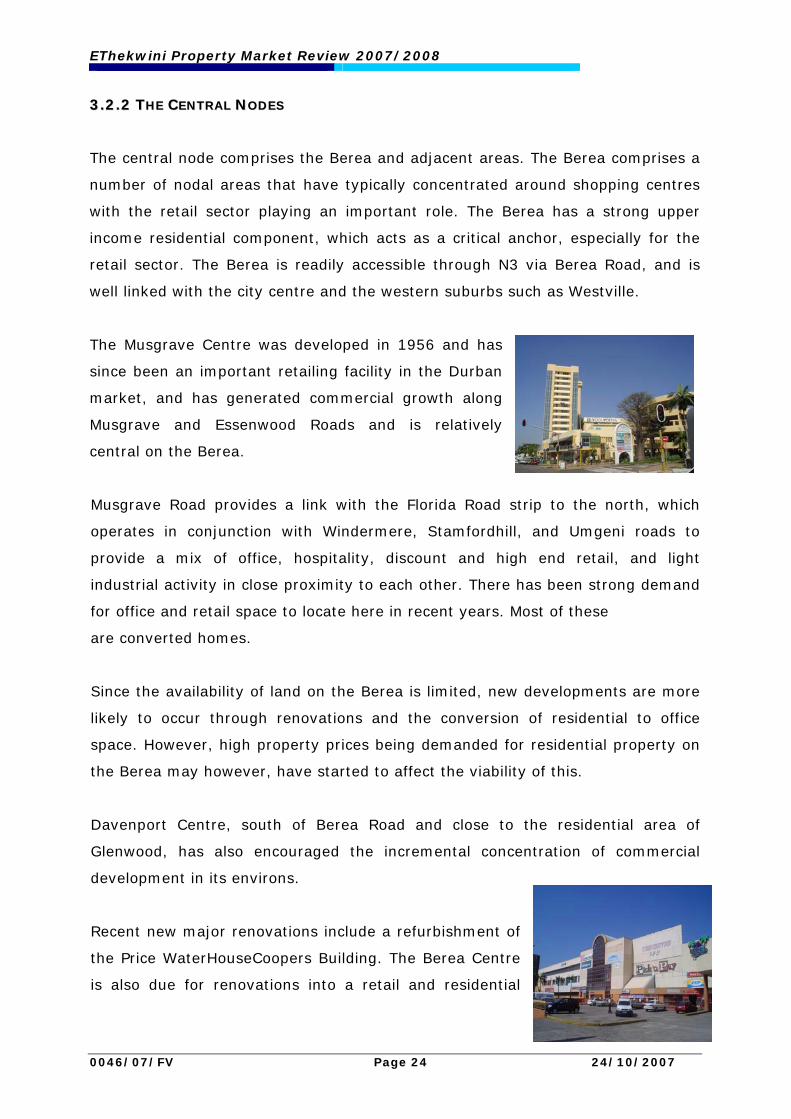
Recent new major renovations include a refurbishment of
the Price WaterHouseCoopers Building. The Berea Centre
is also due for renovations into a retail and residential
EThekwini Property Market Review 2007/2008
0046/07/FV Page 25 24/10/2007
mixed-use development, involving the conversion of 4, 620 m² in its office
tower to residential use. The Berea centre has a few vacancies but tenants such
as as Pick ‘n Pay, PEP, a gymnasium and the Millenia School of Business are still
operating in the centre.
33..22..33 TTHHEE WWEESSTTEERRNN NNOODDEESS
Westville, in the western sector of the Durban metropolitan region, is
characterised by a mixture of residential and dispersed commercial uses. Direct
access to Westville is via the N3 highway, and the M13 Jan Smuts Highway. The
node is also highly accessible from and to the Berea, the Durban CBD, and the far
western commercial Pinetown node.
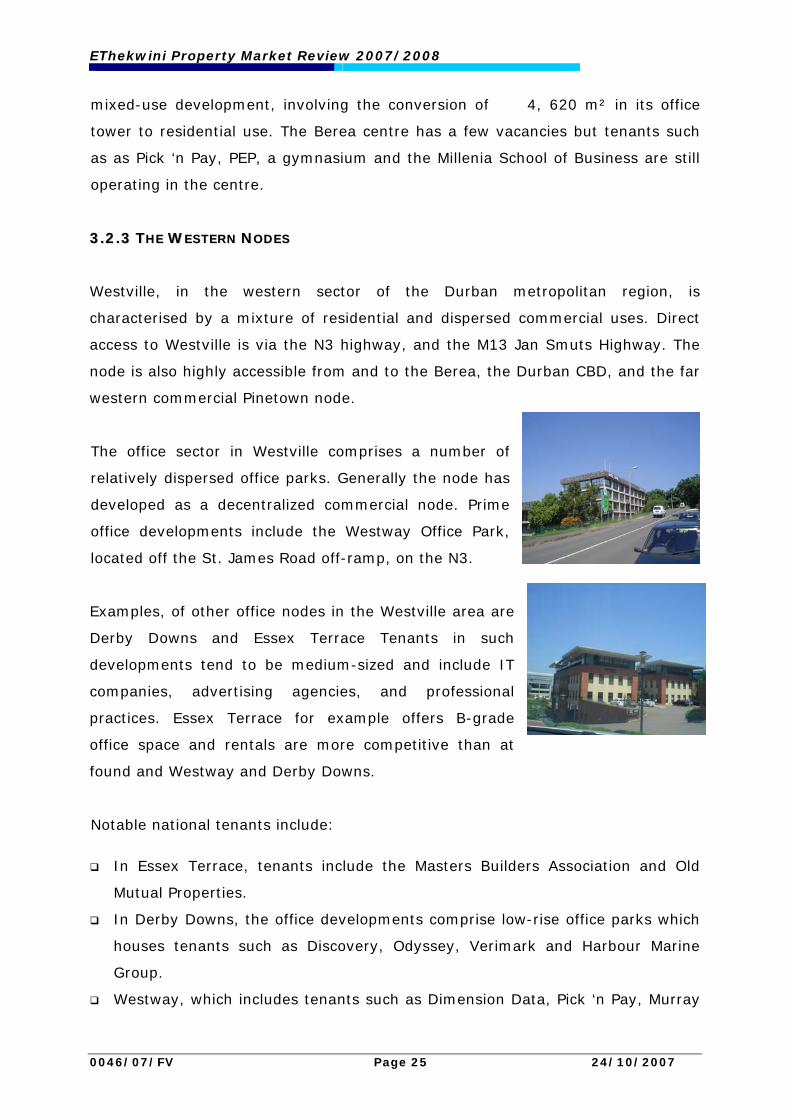
The office sector in Westville comprises a number of
relatively dispersed office parks. Generally the node has
developed as a decentralized commercial node. Prime
office developments include the Westway Office Park,
located off the St. James Road off-ramp, on the N3.
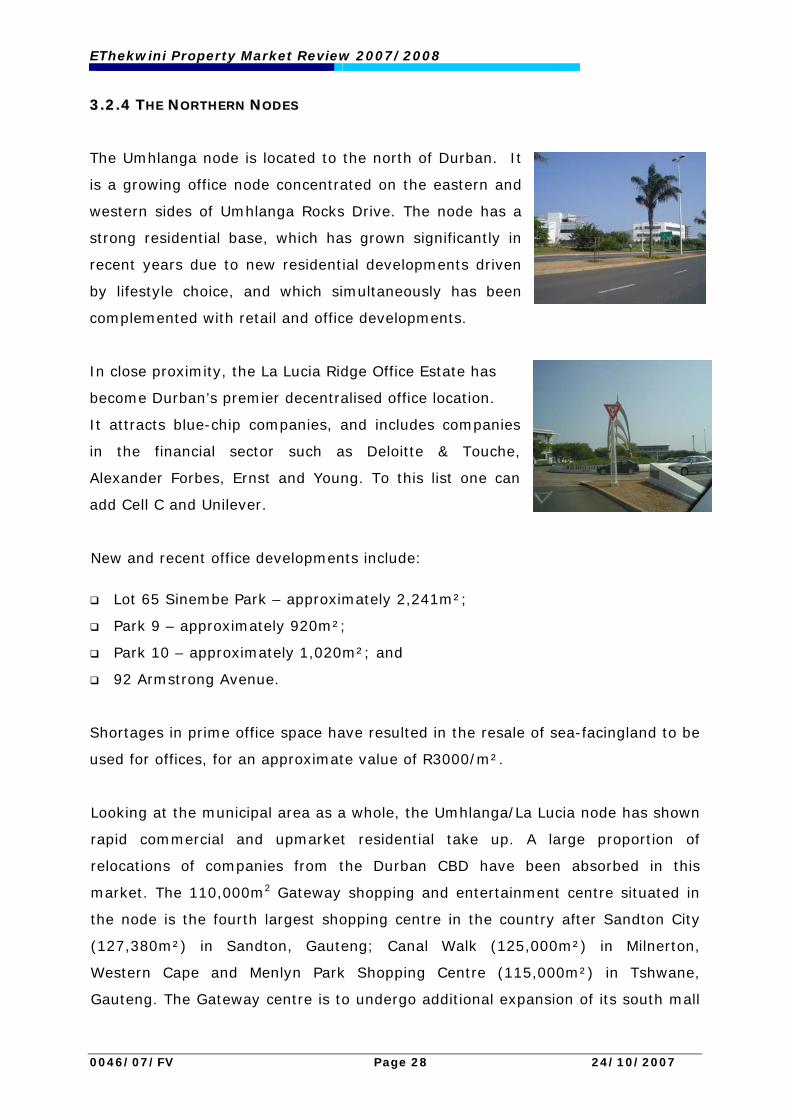
Examples, of other office nodes in the Westville area are
Derby Downs and Essex Terrace Tenants in such
developments tend to be medium-sized and include IT
companies, advertising agencies, and professional
practices. Essex Terrace for example offers B-grade
office space and rentals are more competitive than at
found and Westway and Derby Downs.
Notable national tenants include:
In Essex Terrace, tenants include the Masters Builders Association and Old
Mutual Properties.
In Derby Downs, the office developments comprise low-rise office parks which
houses tenants such as Discovery, Odyssey, Verimark and Harbour Marine
Group.
Westway, which includes tenants such as Dimension Data, Pick ‘n Pay, Murray

EThekwini Property Market Review 2007/2008
0046/07/FV Page 26 24/10/2007
& Roberts and Santam. Four new office developments are occurring within the
Westway node.
A small office node, which consists of office parks, has also developed next to the
Westville Mall on Buckingham Terrace Road and includes tenants such as Business
Partners and WSP.
The Pavilion Shopping Centre is the main shopping centre in the region - it is
100’000m2 in extent and serves a wide catchment area. The centre is currently
completing nearly 4’000m² of extensions. The Westville CBD is also characterised
by a variety of convenience retail facilities, giving the node a “village” feel.
Market commentators suggest that Westville is facing
stiff competition from Umhlanga as a commercial and
retail node – but, at the same time there is a view that
Westville has relatively low levels of traffic congestion
compared to that experienced in Umhlanga/La Lucia
which should underpin its place in the market.
Pinetown offers a commercial node at the far western extremity of the
municipality. The Pinetown CBD is accessed from the N3 via the St John’s Avenue
off ramp. The Old Main Road is the main activity spine for commercial property in
the node and nearby industrial nodes include New Germany, Mahogany Ridge and
Westmead.
Land uses found in the node include commercial developments as well as civic
uses. Car dealerships for various car manufacturers including Toyota, Renault,
BMW and Mercedes Benz are situated along the main road. Other uses include
semi-industrial activity selling building products to the public.
Retail facilities include the Sanlam Centre with tenants such as Game, Pick ‘n Pay,
Woolworths and Clicks. A new retail development is also being built on Kings
Road.

EThekwini Property Market Review 2007/2008
0046/07/FV Page 27 24/10/2007
In terms of industrial nodes, New Germany is one of
the more developed and older industrial nodes in
Durban. New Germany is made up of four distinct
areas, namely North Industria, Pineside, Falcon
Industrial Park and Mountain Ridge, which is adjacent
to the New Germany Nature Reserve. The wider node
is characterised by a variety of light manufacturing activities including, inter alia:
foods, textiles, metals, machinery, automotive components, paints, chemicals and
pharmaceuticals.
Westmead and Mahogany Ridge to the west offer light
industrial and distribution uses. To this should be added
warehousing and packaging and logistics related
services tenants in Westmead include MAN Truck and
Euro Steel. The older part of Westmead includes tenants
such as Hi Q; Nissan; Waltons; GSA (Glass South Africa)
and Shatterprufe.
Suitable vacant land in these areas and particularly the more developed
Westmead node is scarce. In these areas land may be expected to fetch
R 850/m².
The industrial sites are well serviced with generally good accessibility to the N2.
The next push for industrial land appears to be taking place further west with lots
of interest being directed toward Cato Ridge, in particularly, with current land
owners driving the process of delivering industrial land to the market. The local
authority has experienced significant pressure both in terms of rezonings and the
take up of zoning rights in the outer west. Cato Ridge however suffers from an
underdeveloped infrastructure, including the need for a sewerage works, poor
accessibility and remoteness. The outer west also contains much of Durban’s
sensitive environmental assets.
EThekwini Property Market Review 2007/2008
0046/07/FV Page 28 24/10/2007
33..22..44 TTHHEE NNOORRTTHHEERRNN NNOODDEESS
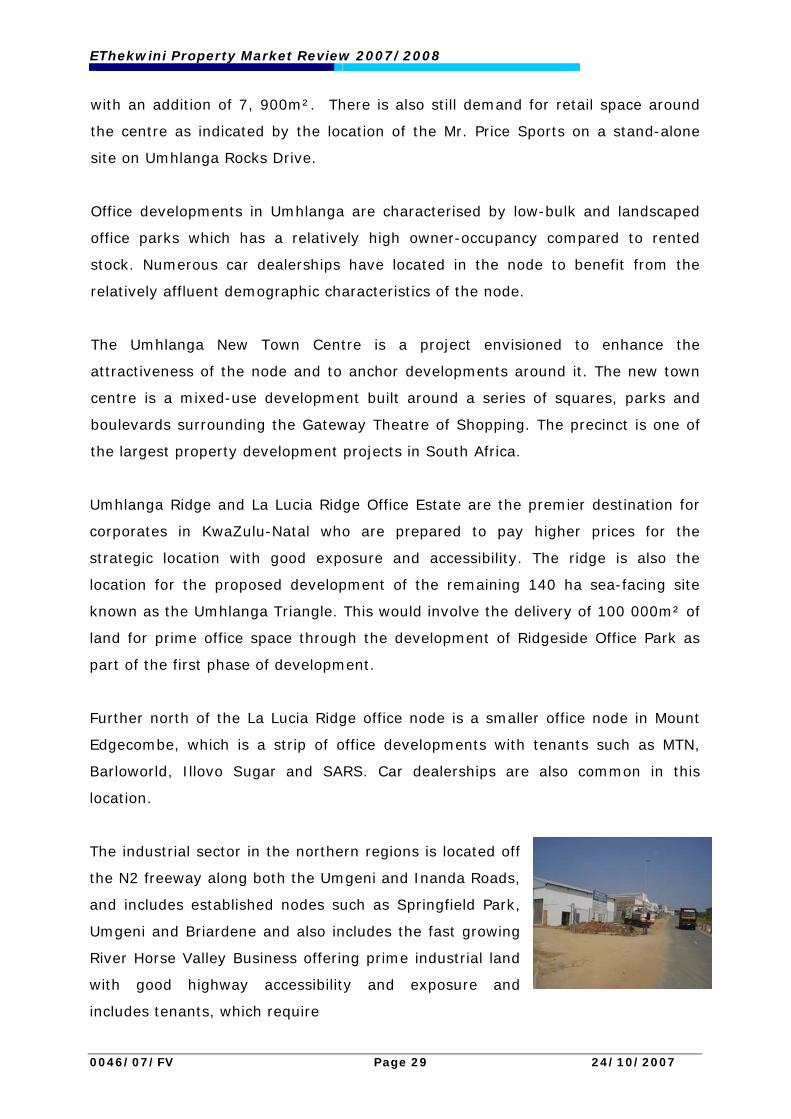
The Umhlanga node is located to the north of Durban. It
is a growing office node concentrated on the eastern and
western sides of Umhlanga Rocks Drive. The node has a
strong residential base, which has grown significantly in
recent years due to new residential developments driven
by lifestyle choice, and which simultaneously has been
complemented with retail and office developments.
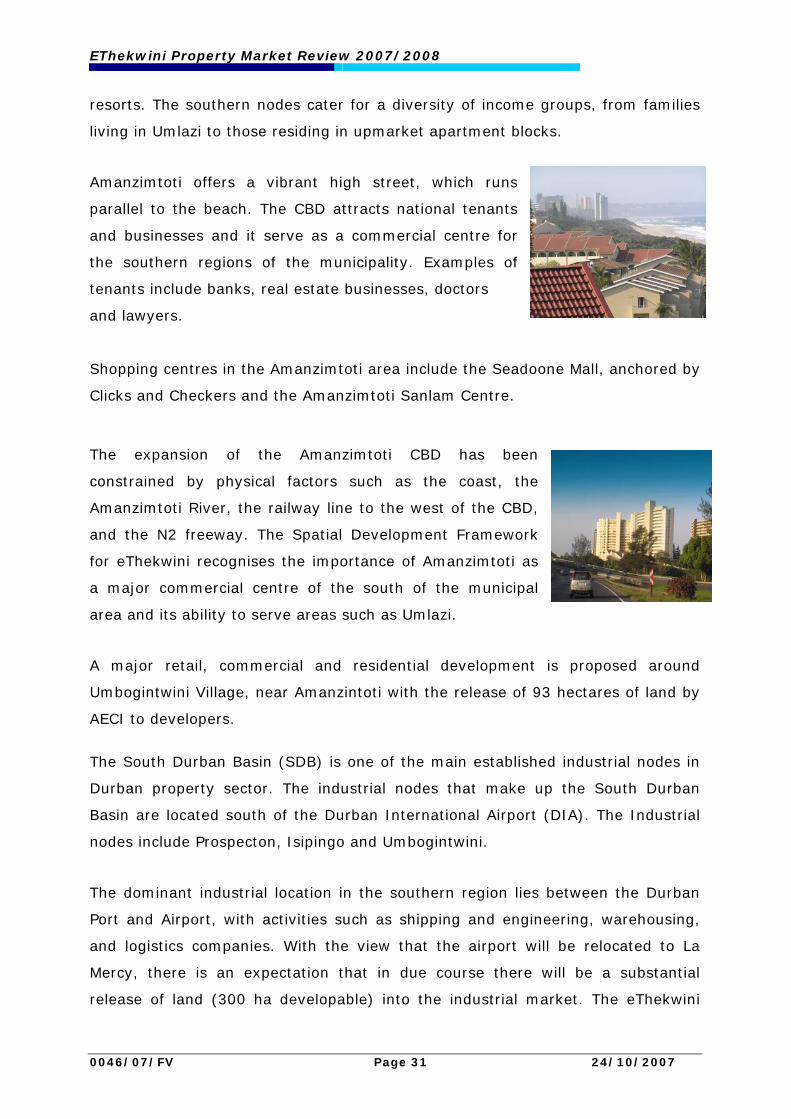
In close proximity, the La Lucia Ridge Office Estate has
become Durban’s premier decentralised office location.
It attracts blue-chip companies, and includes companies
in the financial sector such as Deloitte & Touche,
Alexander Forbes, Ernst and Young. To this list one can
add Cell C and Unilever.
New and recent office developments include:
Lot 65 Sinembe Park – approximately 2,241m²;
Park 9 – approximately 920m²;
Park 10 – approximately 1,020m²; and
92 Armstrong Avenue.
Shortages in prime office space have resulted in the resale of sea-facingland to be
used for offices, for an approximate value of R3000/m².
Looking at the municipal area as a whole, the Umhlanga/La Lucia node has shown
rapid commercial and upmarket residential take up. A large proportion of
relocations of companies from the Durban CBD have been absorbed in this
market. The 110,000m2 Gateway shopping and entertainment centre situated in
the node is the fourth largest shopping centre in the country after Sandton City
(127,380m²) in Sandton, Gauteng; Canal Walk (125,000m²) in Milnerton,
Western Cape and Menlyn Park Shopping Centre (115,000m²) in Tshwane,
Gauteng. The Gateway centre is to undergo additional expansion of its south mall
EThekwini Property Market Review 2007/2008
0046/07/FV Page 29 24/10/2007
with an addition of 7, 900m². There is also still demand for retail space around
the centre as indicated by the location of the Mr. Price Sports on a stand-alone
site on Umhlanga Rocks Drive.
Office developments in Umhlanga are characterised by low-bulk and landscaped
office parks which has a relatively high owner-occupancy compared to rented
stock. Numerous car dealerships have located in the node to benefit from the
relatively affluent demographic characteristics of the node.
The Umhlanga New Town Centre is a project envisioned to enhance the
attractiveness of the node and to anchor developments around it. The new town
centre is a mixed-use development built around a series of squares, parks and
boulevards surrounding the Gateway Theatre of Shopping. The precinct is one of
the largest property development projects in South Africa.
Umhlanga Ridge and La Lucia Ridge Office Estate are the premier destination for
corporates in KwaZulu-Natal who are prepared to pay higher prices for the
strategic location with good exposure and accessibility. The ridge is also the
location for the proposed development of the remaining 140 ha sea-facing site
known as the Umhlanga Triangle. This would involve the delivery of 100 000m² of
land for prime office space through the development of Ridgeside Office Park as
part of the first phase of development.
Further north of the La Lucia Ridge office node is a smaller office node in Mount
Edgecombe, which is a strip of office developments with tenants such as MTN,
Barloworld, Illovo Sugar and SARS. Car dealerships are also common in this
location.
The industrial sector in the northern regions is located off
the N2 freeway along both the Umgeni and Inanda Roads,
and includes established nodes such as Springfield Park,
Umgeni and Briardene and also includes the fast growing
River Horse Valley Business offering prime industrial land
with good highway accessibility and exposure and
includes tenants, which require

EThekwini Property Market Review 2007/2008
0046/07/FV Page 30 24/10/2007
distributions and warehouse space such as Mr Price, Tren Tyre, Gestetner,
Mercedes Benz, Berco Express and Xerox. On completion Riverhorse Valley will
comprise a 160ha industrial business park consisting of separate mixed-use
business parks. Riverhorse Valley has experienced significant exponential increase
in value as stock levels have decreased. The recent sale of a property in July with
an elevated platform of 1,6852 ha, and excellent access on to the N2 was
reported to have reached a price in the order of R 1, 700/m² for net platform
area.
Further from the Umgeni Road off-ramp are established
nodes such as Briardene, located mainly along North
Coast Road. These nodes consist of mainly tenants who
require warehousing and light manufacturing space.
There are also some high levels of industrial
developments in this node.
The Umgeni node, which is an older node, includes a high component of retailing
– typically wholesalers and value centres with tenants such as Furniture City, Dial
a Bed, Duratile, Hisrch’s, Waltons and Panasonic found in this location. A recent
property sold here, based on net platform area, for in the order of R 950/m².
The movement of commercial property in the north will likely be influenced by the
development of the new airport and the Dube tradeport on the La Mercy site, and
which is intended to be completed by 2010. It is likely that industrial demand for
land will move further north in conjunction with these developments.
However, take-up of industrial land released in Ballito adjacent to the N2, outside
the metro has to date been slow.
33..22..55 TTHHEE SSOOUUTTHHEERRNN NNOODDEESS
The southern nodes of Durban are accessible via the N2 freeway and the M4.
These access routes also offer excellent accessibility to the South Coast holiday
EThekwini Property Market Review 2007/2008
0046/07/FV Page 31 24/10/2007
resorts. The southern nodes cater for a diversity of income groups, from families
living in Umlazi to those residing in upmarket apartment blocks.
Amanzimtoti offers a vibrant high street, which runs
parallel to the beach. The CBD attracts national tenants
and businesses and it serve as a commercial centre for
the southern regions of the municipality. Examples of
tenants include banks, real estate businesses, doctors
and lawyers.
Shopping centres in the Amanzimtoti area include the Seadoone Mall, anchored by
Clicks and Checkers and the Amanzimtoti Sanlam Centre.
The expansion of the Amanzimtoti CBD has been
constrained by physical factors such as the coast, the
Amanzimtoti River, the railway line to the west of the CBD,
and the N2 freeway. The Spatial Development Framework
for eThekwini recognises the importance of Amanzimtoti as
a major commercial centre of the south of the municipal
area and its ability to serve areas such as Umlazi.
A major retail, commercial and residential development is proposed around
Umbogintwini Village, near Amanzintoti with the release of 93 hectares of land by
AECI to developers.
The South Durban Basin (SDB) is one of the main established industrial nodes in
Durban property sector. The industrial nodes that make up the South Durban
Basin are located south of the Durban International Airport (DIA). The Industrial
nodes include Prospecton, Isipingo and Umbogintwini.
The dominant industrial location in the southern region lies between the Durban
Port and Airport, with activities such as shipping and engineering, warehousing,
and logistics companies. With the view that the airport will be relocated to La
Mercy, there is an expectation that in due course there will be a substantial
release of land (300 ha developable) into the industrial market. The eThekwini
EThekwini Property Market Review 2007/2008
0046/07/FV Page 32 24/10/2007
Municipality is currently reviewing the impact of the relocation of the airport in the
Spatial Development Plan for this region. Likewise, there is a good chance that
the land may be purchased by Transnet and land banked while feasibility over a
dugout port is considered.
Other important industrial activities include motor-related
businesses. Toyota SA has a large presence in the area and
has attracted relates services to support the manufacturing
of motor vehicles. A Durban Auto Supplier Park is also under
consideration. In general, Toyota is an important anchor for
the node. Other industrial activities include manufacturing of paper, plastic
processing, wood and furniture and chemicals. Mondi, a major paper
manufacturer, is also an important tenant in the SDB.
The South Durban Basin (SDB) is also characterised by relatively heavy, older
industrial areas if compared to prime nodes in the western and northern areas of
the municipal area.
The most notable development in the node is the 127ha
Southgate Business Park. The main investors and tenants
at Southgate Business Park include Old Mutual, Volvo
South African Transport Industries, Aunde Car Trim, Auto
Carriers, Standers Transport, Royal Swazi Distillers, Celtic
Freight and Siyaphambile Transport.
3.3 THE SIZE OF THE COMMERCIAL MARKET
An attempt to quantify the size of the Durban property market is made difficult
due to a lack of reliable data. The accuracy of data also varies from one sector of
the market to the next.
SAPOA (the South African Property Owners Association) and the South African
Council of Shopping Centres provide statistics that provide an estimate of the size
of the office and retail markets for various nodes in the study area.
EThekwini Property Market Review 2007/2008
0046/07/FV Page 33 24/10/2007
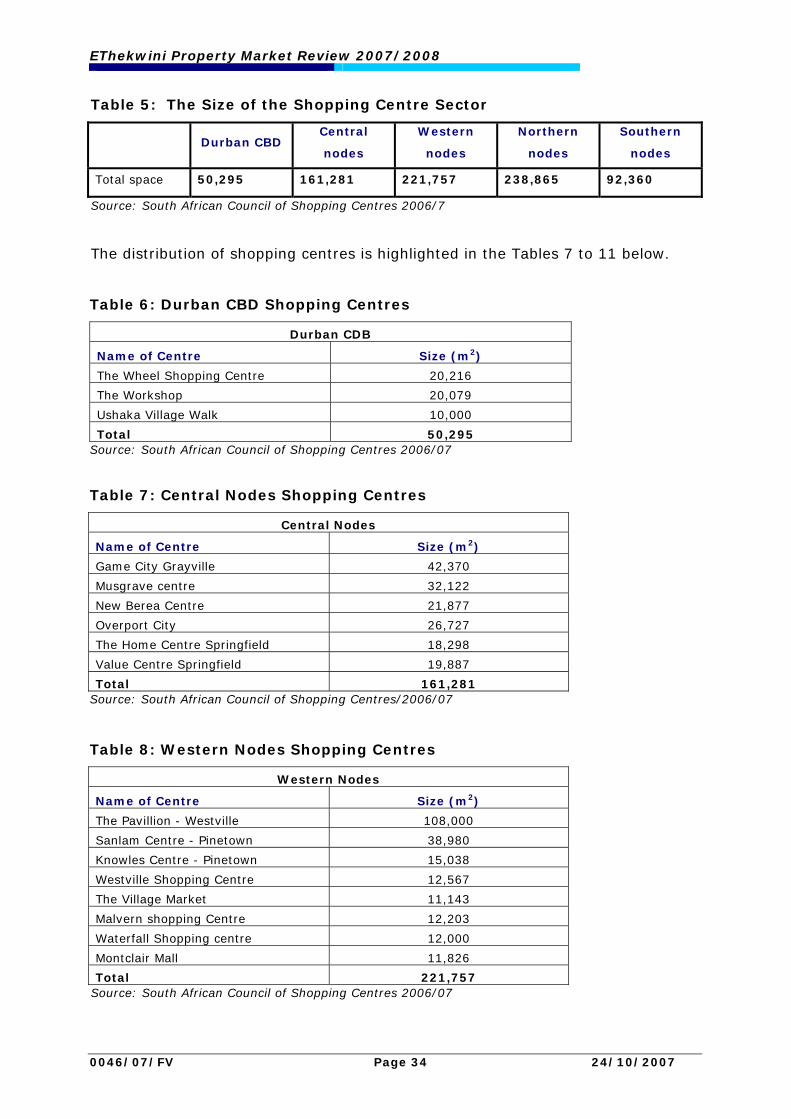
According to the SAPOA Office Vacancy Survey the distribution of office space in
Durban’s major nodes is as follows;
Table 4: Size of the Office Market in m²
Type of Space Durban CBD Berea Westville Umhlanga/La
Lucia
P-grade 8,298
A-grade 114,038 31,596 54,784 143,879
B-grade 140,689 37,817 76,590 22,932
C-grade 433.446 24,452 0
Total 688,123 93,865 131,374 175,109
Source: SAPOA, 2007
The table illustrates that the greatest concentration of office space in the
municipal area lies in the Durban CBD. However, the bulk of this is C-grade type
accommodation, with comparison with previous data indicating a general
degrading of B-grade space into C-grade space. Although the CBD offers the
highest concentration of office stock in Durban at 688,123m² in total office stock,
this is down from 709,334m² in 2005. In the case of premier grade office space
and A-grade office space, a high concentration is found in the Umhlanga/La Lucia
node with 86% of office space in this node in these categories - The CBD and
Berea also offer a significant amount of lower (B and C) grade space with the
trend of B-grade space degrading to C-grade also evident here. This suggests that
improvement in market conditions could in due course offer opportunities for
renovations.
In terms of the concentration of shopping centres, the northern nodes stand out
with approximately 238,865 m², followed by the Western nodes at 221,757m².
This data does not take into account freestanding retailers or street front retail
properties, which are found mainly in the Durban CBD and smaller CBD centres
such as Pinetown and Amanzimtoti. Shopping centres smaller than 10’000 sqm
have also been excluded.
EThekwini Property Market Review 2007/2008
0046/07/FV Page 34 24/10/2007
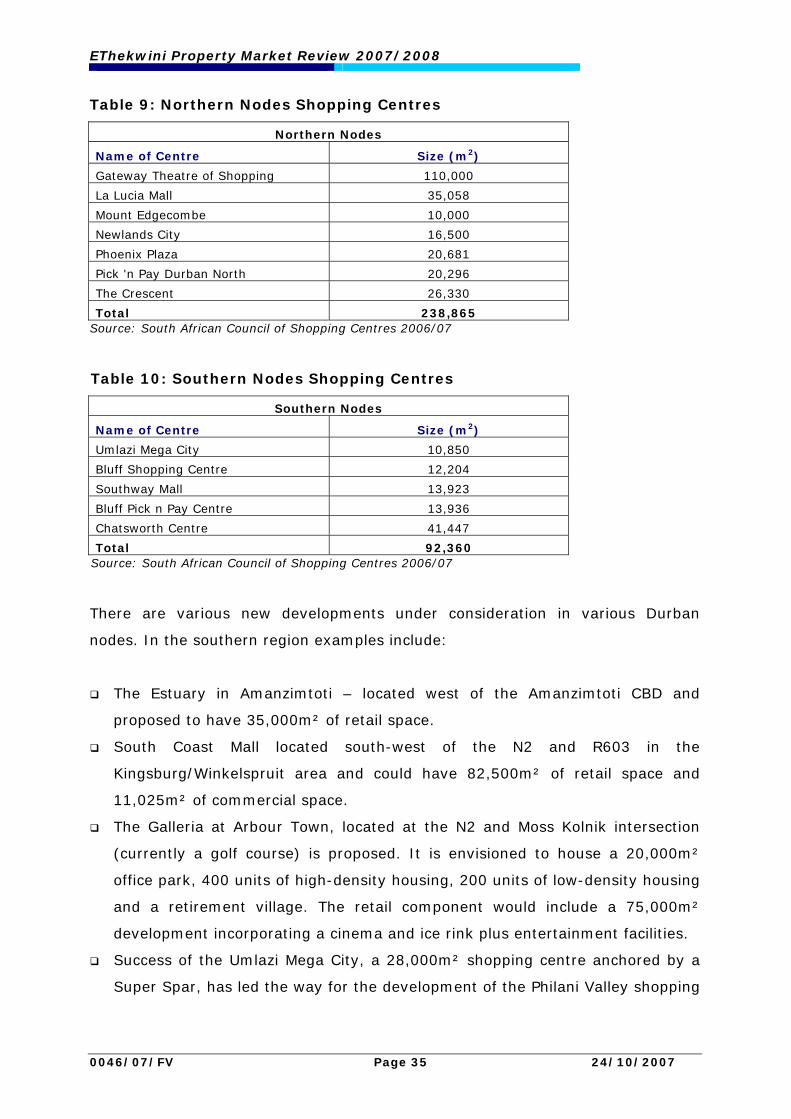
Table 5: The Size of the Shopping Centre Sector
Durban CBD Central
nodes
Western
nodes
Northern
nodes
Southern
nodes
Total space 50,295 161,281 221,757 238,865 92,360
Source: South African Council of Shopping Centres 2006/7
The distribution of shopping centres is highlighted in the Tables 7 to 11 below.
Table 6: Durban CBD Shopping Centres
Durban CDB
Name of Centre Size (m2)
The Wheel Shopping Centre 20,216
The Workshop 20,079
Ushaka Village Walk 10,000
Total 50,295 Source: South African Council of Shopping Centres 2006/07
Table 7: Central Nodes Shopping Centres
Central Nodes
Name of Centre Size (m2)
Game City Grayville 42,370
Musgrave centre 32,122
New Berea Centre 21,877
Overport City 26,727
The Home Centre Springfield 18,298
Value Centre Springfield 19,887
Total 161,281 Source: South African Council of Shopping Centres/2006/07
Table 8: Western Nodes Shopping Centres
Western Nodes
Name of Centre Size (m2)
The Pavillion - Westville 108,000
Sanlam Centre - Pinetown 38,980
Knowles Centre - Pinetown 15,038
Westville Shopping Centre 12,567
The Village Market 11,143
Malvern shopping Centre 12,203
Waterfall Shopping centre 12,000
Montclair Mall 11,826
Total 221,757 Source: South African Council of Shopping Centres 2006/07
EThekwini Property Market Review 2007/2008
0046/07/FV Page 35 24/10/2007
Table 9: Northern Nodes Shopping Centres
Northern Nodes
Name of Centre Size (m2)
Gateway Theatre of Shopping 110,000
La Lucia Mall 35,058
Mount Edgecombe 10,000
Newlands City 16,500
Phoenix Plaza 20,681
Pick 'n Pay Durban North 20,296
The Crescent 26,330
Total 238,865 Source: South African Council of Shopping Centres 2006/07
Table 10: Southern Nodes Shopping Centres
Southern Nodes
Name of Centre Size (m2)
Umlazi Mega City 10,850
Bluff Shopping Centre 12,204
Southway Mall 13,923
Bluff Pick n Pay Centre 13,936
Chatsworth Centre 41,447
Total 92,360 Source: South African Council of Shopping Centres 2006/07
There are various new developments under consideration in various Durban
nodes. In the southern region examples include:
The Estuary in Amanzimtoti – located west of the Amanzimtoti CBD and
proposed to have 35,000m² of retail space.
South Coast Mall located south-west of the N2 and R603 in the
Kingsburg/Winkelspruit area and could have 82,500m² of retail space and
11,025m² of commercial space.
The Galleria at Arbour Town, located at the N2 and Moss Kolnik intersection
(currently a golf course) is proposed. It is envisioned to house a 20,000m²
office park, 400 units of high-density housing, 200 units of low-density housing
and a retirement village. The retail component would include a 75,000m²
development incorporating a cinema and ice rink plus entertainment facilities.
Success of the Umlazi Mega City, a 28,000m² shopping centre anchored by a
Super Spar, has led the way for the development of the Philani Valley shopping

EThekwini Property Market Review 2007/2008
0046/07/FV Page 36 24/10/2007
centre with a phased total lettable space of 12, 930 m². The centre is 6km
from Umlazi Mega City and also has a Super Spar as anchor tenant.
The Durban property market remains dynamic and is in
flux. Prime nodes have, and continue to develop in the
western and northern areas while newer nodes are also
being built on the periphery of the CBD. These would
include the Point Development and the Kingsmead
node. Section 4 of the report will highlight some of the
property indicators in these nodes.
4. PROPERTY MARKET INDICATORS
This section of the report highlights some of the property indicators for the
different nodes in the eThekwini Municipality. Each geographical location is
discussed separately namely - the Durban CBD, Central nodes, Western nodes,
Northern nodes and the Southern nodes as described in Section 3.
4.1 THE DURBAN CBD
The Durban CBD, vacancy rates have in recent years hovered around the 20%
level. It should be noted that these figures only reflect “A’ and “B” grade
buildings.

EThekwini Property Market Review 2007/2008
0046/07/FV Page 37 24/10/2007
Graph 5: Durban CBD - Office Vacancy Rates
Source: SAPOA, 2007:1
In terms of the rental market, rentals are stable with A-grade rentals averaging
between R50/m² and R55/m², however there are a few properties peaking just
above R60/m² and lower grades of property are achieving rentals below R40/m²
as illustrated in the graph below.
Graph 6: Durban CBD - Gross Office Rentals
Source: Rode’s Report
New office developments at the Point are expected to achieve rentals of about
R75-R85/ m², with these rentals largely being reflective of building costs and
expected yields.
R 15
R 25
R 35
R 45
R 55
R 65
2000
:1
2001
:1
2002
:1
2003
:1
2004
:1
2005
:1
2006
:1
2007
:1
R/
m2
A+ A B C
0%
5%
10%
15%
20%
25%
30%
35%
Q1/90
Q1/91
Q1/92
Q1/93
Q1/94
Q1/95
Q1/96
Q1/97
Q1/98
Q1/99
Q1/00
Q1/01
Q1/02
Q1/03
Q1/04
Q1/05
Q1/06
Q1/07
%
TOTAL GRADE A GRADE B
EThekwini Property Market Review 2007/2008
0046/07/FV Page 38 24/10/2007
The shortage of well located office land, with appropriate infrastructure may, in
the longer term encourage the redevelopment of existing CBD office properties.
For the retail market in the CBD, brokers report that rentals are achievable
between R150/m²and R180/m² at the upper end. Although this sector of the
market offers considerable opportunities, there is growing competition from
shopping centres located in for instance Umlazi.
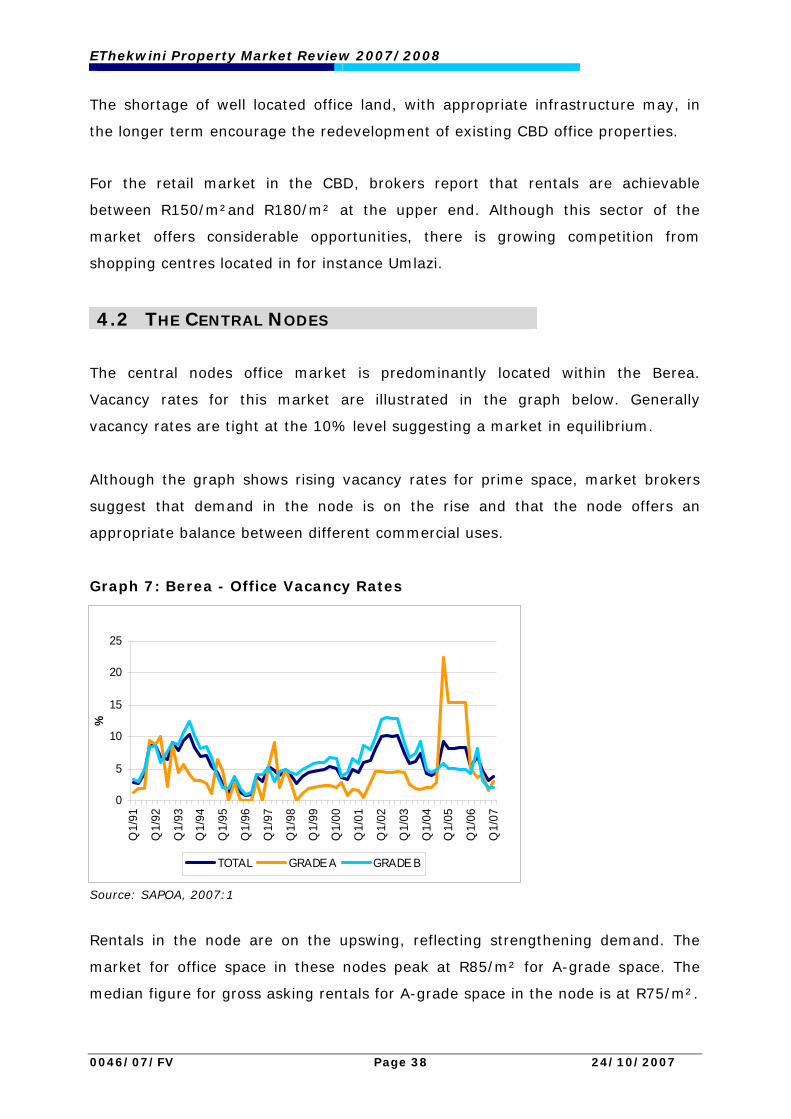
4.2 THE CENTRAL NODES The central nodes office market is predominantly located within the Berea.
Vacancy rates for this market are illustrated in the graph below. Generally
vacancy rates are tight at the 10% level suggesting a market in equilibrium.
Although the graph shows rising vacancy rates for prime space, market brokers
suggest that demand in the node is on the rise and that the node offers an
appropriate balance between different commercial uses.
Graph 7: Berea - Office Vacancy Rates
Source: SAPOA, 2007:1
Rentals in the node are on the upswing, reflecting strengthening demand. The
market for office space in these nodes peak at R85/m² for A-grade space. The
median figure for gross asking rentals for A-grade space in the node is at R75/m².
0
5
10
15
20
25
Q1/
91
Q1/
92
Q1/
93
Q1/
94
Q1/
95
Q1/
96
Q1/
97
Q1/
98
Q1/
99
Q1/
00
Q1/
01
Q1/
02
Q1/
03
Q1/
04
Q1/
05
Q1/
06
Q1/
07
%
TOTAL GRADE A GRADE B

EThekwini Property Market Review 2007/2008
0046/07/FV Page 39 24/10/2007
R 25
R 35
R 45
R 55
R 65
R 75
2000
:1
2001
:1
2002
:1
2003
:1
2004
:1
2005
:1
2006
:1
2007
:1
R/
m2
A+ A B C
Graph 8: Berea - Gross Office Rentals
Source: Rode’s Report
In terms of the retail market, areas such as Musgrave Centre are averaging a
rental of R79/m², although the rental can be significantly higher for smaller, well-
located space.
4.3 THE WESTERN NODES
Official market data suggests that vacancy rates have declined. This is
corroborated by property professionals and brokers reporting on the Western
node market especially in numerous buildings and new developments which are
being undertaken in the at Westway Office Park.
Graph 9: Westville - Office Vacancy Rates
Source: SAPOA, 2007
0%5%
10%15%20%25%
30%35%40%45%50%
Q1/90
Q1/91
Q1/92
Q1/93
Q1/94
Q1/95
Q1/96
Q1/97
Q1/98
Q1/99
Q1/00
Q1/01
Q1/02
Q1/03
Q1/04
Q1/05
Q1/06
Q1/07
%
TOTAL GRADE A GRADE B
EThekwini Property Market Review 2007/2008
0046/07/FV Page 40 24/10/2007
R 10
R 15
R 20
R 25
R 30
R 35
2000
:1
2000
:3
2001
:1
2001
:3
2002
:1
2002
:3
2003
:1
2003
:3
2004
:1
2004
:3
2005
:1
2005
:3
2006
:1
2006
:3
2007
:1
R/
m2
250 500 1,000 2,500 5,000
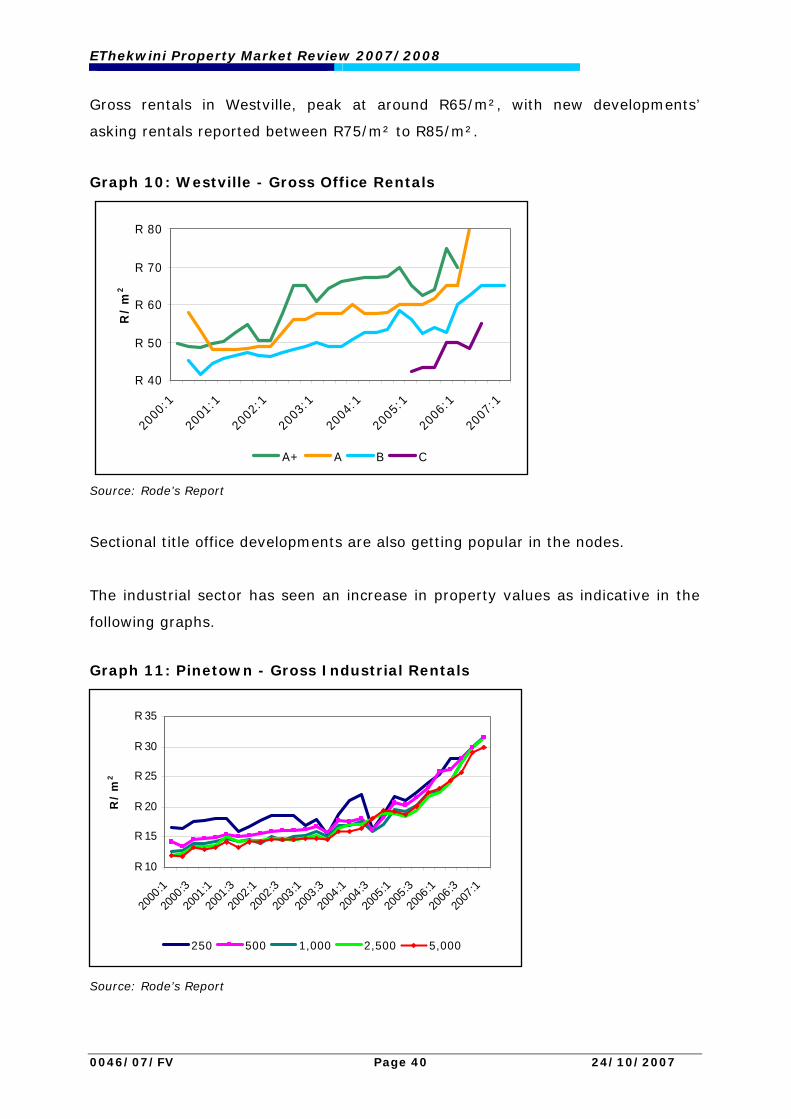
Gross rentals in Westville, peak at around R65/m², with new developments’
asking rentals reported between R75/m² to R85/m².
Graph 10: Westville - Gross Office Rentals
Source: Rode’s Report
Sectional title office developments are also getting popular in the nodes.
The industrial sector has seen an increase in property values as indicative in the
following graphs.
Graph 11: Pinetown - Gross Industrial Rentals
Source: Rode’s Report
R 40
R 50
R 60
R 70
R 80
2000
:1
2001
:1
2002
:1
2003
:1
2004
:1
2005
:1
2006
:1
2007
:1
R/
m2
A+ A B C
EThekwini Property Market Review 2007/2008
0046/07/FV Page 41 24/10/2007
R 10
R 15
R 20
R 25
R 30
R 35
2000
:1
2000
:3
2001
:1
2001
:3
2002
:1
2002
:3
2003
:1
2003
:3
2004
:1
2004
:3
2005
:1
2005
:3
2006
:1
2006
:3
2007
:1
R/m
2
250 500 1,000 2,500 5,000
R 9
R 12
R 15
R 18
R 21
R 24
R 27
R 30
R 33
2000
:1
2000
:3
2001
:1
2001
:3
2002
:1
2002
:3
2003
:1
2003
:3
2004
:1
2004
:3
2005
:1
2005
:3
2006
:1
2006
:3
2007
:1
R/m
2
250 500 1,000 2,500 5,000
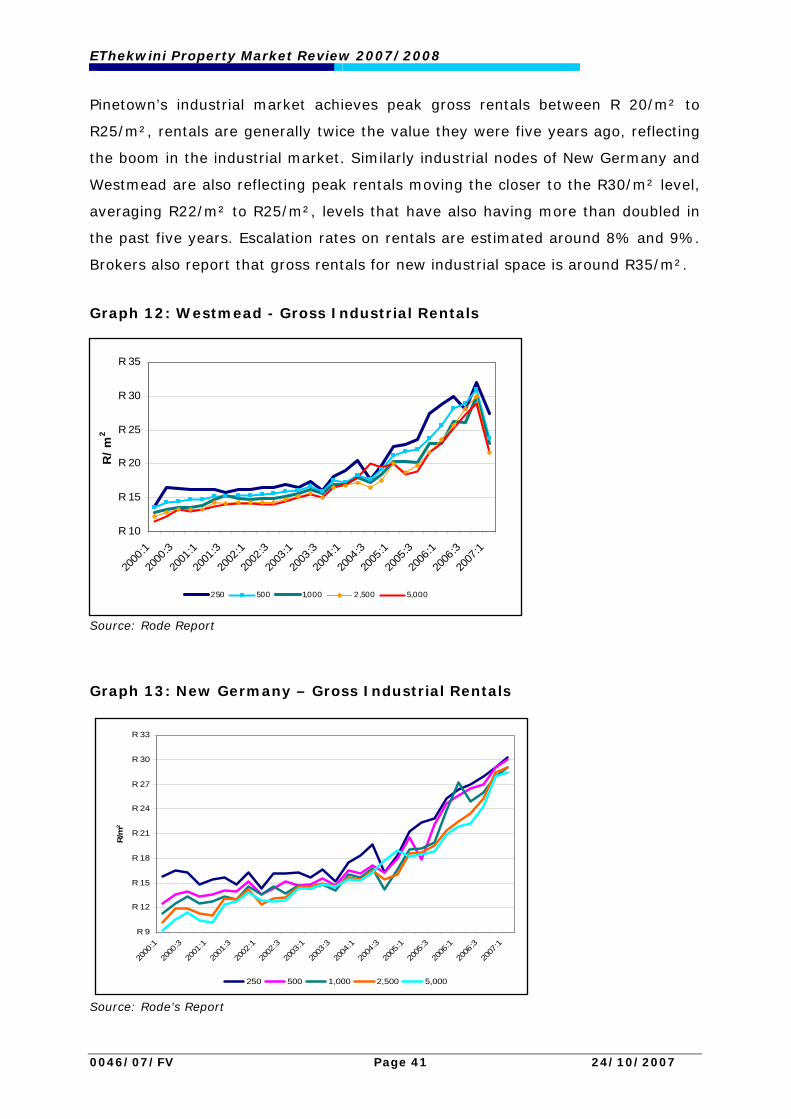
Pinetown’s industrial market achieves peak gross rentals between R 20/m² to
R25/m², rentals are generally twice the value they were five years ago, reflecting
the boom in the industrial market. Similarly industrial nodes of New Germany and
Westmead are also reflecting peak rentals moving the closer to the R30/m² level,
averaging R22/m² to R25/m², levels that have also having more than doubled in
the past five years. Escalation rates on rentals are estimated around 8% and 9%.
Brokers also report that gross rentals for new industrial space is around R35/m².
Graph 12: Westmead - Gross Industrial Rentals
Source: Rode Report
Graph 13: New Germany – Gross Industrial Rentals
Source: Rode’s Report

EThekwini Property Market Review 2007/2008
0046/07/FV Page 42 24/10/2007
Although rentals have strengthened in recent months, brokers report that
industrial users tend to prefer buying industrial space than leasing space.
In terms of industrial values for vacant land The Rode Report reflect the following
rates:
Table 11: Western Nodes: Industrial Land Values (Vacant Land)
1,000m² 2,000m² 5,000m² 10”000m²
Pinetown R500/m2 R475/m2 R450/m2 R400/m2
New Germany R400/m2 R400/m2 R375/m2 R350/m2
New Westmead/Mahogany
Ridge R500/m2 R475/m2 R525/m2 R400/m2
Source: Rode’s Report
Table 11 suggests industrial land values are generally being achieved between
R200/m² and R350/m² in these areas, higher rentals are being achieved for
newer industrial nodes.
Brokers report few sales for vacant space in the node, mainly due to scarcity of
industrial land in the nodes and that land prices could be sitting closer to
R400/m².
4.4 THE NORTHERN NODES
From the late 1990’s the Umhlanga commercial node has been one of the fastest
growing office nodes in South Africa. The latest SAPOA data as of the third quarter
of 2005 indicates a slight weakening of lower office grade vacancy rates. As
discussed earlier in the report the Westville node offers competition to
Umhlanga/La Lucia nodes.
EThekwini Property Market Review 2007/2008
0046/07/FV Page 43 24/10/2007
R 45
R 55
R 65
R 75
R 85
2000
:1
2001
:1
2002
:1
2003
:1
2004
:1
2005
:1
2006
:1
2007
:1
R/
m2
A+ A B
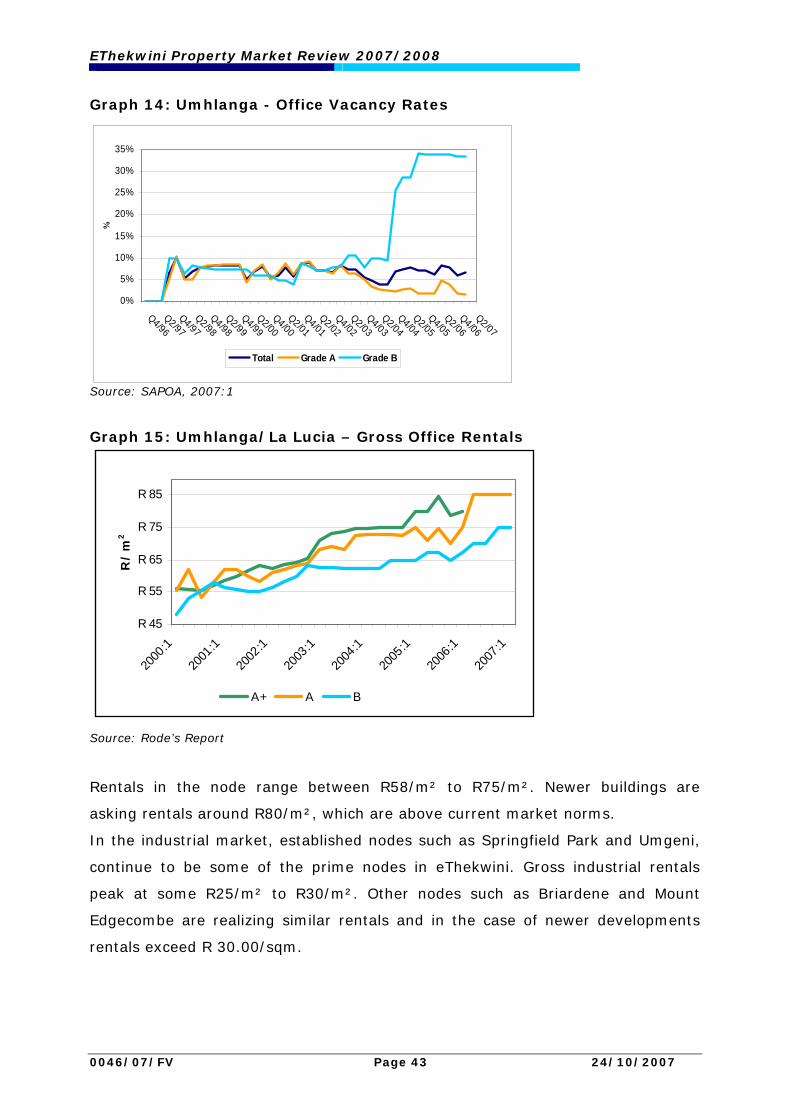
Graph 14: Umhlanga - Office Vacancy Rates
Source: SAPOA, 2007:1
Graph 15: Umhlanga/La Lucia – Gross Office Rentals
Source: Rode’s Report
Rentals in the node range between R58/m² to R75/m². Newer buildings are
asking rentals around R80/m², which are above current market norms.
In the industrial market, established nodes such as Springfield Park and Umgeni,
continue to be some of the prime nodes in eThekwini. Gross industrial rentals
peak at some R25/m² to R30/m². Other nodes such as Briardene and Mount
Edgecombe are realizing similar rentals and in the case of newer developments
rentals exceed R 30.00/sqm.
0%
5%
10%
15%
20%
25%
30%
35%
Q4/96Q2/97
Q4/97Q2/98
Q4/98Q2/99
Q4/99Q2/00
Q4/00Q2/01
Q4/01Q2/02
Q4/02Q2/03
Q4/03Q2/04
Q4/04Q2/05
Q4/05Q2/06
Q4/06Q2/07
%
Total Grade A Grade B

EThekwini Property Market Review 2007/2008
0046/07/FV Page 44 24/10/2007
R 10
R 15
R 20
R 25
R 30
R 35
R 40
2000
:1
2000
:3
2001
:1
2001
:3
2002
:1
2002
:3
2003
:1
2003
:3
2004
:1
2004
:3
2005
:1
2005
:3
2006
:1
2006
:3
2007
:1
R/m
2
250 500 1,000 2,500 5,000
R 15
R 20
R 25
R 30
R 35
R 40
2001
:3
2002
:1
2002
:3
2003
:1
2003
:3
2004
:1
2004
:3
2005
:1
2005
:3
2006
:1
2006
:3
2007
:1
R/m
2
250 500 1,000 2,500 5,000
Graph 16: Springfield Park - Gross Industrial Rentals
Source: Rode’s Report
Graph 17: Umgeni - Gross Industrial Rentals
Source: Rode Report
Reflecting national trends, land prices in the node has seen considerable increases
with industrial stands rising from some R300.00 /sqm some two years ago , to the
present R800.00/ sqm.
4.5 THE SOUTHERN NODES
Although no official market data exists for office space in these nodes of the
municipality, practitioners suggest that the office market averages between
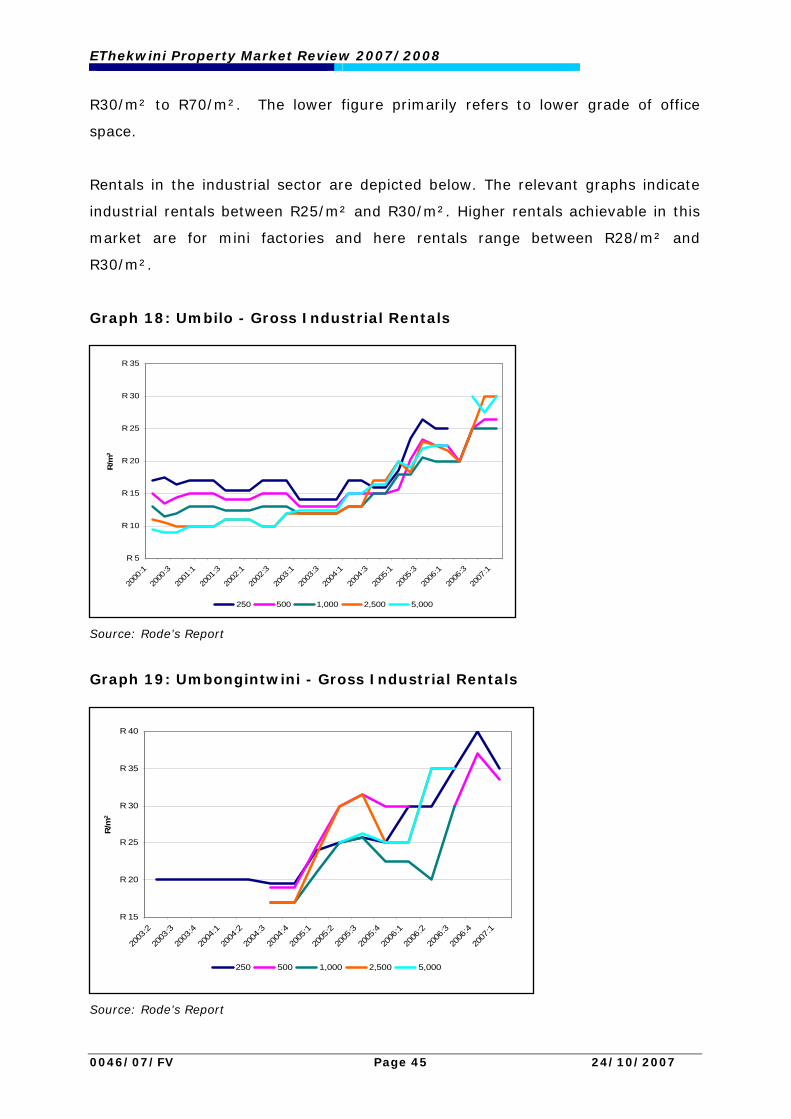
EThekwini Property Market Review 2007/2008
0046/07/FV Page 45 24/10/2007
R 5
R 10
R 15
R 20
R 25
R 30
R 35
2000
:1
2000
:3
2001
:1
2001
:3
2002
:1
2002
:3
2003
:1
2003
:3
2004
:1
2004
:3
2005
:1
2005
:3
2006
:1
2006
:3
2007
:1
R/m
2
250 500 1,000 2,500 5,000
R 15
R 20
R 25
R 30
R 35
R 40
2003
:2
2003
:3
2003
:4
2004
:1
2004
:2
2004
:3
2004
:4
2005
:1
2005
:2
2005
:3
2005
:4
2006
:1
2006
:2
2006
:3
2006
:4
2007
:1
R/m
2
250 500 1,000 2,500 5,000
R30/m² to R70/m². The lower figure primarily refers to lower grade of office
space.
Rentals in the industrial sector are depicted below. The relevant graphs indicate
industrial rentals between R25/m² and R30/m². Higher rentals achievable in this
market are for mini factories and here rentals range between R28/m² and
R30/m².
Graph 18: Umbilo - Gross Industrial Rentals
Source: Rode’s Report
Graph 19: Umbongintwini - Gross Industrial Rentals
Source: Rode’s Report

EThekwini Property Market Review 2007/2008
0046/07/FV Page 46 24/10/2007
R 5
R 10
R 15
R 20
R 25
R 30
R 35
2000
:1
2000
:3
2001
:1
2001
:3
2002
:1
2002
:3
2003
:1
2003
:3
2004
:1
2004
:3
2005
:1
2005
:3
2006
:1
2006
:3
2007
:1
R/m
2
250 500 1,000 2,500 5,000
Graph 20: Jacobs - Gross Industrial Rentals
Source: Rode’s Report
Industrial stands in for instance the Jacobs industrial node, have increased from
some R 250.00/sqm in 2005, to the present R 700.00/sqm (for a 2000 sqm
stand).
Industrial values in the South tend to be underpinned by strong demand,
especially by companies such as Toyota.
5. INVESTMENT INCENTIVES AND URBAN REGENERATION
In South Africa, the public sector, through its numerous policies, plays an
important role in influencing investment and economic growth of the city. Policies
applied by the eThekwini municipality are based on a Long Term Development
Framework, and related spatial development frameworks. The intention of the
report is not to exhaustively discuss the Spatial Development Framework(s) but it
must be underlined that the city invariably encourages investment in areas that
would give investors the required returns, and which are required to meet socio-
economic objectives.
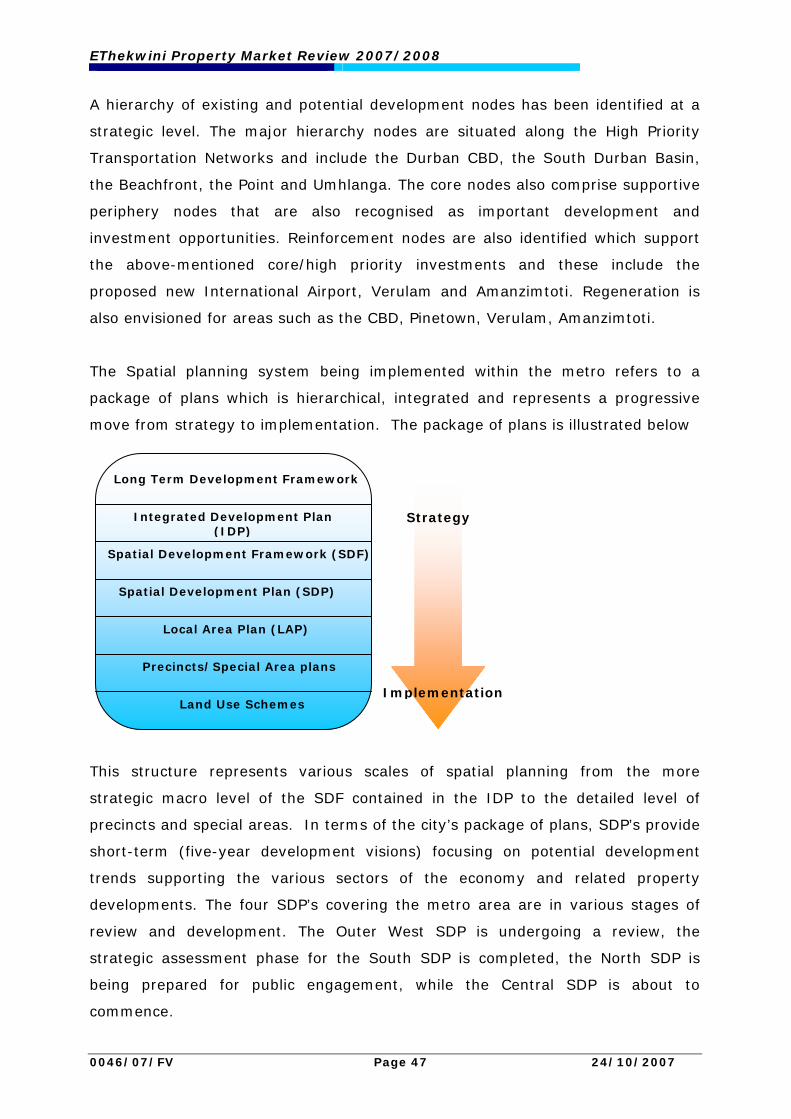
EThekwini Property Market Review 2007/2008
0046/07/FV Page 47 24/10/2007
A hierarchy of existing and potential development nodes has been identified at a
strategic level. The major hierarchy nodes are situated along the High Priority
Transportation Networks and include the Durban CBD, the South Durban Basin,
the Beachfront, the Point and Umhlanga. The core nodes also comprise supportive
periphery nodes that are also recognised as important development and
investment opportunities. Reinforcement nodes are also identified which support
the above-mentioned core/high priority investments and these include the
proposed new International Airport, Verulam and Amanzimtoti. Regeneration is
also envisioned for areas such as the CBD, Pinetown, Verulam, Amanzimtoti.
The Spatial planning system being implemented within the metro refers to a
package of plans which is hierarchical, integrated and represents a progressive
move from strategy to implementation. The package of plans is illustrated below
This structure represents various scales of spatial planning from the more
strategic macro level of the SDF contained in the IDP to the detailed level of
precincts and special areas. In terms of the city’s package of plans, SDP’s provide
short-term (five-year development visions) focusing on potential development
trends supporting the various sectors of the economy and related property
developments. The four SDP’s covering the metro area are in various stages of
review and development. The Outer West SDP is undergoing a review, the
strategic assessment phase for the South SDP is completed, the North SDP is
being prepared for public engagement, while the Central SDP is about to
commence.
Spatial Development Framework (SDF)
Long Term Development Framework
Integrated Development Plan (IDP)
Spatial Development Plan (SDP)
Local Area Plan (LAP)
Precincts/Special Area plans
Land Use Schemes
Strategy
Implementation
EThekwini Property Market Review 2007/2008
0046/07/FV Page 48 24/10/2007
Each SDP area will be covered by a number of local Area Plans (LAP’s). The
preparation of LAP’s, has begun for a number of areas, including for Shongweni
and Cato Ridge with the Ohlanga-Tongati LAP, east of the proposed Dube
Tradeport, being at the most advanced stage. LAP’s would go to the level of
providing detailed physical planning directives for the City by covering land use,
movement systems, environment and infrastructure to a point where they inform
the preparation of Land Use Schemes. Precinct plans provide detailed physical
planning directives down to the level of urban design detail for areas with
particular needs and special characteristics. A number of precinct plans and nodal
projects have begun or are proposed including those for the Umhlanga, Verulam,
Pinetown, Amanzimtoti, Hammarsdale and Umlazi nodes. Finally an effective Land
Use Management System (LUMS) is vital for supporting the intentions of these
plans and the allocation of development rights to private and publicly owned land.
Ultimately LUMS should allow for more appropriate development control
mechanisms aligned with the strategic level of planning. Already conflicts have
arisen between the intentions of SDP’s and existing zoning requiring a review of
the scheme in places.
The city and province also support a strong focus on Tourism related
opportunities. The KZN Tourism Authority
(www.tourismkzn.org/invest/devguide/index.html) has put together an
investment guideline entitled “The Developer’s Guide to investing in Tourism
Projects in Kwazulu-Natal. In this document potential investors are provided with
introduction to economic sectors, the procedure to land development applications,
introduction to major role players who would help investors in starting up and
doing business in this sector of the economy.
The importance lies in investors familiarising themselves with city-wide
development policies and development strategies that support property
investment in Durban.
EThekwini Property Market Review 2007/2008
0046/07/FV Page 49 24/10/2007
5.1 REGENERATION PROJECTS
The Inner eThekwini Regeneration and Urban Management Programme (iTRUMP)
is tasked with facilitating urban regeneration programmes for the Durban property
market.
Major flagship projects that have been part of urban regeneration programmes
include:
The development of the uShaka Marine Theme Park, which has led to
encouraging private investment of development of the Point which will be
discussed;
The development of the Sun Coast Casino located on the beachfront;
The Warwick Junction – a transport and trading business node. The project
successfully relocated traders to a more sheltered area with supportive
amenities within the same vicinity. The original trading hub was in turn
upgraded and better managed and prevented further informal trading that was
not conducive to the environment;
Regulating the informal trading on West Street through some formalisation as
well as the removal of streets trading competing with pedestrian traffic flow;
Improving the beachfront from uShaka Marine Theme Park to Umgeni river;
Regeneration of the inner city residential areas – which is also supported by
private sector investment; and
The development of the Kings Park district to create an international sports
precinct a trend already anticipated by major cities in South Africa in
anticipation of important sporting event such as the 2010 Soccer World Cup.
As discussed earlier in this report, such initiatives have a critical role to play in
creating new opportunities in the market for developers, tenants and investors.
The significance of iTrump has somewhat been exceeded by the formation of the
Strategic Project Team established in September 2005, and which has taken on
the planning, management and implementation of a number of significant
projects. Strategic Projects is specifically involved in the planning for the 2010
EThekwini Property Market Review 2007/2008
0046/07/FV Page 50 24/10/2007
world cup and the management of the tender and contract of the new Moses
Mabhida Soccer Stadium
5.2 THE POINT WATERFRONT
The development of the Point Waterfront is worth mentioning to illustrate how
regeneration initiatives encourage private sector investment. These investments
are leading to an urban regeneration of the Point area.
The Point Waterfont development is becoming one of Durban's most prestigious
locations, and is a vibrant tourist destination. The area’s first major development
was the uShaka Marine Theme Park. This has lead to further investment in high-
rise luxury apartments and commercial space. Together, this has created a high-
income mixed-use environment in close proximity to the CBD.
Some 2,000 apartments are expected to be developed. The first completed
apartment, the Quays, was launched at the end of March 2006. It is a 10-storey
apartment block that also has a separate boutique hotel. Heritage Square and
East Point have also been recently been completed.
Offices developments ranging from sectional title or rented space are also coming
onto the market.
5.3 THE DURBAN INVESTMENT PROMOTION AGENCY
The Durban Investment Promotion Agency (DIPA) is facilitating property
investment projects in the city. DIPA is a partnership initiative, reflecting a joint
effort between the municipality and private sector interests. DIPA offers an
investor advisory and facilitation services and its tasks range from offering
networking opportunities to potential investors and facilitating the unlocking of
potential land for development where possible. This has meant providing
information and market analysis as well as assisting business operations in the
identification of investment opportunities. Added to this, the Agency markets
Durban as an investment opportunity area for local and foreign investors.
EThekwini Property Market Review 2007/2008
0046/07/FV Page 51 24/10/2007
Major projects supported by DIPA include:
Development of community nodes. This includes the creation of an economic
environment that stimulates job creation. But more specifically it means
ensuring that communities have accessibility to community amenities. This is
targeted for example at communities in KwaMashu, Umlazi, Isipingo,
Clermont, Tongaat and Pinetown;
Development of the Kings Park precinct;
The assessment of the Ocean interface with the city. This means focussing on
key tourism opportunities;
The development of the ICC Arena.
Bridge City, a joint venture between Moreland Properties and the Municipality,
within the INK project area, designed to deliver a district centre to KwaMashu,
including residential, commercial and retail space.
DIPA has allocated budgets to undertake projects around the Urban Developments
Zones (UDZ’s), 2010 Soccer World Cup, Africa Square, Kings Park, the Beachfront
and Bridge City and new investment nodes for Inanda, Ntuzuma, KwaMashu,
Phoenix and surrounding areas.
The overall objective of DIPA is therefore to ensure that property and economic
development is broad-based across the municipality. This requires policy to focus
both on successful development nodes as well as encouraging development in
areas that have previously been neglected.
5.4 THE URBAN DEVELOPMENT ZONE
In 2003 the National government introduced Urban Development Zones (UDZ’s)
in numerous South African cities. Existing UDZ’s tend to be focussed around
areas that are predominantly characterised by urban decay - especially in Central
Business Districts. The eThekwini Municipality was one of the first cities to
demarcate a UDZ having done so in December 2004.
The Income Tax Act (58 of 1962) of 2003 permits owners/developers to
depreciate in an accelerated manner capital expenditure undertaken in a

EThekwini Property Market Review 2007/2008
0046/07/FV Page 52 24/10/2007
UDZ. This occurred through an amendment of the Income Tax Act. Consequently
the UDZ legislation provides tax incentives for both the improvement of existing
buildings and the construction of new buildings.
The UDZ tax incentives therefore encourage capital expenditure in designated
areas. In eThekwini the boundaries for the UDZ are Bell Street in the south
through to Shepstone Road, Victoria Embankment, Alexandra Street, Berea Road,
Carters Avenue, Canongate Road, Warwick Avenue, Centenary Road, Carlisle
Road, First Avenue, Stamford Hill Road, Croydon Road, Walter Gilbert Road,
Cobham Road, Old Fort Road, NMR Avenue, Somtseu Avenue, Stanger Street,
Argyle Road, NMR Avenue and Walter Gilbert Road in the north. The total area of
the UDZ amounts to approximately 670ha of developed land that would benefit
from this initiative. The UDZ is illustrated in the Map 2 below.
Map 2: The Urban Development Zone
There is growing evidence that investors are seriously considering the
attractiveness of such incentives, and may well be one of the reasons that major
corporate investments are being undertaken in the Durban CBD. The challenge
also lies in ensuring that investors take this opportunity to improve the condition
of existing buildings through appropriate renovations.
EThekwini Property Market Review 2007/2008
0046/07/FV Page 53 24/10/2007
Currently 35 projects are registered with the city in response to the take up of
incentives provided by the UDZ legislation, ranging in value from 1 million to 200
million. Total value of projects amounts to R700 million, with a number of big
corporates like ABSA and Standard Bank taking advantage of incentives as well as
smaller property owners. The total value of projects amounts to R 700 million,
being the value for projects completed and still under construction. This figure
could be higher as some upgrading projects may only register once construction is
already underway.
While take up of incentives has increased following a slow start, restrictions
created by the end date of 31st of March 2009 for bringing any building located in
a UDZ into use for purposes of claiming the incentive, may discourage some
projects from now on because of the lead time required.
6. CONCLUDING REMARKS
The Durban property market continues to benefit from strong fundamentals in the
South African and local macro-economy as well as improved conditions in the
property market itself. However from a national perspective, the 2006
investment returns provided by the Investment property databank suggest a
slight retraction from higher figures in 2005, with the retail sector pulling back the
most whilst the office sector remained stable. Although growth has been driven by
declining vacancy rates, rising rentals and the strengthening of capitalization
rates, the increase in interest rates and high building costs, may have started to
force a slow down.
From a micro-locational perspective, the performance of the property market,
from a metropolitan perspective, varies from one node to the next. In recent
years, the property market has dispersed throughout the municipality with new
nodes in the north and west showing considerable growth. While this has
sometimes been at the cost of the CBD, successful urban regeneration
programmes have once again provided the basis for investors carefully looking at
older areas.
EThekwini Property Market Review 2007/2008
0046/07/FV Page 54 24/10/2007
The development of the Dube Trade Port is expected to have a profound impact
on the local economy. While the project offers an economic catalyst, the
challenge will lie in maintaining a spatial balance in the local economy.
In the CBD increased tenant and investor demand is coming from smaller tenants
and private investors. The CBD also continues to provide a critical retail node for
shoppers from lower income areas who rely on public transport.
Initiatives such as the development of the Kingsmead node and the point
development are also providing important anchors for the CBD. With time, this
will ensure that the CBD provides a built environment that serves the commercial
as well as residential sectors for different income groups.
The future economic growth of the municipality will also require that an
appropriate balance is found between residential and commercial space. It will be
particularly important that appropriate industrial space is brought to the market to
underpin the economy. This will require taking advantage of big infrastructural
shifts tied to both the move of the airport and the expansion of the port, which
have implications for the use of the old airport site and stimulating development
associated with the trade port in the north. It will also require reviving
opportunities held in the Outer West in Hammersdale and Cato Ridge. Clearly the
delivery of industrial land requires a collective strategic response between private
and public interests to ensure the efficient allocation of land resources.
The future of the eThekwini economy and built environment will also require the
economic development of disadvantaged communities. This will require a
combination of appropriate public sector interventions as well as the creation of
an investment climate that encourages private investment in areas not previously
considered by investors.
Although the strength of the local economy will continue to offer significant
opportunities in the built environment, the challenge lies in ensuring that such
opportunities are provided across the municipal economy and isn’t confined to
certain nodes.
EThekwini Property Market Review 2007/2008
0046/07/FV Page 55 24/10/2007

EThekwini Property Market Review 2007/2008
0046/07/FV Page 56 24/10/2007
7. REFERENCES AND NOTES
ABSA, 2006, Absa Residential Price Index
Bureau of Economic Research (BER), 2007:1
EThekwini Municipality, 2005, IDP Review 2005/2006 (The Draft)
EThekwini Municipality, eThekwini upper south retail and office assessment
Economic Development Unit, 2006, Economic Data.
Investment Property Databank. 2006. SAPIX/IPD Index.
Rode and Associates. 2005:4. Rode’s Report on the South African Property
Market, Vol 18. No 2.
SAMCO: 2005. The Samco Report 2005/2006 in association with SAPOA.
SAPOA. Office Vacancy Survey 2006/2007.
Vancometrics, 2004, Outer West Economic Development Strategy
Vancometrics, eThekwini northern area – Economic analysis and pointers
towards a development strategy.
Viruly Consulting, 2005, Property market analysis of the southern municipal
planning region of eThekwini.
Secondary data, site visits and interviews – contributions from SAPOA vacancy
Survey committee facilitated by Beverly Ann fink of Broll, Bernice Faure,
Steven Reddy, Judith Guthrie, Ithala, Old Mutual Properties, Morelands, JHI,
Hannes Potgieter – Alliance, Maxprop, Keith Wilson – Mindry Rasmussen,
eProp, KZN Tourism Authority, iTRUMP, The Point precinct, eThekwini
Municipality, Economic development Unit, Durban Investment Promotions
Agency.
Stats SA selected building statistics of the private sector 2005 edition 28 June
2006.
Stats SA selected building statistics of the private sector 2006 edition 23
August 2007.
Disclaimer:
While the utmost care has been taken to ensure the validity of the information and
opinions contained herein, the eThekwini Municipality does not accept any responsibility
for investment decisions based thereon.

EThekwini Property Market Review 2007/2008
0046/07/FV Page 57 24/10/2007