Embed Size (px)
Citation preview
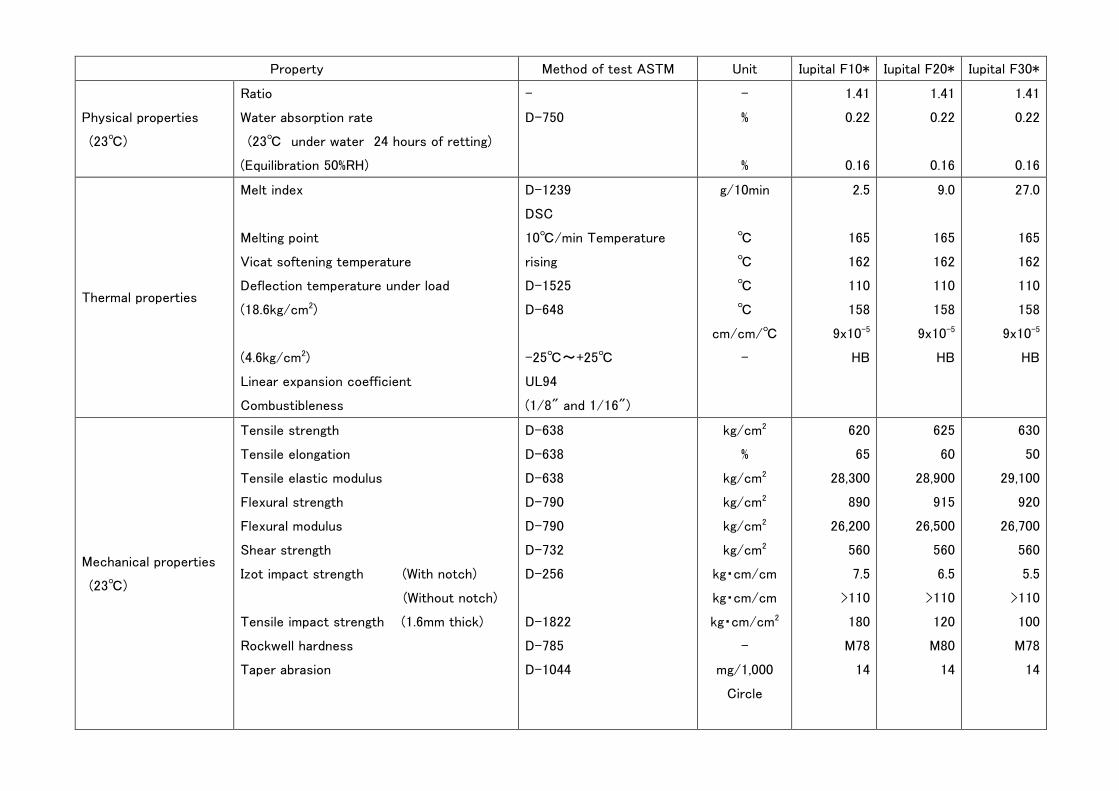
Property Method of test ASTM Unit Iupital F10* Iupital F20* Iupital F30*
Physical properties
(23℃)
Ratio
Water absorption rate
(23℃ under water 24 hours of retting)
(Equilibration 50%RH)
-
D-750
-
%
%
1.41
0.22
0.16
1.41
0.22
0.16
1.41
0.22
0.16
Thermal properties
Melt index
Melting point
Vicat softening temperature
Deflection temperature under load
(18.6kg/cm2)
(4.6kg/cm2)
Linear expansion coefficient
Combustibleness
D-1239
DSC
10℃/min Temperature
rising
D-1525
D-648
-25℃~+25℃
UL94
(1/8" and 1/16")
g/10min
℃
℃
℃
℃
cm/cm/℃
-
2.5
165
162
110
158
9x10⁻⁵
HB
9.0
165
162
110
158
9x10⁻⁵
HB
27.0
165
162
110
158
9x10⁻⁵
HB
Mechanical properties
(23℃)
Tensile strength
Tensile elongation
Tensile elastic modulus
Flexural strength
Flexural modulus
Shear strength
Izot impact strength (With notch)
(Without notch)
Tensile impact strength (1.6mm thick)
Rockwell hardness
Taper abrasion
D-638
D-638
D-638
D-790
D-790
D-732
D-256
D-1822
D-785
D-1044
kg/cm2
%
kg/cm2
kg/cm2
kg/cm2
kg/cm2
kg・cm/cm
kg・cm/cm
kg・cm/cm2
-
mg/1,000
Circle
620
65
28,300
890
26,200
560
7.5
>110
180
M78
14
625
60
28,900
915
26,500
560
6.5
>110
120
M80
14
630
50
29,100
920
26,700
560
5.5
>110
100
M78
14

Kinetic coefficient of friction Against steel
Against brass
Against
aluminum
Against iupital
Poisson ratio
Westover (Radial type)
"
"
"
-
-
-
-
-
0.13
0.15
0.15
0.20
0.35
0.13
0.15
0.15
0.20
0.35
0.13
0.15
0.15
0.20
0.35
Electrical properties
(23℃)
Permittivity 102Hz
106Hz
Dielectric tangent 102Hz
106Hz
Surface resistivity
Volume resistivity
Arc resistance
D-150
"
D-150
"
D-257
D-257
D-495
-
-
-
-
Ω
Ωcm
sec
3.7
3.7
0.001
0.007
1.0x10¹⁶
1.0x10¹⁴
>200
3.7
3.7
0.001
0.007
1.0x10¹⁶
1.0x10¹⁴
>200
3.7
3.7
0.001
0.007
1.0x10¹⁶
1.0x10¹⁴
>200
(* -01 -02 -03 Common)

1. Mechanical properties 1.1 Tensile strength
Figure 1.1-1 and 1.1-2 indicate stress-strain curve and elastic modulus-strain curve when iupital is pulled in strain rate of 5㎜/min. Temperature dependence is indicated in Figure 1.1-3 and velocity dependence is indicated in Figure 1.1-4. Iupital tensile property is shown below. Tensile strength 625kg/cm2
Coefficient of extension 60% Tensile elastic modulus 28900kg/cm2
In addition, there is a secant elastic modulus ratio as an efficient data of deformation-adjusted design, and as in the figure, it is stress-strain curve, and from tangent gradient Eo (initial elastic modulus), and line ,drew from origin to each curve, gradient Es (secant elastic modulus), it can be shown as secant elastic modulus ratio=Es/Eo
Figure 1.1-1 Tensile stress and distortion rate
Figure 1.1-2 Secant elastic modulus ratio and distortion rate
Tensile stress and distortion rate (%)
Tensile distortion rate
Elastic modulus (%)
Elastic modulus of distortion rate εi

1.2 Flexural strength
Figure 1.2-1 and 1.2-2 indicate stress-strain curve and elastic modulus-strain curve when iupital is bent in flexure rate of 10mm/min. Temperature dependence is indicated in Figure 1.2-3. Iupital flexural property is shown below.
Flexural strength 915kg/cm2 Elastic modulus 26500kg/cm2
Figure 1.1-4 Tensile strength and velocity dependence
Temperature (℃)
Figure 1.1-3 Tensile strength and temperature dependence
Tensile strength
Temperature
Temperature
Tension rate (mm/min)
Tensile
strength
Tensile
elongation
Flexural
fiber stress
Velocity
Fulcrum distance 101.6mm
Test piece
Flexural distortion rate (%)
Figure 1.2-1 Flexural stress and distortion rate

Flexural distortion rate (%)
Figure 1.2-2 secant elastic modulus ratio and distortion rate
Figure 1.2-3 Flexural strength and temperature dependence
Temperature (℃)
Elastic modulus
Initial elastic
modulus
Flexural
distortion
rate
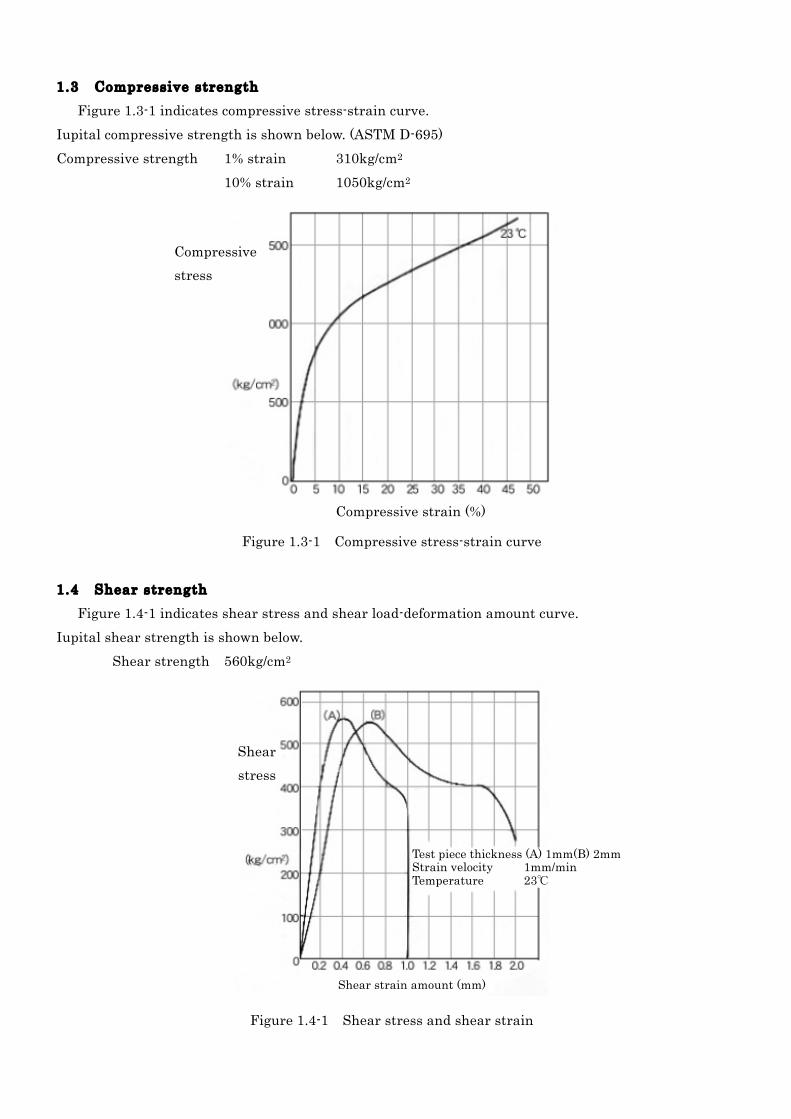
1.3 Compressive strength Figure 1.3-1 indicates compressive stress-strain curve. Iupital compressive strength is shown below. (ASTM D-695) Compressive strength 1% strain 310kg/cm2 10% strain 1050kg/cm2
Figure 1.3-1 Compressive stress-strain curve 1.4 Shear strength Figure 1.4-1 indicates shear stress and shear load-deformation amount curve. Iupital shear strength is shown below. Shear strength 560kg/cm2
Figure 1.4-1 Shear stress and shear strain
Compressive stress
Compressive strain (%)
Test piece thickness (A) 1mm(B) 2mm Strain velocity 1mm/min Temperature 23℃
Shear strain amount (mm)
Shear stress

1.5 Impact strength Figure 1.5-1 and 1.5-2 indicate impact strength and impact fatigue by each corner shape. Iupital impact strength is shown below. Izod method with notch 〔thickness 3.2mm〕ASTM D-256 6.5kg・cm/cm Izod method without notch〔thickness 3.2mm〕 " >110kg・cm/cm Tensile impact method 〔thickness 3.2mm〕ASTM D-1822 150kg・cm/cm2 〔thickness 1.6mm〕 " 120kg・cm/cm2 Falling ball method 〔thickness 3.2mm〕 25kg・cm
Ball head 5R Pad 85mm Temperature dependence and thickness dependence are small in Izod with notch.
Figure 1.5-1 Impact strength and curvature
Figure 1.5-2 Repetitive impact fatigue

1.6 Long-time behavior under load 1.6.1 Fatigue endurance Figure 1.6.1-1 and 1.6.1-2 indicate the result of iupital tension, compression and flexural fatigue.
Figure 1.6.1-1 Tensile fatigue strength and times repeated
Figure 1.6.1-2 Flexural fatigue strength and times repeated
Tensile stress
Times repeated until destruction
Test piece Test condition
Test rate
Test piece Test rate
Flexural stress
Times repeated until destruction

1.6.2 Creep properties Deformation will gradually grow under a situation left for long time with a certain amount of stress. This is called creep phenomenon. Figure 1.6.2-1 and 1.6.2-2 indicate iupital creep deformation.
Creep strain
Time (hr)
Creep strain
Test condition
Test condition
Figure 1.6.2-1 Tensile creep deformation
Figure 1.6.2-2 Tensile creep deformation
Time (hr)

1.6.3 Stress relaxation Stress to keep strain will gradually decrease under a situation left for long time with a certain amount of strain (deformation). This is called stress relaxation phenomenon. Figure 1.6.3-1 indicates iupital stress relaxation
Flexural stress
Figure 1.6.3-1 Flexural stress relaxation
Time (min)
Initial stress

2. Thermal properties 2.1 Melting point According to DSC analysis, the melting point of iupital is 165℃ 2.2 Thermal conductivity and specific heat Iupital thermal conductivity Iupital specific heat 2.3 Coefficient of thermal expansion Iupital coefficient of thermal expansion will change by the temperature. Figure 2.3-1 and 2.3-2 indicate measurement growth rate and temperature dependence of linear expansion coefficient.
Figure 2.3-2 Iupital linear expansion coefficient and temperature dependence
Iupital linear expansion is shown below. Linear expansion coefficient -25~25℃ 8~9×10⁻⁵cm/cm/℃ 20~80℃ 10~16×10-5cm/cm/℃
Figure 2.3-1 Iupital measurement growth rate by temperature alteration (20℃ standard)
Temperature (℃)
Measurement growth rate
Temperature (℃)
Linear
expansion coefficient

2.4 Deflection temperature under load Iupital deflection temperature under load Stress 18.6kg/cm2 110℃ (ASTM-D648) 4.6kg/cm2 158℃ ( " ) 2.5 Property variation by thermal process Molded product sometimes deforms by its shape complexity, uneven thickness, and insert's existence, which will lead to inequality of melted resin flow and solidification rate and end up with residual strain inside. In general, crystalline resin is easier to relax stress than amorphous resin, and also residual strain is smaller. In addition, it causes less stress-cracking as well. Annealing is often used as a method of cleaning up the residual strain in the molded product, and in case of iupital, annealing temperature should be around 140℃ to 150℃ in general. However, iupital molded product will pull out dimension and property change when it receives heat aging in various operating temperature, because it cause crystallization. It might grow in tensile and flexural strength, but will decrease in elastic modulus, expansion and impact, which will end up with dimensional shrinkage. Consequently, these changes need to be concerned when designing product. 2.5.1 Strength variation by thermal process Strength variation by thermal process will differ by the temperature, time, and molding condition. Initial elastic modulus tend to decrease by thermal process. Figure 2.5.1-1 and 2.5.1-2 indicate strength variation.
Tensile strength
retention rate
Tool temperature when molding (℃)
Thermal process condition
Heat cycle
(-20℃~80℃10 cycle)
Unprocessed
Thermal process condition Unprocessed
Heat cycle
(-20℃~80℃10 cycle)
Tool temperature when molding (℃)
Figure 2.5.1-1 Thermal process condition and tensile strength variation
Figure 2.5.1-2 Thermal process condition and flexural strength variation
Tensile strength
retention rate

2.5.2 Measurement variation by thermal process Crystalline resin will cause dimension change by thermal process because it accelerates crystallization. The factors that will effect greatly to the dimension change is thermal process condition (temperature, time), and molding condition (thickness, tool temperature). Figure 2.5.2-1 and Figure 2.5.2-2 indicate their relationship.
Heat shrinking
ratio
Thermal process condition
Thermal process condition
Tool temperature when molding
Tool temperature when molding (℃)
Molded product thickness (mm)
Figure 2.5.2-1 Tool temperature when molding and dimension change by thermal process condition
Figure 2.5.2‐2 Molded product thickness and dimension change by heating process
Heat cycle (-20℃~80℃10 cycle)

3. Chemical properties 3.1 Water absorbability and water resistance Figure 3.1-2, 3.1-2, 3.1-3 indicate weight change by Iupital water absorption, equilibrium water absorption rate, and dimension change by water absorption. Figure 3.1-4 indicates changes in tensile impact strength when left under high-temperature water. Figure 3.1-5 indicates changes in tensile strength.
Days
temperature (℃)
Under water
Water absorption rate
Figure3.1-1 Water absorption rate
Figure 3.1-2 Equilibrium water absorption rate and temperature dependence
Equilibrium
water
absorption
rate
Under water
Under water
Under water
Dimension change rate
Water absorption rate (%)
Figure 3.1-3 Dimension change by water absorption

Tensile impact
strength retention rate
Figure 3.1-4 Hot water immersion and changes in tensile impact strength
Immersion time (hr)
Immersion time (hr)
Figure 3.1-5 Hot water immersion and changes in tensile strength

3.2 Chemical resistance Iupital chemical resistance is good and have resistibility against many organic or inorganic pharmaceuticals and petroleum component. Table 3 indicates physicality changes in Iupital after immersed in each chemical at common temperature or 70℃. Some inorganic strong acid and organic acid might cause erosion or deterioration. In general, plastics are likely to cause stress crack or solvent corrosion. Though Iupital is a stress crack resistant material, sometimes it might occur at a stress concentrated part and a weld part. Hydrochloric acid is one of the sensitive chemicals for Iupital stress.
Table 3.2 Chemical resistance and oil resistance of Iupital Immerse condition Change rate (%)
Classification Chemical name Concentration(%) Temperature(℃)
Tensile
strength Measure Weight
n-heptane 100 23 ±0 -0.01 +0.15
Ethylism alcohol 99.5 23 -4.0 +0.13 +0.06
Aceton 98 23 -4.2 +0.61 +1.50
Carbon tetrachloride 96 23 -0.6 +0.05 +0.43
Organic
chemicals
Acetic acid 5 70 -4.5 -0.51 -1.29
Mitsubishi high-octane gasoline 100 23 -0.8 +0.06 +0.26
Diamond motor oil 100 70 +4.4 -0.13 +0.07
Transmission oil 100 70 +3.7 -0.12 +0.12
High-voltage insulation oil 100 70 +0.2 +0.07 -0.90
Diamond chassis grease 100 70 +3.9 -0.10 +0.18
Cup grease number 3 100 70 +3.2 -0.06 +0.23
Lubricant Daphne # 115 100 70 +4.7 -0.16 +0.18
Lubricant Swarup RO-700 100 70 -2.8 +0.02 -0.33
Gasoline・
Grease・
Motor oil
Lubricant turbine oil # 140 100 70 +4.2 -0.14 +0.09
Mama lemon (LION) 100 70 +2.6 -0.32 -0.33
My pet (Kao) 100 70 +1.0 -0.25 -0.16 Detergent
Tonic shampoo
(Sunstar) 100 70 +0.5 -0.08 +0.20
Sodium chloride 10 70 +3.1 -0.26 -0.15
Sodium hydroxide 10 70 +4.2 -0.29 -0.27
Vitriol 3 23 +0.8 -0.03 +0.13
Hydrochloric acid 10 23 X X X
Hydrogen peroxide 3 23 -0.8 ±0 +0.25
Inorganic
chemical
Distillated water 23 +0.8 -0.02 +0.13
Measurement sample figure: Tensile strength test piece, 1/8 inch thick
Immersion time: 90 days

4. Frictional wear properties
4.1 Thrust friction wear
Table 4.1-1, 4.1-2, 4.1-3 and Figure 4.1-1, 4.1-2, 4.1-3, 4.1-4 indicate friction coefficient, limiting PV value,
and specific wear volume by thrust wear of cylindrical test piece which contact area is 2cm2 and tabular test
piece.
Table 4.1-1 Coefficient of static friction
Friction material
Stationary side Movable side
Coefficient of static friction (μ)
Iupital Steel 0.12~0.16
Iupital Brass 0.13~0.18
Steel Iupital 0.12~0.18
Iupital Iupital 0.20~0.28
Attention: Surface pressure Low-speed rotation
Table 4.1-2 Coefficient of static friction and surface pressure
Friction material
Stationary side Movable side
Surface pressure
(kg/cm2)
Coefficient of static
friction
5.1 0.17~0.19
9.8 0.13~0.18
15.1 0.13~0.16 Iupital Steel
25.3 0.10~0.16
μ= Torque
------------------------ Load x Average radius
Friction coefficient
Surface pressure
Surface pressure
velocity
Figure 4.1-1 Coefficient of kinetic friction and surface pressure (against steel)
(Steady friction coefficient of 3 hours after under load friction)
velocity
Figure 4.1-2 Coefficient of kinetic friction and velocity (against steel) velocity velocity
Friction coefficient
Surface pressure
Surface pressure

Table 4.1-3 Specific wear volume (against each material)
Material* against steel against brass against aluminum against Iupital
Specific wear
volume** 1.1 2.0 19 3~30
Testing
condition
surface pressure
0.7~10kg/cm2
velocity
7.8~72.4km/day
Average specific wear
volume in
surface pressure
2.5~5kg/cm2
velocity
7.8~15.5km/day
Average specific wear
volume in
surface pressure
2.5~5kg/cm2
velocity
7.8~15.5km/day
Average specific wear
volume in
surface pressure
0.15~0.35kg/cm2
velocity
15.5,43.9,72.4km/day
Average specific wear
volume in
* Metal stock surface lapping ** Unit (x 10-2mm3/kg・km)
against steel
against Iupital
velocity velocity
Limiting PV value
Figure 4.1-3 Limiting PV value (Surface pressure increase method every 20 minutes)
velocity Surface pressure
Specific wear volume
Figure 4.1-4 Specific wear volume and surface pressure, velocity (against steel)
[Attention] Specific wear volume(mm3/kg・km)=
Friction capacity(mm3) ------------------------
Surface pressure(kg/cm2) x Walking distance (km) x Contact area(cm2)

4.2 Bearing (Journal bearing)
Iupital has good mechanical properties, long-term durability, thermostability, chemical resistance, and
friction wear properties, so it can be used as various slide member such as the bearing.
Bearing designing method is explained below since friction wear properties and thrust friction wear
properties of the bearing slightly differs.
4.2.1 Bearing inner diameter (Bearing clearance) Clearance (δ) in the journal bearing differs by its usage, but when used in common temperature area,
5/1000 to 8/1000 against shaft diameter is enough and will be
However, if rotational friction heat occurs between the bearing and the metal shaft, and bearing
temperature rises, or its environment become high-temperature, there is need to think about those condition
changes when deciding the clearance. Namely, clearance can be shown as
Here, φ2: Linear expansion coefficient difference between the bearing and the shaft
Bearing dimension will increase. φ2=(αP-αM)ΔT
αP, αM: Linear expansion coefficient of each resin and metal.
Material Linear expansion coefficient (x 10-5cm/cm/℃)
Iupital 1.1
Steel 1.6~2.4
Brass 1.9
Aluminum 2.4
ΔT : Difference between common temperature and in use temperature
φ3 : Thermal contraction of bearing material
When the bearing exposed to high-temperature atmosphere, crystallization will be accelerated and its
dimension will decrease.
Contraction percentage will differ by the thickness of molded product and the molding condition φ3=0.1~0.5% would be enough.
φ4 : Dimension variability by molding
See φ4=±0.05% dimension variability against basic dimension.
φ5=Dimension change by the lubricant
By the type of the lubricant, it will expand or shrink, so consider φ5=±0~0.2% changes (see also 3.2 Chemical resistance)
The clearance decision under high-temperature environment will be affected a great deal by the linear
Shaft diameter

expansion difference between the bearing and the shaft (φ2), and thermal contraction of bearing stuff (φ3).
However, the effect of dimension change by the lubricant (φ5), and dimension variability by molding
relatively small.
Also, when press fitting Iupital bearing into the metal housing, make the bearing inner diameter big in
advance, thinking about the bearing inner diameter decrement.
In this situation,
k = υ: Poisson ratio of Iupital (0.35)
I : Interference when press fitting
and shown as δ3=(φ1-φ2+φ3±φ4±φ5+φ6)ds
4.2.2 Bearing outer diameter (bearing thickness)
The thickness of bearing is generally 1mm to 2.5mm, thinking about friction heating (limiting PV value),
molded product dimension accuracy, and strength.
i) Interference when press fitting bearing into the metal housing
Compression stress of the bearing by press fitting must be less than 1050kg/cm2 of Iupital maximum
permissible compression stress.
ii) Contact surface stress and interference
Interference set up here is the value in actual usage. Therefore, linear expansion amount and heat
contraction of the bearing must be considered about interference in common temperature.
4.2.3 Bearing length
The size of bearing diameter is recommended for the length of the bearing, thinking of friction heating and
wear by the eccentricity in each pieces. Formula of equivalent compressive stress to the bearing (σc)is shown below.
φ6= 2k
------------------ ・1 k2(1-υ) +(1-υ)
σ= 2pk2
------------------ k2-1
l ---- 2r2
=
p ----
E
k2+1 [------]
k2-1
-v
σ : Compression stress p : Metal housing and contact surface stress of the bearing
2r2 : Metal housing inner diameter E : Stiffness modulus of elasticity in operating temperature and maximum operating time
σc= W
-------- 2r2・l
W : Vertical load to the bearing 2r2 : Bearing outer diameter l : Bearing length

4.2.4 Bearing durability
Long-term durability of the bearing is regulated by the wear volume in under limiting PV value. Specific
wear volume of the bearing will change by the clearance of the bearing shaft too.
Figure 4.2.4-1, 4.2.4 -2, 4.2.4-3 indicate friction coefficient, limiting PV value, and specific wear volume, when 10mmφ steel shaft was used.
Figure 4.2.4-2 Load velocity effect on friction coefficient (against steel)
Figure 4.2.4-2 Velocity effect on limiting PV value (against steel)
Figure 4.2.4-3 Specific wear volume in the bearing and PV value (against steel)
friction coefficient
velocity
Load
Load Load
velocity
Limiting
PV value
Specific
wear
volume
PV value