Embed Size (px)
Citation preview
Master Thesis in Geographical Information Science nr 133
MUHAMMAD IMRAN KHAN
2021
Department of
Physical Geography and Ecosystem Science
Centre for Geographical Information Systems
Lund University
Sweden
Property Tax Mapping and Assessment
Using GIS: Case study of Rawalpindi
City

ii
PROPERTY TAX MAPPING AND ASSESMENT
USING GIS
_________________________________________________________________
Muhammad Imran Khan (agi10mkh)
Master Thesis, 30 Credits, in Geographical Information Systems
Supervisor
Mr. Ulrik Martensson
Department of Physical Geography and Ecosystem Science
Lund University, Sweden

iii
Abstract
This study aims at exploring the use of spatial technologies in the taxation process to improve
property tax assessment procedures and work efficiency. The research would help to bring
uniformity and consistency in the property tax management system. Likewise, property tax
recovery is considered one of the most challenging tasks for the governments around the globe in
general and in third world countries including Pakistan, India, and Sri Lanka in particular.
Today, the existing real property assessment and tax collection system are under pressure to
increase its efficiency. Moreover, monitoring and updating of property units are not being carried
out regularly which results in loss of revenue. For example, change in the number of floors, land
area, covered area, building type, property occupation, tax categories, property usage, and land
use, etc. are not updated regularly. Each property unit has both spatial and non-spatial data. The
integration of both data sets can improve the efficiency of property tax assessment procedures
and monitoring systems. The introduction of geospatial technologies to the existing databases
will not only simplify the assessment and management of property taxes but it would also
improve the tax collection process. Furthermore, this technology will also enable the government
to monitor property tax revenue by preparing a common platform that visually links all property-
related data such as the number of floors in each building, a total constructed area of each
building, individual plot areas, details of locality and road facing details with the applied tax
calculation principles. Comprehensive geo-statistical reporting along with visualization and
thematic maps will enable the governments to identify the potential of revenue collection and
accordingly devise the proper policy instrument. Tax defaulters, hidden properties, and potential
areas for tax recovery and tax categories of properties can be easily identified with the help of
analysis and visualization. Geographical Information Systems (GIS) and Remote Sensing (RS)
are the tools to identify and locate the exact location of the properties with relevant tax attributes.
Among others, tax assessment variables such as land area, tax categories, main-off road, building
types of properties can also be observed and updated with the help of GIS and remote sensing
techniques. As a result, the property tax system will become more transparent, efficient, updated,
and considerable enhancement in government revenue.
Keywords: GIS, RS, Spatial Data, Attribute Data, Property Mapping, Property Tax

iv
Acknowledgements
I would like to acknowledge and thank to:
The Government of Sweden and Lund University for making LUMA-GIS program
available tuition-free via internet-based distance learning.
Mr. Ulrik Martensson, Thesis supervisor for providing technical support and guidance.
Taxation Department Government of Punjab, Pakistan for providing guidance, technical
support.
The Urban Unit P&D Department Government of Punjab, Pakistan for providing
technical support and guidance.
Thanks to my father who is well known statistician. He provided very valuable data,
guidance and moral support in accomplishing the job of preparing thesis.
v
Table of Contents
Abstract ......................................................................................................................................... iii
Acknowledgements ...................................................................................................................... iv
Table of Contents .......................................................................................................................... v
List of Figures .............................................................................................................................. vii
List of Tables .............................................................................................................................. viii
List of Abbreviations ................................................................................................................... ix
Chapter-1: Introduction ............................................................................................................... 1
1.1 Background and Motivation .................................................................................................. 1
1.2Aim of study.............................................................................................................................. 3
1.3 Research Questions ................................................................................................................. 3
1.4 Rawalpindi City Overview ..................................................................................................... 4
1.5 Overview of Study Area ......................................................................................................... 5
Chapter-2: Methodology .............................................................................................................. 7
2.1 What is Property Mapping? .................................................................................................. 7
2.2 Different Methods of Property Mapping .............................................................................. 7
2.3 Preparation for the Property Mapping................................................................................. 8
2.4 Data Sets ................................................................................................................................ 10
2.5 Methodology for Property Tax Mapping ........................................................................... 11
2.6 Creation of Geo Database .................................................................................................... 22
2.7 Building Topology ................................................................................................................. 22
Chapter-3: Property Tax System .............................................................................................. 23
3.1 Types of Properties in Property Tax System ...................................................................... 23
3.1.1 Taxable ................................................................................................................................ 23
3.1.2 Exempted ............................................................................................................................ 24
3.2 Procedure of Assessment of Property Tax.......................................................................... 24

vi
Chapter-4: Results and Analysis ............................................................................................... 27
4.1 Property Tax Mapping ......................................................................................................... 28
4.2 Category Detail...................................................................................................................... 39
4.3 Land Area Statistics .............................................................................................................. 39
4.4 Building Type Statistics ........................................................................................................ 40
4.5 Identification of Hidden Taxable Property Units .............................................................. 41
4.6 Identification of Tax Defaulters ........................................................................................... 41
4.7 Monitoring and Evaluation of Property Tax System ........................................................ 42
Chapter-5: Discussion ................................................................................................................. 53
5.0 Brief Note ............................................................................................................................... 53
5.1 Financial Impact ................................................................................................................... 53
5.2 Web Mapping ........................................................................................................................ 58
5.3 Difficulties, Problem, and Issues.......................................................................................... 59
5.4 Summary of Discussion ........................................................................................................ 61
5.5 Recommendations ................................................................................................................. 63
Chapter-6: Conclusion................................................................................................................ 65
Glossary ....................................................................................................................................... 67
References .................................................................................................................................... 71
Appendices ................................................................................................................................... 74

vii
List of Figures
Figure 1: Map of Rawalpindi City.
Figure 2: Map of study area.
Figure 3: Process flow/methodology for the property tax mapping.
Figure 4: Parcel mapping of study area.
Figure 5: Image of survey sheet for field verification.
Figure 6: Image of survey sheet after verification.
Figure 7: Working model of the study.
Figure 8: Parcel mapping of zone-II with satellite imagery.
Figure 9: Map of taxable and non-taxable units in the zone-II.
Figure 10: Map of zone-II showing the self-occupied and rented properties.
Figure 11: Map showing the number of storeys of each parcel in the zone-II.
Figure 12: Land use map of the zone-II.
Figure 13: Map of land area of zone-II.
Figure 14: Map of covered area of zone-II.
Figure 15: Map of luxury houses in the study area.
Figure 16: Map showing the categories of the tax (Amount wise) zone-II.
Figure 17: Tax status map of zone –II.
Figure 18: Map showing hidden and missing property units in the study Area.
Figure 19: Map showing the area correction of individual property unit.
Figure 20: Map showing misclassified information of tax categories before corrections.
Figure 21: Tax categories map of property units of zone-II after corrections.
Figure 22: Map showing the location information misclassified main and off-road properties.
Figure 23: Map showing the location information of property units after correction (Main /Off Road).
Figure 24: Map showing misclassified information of building type.
Figure 25: Map showing the building type of individual property unit.
Figure 26: Map showing the arrears detail of property unit.
Figure 27: Recovery comparison year wise recovery.
Figure 28: Web mapping of study area.

viii
List of Tables
Table 1: List of datasets.
Table 2: Quick Bird satellite sensor specification.
Table 3: Table showing fields of geo-database and attribute table.
Table 4: Attribute table detail.
Table 5: Comparison of property unit’s types and tax demand detail.
Table 6: Count of residential and commercial properties as per occupation.
Table 7: Land area statistics.
Table 8: Building type statistics of study area.
Table 9: Tax defaulters and tax paid detail.
Table 10: Comparison of zone-II & zone-V.
Table 11: Summary of corrections and its financial impact.
ix
List of Abbreviations
ArcGIS Suite of GIS software products developed by
ESRI
ARV Annual Rent Value
CAD Computer Aided Design
DBMS Database Management System
ESRI Environmental Systems Research Institute
GIS Geographical Information Systems
JPEG Joint Photographic Experts Group
GCP Ground Control Points
GPS Global Positioning System
GRAV Gross Annual Rent Value
MS Microsoft
PIN Property Identification Number
PKR Pakistan Rupee (Currency Unit, ISO)
QGIS Quantum Geographic Information System
(Software)
RGB Red, Green ,Blue
RS Remote Sensing
Shp Shape file
UIPT Urban Immovable Property Tax
UTM Universal Transverse Mercator
USGS United States Geological Survey

x
-This page is intentionally left blank
1
Chapter-1: Introduction
1.1 Background and Motivation
Property tax recovery has remained one of the challenging tasks over the years for almost every
government around the world, especially in third world countries. People often do not want to
pay taxes to the government thus following illegal ways of hiding their real attribute/status of the
property. Proper assessment of properties and efficient collection of tax is vital for municipal
corporations and other government departments as it is the primary source of income for these
authorities. In Pakistan, the tax collection system is antique and defective in many ways. The tax
collecting personal often do not have relevant knowledge, education, and training. Furthermore,
the government has very limited financial and human resources to properly dealing with tax
collection. Tax defaulters are usually influential persons and had a cordial relationship with tax
recovery staff. As a result, the tax department staff doesn’t put the properties on record and they
receive illegal amounts through unfair means. The tax department has manual and outdated
methods for tax collection. The relevant revenue department collects factious and bogus tax data.
As a result, the government is deprived of real tax revenue (Property tax department Rawalpindi,
2014). Here are some main issues being faced by the relevant authorities in Pakistan:
i. Wrong assessment of property tax.
The assessment of property tax is not calculated according to the prescribed formulas.
Assessment is not made according to property specifications.
ii. Delaying tactics in preparing of the list of tax defaulters.
Manual preparation of the defaulter list is a hectic task. Staff usually hesitates to prepare
defaulter list.
iii. Alteration of records.
Staff changes the manual record as per their personal interest.
iv. Manual property record is maintained on registers.
Hand written property tax record is maintained manually on the registers. It is very
difficult to check every property unit in detail on the manual register. The manual record
is beyond the access of public.
v. A large number of un-register properties.
Those property units which have not been registered in the tax network intentionally due
to individual interest.
vi. Inaccurate and incomplete property data.
The complete and accurate data for the assessment of property tax is not collected by
staff of tax department.
vii. Non-existence of property tax mapping system.
There are not any types of maps of property units available in the existing tax system.

2
The GIS and RS technology had an effective role in the improvement of the tax collection
system due to its spatial and statistical analysis and visualization (Cheplong, 2013). Hence, it is
essential to use GIS techniques in Pakistan to improve the tax collection system as adopted in
developed countries. Property mapping is the most convenient source available to the public to
determine the location and property-related attributes (like a street address, locality, category,
main/off-road and tax status, etc.).
It also helps in better understanding and easily visualizing the impact of sales, foreclosures, and
assessment appeals on property value in a neighborhood or tax district, eliminating multiple
views and unnecessary queries. One can quickly detect outliers, errors refine valuation models
and deliver more accurate data and assessments for the stakeholders and taxpayers (GIS for Land
Administration & Land Records, 2015).
Property mapping reflects the accurate size and shape of the property. Every property has both
spatial and other attributes data. The attribute data of parcels are available in the local tax
department office in the form of a paper register. The unique feature available in GIS is to link
the spatial and attribute data. Linking at both types of data, a variety of spatial and attributes
analysis are available to be performed with several tax variables.
The GIS could help monitor the property tax revenue by preparing a common platform that
visually links all property-related data such as the number of floors in each building, the total
constructed area of each building, individual plot areas, details of locality, and road facing details
with the applied tax calculation principles (Pareta, 2017).
The property tax system can be corrected and monitored with the help of RS and GIS using
analysis, measurements, statistics, and visualizations. Tax assessment variables such as parcel
area, tax categories, main-off road, building types, land area, number of floors, etc. of the
properties can be monitored and corrected. As a result, the property tax system becomes more
transparent and efficient.
The GIS is used to support decision-making processes in public and private institutions around
the world and can contribute significantly to the design of administrative and management
procedures that are more efficient, transparent and customer-friendly (Wehrmann and Glavina,
2009).

3
1.2 Aim of study
The main aims of study are as under
1. Explore the use of spatial technologies in the taxation process to improve property tax
assessment procedures and work efficiency.
2. Enhance tax revenue and bring transparency.
3. Improve planning and decision making process.
1.3 Research Questions
The study is based on the following research questions:
1. How to bring transparency, efficiency, better control and decision making in the property
tax system through computerization and integration with the Geographic Information
System (GIS) which will lead to effectively overcome the tax leakages, corruption, and
malpractices resulting in a considerable rise in revenue collection?
2. How to prepare maps by digitizing the imagery of urban areas to provide the printouts of
these maps to the surveyors for identification of properties on maps for integration with
GIS?
3. What is the extent of tax evasion/misclassification in the study area and how does the
correct classification, assisted with mapping/GIS increase tax recovery?
4. In what ways the property tax defaulters could be identified?
5. How to monitor, rectify and evaluate property tax system with different spatial, visual,
and statistical analyses?
The following hypotheses to be tested are:
1. The GIS can be used as an effective tool for property tax assessment, monitoring,
and information management system in the study area as compare to the manual
paper-based system.
2. GIS-based property tax system safeguards the government revenue and boost up
tax recovery in the study area by rectifying the anomalies/misclassification,
identifying the pattern of tax defaulters and potential area of tax revenue than the
manual paper-based system.
3. The GIS system can effectively overcome issues of the tax leakages, corruption,
and malpractices in the study area as compared to the manual paper-based system.

4
1.4 Rawalpindi City Overview
Punjab is the biggest province of Pakistan. Most city governments depend on the revenue
collection from property tax to finance their infrastructure and daily operations of the city. In
Punjab province, property tax provides an abysmally small percentage of total provincial revenue
by 2%. Property tax has the potential to grow very fast and can be more than double its current
size with better administration and decision making. The government of the province has put
tremendous pressure on tax authorities to increase their tax revenue by incorporating modern
technologies in the property tax system. The property tax systems are one of the mandatory
reforms.
The study area of the thesis is located in Rawalpindi city. Rawalpindi is one of the biggest cities
of the province which is located in the northern region of Punjab province. It is situated in the
pothar plateau near Islamabad, the capital of Pakistan. This area is selected because a variety of
taxable property types exists and the implementation of the current system will increase
government revenue inconsiderable amount. The area of Rawalpindi city is 259 square
kilometers which comprise more than 25 zones/circles. The city is highly populated. It has a
population of 2,098,231 persons as per the census 2017 (Population Census | Pakistan Bureau of
Statistics, 2017).
Figure 1: Map of Rawalpindi city and study area ( Data Source: IRIS Punjab (2015) IRIS: It’s a brand name of GIS based web mapping
application that provides a spatial frame work to host, geo code and view numerous other layered data-sets through internet.

5
1.5 Overview of Study Area
Rawalpindi city has been divided into 25 circles/zones for revenue collection and management.
This is a vast area that requires a lot of resources, time and human resources. For this reason,
only one zone namely Zone-II has been selected for this study area. I have selected Zone-II of
Rawalpindi for study purposes because it is located in the hub of the city, contains a variety of
properties, the record is in better condition, easily accessible, and can enhance the considerable
amount of tax revenue. For the identification of the boundary of Zone-II, I marked the boundary
of the zone on satellite imagery in collaboration with the revenue department staff. On
identifying and marking the boundary of Zone-II, it has been overlaid on the satellite imagery
and the zone boundary is verified in the field with the help of the tax department.
Satellite Map of Study Area
Figure 2: Map of study Area with satellite imagery. (Satellite imagery Source: Urban unit planning and development
Government of Punjab for Study and research Purposes.)

6
-This page is intentionally left blank-

7
Chapter-2: Methodology
2.1 What is Property Mapping?
In the past, the most common technique of keeping track of land ownership was surveying and
deed registration but it was not actual parcel mapping. Property mapping is a method of
identifying real property units, establishing property boundaries, determining actual use and
discovering undeclared properties (Cheplong, 2013). Property mapping of an area usually
represents the ownership of the property. The advantage of parcel mapping is that it allows easy
identification of a property where it is located relative to public ways and adjacent properties. A
parcel map is perhaps the most convenient resource available to the public to determine the
location and parcel identification number of a property. In property mapping, the location and
extent of a property/parcel are marked/digitized on land and a unique property identification
number is assigned.
Due to rapid development and increasing property values in cities and towns, the relevant
government departments and organizations began to realize the importance of having accurate
parcel mapping in Pakistan. Property number is the unique key to identify and fetch information.
When a unique Property Identification Number (PIN) is assigned to the parcel, the relevant
property information (location, property and tax detail) pertaining to the said property is
retrieved. An adequate parcel/property mapping should reflect the size and shape of each
individual parcel owned in a town/city (PARCEL MAPPING USING GIS, 1999). Property
mapping can be used for a variety of purposes which can be integrated with different systems
and databases. For example, it can be integrated with land use, tax collection and cadastral
mapping system, etc.
2.2 Different Methods of Property Mapping
The data in a GIS system is usually collected from the following sources:
I. Manual digitizing from existing map or satellite imagery.
II. Scanning analog map.
III. Automatic vectorization.
IV. Heads-up digitizing.
V. Coordinate geometry.
VI. Positioning property corners with GPS.
VII. Transfer of existing CAD map.
(Handbook on Geographic Information Systems and Digital Mapping, 2000)
Practitioner’s Guide: Digital Tax Parcel Mapping, 2009).

8
Data from the other sources are deficient and obsolete due to the non-availability of accurate
paper maps, cad map and coordinates data. As there was no CAD drawing or analog map existed
for the study area, therefore, this option was obsolete. Moreover, the collection of corner points
through GPS was also time-taking.
Therefore, as a researcher, I concluded that the current study heads-up digitizing method on
satellite imagery is more efficient due to its most suitability and relevancy for my study.
Heads-up digitizing is defined as the manual digitization by tracing a mouse-over feature
displayed on a computer screen, used as a method of vectorizing raster data (GIS for Land
Administration & Land Records, 2015). In the heads-up digitization, the raster imagery (satellite
imagery) is used as the background image. Operators perform digitization on the computer
screen and work can be distributed among several persons.
2.3 Preparation for the Property Mapping
Spatially mapping and registering all properties within the study area is critical to the
development of the research’s comprehensive and integrated property tax information system
(ZONEH, 2013). The assembling of an inventory on all property units is the very first step in
identifying and describing properties. The tax cannot be collected if those properties are not
properly located. As discussed earlier, there is no base map, cad map, and coordinated data
available. The first task is to develop a base map for the property tax database that is the property
tax mapping with the help of satellite imagery.
The property tax department Punjab requires two types of data pertaining to all parcels of
property in the property tax implementation:
1. Spatial Data
2. Non-Spatial Data
The spatial data refers to all types of data objects or elements that are present in a geographical
space or horizon and that can be represented by numerical values in a geographically coordinated
system. The non-spatial data contains the attribute information that describes spatial data such as
the property address, property ownership, occupant, taxpayer, land use and, building type. It is
explained here that the capturing process involves mapping and collecting current and relevant
property information on all properties within the study area for the purpose of taxation.

9
Credentials and information regarding the property units which falls under the tax is periodically
updated to keep records up to date and to monitor the changes being developed in property with
the passage of time. This information is mostly updated with the help of field survey and
sometimes the information is updated with conversation with the property occupant or the
property owner. In more than 100 developed and underdeveloped countries in the world like
Canada, Japan, the United Kingdom, The Netherlands, Switzerland, and Australia, etc. property
data collection is done through field surveys. In the United States cadastral maps are used by the
property tax administration to prepare parcel maps for property tax purposes. (Kayuza, 2006).
In Pakistan, the property tax survey is conducted every five years. The purpose of conducting a
survey is to collect updated, accurate and detail information about each property unit.
Furthermore, there is also a program to collect information about changes occurred in the status
of property units from time to time by the tax department staff.

10
2.4 Data Sets
Datasets for the current study were prepared with the help of the excise and taxation department
government of Punjab. First of all, I demarked the zonal boundary of the study area with the help
of the staff from the excise and taxation department on Google Earth as well as in the field. As a
second step, I mapped individual parcels on high resolution satellite imagery of the Quickbird
satellite following a manual digitizing technique. Road networks and landmarks were extracted
from the study area using high resolution satellite imagery as well as field visits. As a last step of
data collection, I collected property attributes from property tax registers of the excise and
taxation department. The detail is given below:
Table 1: List of Data sets
Sr.no Data Type Description Source
1 Zone boundary Boundary of the zone or circle With the help of GPS Survey
2
Property mapping Property mapping of an area
On screen digitization
with the help of satellite imagery
3 Road Road network
From satellite imagery and field
work
4 Land marks Important land mark of area From field work/Google Earth
5
Property attribute
data
All the tax related attributes of
a property
Existing database of property tax
& manual registers
(convert to Excel work book)
6 Satellite imagery Satellite imagery of the study
Area
On request from the urban unit
planning and development
Government of Punjab for Study
and research Purposes.

11
2.5 Methodology for Property Tax Mapping
The step by step process flow/methodology for the property tax mapping is shown in Figure-3.
Figure 3: Process flow/methodology for the property tax mapping.
2.5.1 Data Entry and Creation of Property Tax Data Base
All the property tax was available in the form of old manual paper registers. The next step was to
create a property tax database system on Microsoft Excel. After understanding and with the help
of tax department staff, data entry of the property units will be made from the paper registers and
a database of the property tax record of the study area was created.

12
2.5.2 Acquiring Satellites Imagery
The next task is to digitize the parcel for property mapping. For this purpose, high resolution
satellite imagery was used. QuickBird satellite offers high resolution image data up to 0.65
meters pixel. QuickBird provides industry-leading geo-locational accuracy of up to 23-meter
(CE90%), excluding any topographic displacement.
Ground location is derived from refined satellite attitude and ephemeris information without
requiring the use of Ground Control Points (GCPs). QuickBird sensor satellite imagery is used
for property mapping, change detection and forestry image analysis, etc. (QuickBird Satellite
Sensor Satellite Imaging Corp, 2015). The satellite imagery acquisition date September 24, 2014
and after a long struggle, conversations, applications, and verification, it was made possible to
get the satellite imagery of the study area from the government of Punjab for the study purposes.
Table 2: Quick Bird Satellite Sensor Specification
(QuickBird Satellite Sensor | Satellite Imaging Corp. 2015)
Launch Date
18-Oct-2001
Launch Vehicle Boeing Delta II
Launch Location Vandenberg Air Force Base, California, USA
Orbit Altitude 450 Km
Orbit Inclination 97.2°, sun-synchronous
Speed 7.1 Km/sec (25,560 Km/hour)
Equator Crossing
Time 10:30 AM (descending node)
Orbit Time 93.5 minutes
Revisit Time 1-3.5 days, depending on latitude (30° off-nadir)
Swath Width 16.5 Km x 16.5 Km at nadir
Metric Accuracy 23 meters horizontal (CE90%)
Digitization 11 bits
Resolution Pan: 61 cm (nadir) to 72 cm (25° off-nadir)
MS: 2.44 m (nadir) to 2.88 m (25° off-nadir)
Image Bands
Pan: 450-900 nm
Blue: 450-520 nm
Green: 520-600 nm
Red: 630-690 nm
Near IR: 760-900 nm
13
2.5.3 Identify the Study Area on satellite Imagery
After getting the satellite imagery, the boundary of the study area was marked with the help of
the tax department. For defining the boundary of the study area, the relevant properties of the
area were included. This phase will involve the active participation of tax officials for providing
the spatial extent of a region, zone or circle. Therefore, localities and many other properties in
the study area were verified. On the ground, property verification number, property bills, and
other necessary information were mentioned.
During the digitization, it was ensured that access or ways to every parcel should exist.
Moreover, every parcel of land was digitized for the revenue collection processes. All
properties/parcels were digitized as polygon feature, line feature (Roads), and point feature (land
mark).
2.5.4 Digitization
Digitization is one of the most important stages in map production since the quality of the final
work, the subsequent analysis and results are relatively depending on the accuracy of the
digitized data (Cheplong, 2013). The utility of a parcel/property map is that it allows for easy
identification of where a property is located relative to public ways and adjacent properties
(PARCEL MAPPING USING GIS, 1999). Property tax mapping is the core element of any
integrated real property tax administration and tax management. It establishes the link between
the real properties in the field and the property assessment and the tax record of tax
administration (Handbook on Geographic Information Systems and Digital Mapping, 2000).
After the demarcation of Zone-II boundaries, digitization will be performed on satellite imagery
to acquire unique urban features on the ground. In terms of GIS, every unique entity on the
ground is known as a parcel, which has an area, a spatial reference, and unique id, whereas, in
terms of tax, it is regarded as a property unit. Thus, every parcel of the study area was digitized.
2.5.5 Data Verification Sheets
For ground-truthing, the data verification sheet (Figure 5 and Figure 6) was prepared that
contained landmarks, map legends, and roads, etc. This helped the surveyors to locate and verify
the attributes of property in the field. Figure 5 shows that parcels are blank and surveyors have to
collect the parcel number from the study area. The parcel number is defined as the property
number/Street address mentioned on each property.
2.5.6 Indexing of the Study Area for Work Distribution
For efficient planning and management, the zone area is indexed to divide it into the smaller
portions (A3 sheets), so all the study area can fit into the sheets (A3 size) for field verification.
The said work was managed by dividing the area into sheets. Thus, for the field verification, the
property to property verification on the ground was required.

14
Figure 4: Parcel Mapping of Study Area (Source: Digitization of parcel on satellite imagery)
2.5.7 Field Survey
The field verification was essential and prerequisite to collect the relevant information from the
study area with the co-operation of the tax department. After digitization phase, a door to door
survey was carried out in the study area. The maps will be prepared and provided to the
surveyors for mapping the location and relevant attributes of the property units with the help of
the tax department staff.
At this stage, attributes only will involve land use (Commercial, residential or both), property
number and ownership status, etc. In the study area, surveyors identified the relevant property
number and attributes and assigned them. This data was then correlated with the data available
with the municipal corporation (GIS simplifying property tax collection in India-Geospatial
World 2019).
A high-resolution photograph of each property is captured during the field survey and attached to
each property unit. This property photograph helped in the identification, verification, and
assessment of property tax.

15
Figure 5: Image of Survey Sheet for before Field Verification

16
Figure 6: Image of Survey sheet after Field Verification

17
Unique property number marked on the survey sheets. The size and shape of the property are
also verified with reference to the map scale. They used maps to determine the land and covered
area of the property. Measuring tapes were used where building maps were not available.
Surveyors performed the job of splitting and merging the parcel on the survey sheets according
to reality. Moreover, they provided road access to every property or parcel according to reality.
2.5.8 Geo-referencing the Survey Sheets and Building Property Geo database
The survey sheets are scanned in JPEG format and geo-referenced in the UTM projection
system. This was done by identifying some (not less than four) identical points from the satellite
imagery and the survey sheet. This introduces minor shifting and distortion which was rectified
by increasing control points and using the 1st order polynomial (affine) transformation. The first-
order polynomial transformation is commonly used to geo-reference an image.
All four points of the corner were used as the ground control points for registering. After geo-
referencing the scanned survey sheets, these were superimposed on the satellite imagery. When
both the imagery and survey sheets were superimposed on each other, it was easy to update the
information from the survey sheet to the relevant parcel attributes in the database table and
necessary corrections can be made in the parcels according to the survey sheet and satellite
imagery.
One can clearly see the information in the survey sheets and transfer this to the respective parcel.
From the survey sheet, a unique identification property number as mentioned in the survey sheet
to the property in the database was assigned. The updating process was undertaken in respect of
all the parcel status with the unique property number as collected from the study area mentioned
in the survey sheets.
2.5.9 Linking Attribute and Spatial Data
During the filed activity, some basic property related information such as street address, housing
unit or population estimates and documentation information will be compiled for the study area.
This external information about the property units will be stored in separate data tables in a
generic database management system. From there, it can be linked as needed to the boundary
data through the common identifier. Similarly, after field survey completion, the above attribute
information is stored separately in a database management system. In order to create results
(thematic maps), the spatial and non-spatial data are then linked via the unique identifiers in the
polygon attribute table (Handbook on geographic information systems and digital mapping,
2000).
Currently, the property tax record is maintained in the form of a register prepared by the survey
staff of the tax department. The property tax data is verified from these manual registers.
Furthermore, the property tax data is obtained from the property tax management information
system that is also available in Microsoft excel format.

18
On updating data from the survey sheets, a complete parcel data with a unique property number
(primary key) was assigned to each parcel. In the property tax system, property number/street
address has a unique key which provides detailed information about the property by searching
unique property identification number (primary key). Both attribute and spatial databases are
available now.
Implementation of GIS based revenue collection system will commence once the digital map
base and the automated billing databases are in place. The necessary building blocks are the map
and attribute databases. The GIS system has to be able to handle all operations in revenue
collection including creating a new property unit in the system, valuation, tax bill delivery, tax
collection, arrears control, and splitting and/or amalgamating two property units (Nieminen,
2002).
The next step was to create a link between them so that both the property tax management
information system and GIS system could be integrated. In the property tax management,
information system and GIS system, property number is unique and relevant information can be
retrieved with the property identification number. In order to achieve this goal, join in ArcGIS.
Now establish a link between the property location on to GIS map and its corresponding property
details with photographs.
Property tax mapping establishes the link between the real properties in the field and the property
assessment and the tax record of tax administration (Handbook on Geographic Information
Systems and Digital Mapping, 2000).
By establishing a link between the document and the related property, the workflow from
submission to property assessment to GIS mapping is strengthened. The workflow is more direct
and less error-prone. The GIS and property record integration create a value-added product for
all property records stakeholders (GIS and Land Records Integration A PRIA White Paper,
2017).

19
Table3: Table Showing Fields of Geo-Database and Attribute Table
GIS Table Attribute
City name
Zone Name
Area Code
Street address
Locality
Property Tax Database
City Name
Zone Name
Area Code
Street Address
Taxable/Exempted
Covered Area
Land Area (Plot Size)
Building Type
Location (Main/Off Road)
Payable Tax
Category (Residential)
Category (Commercial)
Owner name
PIN
Year of constructions
Number of stories
Accommodations
Locality
Arrears

20
Existing
Property Tax
Data Base
Land Area and Covered Area
Statistics
Property Land Use
info
View Tax Categories
Property Types
Search
Tax Defaulter Search
Existing
Property Tax
Data Base
Integrate/Join
Property Tax Data Base
Geo Data Base
GIS Field
Survey
Property
Mapping/Digitization
Figure 7: Working Model of the Study
Working Model
Existing Manual
Property Tax
Record
Acquisition of Satellite
Imagery of Study Area

21
Attribute Table Detail
Table 4: Attribute Table Detail
Attribute Detail
City Name Name of city
Zone Name Name of the area
Area code Code of area assign by the department
Street Address/Property
Unit number
Property Address
Taxable/Exempted Type of property Unit
Building Type Type of building (For example Office, House, Factory, industry,
shop etc.)
Covered Area (Sq ft) Built up area (It is the actual area of a house that is under the roof.)(
Land Area (Sq yards) Total area of land (plot size)
Location Main/Off road
Payable Tax Current year tax
Category Res Residential category
Category Com Commercial category
Owner Name Name of property owner.
PIN =16 digit code (district
code+citycode+zonecode+Localitycode.............................)
Year of construction
Year of property construction
Number of Stories
Total flour /Building stories
Accommodation
Detail of rooms
Locality
Subsector of Area. For example, an area is divided in to four sub
parts called sub sector.
Arrears Previous year’s tax balance
Two common attributes in both databases/tables are created. The attribute joins are not
permanent, so it can be created or removed whenever it is desirable.
If you want to create a permanently joined layer, you will need to export the joined layer to a
new feature class/shape file in ArcGIS. The study area is just a smaller segment/part consisting
of only one zone of the city. Every property unit has a unique property number/street address that
is assigned by tax department staff and is mentioned on every property of the study area. This
unique property number is used in the property tax management information system.

22
Every property in the study area is identified with the help of this unique number. A Property
Identification Number (PIN) is developed for future use when applying this system to the entire
city. At the zone level, the property number/street address is unique in the study area. It is
important that while proceeding to broader levels (city), a PIN is needed to avoid duplication.
2.6 Creation of Geo Database
The primary function of the database is to store and manage the data in an organized way.
Similarly, the geo-database is defined as the physical store of geographical information primarily
using the database management system (DBMS) or file system. Geo-database is a built-in data
structure for ArcGIS that provides a comprehensive information model for representing and
managing geographic information. The geo-database contains three primary dataset types:
1. Feature class
2. Raster database
3. Table
The personal geo-database has been used in this study because it is commonly used as original
format for Arc GIS and fulfills its requirements i.e. topology creation (not supported in shape
file), all raster and vector data in one file, flexibility, data sharing, file size limit, raster support
(not supported in shape file), support null values, ability to compress files and filed name length
limit up to 64 characters, etc. Personal geo-databases are available in Microsoft Access file
format.
2.7 Building Topology
Topology refers to the relationship between spatial features or objects. Topology defines the
standard rules point, line and polygons are connecting share their geometry. Topology checks
and validates the spatial relationship between neighboring and overlapping features. Topology is
stored in a geo-database and provides the editing environment to identify and fix errors.
Topology ensures better data quality and greater data integrity. Topology is essential for database
integrity helps to validate and maintain better feature representations in geo-database. The
following topology rules have been used as given below:
1. Must not overlap.
2. Must not have gaps.
3. Must not overlap with (the interior of polygons in another feature class or subtype).
Figure-8 Creation of Geo Database in Arc Catalog

23
Chapter-3: Property Tax System
In this chapter, the property tax system of Punjab province, Pakistan is described briefly. The
chapter also discusses the types of properties in the property tax system, assessment procedure
and different types of property tax notices. The property tax system is applicable in the urban
area limit only. Each city/district government determines and notifies the limit of urban areas for
the purpose of tax collection.
The property tax system is entirely based on the Punjab Urban Immovable Property Tax (UIPT)
Act 1958 (UIPT, 1958). In case of any change/amendment in the Act; the provincial legislative
assembly passes the bill and is finally approved by the provincial governor. This act provides a
basic guideline for the property tax system.
3.1 Types of Properties in Property Tax System
There are two types of properties in the property tax system:
1. Taxable
2. Exempted
3.1.1 Taxable
The identification and registering of the taxable property units is base for revenue generation.
The successful property tax system is based on proper identification and subsequently registering
of taxable property units (M. Bird and Slack, 2002). Property tax calculations are based on the
value of the taxable property. Commonly, the tax rate is fixed by law or based upon the capital
(or market value of the property), rental or annual value of the property being taxed. The
assessment of property tax calculations are based on the valuation table approved by the revenue
authorities given in Appendix-1. The assessment of the different types of properties is based on
the methodology defined in the table given in Appendix 2.

24
3.1.2 Exempted
Exempting a few properties in some areas in the taxable property tax net is a common thing
being practiced in many parts of the world and in almost every country. These exemptions are
mostly sanctioned by the national and sub national governments whereas sometimes these rights
are also given to the local level administrations. Sometimes these exemptions are provided at
both the national and the local level depending upon the nature of case and the exemption
provided. These exemptions are always based on the special cases and also on the ownership or
the use of the property i.e. some properties are belonged to the persons having more attention for
the government or the state due to some disability or due to the age factor and in some cases
nature of property or ownership also defines some special exemptions like the property belongs
to some charity which works for betterment of the society and is purely a nonprofit organization.
Some of the common practices which are used in almost each and every country, below is the
detail of commonly exempted properties i.e. educational buildings, churches, cemeteries,
government buildings, public hospitals, public roads, libraries, foreign embassies and property
owned by international organizations (Kayuza, 2006).
In Pakistan, the following properties units have been exempted from the tax by the government.
The detail of the exemptions is given in Appendix 3.
3.2 Procedure of Assessment of Property Tax
Property tax is always calculated based on the market price of the property and some other
techniques for valuation of property are also used in many developed countries. Most common
method for assessment of market value of the property is sales comparison approach whereas
sometimes for few cases depreciated replacement cost and income approaches are also used. In
Denmark, Switzerland, Sweden, and in many parts of the United States mostly use depreciated
replacement cost method whereas in United Kingdom, the estimation of residential and domestic
properties is based on the pre-defined classes and commercial properties operating any type of
businesses are valued on the basis of their open market information. (Kayuza, 2006).
Most of the underdeveloped countries use the unit approach or area based in the valuation of
property tax due to insufficient resources, lack of property information, technical expertise and
lack of restricted and limited market. These approaches are commonly used in South African
countries, Indonesia, Kenya, Tanzania, Philippine’s etc.
In Pakistan, the assessment of the property is based on the valuation table approved by the
authorities. The valuation table for the assessment of property tax is given in Appendix 1. The
annual value of the buildings and lands is determined on the basis of reasonable rent of
properties prevailing in a locality (Mohalla, Colony, Town, Road or Street, etc.), having similar
characteristics and the use of the property. This reasonable prevailing rent of properties
(Residential or Commercial) in a particular locality has been transformed into Per Sq. Yd. rent
for land area and per Sq. Ft. rent for the covered area in the formulation of valuation Tables. For

25
general residential & commercial properties, the figures recorded in the respective column of the
valuation table shall be multiplied with the total land area (Sq. Yard) and covered area (Sq. Feet)
of the building, the figure arrived at shall be multiplied by 12 to determine the reasonable Annual
Rent Value of a property. The procedure will involve the following steps:
a. Total land area of a property (Actual) X per Sq. Yard Rent prescribed in the valuation table
against the locality in which the property is located.
b. Total Covered Area of a property (Actual) X per Sq. Yard Rent prescribed in the Valuation
table against the locality in which the property is located.
c. (a) + (b) above X 12 = GARV (Gross Annual Rental Value)
d. GARV – 10% = ARV (Annual Rental Value)
Where payable Tax is 5 % of ARV,
Tax categories from A to G have been defined by the tax department as given in Appendix 1.
The relevant category is assigned to each locality/property based upon the value of the property,
geographic location, civic facilities, and business activities. A category has the highest tax rate
and F has the lowest. Assessment of Special properties is made as per government notifications
shown in Appendix-2.

26
-This page is intentionally left blank-

27
Chapter-4: Results and Analysis
4.0 Overview
The GIS based property tax system is an appropriate solution for all these problems. The
Geographic Information System (GIS) has been developed and built to equip institutions like the
tax department with the ability to deploy standardized and best practices of management to
improve overall administration. GIS is capable to integrate different sources of information with
geographic features to create a complete database for policy maker (Zhao, 2002). Here the
property tax information system is linked with a geographic information system (GIS) to obtain
spatial dimension and aid in the analysis of the assessment of the property taxation process till
parcel level.
The GIS has emerged as an important instrument in improving operational efficiency in planning
and management of urban infrastructure and services (Bhan, 2011). The GIS system helps to
streamline property tax collection mechanism and officials will be able to make informed
decisions.
Cartographic presentation provides a powerful means for visualizing the results for better
decision making. This supports the identification of local patterns of important demographic and
social indicators. Maps are thus an integral part of policy analysis in the public and private
sectors (Handbook on geographic information systems and digital mapping, 2000).
Maps will enable the tax officers to track down the tax defaulters by each displayed parcel.
Analysis and statistics reports are available in a few minutes with high precision. This system has
functionalities that enable the integration and analysis of a wide range of information based on
their spatial locations. Potential revenue area identification of assessed and un-authorized
properties is done through the new technology of GIS to bring them in assessment and maximize
coverage of properties into the tax net. The GIS is also capable of monitoring and correcting tax
parameters such as tax category, main/off road, land area, covered area, etc. The GIS also
provides the detail of tax defaulters with the exact location. The property tax as well as tax
recovery system becomes more streamlined and transparent.

28
4.1 Property Tax Mapping
Visualizing large amounts of information interactively is one of the most attractive and useful
capabilities of GIS. Visualizing location data can help identify new areas of opportunity and
potential problem areas (By and Huisman, 2009). In Figure 8, the parcel/property mapping of the
study area overlaid on the satellite imagery has been shown as a map. These parcels were
digitized on high resolution satellite imagery and then verified through field surveys by using
GPS. This map provides excellent visualization of the study area.
What is needed is a system that allows city managers to identify all taxable units and determine
the tax payable. This information needs to be linked to GIS and an accounting system that will
produce bills, monitor receipts and notify the need for action on arrears (Nieminen, 2002). The
digitized parcels were linked with the property tax database of the property tax department.
There are two types of properties in the property tax systems which have been shown in Figure 9.
One is taxable and the second is exempted. The map clearly indicates that where parcels which
are exempted from tax are and at what location mostly parcels are taxable.
The capability to trace out each parcel of taxable property is basic and important for the proper
functioning of any property tax system. Table-5 shows the comparison of the number of property
units, type and their tax demand before and after the implementation of the GIS system in the
study area.
Table 5 Property unit’s types and tax demand details before and after GIS implementation in the study area
Before After
Type Number of
property
units
Tax demand
Amount
Rupees (PKR)
Number of
property
units
Tax demand
Amount
Rupees (PKR)
Taxable 2,402 32,581,356 2,933 69,838,599
Exempted 635 19,442,032 425 11,253,628
Total 3,037 52,023,388 3,358 81,092,227
The digitized parcel is integrated with the property tax database of the excise and taxation
department to map rented and self-occupied properties as shown in Figure 10. The ability to
determine the rented and self-occupied status of each parcel of taxable property is a complicated
task for property tax collecting staff. People usually misreport the type of property due to the
different rates of tax as discussed below. Self-occupied and rented property units are defined as
below. The rented property units are very important in the property tax system and the main
source of revenue. The rented property units had five times more tax rates than self-occupied.
(Refer to Appendix-1 to see the valuation table for assessments of property tax).

29
Figure 8: Parcel mapping of zone-II with satellite imagery
Once GIS is integrated with the property tax database, it is able to show details of tax liability
such as amount paid and the amount due. This integration not only enables the corporations to
identify defaulters and check whether appropriate tax is assigned as per current land/building use
but also allows the taxpayers to monitor their tax records (Bhan, 2011).

30
Property picture:
High resolution image (above 5 Megapixel) of each property is captured during the field survey.
These images help in identification, verification and, tax assessment. From these property
images, the property tax assessment can be analyzed i.e. building type, land use, number of
stories, occupant type, land area, covered area, plaza, open plot, etc.
From these property images, it can be clearly analyzed that these are shops used for commercial
purposes so the commercial rate will be applied to these property units.
From these property images, it can be clearly analyzed that these are residential houses. The left
side has 2-storey and the right side has 3-storey, hence these will be assessed as the residential
properties and residential rate will be applied. I have captured these pictures during filed survey.
Picture of Residential Property with three
stories Picture of Residential of Property with two
stories
Picture of shop Picture of shop

31
From these property images, it can be analyzed that these are multistory plazas so commercial
rate for multistory building will be applied and it is pertinent to mention here that this plaza had
various commercial businesses so that multiple entities not charged as a single entity and revenue
collection will also be accelerated.
From these property images, it can be clearly analyzed, it is a school (right side); a commercial
property with two stories with multiple uses in the middle and it is an open plot (left side). So
that a separate rate could be applied on each property. Now a link has been established between
the property location on the GIS map and its corresponding property details with photographs
that are helpful in analysis, visualization, and property tax assessment.
The GIS can help improve efficiency and transparency of tax assessment and collection. First,
the GIS can be used to calculate and collect real estate taxes. Arial photographs within a GIS can
be used to calculate surfaces and values of parcels or buildings. In the attached data-base,
additional information on the owner and property can be held. Secondly, the GIS can be used to
map and monitor the tax payment status of any direct tax. This information (map) can easily be
made public through web-based GIS (Wehrmann and Glavina, 2009).
Picture of School Picture of commercial property-bank and
school with three stories
Picture of open plot
Picture of Plaza Picture of Plaza

32
Rented: The property unit rented out by the owner to a tenant for commercial as well as
residential purposes.
Self-Occupied: The property unit remained in self-use of the owner for both commercial and
residential purposes.
Both: The property unit with both self and rented status. Rented properties had more tax than
self. Due to this reason, many properties were mis-reported by property tax staff as self-status.
Resultantly, the government lost a large amount of tax revenue. Correction of properties
occupant type with the help of satellite imagery, property photographs and under the supervision
of relevant authorities enhanced the considerable amount of revenue by 3.03 %.
The next target was to map the number of stories through the integration of property tax database
and GIS databases for each property unit as shown in Figure 11. The map identifies multi-storey
(plaza) buildings, which is helpful for the assessment of tax. The multi-storey building has a
different rate of tax for each portion and depending upon the number of storey as described in
assessment of special properties in Appendix 2.
Figure 12 shows the land use of the property units in the study area. The different categories of
land uses were mapped with different symbols by using information available in the property tax
database of the excise and taxation department. This land use was validated through the
overlapping of parcels with high resolution satellite imagery as well as the surveyed sheets by
visual interpretation. For the assessment of property tax, the authorities define two types of
valuation table: One is for residential, and second is for commercial as described in Appendix 1.
Residential: Properties which are purely used for only living/residential purpose.
Commercial: Properties used for commercial purposes such as shop, banks, educational
institutions, offices, godowns, factories and industrial units etc.
Residential/Commercial: Properties usage is for both residential and commercial purposes. The
residential rate is applicable on residential portion while the commercial rate on the commercial
portion of the property.
Commercial properties units have more tax rates than residential as you can see in the valuation
given in Appendix 1. Property tax staff misreported many commercial properties as residential
properties due to their personal interest. Due to this reason, the government deprived of a large
amount of revenue.

33
GIS property mapping is capable of analyzing a property parcel shape to determine the area and
dimensions of each identified parcel (1000 GIS Applications & Uses - How GIS Is Changing the
World - GIS Geography, 2019). The land area of property units was calculated through parcel
mapping and verified with ground realities by surveyors. Figure 13, shows the land area of
property units in the study area. The property units falling in the eight classes have also shown
with different colors based on land area. Tax calculation of a property is entirely based on the
land and covered area of the property as described in Appendix 1. Land area is converted in to
square yards. Land area is an important factor in tax assessment. Land area is corrected and
monitored with the help of tools available in GIS. I measured exact land area of the property
through parcel mapping of remotely sensed data in GIS environment. The present study has
found 426 such tax liable properties for which earlier tax was exempted. Property tax calculation
depends on the land and covered area of property units which is another important factor in tax
assessment. The covered area is converted into square feet. The information was collected from
the existing property tax database and verified by the surveyor in the field. The present study has
rectified the covered area 205 properties in the study area. Property units falling in eight classes
are shown with different colors based on covered area as in Figure 14.
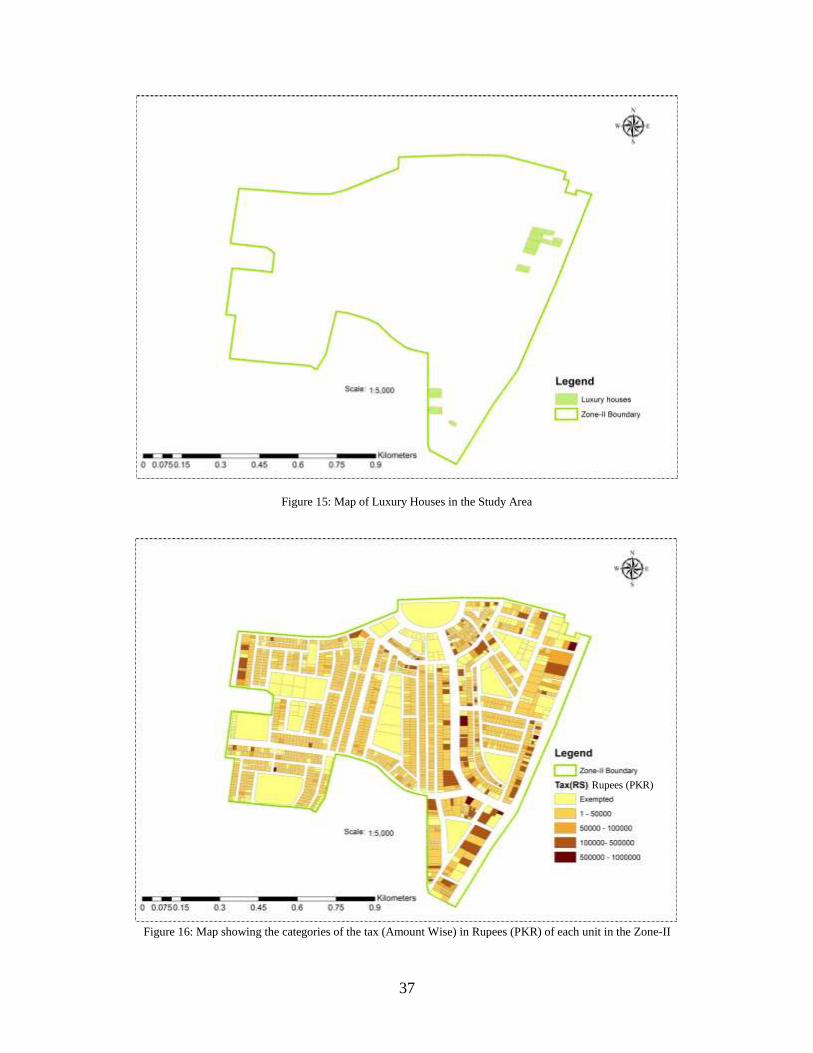
Tax calculation of a luxury house tax is entirely based on the land and covered area of the
residential property as described in appendix 1.luxury tax is applied on the residential houses
having an area of two kanals or above with a covered area of more than six thousand square feet
Luxury houses in the study area have been shown in Figure 15.
Figure 16 shows amount wise tax classes with different colors symbols. The tax amount for a
property unit was calculated from property tax database. The map helps to identify potential tax
payers which enhances and accelerates tax recovery process. The list of potential tax payers is
provided to the concerned staff at the beginning of the financial year. The list of potential tax
payers contains the property number, location and ownership information, current year tax, and
arrears etc.

34
Figure 9: Map showing the taxable and non-taxable units in the Zone-II
Figure 10: Map of zone-II showing the self-occupied and rented properties

35
Figure 11: Map showing the number of stories of each parcel in the zone-II
Figure 12: land use map of the Zone-II

36
Figure 13: Map of land Area Zone-II showing the land area of each property unit in square yards(local) and square meters (SI)
Figure 14: Map of Covered Area Zone-II showing the covered area of each property unit in square feet (local) and square meters
(SI)
37
Figure 15: Map of Luxury Houses in the Study Area
Figure 16: Map showing the categories of the tax (Amount Wise) in Rupees (PKR) of each unit in the Zone-II
Rupees (PKR)

38
Tax-Status Map of zone-II Figure 17: Map showing the tax status of individual property unit. The green color shows units
where tax of current year has been paid and defaulters have been shown on the map with red color.
The GIS has proven to be powerful tools in the collection of and tracking delinquent tax payers
thus assisting in raising the revenue collect (Birir and Ngigi, 2015).With the help of said list, the
tax collecting staff approach/visit the location of each property and consequently, tax dues are
recovered. Taxable properties were mapped by attaching attributes of the property tax database
with the digitized property units. The integration of both datasets is mostly easy, as I have
property number as a common field in both datasets. Based on property number, I join the
digitized parcels with property tax database and the relevant information such as owner name,
property location, covered area, total area, self or rented etc. is easily copied. The GIS
technology facilitates in exposing tax havens by putting it all on a map (1000 GIS Applications
& Uses - How GIS Is Changing the World - GIS Geography, 2019). Figure 17 shows the map of
taxable property units with green color for paid property units, while, red color for tax defaulters,
which identified 425 properties tax defaulters. Instead of wasting time and resources in
contacting each property unit owner, only defaulter can be focused for tax recovery. Tax
managers can easily direct the staff of the tax department for the recovery of revenue from tax
defaulters. The current study has traced out 284 such missing records from the existing property
tax system through integration of taxation records and spatial data base with the help of geo-
spatial technologies. As a result of identification of these properties amount of government
revenue enhanced by 8.45 percent. These properties were un-assessed/misreported.

39
4.2 Category Detail
Category-wise number of commercial and residential property as per occupation is shown in
Table 6. Tax categories are defined and assigned by local authorities from A to F.
Table 6: Count of residential and commercial properties as per occupation
Category Residential Properties Commercial Properties Total
A 2880 2467 5550
B 188 150 238
C 160 28 188
D 120 5 25
E 0 0 0
F 0 0 0
‘A’ category has the highest tax rate and ‘F’ has the lowest (as per valuation table explained in
Appendix-1). In our study area, the majority of properties fall in category-A while the smallest
number of properties pertaining to category –D. Categories E and F don’t exist in the study area
as shown in table 4. The current study found 254 property units were placed in wrong (lowest
tax) categories like B, C, or D which were corrected efficiently through using geo-spatial
technologies as discussed in 4.7 section(b).
4.3 Land Area Statistics
Land area is an important factor in tax assessment. Land area is total land or plot size of a
property measured in square yards. It is equal to 9 square feet or about 0.836 square meters (SI).
Table 7, properties in the study area has been categorized by land area. In our case, there are
eight categories of properties by land area. It is clear that mostly property units have up to five
Marla’s land area and between 5 to 10 Marlas. While only 10 properties have three to four kanals
areas and 20 properties have above four kanals areas
Table 7: Land Area statistics
Land Area (Local unit)
Land Area (Square
meters) SI Unit
No. of Property Units
Up to 5 m (Marlas) Up to 126.465 1850
5 to 10 m 126.465 to 252.929 1200
10 to 15 m 252.929 to 379.394 101
15 to 20 m 379.394 to 505.858 85
20 M to 2 k(Kanal) 505.858 to 1011.71 77
2 to 3 k 1011.71 to 1517.57 15
3 to 4 k 1517.57 to 2023.43 10
Above 4 k Above 2023.43 20

40
4.4 Building Type Statistics
Table 8 shows that in study area there are two hundred fifty offices, around fifteen hundred
shops and more than three thousand houses. There are total twelve different most common
building types in our study area. Building type is very important factor in tax assessment because
tax rate depends on it as already has been described in chapter-3 during the discussion on
assessment of special properties in Appendix 2. Under the supervision of tax authorities, 86
properties building types has been corrected with the help of property photographs, satellite
imagery, and field survey result as discussed in section 4.7(d).
Table 8: Building Type Statistics of study Area

41
4.5 Identification of Hidden Taxable Property Units
Identification of un-assessed and un-authorized properties will be done through new technology
of GIS to bring them into assessment and to maximize coverage of properties into tax net.
(Urban Immovable Property Tax | Excise, Taxation and Narcotics Control Department Khyber
Pakhtunkhwa, 2020).
Missing property units are those which do not exist in the Excise and Taxation record due to staff
corruption or lack of knowledge. I found an interesting matter that upon joining the digitized and
survey verified parcels with attributes of property tax database mostly parcels were joined
correctly but a few of them was missed. Upon investigation, I came to know that there was a
couple of properties which existed on ground but missing from Excise and Taxation record.
The GIS integrated property tax system facilitates to trace out properties that have not been
registered and not appearing in the tax records. The officials will be able to identify the
unaccounted/unregistered properties and so serves as a check on updating of transacted
properties due to subdivisions of land parcels and erection of buildings. The updating of property
is made easy in the system (Birir and Ngigi, 2015).
The records have been highlighted in maps as shown in Figure 18, so that tax officers may guide
their staff properly for tax collection. GIS technology is a smarter way to detect the missing
properties as it facilitates capturing, storing, analyzing, visualizing, and managing geographical
data related to a property. The GIS provides an accurate measurement of the spatial extent of a
property. It can show different kinds of data on a map. Moreover, it provides a real picture of
reality and validate each record on the property tax system on ground. When applying the join
between the existing property tax data base and parcel mapping, the missing properties are
automatically highlighted in the study area. The process of comparing the land record with
satellite image is a hectic task and requires a considerable time period, resources, knowledge
and, data from multiple sources.
4.6 Identification of Tax Defaulters
The GIS technology could enhance the revenue collection mechanism for Government
authorities, whether it is property tax, utility bills (water/electricity/telecom), or municipality tax.
A GIS-based database will bring the defaulters under the tax net and help increase revenues of
the corporation (GIS simplifying property tax collection in India - Geospatial World 2012).
Hence, it provides an efficient, easier and improved mechanism to monitor taxation processes
and identifies defaulters. Visualization and spatial analysis identified tax defaulters and the staff
was briefed about their spatial information which enhanced taxation recovery in the study area.
The property units having nil (zero) balance were considered as clear units, however, those
having pending tax amount (greater than zero) were considered as tax defaulter. This information
was also attached with GIS system from property tax database attributes through join the
datasets.

42
The GIS integrated property tax system facilitated easy identification of the spatial location of
tax defaulters and non-tax defaulters. The tax collectors can use the spatial location to physically
locate the tax defaulter. It will also enable them to easily know how much the tax defaulter owe
the sub county (Birir and Ngigi, 2015).
This map will be helpful for tax officers to track down tax defaulters as each parcel has been
displayed. Through visualization and analysis of thematic map tax collector can detect spread
pattern of tax defaulters and make efficient route planning for recovery of tax dues from the
defaulters. Based on the route planning, the staff can locate tax defaulters with high accuracy
instead of wondering in the field. Hence stipulated time period and resource can be utilized and
tax dues from defaulters can be recovered. The pattern of the tax defaulter shows that in most of
cases the defaulters exist along the road and properties are commercial type. The most of these
property defaulters are found due to court case, ownership transfer cases, issues between the
owner and tenant and owner out of city/country.
Table 9: Tax Defaulters and Tax Paid Detail
Tax Status Property units Amount (Rupees) (PKR)
Tax Paid 2033 67308287
Defaulter 1325 11763425
Total 3358 79071712
4.7 Monitoring and Evaluation of Property Tax System
4.7(a) Land Area
Land area is an important factor in tax assessment. However, without parcel mapping, its
measurement is not feasible. Property unit in the commercial area (of whatever size) is taxable
while in a residential area it may be tax exempted if less than 150 square yards. Usually, taxation
staff reported some property units too large while others too small due to corruption. Moreover,
owners revealed the lesser size of his/her property to avoid tax; however, I measured the land
area of the property through parcel mapping of remotely sensed data in a GIS environment. Few
of the measured properties were verified through ground reality by surveyor for accuracy
assessment. The present study has found a number of tax liable properties for which earlier tax
was exempted.

43
The spatial support of the GIS for the area based tax calculation will help the management to
assess the tax more accurately than the manual (Wyatt, 1996). Figure 19 shows property units in
the form of a map, which clearly shows that most commercial properties or property units on the
main road were reported smaller. From the map, it can be concluded that I have to focus on
commercial property units as their tax rate is higher and their areas were reported wrongly. This
correction greatly enhanced the revenue by 7.4 % per year.
Figure 18: Map showing Hidden and Missing Properties in the Study Area
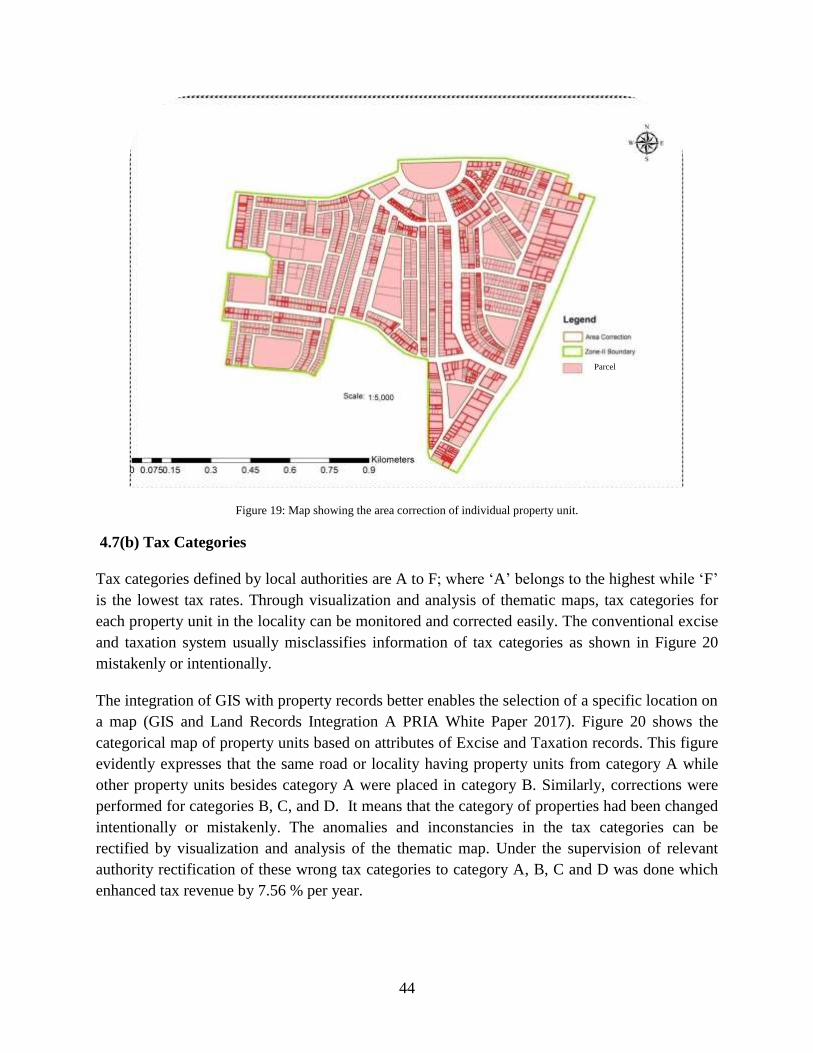
44
Figure 19: Map showing the area correction of individual property unit.
4.7(b) Tax Categories
Tax categories defined by local authorities are A to F; where ‘A’ belongs to the highest while ‘F’
is the lowest tax rates. Through visualization and analysis of thematic maps, tax categories for
each property unit in the locality can be monitored and corrected easily. The conventional excise
and taxation system usually misclassifies information of tax categories as shown in Figure 20
mistakenly or intentionally.
The integration of GIS with property records better enables the selection of a specific location on
a map (GIS and Land Records Integration A PRIA White Paper 2017). Figure 20 shows the
categorical map of property units based on attributes of Excise and Taxation records. This figure
evidently expresses that the same road or locality having property units from category A while
other property units besides category A were placed in category B. Similarly, corrections were
performed for categories B, C, and D. It means that the category of properties had been changed
intentionally or mistakenly. The anomalies and inconstancies in the tax categories can be
rectified by visualization and analysis of the thematic map. Under the supervision of relevant
authority rectification of these wrong tax categories to category A, B, C and D was done which
enhanced tax revenue by 7.56 % per year.
Parcel

45
Figure 20: Map showing misclassified information of tax categories before correction.

46
Figure 21: Tax categories map of property units of zone-II after corrections

47
Figure 22: Map showing the location information misclassified main and off-road properties
Figure 23: Map showing the corrected location information of property units after rectification (Main /Off Road).
48
The current study found many property units were placed in wrong (lowest tax) categories like
B, C, or D which were corrected efficiently through using geo-spatial technologies. The map of
property units along with correction their categories are shown in Figure 21.
4.7(c) Main Road /Off Road
Main Road is wider than 30 feet while Off Road is narrower and properties on the main road had
a 15% higher tax rate as compared to off road’s properties. The conventional excise and taxation
system usually misclassifies main and off-road properties as shown in Figure 22 mistakenly or
intentionally. The GIS and remote sensing can precisely and easily measure the road width to
access main and off-road tax variable factors for property units.
The existing excise and taxation record contained narrow road width due to the corruption of
staff as well as the lack of updating. Moreover, property owners do not reveal whether their
properties are on the main or off road correctly. During the present study, the road width was
measured in ArcGIS software by using high resolution satellite imagery. Figure 23 shows the
main and off-road categories after correction from the current study. Apparently, there is no
chance for someone to hide the category of property units or main and off-road categories.
4.7(d) Building Types
The GIS technology is helpful in catching tax evaders by recognizing the potential area of tax
revenue such as banks, offices, halls, shops, petrol pump, hotels, hotels or industrial units (1000
GIS Applications & Uses - How GIS Is Changing the World - GIS Geography, 2019). Tax
criteria and rates depend on building type which may be residential, commercial, godown,
workshop, educational, hospital, cinema, halls, petrol pumps, or industrial units. For example,
hotels have different tax rate which depending upon the type as well as the number of rooms.
However, land-use and building type determination are nearly impossible through remote
sensing imagery. Hence, during the current study, I followed field survey through GPS for
mapping of building type or building use. This will further assist in the tax collection and
monitoring system. The tax department staff misreported the building type of many buildings as
result the government lost tax revenue. For example, some banks, shops, offices, a hotel which
are commercial units and have high tax rates were reported as a residential house (lower tax
rate). Due to the wrong building type, the residential rate (lower tax rate) will be applied to these
properties and government revenue suffers. Under the supervision of tax authorities, building
types have been corrected with the help of property photographs, satellite imagery, and field
survey results. The current study found many property units were placed in the wrong building
type like residential which were corrected efficiently. As a result, a considerable amount of
government revenue enhanced 2.56 % per year.

49
Figure 24 shows the map of individual property units where the building type was incorrect. The
rectified map of building types has shown in figure 25. This map helps us to identify where shop,
bank, institute, or residential building located in the study area.
4.7(e) Building Stories
Tax rates depend on a number of stories in a building which may either be single, double, triple
or multi-story building. According to the Excise and Taxation Department, Standard Operating
Procedures (SOPs) a building is known as a plaza if it has more than four storey. Furthermore,
plaza and ordinary buildings had different tax rates. Because of this reason and their personal
interest tax department staff reported some of the multi-story building as an ordinary building
type.
During the present study, I distinguished and mapped plaza from ordinary buildings as shown in
Figure 11. This figure shows that plazas had more than three stories which are situated in
Commercial areas. This further indicates that plazas are most important for revenue collection in
taxation system. This information is based on the collected data by the tax department.
Figure 24: Map showing misclassified information of Building type

50
Figure 25: Map showing the rectified building type of individual property unit after corrections.
Figure 26: Map showing the arrears detail of property unit (Total balance/ outstanding dues since 2014–Overall)
Rupees (PKR)
The Arrears amount is total outstanding dues since 2014 because every year the arrears of each property are brought forward
in the total balance or total accumulated amount unpaid (due) as on 1st day of new financial year.

51
Plazas/multistoried buildings can be identified using RS and GIS technology. The property
photographs are attached with each property unit and which helps to detect the number of stories.
Under the supervision of tax authorities, many properties stories have been corrected with the
help of property photographs, satellite imagery and field survey results. As a result, a
considerable amount of government revenue enhanced by 1.48 % per year. Plazas/multistoried
buildings are the hub of business activity in the area and contain a large number of commercial
units like shops, offices, banks, shopping malls, and showrooms etc.
Furthermore, commercial units are the important source of revenue collection in the excise and
taxation system. Because commercial properties have five times more tax rates than residential
or others. Therefore, the property tax recovery from plazas/ multistoried buildings can boost up
the tax revenue. Tax departments incorporate all the changes and perform standard tax
calculations on all properties. Then the result is derived from the impact assessment
(increase/decrease in tax demand) of the respective properties.
4.7(f) Previous Year Tax Arrears
Tax arrears are the pending tax money from the previous year. It is really important to determine
for which property units tax arrears are pending so that tax collection may be preceded. Property
units having property tax arrears in previous financial years were identified on a map through
attributes data as shown in Figure 26. This map truly guided the relevant excise inspector (tax
collector) that which property unit or owner should be approached first for tax collection.

52
-This page is intentionally left blank-

53
Chapter-5: Discussion
5.0 Brief Note
The GIS could help monitor the property tax revenue by preparing a common platform that
visually links all property-related data such as the number of floors in each building, the total
covered and a land area of each building, individual plot areas, details of locality, and road
facing details with the applied tax calculation principles (Pareta, 2017).
The current study addresses the vital research questions of how to map property units along with
attributes in the study area? How to monitor, enhance, rectify and evaluate the property tax
system? To investigate these research questions and improve the management of the property tax
system, spatial analysis, visualization, measurement, integrating properties in the field with
property tax office record, analysis and rectification of property tax assessment factors with the
applied tax calculation principles have been performed. The following discussion addresses the
key findings of the study for each of these research questions, followed by the discussion of
study limitations and recommendations for future research.
5.1 Financial Impact
The GIS based property tax system was implemented in 2014 which had streamlined the process
of property tax collection. The tax revenue was considerably enhanced through the correction of
property tax assessment variables and data. Precisely spatial identification of current tax
defaulters and arrears of previous years accelerated tax revenues. Furthermore, the use of geo-
spatial technologies such as remote sensing, GIS, and GPS brought transparency which further
eradicated corruption in the property tax system.
The GIS enabled up to property parcel level for better tax administration, because of which
additional properties are brought under Tax net for creating thematic maps such as land area,
covered area payment status, land use, building types, property occupations type and number of
stories etc. For the tax officer, it is most convenient when these maps can be accessed within the
tax administration system (Practitioner’s Guide: Digital Tax Parcel Mapping. 2009). The tax
recovery in the study area increased by the implementation of following steps (1) implementing
the GIS and RS to monitor and evaluate property tax system, (2) property mapping, (3) data
integration, (4) different corrections (missing properties, property size, location, tax categories,
building type, number of stories etc.), (5) locating the tax defaulters (current and arrears) where
they are geographically located, (6) visualization, analysis.
Anomalies in the property tax system were identified and rectified with the help of GIS and RS.
As a result, the government tax revenue increases almost twice.

54
The efficiency of the tax collection system is increased due to the implementation of GIS and RS
in the study area. The collective effect of these measures will resultantly accelerate the tax
revenue. Other factors are on an increase in tax rate by the government every year. The tax
recovery of Zone-II from finical year 13-14 to 15-16 has been shown in figure 27. The recovery
progress of zone-V has been shown in Figure 27 for comparison where GIS and RS technologies
were not implemented. Zone-V has almost similar features and challenges as in zone-II as shown
in Table 10 below. Therefore, I selected the zone-V for the comparison with study area. The
calculation is based upon the difference between manual tax record and the current tax record of
the properties in the study area after implementation of GIS and RS. The entire business rule
related to tax calculation is collected from the tax department. Tax department staff incorporates
all the changes and perform standard tax calculation on all properties. Then the result is derived
from the tax impact (increase/decrease in tax demand) of the respective properties.
Figure 27: Showing the Year wise Recovery of Zone-II in Rupees (PKR).
*Study Area: Represent the study area where GIS and RS techniques were implemented.
*Zone-V: is an area/zone where GIS and RS technologies were not implemented.
4922867952427389
81708781
4887536652023362
59596623
0
10000000
20000000
30000000
40000000
50000000
60000000
70000000
80000000
90000000
2013-2014 2014-2015 2015-2016
Tax
Re
cove
ry(P
KR
)
Study Area
Zone-V
Financial Year
After incorporating all the changes and then performs standard tax calculation formulas on all properties. The financial impact statement is
collected form the tax department staff which is based upon the tax impact (increase/decrease in tax demand) of each property. Note: The GIS
based property tax system was implemented in 2014.
roperty tax system was implemented in 2014 which had streamlined the process of property tax collection.

55
Increased tax revenue by updated property and tax related attributes, adding new construction
records, and integrated departmental data into a single property tax information and management
system (1000 GIS Applications & Uses - How GIS Is Changing the World - GIS Geography,
2019).
Table 10: Comparison of Zone-II & Zone-V
Name of
circle
Total propertie
s
Taxable Propertie
s
Exempted Properties
Tax Demand (Rupees) PKR
Nature Properties Type Area
Zone-II
3358 2933 425 53427389 Urban Area
Residential/Commercial/Plaza
1.65sq km
Zone-IV
3250 2780 470 52023362
Urban Area
Residential/Commercial/plaza
1.76Sq km
It shows clearly the difference in tax recovery of both the zones from finical year 13-14 to 15-16.
The amount collected for tax recovery of zone-II is much higher than Zone-V where GIS and RS
have not been implemented. The summary of correction type with finical impact is shown in
Table 11 below:
Summary of Financial Impact
Table 11: Summary of Correction and its Financial Impact
Sr.No Correction
Type
Total
Properties
Number
of
Property
Units
Correction
(%)
Total Financial
Impact (Rupees)
PKR
1
Hidden/ Un-
assessed
Properties
3358
284 8.45 5505550
2 Building Type 86 2.56 3,112,000
3 Land Area 426 12.68 35,20,000
4 Location
(Main/Off) 250 7.44 3,050,500
5 Multi
stories/Plazas 50 1.48 2550500
6 Residential
/Commercial 163 4.85 3,053,500
7 Tax Categories 254 7.56 2556000
8 Self/Rented 102 3.03 3,223,500
Total 3358 1615 48.05 23051550

56
The overall economic benefits of this development are high as tax revenues increased and
improved access to information led to increases efficiency and better decision-making in the
public and private sectors.
Major differences between the current and previous system, which contribute to increase the
efficiency and productivity, are stated below.
Property tax mapping: One of the most important need of tax officials is addressed in this
study, is mapping of the taxable and exempted properties within their area of jurisdiction. It
helps them to identify the potential revenue sources, taxable and exempted properties. Property
tax mapping establishes the link between the real properties and locates them in the field with
property tax detail in the office with attached digital photographs.
Property Tax assessment and Monitoring: The current study also improves the assessor’s
judgment and consistent efficiency of the taxation process through geo-spatial technologies. This
study enables tax officials to monitor property tax revenue by preparing a common platform that
visually links all property-related data such as the number of floors in each building, total
constructed area of each building, individual plot areas, details of locality, and road facing details
with the applied tax calculation principles. Tax assessment variables such as land area, tax
categories, main-off road, building types of the properties are monitored and updated with the
help of GIS and remote sensing techniques resultantly system efficiency, productivity, and
transparency are improved. Hence, it is very difficult for anybody to steal government revenue
by the use of unfair means. This improves the property tax assessment, monitoring and
eliminates the corruption in the property tax system, resultantly, an inspection of the properties
can be easily done with limited staff.
Identification of Defaulters: Through visualization and analysis of the thematic map, the tax
collector can detect the spread pattern of tax defaulters and make efficient route planning for the
recovery of tax dues from the defaulters. It is, therefore, tax recovery process was accelerated
through real time, accurate, and updated data.
Visualization and Reporting: Comprehensive geo statistical reporting along with visualization
and thematic maps enable the government to identify the potential of revenue collection. Based
on the route planning, the staff can locate tax defaulters with high accuracy instead of wondering
in the field. Visualization enables the tax officials to identify the unregistered properties in the
study area and so serves as a check on updating of transacted properties due to subdivisions of
land parcels and erection of buildings. The excise department now manages and evaluates the
limited staff efficiently in a productive way and evaluates their performance with the help of
visualization.

57
Transparency: All the property tax data is available publicly on the map integrated with
property details and attached digital photographs of the properties. The transparency of the
property tax system and the public trust is improved on the property tax system. As a result, the
public is more enthusiastic to pay property tax.
All the forms, files, registers, and records being used in the assessment & collection of UIP Tax
are manual and based upon paper work. On one hand the data present in these forms/files and
registers is unreliable, on the other hand the Government has to incur huge costs in maintaining
and managing separate registers, files & forms. A very conservative estimation is that it costs
almost 600 million rupees if such a manual record is managed in the whole Punjab province.
This includes the procurement, managing cost coupled with the implementation and maintenance
cost for the manual paper-based system.

58
5.2 Web Mapping
Web mapping is a technique to publish GIS data on the web and make it accessible globally via
the internet. In this research, map is published on web while using open source technologies like
QGIS and Geo server etc. Geo server is an open source server for sharing geospatial data. The
server is designed for interoperability; it publishes data from any major spatial data source using
open standards (GeoServer, 2017).
Creating a web map is a very different process than creating one in a GIS. The GIS users are not
typically web programmers and it presents a challenge when one needs to create a web map that
is of the same quality as a map creating in a GIS. Fortunately, there are tools available to easily
translate your work in QGIS to web maps (Web Mapping with QGIS2Web — QGIS Tutorials
and Tips. 2019). Figure 28 shows the property tax mapping of the study area on the web.
Everyone can easily access, view, and search the property tax data using this web based
technology. This has also brought transparency in the property system.
Figure 28: Web mapping of Study Area
In many developed countries like Canada, Netherlands, Sweden, United Kingdom etc. the
property tax system is implemented on the same methodology. Many of the underdeveloped
countries are still using conventional and manual systems of property tax management and
assessment. However, some underdeveloped countries like India, Pakistan, Kenya, Liberia etc.
have adopted this system as a prototype in some major cities and have gained unprecedented
success in terms of increment in revenue and computerization of conventional and manual
techniques. Resultantly, they are taking a keen interest to expand this system to their whole
countries to increase monitoring standards and government revenue and tax collection.

59
5.3 Difficulties, Problem, and Issues
The existing record found in the register was in very bad condition. In order to get the manual
record, one has to be in touch with the staff of the tax department. However, there is a lengthy
procedure to get this record as it involves application, approvals, and verification at different
levels. After getting all the approvals and verifications, access to tax department data was
allowed. The next step was to understand the manual record. The data is on a paper register
which is not standardized. In this study, the whole property tax system and standardization of the
data were understood by the researcher. This was also achieved with the help of tax department
staff.
The next step was to create a property tax database system on Microsoft excel. After getting the
old record written on the paper register, it was very difficult to understand and transfer the
information on excel as these were not in good shape. Anyhow, after understanding and with the
help of tax department staff, data entry of the property units was made from the paper registers
and a database of the property tax record of the study area was created. This step is meant to
acquire the satellite imagery of the study. For this purpose, several government and semi-
government organizations were contacted. After a long struggle, conversations, applications, and
verification, it was made possible to get the satellite imagery of the study area from the
Government of Punjab for the study purposes.
After getting the satellite imagery, the boundary of the study area was marked with the help of
the tax department. In this boundary demarcation, several difficulties were faced in boundaries
demarcation which again needed a lot of verifications on the grounds. In the field, the property
number is in different formats and some properties overlap with other neighbor circles. In many
streets, property number does not follow any sequencing and in some properties property number
not mentioned. These issues have been resolved in the field with the technical support of the
property tax staff. For defining the boundary of the study area, the relevant properties of the area
were included. This phase will involve the active participation of tax officials for providing the
spatial extent of a region, zone or circle. Therefore, localities and many other properties in the
study area were verified. On the ground, property verification number, property bills, and other
necessary information were verified.
Tax mapping is a classical method of field operations for identifying real property units (Pareta,
2017). After the demarcation of zone-II boundaries, digitization will be performed on satellite
imagery to acquire unique urban features on the ground. In terms of GIS, every unique entity on
ground is known as a parcel, which has an area, a spatial reference and a unique id, whereas in
terms of tax, it is regarded as a property unit. Thus, every parcel of the study area was digitized.
So, when the parcel mapping of the study area was made ready, a sheet for the field verification
was prepared. For indexing, the study area, A3 sheets for the field verification were prepared.
Thus, for the field verification, property to property verification on the ground was required.
Square yard: is
a unit of area
equal to the size
of a square that
is one yard on a
side. It is equal
to 9 square feet
or about 0.836
square meters
(SI).

60
After the digitization phase, a door to door survey was be carried out for each zone. The maps
was prepared and provided to the surveyors for mapping the location of the property units with
the help of tax department staff. At this stage, only attributes was involved the land use
(Commercial, residential or both), property number and ownership status etc.
The main problem emerged in the field when it was understood that the property number
mentioned on properties is entirely different from the property number in the tax department
record. The tax department has its own numbering system and the property number is not
mentioned on most of the properties. So, the researcher could not get the property number from
the field.
Door to door survey will be conducted to take the photographs of property units and integrate
them with the GIS. Therefore, the tax department was requested to provide the relevant staff for
the property identification. The tax department staff work daily in the field and had the idea of
numbering and sequencing as they are working in the study area for quite some time. After
several requests, the researcher was made able to get the support of tax department staff and
started work again in the field for marking the property number on the survey sheets. The tax
department has shortage of staff and spared very little time for us. It is due to this reason; the
field work took long time. After completion of field work, the survey sheets were geo-referenced
with the satellite imagery. After geo-referencing of all the survey sheets, the property unit
number of every parcel on the attribute table was updated.
The unique parcel identification number links the mapped parcel polygon with the tax data base
(Practitioner’s Guide: Digital Tax Parcel Mapping, 2009). The upcoming step was to link the
GIS and property tax database. During this final stage, all the spatial data containing land use
information was linked with the excise & taxation department. Every property unit would be
possible to be seen as a packet of property tax records along with a pictorial view. During this
step, it was found that the property number on the property tax database and GIS was not in a
standard way. Therefore, the researcher has to study the property tax numbering mechanism of
the tax department and standardized the property numbers on the property tax data base and GIS.
The standardization of data was very important for linking GIS and property tax data. By
defining the same format and pattern for attributes in the GIS and the property tax database the
standardization of data was achieved. After the standardization, property tax data base and GIS
and data were linked together. Geospatial technologies integrated with databases offers an
effective tool for easy assessment and management of corporation property taxes (Wyatt, 1996).

61
5.4 Summary of Discussion
Geographical Information Systems have proven power tools in the collection of taxes and
tracking delinquent tax payers in assisting and raising the revenue collection. The tax
information system has provided an interactive link between real property and office
records and can facilitate tracking of the property owners through the use of handheld
GPS. Visualization, statistical analyses and thematic maps are useful to identify the
potential of revenue collection, planning, and policy making decision purposes. Through
visualization and, analysis of the thematic map, tax collector can detect the spread pattern
of tax defaulters and make efficient route planning for the recovery of tax dues from the
defaulters. Tax assessment variables such as land area, tax categories, main-off road,
building types of the properties are monitored and updated with the help of GIS and
remote sensing techniques. Based on the route planning, the staff can locate tax defaulters
with high accuracy instead of wondering in the field.
The present study aims to improve the assessor’s judgment and consistent efficiency of
taxation process through geo-spatial technologies. Geospatial technologies integrated with
databases that offers an effective tool for easy assessment and management of property tax
and helps to monitor property tax revenue by preparing a common platform that visually
links all property-related data such as the number of floors in each building, total
constructed area of each building, individual plot area, details of locality and road facing
details with the applied tax calculation principles. While in previous studies Property Tax-
Excise & Taxation. (2016) and Property Tax-Excise & Taxation. (2016), it is just an
information system that only provides information about the properties and tax.
One of the most important needs for the tax officials was the mapping of the taxable and
exempted properties within their area of jurisdiction. This helps the property tax officials
to quantify taxable and exempted proceedings of the properties and locate them. The
system will enable categorization of properties depending on the proximity according to
the number of staff; hence inspection of tax properties becomes manageable. The research
found out that there are 3358 properties, out of 1615 properties were corrected through
GIS based taxation system. It is pertinent to mention here that 284 new properties were
also recorded which were missing in the manual record register.
As far as this research is concerned, some procedures and automation can be done more to
enhance the working capacity of the model. The manual excel database will be replaced
with an automated software database. Limitations and concerns related to the study are
just due to financial and administrative concerns. When the same idea will be taken up to
Government level (city/province/country level) so financial and administrative constrains
will be eliminated and this system with more functionalities.
62
The Survey in all methodology is performed on hard paper (survey sheets) and then
updated on the system. This is because limited resources are available for this project.
Government should develop an android application for property tax filed survey and use
the tablet on which real time updating, splitting merging, shaping of parcels as well as
their attributes are updated which will reduce the chance of errors to much extent. This is
one of the automated systems which will minimize the chance of geometric errors in terms
of data quality as compared to the paper-based method. Regular change detection will be
followed by Government resultantly it will reduce any chance of bribery or corruption by
staff which will accelerate revenue generation to its new peak.
Real time change detection is a very important on-going process in the property tax
responsible for monitoring and evaluation of the entire system. This study does not
include any methodology for regular change detection in the property and tax attributes.
This will surely help to make the system transparent, and safeguard government revenue.
Change detection is also helps in the accountability of corrupt staff and accumulative
effect on revenue generation.
In this study, I have created the Microsoft excel data base of the property tax system from
the paper register and tax, which is calculated while using a manual procedure. For an
efficient system, there is a need to develop a standard-database and automatic tax
calculation system for property tax. There is a need to develop proper standard database
management systems like Oracle, MySQL, SQL Server, DB2, Postgre SQL, etc. for the
property tax. These standard database management systems will address the future needs,
and provide high performance, accuracy, security, and reliability. This data base should
directly link to the parcel database and provide real time accurate data.
Increased collaboration between government organizations and departments will ensure
consistency in information sharing. Provide an opportunity to improve the effectiveness
and efficiency of the services to the public, reducing the cost of delivery.
In manual paper based system very little information is available to higher management
and decision making authorities in a timely accurate manner. This results in less effective
planning & development. Centralized decision making will result in more accurate and
correct decisions which will allow better allocation of the scarce resources at our disposal.
For property tax field survey android application should be developed to replace the
manual paper-based survey. This development saves time, resources, and provides real
time and updated data from the field.

63
5.5 Recommendations
The study aims at integrating spatial technologies into the taxation process to help
improve the assessor’s judgment and work-efficiency in assisting with uniformity and
consistency in full operations of property tax collection. The tax payers should provide
access to the property record and method of calculating tax. The tax authorities need to
address the problems related to tax collection administration and enforcement for proper
revenue collection.
Government should also develop an online web-portal for tax payers through which they
can view details of property (land area, cover area, category etc.) and tax amount on the
map with the help of satellite imagery. The tax calculation methodology, property search
option, property tax relative information and notification should be available on the
online web portal. Furthermore, the government should also provide online property tax
calculator so that the tax payers can calculate the tax of their properties themselves.
Resultantly, this would also help ensure transparency in the data, confidence in the public
minds and enhancement in the government tax revenue generation. Hence, the
government needs to implement the GIS and RS technology in the entire country.
It is highly recommended that local authorities should automate their services through
GIS for the realization of their goals. The development of a geo-database will save them
from many risks of losing important documents either through malice or mistake. The
government of Punjab is in the process of introducing e-government and modern
technology in almost every department. This application should be available through
Web GIS so that more and more people can access and get benefit from it. Many GIS
open source servers such as Geo server, map server, map guide etc. are available for
publishing the GIS Data. Furthermore, it is suggested that the government should take
steps to enhance the technical skills and knowledge of the employees through
technical/professional trainings from time to time. The tax department should address the
problems associated with tax collection administration and enforcement.
The property mapping should be applied to all cities and towns of the country so that all
properties liable to tax are identified correctly. Subsequently, there should be a
monitoring and evaluation system to examine the existing property tax record with the
help of RS and GIS. The property tax data should be shared and linked with both the
public and private departments like police, municipal administration, solid waste
management, real estate management, urban planning to improve their services for the
public.
For the sake of greater transparency and security, it is important to develop a standard
data base management system for property tax system capable to perform computerized
standard tax calculations.

64
-This page is intentionally left blank-

65
Chapter-6: Conclusion
The main objective of the understudy research was to develop a Tax Information System
for the Rawalpindi city government in the Punjab province of Pakistan through integrated
emerging technologies like remote sensing and GIS. The system can provide spatial
dimensions which will enhance assessment, analysis, and revenue of property taxation
up-to parcel level. The GIS and RS are being used as a tool to identify and locate the
exact location of the properties with relevant tax attributes is obtained.
Verification (house to house survey, digitization, and geo-mapping of previously manual
property tax records.
The development of a database integrated with GIS, will automatically eliminate the
discretion of staff whereby the units were left un-assessed or otherwise kept under-
assessed. In this study 284 new properties are added to the tax net.
Tax revenue increased from PKR 23051550 in the last three years.
425 properties tax defaulters are identified in this study.
The current study found 86 property units were placed in the wrong building type like
residential which were corrected efficiently.
The current study found 254 property units were placed in wrong (lowest tax) categories
like B, C, or D which were corrected efficiently through using geo-spatial technologies.
50 properties stories have been corrected with the help of property photographs, satellite
imagery, and field survey results.
Increase in fiscal space through expanding the tax base and increasing tax collections.
Government has to incur huge costs in maintaining and managing separate registers, files
& forms. Savings through reduced use of inaccurate paper based reports, files, register
within and outside the government.
The GIS technology is ideal to analyze, visualize, and map market values of land
properties since values are spatial dependent. A combination of numerical, textual, and
visual i.e. digital photos of properties including building can be embedded into the
system and retrieved based on numerous spatial or statistical selection criteria and
provide excellently.
The GIS integrated property tax system facilitated easy identification of the spatial
location of tax defaulters. The potential area for property tax and defaulters were
identified and mapped precisely. It is, therefore, tax recovery process was accelerated
through real time, accurate, and updated data. Moreover, the un-assessed, and un-
authorized properties were identified while using geo-spatial technologies to increase
property coverage and assessment in rationalized tax-net.
The GIS has been proved as a powerful tool in tax collection and delinquent tax payers
tracking for raising government tax revenue collection. The purpose of the study is
achieved successfully while showing an increase in tax revenue and elimination of
corruption.
66
The study also aimed at improving the assessor’s judgment and efficiency of the taxation
process through housing desktop geo-spatial technologies. However, it will be more
appreciated if the system is presented through Web-GIS, so that the private departments
and public can access their property information and method of tax calculation for
ensuring data transparency and comfortable rectification.
Tax assessment variables such as land area, tax categories, main-off road, building types
of the properties are monitored and updated with the help of GIS and remote sensing
techniques. Anomalies in the tax assessment of 1615 (which is 48.05% of total
properties) were identified and corrected. As a result, the property tax system is more
transparent, speedy, and updated. This ensures transparency in the property tax system
and considerable enhancement in the government revenue
With the help of geospatial technology, the decision makers would be able to efficiently
plan and execute the property tax collection process with limited resources and staff.
Therefore, the taxation staff, existing properties record, and tax recovery process can be
monitored and evaluated efficiently with the help of RS & GIS technology. Moreover,
properties should be mapped around the country to identify them correctly as taxable.
Better Government-Citizen Interaction, which will result in better Public Sector Delivery,
i.e. efficient collection of tax returns.
.

67
Glossary
Attribute table: Attribute tables are normally associated with a class of geographic features.
Attribute table contains rows and columns. Each row represents a geographic feature. Each
column represents one attribute of a feature, with the same column representing the same
attribute in each row.
Attribute: A trait, quality or property describing a geographical feature.
Arrears: The total accumulated amount unpaid (due) as on 1st day of new financial year.
Band: Band is the specific range of the electromagnetic Spectrum to which the sensor is
sensitive. The band is commonly related to wave length.
Base map: A set of topographic data displayed in map form providing a frame of reference or
contextual information to the user.
Classification: The Classification is the method of identifying and dividing the feature in to
different categories or classification is arrangement or ordering of objects
Database: A collection of information organized in such a way that a computer program can
quickly select desired pieces of data; an electronic filing system.
Digitization: Digitization is the process of converting the coordinates from map, satellite
imagery or data available from another source in digital format
Digitizer: A device for manual digitizing. It normally consists of a flat surface that documents
can be attached to, and a cursor or puck that is used to locate and input map features into the
computer.
Exempted Unit: Residential property unit having land area more than 150 square yards is free
from tax.
Feature: A set of points, lines or polygons in a spatial database that represent a real-world entity.
Field: A set of one or more alphanumeric characters comprising a unit of Information.
Geo Server: is an open source server for sharing geospatial data. Designed for interoperability, it
publishes data from any major spatial data source using open standards.
Geo-Referencing: To establish the relationship between page co-ordinates on a planar map and
known real-world co-ordinates.
Geo-Database: A database that store geo-referenced data among others.

68
GPS: Global Positioning System (GPS) is satellite-based navigation systems that provide
location and time information on anywhere or near the Earth.
Image Classification: Image classification is the process of assigning the pixel values to classes,
thematic etc. Image classification can be done with the help of supervised and unsupervised
classification.
Integration: The combining of data of different types from different sources and systems to
provide new information.
IRIS: It’s a brand name of GIS based web mapping application that provides a spatial frame
work to host, geo code and view numerous other layered data-sets through internet.
Join: Joining data is typically used to append the fields of one table to those of another through
an attribute or field common to both tables.
Kanal Kanal is a unit of area used in Pakistan and India. Kanal is equivalent to about 505.857
square meters.
1 kanal=605 square yards.
1 kanal=20 marlas.
1 kanal=5445 square feet.
Land Cover Land Cover is the physical material or Land type such as forest, water, built up etc.
land cover can be defined as the bio-physical cover of the earth surface
Main Road: Road having width of 25 meters is considered as main road.
Marla Marla is a traditional unit of area that is used in India, Pakistan and Bangladesh. One
marla is equivalent to about 272.25 Square feet.
1 marla=30.25 square yards.
1 marla=25.2929 square meters
Merging: In Arc GIS the process of combining many selected feature in to single feature.
Off Road: Road having width of less than 25 meters is considered as off road
Overlay: The process of superimposing two or more maps, through registration to a common co-
ordinate system, such that the resultant maps contain the data from both maps for selected

69
features. Although the term overlay can be applied to paper-based maps, more often it applies to
the use of digital data; nevertheless, the principal is the same.
Primary key: One or more attributes whose values uniquely identify a row in a database table.
Property Tax data base: The database of property tax is created from the hardcopy of revenue
register in the Microsoft Excel format.
Query: A statement expressing a set of conditions that forms the basis for the retrieval of
information from a database.
Quick-Bird: It is a very high-resolution satellite that was launched in 2001 and decommissioned
on January 27, 2015. Quick-Bird was owned and operated by Digital Globe and collected image
data down to a pixel resolution of 0.61m. Quick-Bird satellite collects image data to 0.65m pixel
resolution degree of detail. This satellite is an excellent source of environmental GIS data.
QGIS:(previously known as Quantum GIS) is a free and open-source cross-platform desktop
geographic information system (GIS) application that supports viewing, editing, and analysis of
geospatial data.
Remote Sensing (RS): Remote sensing is the science of obtaining information about the area
from distance or object from the satellite image or aircraft.
Spatial Data: Any data that have information of position coordinates.
Spatial Resolution: Spatial resolution of the sensor is the smallest size of smallest feature that
can be detected or it can be defined as the size of cell in the raster data set.
Spectral Resolution: Specific wavelength intervals in the electromagnetic spectrum for which a
satellite sensor records the data.
Splitting: In Arc GIS is the process of dividing the one feature into many features.
Square foot is a unit of area. It is the size of a square that is one foot on a side. It is 144 square
inches, 1/9th of a square yard, or approximately 0.093 square meters.
Square yard: is a unit of area equal to the size of a square that is one yard on a side. It is equal
to 9 square feet or about 0.836square meters.
Taxable units: Residential property unit having land area less than 150 square yards is liable to
tax. But commercial property whatever the size is taxable
Thematic map: A map depicting selected kinds of information relating to one or more specific
themes. Examples are soil type, land classification, population density and rainfall maps.

70
Topology: In geo-databases, the arrangement that constrains how point, line, and polygon
features share geometry. Topology defines and enforces data integrity rules.
Vector data: An abstraction of the real world where positional data is represented in the form of
coordinates. In vector data, the basic units of spatial information are points, lines and polygons.
Unique identifier: Common field to at least two databases chosen to perform a relate, link or
join.
Union Council: Union Councils is the 5th lowest level of government in Pakistan. Union
Councils is a geographical region of tehsil used for administrative and other purpose. It
comprises about 20,000 to 30,000 population in urban and rural areas of the tehsil (subdivision
of district).
Vector data: A GIS data model in which the location and shape of objects is represented by
points, lines.
Zone: Zone is an area containing an average of 3000 to 8000 properties.
71
References
Assessment, Tax, and Land Records-ESRI. (2017). Esri.com.
Bhan, T., 2011. Using GIS For Greater Efficiency In Operations And Better Delivery Of Services
By Urban Local Bodies In India Tanushree Bhan Abstract. [ebook] Available at:
<http://Icrier.org.> [Accessed 5 October 2016].
Birir, F. and Ngigi, M., 2015. Development of A Property Tax Information Management System
For County Governments: A Case Study Of Kapsabet Sub-County.
By, R. and Huisman, O., 2009. Principles Of Geographic Information Systems. Enschede: The
International Institute for Geo-Information Science and Earth Observation (ITC).
City District Government Rawalpindi (2017), available at http://www.rawalpindi.gov.pk/
(accessed on 01-1-2017).
Cheplong, C., 2013. Development of GIS-based Tax Information System for Local Government.
Excise-punjab.gov.pk. 2016. Property Tax | Excise & Taxation. [online] Available at:
<http://excise-punjab.gov.pk/property_tax> [Accessed 9 February 2016].
GIS Geography. 2019. 1000 GIS Applications & Uses - How GIS Is Changing The World - GIS
Geography. [online] Available at: <https://gisgeography.com/gis-applications-uses/> [Accessed
13 September 2019].
GIS and Land Records Integration A PRIA White Paper, 2017. [ebook] PRIA. Available at:
<http://www.pria.us/> [Accessed 9 October 2019].
Geoserver.org. 2017. Geoserver. [online] Available at: <http://geoserver.org/> [Accessed 20
May 2017].
Geospatial World. 2012. GIS Simplifying Property Tax Collection In India - Geospatial World.
[online] Available at: <https://www.geospatialworld.net/article/g.
Handbook On Geographic Information Systems And Digital Mapping. 2000. New York.
Irispunjab.gov.pk. 2015. Welcome To Iris Punjab Website!. [online] Available at:
<http://www.irispunjab.gov.pk/> [Accessed 24 March 2015].

72
Kpexcise.gov.pk. 2015. Urban Immovable Property Tax | Excise, Taxation And Narcotics
Control Department Khyber Pakhtunkhwa. [online] Available at:
<http://www.kpexcise.gov.pk/app/uiptaxcomarea/> [Accessed 25 March 2016].
M. Bird, R. and Slack, E., 2002. Land And Property Taxation: A Review. Cambridge, MA .
Nieminen, J., 2002. Property Tax Based Revenue Collection GIS In The Developing Cities – A
New Approach For Sustainable Urban Development. WIT Press.we
Kayuza, H. 2006. Real Property Taxation in Tanzania. Ebook. tockholm: Royal Institute of
Technology Stockholm, Sweden.
Punjab-zameen.gov.pk. 2016. Home Page - LRMIS. [online] Available at: <https://www.punjab-
zameen.gov.pk/> [Accessed 14 June 2016].
Pbs.gov.pk. 2016. Population Census | Pakistan Bureau Of Statistics. [online] Available at:
<http://www.pbs.gov.pk/content/population-census> [Accessed 11 April 2016].
Pareta, D., 2017. Applications Of GIS: Property Tax Mapping And Management System. ESRI
India.
Practitioner’s Guide: Digital Tax Parcel Mapping 2009. Philippines: GTZ Decentralization
Programme.
Punjablaws.gov.pk. 2020. The Punjab Local Government Ordinance 2001. [online] Available at:
<http://www.punjablaws.gov.pk/426.html> [Accessed 12 April 2015].
Parcel Mapping Uing GIS. 1999. University of Massachusetts.
Qgistutorials.com. 2018. Web Mapping With Qgis2web — QGIS Tutorials And Tips. [online]
Available at: <https://www.qgistutorials.com/en/docs/web_mapping_with_qgis2web.html>
[Accessed 29 August 2018].
Resources.arcgis.com. 2016. Arcgis Resource Center. [online] Available at:
<http://resources.arcgis.com/> [Accessed 29 June 2017].
Satimagingcorp.com. 2014. Quickbird Satellite Sensor | Satellite Imaging Corp. [online]
Available at: <https://www.satimagingcorp.com/satellite-sensors/quickbird/> [Accessed 19
August 2014].

73
Urbanunit.gov.pk. 2015. The Urban Unit. [online] Available at:
<https://www.urbanunit.gov.pk/UU/Projects_Detail?Id=16> [Accessed 6 July 2015].
Wehrmann, B. and Glavina, J., 2009. Geographic Information Systems (GIS) - The Spatial
Dimension to Development Cooperation | Capacity4dev. [online] Europa.eu. Available at:
<https://europa.eu/capacity4dev/eu-working-group-land-issues/blog/geographic-information-
systems-gis-spatial-dimension-development-cooperation> [Accessed 02 November 2017].
Wyatt, P., 1996. Using A Geographical Information System for Property Valuation. [ebook]
Research Gate. Available at: <https://www.researchgate.net/publication/241698734> [Accessed
24 June 2018].
Zhao, H., 2002. Using Geographic Information System (GIS) In A Local Government--A Case
Study of GIS Implementation In Ascension Parish Government, Louisiana. [Online]
Citeseerx.ist.psu.edu. Available at:
<https://citeseerx.ist.psu.edu/viewdoc/download?doi=10.1.1.602.401&rep=rep1&type=pdf>
[Accessed 9 October 2013].
Zoneth,, T., 2013. A GIS-BASED REAL ESTATE TAX INFORMATION SYSTEM The Case Study
Of Sinkor District, Monrovia - Liberia. [ebook] Liberia. Available at:
<http://hdl.handle.net/123456789/5510> [Accessed 20 March 2018].

74
Appendices
Appendix 1: Valuation Table for Assessments of Property Tax
Figure7: Valuation Table for Assessments of Property Tax
Refrence: Property Tax-Excise & Taxation. (2016) Property Tax | Excise & Taxation, 2016)

75
Appendix 2: Assessment of Special Properties
Table 5: Assessment of Special Properties
(Property Tax | Excise & Taxation, 2016)
Sr.No. Type of Property Criteria for Assessment
1 Cinemas/Theaters/Auditorium
/Multipurpose Hall
Commercial rate self or rented as the case may be specified in
the valuation table of the respective locality
2 Factories/Industrial units
(Manufacturing units)
Residential rates notified, (self or rented as the case may be)
with the following rebate for land area:
Up to 1 acre: Normal Rate
Exceeding 1 acre up to 4 acres: 20% reduction
Exceeding 5: 30% reduction
3 Marriage Hall / Banquet Hall,
Marriage Lawn /Event Hall/
Marquee / Exhibition Centers.
Self-properties shall be assessed @ 175% of the commercial
rate of the valuation tables prescribed for the locality. Rented
properties shall be assessed as per rate prescribed for the
rented properties
4 Properties built as residential
properties but used for
offices/ Educational intuitions
150% of the rate specified in the valuation table of the
residential properties of the respective locality.
5 Hotels/Motels/Guest Houses
& such other furnished
properties.
1. In case of portion consisting of
rooms/boarding/lodging units used as residential
accommodation 40% of the gross annual (365 days)
rent shall be taken as GRAV. The gross rent shall be
worked out on average /normal charges received per
room per day.
2. The commercial area shall be assessed self or rented
as the case may be as per valuation table prescribed
for locality.
3. While calculating covered are, lobby/kitchen/mosque
and ancillary portion shall be excluded.
6 Hostels 150% od rates specified in valuation tables for rented
residential properties of the respective locality.
7 Hospital Commercial rate self or rented as the case may be prescribed
for the locality.
8 Petrol pumps/CNS
station/Car wash service
station
Commercial rate self or rented as the case may be.
Underground area for storage/tanks/canopy shall also be
accounted for as covered area.
9 Plaza and multi storeys
buildings
Normal commercial rate self or rented as the case may be.
However, 10% reduction in case of 1st floor and first
basement and further 5% reduction for each floor/basement
up to maximum of 40% shall be allowed for floor above and
below ground floor.
In case of single owner ship land shall be assessed only once.
However, in case of individuals and different ownership land
equal to the respective portion shall be assessed in each case.

76
10 Customized parking plaza /
Parking Lots
25% of the commercial rate self or rented as the case may be
meant for the locality.
11 Old Residential Building 10% rebate for building older than 20 years up to 30 years
15% rebate for building older than 30 years
12 Agriculture Lands, Orchards,
Nurseries
As per actual rented in case of rented and Rs.1000/- per
Kanal, per annum case of self-occupation / cultivation
13 Poultry Farms, Cattle Shed
and Brick kilns
50% of the residential rate self or rented as the may be
prescribed for the locality.
14 Transmission
/Communication Tower
Actual rent in case of rented properties. Self-commercial rate
of valuation table shall be applied in case of company own
properties.
15 Grid station Land area and covered are including are having installation
/equipment shall be assessed on self -rented commercial rates
as the case may be
16 Properties built as used as
commercial properties
(including offices and
customized educational
institutional buildings)
Commercial rates of the localities self or rented as the case
may be.
17 Airport/ Runway strip /Dry
Ports /Open yards
1. Land and covered area shall be assessed as per self or
rented, commercial rate of the locality.
2. Runway strip & taxi area, dry ports open yards
including logistic tracks to be assessed at 25% of the
self or rented commercial rate of the locality.
18 Open plots being used for
commercial purposes
200% of the rate of the valuation table meant for the land are
prescribed for the locality, self or rented as the case may be
19 Stadium , Sports complex
such like sports sites
including swimming pools
1. Commercial area self or rented to be assessed as per
commercial rate of the locality.
2. Playing fields/areas to be assessed at residential rate
of the locality self or rented as the case may be.
3. Open area / land other than the above to be assessed at
residential rate rented or self as the case may be.
20 Godowns and workshops 50% of the commercial rate rented or self, as the case may be.
21 Cold storage Self-properties shall be assessed @ 175% of the commercial
rate of the valuation tables prescribed for the locality. Rented
properties shall be assessed as per rate prescribed for the
commercial rented properties. However, portion of the
premises being used as offices or other ancillary purpose shall
be assessed as per occupied Commercial.

77
Appendix 3: Exemptions According to UIPT Act 1958
The tax shall not be livable in respect of the following properties, namely: -
(1) Buildings and lands other than those leased in perpetuity [owned by] the Federal
Government.
(2) Buildings and lands other than those leased in perpetuity owned and administered by the
Government of the Punjab or a local government as defined in section 2 clause (xvi) of the
Punjab local government ordinance, 2001 (XIII of 2001) (Punjab Local Government Ordinance,
2001).
(3) Buildings and lands, the annual rental value of which does not exceed [one thousand and
eighty] rupees; or
(4) One building occupied by an owner for his residence, the annual value of which does not
exceed one thousand, six hundred and twenty] rupees subject to the condition that the owner or
any member of his family does not own any other property in that rating area and such other
conditions as may be prescribed:
(5)Provided that if such building or land is in the ownership of a person who owns any other
building or land in the same rating area, the annual value of such building or land, shall, for the
purposes of this clause, be deemed to be the aggregate annual value of all buildings and lands
owned by him in that area.
(6) Buildings and lands or portions thereof used exclusively for educational purposes including
schools, boarding houses and hostels owned by the Government or by a body owned or
controlled by the Government.
(7) Public parks, playgrounds and libraries.
(9) Buildings and lands or portions thereof used exclusively for public worship or public charity
including mosques, temples, churches, dharmsalas, gurdwaras, hospitals, dispensaries,
orphanages, alms-house, drinking water fountains, infirmaries for the treatment and care of
animals and public burial or burning grounds or other places for the disposal of the dead.
Provided that the following buildings and lands or portions thereof shall not be deemed to be
used exclusively for public worship or for public charity within the meaning of this section,
namely: -
(10) buildings in or land on which any trade or business is carried on unless the rent derived from
such buildings or lands is applied exclusively to religious purposes or such public charitable
institutions as may be prescribed.

78
(i) Buildings or lands in respect of which rent is derived, and such rent is not applied exclusively
to religious purposes or to public charitable institutions; and
(ii) Buildings and lands annual value of which does not exceed rupees [forty-eight thousand and
six hundred] belonging to a widow, a disabled person or a minor orphan:
Provided that where the annual value is more than rupees [forty-eight thousand and six hundred]
the tax shall be levied on the amount in excess of the said amount].
(11) One residential house measuring an area up to one kanal (505 square meters) owned and
occupied for his residence by a retired Government Servant of the Federation or a Province.
Provided that in this clause Government Servant shall not include a servant of a body corporate
owned, established or controlled by the Federal or a Provincial Government.
(12) One self-occupied residential house having an area not exceeding five Marla’s (126.465
Square meters) in a Katchi Abadi notified under the law relating to Katchi Abadis (Urban slums).
(13) One residential house, measuring an area not exceeding five marlas, used for residential
purpose except a residential house with annual value of more than five thousand rupees situated
in a part of a rating area which is category A area.
Exemptions in UIPT Act 1958: (Property Tax | Excise & Taxation, 2020)

79
Series from Lund University
Department of Physical Geography and Ecosystem Science
Master Thesis in Geographical Information Science
1. Anthony Lawther: The application of GIS-based binary logistic regression for
slope failure susceptibility mapping in the Western Grampian Mountains,
Scotland (2008).
2. Rickard Hansen: Daily mobility in Grenoble Metropolitan Region, France.
Applied GIS methods in time geographical research (2008).
3. Emil Bayramov: Environmental monitoring of bio-restoration activities using
GIS and Remote Sensing (2009).
4. Rafael Villarreal Pacheco: Applications of Geographic Information Systems
as an analytical and visualization tool for mass real estate valuation: a case
study of Fontibon District, Bogota, Columbia (2009).
5. Siri Oestreich Waage: a case study of route solving for oversized transport:
The use of GIS functionalities in transport of transformers, as part of
maintaining a reliable power infrastructure (2010).
6. Edgar Pimiento: Shallow landslide susceptibility – Modelling and validation
(2010).
7. Martina Schäfer: Near real-time mapping of floodwater mosquito breeding
sites using aerial photographs (2010).
8. August Pieter van Waarden-Nagel: Land use evaluation to assess the outcome
of the programme of rehabilitation measures for the river Rhine in the
Netherlands (2010).
9. Samira Muhammad: Development and implementation of air quality data mart
for Ontario, Canada: A case study of air quality in Ontario using OLAP tool.
(2010).
10. Fredros Oketch Okumu: Using remotely sensed data to explore spatial and
temporal relationships between photosynthetic productivity of vegetation and
malaria transmission intensities in selected parts of Africa (2011).
11. Svajunas Plunge: Advanced decision support methods for solving diffuse
water pollution problems (2011).
12. Jonathan Higgins: Monitoring urban growth in greater Lagos: A case study
using GIS to monitor the urban growth of Lagos 1990 - 2008 and produce
future growth prospects for the city (2011).
13. Mårten Karlberg: Mobile Map Client API: Design and Implementation for
Android (2011).
14. Jeanette McBride: Mapping Chicago area urban tree canopy using color
infrared imagery (2011).
15. Andrew Farina: Exploring the relationship between land surface temperature
and vegetation abundance for urban heat island mitigation in Seville, Spain
(2011).
16. David Kanyari: Nairobi City Journey Planner: An online and a Mobile
Application (2011).
80
17. Laura V. Drews: Multi-criteria GIS analysis for siting of small wind power
plants - A case study from Berlin (2012).
18. Qaisar Nadeem: Best living neighborhood in the city - A GIS based multi
criteria evaluation of ArRiyadh City (2012).
19. Ahmed Mohamed El Saeid Mustafa: Development of a photo voltaic building
rooftop integration analysis tool for GIS for Dokki District, Cairo, Egypt
(2012).
20. Daniel Patrick Taylor: Eastern Oyster Aquaculture: Estuarine Remediation via
Site Suitability and Spatially Explicit Carrying Capacity Modeling in
Virginia’s Chesapeake Bay (2013).
21. Angeleta Oveta Wilson: A Participatory GIS approach to unearthing
Manchester’s Cultural Heritage ‘gold mine’ (2013).
22. Ola Svensson: Visibility and Tholos Tombs in the Messenian Landscape: A
Comparative Case Study of the Pylian Hinterlands and the Soulima Valley
(2013).
23. Monika Ogden: Land use impact on water quality in two river systems in
South Africa (2013).
24. Stefan Rova: A GIS based approach assessing phosphorus load impact on Lake
Flaten in Salem, Sweden (2013).
25. Yann Buhot: Analysis of the history of landscape changes over a period of 200
years. How can we predict past landscape pattern scenario and the impact on
habitat diversity? (2013).
26. Christina Fotiou: Evaluating habitat suitability and spectral heterogeneity
models to predict weed species presence (2014).
27. Inese Linuza: Accuracy Assessment in Glacier Change Analysis (2014).
28. Agnieszka Griffin: Domestic energy consumption and social living standards: a
GIS analysis within the Greater London Authority area (2014).
29. Brynja Guðmundsdóttir: Detection of potential arable land with remote
sensing and GIS - A Case Study for Kjósarhreppur (2014).
30. Oleksandr Nekrasov: Processing of MODIS Vegetation Indices for analysis of
agricultural droughts in the southern Ukraine between the years 2000-2012
(2014).
31. Sarah Tressel: Recommendations for a polar Earth science portal
in the context of Arctic Spatial Data Infrastructure (2014).
32. Caroline Gevaert: Combining Hyperspectral UAV and Multispectral
Formosat-2 Imagery for Precision Agriculture Applications (2014).
33. Salem Jamal-Uddeen: Using GeoTools to implement the multi-criteria
evaluation analysis - weighted linear combination model (2014).
34. Samanah Seyedi-Shandiz: Schematic representation of geographical railway
network at the Swedish Transport Administration (2014).
35. Kazi Masel Ullah: Urban Land-use planning using Geographical Information
System and analytical hierarchy process: case study Dhaka City (2014).
36. Alexia Chang-Wailing Spitteler: Development of a web application based on
MCDA and GIS for the decision support of river and floodplain rehabilitation
projects (2014).

81
37. Alessandro De Martino: Geographic accessibility analysis and evaluation of
potential changes to the public transportation system in the City of Milan
(2014).
38. Alireza Mollasalehi: GIS Based Modelling for Fuel Reduction Using
Controlled Burn in Australia. Case Study: Logan City, QLD (2015).
39. Negin A. Sanati: Chronic Kidney Disease Mortality in Costa Rica;
Geographical Distribution, Spatial Analysis and Non-traditional Risk Factors
(2015).
40. Karen McIntyre: Benthic mapping of the Bluefields Bay fish sanctuary,
Jamaica (2015).
41. Kees van Duijvendijk: Feasibility of a low-cost weather sensor network for
agricultural purposes: A preliminary assessment (2015).
42. Sebastian Andersson Hylander: Evaluation of cultural ecosystem services
using GIS (2015).
43. Deborah Bowyer: Measuring Urban Growth, Urban Form and Accessibility as
Indicators of Urban Sprawl in Hamilton, New Zealand (2015).
44. Stefan Arvidsson: Relationship between tree species composition and
phenology extracted from satellite data in Swedish forests (2015).
45. Damián Giménez Cruz: GIS-based optimal localisation of beekeeping in rural
Kenya (2016).
46. Alejandra Narváez Vallejo: Can the introduction of the topographic indices in
LPJ-GUESS improve the spatial representation of environmental variables? (2016).
47. Anna Lundgren: Development of a method for mapping the highest coastline
in Sweden using breaklines extracted from high resolution digital elevation
models (2016).
48. Oluwatomi Esther Adejoro: Does location also matter? A spatial analysis of
social achievements of young South Australians (2016).
49. Hristo Dobrev Tomov: Automated temporal NDVI analysis over the Middle
East for the period 1982 - 2010 (2016).
50. Vincent Muller: Impact of Security Context on Mobile Clinic Activities
A GIS Multi Criteria Evaluation based on an MSF Humanitarian Mission in
Cameroon (2016).
51. Gezahagn Negash Seboka: Spatial Assessment of NDVI as an Indicator of
Desertification in Ethiopia using Remote Sensing and GIS (2016).
52. Holly Buhler: Evaluation of Interfacility Medical Transport Journey Times in
Southeastern British Columbia. (2016).
53. Lars Ole Grottenberg: Assessing the ability to share spatial data between
emergency management organisations in the High North (2016).
54. Sean Grant: The Right Tree in the Right Place: Using GIS to Maximize the
Net Benefits from Urban Forests (2016).
55. Irshad Jamal: Multi-Criteria GIS Analysis for School Site Selection in Gorno-
Badakhshan Autonomous Oblast, Tajikistan (2016).
56. Fulgencio Sanmartín: Wisdom-volkano: A novel tool based on open GIS and
time-series visualization to analyse and share volcanic data (2016).

82
57. Nezha Acil: Remote sensing-based monitoring of snow cover dynamics and its
influence on vegetation growth in the Middle Atlas Mountains (2016).
58. Julia Hjalmarsson: A Weighty Issue: Estimation of Fire Size with
Geographically Weighted Logistic Regression (2016).
59. Mathewos Tamiru Amato: Using multi-criteria evaluation and GIS for chronic
food and nutrition insecurity indicators analysis in Ethiopia (2016).
60. Karim Alaa El Din Mohamed Soliman El Attar: Bicycling Suitability in
Downtown, Cairo, Egypt (2016).
61. Gilbert Akol Echelai: Asset Management: Integrating GIS as a Decision
Support Tool in Meter Management in National Water and Sewerage
Corporation (2016).
62. Terje Slinning: Analytic comparison of multibeam echo soundings (2016).
63. Gréta Hlín Sveinsdóttir: GIS-based MCDA for decision support: A framework
for wind farm siting in Iceland (2017).
64. Jonas Sjögren: Consequences of a flood in Kristianstad, Sweden: A GIS-based
analysis of impacts on important societal functions (2017).
65. Nadine Raska: 3D geologic subsurface modelling within the Mackenzie Plain,
Northwest Territories, Canada (2017).
66. Panagiotis Symeonidis: Study of spatial and temporal variation of atmospheric
optical parameters and their relation with PM 2.5 concentration over Europe
using GIS technologies (2017).
67. Michaela Bobeck: A GIS-based Multi-Criteria Decision Analysis of Wind
Farm Site Suitability in New South Wales, Australia, from a Sustainable
Development Perspective (2017).
68. Raghdaa Eissa: Developing a GIS Model for the Assessment of Outdoor
Recreational Facilities in New Cities Case Study: Tenth of Ramadan City,
Egypt (2017).
69. Zahra Khais Shahid: Biofuel plantations and isoprene emissions in Svea and
Götaland (2017).
70. Mirza Amir Liaquat Baig: Using geographical information systems in
epidemiology: Mapping and analyzing occurrence of diarrhea in urban -
residential area of Islamabad, Pakistan (2017).
71. Joakim Jörwall: Quantitative model of Present and Future well-being in the
EU-28: A spatial Multi-Criteria Evaluation of socioeconomic and climatic
comfort factors (2017).
72. Elin Haettner: Energy Poverty in the Dublin Region: Modelling Geographies
of Risk (2017).
73. Harry Eriksson: Geochemistry of stream plants and its statistical relations to
soil- and bedrock geology, slope directions and till geochemistry. A GIS-
analysis of small catchments in northern Sweden (2017).
74. Daniel Gardevärn: PPGIS and Public meetings – An evaluation of public
participation methods for urban planning (2017).
75. Kim Friberg: Sensitivity Analysis and Calibration of Multi Energy Balance
Land Surface Model Parameters (2017).
76. Viktor Svanerud: Taking the bus to the park? A study of accessibility to green
areas in Gothenburg through different modes of transport (2017).

83
77. Lisa-Gaye Greene: Deadly Designs: The Impact of Road Design on Road
Crash Patterns along Jamaica’s North Coast Highway (2017).
78. Katarina Jemec Parker: Spatial and temporal analysis of fecal indicator
bacteria concentrations in beach water in San Diego, California (2017).
79. Angela Kabiru: An Exploratory Study of Middle Stone Age and Later Stone
Age Site Locations in Kenya’s Central Rift Valley Using Landscape Analysis:
A GIS Approach (2017).
80. Kristean Björkmann: Subjective Well-Being and Environment: A GIS-Based
Analysis (2018).
81. Williams Erhunmonmen Ojo: Measuring spatial accessibility to healthcare for
people living with HIV-AIDS in southern Nigeria (2018).
82. Daniel Assefa: Developing Data Extraction and Dynamic Data Visualization
(Styling) Modules for Web GIS Risk Assessment System (WGRAS). (2018).
83. Adela Nistora: Inundation scenarios in a changing climate: assessing potential
impacts of sea-level rise on the coast of South-East England (2018).
84. Marc Seliger: Thirsty landscapes - Investigating growing irrigation water
consumption and potential conservation measures within Utah’s largest
master-planned community: Daybreak (2018).
85. Luka Jovičić: Spatial Data Harmonisation in Regional Context in Accordance
with INSPIRE Implementing Rules (2018).
86. Christina Kourdounouli: Analysis of Urban Ecosystem Condition Indicators
for the Large Urban Zones and City Cores in EU (2018).
87. Jeremy Azzopardi: Effect of distance measures and feature representations on
distance-based accessibility measures (2018).
88. Patrick Kabatha: An open source web GIS tool for analysis and visualization
of elephant GPS telemetry data, alongside environmental and anthropogenic
variables (2018).
89. Richard Alphonce Giliba: Effects of Climate Change on Potential
Geographical Distribution of Prunus africana (African cherry) in the Eastern
Arc Mountain Forests of Tanzania (2018).
90. Eiður Kristinn Eiðsson: Transformation and linking of authoritative multi-
scale geodata for the Semantic Web: A case study of Swedish national building
data sets (2018).
91. Niamh Harty: HOP!: a PGIS and citizen science approach to monitoring the
condition of upland paths (2018).
92. José Estuardo Jara Alvear: Solar photovoltaic potential to complement
hydropower in Ecuador: A GIS-based framework of analysis (2018).
93. Brendan O’Neill: Multicriteria Site Suitability for Algal Biofuel Production
Facilities (2018).
94. Roman Spataru: Spatial-temporal GIS analysis in public health – a case study
of polio disease (2018).
95. Alicja Miodońska: Assessing evolution of ice caps in Suðurland, Iceland, in
years 1986 - 2014, using multispectral satellite imagery (2019).
96. Dennis Lindell Schettini: A Spatial Analysis of Homicide Crime’s Distribution
and Association with Deprivation in Stockholm Between 2010-2017 (2019).

84
97. Damiano Vesentini: The Po Delta Biosphere Reserve: Management challenges
and priorities deriving from anthropogenic pressure and sea level rise (2019).
98. Emilie Arnesten: Impacts of future sea level rise and high water on roads,
railways and environmental objects: a GIS analysis of the potential effects of
increasing sea levels and highest projected high water in Scania, Sweden
(2019).
99. Syed Muhammad Amir Raza: Comparison of geospatial support in RDF stores:
Evaluation for ICOS Carbon Portal metadata (2019).
100. Hemin Tofiq: Investigating the accuracy of Digital Elevation Models from
UAV images in areas with low contrast: A sandy beach as a case study (2019).
101. Evangelos Vafeiadis: Exploring the distribution of accessibility by public
transport using spatial analysis. A case study for retail concentrations and
public hospitals in Athens (2019).
102. Milan Sekulic: Multi-Criteria GIS modelling for optimal alignment of roadway
by-passes in the Tlokweng Planning Area, Botswana (2019).
103. Ingrid Piirisaar: A multi-criteria GIS analysis for siting of utility-scale
photovoltaic solar plants in county Kilkenny, Ireland (2019).
104. Nigel Fox: Plant phenology and climate change: possible effect on the onset of
various wild plant species’ first flowering day in the UK (2019).
105. Gunnar Hesch: Linking conflict events and cropland development in
Afghanistan, 2001 to 2011, using MODIS land cover data and Uppsala
Conflict Data Programme (2019).
106. Elijah Njoku: Analysis of spatial-temporal pattern of Land Surface
Temperature (LST) due to NDVI and elevation in Ilorin, Nigeria (2019).
107. Katalin Bunyevácz: Development of a GIS methodology to evaluate informal
urban green areas for inclusion in a community governance program (2019).
108. Paul dos Santos: Automating synthetic trip data generation for an agent-based
simulation of urban mobility (2019).
109. Robert O’ Dwyer: Land cover changes in Southern Sweden from the mid-
Holocene to present day: Insights for ecosystem service assessments (2019).
110. Daniel Klingmyr: Global scale patterns and trends in tropospheric NO2
concentrations (2019).
111. Marwa Farouk Elkabbany: Sea Level Rise Vulnerability Assessment for Abu
Dhabi, United Arab Emirates (2019).
112. Jip Jan van Zoonen: Aspects of Error Quantification and Evaluation in Digital
Elevation Models for Glacier Surfaces (2020).
113. Georgios Efthymiou: The use of bicycles in a mid-sized city – benefits and
obstacles identified using a questionnaire and GIS (2020).
114. Haruna Olayiwola Jimoh: Assessment of Urban Sprawl in MOWE/IBAFO
Axis of Ogun State using GIS Capabilities (2020).
115. Nikolaos Barmpas Zachariadis: Development of an iOS, Augmented Reality
for disaster management (2020).
116. Ida Storm: ICOS Atmospheric Stations: Spatial Characterization of CO2
Footprint Areas and Evaluating the Uncertainties of Modelled CO2
Concentrations (2020).

85
117. Alon Zuta: Evaluation of water stress mapping methods in vineyards using
airborne thermal imaging (2020).
118. Marcus Eriksson: Evaluating structural landscape development in the
municipality Upplands-Bro, using landscape metrics indices (2020).
119. Ane Rahbek Vierø: Connectivity for Cyclists? A Network Analysis of
Copenhagen’s Bike Lanes (2020).
120. Cecilia Baggini: Changes in habitat suitability for three declining Anatidae
species in saltmarshes on the Mersey estuary, North-West England (2020).
121. Bakrad Balabanian: Transportation and Its Effect on Student Performance
(2020).
122. Ali Al Farid: Knowledge and Data Driven Approaches for Hydrocarbon
Microseepage Characterizations: An Application of Satellite Remote Sensing
(2020).
123. Bartlomiej Kolodziejczyk: Distribution Modelling of Gene Drive-Modified
Mosquitoes and Their Effects on Wild Populations (2020).
124. Alexis Cazorla: Decreasing organic nitrogen concentrations in European water
bodies - links to organic carbon trends and land cover (2020).
125. Kharid Mwakoba: Remote sensing analysis of land cover/use conditions of
community-based wildlife conservation areas in Tanzania (2021).
126. Chinatsu Endo: Remote Sensing Based Pre-Season Yellow Rust Early
Warning in Oromia, Ethiopia (2021).
127. Berit Mohr: Using remote sensing and land abandonment as a proxy for long-
term human out-migration. A Case Study: Al-Hassakeh Governorate, Syria
(2021).
128. Kanchana Nirmali Bandaranayake: Considering future precipitation in
delineation locations for water storage systems - Case study Sri Lanka (2021).
129. Emma Bylund: Dynamics of net primary production and food availability in the
aftermath of the 2004 and 2007 desert locust outbreaks in Niger and Yemen
(2021).
130. Shawn Pace: Urban infrastructure inundation risk from permanent sea-level
rise scenarios in London (UK), Bangkok (Thailand) and Mumbai (India): A
comparative analysis (2021).
131. Oskar Evert Johansson: The hydrodynamic impacts of Estuarine Oyster reefs,
and the application of drone technology to this study (2021).
132. Pritam Kumarsingh: A Case Study to develop and test GIS/SDSS methods to
assess the production capacity of a Cocoa Site in Trinidad and Tobago (2021).
133. Muhammad Imran Khan: Property Tax Mapping and Assessment using GIS
(2021).