Embed Size (px)
Citation preview

Property Taxes in New York State
DIVISION OF LOCAL GOVERNMENT & SCHOOL ACCOUNTABILITY
A RESEARCH SERIES FROM THE
OFFICE OF THE NEW YORK STATE COMPTROLLER
Thomas P. DiNapoli
LOCAL GOVERNMENT ISSUES IN FOCUS
“Local property tax levies totaled
$38 billion in 2005 –
refl ecting an increase of $11 billion
(42 percent) since 2000.”
“The magnitude
of the property tax, its visibility
and its recent growth have all brought
considerable pressure to
bear on State policy makers
to provide relief.”
Summary of FindingsThis research brief summarizes issues associated with the property tax, provides an overview of recent trends and analyzes the tax burden across regions and types of local government.
• The property tax is by far the largest tax imposed by local governments in the State, representing 79 percent of all local taxes outside of New York City. • Per capita property tax burdens in New York are 49 percent higher than the national average and property taxes measured as a share of personal income are 28 percent higher.• This disparity is even greater for taxpayers in most of the State, since New York City’s property taxes are relatively low compared with other local governments (because it collects revenue from a number of other local taxes, including a personal income tax). • Local property tax levies grew by 60 percent from 1995 to 2005, more than twice the rate of infl ation during that period (28 percent). Most of this growth occurred in the last 5 years – when property tax levies increased by 42 percent, compared to infl ation of 13 percent.• Levy increases have moderated somewhat in 2006, particularly for counties, which benefi ted from last year’s Medicaid cap. However, growth rates continue to be substantially above infl ation for most classes of government.• Although taxpayers in suburban downstate counties pay the highest property tax bills per household, they have some of the lowest full value rates in the State, since their property values are much higher as well. These low rates are partly due to the growth in property values between 1995 and 2005, which was much stronger downstate than upstate.• Property taxes add to the overall high cost of living in downstate suburbs, where property taxes per $1,000 of personal income average about $65 (compared
to the State median of $53), and are a major contributor to higher housing costs. • Assessment quality varies throughout the State, and in many areas properties with similar market values may have very different assessments and tax bills. This can lead to dissatisfaction and challenges to assessments that have a signifi cant impact on the property tax base.
CONTENTS (VOL. 2 NO. 2 APRIL 2006) Pg. #
Overview ................................................................................ 2Local Tax Burden .................................................................. 3Property Tax Growth ........................................................... 4Regional Tax Burden Patterns ............................................. 7School Taxes .......................................................................... 12 Fairness Issues ....................................................................... 15Conclusion ............................................................................. 15
Property Taxes in New York State

Property Taxes in New York State / OFFICE OF THE STATE COMPTROLLER2
Overview
The property tax is by far the largest tax imposed by local governments in New York State, representing 79 percent of all local taxes outside of New York City. Local property tax levies totaled $38 billion in 2005 – refl ecting an increase of more than $11 billion (42 percent) since 2000 and generating more revenue than
even the State’s $28 billion personal income tax. In fact, even including other sources of revenue (such as State and Federal aid) it is still the largest single source of all revenue for local governments in New York State, accounting for 43 percent of all municipal revenues in 2004.
During the late 1990s, the economic expansion allowed most local governments to keep property tax increases below infl ation. More recently this trend has reversed, as economic slowdowns and resulting contractions in other revenues have placed additional pressure on local property tax levies. As a result, the property tax is currently the fastest growing local revenue in the State.
Unlike sales taxes and State aid, the property tax is a relatively stable, locally-controlled revenue source. It pays for services like schools, roads and libraries as well as the local share of some State programs such as Medicaid. Property taxes are generally used to balance municipal budgets after accounting for all other sources of revenue – this means they tend to increase more quickly if other revenues stagnate or decline. This tendency to grow during tough economic times – when combined with its sheer size and the perception that assessments are inequitable or that the burden falls unfairly on certain classes of taxpayers – has made the property tax a lighting rod for criticism.
The magnitude of the property tax, its visibility and recent growth have all brought considerable pressure to bear on State policy makers to provide relief. In 1997, lawmakers responded by enacting the School Tax
Local Government Revenue Sources, 2004
(Excluding New York City)
Average Annual Growth in Revenue Sources, 2000-2004(Excluding New York City)
0.0%
1.0%
2.0%
3.0%
4.0%
5.0%
6.0%
7.0%
Real PropertyTax
Sales and OtherTaxes
State Aid Other Non-TaxRevenues
Other Non-Tax
13%Federal Aid
7%
Property Tax43%
State Aid25%
Sales and Other Taxes12%

DIVISION OF LOCAL GOVERNMENT & SCHOOL ACCOUNTABILITY / Property Taxes in New York State 3
Relief (STAR) program, which exempted the fi rst $30,000 of property value from taxation for homeowners ($50,000 for lower-income seniors). Last year’s State Budget included a cap on local Medicaid cost increases for counties and New York City and an increase in revenue sharing aid for other municipalities. The 2006-07 State Budget also contains property tax relief initiatives, but the outcome of those proposals is currently caught up in the budget disagreement between the Governor and the Legislature.
This research brief summarizes issues associated with the property tax and provides an analysis of recent trends. As the analysis shows, the property tax burden varies signifi cantly among regions and types of local governments, and can be described very differently when property values or income are taken into consideration. A discussion on the methodology can be found in the “Notes on Data” section at the end of the report. Local Tax Burden
Tax burdens in New York State are generally higher than in the rest of the nation:
New York taxpayers have the highest combined State and local tax burden in the nation, with a • total tax bill of $131 for every $1,000 of personal income in 2002, nearly 26 percent higher than the national average.
New York’s high tax burden is entirely driven by high local taxes – State taxes are about average, • at $64 per $1,000 of personal income, versus $62 for the nation as a whole.
Local taxes are the highest in the country, at $67 per $1,000 of personal income, 60 percent higher • than the national average of $42. Maine is the next highest state at $55 – nearly 20 percent lower than New York.
Dependence on the Property Tax as a Revenue Source
While the property tax is the primary revenue source for most local governments in the State, reliance on it varies considerably. Counties and cities also rely heavily on the sales tax and receive only about one-quarter of their revenue from property levies. In comparison, fire districts receive over 90 percent of their revenue from this source. For school districts, property taxes make up just over half of total revenues, but among individual districts the percentage ranges from less than 10 percent to more than 90 percent (this variance largely depends on local wealth and reliance on State school aid).
Percent of Revenue from Property Taxes, 2004
0%
10%
20%
30%
40%
50%
60%
70%
80%
90%
100%
Counties Cities(exclud-
ing NYC)
Villages Towns School Districts
Fire Districts
New York City

Property Taxes in New York State / OFFICE OF THE STATE COMPTROLLER4
Although New York does not rank fi rst in any individual major local tax, it is among the top seven • states for the three major taxes: local property, sales and personal income. It is the combination of high local taxes across the board that causes the State’s overall local tax ranking to rise to the top.
Local property taxes in New York were $1,406 per capita in 2002, or 49 percent above the national • average, and $40 per $1,000 of personal income, or 28 percent above average.
This disparity is even greater for taxpayers • in most of the State, since New York City’s property taxes are relatively low compared with other local governments (because it collects revenue from a number of other local taxes, including a personal income tax). Outside of the City, property taxes per capita are $1,634 – 73 percent above the national average. Accordingly, and because its large size sways averages, many of the descriptive statistics presented in this report exclude the City.
Over the last 10 years, property tax levies have • grown by 60 percent, more than twice the rate of infl ation during that period (28 percent). Most of this growth occurred in the last 5 years – when property tax levies increased by 42 percent, compared to infl ation of 13 percent.
Property taxes are also highly visible – most homeowners see the amount on their tax bills twice a year (once for schools and once for all other local governments). Tax rates are a subject of annual public debate, and school budgets are approved or defeated by popular vote in most districts (with the exception of the fi scally dependent school districts in the “Big Five” cities).
Property Tax Growth
Property taxes are also growing rapidly – a trend especially evident in recent years. Local governments as a whole had average annual increases in property tax levy of only 2.3 percent during the 1990s, and counties, cities, towns and villages all kept annual levy increases below the infl ation rate of 2.5 percent. Slow property tax growth during that period
Property Taxes Per $1,000 of Personal IncomeNYC vs. Rest of State vs. US Average, 2002
0%
1%
2%
3%
4%
5%
6%
7%
8%
Cities Villages Towns SpecialDistricts
Counties SchoolDistricts
1995 to 2000 2000 to 2005
Annual Average Inflation Rate, 1995-2005 (2.5%)Excluding STAR Revenue
Ann
ual A
vera
ge P
erce
nt C
hang
e
Annual Average Percent Change by Class of Government, 1995-2000 vs. 2000-2005
(Excluding NYC)
$50
$45
$40
$35
$30
$25
$10
$15
$20
$0
$5
US AverageRest of StateNYC

DIVISION OF LOCAL GOVERNMENT & SCHOOL ACCOUNTABILITY / Property Taxes in New York State 5
was also related to increased growth in other sources of revenue (especially sales tax revenue growth due to the healthy economy) and moderating costs, including low interest rates for capital projects and lower-than-usual pension contributions (driven by extraordinary returns on pension fund investments during that period).
School districts were the only local governments to have property tax growth that outpaced infl ation between 1995 and 2000. However, when the amount of STAR reimbursements (which were being phased in during that period) is deducted from school levies, net growth was lower than infl ation. The impact of levy growth on local taxpayers varied, therefore, depending on whether they were eligible for STAR. Homeowners saw much lower growth than rental or other commercial property owners, who account for about half of the tax base.
From 2000 to 2005, the economic impact of the recession and the attacks of September 11, 2001 reduced State aid at the same time other local revenues slowed. These changes, coupled with growth in local costs for health care and employee benefi ts, produced more rapid property tax growth. All classes of government shared in this acceleration, with levies growing faster than infl ation during the period. School district levies grew at an average annual rate of 7.3 percent, signifi cantly outpacing infl ation even after accounting for STAR. Although data are still preliminary, levy increases appear to be moderating somewhat in 2006, particularly for counties. In part, this is a result of recent State-level actions. The cap on local Medicaid cost increases, for example, has had a dramatic effect on county tax levies. As described in a recent OSC update, county tax levy increases slowed from an annual average increase of 7.0 percent statewide from 2000 to 2005 to 3.3 percent in 2006. State revenue sharing and school aid increases may have also had an impact. Preliminary school district and village levy data show growth slowing for those classes of government as well, although less dramatically (from 7.8 percent in 2005 to 6.8 percent for 2006 for school districts, and from 6.3 percent to about 5.5 percent for villages). However, growth rates for most classes continue to be substantially above infl ation.
Why Use the Property Tax?
Despite the problems associated with the property tax, it is well-suited to local administration and is used in all 50 states to support local governments. Among its positive aspects:
It is a reliable and effective way for local governments to raise • revenue, in that it is imposed on a known, stable tax base and can be relatively easy to administer.
It is better insulated from economic downturns than other • taxes, especially the sales tax, which is the most common major alternative tax.
Having a single major identifiable local revenue source for • municipalities and schools offers direct accountability and keeps the pressure on these local governments to carry out their operations in a cost-effective manner.
It taxes wealth missed by other taxes (such as the wealth of • non-resident second home owners or certain businesses).

Property Taxes in New York State / OFFICE OF THE STATE COMPTROLLER6

DIVISION OF LOCAL GOVERNMENT & SCHOOL ACCOUNTABILITY / Property Taxes in New York State 7
Regional Tax Burden Patterns
There is a great deal of variation across the State in property tax levels, growth rates and relative burden. Adding together all the property taxes imposed by counties, cities, towns, villages, school districts and other local entities provides a comprehensive view of the overall property tax burden by county and region. The Offi ce of the State Comptroller collects much of the levy and assessment data necessary for such an analysis (see the “Notes on Data” at the end of this report for more detail). These data are published annually on the OSC website, www.osc.state.ny.us/localgov.
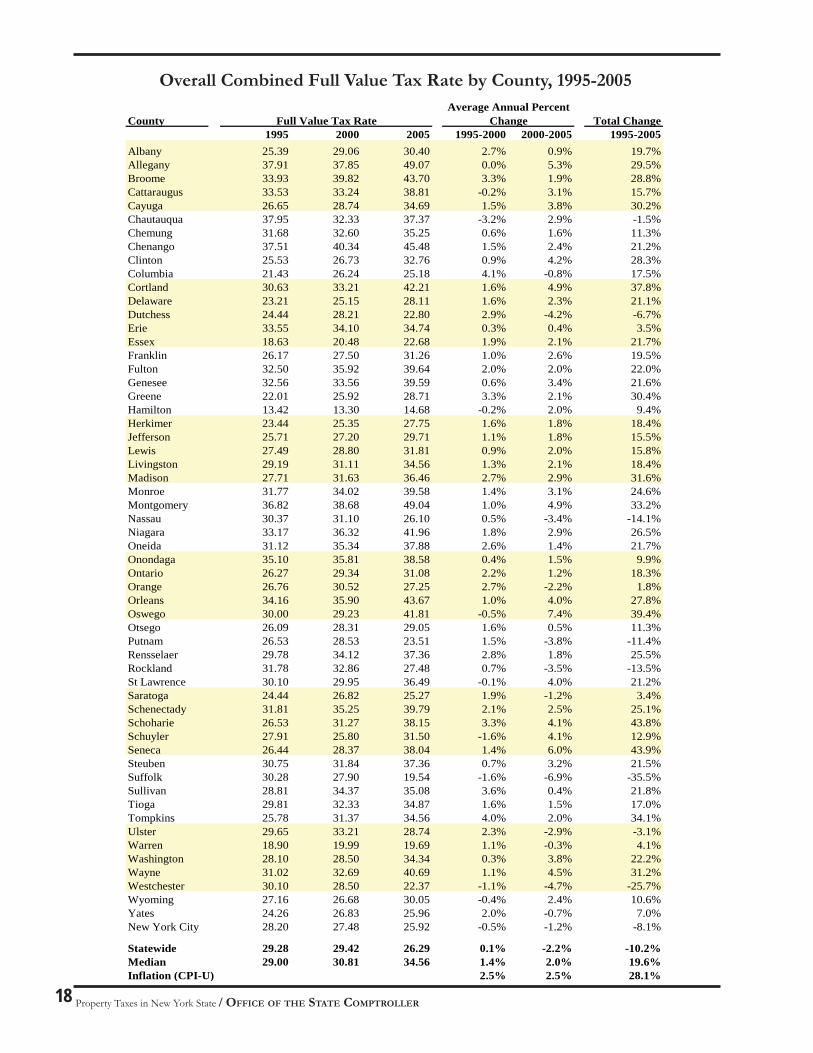
The simplest measure of burden is total taxes per household. By this measure the property tax burden falls most heavily on taxpayers in suburban downstate counties. Nassau, Putnam, Rockland, Suffolk and Westchester counties have tax burdens per household that are more than twice the statewide average. The remaining down- state suburban counties – Dutchess, Orange, Sullivan and Ulster – are also well above average. By contrast, several western and northern counties have overall burdens that are 20 percent or more below the average.
The fact that total taxes per household are higher in those counties, however, may not indicate by itself that property taxes are more burdensome there. Downstate residents are generally wealthier, and therefore may be able to afford higher taxes. Property values – one measure of household wealth and ability to pay – are, in fact, three to four times higher in Long Island (Nassau and Suffolk counties) and much of the Mid-Hudson Valley (Putnam, Rockland and Westchester counties) than in other regions of the State.
Levy Per Household by Region, 2005
$0
$2,000
$4,000
$6,000
$8,000
$10,000
$12,000
Capita
l Regi
on
Centra
l NY
Finger
Lakes
Long I
sland
Mid-Hud
son
Mohaw
k Valle
y
North C
ountr
y
South
ern Tier
Western
NY
Levy without STAR STAR Reimbursement
Full Value Per Household by Region, 2005
$0$50,000
$100,000$150,000$200,000$250,000$300,000$350,000$400,000$450,000$500,000
Capita
l Regi
on
Centra
l NY
Finger
Lakes
Long I
sland
Mid-Hud
son
Mohaw
k Valle
y
North C
ountr
y
South
ern Tier
Western
NY

Property Taxes in New York State / OFFICE OF THE STATE COMPTROLLER8

DIVISION OF LOCAL GOVERNMENT & SCHOOL ACCOUNTABILITY / Property Taxes in New York State 9
Full value property tax rates give an indication of tax burden relative to property wealth. Overall full value rates in 2005 ranged from less than $20 per $1,000 in Hamilton, Suffolk and Warren counties to over $45 per $1,000 in Allegany, Chenango and Montgomery counties, with higher rates being generally found in the western areas of the State, where property values are particularly low. By this measure, property taxes look much more affordable than average downstate, especially in property-wealthy Suffolk and Westchester counties.
But “property wealth” can be looked at from another perspective: housing costs, such as mortgage payments, are higher in downstate markets. This could be an indicator of taxpayer stress, rather than of ability to pay more in property taxes. The Census collects information on housing costs as a percentage of household income, and by this indicator, housing costs were, on average, somewhat higher compared with income in the two downstate regions outside of New York City in 1999. The recent “housing bubble” in coastal metropolitan areas has probably exacerbated this further.
Anomalies: Hamilton County, New York City, and Erie County
Hamilton County, at three times the average tax burden per household, is not comparable to other New York counties in several respects: its extremely small population, relatively high proportion of vacation homes and large amount of taxed Adirondack State Park land cause it to show up as an outlier in all of the analyses.
New York City, with its extensive service needs and high cost of living, might be expected to have high property tax burdens, at least in terms of total dollars per household, if not per $1,000 of full value or personal income. Yet, by all measures it is either average or low. This is because, unlike other local governments in the State, New York City collects a large portion of local revenue through a personal income tax and a variety of other taxes, lowering its dependence on the property tax as a source of revenue.
Erie County had a relatively low overall tax burden in 2005, but taxpayers saw an increase in 2006, when County-level taxes rose by 19 percent in response to that County’s fiscal crisis.
0%
5%
10%
15%
20%
25%
30%
Capita
l Regi
on
Centra
l NY
Finger
Lakes
Long I
sland
Mid-Hud
son
Mohaw
k Valle
y
North C
ountr
y
South
ern Tier
Western
NY
Median Housing Costs as % of Homeowner IncomeMedian Housing Costs as % of Homeowner Income, excluding property taxes
Selected Homeowner Housing Costs as a Percent of Income, with and without Real Estate Taxes, 1999

Property Taxes in New York State / OFFICE OF THE STATE COMPTROLLER10
However, further analysis of the data shows that the major reason for this difference is the property tax itself – housing costs excluding real estate taxes were fairly even as a percent of personal income across all regions of the State.
Looking at the measure of ability to pay that is most commonly used to compare tax burden across states – levy per $1,000 of personal income – shows yet another picture. The tax burden on property-owners in suburban downstate counties looks relatively higher by this measure compared to the full value tax rate, but relatively lower than the nominal measure of levy per household. Outside of Hamilton County, levies per $1,000 of personal income ranged from a low of $37 in Jefferson County to highs of over $65 for most of the Mid-Hudson Valley.
Much of the disparity in measures of tax burden between the full value tax rate and share of personal income can be explained by the rapid increase in property values downstate, particularly in downstate suburbs. From 1995 to 2005, average full value grew by 7.0 percent per year in downstate suburban counties, almost fi ve times as fast as the average annual upstate growth of 1.5 percent.
As total property value rises, the tax rate needed to achieve the same total levy goes down. Thus, even though levies grew slightly faster downstate than upstate from 1995 to 2005 (annual average change of 5.4 percent versus 3.7 percent), tax rates responded by falling downstate while rising upstate.
Trends in Full Value, Upstate vs. Downstate,2000-2005
(Excluding NYC)
$0
$100
$200
$300
$400
$500
$600
$700
$800
2000 2001 2002 2003 2004 2005
Downstate Upstate
Trends in Levy, Upstate vs. Downstate,2000-2005
(Excluding NYC)
$0
$2
$4
$6
$8
$10
$12
$14
$16
$18
2000 2001 2002 2003 2004 2005
Downstate Upstate
Trends in Full Value Tax Rate, Upstate vs. Downstate,2000-2005
(Excluding NYC)
$0.00
$5.00
$10.00
$15.00
$20.00
$25.00
$30.00
$35.00
$40.00
2000 2001 2002 2003 2004 2005
Downstate Upstate
Bill
ion
sB
illio
ns
Dol
lars
per
$1,
000
of F
ull
Val
ue

DIVISION OF LOCAL GOVERNMENT & SCHOOL ACCOUNTABILITY / Property Taxes in New York State 11

Property Taxes in New York State / OFFICE OF THE STATE COMPTROLLER12
School Taxes
School taxes represent the largest portion of the overall property tax burden (61 percent outside of New York City) and, as noted above, have generally been increasing more rapidly than municipal property taxes (counties, cities, towns and villages). The reasons for this are twofold. First, schools consume more public resources than other types of local government, accounting for 48 percent of total local government expenditures in 2004, and demands upon public education have been escalating. Second, property taxes are the only signifi cant source of local revenue for most school districts. A relatively small number of districts receive sales tax distributions or impose a consumer utility tax, and of course, New York City is an exception – being funded by a municipal tax base which includes personal income, sales and other taxes.
As with total property taxes, school taxes vary around the State, with some of the highest full value tax rates in high-need districts, where property values tend to be low, but some of the highest total bills in wealthier areas, where property values are much higher.
Because of their magnitude, visibility and growth, school taxes have been the subject of many property tax relief measures over the past decade. These include STAR – a $2.5 billion State-funded property tax exemption program – and a variety of fi scal accountability measures including property tax report cards, a single statewide school budget/school board voting day and contingency budget caps, all created at least in part with the intent of dampening school spending and property tax growth.
As noted earlier, STAR exempts the fi rst $30,000 of every homeowner’s property value ($50,000 for lower-income senior citizens), and the foregone local revenue is reimbursed by the State. Renters (who pay taxes indirectly through their rent) and businesses receive no benefi t from STAR. Adjustments are made for local assessing practices, and in counties with higher-than-average home prices, the exemptions are increased proportionally.
STAR benefi ts go disproportionately to higher-wealth areas. The pattern of STAR funding is therefore the exact inverse of the pattern of State school aid, which generally provides
Cities3%
Towns7%
Distribution of Property Tax Levy by Class, 2005(Excluding New York City)
Local Government Revenues by Class, 2004
(Excluding New York City)
School Districts
61%
Muni-cipalities
21%
Counties18%
Special Districts
7%
Villages4%
School Districts
48%
Muni-cipalities
21%
Counties31%

DIVISION OF LOCAL GOVERNMENT & SCHOOL ACCOUNTABILITY / Property Taxes in New York State 13
greater aid to lower-wealth, higher-needs districts. Big cities and other urban areas also receive a relatively small proportion of STAR exemption benefi ts, because they have a much smaller proportion of homeowners than suburban areas, and also because many have more complex revenue structures.
STAR was originally proposed with an accompanying spending cap, which was not enacted. A series of proposals have been made since that time to link STAR to caps on the growth in school budgets or otherwise govern or limit tax or spending increases (including this year’s Executive Budget). However, these proposals have not been adopted primarily because of objections to limiting local school spending decisions or governing them through a formula, particularly since voters have an annual opportunity to accept or reject local budgets and elect school board members.
Although often described as a tax cut, STAR exemptions are actually a transfer of tax burden, from homeowners paying local school property taxes to taxpayers statewide. While STAR indisputably provides property tax relief for those receiving it, its long-term impact may well be an overall increase in State and local taxes. The reason for this is that STAR lowers the effective tax rate on homeowners – the largest group of people who vote on and otherwise infl uence local school budgets. For many seniors, STAR effectively eliminated their school tax burden. By reducing the local tax share paid for greater school spending, STAR actually provides an incentive to increase school spending – an impact which has been described in several studies. This incentive is strongest, ironically, in the some of the highest spending areas – where high taxes and high home values combine to provide the highest STAR benefi ts.
This impact from STAR may have been strongest during the period it was being phased in (from 1998-99 through 2001-02), as the annually increasing amounts of tax relief provided an offset to annual levy increases. Now that STAR is fully phased in, however, increases in school taxes have re-emerged as a matter of concern – despite the fact that STAR has lowered the direct property tax burden paid by homeowners. The implementation of STAR signifi cantly reduced the net increase in levies for a time. That effect has now ended, and school property tax levy increases are being felt in their entirety again.
The budget adopted by the Legislature this year added nearly $1 billion for STAR rebate checks equal to 30 percent of each homeowner’s existing STAR benefi t (for example, a taxpayer entitled to $1,000 STAR savings off the property tax would get a check for $300). The rebate checks would be mailed out by the end of October, based on the previous year’s STAR exemptions, and taxpayers may need to declare them as income on Federal and State income tax returns. In addition, the Legislature enacted a “cost-of-living” increase in the enhanced exemption for moderate income seniors (at a cost of $72 million). Subsequently the Governor vetoed the STAR rebate program, which differs signifi cantly from his “STAR Plus” proposal, which was set at $400 per homeowner, but was contingent on a school district’s compliance with a new spending cap. The increase in the enhanced exemption for seniors was originally proposed by the Governor and was not vetoed.
$0
$2
$4
$6
$8
$10
$12
$14
$16
$18
1990
1991
1992
1993
1994
1995
1996
1997
1998
1999
2000
2001
2002
2003
2004
2005
Overall Levies Levies Deducting STAR
School Property Tax Levies

Property Taxes in New York State / OFFICE OF THE STATE COMPTROLLER14

DIVISION OF LOCAL GOVERNMENT & SCHOOL ACCOUNTABILITY / Property Taxes in New York State 15
Fairness Issues
A common complaint about the property tax is that it is unfair. This perception derives from a number of factors, including that property taxes are often considered regressive (the burden falls more heavily on lower-income taxpayers as a percentage of their income), and that home values may not accurately refl ect ability to pay – particularly for senior citizens or others of modest means living in homes that have appreciated substantially in value due to market changes.
Perceived and real inequities in the administration of the property tax also contribute to the poor public image of the tax. Inequitable practices can cause many taxpayers to challenge their assessments, and when major taxpayers achieve reductions through certiorari actions, it often has a signifi cant impact on the property tax base.
Since the property tax is based upon on a locally determined property valuation process, assessment quality varies throughout the State, and in many areas properties with similar market values can have very different assessments and tax bills. These disparities are frequently experienced where assessments have not been updated or reviewed for decades. Although national standards call for property revaluation every few years, State law does not effectively require jurisdictions to assess real property at market value, or in accordance with professional standards. The New York State Offi ce of Real Property Services (ORPS) – the State agency charged with overseeing assessment practices – produces detailed statistics and provides fi nancial and technical assistance programs to encourage good assessing practices, but it has no power to compel local assessors to use acceptable, modern appraisal methods. As a result, recent ORPS statistics show that only two-thirds of assessing jurisdictions are achieving satisfactory uniformity in residential assessments. Moreover, some of the biggest problems with assessments are found in the State’s most populous areas, including most of Westchester, Rockland and Suffolk counties.
A 1996 Interagency Task Force on Real Property Valuation recommended that assessment requirements be strengthened in New York State. Specifi cally, the Task Force recommended that State law be amended to require that all assessing jurisdictions assess real property at market value, in accordance with standards promulgated by national standard-setting agencies – including updated assessments on a regular cycle, not to exceed four years. Unfortunately, these recommendations have never been acted upon.
Conclusion
New York’s property tax is large and growing fast, as it tends to do when growth slows in other revenues or costs increase for local governments. The property tax is stable and easy to administer, but it has some serious fl aws, including a weak system for ensuring professional and equitable assessments. STAR and related rebates will not fi x these fl aws, and may indeed magnify them, as they may encourage growth in spending, particularly in higher-wealth, higher-spending areas. A rebate payment or State-funded tax exemption is a transfer of tax burden, not a tax cut, and should be considered in the context of overall tax policy in New York. While short-term property tax relief may be the perceived effect, the long-term outcome may well be an overall increase in State and local taxes. Future research and policy analysis should be directed toward structural changes and systemic reforms for the property tax.

Property Taxes in New York State / OFFICE OF THE STATE COMPTROLLER16
County Total Change1995 2000 2005 1995-2000 2000-2005 1995-2005
Albany 348,090,412 399,149,026 537,749,699 2.8% 6.1% 54.5%Allegany 41,912,988 49,150,519 69,536,036 3.2% 7.2% 65.9%Broome 223,218,218 227,770,857 297,141,606 0.4% 5.5% 33.1%Cattaraugus 73,266,806 84,207,184 113,478,970 2.8% 6.1% 54.9%Cayuga 63,053,359 70,266,266 102,218,509 2.2% 7.8% 62.1%Chautauqua 149,217,131 153,567,791 198,938,514 0.6% 5.3% 33.3%Chemung 74,196,456 81,632,379 106,278,505 1.9% 5.4% 43.2%Chenango 48,225,968 52,206,765 70,883,212 1.6% 6.3% 47.0%Clinton 59,821,084 69,520,406 107,320,456 3.1% 9.1% 79.4%Columbia 73,973,113 89,637,984 124,541,401 3.9% 6.8% 68.4%Cortland 40,050,573 45,207,200 66,009,806 2.5% 7.9% 64.8%Delaware 61,415,164 69,535,444 97,605,357 2.5% 7.0% 58.9%Dutchess 345,457,236 396,036,780 567,363,209 2.8% 7.5% 64.2%Erie 1,029,638,302 1,082,685,560 1,250,058,503 1.0% 2.9% 21.4%Essex 51,533,821 59,649,056 88,449,957 3.0% 8.2% 71.6%Franklin 43,541,708 48,961,799 70,495,893 2.4% 7.6% 61.9%Fulton 54,798,495 60,208,832 80,545,923 1.9% 6.0% 47.0%Genesee 56,453,457 63,210,412 83,881,924 2.3% 5.8% 48.6%Greene 61,846,608 69,865,699 98,662,027 2.5% 7.1% 59.5%Hamilton 19,749,434 22,073,033 31,249,726 2.2% 7.2% 58.2%Herkimer 59,542,466 66,424,680 87,498,431 2.2% 5.7% 47.0%Jefferson 81,961,692 91,502,059 116,505,443 2.2% 5.0% 42.1%Lewis 24,455,098 27,127,770 35,534,246 2.1% 5.5% 45.3%Livingston 54,802,325 63,474,758 87,397,953 3.0% 6.6% 59.5%Madison 62,218,608 73,286,456 101,702,662 3.3% 6.8% 63.5%Monroe 879,334,589 962,332,598 1,283,656,553 1.8% 5.9% 46.0%Montgomery 46,310,633 50,553,858 71,469,909 1.8% 7.2% 54.3%Nassau 2,890,366,265 3,579,381,927 5,053,266,951 4.4% 7.1% 74.8%Niagara 238,428,613 264,471,570 332,414,651 2.1% 4.7% 39.4%Oneida 216,560,385 224,708,623 278,829,690 0.7% 4.4% 28.8%Onondaga 557,667,780 572,266,822 733,051,340 0.5% 5.1% 31.4%Ontario 107,574,845 129,950,263 177,968,954 3.9% 6.5% 65.4%Orange 399,483,265 492,604,554 768,973,282 4.3% 9.3% 92.5%Orleans 35,436,748 41,654,668 57,911,577 3.3% 6.8% 63.4%Oswego 191,855,773 155,221,424 167,620,503 -4.1% 1.5% -12.6%Otsego 54,845,388 63,065,395 79,566,138 2.8% 4.8% 45.1%Putnam 166,492,853 200,040,534 295,473,963 3.7% 8.1% 77.5%Rensselaer 154,082,793 175,697,596 244,276,036 2.7% 6.8% 58.5%Rockland 562,962,635 672,460,476 928,095,253 3.6% 6.7% 64.9%St Lawrence 87,851,526 99,846,472 137,748,231 2.6% 6.6% 56.8%Saratoga 203,979,035 245,860,729 348,809,099 3.8% 7.2% 71.0%Schenectady 175,056,098 189,638,026 269,140,403 1.6% 7.3% 53.7%Schoharie 33,787,259 39,518,767 56,018,791 3.2% 7.2% 65.8%Schuyler 15,891,770 16,208,692 24,475,612 0.4% 8.6% 54.0%Seneca 28,693,670 32,042,888 47,833,907 2.2% 8.3% 66.7%Steuben 88,622,593 100,466,823 139,604,749 2.5% 6.8% 57.5%Suffolk 2,600,072,201 3,006,358,037 4,259,018,044 2.9% 7.2% 63.8%Sullivan 125,514,012 140,593,862 192,578,939 2.3% 6.5% 53.4%Tioga 41,497,388 45,383,435 62,891,933 1.8% 6.7% 51.6%Tompkins 93,107,236 111,867,762 159,432,122 3.7% 7.3% 71.2%Ulster 245,896,634 278,949,999 401,963,043 2.6% 7.6% 63.5%Warren 81,087,934 95,271,256 131,784,420 3.3% 6.7% 62.5%Washington 57,924,621 63,878,178 94,322,997 2.0% 8.1% 62.8%Wayne 96,390,195 110,855,891 162,640,596 2.8% 8.0% 68.7%Westchester 1,989,429,770 2,332,165,426 3,328,384,768 3.2% 7.4% 67.3%Wyoming 31,306,988 36,512,122 47,681,274 3.1% 5.5% 52.3%Yates 26,119,728 30,081,026 39,204,897 2.9% 5.4% 50.1%New York City 7,889,768,851 8,374,300,959 12,720,048,530 1.2% 8.7% 61.2%
Statewide 23,615,840,596 26,450,569,373 37,687,205,123 2.3% 7.3% 59.6%Inflation (CPI-U) 2.5% 2.5% 28.1%
Average Annual Percent ChangeLevy
Overall Combined Levy by County, 1995-2005

DIVISION OF LOCAL GOVERNMENT & SCHOOL ACCOUNTABILITY / Property Taxes in New York State 17
County Total Change1995 2000 2005 1995-2000 2000-2005 1995-2005
Albany 13,709,908,000 13,734,724,233 17,690,980,288 0.0% 5.2% 29.0%Allegany 1,105,653,411 1,298,618,151 1,416,980,291 3.3% 1.8% 28.2%Broome 6,578,138,745 5,719,987,594 6,800,046,810 -2.8% 3.5% 3.4%Cattaraugus 2,184,956,783 2,533,181,848 2,923,918,790 3.0% 2.9% 33.8%Cayuga 2,366,267,180 2,444,740,237 2,946,905,130 0.7% 3.8% 24.5%Chautauqua 3,931,635,856 4,750,005,449 5,323,987,735 3.9% 2.3% 35.4%Chemung 2,342,182,592 2,504,443,051 3,014,899,674 1.3% 3.8% 28.7%Chenango 1,285,524,143 1,294,223,889 1,558,582,812 0.1% 3.8% 21.2%Clinton 2,342,796,794 2,600,643,286 3,275,754,361 2.1% 4.7% 39.8%Columbia 3,452,029,779 3,415,636,366 4,946,971,215 -0.2% 7.7% 43.3%Cortland 1,307,628,035 1,361,183,342 1,563,968,253 0.8% 2.8% 19.6%Delaware 2,646,071,911 2,765,106,153 3,472,106,198 0.9% 4.7% 31.2%Dutchess 14,132,514,687 14,039,760,281 24,880,843,128 -0.1% 12.1% 76.1%Erie 30,687,612,139 31,749,141,509 35,980,745,078 0.7% 2.5% 17.2%Essex 2,766,465,637 2,912,934,358 3,900,035,320 1.0% 6.0% 41.0%Franklin 1,663,792,036 1,780,444,643 2,255,015,867 1.4% 4.8% 35.5%Fulton 1,686,055,835 1,676,051,987 2,031,701,941 -0.1% 3.9% 20.5%Genesee 1,734,065,017 1,883,721,508 2,118,730,154 1.7% 2.4% 22.2%Greene 2,810,142,323 2,695,753,048 3,436,679,462 -0.8% 5.0% 22.3%Hamilton 1,471,925,656 1,659,184,662 2,128,879,531 2.4% 5.1% 44.6%Herkimer 2,539,948,554 2,620,326,716 3,153,258,815 0.6% 3.8% 24.1%Jefferson 3,187,566,896 3,364,608,648 3,921,814,116 1.1% 3.1% 23.0%Lewis 889,752,939 941,789,380 1,116,921,518 1.1% 3.5% 25.5%Livingston 1,877,491,810 2,040,575,234 2,528,802,356 1.7% 4.4% 34.7%Madison 2,245,173,761 2,316,845,214 2,789,289,510 0.6% 3.8% 24.2%Monroe 27,675,874,420 28,286,004,142 32,434,344,827 0.4% 2.8% 17.2%Montgomery 1,257,642,275 1,306,866,508 1,457,421,235 0.8% 2.2% 15.9%Nassau 95,159,458,696 115,091,989,297 193,592,283,345 3.9% 11.0% 103.4%Niagara 7,187,171,335 7,282,271,596 7,921,705,176 0.3% 1.7% 10.2%Oneida 6,959,003,753 6,358,504,033 7,361,263,377 -1.8% 3.0% 5.8%Onondaga 15,887,330,872 15,978,621,763 19,003,054,235 0.1% 3.5% 19.6%Ontario 4,095,286,166 4,428,699,224 5,726,960,880 1.6% 5.3% 39.8%Orange 14,926,107,792 16,142,878,467 28,223,656,673 1.6% 11.8% 89.1%Orleans 1,037,340,961 1,160,350,782 1,326,265,829 2.3% 2.7% 27.9%Oswego 6,395,647,033 5,310,327,928 4,009,547,266 -3.7% -5.5% -37.3%Otsego 2,101,917,111 2,227,436,702 2,738,700,307 1.2% 4.2% 30.3%Putnam 6,276,047,197 7,011,966,601 12,567,889,064 2.2% 12.4% 100.3%Rensselaer 5,174,582,350 5,149,959,155 6,538,315,865 -0.1% 4.9% 26.4%Rockland 17,715,191,714 20,462,986,529 33,775,416,256 2.9% 10.5% 90.7%St Lawrence 2,918,584,716 3,333,926,562 3,774,653,091 2.7% 2.5% 29.3%Saratoga 8,347,471,986 9,166,882,190 13,803,606,677 1.9% 8.5% 65.4%Schenectady 5,503,016,725 5,379,330,845 6,763,200,999 -0.5% 4.7% 22.9%Schoharie 1,273,669,731 1,263,609,188 1,468,438,084 -0.2% 3.1% 15.3%Schuyler 569,434,838 628,207,146 776,886,480 2.0% 4.3% 36.4%Seneca 1,085,439,790 1,129,644,649 1,257,400,515 0.8% 2.2% 15.8%Steuben 2,881,759,164 3,155,499,730 3,736,813,595 1.8% 3.4% 29.7%Suffolk 85,858,798,711 107,766,704,405 217,940,801,707 4.7% 15.1% 153.8%Sullivan 4,356,940,944 4,090,397,675 5,489,210,134 -1.3% 6.1% 26.0%Tioga 1,392,287,398 1,403,663,356 1,803,681,223 0.2% 5.1% 29.5%Tompkins 3,612,193,986 3,566,329,088 4,612,905,463 -0.3% 5.3% 27.7%Ulster 8,292,880,571 8,400,004,054 13,987,639,143 0.3% 10.7% 68.7%Warren 4,289,516,763 4,765,749,876 6,693,888,554 2.1% 7.0% 56.1%Washington 2,061,310,193 2,240,954,216 2,746,515,923 1.7% 4.2% 33.2%Wayne 3,107,552,764 3,391,056,534 3,997,515,036 1.8% 3.3% 28.6%Westchester 66,092,888,757 81,833,024,754 148,771,978,996 4.4% 12.7% 125.1%Wyoming 1,152,516,280 1,368,644,621 1,586,491,763 3.5% 3.0% 37.7%Yates 1,076,599,432 1,121,096,856 1,510,001,807 0.8% 6.1% 40.3%New York City 279,791,477,839 304,721,872,278 490,816,324,579 1.7% 10.0% 75.4%
Statewide 806,458,242,782 899,029,091,537 1,433,392,596,457 2.2% 9.8% 77.7%Inflation (CPI-U) 2.5% 2.5% 28.1%
Average Annual Percent ChangeFull Value
Full Value by County, 1995-2005
Property Taxes in New York State / OFFICE OF THE STATE COMPTROLLER18
County Total Change1995 2000 2005 1995-2000 2000-2005 1995-2005
Albany 25.39 29.06 30.40 2.7% 0.9% 19.7%Allegany 37.91 37.85 49.07 0.0% 5.3% 29.5%Broome 33.93 39.82 43.70 3.3% 1.9% 28.8%Cattaraugus 33.53 33.24 38.81 -0.2% 3.1% 15.7%Cayuga 26.65 28.74 34.69 1.5% 3.8% 30.2%Chautauqua 37.95 32.33 37.37 -3.2% 2.9% -1.5%Chemung 31.68 32.60 35.25 0.6% 1.6% 11.3%Chenango 37.51 40.34 45.48 1.5% 2.4% 21.2%Clinton 25.53 26.73 32.76 0.9% 4.2% 28.3%Columbia 21.43 26.24 25.18 4.1% -0.8% 17.5%Cortland 30.63 33.21 42.21 1.6% 4.9% 37.8%Delaware 23.21 25.15 28.11 1.6% 2.3% 21.1%Dutchess 24.44 28.21 22.80 2.9% -4.2% -6.7%Erie 33.55 34.10 34.74 0.3% 0.4% 3.5%Essex 18.63 20.48 22.68 1.9% 2.1% 21.7%Franklin 26.17 27.50 31.26 1.0% 2.6% 19.5%Fulton 32.50 35.92 39.64 2.0% 2.0% 22.0%Genesee 32.56 33.56 39.59 0.6% 3.4% 21.6%Greene 22.01 25.92 28.71 3.3% 2.1% 30.4%Hamilton 13.42 13.30 14.68 -0.2% 2.0% 9.4%Herkimer 23.44 25.35 27.75 1.6% 1.8% 18.4%Jefferson 25.71 27.20 29.71 1.1% 1.8% 15.5%Lewis 27.49 28.80 31.81 0.9% 2.0% 15.8%Livingston 29.19 31.11 34.56 1.3% 2.1% 18.4%Madison 27.71 31.63 36.46 2.7% 2.9% 31.6%Monroe 31.77 34.02 39.58 1.4% 3.1% 24.6%Montgomery 36.82 38.68 49.04 1.0% 4.9% 33.2%Nassau 30.37 31.10 26.10 0.5% -3.4% -14.1%Niagara 33.17 36.32 41.96 1.8% 2.9% 26.5%Oneida 31.12 35.34 37.88 2.6% 1.4% 21.7%Onondaga 35.10 35.81 38.58 0.4% 1.5% 9.9%Ontario 26.27 29.34 31.08 2.2% 1.2% 18.3%Orange 26.76 30.52 27.25 2.7% -2.2% 1.8%Orleans 34.16 35.90 43.67 1.0% 4.0% 27.8%Oswego 30.00 29.23 41.81 -0.5% 7.4% 39.4%Otsego 26.09 28.31 29.05 1.6% 0.5% 11.3%Putnam 26.53 28.53 23.51 1.5% -3.8% -11.4%Rensselaer 29.78 34.12 37.36 2.8% 1.8% 25.5%Rockland 31.78 32.86 27.48 0.7% -3.5% -13.5%St Lawrence 30.10 29.95 36.49 -0.1% 4.0% 21.2%Saratoga 24.44 26.82 25.27 1.9% -1.2% 3.4%Schenectady 31.81 35.25 39.79 2.1% 2.5% 25.1%Schoharie 26.53 31.27 38.15 3.3% 4.1% 43.8%Schuyler 27.91 25.80 31.50 -1.6% 4.1% 12.9%Seneca 26.44 28.37 38.04 1.4% 6.0% 43.9%Steuben 30.75 31.84 37.36 0.7% 3.2% 21.5%Suffolk 30.28 27.90 19.54 -1.6% -6.9% -35.5%Sullivan 28.81 34.37 35.08 3.6% 0.4% 21.8%Tioga 29.81 32.33 34.87 1.6% 1.5% 17.0%Tompkins 25.78 31.37 34.56 4.0% 2.0% 34.1%Ulster 29.65 33.21 28.74 2.3% -2.9% -3.1%Warren 18.90 19.99 19.69 1.1% -0.3% 4.1%Washington 28.10 28.50 34.34 0.3% 3.8% 22.2%Wayne 31.02 32.69 40.69 1.1% 4.5% 31.2%Westchester 30.10 28.50 22.37 -1.1% -4.7% -25.7%Wyoming 27.16 26.68 30.05 -0.4% 2.4% 10.6%Yates 24.26 26.83 25.96 2.0% -0.7% 7.0%New York City 28.20 27.48 25.92 -0.5% -1.2% -8.1%
Statewide 29.28 29.42 26.29 0.1% -2.2% -10.2%Median 29.00 30.81 34.56 1.4% 2.0% 19.6%Inflation (CPI-U) 2.5% 2.5% 28.1%
Average Annual Percent ChangeFull Value Tax Rate
Overall Combined Full Value Tax Rate by County, 1995-2005
DIVISION OF LOCAL GOVERNMENT & SCHOOL ACCOUNTABILITY / Property Taxes in New York State 19
CountyAmount Index Amount Index Amount % of Income Amount % of Income
Albany $146,798 130 $42,935 115 $1,180 18.2% $977 15.1%Allegany $78,682 69 $32,106 86 $734 17.1% $618 14.4%Broome $84,212 74 $35,347 95 $895 17.0% $741 14.1%Cattaraugus $91,307 81 $33,404 89 $768 17.0% $646 14.3%Cayuga $96,436 85 $37,487 100 $921 18.8% $762 15.6%Chautauqua $97,661 86 $33,458 90 $802 17.8% $659 14.6%Chemung $86,020 76 $36,415 97 $870 18.2% $720 15.1%Chenango $78,219 69 $33,679 90 $820 17.1% $689 14.4%Clinton $111,333 98 $37,028 99 $926 17.1% $805 14.9%Columbia $199,507 176 $41,915 112 $1,099 19.1% $909 15.8%Cortland $85,885 76 $34,364 92 $894 18.9% $727 15.4%Delaware $180,182 159 $32,461 87 $825 17.4% $708 14.9%Dutchess $249,968 221 $53,086 142 $1,398 20.2% $1,131 16.3%Erie $94,469 83 $38,567 103 $1,053 19.1% $839 15.2%Essex $259,518 229 $34,823 93 $817 17.2% $709 14.9%Franklin $125,761 111 $31,517 84 $750 17.0% $635 14.4%Fulton $92,840 82 $33,663 90 $854 18.4% $698 15.0%Genesee $93,049 82 $40,542 108 $967 18.9% $780 15.2%Greene $188,249 166 $36,493 98 $991 19.2% $831 16.1%Hamilton $901,304 796 $32,287 86 $776 15.6% $688 13.8%Herkimer $122,533 108 $32,924 88 $812 17.3% $686 14.6%Jefferson $97,879 86 $34,006 91 $842 18.0% $718 15.4%Lewis $111,247 98 $34,361 92 $735 16.1% $639 14.0%Livingston $114,167 101 $42,066 113 $1,037 19.4% $843 15.8%Madison $109,953 97 $40,184 108 $967 18.8% $792 15.4%Monroe $113,204 100 $44,891 120 $1,122 19.5% $891 15.5%Montgomery $72,733 64 $32,128 86 $902 18.5% $738 15.1%Nassau $432,718 382 $72,030 193 $1,903 22.3% $1,430 16.8%Niagara $90,177 80 $38,136 102 $985 18.9% $788 15.1%Oneida $81,344 72 $35,909 96 $942 17.8% $768 14.5%Onondaga $104,901 93 $40,847 109 $1,048 18.8% $829 14.9%Ontario $149,256 132 $44,579 119 $1,076 19.4% $877 15.8%Orange $245,876 217 $52,058 139 $1,405 21.2% $1,115 16.8%Orleans $86,329 76 $37,972 102 $909 19.5% $732 15.7%Oswego $88,079 78 $36,598 98 $914 18.1% $782 15.5%Otsego $117,586 104 $33,444 89 $857 18.3% $724 15.5%Putnam $384,304 339 $72,279 193 $1,751 22.7% $1,340 17.4%Rensselaer $109,165 96 $42,905 115 $1,123 18.8% $911 15.3%Rockland $364,450 322 $67,971 182 $1,924 22.2% $1,458 16.8%St Lawrence $176,596 156 $32,356 87 $746 16.2% $643 14.0%Saratoga $113,317 100 $49,460 132 $1,200 19.3% $994 16.0%Schenectady $122,462 108 $41,739 112 $1,110 18.9% $886 15.1%Schoharie $105,355 93 $36,585 98 $916 19.2% $770 16.1%Schuyler $99,557 88 $36,010 96 $850 17.7% $723 15.1%Seneca $93,188 82 $37,140 99 $892 18.2% $745 15.2%Steuben $95,642 84 $35,479 95 $838 16.8% $707 14.2%Suffolk $464,396 410 $65,288 175 $1,663 23.3% $1,258 17.6%Sullivan $198,446 175 $36,998 99 $1,068 20.8% $874 17.0%Tioga $91,441 81 $40,266 108 $930 17.8% $774 14.8%Tompkins $126,659 112 $37,272 100 $1,094 19.2% $879 15.4%Ulster $207,227 183 $42,551 114 $1,149 19.6% $937 16.0%Warren $260,199 230 $39,198 105 $993 19.3% $844 16.4%Washington $122,296 108 $37,668 101 $909 19.3% $751 15.9%Wayne $114,516 101 $44,157 118 $1,020 19.8% $823 16.0%Westchester $441,274 390 $63,582 170 $2,372 21.8% $1,803 16.6%Wyoming $106,433 94 $39,895 107 $865 18.7% $721 15.6%Yates $167,239 148 $34,640 93 $831 19.0% $686 15.7%New York City $162,437 143 $38,293 102 $1,562 22.2% $1,438 20.4%
Statewide $203,120 $43,393 $1,357 20.4% $1,120 16.8%Median $113,260 $37,380 $928 18.8% $777 15.4%
Total Other than Real Estate Taxes
Measures of Income and Housing Costs from Decennial Census, 1999Selected Monthly Mortgage-Paying Homeowner ExpensesFull Value Per
Household 2005Household
Median Income
Measures of Ability to Pay, by County

Property Taxes in New York State / OFFICE OF THE STATE COMPTROLLER20
County Amount Index Amount Index Amount Index Amount % Median Income
Albany $1,802 120 $4,462 112 $45.57 86 $2,440 5.7%Allegany $1,375 92 $3,861 97 $62.45 117 $1,398 4.4%Broome $1,503 100 $3,680 93 $51.24 96 $1,843 5.2%Cattaraugus $1,364 91 $3,544 89 $50.46 95 $1,461 4.4%Cayuga $1,248 83 $3,345 84 $44.64 84 $1,903 5.1%Chautauqua $1,449 96 $3,649 92 $57.67 108 $1,720 5.1%Chemung $1,181 79 $3,032 76 $43.21 81 $1,803 5.0%Chenango $1,367 91 $3,557 89 $53.27 100 $1,575 4.7%Clinton $1,311 87 $3,648 92 $48.11 90 $1,447 3.9%Columbia $1,956 130 $5,023 126 $61.79 116 $2,284 5.4%Cortland $1,347 90 $3,625 91 $53.22 100 $2,004 5.8%Delaware $2,062 137 $5,065 127 $79.29 149 $1,407 4.3%Dutchess $1,934 129 $5,700 143 $53.36 100 $3,202 6.0%Erie $1,335 89 $3,282 83 $39.79 75 $2,573 6.7%Essex $2,274 151 $5,886 148 $86.38 162 $1,296 3.7%Franklin $1,382 92 $3,932 99 $61.29 115 $1,377 4.4%Fulton $1,452 97 $3,681 93 $51.78 97 $1,867 5.5%Genesee $1,405 94 $3,684 93 $49.43 93 $2,246 5.5%Greene $2,006 133 $5,404 136 $68.70 129 $1,915 5.2%Hamilton $5,979 398 $13,230 333 $205.95 386 $1,056 3.3%Herkimer $1,370 91 $3,400 85 $54.18 102 $1,510 4.6%Jefferson $1,045 70 $2,908 73 $36.82 69 $1,485 4.4%Lewis $1,338 89 $3,539 89 $57.92 109 $1,155 3.4%Livingston $1,348 90 $3,946 99 $50.77 95 $2,334 5.5%Madison $1,444 96 $4,009 101 $50.04 94 $2,106 5.2%Monroe $1,746 116 $4,471 112 $46.75 88 $2,768 6.2%Montgomery $1,450 97 $3,567 90 $49.70 93 $1,966 6.1%Nassau $3,772 251 $11,295 284 $67.04 126 $5,677 7.9%Niagara $1,524 101 $3,784 95 $52.26 98 $2,359 6.2%Oneida $1,187 79 $3,081 77 $42.30 79 $2,083 5.8%Onondaga $1,594 106 $4,047 102 $46.94 88 $2,633 6.4%Ontario $1,719 114 $4,638 117 $53.75 101 $2,386 5.4%Orange $2,076 138 $6,699 168 $65.20 122 $3,476 6.7%Orleans $1,312 87 $3,770 95 $55.78 105 $2,125 5.6%Oswego $1,354 90 $3,682 93 $53.44 100 $1,587 4.3%Otsego $1,273 85 $3,416 86 $50.17 94 $1,598 4.8%Putnam $2,938 196 $9,035 227 $67.18 126 $4,938 6.8%Rensselaer $1,585 106 $4,078 103 $49.10 92 $2,543 5.9%Rockland $3,161 210 $10,015 252 $67.94 127 $5,591 8.2%St Lawrence $1,238 82 $3,401 85 $53.33 100 $1,241 3.8%Saratoga $1,640 109 $4,462 112 $46.76 88 $2,478 5.0%Schenectady $1,818 121 $4,509 113 $51.48 97 $2,688 6.4%Schoharie $1,750 116 $4,672 117 $66.51 125 $1,754 4.8%Schuyler $1,255 84 $3,319 83 $50.17 94 $1,522 4.2%Seneca $1,364 91 $3,787 95 $50.67 95 $1,765 4.8%Steuben $1,413 94 $3,573 90 $48.60 91 $1,567 4.4%Suffolk $2,887 192 $9,001 226 $67.82 127 $4,864 7.5%Sullivan $2,530 168 $6,962 175 $83.98 158 $2,324 6.3%Tioga $1,220 81 $3,188 80 $44.22 83 $1,877 4.7%Tompkins $1,592 106 $4,378 110 $55.02 103 $2,575 6.9%Ulster $2,211 147 $5,955 150 $73.67 138 $2,543 6.0%Warren $2,023 135 $5,123 129 $64.04 120 $1,784 4.6%Washington $1,502 100 $4,200 106 $61.63 116 $1,895 5.0%Wayne $1,733 115 $4,659 117 $59.92 112 $2,364 5.4%Westchester $3,532 235 $9,776 246 $56.36 106 $6,826 10.7%Wyoming $1,109 74 $3,199 80 $45.00 84 $1,732 4.3%Yates $1,589 106 $4,342 109 $68.60 129 $1,741 5.0%New York City $1,570 104 $4,210 106 $37.06 70 $1,492 3.9%
Statewide $2,022 $5,341 $48.32 $2,847 6.6%Median $1,502 $3,977 $53.30 $1,909 5.2%
Median Real Estate Taxes Paid, 1999
Levy Per $1000 of Personal Income,
2005Levy Per Capita,
2005Levy Per
Household, 2005
Alternative Measures of Overall Property Tax Burden, by County

DIVISION OF LOCAL GOVERNMENT & SCHOOL ACCOUNTABILITY / Property Taxes in New York State 21
Notes on Data
OSC collects data from counties, cities, towns, villages and special districts (including fi re districts) on tax levies and assessed valuation. Counties, cities and villages must fi le levy and assessment information to OSC to ensure that these entities do not exceed their constitutional tax limits, and town information on those items is provided to OSC on towns and special districts through a separate survey of counties. OSC collaborates with the State Education Department (SED) and the Offi ce of Real Property Services (ORPS) to collect data on school district levies as well. The data thus collected, along with equalization rate information from ORPS, allowed OSC to conduct most of the analysis in this report. Annually, OSC compiles these data to produce its Overlapping Real Property Tax Rates and Levies tables, available on the OSC website at: www.osc.state.ny.us/localgov/orptbook/taxrates.htm. The county tables in this report differ slightly from the county summaries in these tables, due to treatment of school districts that overlap county bounderies.
OSC also collects data on revenue and expenditures, along with other items, for all classes of government. This information is presented in its Financial Data for Local Governments series, at www.osc.state.ny.us/localgov/datanstat/fi ndata/index_choice.htm.
Legally, as well as practically, STAR is a component of the school property tax levy. In fact, the value of STAR exemptions cannot even be known until the school property tax is levied (because its calculation is dependent on the tax rate). As such, STAR reimbursements have always been included in the property tax levy data published by the State Comptroller’s Offi ce and other State agencies. However, STAR revenues are deducted in a number of comparisons, including the interstate property tax comparisons as well as (where specifi cally indicated) other data presented in this report.
In addition to OSC’s own data sources, this report made use of data collected by the following Federal entities and other sources:
Bureau of Labor Statistics (BLS):• o Infl ation rate (consumer price index – all urban consumers)
Bureau of Economic Analysis (BEA):• o Personal income by county through 2003, estimates of 2004 and 2005 derived from Statewide
numbers through fi rst quarter of 2005
Census Bureau county-level data, decennial census:• o Number of households, 2000o Median income, 1999o Median household costs, 1999o Median real estate taxes paid, 1999o Population 2000 (also estimates for 2004)
• Rockefeller Institute: Rankings of tax burden per $100 of personal income (converted to $1,000 of personal income) and per capita computed from Census and BEA data

New York StateOffi ce of the State ComptrollerDivision of Local Government
and School Accountability
For additional copies of this report contact:
New York State Comptroller’s Offi ceDivision of Local Government and School Accountability110 State Street, 12th fl oorAlbany, New York 12236 (518) 474- 6975
www.osc.state.ny.us