Embed Size (px)
Citation preview
Report Prepared by
SRK Exploration Services Ltd
ES 7536
PROPERTY VALUATION FOR THE BLUE HORIZON EXPLORATION LICENCE
(EL54/2011), SIERRA LEONE
Prepared For
Sula Iron & Gold plc
190 High Street Tonbridge
Kent TN9 1BE
Report Author Report Reviewer
Gareth O‟Donovan William Kellaway
Blue Horizon Property Valuation
Final_Blue Horizon Property valuation update 2014_v8_DJM.docx January 2014 Page 2 of 30
COPYRIGHT AND DISCLAIMER
Copyright (and any other applicable intellectual property rights) in this document and any
accompanying data or models is reserved by SRK Exploration Services Limited ("SRK ES") and
is protected by international copyright and other laws. The use of this document is strictly subject
to terms licensed by SRK ES to its client as the recipient of this Proposal and unless otherwise
agreed by SRK ES, this does not grant rights to any third party. This document may not be
reproduced or circulated in the public domain (in whole or in part) or in any edited, abridged or
otherwise amended form unless expressly agreed by SRK ES. This document may not be
utilised or relied upon for any purpose other than that for which it is stated within and SRK ES
shall not be liable for any loss or damage caused by such use or reliance.
SRK ES respects the general confidentiality of its clients‟ confidential information whether formally
agreed with clients or not. See the attached Terms and Conditions as included in the
Commercial Appendices contain mutual confidentiality obligations upon SRK ES and the Client.
The contents of this Proposal should be treated as confidential by the Client. The Client may not
release the technical and pricing information contained in this Proposal or any other documents
submitted by SRK ES to the Client, or otherwise make it available to any third party without the
express written consent of SRK ES.
Client Feedback
We merit all comments received from our clients, take pride in providing an excellent service and place value on our ability to correct error. Should you wish to comment on any aspect of the service that an individual staff member has provided, or else the company as a whole, please feedback a reply to the email address [email protected], or if appropriate else write in confidence to our Managing Director at the address above.
© SRK Exploration Services Ltd 2014
SRK ES Legal Entity: SRK Exploration Services Ltd
SRK ES Address:
12 St Andrew‟s Crescent Cardiff
CF10 3DD.
Date: January 2014
Project Number: ES 7536
SRK ES Project Manager: Gareth O‟Donovan Principal Exploration Geologist
Client Legal Entity: Sula Iron & Gold plc
Client Address:
190 High Street Tonbridge
Kent TN9 1BE
Blue Horizon Property Valuation – Executive Summary
Final_Blue Horizon Property valuation update 2014_v8_DJM.docx January 2014 Page 3 of 30
Executive Summary
The Blue Horizon (SL) Ltd licence EL54/2011 covers an area of 153 km2 and is located in the
central part of the Sula Mountains of Sierra Leone; an elongated chain some 120 km long by
16 km wide which forms an open, northerly-trending arc and contains Sierra Leone`s richest
and most historic gold fields.
The geology of the area consists of a broad north-easterly trending band of ultramafic rocks,
juxtaposed against amphibolites, which contain horizons of banded iron formation to the
southeast. An intrusive granite occurs in the south-eastern corner of the licence and a
northeast-trending shear brings metasediments (possibly tectonic schists) into contact with
syn-kinematic granites.
Gold
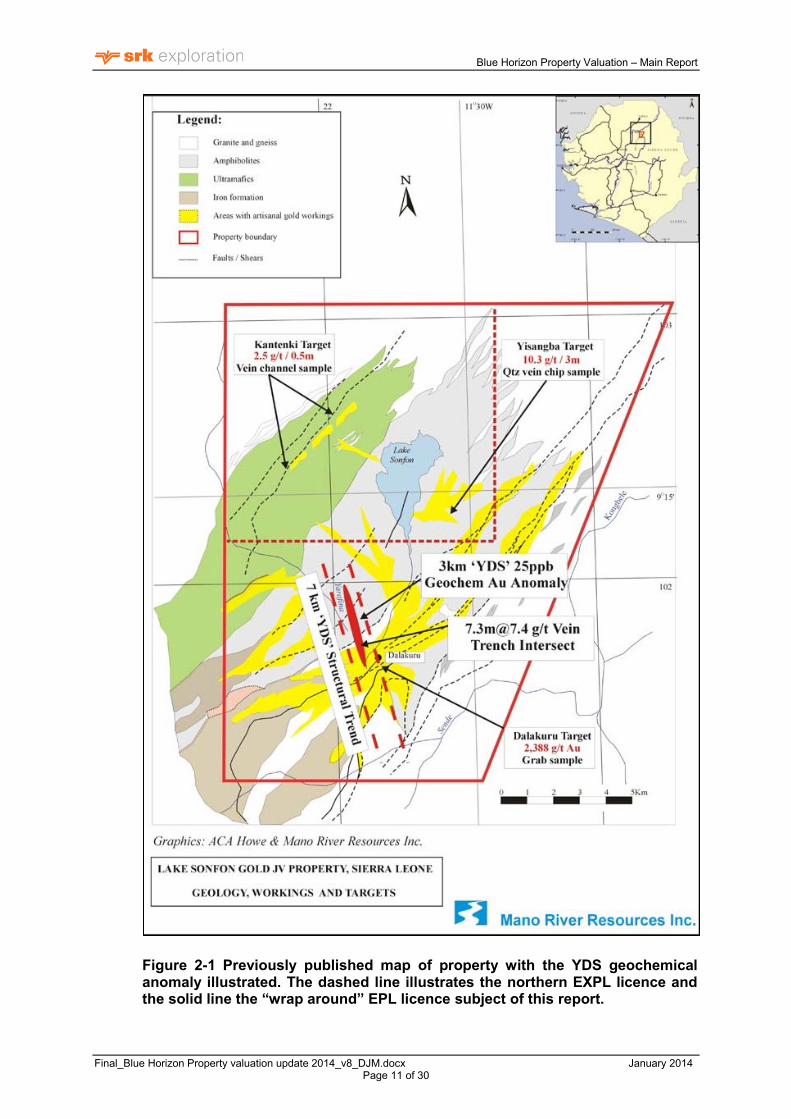
The area has numerous artisanal gold workings lying within a prominent structure
approximately 9 km long and 5 km wide, refered to previously as the Yanfarina-Dalakuru-
Sende (YDS) gold zone. Historical trenching in this zone identified a series of northwest
trending high grade tourmaline and gold-bearing narrow veins (stockworks) of 0.1-1 m width
and 75 m of strike length. Grades range from 0.2 to 108 g/t Au and with an average grade of
5.97 g/t Au.
Drilling in 1969 reportedly intersected an 85 m wide zone of sulphide mineralization (2-3 %
sulphides). Two geophysical anomalies were also reportedly identified at that time, coincident
with the geochemical anomaly at a depth 45-60 m continuing for over 2,000 m to the north.
Further drilling in 2008, also intersected high grade zones of massive sulphides, and ground
geophysical IP surveys conducted in 2010 to follow-up the results of the 2008, reportedly
generated several other new targets.
In excess of 5,000 m core diamond drilling was completed by previous owners and though
detailed results of this drilling have not been located, significant intersections have been
commented on in various reports and SRK ES has viewed some of the old cores.
Several other deposits have been located and delineated in the region since the start of
exploration at Dalakuru. SRK ES considers the exploration model of mesothermal shear zone
gold to be a reasonable model and the target of 250,000 – 400,000 ounces of gold to be an
achievable target.
Iron
During the production of the CPR for the AIM listing documents, airborne magnetic data
published by AML, who own the licence to the south, revealed the extension of a magnetic
anomaly, thought to be a BIF, into the Sula Licence. Thus, in early 2012 Sula conducted a
ground magnetic survey over the main BIF target zone in the SW corner of the licence area.
This work confirmed the prescence of a BIF and the exploration model for the Iron was a
target of 500Mt of BIF or above.
In April 2013 Sula conducted a reconnaissance drilling campaign over the BIF target area
defined by the ground magnetic survey, this programme totalled 2000 m from 9 holes, clearly
outlining a robust zone of BIF extending up to 3km to a depth of 150 m plus and with a
thickness exceeding 100 m.

Blue Horizon Property Valuation – Executive Summary
Final_Blue Horizon Property valuation update 2014_v8_DJM.docx January 2014 Page 4 of 30
The scale of the first phase drilling was constrained by budget. SRK ES has outlined a 2nd
phase of drilling designed to cover the remaining strike extent of the Target BIF zone and be
sufficient to allow a Resource Estimate to be calculated. In addition to this a short hole
programme has been designed to delineate a resource for the potential of DSO.
Blue Horizon Property Valuation – Table of Contents
Final_Blue Horizon Property valuation update 2014_v8_DJM.docx January 2014 Page 5 of 30
Table of Contents
1 Introduction 7 1.1 Disclaimer 8
2 Sierra Leone 8 2.1 Mining Law in Sierra Leone 8 2.2 Royalties, Back-in rights, payments & Required Permits 8 2.3 Environmental Liabilities 12
3 Accessibility of the property 12
4 History of exploration 12 4.1 Gold exploration 12 4.2 Iron Exploration 13
5 Geology of Sierra Leone 17 5.1 Regional Geology 18
5.1.1 The Sula-Kangari Greenstone Belt 19 5.1.2 Structural Controls on the Sula-Kangari Greenstone Belt 21
6 Valuation 24 6.1 Approach 24 6.2 Project Status 24 6.3 Company Fit 25 6.4 Country Risk 25 6.5 Minimum Values 25 6.6 Potential Values 26 6.7 Technical Value 27
7 References 28
Blue Horizon Property Valuation – Table of Contents
Final_Blue Horizon Property valuation update 2014_v8_DJM.docx January 2014 Page 6 of 30
List of Figures
Figure 2-1 Previously published map of property with the YDS geochemical anomaly illustrated. The dashed line illustrates the northern EXPL licence and the solid line the “wrap around” EPL licence subject of this report. 11
Figure 4-1 locality plan of drill holes and geology of the main BIF zone, SIG 16 Figure 4-2 Cross section through the Main BIF target, SIG 16 Figure 5-1 Sierra Leone Regional Geology. Location of the Blue Horizon licence
area in solid black line. 17 Figure 5-2 Geology of the Sula–Kangari Greenstone Belt 20 Figure 5-3 Airborne Total Field Magnetic Survey at 100m Resolution (SLDC,
Tonkolili Iron Ore Region Preliminary Geophysical Investigation, 2006). 21 Figure 5-4 Geology and Structural Interpretation of SIG licence area and the YDS
and Dalakuru Au anomaly. 23
List of Tables
Table 2-1 Exploration and Mining Licence types issued by the Sierra Leone Government and Minerals Advisory Board 9
Table 4-1 Table of the Best Drilling Intersections 13 Table 4-2 Selected Channel sample results 14 Table 4-3 Phase I drilling best intersections** 15
SRK Exploration Services Registered Address:
21 Gold Tops,
Newport,
Gwent.
NP9 4PG
Offices in:
Africa
Asia
Australia
North America
South America
United Kingdom
15th January 2014
Property Valuation for the Blue Horizon Exploration
Licence (EL54/2011)
1 Introduction
SRK Exploration Services Ltd (SRK ES) has been commissioned by Mr. N. Warrell, CEO of
Sula Iron and Gold Ltd (SIG) to provide an updated technical valuation of the company‟s
exploration assets in Sierra Leone, namely Licence EL54/2011 held by a 100% subsidiary
company, Blue Horizon (SL) Ltd. The licence was previously reviewed in February 2012 and a
technical valuation was provided at that time. Since then SIG has conducted a drilling
campaign over the main iron target and undertaken some preliminary ground work over
several of the gold targets.
This report summarises the work conducted on the licence which is located in the Sula
Mountain region of Sierra Leone, which wraps around the “Lake Sonfon” mining licence
(Figure 2-1).
The majority of the early work conducted on the licence was the result of a joint venture
agreement between African Aura Mining Inc (AAM) (formerly Mano River Resources Inc) and
Golden Star Ltd. (GSR), under the umbrella of the “Sonfon JV gold project”. The work was
conducted under the EPL licence type which allows for prospecting for specific minerals only,
excluding sub surface work (e.g. drilling) unless stipulated in the agreement.
SRK ES has reviewed all of the historical data provided by Sula as well as public domain data.
In addition, SRK ES is familiar with Sierra Leone and has visited the property on a number of
occasions. SRK ES also designed and managed the collection of ground geophysical data
over the Iron and gold targets, designed and managed the drilling programme conducted on
the iron targets in the summer of 2013 and designed and managed the geochemical soil
sampling programme conducted in November 2013.
This valuation supersedes the valuation report written in February 2012 by SRK ES.
SRK Exploration Services Ltd 12 St Andrews Crescent, Cardiff, United Kingdom CF10 3DD
e-mail: [email protected]
URL: www.srkexploration.com
Tel: + 44 (0)29 20 233 233 Fax: + 44 (0)29 20 233 211
Blue Horizon Property Valuation – Main Report
Final_Blue Horizon Property valuation update 2014_v8_DJM.docx January 2014 Page 8 of 30
1.1 Disclaimer
The historical data presented in this report is a summary of the current available information
for the project and SRK ES has not been able to verify any of this information. Drill; cores from
previous drilling is available on site but in a very poor condition and thus of limited quantitative
value. SRK ES is responsible for the geological field work conducted on site between April
2013 and December 2013 and thus happy to accept responsibility for the data generated by
that work.
2 Sierra Leone
Sierra Leone is located in West Africa bordering the North Atlantic, between Guinea and
Liberia. The democracy is slowly being re-established after the civil war which lasted from
1991 to 2002. At the end of 2005 the military took over full responsibility for security, following
the departure of UN peacekeepers, and are increasingly developing as a guarantor of the
countries stability.
The new government`s priorities include furthering development, creating jobs and stamping
out endemic corruption. The legal system is based on English law and customary laws
indigenous to local tribes.
2.1 Mining Law in Sierra Leone
Mining and exploration in Sierra Leone is regulated by the Mines and Minerals Act of 2009,
which entirely replaced the Act of 1994, including major changes to how the sector is to be
governed. The new Act is more comprehensive and has a more balanced view between the
interests of investors and communities.
The Ministry of Mineral Resources (MMR) is responsible for the administration, licence
issuing, field monitoring and enforcement of Mineral Rights. Records are maintained at the
ministry in Freetown and in local, district level mining offices. The MMR includes two technical
divisions; the Mines Division and the Geological Survey Division.
The Mines Division administers the provisions of the Mines and Mineral Act, which include the
issue of all Mineral Rights upon the recommendation of the Mineral Advisory Board (MAB),
and the administration and supervision of all activities under these rights. The Geological
Survey Division provides advice to the MMR on all geological matters. It also compiles,
publishes and disseminates data and information concerning the geology and mineral
resources of Sierra Leone and supervises prospecting and mineral exploration activities in the
country.
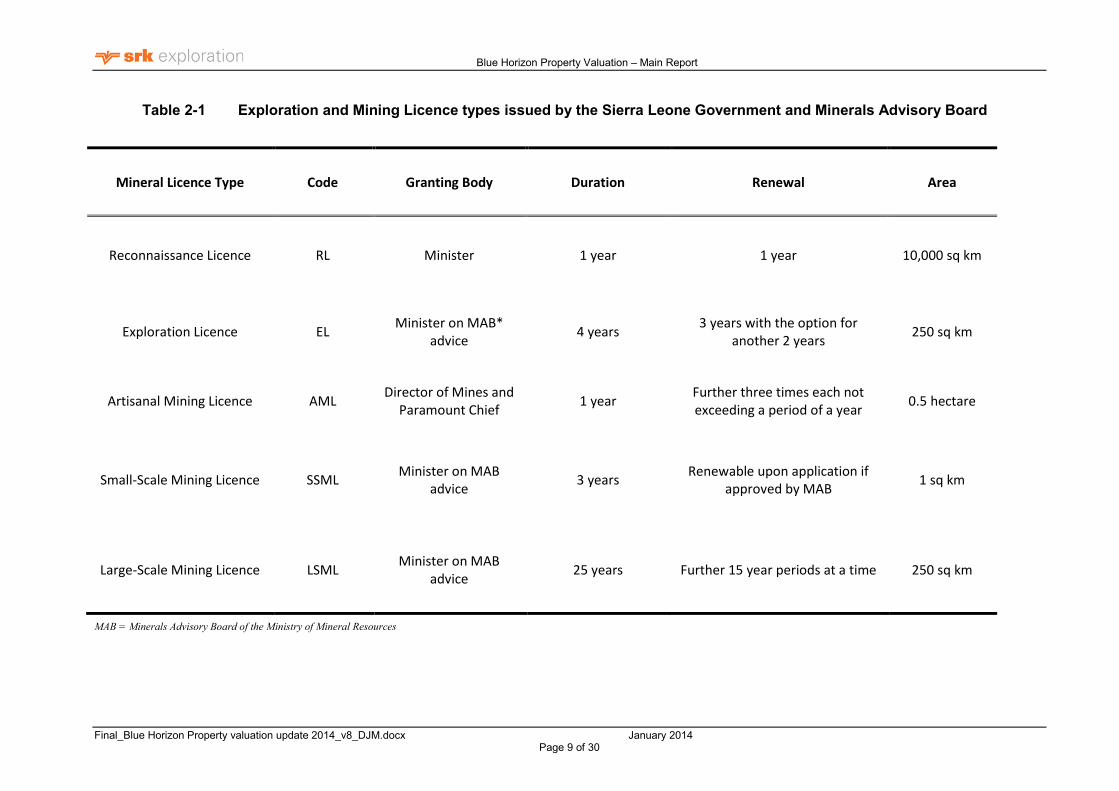
There are five types of Mineral Rights in Sierra Leone, three of which are relevant to foreign
investors seeking to explore and/or develop mines (Table 2-1).
2.2 Royalties, Back-in rights, payments & Required Permits
The Mining Lease is subject to a four percent government royalty on revenue and a three
percent Export Duty is payable to the Government Gold and Diamond Office (GGDO). In the
case of gold, the fee is related to gold purity.
Blue Horizon Property Valuation – Main Report
Final_Blue Horizon Property valuation update 2014_v8_DJM.docx January 2014 Page 9 of 30
Table 2-1 Exploration and Mining Licence types issued by the Sierra Leone Government and Minerals Advisory Board
MAB = Minerals Advisory Board of the Ministry of Mineral Resources
Mineral Licence Type Code Granting Body Duration Renewal Area
Reconnaissance Licence RL Minister 1 year 1 year 10,000 sq km
Exploration Licence EL Minister on MAB*
advice 4 years
3 years with the option for another 2 years
250 sq km
Artisanal Mining Licence AML Director of Mines and
Paramount Chief 1 year
Further three times each not exceeding a period of a year
0.5 hectare
Small-Scale Mining Licence SSML Minister on MAB
advice 3 years
Renewable upon application if approved by MAB
1 sq km
Large-Scale Mining Licence LSML Minister on MAB
advice 25 years Further 15 year periods at a time 250 sq km
Blue Horizon Property Valuation – Main Report
Final_Blue Horizon Property valuation update 2014_v8_DJM.docx January 2014 Page 10 of 30
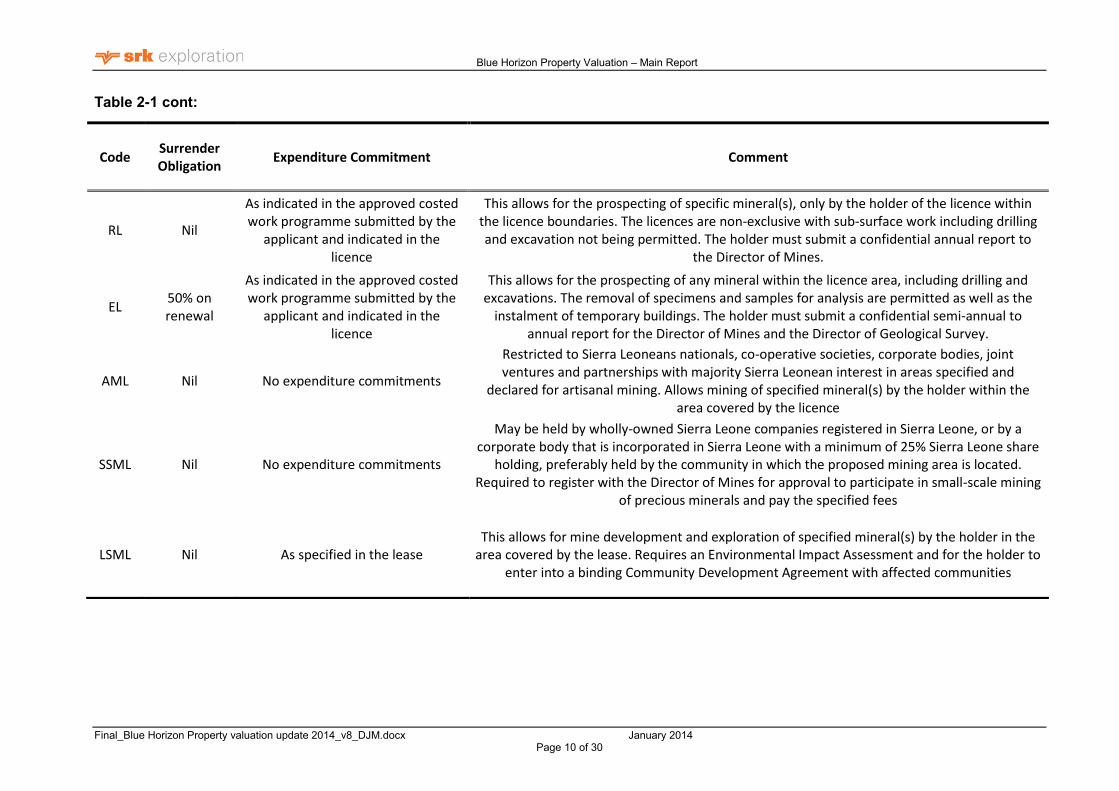
Table 2-1 cont:
Code Surrender Obligation
Expenditure Commitment Comment
RL Nil
As indicated in the approved costed work programme submitted by the
applicant and indicated in the licence
This allows for the prospecting of specific mineral(s), only by the holder of the licence within the licence boundaries. The licences are non-exclusive with sub-surface work including drilling and excavation not being permitted. The holder must submit a confidential annual report to
the Director of Mines.
EL 50% on renewal
As indicated in the approved costed work programme submitted by the
applicant and indicated in the licence
This allows for the prospecting of any mineral within the licence area, including drilling and excavations. The removal of specimens and samples for analysis are permitted as well as the
instalment of temporary buildings. The holder must submit a confidential semi-annual to annual report for the Director of Mines and the Director of Geological Survey.
AML Nil No expenditure commitments
Restricted to Sierra Leoneans nationals, co-operative societies, corporate bodies, joint ventures and partnerships with majority Sierra Leonean interest in areas specified and
declared for artisanal mining. Allows mining of specified mineral(s) by the holder within the area covered by the licence
SSML Nil No expenditure commitments
May be held by wholly-owned Sierra Leone companies registered in Sierra Leone, or by a corporate body that is incorporated in Sierra Leone with a minimum of 25% Sierra Leone share
holding, preferably held by the community in which the proposed mining area is located. Required to register with the Director of Mines for approval to participate in small-scale mining
of precious minerals and pay the specified fees
LSML Nil As specified in the lease This allows for mine development and exploration of specified mineral(s) by the holder in the
area covered by the lease. Requires an Environmental Impact Assessment and for the holder to enter into a binding Community Development Agreement with affected communities
Blue Horizon Property Valuation – Main Report
Final_Blue Horizon Property valuation update 2014_v8_DJM.docx January 2014 Page 11 of 30
Figure 2-1 Previously published map of property with the YDS geochemical anomaly illustrated. The dashed line illustrates the northern EXPL licence and the solid line the “wrap around” EPL licence subject of this report.
Blue Horizon Property Valuation – Main Report
Final_Blue Horizon Property valuation update 2014_v8_DJM.docx January 2014 Page 12 of 30
2.3 Environmental Liabilities
Legislation governing environmental and social regulations are found as Acts from various
government institutions and ministries. Environmental regulations are governed by the
Environmental Protection Agency under the Environmental Protection Agency Act, 2008.
3 Accessibility of the property
Access to the property from the country‟s capital, Freetown is via a 300 km tarred road
followed by a 50 km track via four wheeled drive vehicle taking between 7 and 8 hours. The
Blue Horizon licence is located in mountainous terrain with elevations ranging from 100 to
700 m a.m.s.l. Vegetation consists of seasonal savannah type forest, which in generally is
fairly open and passable in lowland areas. In upland areas, vegetation consists of relatively
open forest and grasslands.
4 History of exploration
Prior to SIG historical work in the licence area has predominantly focussed on the gold
potential, and all work on the iron ore potential has been conducted since 2012. The current
geological knowledge is largely provided by the technical reports of ACA Howe (1989), the
technical report by Carl G. Verly (2005) and Mackay & Schnellman (1994) and research done
by Davies, Friedrich and Wiechowski (1988).
4.1 Gold exploration
The gold bearing alluvials within the Property are considered to be derived from primary
mineralization within the Sula Mountains Greenstone Belt and form part of a much larger gold
field which was discovered in 1926 and studied by the Geological Survey of Sierra Leone
between 1926 and 1930. A comprehensive drainage survey undertaken by the Geological
Survey in the 1930`s demonstrated the presence of alluvial gold in most of the streams which
drains the area around Lake Sonfon. Alluvial gold has been worked extensively by local
miners in the area for some time. Alluvial gold within the region has an angular to hackley
characteristic indicating a close proximity to its source. Small flecks of gold have also been
seen within quartz clasts associated with mafic host material.
Wilson and Marmo conducted a number of field visits covering the Sula Mountains in the late
1950‟s aimed at prospecting for primary gold and geological mapping funded by the
Geological Survey of Sierra Leone. They published their finding in “Geomorphology and
Mineral Resources of the Sula Mountains” (Wilson and Marmo, 1958) which discussed the
presence of gold bearing quartz veins near the village of Dalakuru within the licence area.
In the 1960`s drilling of a geochemical anomaly reportedly intersected a 85 m wide zone of
sulphide mineralization (2-3 % sulphides). Two geophysical anomalies (Zone A and B) were
also reportedly identified at that time, with Zone A coincident with the geochemical anomaly at
a depth 45-60 m continuing for over 2,000 m to the north (Patrick 1998b).
In the early 1990`s Dr. L. Wright conducted Landsat imagery mapping as part of the target
selection and licence application procedures for the Sonfon licence areas on behalf of AAM
subsidiary, Golden Leo Resources (GLR).
Golden Leo Resources BVI (“GLR”) is an entity which was formed as a joint venture between
Golden Star Resources (TSX) and Mano River Resources (BVI). They held the exploration
licence EXPL 07/2007 between 2007 and 2011, which covered the same area as the current
Blue Horizon Property Valuation – Main Report
Final_Blue Horizon Property valuation update 2014_v8_DJM.docx January 2014 Page 13 of 30
licence. Prior to 2007 the licence was held by Mano River Resources a subsidiary of Aureus
Mining Plc (AIM & TSX). From 2002 Mano River Resources had been the joint venture partner
with Golden Prospect PLC who held the Lake Sonfon Licence, which is to the immediate north
and contiguous with the current Blue Horizon Property.
In 2004 GLR undertook a regional soil sampling programme which covered the entirety of the
licence with samples taken along an 800 m x 100 m grid and analysed for trace gold at ppb
levels via BLEG methods. This produced a number of target anomalies some of which were
investigated by an infill regolith soil sampling follow up programme along a 200 m x 50 m grid
in 2006.
This infill soil sampling appears to have been accompanied by the re-sampling of the trenches
dug by Wilson and Marmo in 1958, and it is this data that GLR used to delineate the Yafarina-
Dalakuru-Sende (YDS) NNW-SSE trending gold target zone. (Figure 2-1).
Following the results of the regolith sampling programmes a RAB drilling programme was
established and ran from late 2007 to 2008. A total of 388 holes were completed along fences
spaced every 200 m with holes drilled every 25 m on an azimuth of 287° at an inclination of -
50°.
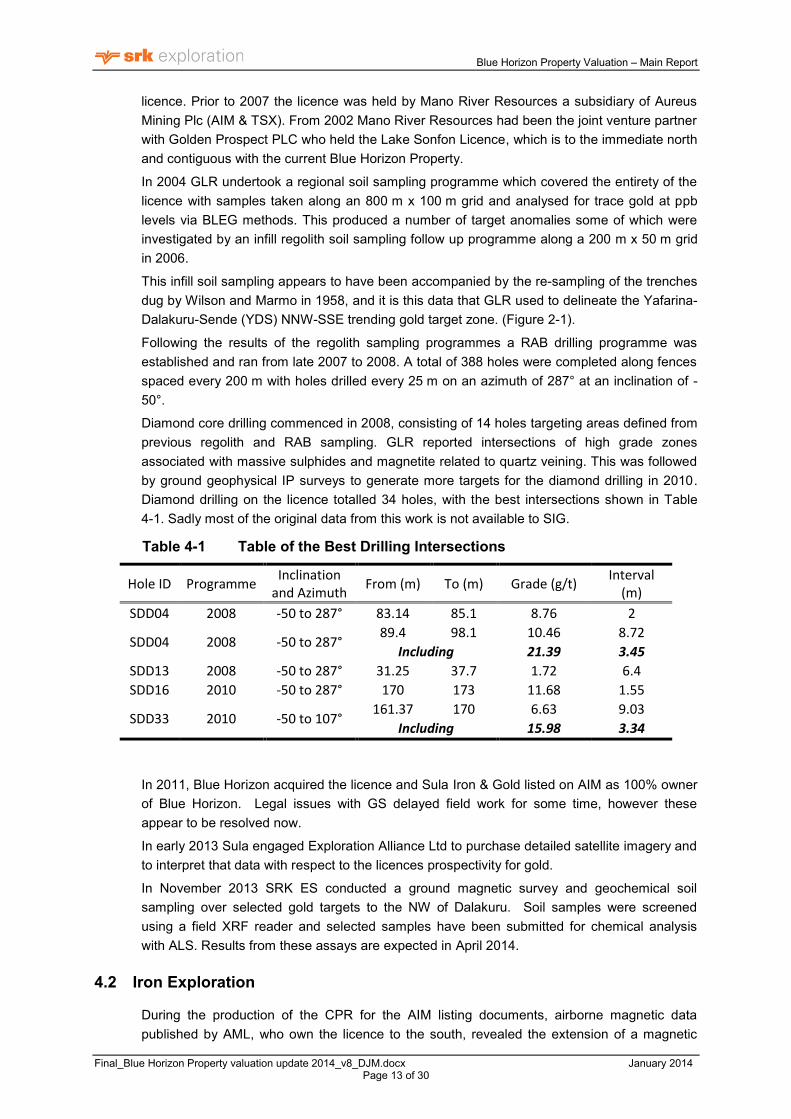
Diamond core drilling commenced in 2008, consisting of 14 holes targeting areas defined from
previous regolith and RAB sampling. GLR reported intersections of high grade zones
associated with massive sulphides and magnetite related to quartz veining. This was followed
by ground geophysical IP surveys to generate more targets for the diamond drilling in 2010.
Diamond drilling on the licence totalled 34 holes, with the best intersections shown in Table
4-1. Sadly most of the original data from this work is not available to SIG.
Table 4-1 Table of the Best Drilling Intersections
Hole ID Programme Inclination
and Azimuth From (m) To (m) Grade (g/t)
Interval (m)
SDD04 2008 -50 to 287° 83.14 85.1 8.76 2
SDD04 2008 -50 to 287° 89.4 98.1 10.46 8.72
Including 21.39 3.45
SDD13 2008 -50 to 287° 31.25 37.7 1.72 6.4
SDD16 2010 -50 to 287° 170 173 11.68 1.55
SDD33 2010 -50 to 107° 161.37 170 6.63 9.03
Including 15.98 3.34
In 2011, Blue Horizon acquired the licence and Sula Iron & Gold listed on AIM as 100% owner
of Blue Horizon. Legal issues with GS delayed field work for some time, however these
appear to be resolved now.
In early 2013 Sula engaged Exploration Alliance Ltd to purchase detailed satellite imagery and
to interpret that data with respect to the licences prospectivity for gold.
In November 2013 SRK ES conducted a ground magnetic survey and geochemical soil
sampling over selected gold targets to the NW of Dalakuru. Soil samples were screened
using a field XRF reader and selected samples have been submitted for chemical analysis
with ALS. Results from these assays are expected in April 2014.
4.2 Iron Exploration
During the production of the CPR for the AIM listing documents, airborne magnetic data
published by AML, who own the licence to the south, revealed the extension of a magnetic
Blue Horizon Property Valuation – Main Report
Final_Blue Horizon Property valuation update 2014_v8_DJM.docx January 2014 Page 14 of 30
anomaly, thought to be a BIF, into the Sula Licence.
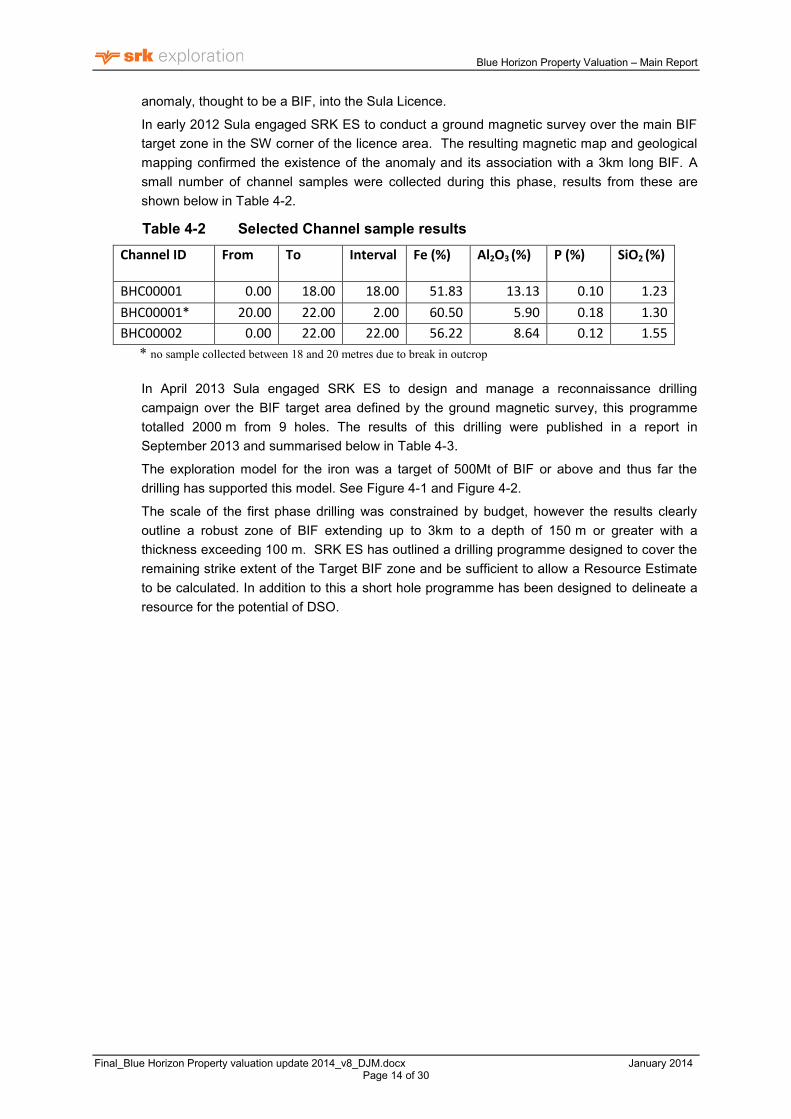
In early 2012 Sula engaged SRK ES to conduct a ground magnetic survey over the main BIF
target zone in the SW corner of the licence area. The resulting magnetic map and geological
mapping confirmed the existence of the anomaly and its association with a 3km long BIF. A
small number of channel samples were collected during this phase, results from these are
shown below in Table 4-2.
Table 4-2 Selected Channel sample results
Channel ID
From To Interval Fe (%) Al2O3 (%) P (%) SiO2 (%)
BHC00001 0.00 18.00 18.00 51.83 13.13 0.10 1.23
BHC00001* 20.00 22.00 2.00 60.50 5.90 0.18 1.30
BHC00002 0.00 22.00 22.00 56.22 8.64 0.12 1.55
* no sample collected between 18 and 20 metres due to break in outcrop
In April 2013 Sula engaged SRK ES to design and manage a reconnaissance drilling
campaign over the BIF target area defined by the ground magnetic survey, this programme
totalled 2000 m from 9 holes. The results of this drilling were published in a report in
September 2013 and summarised below in Table 4-3.
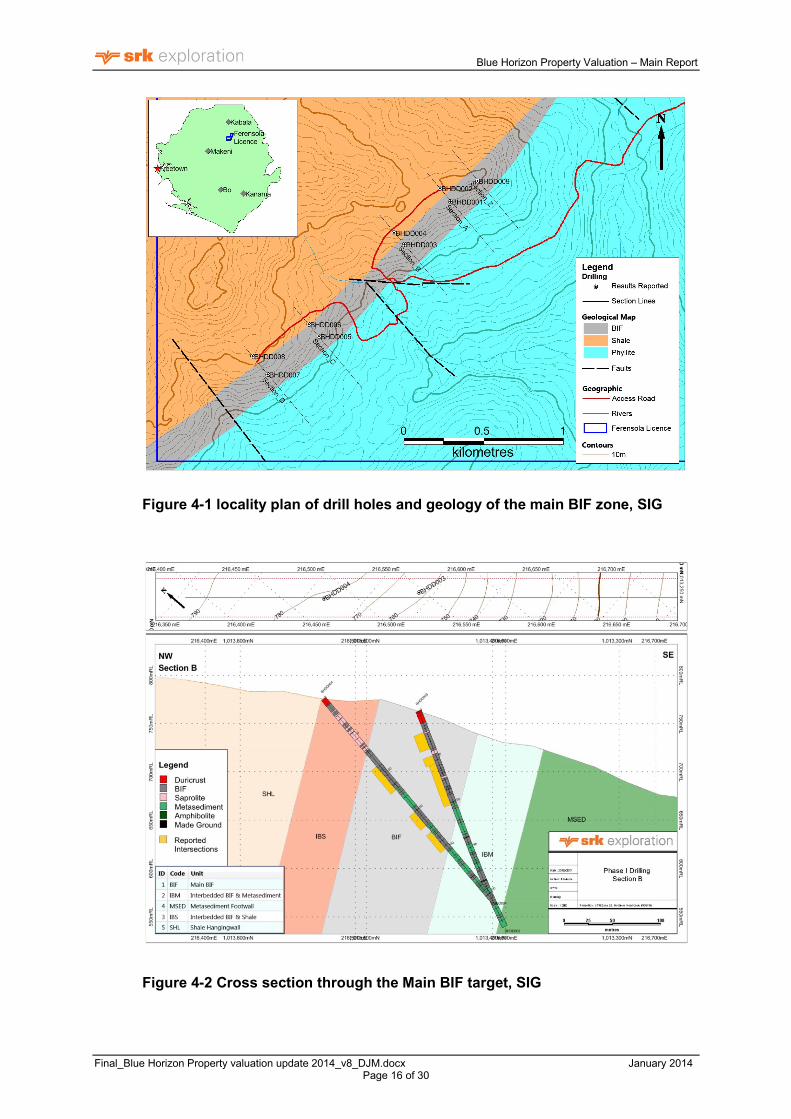
The exploration model for the iron was a target of 500Mt of BIF or above and thus far the
drilling has supported this model. See Figure 4-1 and Figure 4-2.
The scale of the first phase drilling was constrained by budget, however the results clearly
outline a robust zone of BIF extending up to 3km to a depth of 150 m or greater with a
thickness exceeding 100 m. SRK ES has outlined a drilling programme designed to cover the
remaining strike extent of the Target BIF zone and be sufficient to allow a Resource Estimate
to be calculated. In addition to this a short hole programme has been designed to delineate a
resource for the potential of DSO.
Blue Horizon Property Valuation – Main Report
Final_Blue Horizon Property valuation update 2014_v8_DJM.docx January 2014 Page 15 of 30
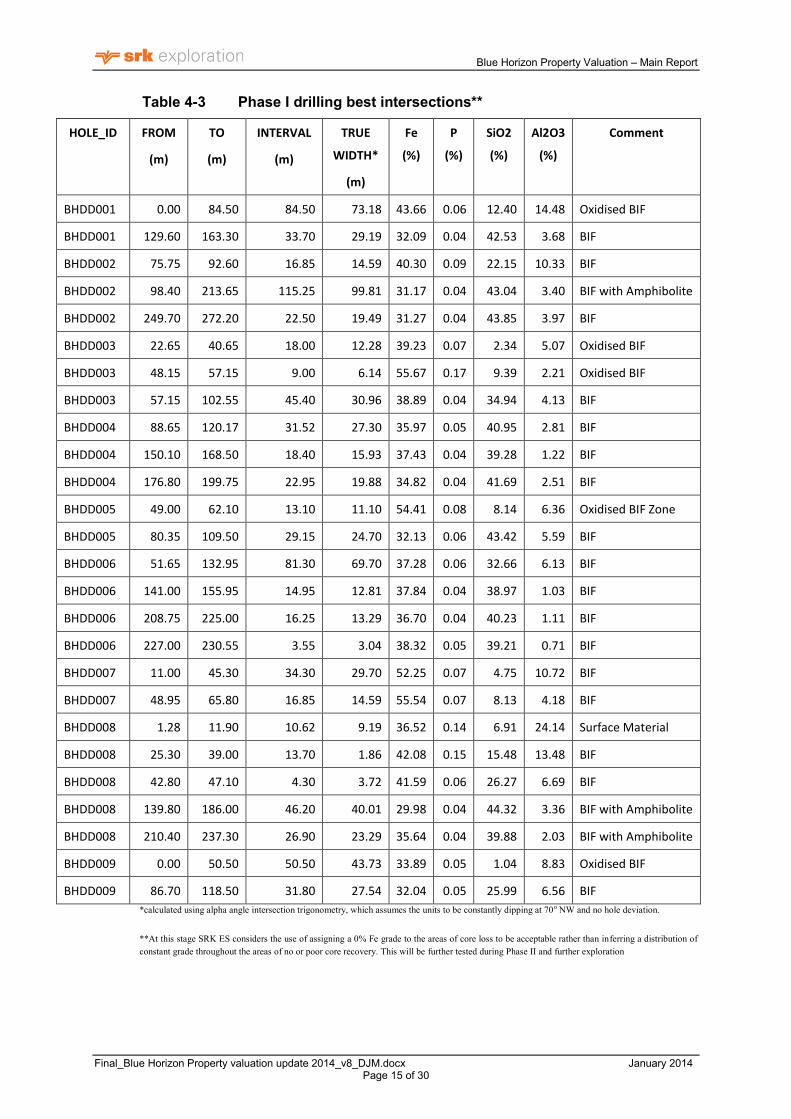
Table 4-3 Phase I drilling best intersections**
HOLE_ID FROM
(m)
TO
(m)
INTERVAL
(m)
TRUE
WIDTH*
(m)
Fe
(%)
P
(%)
SiO2
(%)
Al2O3
(%)
Comment
BHDD001 0.00 84.50 84.50 73.18 43.66 0.06 12.40 14.48 Oxidised BIF
BHDD001 129.60 163.30 33.70 29.19 32.09 0.04 42.53 3.68 BIF
BHDD002 75.75 92.60 16.85 14.59 40.30 0.09 22.15 10.33 BIF
BHDD002 98.40 213.65 115.25 99.81 31.17 0.04 43.04 3.40 BIF with Amphibolite
BHDD002 249.70 272.20 22.50 19.49 31.27 0.04 43.85 3.97 BIF
BHDD003 22.65 40.65 18.00 12.28 39.23 0.07 2.34 5.07 Oxidised BIF
BHDD003 48.15 57.15 9.00 6.14 55.67 0.17 9.39 2.21 Oxidised BIF
BHDD003 57.15 102.55 45.40 30.96 38.89 0.04 34.94 4.13 BIF
BHDD004 88.65 120.17 31.52 27.30 35.97 0.05 40.95 2.81 BIF
BHDD004 150.10 168.50 18.40 15.93 37.43 0.04 39.28 1.22 BIF
BHDD004 176.80 199.75 22.95 19.88 34.82 0.04 41.69 2.51 BIF
BHDD005 49.00 62.10 13.10 11.10 54.41 0.08 8.14 6.36 Oxidised BIF Zone
BHDD005 80.35 109.50 29.15 24.70 32.13 0.06 43.42 5.59 BIF
BHDD006 51.65 132.95 81.30 69.70 37.28 0.06 32.66 6.13 BIF
BHDD006 141.00 155.95 14.95 12.81 37.84 0.04 38.97 1.03 BIF
BHDD006 208.75 225.00 16.25 13.29 36.70 0.04 40.23 1.11 BIF
BHDD006 227.00 230.55 3.55 3.04 38.32 0.05 39.21 0.71 BIF
BHDD007 11.00 45.30 34.30 29.70 52.25 0.07 4.75 10.72 BIF
BHDD007 48.95 65.80 16.85 14.59 55.54 0.07 8.13 4.18 BIF
BHDD008 1.28 11.90 10.62 9.19 36.52 0.14 6.91 24.14 Surface Material
BHDD008 25.30 39.00 13.70 1.86 42.08 0.15 15.48 13.48 BIF
BHDD008 42.80 47.10 4.30 3.72 41.59 0.06 26.27 6.69 BIF
BHDD008 139.80 186.00 46.20 40.01 29.98 0.04 44.32 3.36 BIF with Amphibolite
BHDD008 210.40 237.30 26.90 23.29 35.64 0.04 39.88 2.03 BIF with Amphibolite
BHDD009 0.00 50.50 50.50 43.73 33.89 0.05 1.04 8.83 Oxidised BIF
BHDD009 86.70 118.50 31.80 27.54 32.04 0.05 25.99 6.56 BIF
*calculated using alpha angle intersection trigonometry, which assumes the units to be constantly dipping at 70o NW and no hole deviation.
**At this stage SRK ES considers the use of assigning a 0% Fe grade to the areas of core loss to be acceptable rather than inferring a distribution of
constant grade throughout the areas of no or poor core recovery. This will be further tested during Phase II and further exploration
Blue Horizon Property Valuation – Main Report
Final_Blue Horizon Property valuation update 2014_v8_DJM.docx January 2014 Page 16 of 30
Figure 4-1 locality plan of drill holes and geology of the main BIF zone, SIG
Figure 4-2 Cross section through the Main BIF target, SIG
Blue Horizon Property Valuation – Main Report
Final_Blue Horizon Property valuation update 2014_v8_DJM.docx January 2014 Page 17 of 30
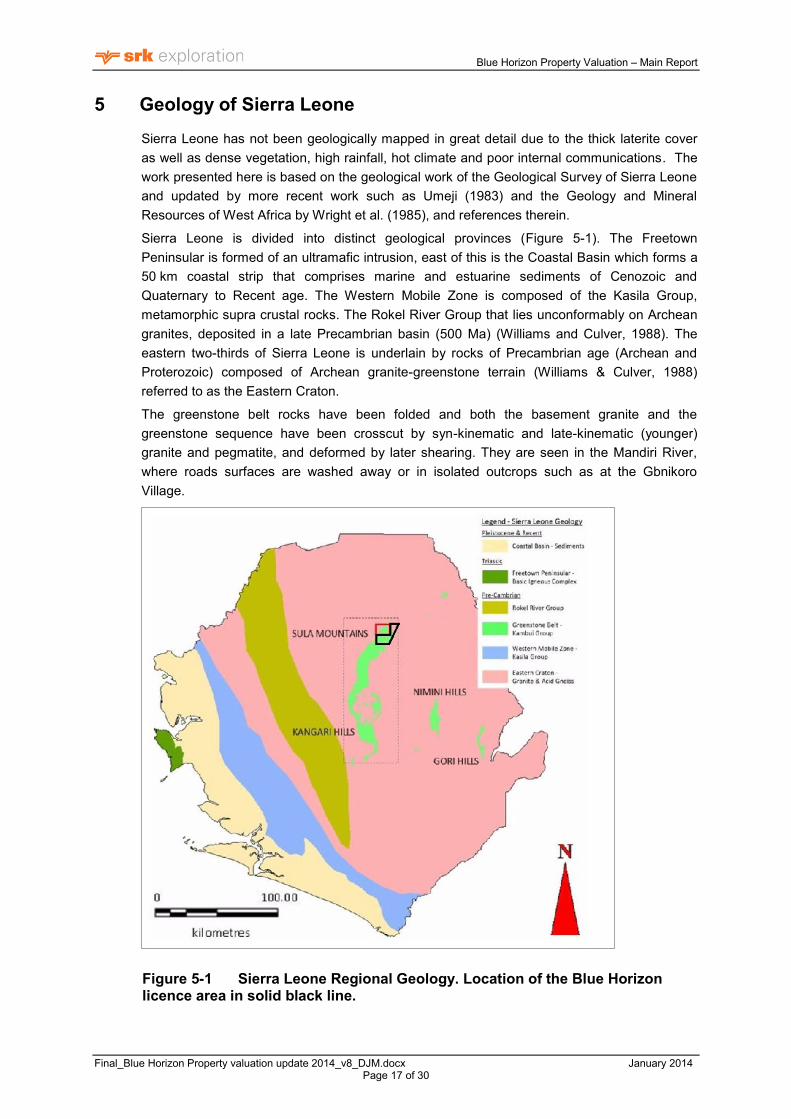
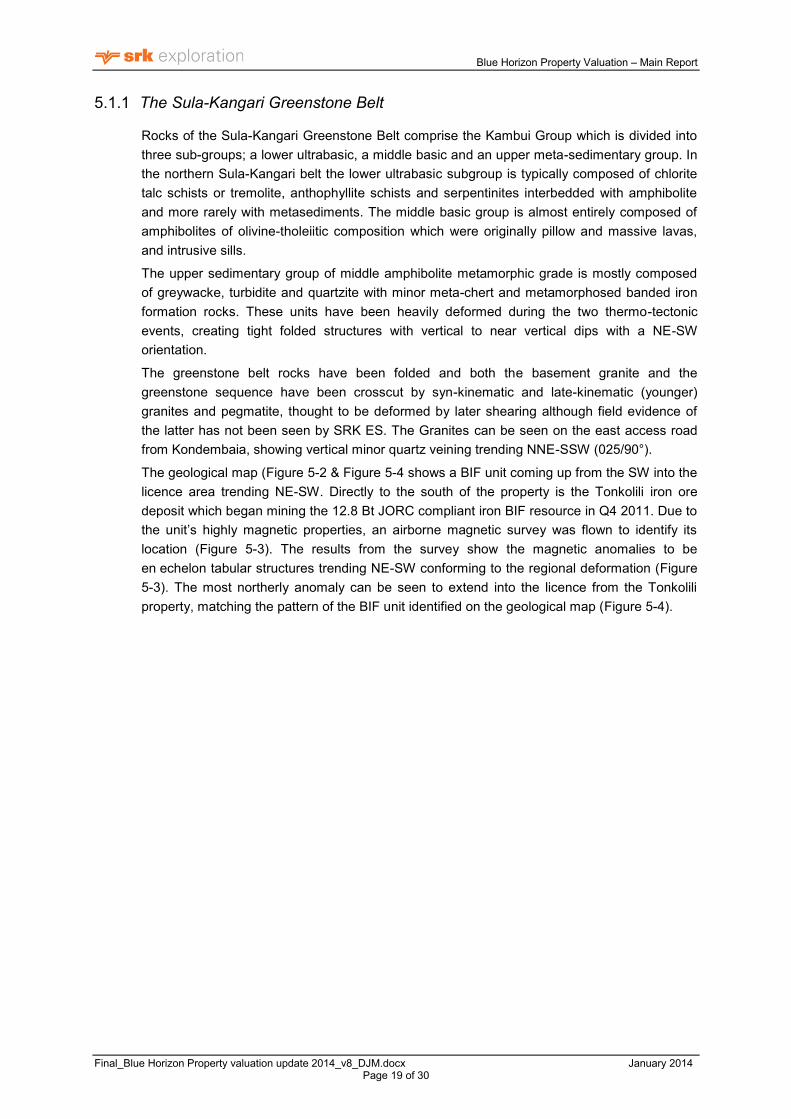
5 Geology of Sierra Leone
Sierra Leone has not been geologically mapped in great detail due to the thick laterite cover
as well as dense vegetation, high rainfall, hot climate and poor internal communications. The
work presented here is based on the geological work of the Geological Survey of Sierra Leone
and updated by more recent work such as Umeji (1983) and the Geology and Mineral
Resources of West Africa by Wright et al. (1985), and references therein.
Sierra Leone is divided into distinct geological provinces (Figure 5-1). The Freetown
Peninsular is formed of an ultramafic intrusion, east of this is the Coastal Basin which forms a
50 km coastal strip that comprises marine and estuarine sediments of Cenozoic and
Quaternary to Recent age. The Western Mobile Zone is composed of the Kasila Group,
metamorphic supra crustal rocks. The Rokel River Group that lies unconformably on Archean
granites, deposited in a late Precambrian basin (500 Ma) (Williams and Culver, 1988). The
eastern two-thirds of Sierra Leone is underlain by rocks of Precambrian age (Archean and
Proterozoic) composed of Archean granite-greenstone terrain (Williams & Culver, 1988)
referred to as the Eastern Craton.
The greenstone belt rocks have been folded and both the basement granite and the
greenstone sequence have been crosscut by syn-kinematic and late-kinematic (younger)
granite and pegmatite, and deformed by later shearing. They are seen in the Mandiri River,
where roads surfaces are washed away or in isolated outcrops such as at the Gbnikoro
Village.
Figure 5-1 Sierra Leone Regional Geology. Location of the Blue Horizon licence area in solid black line.
Blue Horizon Property Valuation – Main Report
Final_Blue Horizon Property valuation update 2014_v8_DJM.docx January 2014 Page 18 of 30
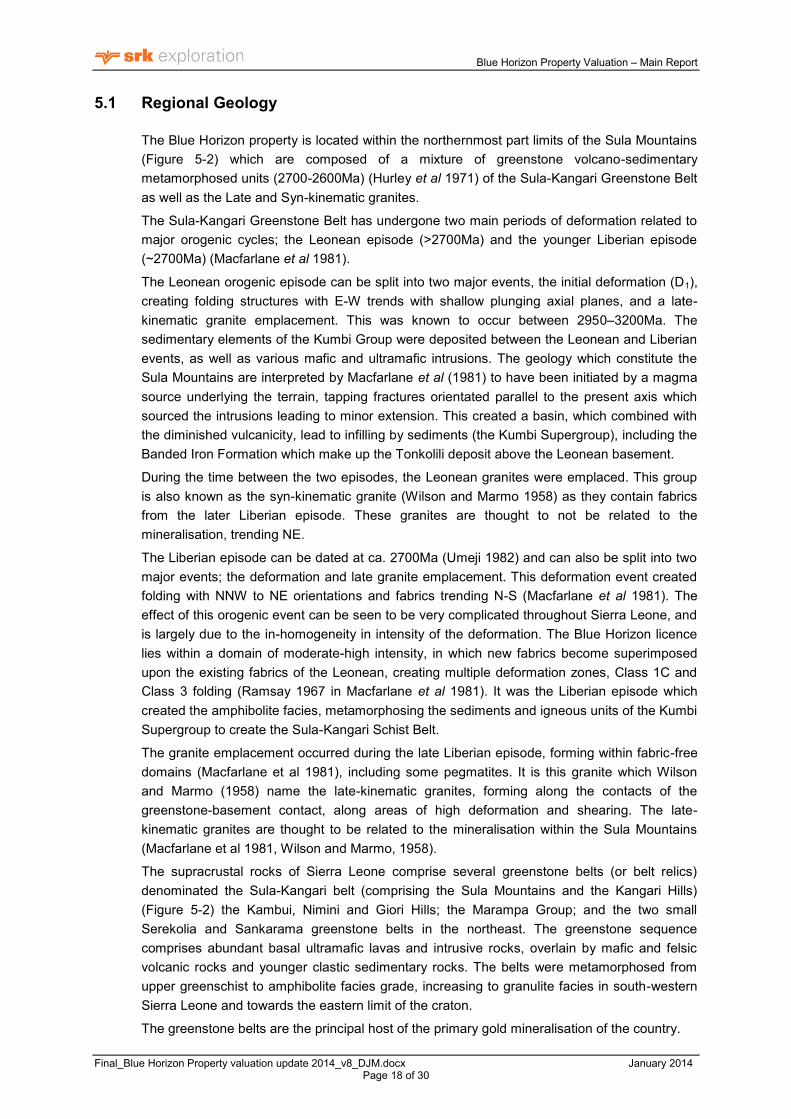
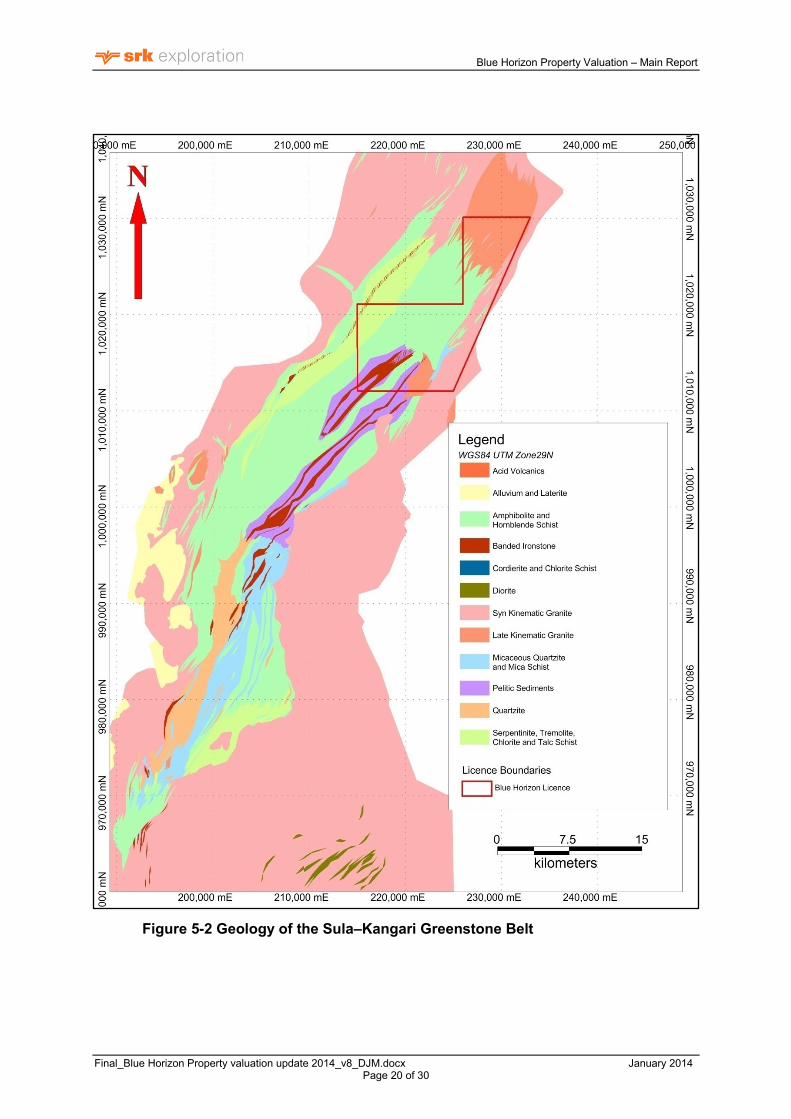
5.1 Regional Geology
The Blue Horizon property is located within the northernmost part limits of the Sula Mountains
(Figure 5-2) which are composed of a mixture of greenstone volcano-sedimentary
metamorphosed units (2700-2600Ma) (Hurley et al 1971) of the Sula-Kangari Greenstone Belt
as well as the Late and Syn-kinematic granites.
The Sula-Kangari Greenstone Belt has undergone two main periods of deformation related to
major orogenic cycles; the Leonean episode (>2700Ma) and the younger Liberian episode
(~2700Ma) (Macfarlane et al 1981).
The Leonean orogenic episode can be split into two major events, the initial deformation (D1),
creating folding structures with E-W trends with shallow plunging axial planes, and a late-
kinematic granite emplacement. This was known to occur between 2950–3200Ma. The
sedimentary elements of the Kumbi Group were deposited between the Leonean and Liberian
events, as well as various mafic and ultramafic intrusions. The geology which constitute the
Sula Mountains are interpreted by Macfarlane et al (1981) to have been initiated by a magma
source underlying the terrain, tapping fractures orientated parallel to the present axis which
sourced the intrusions leading to minor extension. This created a basin, which combined with
the diminished vulcanicity, lead to infilling by sediments (the Kumbi Supergroup), including the
Banded Iron Formation which make up the Tonkolili deposit above the Leonean basement.
During the time between the two episodes, the Leonean granites were emplaced. This group
is also known as the syn-kinematic granite (Wilson and Marmo 1958) as they contain fabrics
from the later Liberian episode. These granites are thought to not be related to the
mineralisation, trending NE.
The Liberian episode can be dated at ca. 2700Ma (Umeji 1982) and can also be split into two
major events; the deformation and late granite emplacement. This deformation event created
folding with NNW to NE orientations and fabrics trending N-S (Macfarlane et al 1981). The
effect of this orogenic event can be seen to be very complicated throughout Sierra Leone, and
is largely due to the in-homogeneity in intensity of the deformation. The Blue Horizon licence
lies within a domain of moderate-high intensity, in which new fabrics become superimposed
upon the existing fabrics of the Leonean, creating multiple deformation zones, Class 1C and
Class 3 folding (Ramsay 1967 in Macfarlane et al 1981). It was the Liberian episode which
created the amphibolite facies, metamorphosing the sediments and igneous units of the Kumbi
Supergroup to create the Sula-Kangari Schist Belt.
The granite emplacement occurred during the late Liberian episode, forming within fabric-free
domains (Macfarlane et al 1981), including some pegmatites. It is this granite which Wilson
and Marmo (1958) name the late-kinematic granites, forming along the contacts of the
greenstone-basement contact, along areas of high deformation and shearing. The late-
kinematic granites are thought to be related to the mineralisation within the Sula Mountains
(Macfarlane et al 1981, Wilson and Marmo, 1958).
The supracrustal rocks of Sierra Leone comprise several greenstone belts (or belt relics)
denominated the Sula-Kangari belt (comprising the Sula Mountains and the Kangari Hills)
(Figure 5-2) the Kambui, Nimini and Giori Hills; the Marampa Group; and the two small
Serekolia and Sankarama greenstone belts in the northeast. The greenstone sequence
comprises abundant basal ultramafic lavas and intrusive rocks, overlain by mafic and felsic
volcanic rocks and younger clastic sedimentary rocks. The belts were metamorphosed from
upper greenschist to amphibolite facies grade, increasing to granulite facies in south-western
Sierra Leone and towards the eastern limit of the craton.
The greenstone belts are the principal host of the primary gold mineralisation of the country.
Blue Horizon Property Valuation – Main Report
Final_Blue Horizon Property valuation update 2014_v8_DJM.docx January 2014 Page 19 of 30
The Sula-Kangari Greenstone Belt 5.1.1
Rocks of the Sula-Kangari Greenstone Belt comprise the Kambui Group which is divided into
three sub-groups; a lower ultrabasic, a middle basic and an upper meta-sedimentary group. In
the northern Sula-Kangari belt the lower ultrabasic subgroup is typically composed of chlorite
talc schists or tremolite, anthophyllite schists and serpentinites interbedded with amphibolite
and more rarely with metasediments. The middle basic group is almost entirely composed of
amphibolites of olivine-tholeiitic composition which were originally pillow and massive lavas,
and intrusive sills.
The upper sedimentary group of middle amphibolite metamorphic grade is mostly composed
of greywacke, turbidite and quartzite with minor meta-chert and metamorphosed banded iron
formation rocks. These units have been heavily deformed during the two thermo-tectonic
events, creating tight folded structures with vertical to near vertical dips with a NE-SW
orientation.
The greenstone belt rocks have been folded and both the basement granite and the
greenstone sequence have been crosscut by syn-kinematic and late-kinematic (younger)
granites and pegmatite, thought to be deformed by later shearing although field evidence of
the latter has not been seen by SRK ES. The Granites can be seen on the east access road
from Kondembaia, showing vertical minor quartz veining trending NNE-SSW (025/90°).
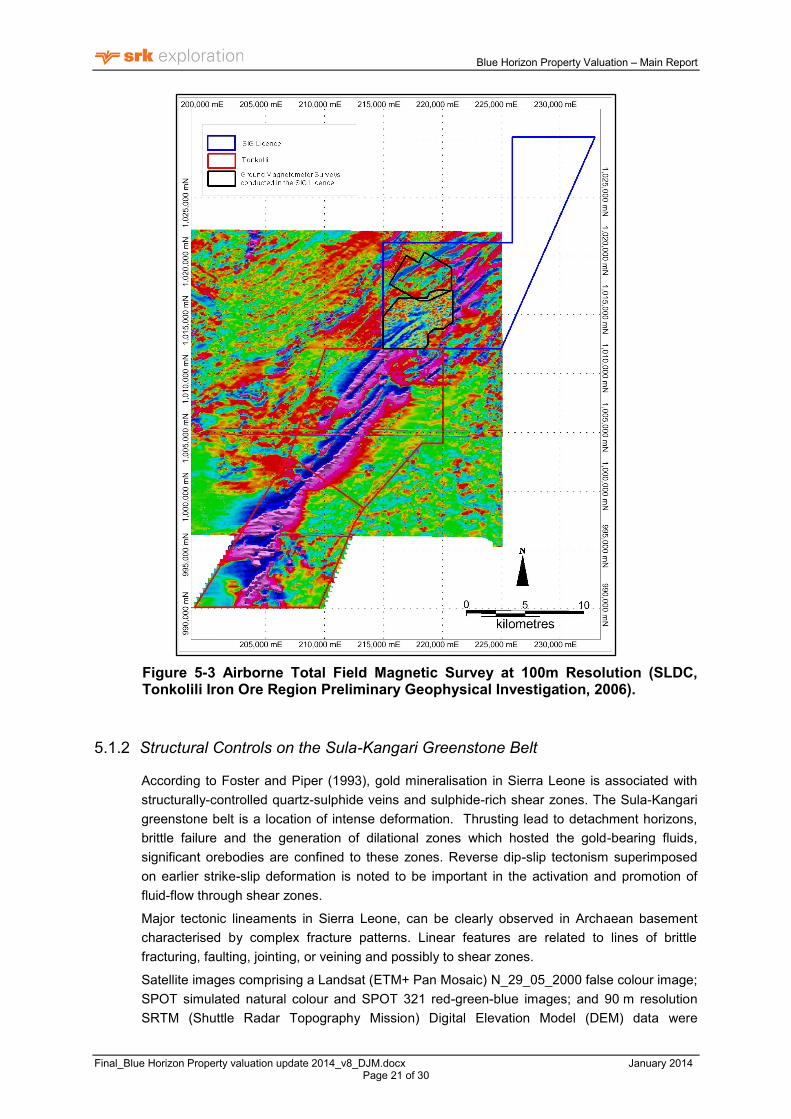
The geological map (Figure 5-2 & Figure 5-4 shows a BIF unit coming up from the SW into the
licence area trending NE-SW. Directly to the south of the property is the Tonkolili iron ore
deposit which began mining the 12.8 Bt JORC compliant iron BIF resource in Q4 2011. Due to
the unit‟s highly magnetic properties, an airborne magnetic survey was flown to identify its
location (Figure 5-3). The results from the survey show the magnetic anomalies to be
en echelon tabular structures trending NE-SW conforming to the regional deformation (Figure
5-3). The most northerly anomaly can be seen to extend into the licence from the Tonkolili
property, matching the pattern of the BIF unit identified on the geological map (Figure 5-4).
Blue Horizon Property Valuation – Main Report
Final_Blue Horizon Property valuation update 2014_v8_DJM.docx January 2014 Page 20 of 30
Figure 5-2 Geology of the Sula–Kangari Greenstone Belt
Blue Horizon Property Valuation – Main Report
Final_Blue Horizon Property valuation update 2014_v8_DJM.docx January 2014 Page 21 of 30
Figure 5-3 Airborne Total Field Magnetic Survey at 100m Resolution (SLDC, Tonkolili Iron Ore Region Preliminary Geophysical Investigation, 2006).
Structural Controls on the Sula-Kangari Greenstone Belt 5.1.2
According to Foster and Piper (1993), gold mineralisation in Sierra Leone is associated with
structurally-controlled quartz-sulphide veins and sulphide-rich shear zones. The Sula-Kangari
greenstone belt is a location of intense deformation. Thrusting lead to detachment horizons,
brittle failure and the generation of dilational zones which hosted the gold-bearing fluids,
significant orebodies are confined to these zones. Reverse dip-slip tectonism superimposed
on earlier strike-slip deformation is noted to be important in the activation and promotion of
fluid-flow through shear zones.
Major tectonic lineaments in Sierra Leone, can be clearly observed in Archaean basement
characterised by complex fracture patterns. Linear features are related to lines of brittle
fracturing, faulting, jointing, or veining and possibly to shear zones.
Satellite images comprising a Landsat (ETM+ Pan Mosaic) N_29_05_2000 false colour image;
SPOT simulated natural colour and SPOT 321 red-green-blue images; and 90 m resolution
SRTM (Shuttle Radar Topography Mission) Digital Elevation Model (DEM) data were
Blue Horizon Property Valuation – Main Report
Final_Blue Horizon Property valuation update 2014_v8_DJM.docx January 2014 Page 22 of 30
interpreted by SRK ES, (Kellaway and Nash, 2011).
Drainage patterns including rivers, dry creeks and breaks of slope are clearly visible in the
SPOT survey images and SRTM topographic image. Three principal orientations of lineament
can be interpreted from the data, i) NE-SW, ii) NW-SE, and iii) N-S.
To the west of the Property a major N-S trending lineament causes the Sula-Kangari
greenstone belt to be deflected and folded from a northwest-southeast orientation to north-
south. This is interpreted to be a Leonean (~3000Ma) structure, reactivated during east-west
Cretaceous (100 Ma) Atlantic opening. This north-south trend of structures is observed within
the Property area.
It is probable that the greenstone belt orientation has been controlled to a large extent by a
NE-SW shear orientation. Major shear zones trending NE-SW to ENE-WSW appear to offset
the greenstone belt in a dextral sense south of the Property area. These shear zones are
interpreted as brittle Archaean structures, reactivated during the Rokelide Orogeny (950-
550Ma). Williams (1978) describes a conjugate set of Archaean brittle structures, i.e. dextral
NNE-SSW and sinistral ENE-WSW faults with small displacement. These indicate a principal
compressional stress axis orientated NE-SW during the Archaean collision event. The major
N-S fault to the west caused buttressing of the shear zones.
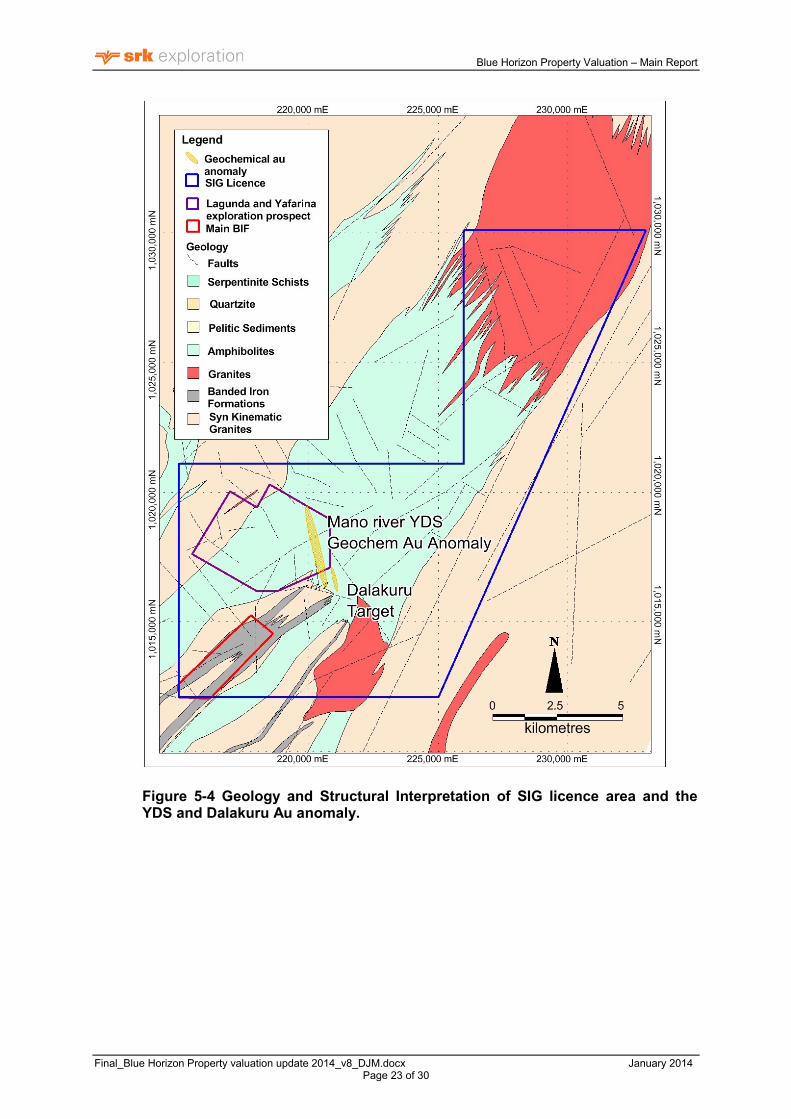
It is possible that the ENE-WSW trending shear zone south of the Property area controls the
limit of BIF occurrence within the belt. This assumption is supported by the lack of mapped BIF
northeast of this zone towards Lake Sonfon (Figure 5-4). This may have a control on the type
of primary gold mineralisation found in the Property area. BIF and chert units are important in
gold mineralisation as deformation and fluid flow are often focused along the lithological
contacts of rocks of different competence.
The northwest trending linear structures interpreted from satellite and DEM as faults are
relatively straight lines and are not strongly affected by topography, suggesting they are steep
to sub vertical in nature. These NW-SE faults are interpreted as Leone an (~3000Ma)
structures, slightly reactivated. Most interpreted faults are based on small drainage features;
however several individual faults define major breaks of slope, indicating they have strongly
influenced the geomorphological development of the Sula Mountain range. A major structure
~50 km long clearly intersects the Property in the south-western corner.
Significant primary lode gold deposits are commonly located within a few kilometres of major
shear-zones, but are often hosted by related second-order and even third-order structures.
The „YDS‟ gold anomaly appears to be a NNW-SSE trending second order structure
associated with and to the south of the major NW-SE fault (Figure 2-1 & Figure 5-4).
Blue Horizon Property Valuation – Main Report
Final_Blue Horizon Property valuation update 2014_v8_DJM.docx January 2014 Page 23 of 30
Figure 5-4 Geology and Structural Interpretation of SIG licence area and the YDS and Dalakuru Au anomaly.
Blue Horizon Property Valuation – Main Report
Final_Blue Horizon Property valuation update 2014_v8_DJM.docx January 2014 Page 24 of 30
6 Valuation
It is generally accepted in the exploration industry that the valuation of exploration properties is
a subjective process and is greatly influenced by the prevailing market conditions and to some
extent the experience and qualifications of the person conducting the exploration. The
observations, comments and results of technical analyses presented in this report represent
SRK ES‟ opinions as of the date of this report. SRK ES has visited this specific property on
numerous occasions and is familiar with the region. We are confident that the opinions
presented here are reasonable and that the overall valuation is a fair reflection of the value of
the property in January 2014.We cannot, however, accept any liability, either direct or
consequential, for the validity of historical data accepted in good faith.
6.1 Approach
Based on SRK ES experience, information provided by Sula Gold and information obtained
from the public domain regarding the status of the asset in question, SRK ES has combined
several valuation methods to provide a technical value for the property. SRK ES‟ approach is
firstly to establish a minimum value for the asset based primarily on the historical and
proposed expenditures and discounted to account for our view on the validity of the
expenditure. Secondly, we establish a potential maximum value based on our opinion and
understanding of the geology, the exploration model, the level of work conducted and the
results obtained to date. The third stage is to establish the status of each asset and to allocate
a reasonable technical value based upon the progression from minimum to potential value.
This technical value is the value that SRK ES considers to be reasonable based on the
geology status and potential of the project to succeed, it may not equate to the value that
someone is prepared to pay for the asset, particularly in times of low market sentiment. The
technical value in essence represents the value added by the owners having made their
investment and conducted works on the licence.
SRK ES has not undertaken any legal due diligence study to confirm that all statutory
consents are in force and current. There are several non-geological factors that are taken into
consideration during a valuation of this sort, these are briefly explained below.
6.2 Project Status
For the purposes of this valuation SRK ES considers the progression of an exploration
property to comprise the following five stages:
Grass-roots projects - Desk studies, target generation and very early field work has been
conducted;
Intermediate projects – Follow-up field work, trenching, geological drilling;
Advanced projects - RC or Diamond drilling for geological modelling;
Resource Definition projects - Drilling conducted specifically for resource purposes;
Full feasibility projects - All economic and technical parameters analysed.
As a property progresses from one stage to another the overall range between the minimum
and maximum values should decrease. Whilst the maximum potential value would remain
similar during the early stages the minimum value, being based on exploration expenditure,
would increase. As a property reaches the final stages the maximum potential value is more
likely to change as more quantitative methods tend to be applied to valuing defined resources.
Blue Horizon Property Valuation – Main Report
Final_Blue Horizon Property valuation update 2014_v8_DJM.docx January 2014 Page 25 of 30
The chances of successfully realising the maximum potential value are increased as the
property progresses with positive results being obtained. During the early stages of exploration
the possibility of success is lower than in latter stages. SRK ES applies an incremental scale
to the probability of attaining the maximum potential value, thus:
Grass-roots projects 0 - 10%,
Intermediate projects 10 - 25%,
Advanced projects 25 - 50%,
Resource Definition projects 50 - 80%,
Full feasibility projects 80 - 100%.
In this case there are two specific exploration targets, the Iron and the Gold. SRK ES
considers that the Iron target falls in the late intermediate to early advanced category and the
Gold targets fall in to the grass-roots category.
6.3 Company Fit
The second factor is an assessment of “company fit” and the relative ability to conduct
exploration within a particular country/environment. This factor attempts to consider the
attractiveness of a particular project for investment or purchase and hence the value that a
third party would be willing to pay for the property.
Mr. Nick Warrell has very significant mining industry experience and has access to suitably
skilled and experienced expatriate and in-country personnel. Additionally, he has established
important links with government and community both locally and in the Republic capital and is
an Honorary Paramount Chief of the Diang Chiefdom and member of the Tribal Council, the
body which represents all the Chiefdoms to the President. SRK ES considers that Sula Iron &
Gold is capable of conducting exploration work in the region without any difficulty.
6.4 Country Risk
The third factor is an assessment of “country risk” whereby the risks involved in conducting
exploration in a particular country are quantified.
Sierra Leone has suffered greatly in the past however recent exploration projects are
progressing well and several projects are in advanced stages of development.
SRK ES does not consider that Sierra Leone poses any specific country risks to the Company.
6.5 Minimum Values
Under normal circumstances establishing minimum values for an exploration property is
generally the simplest part of a valuation exercise. If a property is purchased, then the
purchase price is the minimum value assigned to that property by the purchaser. Historical
exploration expenditure is also used to assist in this process and SRK ES tends to apply 65-
80% of the historical spend as being valid, “in the ground” expenditure. The minimum value
should also include the amount that the current owner intends to expend on exploration during
the next phase of work, as this is a further indication of the perceived value of the property;
again, SRK ES applies a discount factor of 65-80% to this.
All of the above assumes that the interested party is a willing, able and informed body.
In this case SRK ES would suggest a minimum value for the licence of US$ 8 Million.
Blue Horizon Property Valuation – Main Report
Final_Blue Horizon Property valuation update 2014_v8_DJM.docx January 2014 Page 26 of 30
6.6 Potential Values
Philosophically, the maximum “potential” value of an exploration property may be linked to the
target mineralisation being sought, however all explorers are seeking the best possible deposit
and it is essential to establish a realistic view of the geological potential. SRK ES‟s approach
here is to establish the maximum potential value of the properties based on the currently
available geological data and our understanding of the geological models applied.
SRK ES considers that the highest level of prospectivity for gold is the geological model for
mesothermal gold which could be expected to contain in the region of 250,000 – 400,000 OZ‟s
of gold and may be as large as 40 Mt. Lower prospectivity may be represented by the model
for gold associated with banded iron formation or laterite.
Current resource estimates at the nearby Komahun gold deposit are 3.6 Mt @ 4.69g/t
Indicated and 2.6Mt @ 4.08 g/t Inferred (cut-off 2.4 g/t).(company web site)
Current resource estimates at the Baomahun gold deposit (southern Sula-Kangari greenstone
belt) are 23.3 MT @ 1.62g/t probable reserves and 38.4 MT @ 1.82 g/t Indicated Resources
with additional inferred resources. (company web site)
In addition to the prospectivity for gold SRK ES also consider that the licence area has
excellent potential for an iron ore resource to be delineated, demonstrated by the drilling
conducted in mid-2013, on an extension of the Tonkolili BIF. The existence of BIF
mineralisation over a strike extent exceeding 3km has now been proven, though further drilling
is required to outline a resource. SRK ES is confident that the exploration target of 500 MT is
achievable, and the potential for a DSO component is good. Whilst the potential for iron is
unlikely to be on the same scale as Tonkolili it is still substantial.
It should be noted that the “potential” value for the gold targets has been heavily discounted
due to their stage of development and the potential value of the Iron target has been equally
discounted on the basis of its size. In this case, SRK ES would suggest a maximum potential
value for the combined targets of approximately US$ 200 Million would be a reasonable figure
for the licence area.
Blue Horizon Property Valuation – Main Report
Final_Blue Horizon Property valuation update 2014_v8_DJM.docx January 2014 Page 27 of 30
6.7 Technical Value
The technical valuation applied here is the value that SRK ES considers to be a fair and
reasonable value for the property, based upon the geological information available and our
view on the status of the assets and their probability of success. In this case, SRK ES has
applied a technical value of US$ 36.7 Million to the property. This does not address the
market sentiment of such investments and as such a potential investor‟s valuation may differ
greatly from the technical valuation as the result of their view of the current status of the
mining industry or the sellers financial position.
For and on behalf of SRK Exploration Services
Gareth O’Donovan
Managing Director
William Kellaway
Director
Blue Horizon Property Valuation – Main Report
Final_Blue Horizon Property valuation update 2014_v8_DJM.docx January 2014 Page 28 of 30
7 References
A.C.A. Howe International Limited, 1989. Preliminary Assessment of Alluvial Gold
Mineralisation at Lake Sonfon, Republic of Sierra Leone
Davies, T.C., Friedrich, G. and Wiechowski, A., 1989, Geochemistry and mineralogy of
laterites in the Sula Mountains greenstone belt, Lake Sonfon gold district, Sierra Leone
Journal of Geochemical Exploration, 32, 75-98
Foster R.P. and Piper D.P., 1993, Archean lode gold deposits in Africa: Crustal setting,
metallogenesis and cratonisation, Ore Geology Reviews, No 8, pp. 303-347
GSR 2010: Golden Star Resources Annual Report, 2010;
(http://216.139.227.101/interactive/gss2010/)
Macfarlane, A., Crow, M. J., Arthurs, J.W., Wilkinson, A.F. and Aucott, J.W., 1981, The
geology and mineral resources of northern Sierra Leone, Overseas Memoir 7. Institute of
Geological Sciences, Natural Environment Research Council, p 0-99
Mackay & Schnellman, 1994. Independent Appraisal of the gold potential of Special
Exploration Licence No: EXPL9/94 Lake Sonfon Area Sierra Leone
Morel, s. W., 1979, The Geology and Mineral Resources of Sierra Leone, Economic Geology,
v. 74, No 7., pp. 1563-1576
Patrick D. J. 1998b: Geology and Mineral Potential Of Exploration permits Held by Mano
River Resources Limited In Sierra Leone, Report for Mano River Resources Inc.
SLDC Tonkolili Iron Ore Region Preliminary Geophysical Investigation May 2006. Publically
available on African Minerals Website
Umeji, AC 1983. Archean greenstone belts of Sierra Leone with comments on the stratigraphy
and metallogeny. Journal of African Earth Sciences, 1, 1-8
Verley C. G. 2005; Technical report on Mano River Resources Inc gold properties in Liberia,
Sierra Leone and Guinea. For Mano River Resources Inc. Amerlin Exploration Services Ltd.
Williams H.R., 1978, The Archean geology of Sierra Leone, Precambrian Research, Volume 6, Issues 3-
4, pp. 251-268
Williams H.R. and Culver S.J., 1988, Structural terranes and their relationships in Sierra
Leone, Journal of African Earth Sciences, Vol. 7, No. 2, pp. 473—47
Wilson, N.W. & Marmo, V., 1958, Geology, Geomorphology and Mineral Resources of the
Sula Mountains, Geological Survey of Sierra Leone, No. 1
Wright, JB, Hastings DA, Jones, WB, Williams, HR, 1985. Geology and Mineral Resources
of West Africa, George Allen & Unwin, London
Web 1: (http://www.gsr.com/News_Releases/Index.asp. (20/5/2011))
Blue Horizon Property Valuation – Main Report
Final_Blue Horizon Property valuation update 2014_v8_DJM.docx January 2014 Page 29 of 30
EAL, 2013, Blue Horizon Exploration Licence – Reconnaissance and Work Program design,
Exploration Alliance Limited
EAL, 2013, Reconnaissance and work programme design, Blue Horizon exploration Licence
Diang Chiefdom, Sierra Leone, Exploration Alliance Limited
EAL, 2013, Final Satellite Data Interpretation, Blue Horizon Exploration Licence, Sierra
Leone, Exploration Alliance Limited
EAL, 2012, Blue Horizon Exploration Licence – Notes on gold potential, Exploration Alliance
Limited
Hurley, P.M., Leo, G.W., White, R.W. and Fairbairn, H.W. 1971. Liberian Age Province
(about 2700 m.y.) and adjacent Provinces in Liberia and Sierra. Geol. Soc. Am. Bull. 82.
SRK ES, 2012, Competent person’s report (CPR) on exploration licence no. El 54/2011 for
Sula Iron & Gold Plc, Sierra Leone’
SRK ES, 2012, Property valuation for Sula Gold Plc for the Blue Horizon Exploration Licence
(El54/2011), Sierra Leone’
SRK ES, 2012, ‘Ground magnetic survey over the south western part of the Blue Horizon
exploration property, Sierra Leone’
Tunningley, A.T., 2012, Blue Horizon Exploration Licence – Field Review and Work
Program design, Exploration Alliance Limited
Blue Horizon Property Valuation – Main Report
Final_Blue Horizon Property valuation update 2014_v8_DJM.docx January 2014 Page 30 of 30
SRK Exploration Services Report Distribution Record
Report No. ES7536
Copy No. Final
Name/Title Company Copy Date Authorised by
Mr Nick Warrell Sula Iron & Gold Draft 16/01/2014 O’Donovan
Mr Nick Warrell Sula Iron & Gold Final 20/1/2014 O’Donovan
Approval Signature:
This report is protected by copyright vested in SRK Exploration Services Ltd. It may not be
reproduced or transmitted in any form or by any means whatsoever to any person without the written
permission of the copyright holder, SRK ES