Embed Size (px)
Citation preview
MAX - PLANCK -INSTITUT FOR QUANTENOPTIK
Proposal for a Joint
German- British Interferometric
Gravitational Wave Detector
M P Q 147 September 1989 GWD/137/ J H(89)
Proposal for a Joint
German-British -Interferometric
Gravitational Wave Detector
J. Hough, B.J. Meers, G.P. Newton, N.A. Robertson, H. Ward
Department of Physics and Astronomy, University of Glasgow
G. Leuchs, .T.M~ Niebauer, A. Rudiger, R. Schilling, L. Schnupp, H. Walther, W. Winkler
Max-Planck-Institut fur Quantenoptik, Garching
B.F. Schutz
Department of Physics, University of Wales, Cardiff
J. Ehlers, P. Kafka, G. Schafer
Max-Planck-Institut fur Astrophysik, Garching
M.W. Hamilton
Department of Physics and Applied Physics, University of Strathclyde, Glasgow
I. Schutz, H. Welling
Laser-Zentrum und Institut fur Quantenoptik, Universitiit Hannover
J.R.J. Bennett, I.F. Corbett, B.W.H. Edwards, R.J.S. Greenhalgh
Rutherford App/eton Laboratory, Chi/ton, near Oxford
v. Kose
Physika/isch- Technische Bundesansta/t, Braunschweig
Contact persons are indicated in bold face.
Acknowledgelllents
The authors would lil<e to acknowledge gratefully the help of the follovving in thepreparation of tllis report:
Other members of the gravitational wave research group at the Departmentof Physics and Astronomy, University of Glasgow.
Other members of the gravitational wave research group at the Max-Plancl<Institut fur Quantenoptik.
J. Gea-Banacloche at the University of Madrid.
N. MacDonald at the Department of Physics and Astronomy, University ofGlasgow.
The Council vVorks Unit of the SERC.
Staff at the Bauabteilung of the Max-Planck-Gesellschaft.
The Forestry Commission of the United Kingdom.
The Planning Department and the District Council of North-East Fife,United Kingdom.
The work at the Universities of Glasgow and Wales is supported by the Universities and by the Science and Engineering Research Council. The vvorl{ at theMax-Planck-Institut fur Quantenoptik is supported by the BundesministeriuJ? furForschung und Technologie.
Preface
For many years there has been steady progress towards the detection of gravitational radiation. It has now become clear that the next major step sllould be tIleconstruction of a number of long-baseline detectors around the vvorld. An array ofdetectors of this type is expected to allow the observation of gravitational wavesfrom a range of astrophysical sources, leading to improved insight in many areasincluding stellar collapse, binary coalescence and the expansion of tIle Universe.
We propose that one of these detectors be built by a collaboration formed aroundthe gravitational wave groups in Britain and Germany. In tllis document vvepresent our case for tllis collaborative venture and outline the design philosophyof our proposed instrument - an interferometric detector with arms of length closeto 3km.
Two detectors of the same general type are planned for the USA (LIGO project),one is planned for Italy (Italian/French VIRGO project) and another is proposedfor Australia (AIGO project). It is expected that all the long baseline detectors tobe built will operate as part of a coordinated worldwide networl{.
Contents
1 Introduction
1.1 Gravitational Wave Detection .
1.1.1 Resonant bar detectors
1.1.2 Detectors using laser interferometry
1.2 Proposed British/German Detector System
1.2.1 Scientific objectives .
1.2.2 Research groups and their experience
1.2.3 The British/German proposal .
2 TIle Scientific Case
2.1 Introduction.........
2.1.1 Gravitational waves
2.1.2 Key characteristics of the detector
2.1.3 Observing in a worldwide network
2.2 Detectability of Possible Sources of Gravitational Radiation .
2.2.1 Supernovae ....
2.2.2 Coalescing binaries.
2.2.3 Pulsars and other continuous-wave sources.
2.2.4 Stochastic background radiation . . . . .
2.2.5 Unpredicted sources .
2.3 Scientific Output of an Interferometric Detector ..
3 Interferometric Gravitational Wave Detectors
3.1 Interferometer Types .
3.2 Sensitivity and Noise Sources
3.2.1 Shot noise in a simple interferometer . .
1
1
2
2
4
4
4
5
7
7
7
8
9
11
11
12
15
18
19
20
23
23
24
25
25
28
31
32
35
35
38
...... 42
42
42
3.3 Squeezed Light Techniques
3.2.2 Shot noise in recycled interferometers
3.2.3 Other noise sources. . . . .
3.2.4 Some basic noise formulae.
4 Proposed Detector System
4.1 The Proposed Delay Line System . . . . . . . . .
4.2 Commissioning of the Delay Line Interferometer
4.3 Proposed Second Detector with Fabry-Perot Cavities.
4.4 Interferometer Control Systems . . . . . . . . . . . . . .
4.4.1 Axial control of main interferometer components
4.4.2 Alignment control of the interferometer and associated opticalcomponents. . . . . . . . . . . . . . 42
4.5
4.6
Laser Stabilisation Requirements . . . . . . . . . .
4.5.1 Mode cleaning and frequency stabilisation .
4.5.2 Power stabilisation .
Laser Systems. . . . . .
4.6.1 Argon ion laser .
4.6.2 Nd:YAG laser ..
45
45
46
46
47
47
5 The Vacuum System
Introduction. . . . .
Detailed Description
5.1
5.2
5.2.1
5.2.2
5.2.3
5.2.4
5.2.5
The tube
Tanks ..
Vacuum system design.
Bake-out
Monitoring and control
49
49
49
51
51
51
55
55
6 Vibration Isolation
6.2 Elements of the Vibration Isolation System
6.3 Combined Performance .
6.4 Suspension of Test Masses and Oth-er Optical Elements
6.1 Introduction. . .
57
57
59
61
62
7 Data Acquisition and Analysis
7.1 Data Acquisition .
7.1.1 The interferometer signal and auxiliary data
7.1.2 Data volume .
7.1.3 Storage media .....
7.1.4 Hardware cost .
7.1.5 Data integrity. . .
7.1.6 Timing accuracy .....
7.1.7 Data acquisition computer.
7.2 Data Analysis .
7.2.1 The on-line computer system
7.2.2 The off-line computer system
8 Site, Buildings, and Services
8.1 Site .
8.1.1 Choice of site
8.1.2 Above or below ground
8.1.3 Geometry of detector and possible future extension ..
8.2 Buildings and Tube Housings
8.2.1 Buildings . . . .
8.2.2 Tube housings
8.3 Services . . . . . . . . .
8.3.1 Mechanical and electrical
8.3.2 Water......
8.3.3 Other services. .
9 Project Organisation and Costing
9.1 Management
9.2 Costs .
9.3 Running Costs
9.4 Timescale ....
9.5 Exchange of Personnel between the British Group and MPQ
65
65
65
66
66
66
67
68
68
68
69
70
73
73
73
74
74
75
75
75
77
77
77
77
79
79
80
82
83
84
A The Prototype Detectors at Garching and Glasgow
A.l Introduction. . . . . . . . . . . . . . .
A.2 The Prototype Detectors at Garching
A.2.l The 3 m prototype . .
A.2.2 The 30m prototype .....
A.2.3 Experiments with recycling and multiple mirror delay lines
A.2.4 Sensitivity of the 30 ill prototype .. .....
A.3 The Prototype 10 m Detector at Glasgow
A.3.1 Introduction ....
A.3.2 General description ..
A.3.3 Operation of the detector .....
A.3.4 Sensitivity of the 10 m detector
A.4 The 100 Hour Data Run . . . . . . . .
B International Collaborations
B.l European Collaborations ..
B.2 Australian Collaboration ..
B.3 Worldwide Collaboration
B.4 Specialised Collaborations .
References
87
87
87
87
88
89
90
91
91
91
92
92
94
95
95
95
96
96
97

Chapter 1
Introduction
Gravitational waves are ripples in the curvature of space-time produced by the acceleration of mass. Because the gravitational interaction is very weak, large masses and highaccelerations are needed to produce gravitational waves of significant amplitude. Theseare the very conditions that occur during violent astrophysical events. If the gravitational wave signals from such processes can be detected, new types of information willbe gained, qualitatively different from those produced by any other observations. Thisis the goal of this proposal- the opening of a new window on the Universe.
Despite the prediction of the existence of gravitational waves early in this century,it was not until the early 1960's that it was appreciated by Joseph Weber that theextremely weak signals might be experimentally detectable. His pioneering searchesappeared to yield positive results, which he interpreted as being due to gravitationalwaves of astrophysical origin. These findings caused a sensation in the astrophysicalcommuI].ity because of the strength of the signals as well as their frequency of occurrence.However, since then, these observations have not been confirmed by other groups whohave repeated searches for gravitational waves, some using improved techniques. It isonly within the last few years that the researchers in the field have been able to see howto build detectors of enough sensitivity to allow the detection of gravitational waves atthe levels predicted by astrophysics.
In this proposal, we outline the very significant returns to be gained from the observation of gravitational waves resulting from various types of astrophysical sources.Subsequently we describe the technology which the German/British group proposes toadopt for its detection system, and give a detailed estimate of the technological andengineering effort required.
1.1 Gravitational Wave Detection
The effect of a gravitational wave passing through a system of particles (or test bodies)is to induce a strain in space that changes the distances between the particles. Theamount of this change is proportional to the amplitude of the gravitational wave andto the separation of the particles. It is this change in separation which has to be
1
2 CHAPTER 1
experimentally detected against a background of perturbing influences. As is outlinedin Chapter 2 the strains in space caused by predicted gravitational wave events areexceedingly small - of the order of 10-22 to 10-21 over bandwidths of several hundredHz; the predicted frequency range of interest extends from tens of Hz to a few kHz.
Two main schemes for earth based detection of gravitational waves are being developed- sensing of the excitation of resonant bar detectors cooled to very low temperature,and laser interferometry between widely spaced test bodies.
1.1.1 Resonant bar detectors
Variants of the resonant bar detector are being developed by a number of researchgroups: at Stanford University, Louisiana State University, University of Maryland,University of Rome, University of Western Australia and by a collaboration in Japan.Currently Stanford, Louisiana and Rome, with bars of several tons mass cooled to below4!<: by liquid helium, have achieved strain sensitivities of close to 10-18 for pulses ofmillisecond duration. Further improvement can be expected, but it seems likely thatsuch detectors will have great difficulty in reaching an amplitude sensitivity better thanrv 10-2°. At this level the sensitivity limitation due to the Heisenberg UncertaintyPrinciple in the detection of displacement begins to play a role. Although theoreticalschemes for circumventing this limitation have been proposed, the problems in implementing them seem considerable. Furthermore, the fact that a solid bar is resonant innature will tend to restrict its bandwidth of operation to a small fraction of its resonantfrequency. This imposes a further limitation on the applicability of such detectors.
1.1.2 Detectors using laser interferometry
A totally different technique for the measurement of gravitational waves forms the basisof this proposal. The detector will use laser interferometry to sense the displacementchanges between widely separated test bodies. This method offers the highest potentialsensitivity and widest bandwidth for the detection of different types of sources.
The interferometric, method was pioneered by Forward [1] and Weiss [2]. Prototypedetectors of this type, with arm lengths ranging from 1 m to 40 m, have been constructedand operated at the Max-Planck-Institut fur Quantenoptik, Garching, at the Universityof Glasgow, at Caltech, at MIT, and at ISAS in Japan. The best sensitivities achievedso far are comparable to those of the cooled bar detectors.
In principle the change in separation of two test bodies hung a distance apart can bemeasured against the wavelength of light from a very stable source, but the degree ofwavelength (or frequency) stability required of the source is unreasonably high. It ismuch more practicable to measure the distance between test bodies along one arm withrespect to the distance between similar masses along a perpendicular, arm - i. e. to use
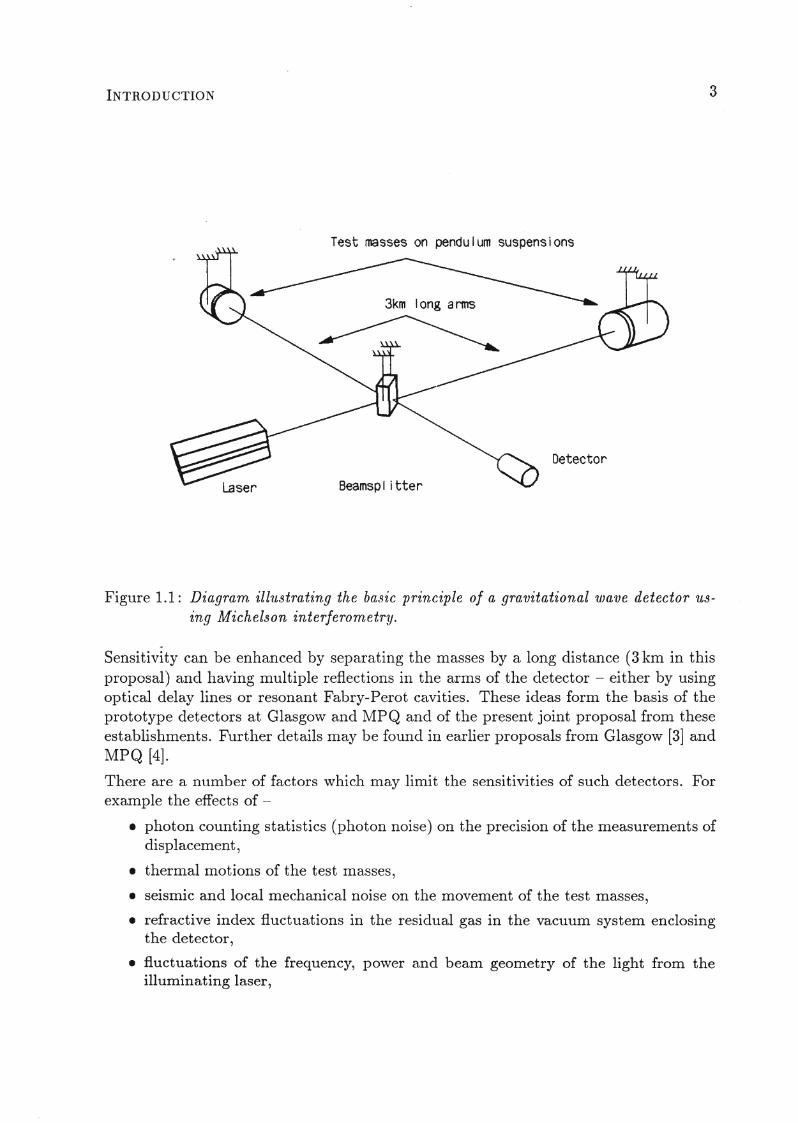
. a Michelson interferometer arrangement as in Figure 1.1. This layout is particularlyappropriate since the effect of a gravitational wave is quadrupole in nature and so tendsto cause the opposite sign of length change in the two arms.
INTRODUCTION
Test masses on -pendulum suspensions
Detector
Beamsp litter
3
Figure 1.1: Diagram illustrating the basic principle of a gravitational wave detector using Michelson interferometry.
Sensitivity can be enhanced by separating the masses by a long distance (3 km in thisproposal) and having multiple reflections in the arms of the detector - either by usingoptical delay lines or resonant Fabry-Perot cavities. These ideas form the basis of theprototype detectors at Glasgow a.nd MPQ and of the present joint proposal from theseestablishments. Furtller details may be found in earlier proposals from Glasgow [3] andMPQ [4].
There are a ntlmber of factors which may limit the sensitivities of such detectors. Forexample tIle effects of -
• photon counting statistics (photon noise) on the precision of the measurements ofdisplacement,
• thermal motions of the test masses,
• seismic and local mechanical noise on tIle movement of the test masses,
• refractive index fluctuations in tIle residual gas in the vacuum system enclosingthe detector,
• fluctuations of the frequency, povver and beam geometry of the light from theillumiIlating laser,
4 CHAPTER 1
• light scattered inside the interferometer.
Again, the significance of each of these sources of noise has been assessed in the earlierproposals [4,3], and schemes have been pointed out for reducing them to an acceptablelevel..
1.2 Proposed British/German Detector System
1.2.1 Scientific objectives
The overall objective of the international gravitational wave community is the observation and interpretation of gravitational wave signals from astrophysical sources such asstellar collapses, coalescing compact binary systems, pulsars, and from various processesin the early evolution of the universe. Such observations will allow new information tobe obtained - for example on the mechanisms of stellar collapse, on the expansion ofthe universe and on the equation of state of neutron star material. The consensus ofopinion is that to achieve this goal requires the construction of a worldwide network ofat least four laser interferometer detectors.
The British and German research groups involved wish to construct and operate oneof these detector systems. Two detectors are planned to be built in the USA (LIGO
project, [5]), one is planned for Italy (Italian/French VIRGO project, [6]), and one isbeing proposed in Australia (AlGa project, [7]).
1.2.2 Research groups and their experience
Considerable experience in the design and operation of prototype versions of interferometric detectors has been gained by the research groups at Garching and Glasgow,both of which have been active in the gravitational wave field since the early 1970's.The experimental group at Glasgow has been greatly strengthened over the last fewyears by collaboration with a theoretical group interested in analysis of signals fromgravitational wave detectors, led by Professor B.F. Schutz at the University of Wales.Important engineering support is being provided by the Rutherford Appleton Laboratory. Right from the start, the work of the experimental group at Garching has benefitedconsiderably from close contact with colleagues at the Max-Planck-Institut fur Astrophysik, especially with the Department of General Relativity led by Professor JiirgenEhlers.
With our prototypes in Garching and Glasgow we have achieved some of the best sensitivities with laser interferometers. In addition we have recently demonstrated thepotential for long term operation of laser interferometric detectors by carrying out a100 hour period of coincident observation using the 30 m arm length delay line systemat Garching,and the 10m arm length Fabry-Perot based system at Glasgow. Moredetails on the prototypes and the data run are presented in Appendix A.
INTRODUCTION 5
Well known noise sources, particularly thermally excited vibrations of the mirror substrates, but also the fundamental limit due to the Uncertainty Principle, do not allowthe present prototype detectors to be upgraded to the sensitivity level required for arealistic prospect of detecting gravitational wave signals from predicted sources. Theselimitations can be overcome only by the use of a long baseline detector system. TheBritish and German groups are now committed to a joint proposal for such an instrument. The prototype detectors will henceforth provide a testbed for new technologies,techniques, and concepts before they are implemented in the full-scale detectors.
1.2.3 The British/German proposal
It will become clear in the next chapter that if a high probability of making gravitational wave observations is to be achieved a sensitivity goal equivalent to 10-22 over abandwidth of several hundred Hz is necessary for each detector in the network. In orderto meet the high sensitivity requirements we propose a large interferometer, with armsof 3 km in length.1
Nevertheless the envisaged sensitivity cannot be expected to be achieved initially inthe operation of a detector system, but must be approached in stages. To allow forthis, and in an effort to maximise the returns from the capital investment, we believethat we must plan for two interferometer systems to be installed in our detector; oneinterferometer may then be developed while another is operating.
We would anticipate that the first interferometer installed should reach a sensitivityapproaching 10-21 for millisecond pulses within about three years of the facility beingcommissioned and then would be operated for several years. During the operationalphase some development would be carried out with the aim of improving the sensitivityto 10-22 for millisecond pulses. Also during this time another interferometer systemwould be developed to operate down to lower frequency (I"V 100 Hz) with high sensitivity(:::; 10-22 ). The two interferometers mentioned above would lie parallel to each other inthe same vacuum housing.
The geometry envisaged is two arms with an opening angle of either 90° or 60°, bothvariants having their own merits. The choice depends on various boundary conditions,particularly on the choice of the site and on the plans for possible future extension.Further discussion of this question is presented in Chapter 8.
1It should be noted that this proposal differs from the earlier British proposal in that a longer armlength - 3 km - is being suggested at the first stage. This change .has been made to allow thesensitivity goals to be approached with a higher level of confidence and to bring the detector designmore into line with those being planned elsewhere.

6
Chapter 2
The Scientific Case
2.1 Introduction
The scientific case for building a large interferometric gravitational wave detector wasfully 1nade in the proposals submitted by the two groups in 1986 and 1987 [3,4], and sincethen some extensive reviews have appeared (especially [8] and [9]). In this section we willgive a brief review of the case, stressing what we have learned since the proposals weresubmitted. We will tie the discussion to the planned progression of the interferometerinstallation: a first stage reaching a sensitivity level of 10-21 over a 1 kHz bandwidth,followed by progress to 10-22 at kHz frequencies, a second detector optimised for lowfrequency observing down to 100 Hz, and a final extension of sensitivity down to lowerfrequencies.
2.1.1 Gravitational waves
Gravitational waves are a property of any theory of gravity in which influences propagateat a finite velocity. Einstein's theory of general relativity is the only theory of gravitytoday that has passed the stringent experimental tests of the past two decades [10].For our purposes one of the most important of these tests is that general relativitycorrectly predicts the rate of orbital decay of the Binary Pulsar PSR 1913+16 dueto gravitational radiation. This is the only test so far of the predictions of the theoryregarding gravitational waves, and it is an indirect one, in that the waves themselves arenot detected. A direct detection of gravitational waves is still of the greatest importancefor physics, and we shall see that our proposed detector can perform a range of otherdirect tests as well.
Within general relativity, gravitational waves travel at the speed of light, have twoindependent transverse polarisations, and are characterised by an amplitude that isconventionally called h, which is twice the strain induced in a system of free particlesby the gravitational wave. In the optimal orientation, a laser interferometric detectormeasures twice this strain, so the minimum detectable h characterises the detector'ssensitivity. The maximum amplitude of gravitational waves expected from sources in
7
8 CHAPTER 2
our Galaxy is 10-18 , and that only once every decade or so. The maximum amplitudeexpected from extragalactic sources that might occur more than once per year is 10-21
,
which could come from supernovae in the Virgo Cluster, where there are several thousand galaxies. Our design is aimed at providing amplitude sensitivity ten times betterthan this.
Although gravitational waves are difficult to detect, they carry enormous amounts ofenergy. The energy flux of a gravitational wave of frequency f and amplitude h is givenby
:Fgw = 3.2 X 10⁻³ [l!Hzr [1O~22r W rn-
2. (2.1)
In astronomers' language, a 1 kHz wave with amplitude 10-22 is as bright as a starof apparent magnitude -13, some 105 times brighter than the brightest star in thenight sky. By integrating this equation over a sphere of radius r for a time 7 we findthe relation between the amplitude h of an isotropic wave and the energy E it carriesduring a time r:
[E
]1/2 [ f ] -1 -1/2 [ ] -1h - 1 4 10-21 _0__ __7_ r
- • X 10-2 M0 c2 1 kHz [1 ms] 15 Mpc · (2.2)
For convenience we normalise total energies to 10-2 M 0 c2 (a fairly large burst for aconventional supernova) and distances to the distance to the Virgo Cluster.
2.1.2 Key characteristics of the detector
While many factors affect the ultimate sensitivity of a detector, they combine intorelatively few key properties that determine how much science they can do. These are,in order of importance,
• Broadband sensitivity. The usual way of characterising the performance ofa detector is to give its sensitivity to the sort of broadband bursts that are expected from supernova explosions: a typical frequency of 1 kHz and a bandwidth of500 Hz. With various combinations of laser power, mirror reflectivity, length, andother factors, it seems possible with our proposed design to reach a photon-noiselimited strain sensitivity of 10-22 or even better. We shall denote the standarddeviation (a) of the broadband noise of a detector by abbe This is given in terms ofthe characteristics of the detector in Equation 3.6. If the arms of a detector makean angle a with each other, then abb will contain a factor of sin a, the reductionin sensitivity relative to a right-angled detector. In all our equations, we shallassume that such a factor is included in abb where appropriate. This angle doesnot affect any sensitivity formula in any other way.
A detector that is capable of reaching a certain broadband sensitivity can be usedfor other kinds of observing, such as looking for lower-frequency coalescing binaries, pulsars, or a stochastic background. As we discuss in Chapter 3, by reconfiguring a detector's optics, it can be optimis-ed for low-frequency sources (near
THE SCIENTIFIC CASE 9
100 Hz, say), or narrow-banded to search for specific continuous wave sources.Since we are designing it to reach the photon-noise sensitivity limit over mostof its useful observing spectrum, its ultimate effectiveness will depend at leastin part on the sensitivity it would achieve if optimised for broadband observing.We will therefore quote sensitivity limits for various kinds of sources in terms ofabbe Thus, we will make statements such as: A 10-22 detector, when optimisedfor detecting coalescing binaries, can see such binaries at 100 Mpc distance witha signal-to-noise ratio of 25.
• Lower cutoff frequency. Photon noise, however, may not be the dominant noiseat all frequencies. Seismic noise and thermal noise in the suspension rise at lowfrequencies, so there is a lower cutoff frequency fIe below which our photon-noiselimited sensitivity formulas do not apply. If the cutoff is due to seismic noise, whosespectral density rises steeply at low frequencies, then fIe is essentially the lowestobserving frequency. If the seismic cutoff can be pushed to very low frequencies,then the suspension's thermal noise will still force fIe to stay at about 100 Hz,but~ some kinds of observations may yet be possible below this frequency againstthe more gradually rising thermal noise spectrum. In this scientific case we willemphasise mainly the observations that can be made above 100 Hz, but we willnote the improvements that extending the range down to lower frequencies couldbring.
• Mirror reflectivity and arm length. There are two other important characteristics of the detector, the length Rof each arm and the quality of the mirrors,which is given by the mirror losses 1- R, where R is the reflectivity of the mirrorsin the arms. For observations of supernovae and coalescing binaries, arm lengthand mirror quality affect sensitivity only through the one parameter abb, so theydo not need to be considered separately. For certain kinds of observing, however,such as pulsars and stochastic sources, these parameters are independent and needto be included in our sensitivity formulae. (See, for exalnple, the formula for thenarrow-band sensitivity anb, Equation 3.7.) We shall normalise the length R to3 km and the mirror losses 1 - R to 5 X 10⁻⁵
•
2.1.3 Observing in a worldwide network
Gravitational wave detectors cannot operate alone; detections must be confirmed bycoincidences between two separated detectors. But two detectors cannot supply enoughinformation to reconstruct the gravitational wave itself, i. e. to infer its amplitude, polarisation, and direction of travel. Solving this "inverse problem" is crucial to getting scientific information from the detectors, and it requires at least three detectorsaround the world. In order to allow for non-optimal orientation, operational down-time,special-purpose uses such as narrow-banding, and detector development, detectors atfour separated sites worldwide is a sensible minimum.
We will see in Chapter 3 that it is not optimal to span the entire frequency range ofinterest (100 Hz to several kHz) with a single detector. Each site will need at least
10 CHAPTER 2
two, one optimised for low frequencies, the other for high frequencies. There are furtheradvantages from having three differently oriented (hence, differently polarised) detectorson one site. Detectors on the same site lie in the same plane, and this allows a cleanmeasurement of polarisation, without the complications of using separated detectorsof different polarisation that lie in different planes. Detectors on the same site alsohave no propagation time delay; this allows lower thresholds (see next paragraph) andpermits simpler cross-correlation experiments. The system currently proposed has beendesigned to allow for an extension to three detectors.
Since detector sensitivity is limited by internal and local noise sources, presumablyuncorrelated between separated sites, coincidence experiments have a lower false-alarmrate (noise-generated coincidence rate) at a given threshold than individual detectors do.For a given false-alarm rate (we adopt once per year in this proposal), the more detectorsa network has, the lower will be the threshold it can operate at. Thus, each additionaldetector improves the performance of all the others. The performance of a network issomewhat degraded by the fact that one needs to allow coincidence "windows" for thepropagation of a gravitational wave from one detector to another. All these effects arefully taken into account in the threshold levels assumed in this proposal [11].
Much coincident observing among separated detectors can be done by exchanging listsof candidate "events", where the detector output has crossed a threshold either in thetime series data or in various matched filter outputs. (Matched filters for coalescingbinary signals will be discussed below.) But, as we show later, some observing mayinvolve cross-correlation of the full data sets, such as searching for unknown sources,and especially looking for a stochastic background. Moreover, even simple coincidencedetections can be made with a lower threshold if the data are added coherently beforefiltering, rather than subjecting each data stream to individual filters that must eachcross the threshold, as we have assumed above.
Recognising this, the international laser interferometric detector community has resolvedto cooperate on key areas, two of which are to standardise data taking conventions andto agree on data analysis and exchange protocols. It is therefore important that alldetector projects make adequate provision for analysing not only their own data butalso for the joint analysis of all sites' data. We return to this in Chapter 7.
.Of course, we will also watch for possible coincidences with other instruments, particularly bar gravitational wave detectors and neutrino detectors. The effectiveness ofcoincidence runs between laser interferometers and bars will depend on how sensitivebars eventually become; their narrow bandwidth and poorer time resolution are furthercomplications. Neutrino detectors should prove to be very effective coincidence partnersfor gravitational collapse events in our Galaxy; they should allow gravitational wave detectors to operate at a threshold as low as 20"bb for such events. But they are unlikelyto be able to register neutrinos from collapses in the Virgo Cluster in the foreseeablefuture.
We shall now turn to an examination of the most likely gravitational wave sources,expressing the detectability of each source in terms of the key detector characteristicsdescribed earlier and those of the source. After that we will be in a position to discuss
THE SCIENTIFIC CASE 11
the ultimate justification for building this detector: the science that it will do. Thereader who is more interested in the scientific possibilities than in the details of sourceestimates and detector noise performance may go straight to that section, which isself-contained.
2.2 Detectability of Possible Sources ofGravitational Radiation
The following list of sources is by no means exhaustive, but it contains those that arethe most likely to be detected, based on our present understanding of them.
2.2.1 Supernovae
(2.3)
Supernovae, or more generally gravitational collapses, have been the primary goal ofgravitational wave detector development. We know little about the precise waveform toexpect, but numerical modelling and theoretical arguments suggest that the burst willhave a central frequency of about 1000 Hz and will last for one or two cycles. Providedwe can model such a burst at least crudely, the signal-to-noise ratio depends on O"bb, onthe total energy E released in the burst, and on the distance r to the source:
S -1 [ E ] 1/2 [ ] -1
(N)supernovae = 10 [1~:~2] 10-2M0 c2 15~pc ·
Because detector noise will generate spurious "events", a detection threshold must beset that allows, say, only one such false alarm coincidence in a network of detectors peryear. A reasonable threshold on the signal-to-noise ratio is 4 for a network of 3 or 4detectors. A first-stage high-frequency detector, with O"bb == 10-21 , could detect a largeburst of 0.1 M 0 c2 energy from the Virgo Cluster, and could see a collapse in our ownGalaxy that generates as little as 10-7 M 0 c2 of gravitational wave energy. A supernovain Virgo could be seen by the next stage detector (operating at 10-22 ) if it releases only10-3 M0 c2 of energy in gravitational waves. An event that releases 10-2 M0 c2 of energycould be detected as far away as 40 Mpc, a volume of space in which there are several"starburst" galaxies and several hundreds of supernovae per year.
It is difficult to predict the strength of the radiation from a typical supernova, becauseperfectly spherical gravitational collapses produce no radiation at all. With a smallamount of rotation a collapse becomes nonspherical but remains axisymmetric, andnumerical simulations suggest that the formation of a neutron star in this way will yieldbetween 10-6 and 10-4 solar masses of energy [12]. With more rotation, instabilitiesshould force the collapsing stellar core into a non-axisymmetric form, with the likelyemission of much larger amounts of energy. If the burst is still short-lived, then ourestimates above mean that the 10-22 detector will have an excellent chance of seeingone from Virgo. If the energy comes out over several rotation periods, then numericalsimulations will be required in order to provide a template waveform with which to filterthe data; but in this case the sensitivity of the detector will be likely to be higher than for
12 CHAPTER 2
a millisecond burst of the same energy [13]. The numerical modelling of gravitationalcollapse is under development in a number of research groups, including Cardiff andGarching (MPI fiir Astrophysik), using Cray X-MP computers. It is very likely thatuseful template waveforms will have been produced before the first-stage 10-21 detectorsare operating.
The amount of rotation in a typical collapse is hard to predict, but the case for occasional events in which rotation dominates would be strong if the report of a pulsar inthe remnant of SN1987a, with a pulse period of nearly 2 kHz, is confirmed [14]. Studiesof neutron star models show that a star rotating that fast must either still be subjectto a slowly-growing gravitational wave instability, or else it must be very close to suchan instability. It would be very hard to form such a star without its having undergonenonaxisymmetric deformation, with the emission of considerable gravitational wave energy either as a burst or over a relatively few cycles of rotation. 1 Given the detectionrange of 60 Mpc, it would be surprising indeed if none' of the thousand or so supernovaeper year in that volume produced radiation of this magnitude.
2.2.2 Coalescing binaries
Since most stars begin as members of binary star systems, it is likely that a substantialfraction remain binary after the individual stars have completed their evolution andbecome either white dwarfs, neutron stars, or black holes. A small number of these willhave been brought so close together during earlier phases of binary evolution that theirorbital lifetime against the loss of energy to gravitational radiation is less than the ageof the Universe. Such systems will coalesce in an astronomically short time. Systemscontaining white dwarfs are not of interest to us here, since they coalesce before theirorbital radiation reaches a frequency we could observe. But those composed of highlycompact objects - neutron stars and/or black holes - can produce observable radiation.
Coalescing binaries give off a great deal of energy before they coalesce. As the radiationfrom a system consisting of two 1.4 M0 neutron stars changes from 100 to 200 Hz, thewaves carry away some 5 x 10⁻³ M 0 c2 in energy, comparable to a decent supernova burst.Because this energy is spread out over many cycles, the waves' amplitude is smaller thanone would expect from a supernova. Nevertheless, by matched filtering it is possible toattain a much higher signal-to-noise ratio than for a comparable sup·ernova.
There is one well-known binary coalescence precursor system in our Galaxy: the famousBinary Pulsar, PSR 1913+16, which has a remaining lifetime of about 108 years beforeit will coalesce. Importantly, a second such system, PSR 2127+11C, has very recentlybeen discovered in the globular cluster MI5 [15]. Its pulse and orbital characteristicsare remarkably similar to those of PSR 1913+16. The masses of the component starswill not be known until the periastron shift is measured, but if we assume a pulsar massof 1.4 Mo, then the minimum companion mass allowed by the mass function is 0.94 M 0 .
IThe report by Pizzella and collaborators of apparent coincidences between bar detectors and neutrinodetectors near the time of SN1987a has nothing to do with this scenario. Pizzella himself points outthat these coincidences are inconsistent with standard general relativity.
THE SCIENTIFIC CASE 13
This implies a maximum remaining lifetime of 109 years. If we take the likely companionmass to be 1.4M0 , then the lifetime of PSR 2127+11C is half that of PSR 1913+16.Furthermore, it is possible that PSR 0021-72A, in the globular cluster 47 Tuc, is alsoa precursor with a short lifetime [16]. Unfortunately, this pulsar is at the limit ofdetectability, and exhibits a number of unexplained features, so it is too soon to drawconclusions about it.
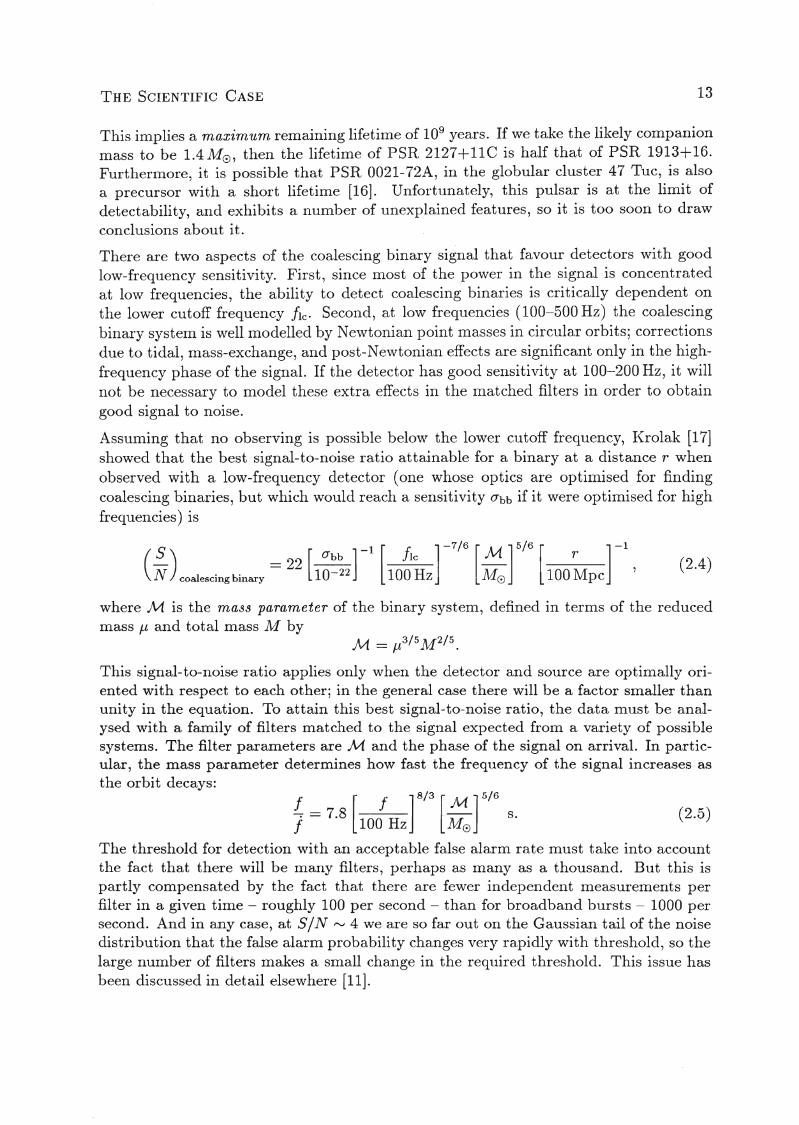
There are two aspects of the coalescing binary signal that favour detectors with goodlow-frequency sensitivity. First, since most of the power in the signal is concentratedat low frequencies, the ability to detect coalescing binaries is critically dependent onthe lower cutoff frequency fIe. Second, at low frequencies (100-500 Hz) the coalescingbinary system is well modelled by Newtonian point masses in circular orbits; correctionsdue to tidal, mass-exchange, and post-Newtonian effects are significant only in the highfrequency phase of the signal. If the detector has good sensitivity at 100-200 Hz, it willnot be necessary to model these extra effects in the matched filters in order to obtaingood signal to noise.
Assuming that no observing is possible below the lower cutoff frequency, Krolak [17]showed that the best signal-to-noise ratio attainable for a binary at a distance r whenobserved with a low-frequency detector (one whose optics are optimised for findingcoalescing binaries, but which would reach a sensitivity O"bb if it were optimised for highfrequencies) is
S -1 [ f ] -7/6 [ M ] 5/6 [ ]-1_ = 22 O"bb J le __ r(N)coalescing binary [ 10-22 ] 100 Hz M0 100 Mpc 1(2.4)
(2.5)
where M is the mass parameter of the binary system, defined in terms of the reducedmass fl and total mass M by
M = fl3/5 M 2/ 5 •
This signal-to-noise ratio applies only when the detector and source are optimally oriented with respect to each other; in the general case there will be a factor smaller thanunity in the equation. To attain this best signal-to-noise ratio, the data must be analysed with a family of filters matched to the signal expected from a variety of possiblesystems. The filter parameters are M and the phase of the signal on arrival. In particular, the mass parameter determines how fast the frequency of the signal increases asthe orbit decays:
£ _ [ f ] 8/3 [ M ] 5/6. - 7.8 . s.f 100 Hz M 0
The threshold for detection with an acceptable false alarm rate must take into accountthe fact that there will be many filters, perhaps as many as a thousand. But this ispartly compensated by the fact that there are fewer independent measurements perfilter in a given tiIIle - roughly 100 per second - than for broadband bursts - 1000 persecond. And in any case, at S /.lV I"V 4 we are so far out on the Gaussian tail of the noisedistribution that the false alarm probability changes very rapidly with threshold, so thelarge number of filters makes a small change in the required threshold. This issue hasbeen discussed in detail elsewhere [11].
14 CHAPTER 2
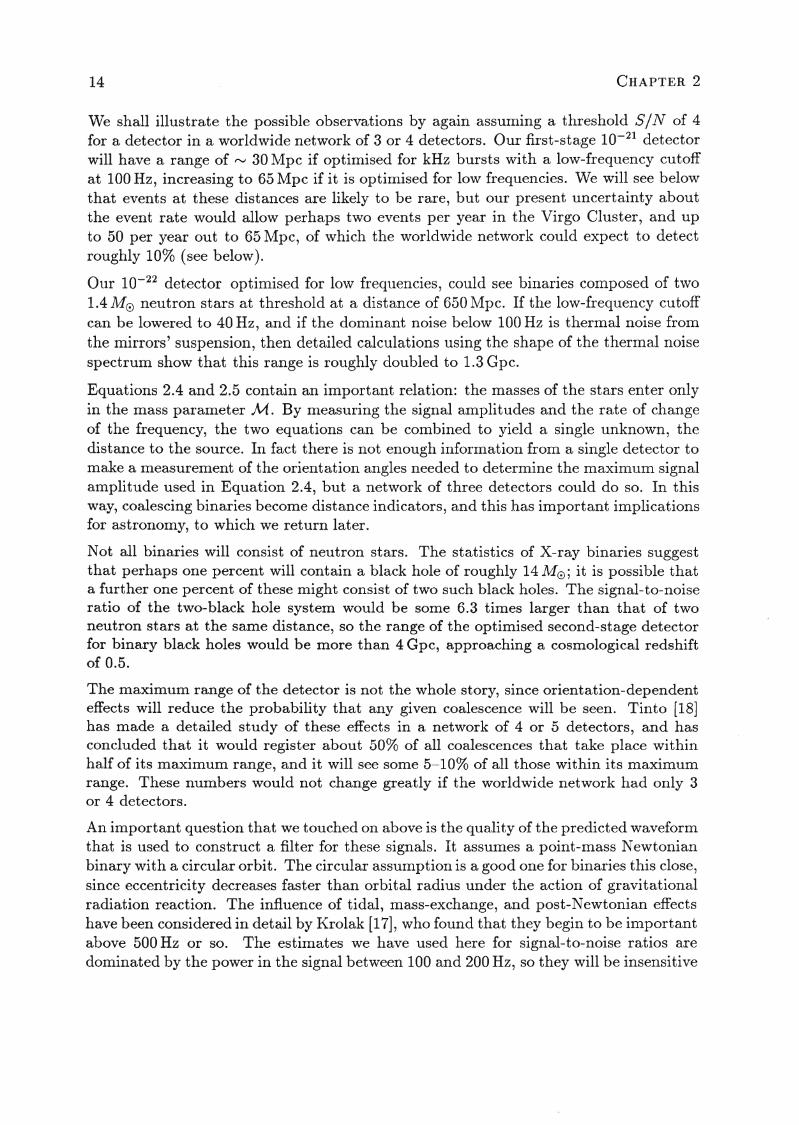
We shall illustrate the possible observations by again assuming a threshold S / N of 4for a detector in a worldwide network of 3 or 4 detectors. Our first-stage 10-21 detectorwill have a range of rv 30 Mpc if optimised for kHz bursts with a low-frequency cutoffat 100 Hz, increasing to 65 Mpc if it is optimised for low frequencies. We will see belowthat events at these distances are likely to be rare, but our present uncertainty aboutthe event rate would allow perhaps two events per year in the Virgo Cluster, and upto 50 per year out to 65 Mpc, of which the worldwide network could expect to detectroughly 10% (see below).
Our 10-22 detector optimised for low frequencies, could see binaries composed of two1.4 M 0 neutron stars at threshold at a distance of 650 Mpc. If the low-frequency cutoffcan be lowered to 40 Hz, and if the dominant noise below 100 Hz is thermal noise fromthe mirrors' suspension, then detailed calculations using the shape of the thermal noisespectrum show that this range is roughly doubled to 1.3 Gpc.
Equations 2.4 and 2.5 contain an important relation: the masses of the stars enter onlyin the mass parameter M. By measuring the signal amplitudes and the rate of changeof the frequency, the two equations can be combined to yield a single unknown, thedistance to the source. In fact there is not enough information from a single detector tomake a measurement of the orientation angles needed to determine the maximum signalamplitude used in Equation 2.4, but a network of three detectors could do so. In thisway, coalescing binaries become distance indicators, and this has important implicationsfor astronomy, to which we return later.
Not all binaries will consist of neutron stars. The statistics of X-ray binaries suggestthat perhaps one percent will contain a black hole of roughly 14M0 ; it is possible thata further one percent of these might consist of two such black holes. The signal-to-noiseratio of the two-black hole system would be some 6.3 times larger than that of twoneutron stars at the same distance, so the range of the optimised second-stage detectorfor binary black holes would be more than 4 Gpc, approaching a cosmological redshiftof 0.5.
The maximum range of the detector is not the whole story, since orientation-dependenteffects will reduce the probability that any given coalescence will be seen. Tinto [18]has made a detailed study of these effects in a network of 4 or 5 detectors, and hasconcluded that it would register about 50% of all coalescences that take place withinhalf of its maximum range, and it will see some 5-10% of all those within its maximumrange. These numbers would not change greatly if the worldwide network had only 3or 4 detectors.
An important question that we touched on above is the quality of the predicted waveformthat is used to construct a filter for these signals. It assumes a point-mass Newtonianbinary with a circular orbit. The circular assumption is a good one for binaries this close,since eccentricity decreases faster than orbital radius under the action of gravitationalradiation reaction. The influence of tidal, mass-exchange, and post-Newtonian effectshave been considered in detail by Krolak [17], who found that they begin to be importantabove 500 Hz or so. The estimates we have used here for signal-to-noise ratios aredominated by the power in the signal between 100 and 200 Hz, so they will be insensitive
THE SCIENTIFIC CASE 15
to any such corrections. On the other hand, if such effects can be modelled reliablythen they can be used to improve the signal-to-noise ratios we have quoted here, andto extract further astrophysical information from the observations.
The event rate out to any distance is very uncertain, however, since our estimates relyon the two firmly identified precursor systems, PSR 1913+16 and PSR 2127+11C. Themost likely value for the rate is probably 3 events per year out to 100 Mpc [19], whichwould give an event rate in a network of 3 or 4 optimised 10-22 detectors of 40-80 peryear. We had elsewhere ~stimated [11] that this rate may be uncertain by a factor of 100either way, allowing a detection rate that could range from one every two years up toseveral thousand per year. But the recent discovery of the second coalescence precursorPSR2127+11C [15] considerably reduces the small-number-statistics uncertainty in thisestimate, placing the likely event rate between 3 and several thousand per year. Furtherpulsar searches currently underway by the same group may well raise this yet again byovercoming some of the selection effects that inhibit the discovery of pulsars in highlyeccentric binaries.
2.2.3 Pulsars and other continuous-w-ave sources
There are many possible long-lived or continuous sources of gravitational radiation in thefrequency range accessible to our proposed detector. These include pulsars with "lumps"in their crust; unstable pulsars spinning down after having been formed with too largean angular velocity; and unstable accreting neutron stars where the instability is beingdriven by the accretion of angular momentum ("Wagoner stars"). Little is known abouthow many such sources in our Galaxy emit significant amounts of radiation, but theproposed detector would be able to set very stringent limits on this.
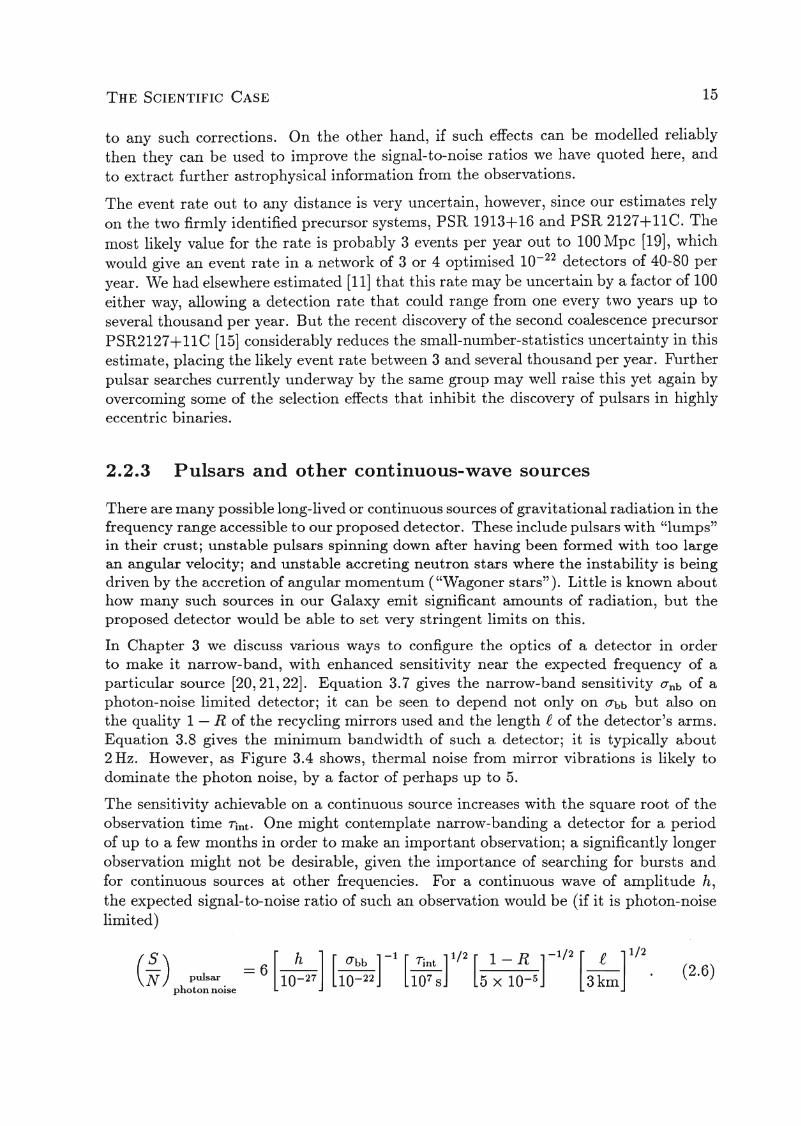
In Chapter 3 we discuss various ways to configure. the optics of a detector in orderto make it narrow-band, with enhanced sensitivity near the expected frequency of aparticular source [20,21,22]. Equation 3.7 gives the narrow-band sensitivity O"nb of aphoton-noise limited detector; it can be seen to depend not only on O"bb but also onthe quality 1 - R of the recycling mirrors used and the length f of the detector's arms.Equation 3.8 gives the minimum bandwidth of such a detector; it is typically about2 Hz. However, as Figure 3.4 shows, thermal noise from mirror vibrations is likely todominate the photon noise, by a factor of perhaps up to 5.
The sensitivity achievable on a continuous source increases with the square root of theobservation time Tint. One might contemplate narroV\t-banding a detector for a periodof up to a few months in order to make an important observation; a significantly longerobservation might not be desirable, given the importance of searching for bursts andfor continuous sourc'es at other frequencies. For a continuous wave of amplitude h,the expected signal-to-noise ratio of such an observation would be (if it is photon-noiselimited)
16 CHAPTER 2
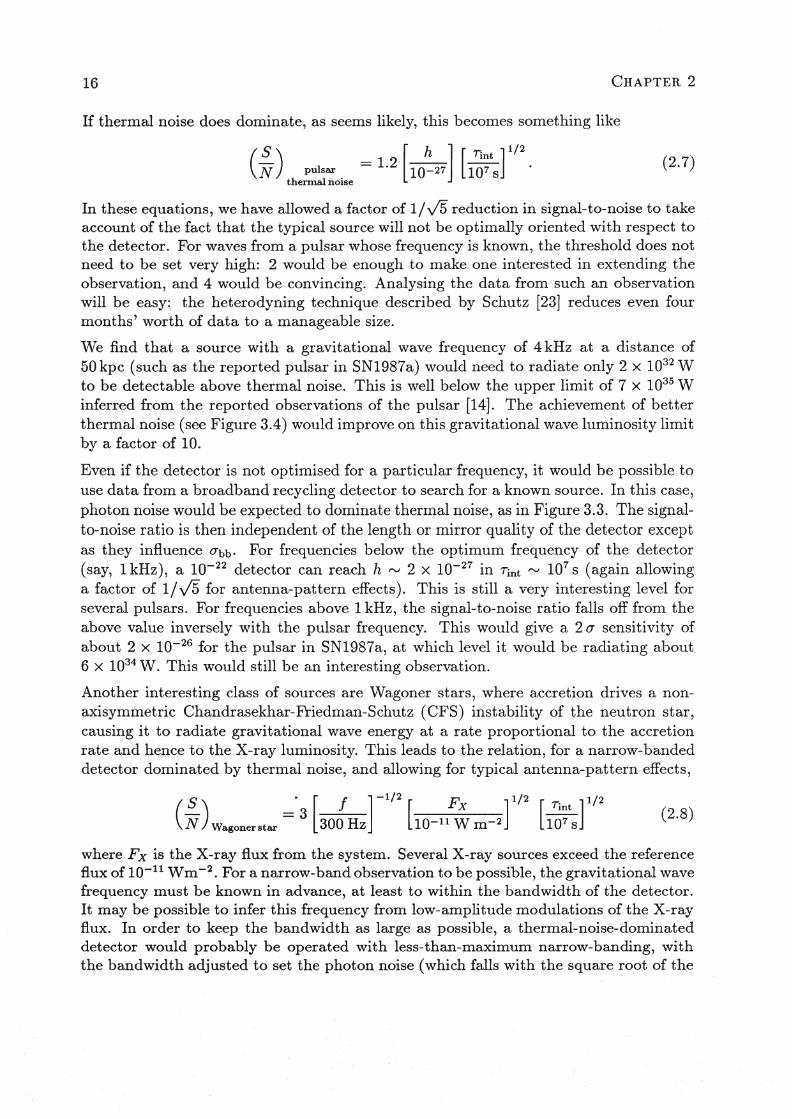
If thermal noise does dominate, as seems likely, this becomes something like
C~) pulsar =1.2[10~27] [1~~tsll/2.thermal noise
(2.7)
(2.8)
In these equations, we have allowed a factor of 1/v15 reduction in signal-to-noise to takeaccount of the fact that the typical source will not be optimally oriented with respect tothe detector. For waves from a pulsar whose frequency is known, the threshold does notneed to be set very high: 2 would be enough to make one interested in extending theobservation, and 4 would be convincing. Analysing the data from such an observationwill be easy: the heterodyning technique described by Schutz [23] reduces even fourmonths' worth of data to a manageable size.
We find that a source with a gravitational wave frequency of 4 kHz at a distance of50 kpc (such as the reported pulsar in SN1987a) would need to radiate only 2 x 1032 Wto be detectable above thermal noise. This is well below the upper limit of 7 x 1035 Winferred from the reported observations of the pulsar [14]. The achievement of betterthermal noise (see Figure 3.4) would improve on this gravitational wave luminosity limitby a factor of 10.
Even if the detector is not optimised for a particular frequency, it would be possible touse data from a broadband recycling detector to search for a known source. In this case,photon noise would be expected to dominate thermal noise, as in Figure 3.3. The signalto-noise ratio is then independent of the length or mirror quality of the detector exceptas .they influence O"bb. For frequencies below the optimum frequency of the detector(say, 1 kHz), a 10-22 detector can reach h r-..I 2 X 10-27 in Tint r-..I 107 s (again allowinga factor of 1/V5 for antenna-pattern effects). This is still a very interesting level forseveral pulsars. For frequencies above 1 kHz, the signal-to-noise ratio falls off from theabove value inversely with the pulsar frequency. This would give a 2 0" sensitivity ofabout 2 x 10-26 for the pulsar in SN1987a, at which level it would be radiating about6 X 1034 W. This would still be an interesting observation.
Another interesting class of sources are Wagoner stars, where accretion drives a nonaxisymmetric Chandrasekhar-Friedman-S·chutz (CFS) instability of the neutron star,causing it to radiate gravitational wave energy at a rate proportional to the accretionrate and hence to the X-ray luminosity. This leads to the relation, for a narrow-bandeddetector dominated by thermal noise, and allowing for typical antenna-pattern effects,
S · [ f ] -1/2 F 1/2. 1/2
(_) = 3 [X] [ Tint ]N Wagonerstar 300 Hz 10-11 W m-2 107 s
where Fx is the X-ray flux from the system. Several X-ray sources exceed the referenceflux of 10-11 Wm-2 • For a narrow-band observation to be possible, the gravitational wavefrequency must be known in advance, at least to within the bandwidth of the detector.It may be possible to infer this frequency from low-amplitude modulations of the X-rayflux. In order to keep the bandwidth as large as possible, a thermal-noise-dominateddetector would probably be operated with less-than-maximum narrow-banding, withthe bandwidth adjusted to set the photon noise (which falls with the square root of the
THE SCIENTIFIC CASE 17
(2.9)
bandwidth) just below the thermal noise. For the noise levels indicated in Figure 3.4,the bandwidth could be as large as 50 Hz.
There may be pulsars in the solar neighbourhood that are not visible electromagnetically(because they are beamed elsewhere or because they are old and radio-quiet), but whichcould still be radiating gravitational waves. But the problem of conducting an all-skysearch for such signals is formidable: the Earth's motion produces Doppler effects thatneed to be removed from any observations lasting longer than about 30 minutes, andthese corrections are different for each different location on the sky. The longer anobservation lasts, the better will be its directional resolution, and therefore the greaterwill be the number of possible locations that have to be looked at. Simply performingthe data analysis on 4 months' worth of data over a 2 Hz bandwidth is beyond thecapacity of present computers [23].
One would normally expect to have to analyse a data set in a time no longer thanthe time it took to take the data in the first place. Given a computer capable ofperforming fast Fourier transforms (FFTs) at a computation speed of 300 Mflops, thelongest duration of a narrow-bandwidth (2 Hz) observation on which one could performan all-sky search is about 5 days at 100 Hz. This would give a signal-to-noise ratio inour proposed 10-22 detector (when thermal-noise-dominated, and allowing for antennapattern effects) of
S [ h ] [ S ] 1/8(N)FFT = 2 10-26 300 Mflops '
where S is the speed of floating point operations in an FFT on the computer. A pulsarcould thus be reliably identified even for h rv 10-26
; this is quite an interesting sensitivitylevel for pulsars.
Another possible way of looking for unknown pulsars is by cross-correlating the outputof two er more detectors. Cross-correlation requires much less computing but has asensitivity that is lower than the optimum achievable in a single detector in the sameobservation time Tint: '
( s ). ( s ) (1 -1/4- = - X -BT· t)N correlation N optimum 2 In ,
(2.10)
where B is the bandwidth of data being correlated. Since the optimum signal-to-noiseratio increases as Ti~2, it follows from this that a correlation experiment lasting a timeTc and a single-detector observation lasting Ts will have the same sensitivity over abandwidth B if
lB 2Tc = 2' Ts •
The single-detector observation lasting 5 days could only be matched over a 2 Hz bandwidth by a correlation experiment lasting 6,000 years! So cross-correlation is not aserious alternative to direct analysis of a single detector's data for a narrow-band all-skypulsar search.
In order to conduct an all-frequency (up to 2 kHz), all-sky search in a fixed time of,say, 107 s, analysing the data with a 300 Mflops computer, the best strategy would be to
18 CHAPTER 2
make a series of observations restricted to successive bandwidths of about 13 Hz, eachlasting 18 hours. The sensitivity of such a search would be a few times 10-26 for h inthe thermal-noise-dominated case. If further information suggested that a particularfrequency band was interesting - for example a newly formed pulsar was spinning downat a significant rate that wasn't well determined by electromagnetic observations, or afrequency was indicated by X-ray data in a Wagoner star but not well determined then a narrow-band search could further improve the sensitivity.
2.2.4 Stochastic background radiation
There have been many predictions of a measurable background of gravitational radiation, usually as a by-product of theories to explain other things in cosmology, suchas phase transitions or galaxy formation. ·One of the most interesting, since it makesdefinite predictions, is the cosmic string scenario for galaxy formation. If strings didactually provide the seeds around which galaxies condensed, then their decay musthave produced a gravitational wave background that is detectable by cross-correlationbetween two detectors.
The signal-to-noise ratio of a cross-correlation to find the stochastic background canbe found from our cross-correlation formula for searches for continuous sources, Equation 2.10, provided we interpret (S/N)optimum correctly. It is given by the ratio of thetypical amplitude of the stochastic field within the bandwidth B of the correlation experiment to the narrow-band noise O'nb in the detector in the same bandwidth. Theradiation's amplitude within a bandwidth B can be expressed in terms of the energydensity in the radiation per unit logarithmic interval of frequency, f!gw:
(2.11 )
where pc is the critical closure density of the Universe - about 1.75 X 10⁻⁹ J m-3 ifHubble's constant Ho is 100km/s/Mpc - and where dEgw /d3 x is the energy density ofstochastic gravitational radiation. Then the radiation in a bandwidth B about frequencyf has an effective amplitude given by
[f
]-3/2 B 1/2 [n ]1/2 [ li ]h - 1 8 X 10-25 __ gw 0
- · 100 Hz [2 Hz] 10-8 100 km S-l Mpc-1 ·(2.12)
In order to optimise the experiment, the bandwidth should be chosen to make photonnoise, thermal noise from the suspension, and thermal noise from mirror vibrationsroughly equal. The exact details will depend on the performance of the real detector,but a typical bandwidth might be 10 Hz. Using the photon noise O"nb multiplied by J3to allow for the three noise sources, and allowing the usual factor of J5 for orientation,we find that one can achieve a signal-to-noise ratio of
S[
f]
-5/2 -1 [ll ]1/2 [ IT ]_ _ 3 O"bb Il"gw LlO
(N)stochastic- 100Hz [10-22 ] 10-8 100kms-1 Mpc-1(2.13)
THE SCIENTIFIC CASE 19
over an observation lasting 107 s in our proposed 10-22 detector. This detector shouldbe able to reach ngw f'J 10-8 , considerably below the predictions of cosmic string theoryand well below the sensitivity one could expect from pulsar timing.
Correlation experiments require, of course, two independent detectors. When we haveonly one detector operating, we will do such experiments with our international collaborators. An important consideration is that sensitivity falls off if the separation betweendetectors is larger than Agw /21r. Baselines within Europe are therefore preferable, buteven on the shortest conceivable one - between Munich and Pisa - the sensitivity beginsto fall off significantly above 100 Hz. (There is still a solid angle in which the sensitivityis high, but this does not help a stochastic search, since the effective wave amplitude willdecrease with decreasing solid angle of acceptance for such an experiment. In fact, thisargument can be elaborated to show that the sensitivity will fall off with separation droughly as d- 1/ 2 .) On a baseline between Scotland and Pisa we should be able to reachngw f'J 2 x 10⁻⁸ , and even in a transatlantic correlation experiment we could get tof'V 2 X 10⁻⁷ , which is still interesting in terms of the predictions of cosmic string theory.
2.2.5 U npredicted sources
As with the opening of any other window in astronomy, one can be confident that therewill be unexpected sources of gravitational waves at some level. If they are strongenough to stand out above the broadband noise, then they will be readily detectedand studied. If they are weaker but have some structure, such as the coalescing binarysignal, then they may still be detectable using cross-correlation between detectors. Thesignal-to-noise ratio is less than the optimum obtainable by matched filtering using priorknowledge of the waveform by the same factor as in Equation 2.10 above, (!BTint)1/4,where I! is the bandwidth and Tint the correlation time.
For example, suppose two 10-22 recycling detectors optimised for broadband burstsobserve a weak signal lasting 1 s with a typical frequency of 200 Hz, not very differentfrom the parameters of a coalescing binary. In this case, photon noise dominates.Allowing for antenna-pattern effects, and using a 200 Hz bandwidth gives
(S) [E] 1/2 [ r ] -1- = 11 -2 2 •N hypothetical 10 M 0 c 15 Mpc
So a source radiating the same energy as a coalescing binary could be seen in the Virgocluster. Whether such sources exist and are frequent enough to give a reasonable eventrate is a question that will only be answered by observation. Certainly such correlationsshould be done after supernova events, for example, in order to look for neutron starspindown or any unpredicted aftermath radiation.
20 CHAPTER 2
2.3 Scientific Output of an InterferometricDetector
Having reviewed various sources of gravitational waves in the previous section, we shallorganise the present section according to the scientific questions that gravitational waveobservations are likely to answer. In many cases such answers will come from combiningobservations of several different kinds of sources. We will begin our list with three newtests of relativistic gravity that observations of gravitational waves can perform.
• Test of gravitational wave polarisation. Simply seeing gravitational waveswould, of course, be a milestone for relativistic gravity. But many theories predict gravitational waves, and a network of detectors can distinguish among them.With four or more detectors, one has redundant information in the observations.Using general relativity one attempts to deduce the amplitude, polarisation, anddirection of the wave. If the resulting data are self-consistent, then general relativity provides a good model of the wave, particularly of its polarisation properties.If they are not self-consistent, then a different theory of gravity may be necessary.
• Speed of propagation of gravitational waves. If a supernova at 15 Mpc wereseen optically and detected by the gravitational wave network, there should beless than a day's delay between the gravitational wave and the optical detections,provided the gravitational wave travels at the same speed as the light from thesupernova. Over a travel time of some 45 million years, the coincident arrival ofthe waves within a day would establish that their speeds were equal to within onepart in 1010
•
• Test of strong-field gravity. A further test can be made if black hole coalescingbinaries are detected. COmptlter simulation should soon be accurate enough tomake detailed predictions of the dynamics of the merger of the holes, and of theradiation they emit, with only a few parameters (such as the masses, spins, totalangular momentum, and impact parameter of the collision). Given a reasonablesignal-to-noise ratio, matching the observations to the predictions could providea stringent test of strong-field gravity.
• Morphology of the supernova core. Observations of bursts from gravitationalcollapses tell us a number of things about supernovae themselves. We could learnhow many collapses do not produce visible supernovae; how often rotation playsan important role in the collapse; whether the collapse has formed a neutron staror a black hole; and what the mass and angular momentum of the compact objectare.
• Neutron star equation of state. This is one of the most important areas wheregravitational wave astronomy can provide information that is crucial to nuclearphysics: the interactions of neutrons in these conditions are poorly understood andinaccessible to laboratory experiments. Supernova gravitational wave observationsconstrain the equation of state by telling us what the timescale of collapse andrebound is, what the mass and angular velocity of any neutron star formed in the
THE SCIENTIFIC CASE 21
collapse might be, and what the upper mass limit of neutron stars is. Coalescingbinaries similarly offer information on neutron star masses (through the massparameter M) and on mass exchange once the initial point-mass approximationbreaks down. Observations of pulsars radiating from frozen-in mass deformationsconstrains the solid crust equations of state. Observations of the frequencies ofCFS instability modes either in new neutron stars spinning down or in Wagonerstars provide a very sensitive constraint on the equation of state, and also giveinformation about neutron matter viscosity, another poorly understood subject.
• Compact-object statistics. It is very hard to devise unbiased indicators of thenumbers and distribution of pulsars, old neutron stars, and black holes. Observations of gravitational waves from supernovae and coalescing binaries can givea new measure of the mass functions of these populations and of their formationrate. Searches for unknown pulsars, if successful, could give a relatively unbiasedindication of their distribution in the solar neighbourhood.
• Hubble's constant. If the event rate of coalescing binaries is sufficient to givea few per year from within 100 Mpc, then the fact (noted above) that coalescingbinaries are reliable distance indicators allows one to measure Hubble's constantto within a few percent in a year or two of observations [24]. This in turn willdetermine the age of the Universe and the distance scale to external galaxies.
• Cosmological mass distribution. Given a reasonable event rate, coalescingbinaries are good tracers of the stellar distribution out to 500 Mpc or (for blackholes) a few Gpc. Their distribution would indicate structure out to 500 Mpc witha resolution of 10-100 Mpc, a length scale on which we have little information atpresent. Such observations could provide a stringent test of the homogeneity andisotropy of the Universe.
• The early Universe. By confirming or ruling out a stochastic background ofgravitational radiation as predicted by cosmic string theory, gravitational waveobservations can be crucial to the cosmic string theory of galaxy formation. Ifother backgrounds are detected, they will have to be explained by some physi~s
in the early Universe. If the explanation has to do with phase transitions, forexample, then this would have implications for particle physics; if an early generation of very massive objects is the cause, then this has implications for galaxyformation as well.

22
Chapter 3
Interferometric Gravitational WaveDetectors - an Outline
A gravitational wave curves the spacetime through which it passes. This results in achange in the time it takes for light to travel between two free masses or, equivalently,in a change of apparent separation. The phase shift on the light may be detected if itis converted to an intensity change by interfering two beams of light which have beendifferently affected by the gravitational wave, such as in a Michelson interferometer.
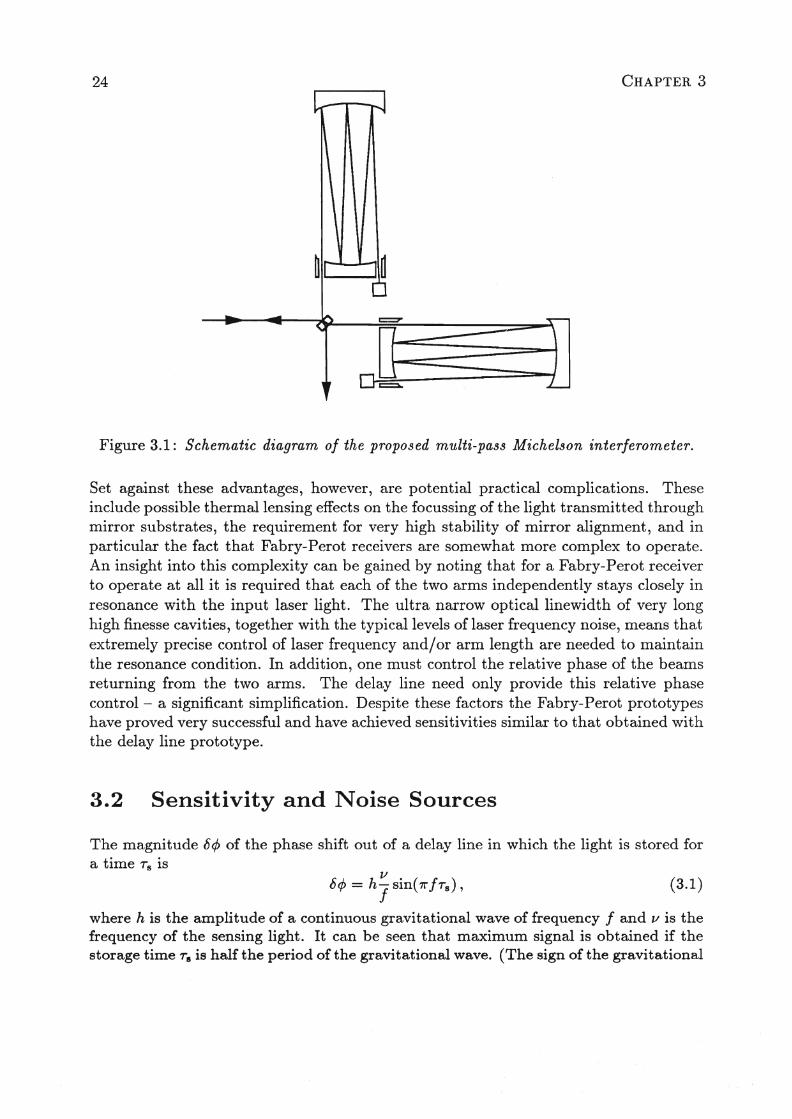
For optical path lengths small compared with the wavelength of the gravitational wave(300 km for a 1 kHz signal) the phase shift is proportional to the length of each arm.Thus, one can gain in sensitivity both by increasing the physical arm-length of theinterferometer, and by bouncing the light back and forth many times in each arm beforeinterference takes place at the beamsplitter (see Figure 3.1).
3.1 Interferometer Types
Two different techniques for achieving the required long optical path length in the armsof an interferometer have been proposed. These are the optical delay line (originallyinvented by Herriot, Kogelnik and Kompfner [25]) developed at MIT and the MaxPlanck-Institut, and the Fabry-Perot scheme investigated at Glasgow and Caltech. Amajor difference between these approaches is that in the delay line the multiple traversesof the light within an arm are spatially separated, whereas with the Fabry-Perot theyare coincident.
At first sight the Fabry-Perot system would appear to offer considerable advantages sinceit requires much smaller mirrors and the light beams occupy a much smaller volume inthe interferometer arms. It should thus be possible to fit more receivers into a givenvacuum pipe diameter. Additionally it is possible to achieve a very large number ofeffective traverses in the arm with a Fabry-Perot, while delay lines with 3 km long armsare limited to 50 to 100 beams even with the largest mirrors that can reasonably beused.
23
24 CHAPTER 3
Figure 3.1: Schematic diagram of the proposed multi-pass Michelson interferometer.
Set against these advantages, however, are potential practical complications. Theseinclude possible thermallensing effects on the focussing of the light transmitted throughmirror substrates, the requirement for very high stability of mirror alignment, and inparticular the fact that Fabry-Perot receivers are somewhat more complex to operate.An insight into this complexity can be gained by noting that for a Fabry-Perot receiverto operate at all it is required that each of the two arms independently stays closely inresonance with the input laser light. The ultra narrow opticallinewidth of very longhigh finesse cavities, together with the typical levels of laser frequency noise, means thatextremely precise control of laser frequency and/or arm length are needed to maintainthe resonance condition. In addition, one must control the relative phase of the beamsreturning from the two arms. The delay line need only provide this relative phasecontrol - a significant simplification. Despite these factors the Fabry-Perot prototypeshave proved very successful and have achieved sensitivities similar to that obtained withthe delay line prototype.
3.2 Sensitivity and Noise Sources
The magnitude 64> of the phase shift out of a delaY'line in which the light is stored fora time T s is
6</> = hysine7riTs) , (3.1)
where h is the amplitude of a continuous gravitational wave of frequency f and v is thefrequency of the sensing light. It can be seen that maximum signal is obtained if thestorage time Ta is half the period of the gravitational wave. (The sign-of the gravitational
INTERFEROMETRIC GRAVITATIONAL WAVE DETECTORS 25
wave reverses every half period, tending to cancel the induced signal.) So if we have adetector of length .e and wish to observe a gravitational wave of frequency f, maximumphase shift is obtained if a delay line has a number of reflections N of
c [ .e ] -1 [ f ] -1
N = 2fj = 50 3km 1kHz
where c is the speed of light.
3.2.1 Shot noise in a simple interferometer
(3.2)
(3.3)
The induced phase shift produces a power change at the output of the interferometer.If this is to be detectable, it must be larger than the -In uncertainty associated withan average count of n photons (unless squeezed light techniques are used). This photonshot noise will limit the detectable gravitational wave amplitude in a simple delay lineto
(1rh>.. ~f) 1/2 j
hDL ~ .,floC sln(1r fTs)
where h is Planck's (reduced) constant, >.. is the light wavelength, ~f is the measuringbandwidth, f is the photodetector quantum efficiency and la is the light power in theinterferometer. Operating in the storage time limited regime (fTs == ~), the pulsesensitivity of such a simple interferometer is therefore limited to
T -1/2 [ f ]3/2-21 f.LO
hDL rv 2.4 x 10 [50 W ] 1 kHz ' (3.4)
where it is assumed that a bandwidth ~f == f /2 is chosen and that light of wavelength>.. == 53~nm is used.
In Chapter 2 we have seen that our eventual goal must be a sensitivity for kHz bursts of1'..1 10-22 • The shot noise limit of Equation 3.4 must therefore be considerably improved.
3.2.2 Shot noise in recycled interferometers
A method for increasing the effective light power and so reducing the photon noisewas suggested in 1981 independently by Drever [26] and Schilling. The interferometernormally operates with its output on a dark fringe, so virtually all of the light comingback from the arms of the interferometer travels back towards the laser (see Figure 3.1).By suitable placement of the recycling mirror Mo, this light may be coherently added tothe incoming light. Since the number N of reflections in the arms of the interferometeris quite low (cf. Equation 3.2) and mirrors of loss 1 - R ::; 10-4 are available, little lightis lost on a single round trip and the power enhancement from this recycling may behigh.
In order to match the storage time to the gravitational wave frequency, optimising adetector for lower frequencies (::; 500 Hz) requires a number of reflections, and thus a
26 CHAPTER 3
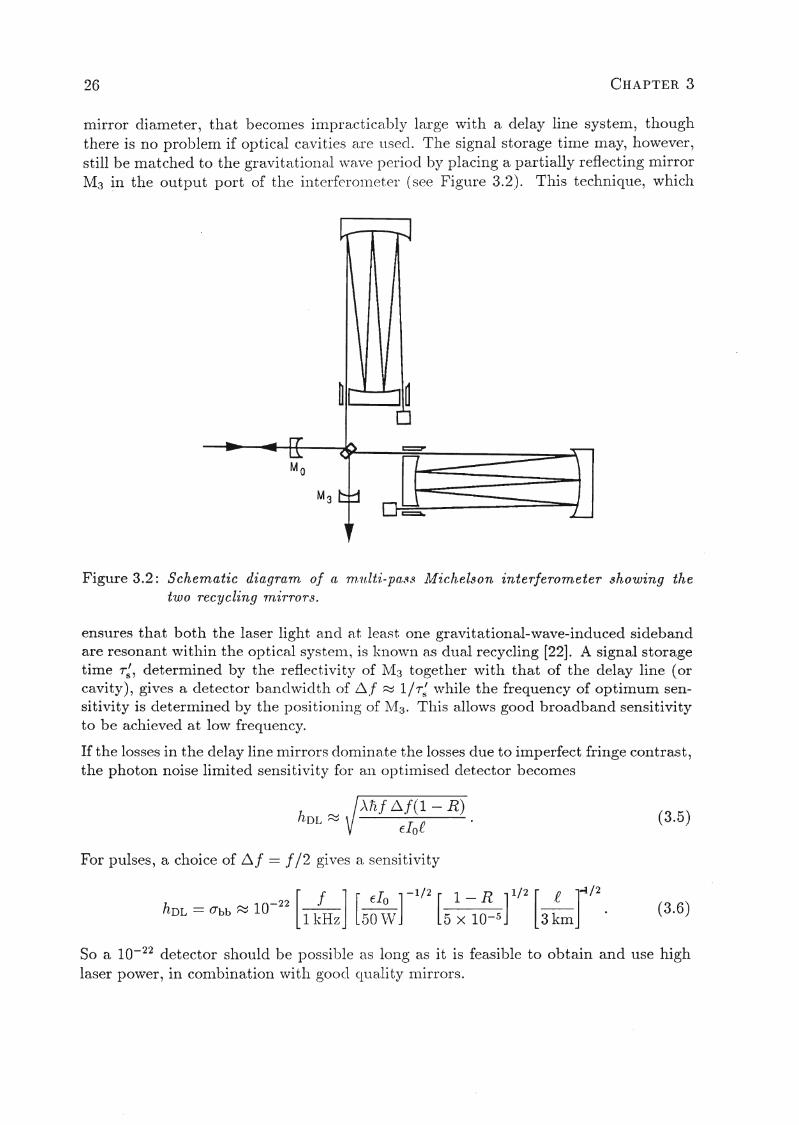
mirror diameter, tllat becollles ilnl)racticablJr large vvitll a delay line system, thoughthere is no prol)lem if Ol)tical cavities a,re llsecl. TIle signal storage time may, however,still be matchecl to tIle gravitatiollal \vave l)eriocl l)y placillg a partially reflecting mirrorM3 ~n tIle outl)llt port of tIle illterferOllleter (see Figtlre 3.2). Tllis tecllnique, which
Figtlre 3.2: Schematic diagram o.f a. rnulti-pa,/~s Michelson interferometer showing thetwo recycling mirrors.
ensures tIlat botll tIle laser ligllt a,ll(l a,t least Olle gravitational-wave-induced sidebandare resonant vvitl1in the optical systell1., is kll0\Vll as dtlal recycling [22]. A signal storagetime or:, determined by tIle reflec.tivit~y ()f l\iI3 togetller with tIlat of tIle delay line (orcavity), gives a cletector banclvviclth. of ~.f ~ l/T: vvllile the frequency of optimum sensitivity is determined by tIle positiollillg of l\iI3 • Tllis allovvs good broadband sensitivityto be acllieved at low frecluency.
If the losses ill the delay line nlirrors clolnillate tIle losses due to ilnperfect fringe contrast,tIle photon noise limited sensitivity for all Ol)timised detector becomes
An! ~!(1 - R)Elo·e
(3.5)
For ptllses, a choice of 6.,( == f /2 gives a sensitivity
[f ]"[ EL ] -1/2 [ 1 - R ] 1/2 [ f ]4/2
hDL = O"bb ~ 10-22
1 kHz 50 ~V 5 X 10⁻⁵ 3 km · (3.6)
So a 10-22 detector Sllould l)e l)Ossil)le as l011g as it is feasible to obtain and use highlaser povver, in conlbinatioll vvitll gooel Cltlality nlirrors.
INTERFEROMETRIC GRAVITATIONAL WAVE DETECTORS 27
To allow maximum recycling gain, power must not be allowed to escape via the outputport of the interferometer; this places a stringent requirement on the fringe contrast thathas to be achieved. For example an effective contrast ratio of f'V 10-4 will be requiredto avoid degrading the sensitivity of a detector optimised for 1 kHz signals.
It is also possible to enhance the sensitivity within a narrow bandwidth and so improvethe detectability of continuous gravitational wave signals. This is achieved by dualrecycling with long signal storage times. The best shot noise limit for narrowbandsignals, again assuming the mirror losses are dominant, now becomes-
1. _1 []-1 1. Anc 2 (l-.R) -28 EIo 2 l-R £ Tint -2"
hDL = O"nb ~ (1rdOTint) £ = 10 [15 vV] [5 X 10⁻⁵ ] 3km [107J '(3.7)
where Tint is the integration time. The detector bandwidth in this optimised case is
.t::..j ~ c(1 - R) = 2 [_£_] -1 [ 1 - R ] Hz.1r£ 3km 5 X 10⁻⁵ .
(3.8)
Other narrowbanding arrangements have been proposed: resonant recycling [20] anddetuned recycling [21]. However, dual recycling has better tuning properties and canbe added naturally to a broadband high-frequency system; it therefore seems the bestchoice.
In the long run when tens of watts of laser power will be used, heating of opticalcomponents due to absorption may produce significant distortion of the beam shape. Inthe case of a reflecting mirror the deformation of the wavefront is due to the expansionof the heated material, and in the case of a mirror used in transmission is also due toa change in the index of refraction. Wavefront distortion degrades the coupling intocavities" for mode cleaning and recycling and into the interferometer arms in a FabryPerot based system. In addition it degrades the fringe contrast inside the interferometerand thus reduces the recycling gain. To control these effects, materials of low absorptionand carefully chosen thermal properties will be used, and the interferometer will be madeas symmetrical as possible.
As will be seen shortly, the power level required to attain a given photon noise limitedsensitivity may be reduced if it is possible to use the noise reducing properties of squeezedlight.
28
3.2.3 Other noise sources
CHAPTER 3
There are, of course, noise sources other than photon counting fluctuations. The mostimportant of these are:
• Optical noise: Fluctuations in the frequency, power and geometry of the light,possibly coupled via scattered light, may produce spurious phase fluctuations.Careful design of the interferometer optical system together with active control oflaser beam quality are required. Further consideration of these topics appears inChapter 4.
• Seismic noise: Ground vibrations may induce motion of the test masses. Isolation measures are discussed in Chapter 6.
• Tllermal noise: Each normal mode of the test masses will have thermal motionassociated with it. The normal modes must be arranged to lie outside of thefrequency region of interest, so that the noise observed is only from the tails ofthe resonances. A high mechanical Q reduces this noise. The relevant modesinclude both the internal acoustic modes of the' test masses and the pendulummodes of their suspensions. The Q of the latter may be higher than that of thematerials involved since only a small fraction of the energy of motion is stored inthe flexures.
• Refractive index fluctuations in the vacuum: these fluctuations determinethe maximum allowable gas pressure for a given strain sensitivity.
Fluctuations of the number of molecules in th"e light path lead to small changesin the refractive index. The resulting apparent path length variations depend onthe magnitude of these index fluctuations and on the degree to which they cancoherently affect the multiple traverses of the light within an interferometer arm.The largest coherent effect occurs when Fabry-Perot cavities are used; some smallcorrelation is also inevitable with delay line systems.
The "vacuum noise" lines on the sensitivity graphs (Figures 3.3 and 3.4) indicate an upper bound for the noise due to index fluctuations in thermodynamicequilibrium, assuming the vacuum specifications laid down in the beginning ofSection 5.2, i. e. < 108 mbar for hydrogen and < 10-9 mbar for heavier molecules,such as water and nitrogen.
• Quantum limit: Heisenberg's Uncertainty Principle limits the accuracy of thedisplacement measurement.
The significance of the most fundamental noise sources in the proposed interferometeris shown in Figures 3.3 and 3.4.
INTERFEROMETRIC GRAVITATIONAL WAVE DETECTORS
SeismicNoise
Neutron Starformation (Virgo)
non - axisymmetrical
29
10-22
1Neutron Star binary
coalescence (100 M pc)--- --- --- .....
10-24 L...- ..L..- ..I.-- ..L.-
10
Frequency (Hz)
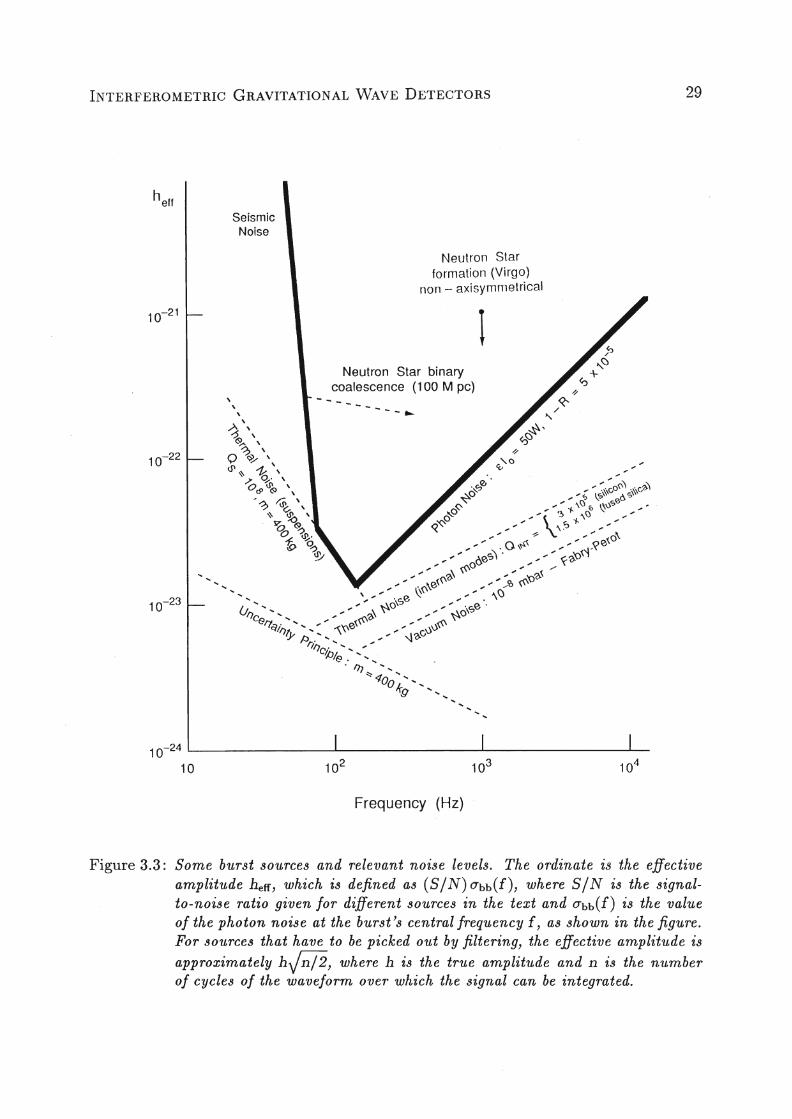
Figure 3.3: Some burst sources and relevant noise levels. The ordinate is the effectiveamplitude heff,·which is defined as (SIN)abb(f), where SIN is the signalto-noise ratio given for different sources in the text and abb(f) is the valueof the photon noise at the burst's central frequency f, as shown in the figure.For sources that have to be picked out by filtering, the effective amplitude is
approximately hJn/2, where h is the true amplitude and n is the numberof cycles of the waveform over which the signal can be integrated.
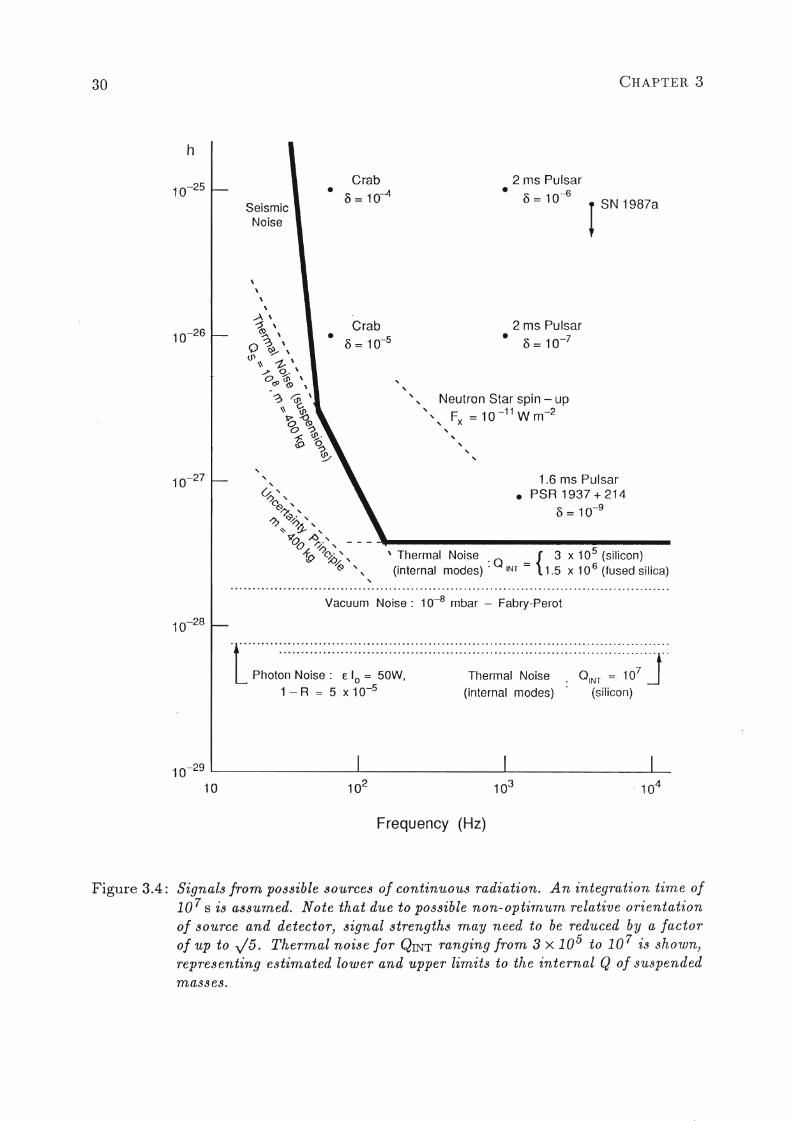
30 CHAPTER 3
h
SeismicNoise
Crab
• 8 = 10-4
2 ms Pulsar
• 8 = 10-6 !SN 1987a
1.6 ms Pulsar• PSR 1937 + 214
8 = 10-9
2 ms Pulsar
• 8 = 10-7
, ,, , Neutron Star spin - up
, " Fx = 10 -11 W m-2
, , , , ,
Crab• 8 = 10-5
, ,
~"('<9 '~ ,
~ ~~',~ ~ ,
9'Q ~ ,V ~. , - - - ....-----------------19 ~%" \ Thermal Noise . Q _ { 3 X 10⁵ (silicon)
~ " (internal modes)' 1Nl - 1.5 x 10 6 (fused silica),
10-27
Vacuum Noise: 10-8 mbar - Fabry-Perot
10-29 ~ .....I.- __'_ __L._
10
Frequency (Hz)
Figure 3.4: Signals from possible sources of continuous radiation. A n integration time of10 7 s is assumed. Note that due to possible non- optimum relative orientationof source and detector, signal strengths may need to be reduced by a factorof up to y'5. Thermal noise for QINT ranging from 3 X 10⁵ to 10 7 is shown,representing estimated lower and upper limits to the internal Q of suspendedmasses.
INTERFEROMETRIC GRAVITATIONAL WAVE DETECTORS
3.2.4 Some basic noise formulae
31
Two of the main noise limits shown in Figures 3.3 and 3.4, photon noise and seismicnoise, are discussed in detail in Chapters 3 and 6 respectively. The other noise limitsare calculated from the following formulae, further details of which can be found in ourprevious proposals [3,4].
For:
• test masses - mass m, density p, speed of sound in material Vs, internal qualityfactor QINT,
• pendulum suspensiolls - angular frequency Wo, quality factor Qs,
• vacuum system - residual pressure p of gas of refractive index no (measured atstandard pressure Po) and thermal molecular speed Vo,
• optical parameters - arm length£, mean beam width 2w,
and detector operating frequency f = W /27r, the squared spectral density of the resultingapparent gravitational wave amplitude is given by -
Tllermal noise due to internal modes:
h2 ~ a. 16kT ,:Pi3pvs3QINT.e2 (3.9)'113
(where a I'..J 2.5 allows for the summation of the effects of a number of resonant modes);
Thermal noise due to pelldulun1 suspension:
(3.10)
Heisenberg Uncertainty Principle:
(3.11 )
Refractive index fluctuations:
(3.12)
'~. \. L ~.' ..where No is the number of molecules per unit volume (2.7 X 1025molecules/m3), and theother symbols have their standard meanings.
32 CHAPTER 3
3.3 Squeezed Light Techniques
The use of "squeezed light" was originally proposed as a means of reducing the shotnoise level in laser interferometer gravitational wave detectors [27, 28]. Its use couldallow our design goals to be achieved \vith less laser power and consequently reduceddemands on the thermal properties of the optical components. Squeezed light has sincebeen produced experimentally [29] and used to enhance the sensitivity of conventional,relatively small, interferometers [30]. The extension to interferometers such as thoseconsidered in this proposal is in principle straightforward.
For the squeezed-light method to be useful, it is necessary that the interferometer sensitivity be limited by "shot noise" (also called "photon noise"). This limit may beunderstood as follows. If n photons enter the interferometer during the sampling timeinterval, then the smallest detectable change in the relative phase of the light from thetwo arms is 1/Vii. Operation at this quantum limit is desirable and has been achievedin several of the prototype interferometers discussed in this proposal. (Photon pressurefluctuations, which are another kind of "quantum noise," would limit the sensitivity onlyat light power levels much higher than envisaged for the planned large interferometer[27]). The shot noise limitation of a Michelson interferometer with two equal arms iscaused by quantum noise introduced by the stochastic nature of the beamsplitter. The1/Vii limit holds only if the noise imposed by the beamsplitter is not correlated withthe phase of the laser beam illuminating the interferometer.
Caves [31] realised that the impact of the stochastic nature of the beamsplitter onthe field fluctuations of the transmitted and reflected beam may be manipulated bycoupling light with special properties into the second, normally unused, input port tothe beamsplitter. This injection may be carried out, when the output beam spatiallyoverlaps the input beam (as is the case for the Fabry-Perot interferometer, and mostlikely for the 3 km delay lines), by using a Faraday isolator and a polarisation-sensitivebeamsplitter. This is illustrated in Figure 3.5, which shows the squeezed light beingcoupled into the system along the same path followed by the return, signal beam.
The properties of this light necessary for achieving a reduction of the shot noise levelcannot be described in the framework of a classical field theory. The fluctuations inthe light are then in a regime where they are dominated by Heisenberg's uncertaintyrelation. In order to achieve the noise reduction in one quadrature of the field theuncertainty relation has to be fulfilled asymmetrically, hence the name squeezed light.The best experimentally observed reduction of the noise power is 70% and more than90% is expected to be reached in the near future [29].
When handling squeezed light one immediately finds it to be extremely fragile. Any dissipation such as absorption and non-unity detector quantum efficiency introduces fluctuations and the initially squeezed light changes its properties in the direction towardsthe regular shot noise level. As a result the shot noise reduction achievable in an interferometer will always be limited. In a real interferometer the limitation will arise mostlyfrom wavefront aberrations that affect the fringe visibility V = (Imax-lmin)/(Imax+lmin)and from the efficiency TJ of the detection system [32]. With these practical limitations
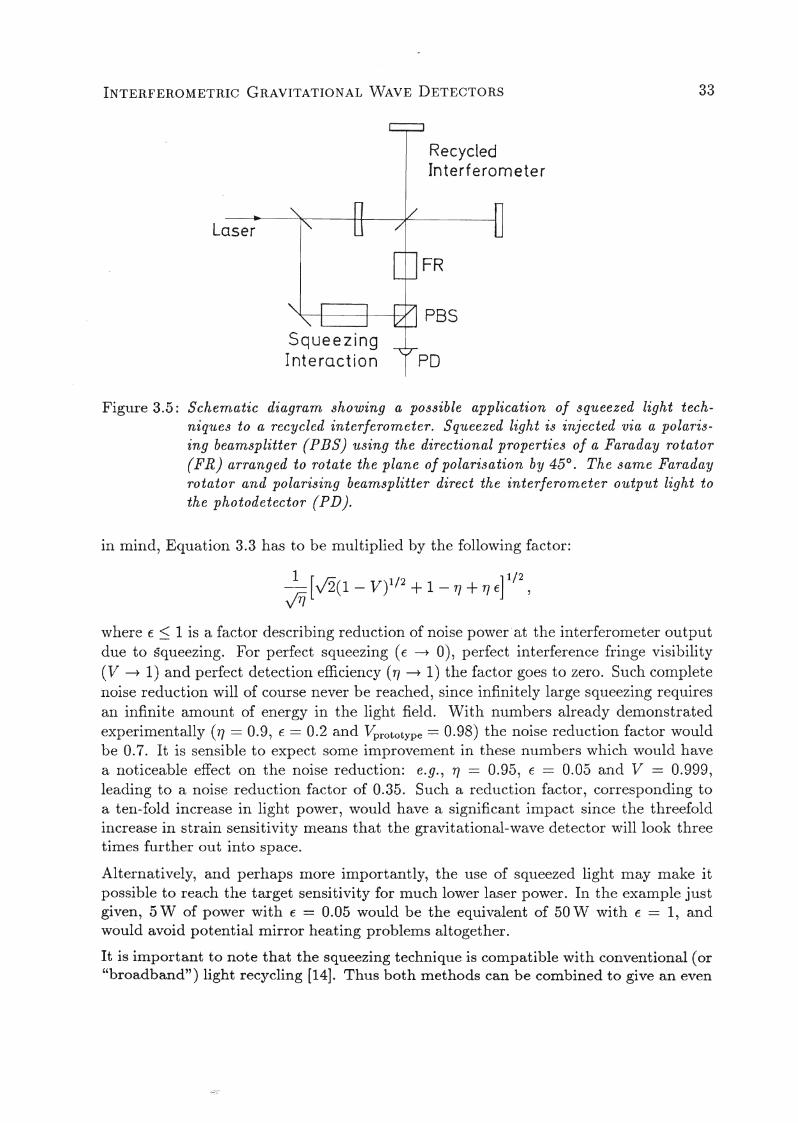
INTERFEROMETRIC GRAVITATIONAL WAVE DETECTORS
RecycledInterferometer
33
Laser
FR
PBS
PO
Figure 3.5: Schematic diagram showing a possible application of squeezed light techniques to a recycled interferometer. Squeezed light is injected via a polarising beamsplitter (PBS) using the directional properties of a Faraday rotator(FR) arranged to rotate the plane of polarisation by 45°. The same Faradayrotator and polarising beamsplitter direct the interferometer output light tothe photodetector (PD).
in mind, Equation 3.3 has to be multiplied by the following factor:
where f ~ 1 is a factor describing reduction of noise power" at the interferometer outputdue to squeezing. For perfect squeezing (€ ---* 0), perfect interference fringe visibility(V ---* 1) and perfect detection efficiency ('rJ ---* 1) the factor goes to zero. Such completenoise reduction will of course never be reached, since infinitely large squeezing requiresan infinite amount of energy in the light field. With numbers already demonstratedexperimentally ('1] == 0.9, E == 0.2 and Vprototype == 0.98) the noise reduction factor wouldbe 0.7. It is sensible to expect some improvement in these numbers which would havea noticeable effect on the noise reduction: e.g., 'rJ == 0.95, € == 0.05 and V == 0.999,leading to a noise reduction factor of 0.35. Such a reduction factor, corresponding toa ten-fold increase in light power, would have a significant impact since the threefoldincrease in strain sensitivity means that the gravitational-wave detector will look threetimes further out into space.
Alternatively, and perhaps more importantly, the use of squeezed light may make itpossible to reach the target sensitivity for much lower laser power. In the example justgiven, 5 W of power with € = 0.05 would be the equivalent of 50 W with € = 1, andwould avoid potential mirror heating problems altogether.
It is important to note that the squeezing technique is compatible with conventional (or"broadband") light recycling [14]. Thus both methods can be combined to give an even
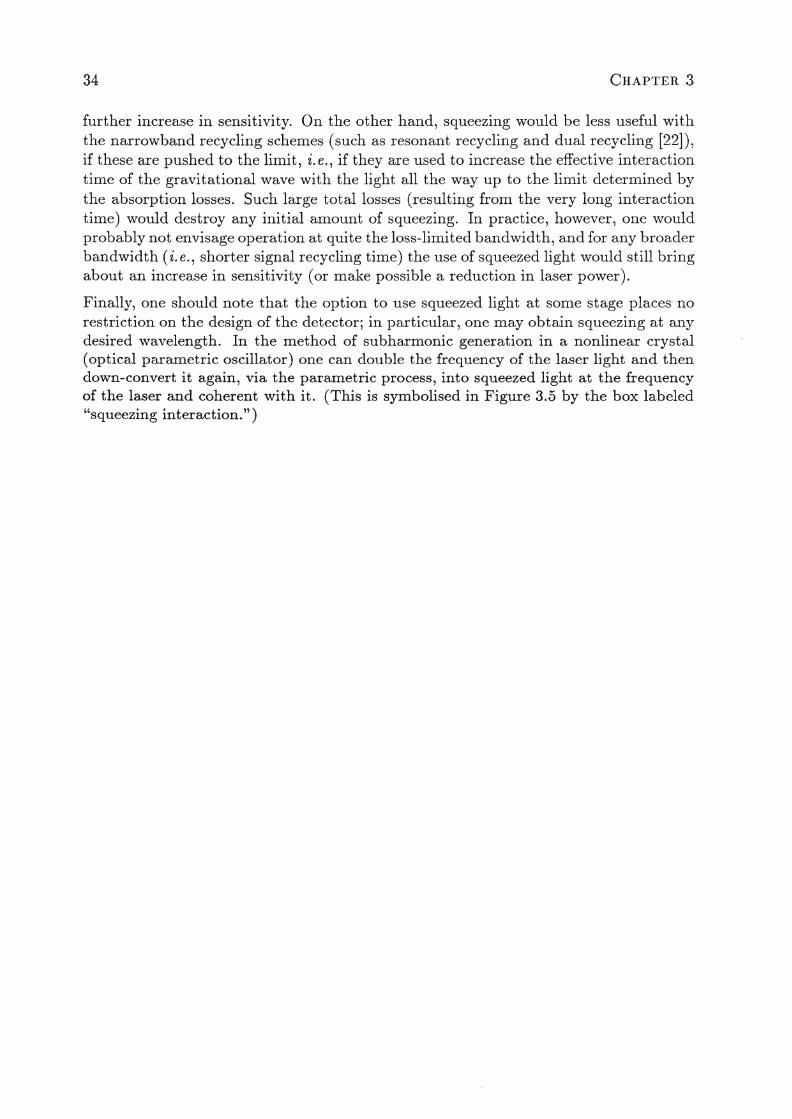
34 CHAPTER 3
further increase in sensitivity. On the other hand, squeezing would be less useful withthe narrowband recycling schemes (such as resonant recycling and dual recycling [22]),if these are pushed to the limit, i.e., if they are used to increase the effective interactiontime of the gravitational wave with the light all the way up to the limit determined bythe absorption losses. Such large total losses (resulting from the very long interactiontime) would destroy any initial amount of squeezing. In practice, however,one wouldprobably not envisage operation at quite the loss-limited bandwidth, and for any broaderbandwidth (i. e., shorter signal recycling time) the use of squeezed light would still bringabout an increase in sensitivity (or make possible a reduction in laser power).
Finally, one should note that the option to use squeezed light at some stage places norestriction on the design of the detector; in particular, one may obtain squeezing at anydesired wavelength. In the method of subharmonic generation in a nonlinear crystal(optical parametric oscillator) one can double the frequency of the laser light and thendown-convert it again, via the parametric process, into squeezed light at the frequencyof the laser and coherent with it. (This is symbolised i~ Figure 3.5 by the box labeled"squeezing interaction.")
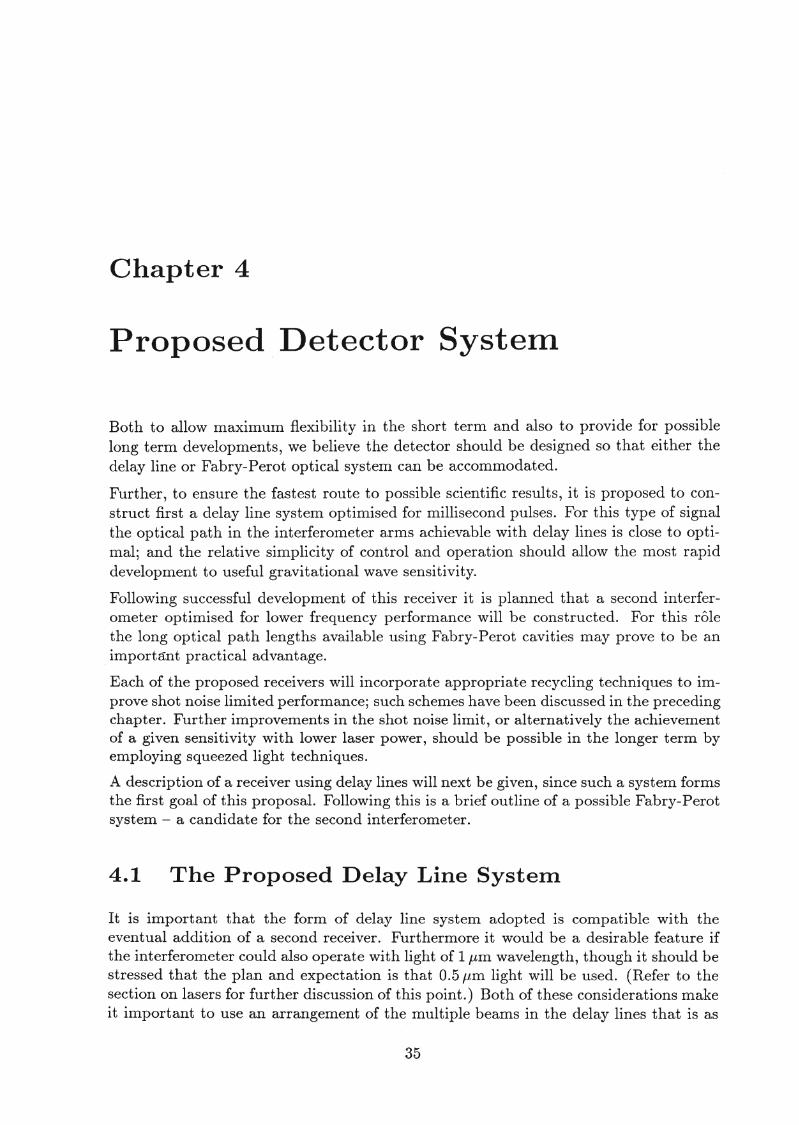
Chapter 4
Proposed Detector System
Both to allow maximum flexibility in the short term and also to provide for possiblelong term developments, we believe the detector should be designed so that either thedelay line or Fabry-Perot optical system can be accommodated.
Further, to ensure the fastest route to possible scientific results, it is proposed to construct first a delay line system optimised for millisecond pulses. For this type of signalthe optical· path in the interferometer arms achievable. with delay lines is close to optimal; and the relative simplicity of control and operation should allow the most rapiddevelopment to useful gravitational wave sensitivity.
Following successful development of this receiver it is planned that a second interferometer optimised for lower frequency performance will be constructed. For this rolethe long optical path lengths available using Fabry-Perot cavities may prove to be an
.important practical advantage.
Each of the proposed receivers will incorporate appropriate recycling techniques to improve shot noise limited performance; such schemes have been discussed in the precedingchapter. Further improvements in the shot noise limit, or alternatively the achievementof a given sensitivity with lower laser power, should be possible in the longer term byemploying squeezed light techniques.
A description of a receiver using delay lines will next be given, since such a system formsthe first goal of this proposal. Following this is a brief outline of a possible Fabry-Perotsystem - a candidate for the second interferometer.
4.1 The Proposed Delay Line System
It is important that the form of delay line system adopted is compatible with theeventual addition of a second receiver. Furthermore it would be a desirable feature ifthe interferometer could also operate with light of 1"'ill wavelength, though it should bestressed that the plan and expectation is that 0.5 "'ill light will be used. (Refer to thesection on lasers for further discussion of this point.) Both of these considerations makeit important to use an arrangement of the multiple beams in the delay lines that is as
35
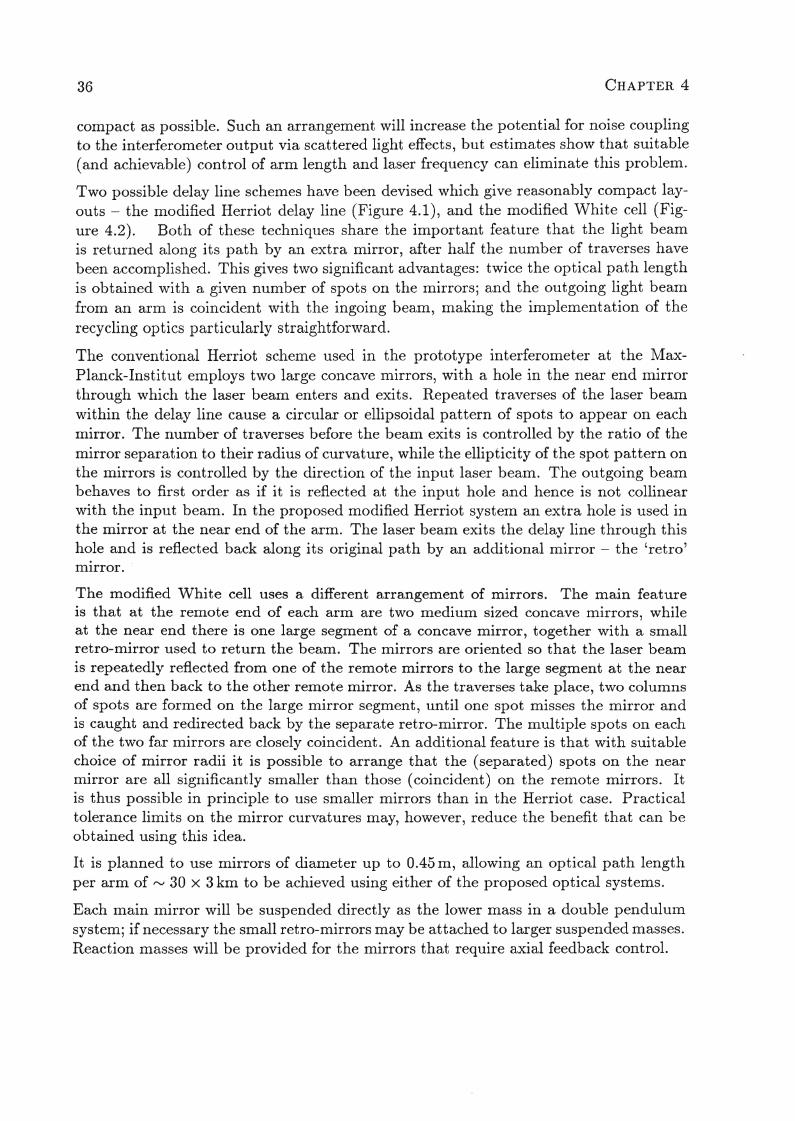
36 CHAPTER 4
compact as possible. Such an arrangement will increase the potential for noise couplingto the interferometer output via scattered light effects, but estimates show that suitable(and achievable) control of arm length and laser frequency can eliminate this problem.
Two possible delay line schemes have been devised which give reasonably compact layouts - the modified Herriot delay line (Figure 4.1), and the modified White cell (Figure 4.2). Both of these techniques share the important feature that the light beamis returned along its path by an extra mirror, after half the number of traverses havebeen accomplished. This gives two significant advantages: twice the optical path lengthis obtained with a given number of spots on the mirrors; and the outgoing light beamfrom an arm is coincident with the ingoing beam, making the implementation of therecycling optics particularly straightforward.
The conventional Herriot scheme used in the prototype interferometer at the MaxPlanck-Institut employs two large concave mirrors, with a hole in the near end mirrorthrough which the laser beam enters and exits. Repeated traverses of the laser beamwithin the delay line cause a circular or ellipsoidal pattern of spots to appear on eachmirror. The number of traverses before the beam exits is controlled by the ratio of themirror separation to their radius of curvature, while the ellipticity of the spot pattern onthe mirrors is controlled by the direction of the input laser beam. The outgoing beambehaves to first order as if it is reflected at the input hole and hence is not collinearwith the input beam. In the proposed modified Herriot system an extra hole is used inthe mirror at the near end of the arm. The laser beam exits the delay line through thishole and is reflected back along its original path by an additional mirror - the 'retro'mirror. (
The modified White cell uses a different arrangement of mirrors. The main featureis that at the remote end of each arm are two medium sized concave mirrors, whileat the near end there is one large segment of a concave mirror, together with a smallretro-mirror used to return the beam. The mirrors are oriented so that the laser beamis repeatedly reflected from one of the remote mirrors to the large segment at the nearend and then back to the other remote mirror. As the traverses take place, two columnsof spots are formed on the large mirror segment, until one spot misses the mirror andis caught and redirected back by the separate retro-mirror. The multiple spots on eachof the two far mirrors are closely coincident. An additional feature is that with suitablechoice of mirror radii it is possible to arrange that the (separated) spots on the nearmirror are all significantly smaller than those (coincident) on the remote mirrors. Itis thus possible in principle to use smaller mirrors than in the Herriot case. Practicaltolerance limits on the mirror curvatures may, however, reduce the benefit that can beobtained using this idea.
It is planned to use mirrors of diameter up to 0.45 m, allowing an optical path lengthper arm of f'.I 30 x 3 km to be achieved using either of the proposed optical systems.
Each main mirror will be suspended directly as the lower mass in a double pendulumsystem; if necessary the small retro-mirrors may be attached to larger suspended masses.Reaction masses will be provided for the mirrors that require axial feedback control.
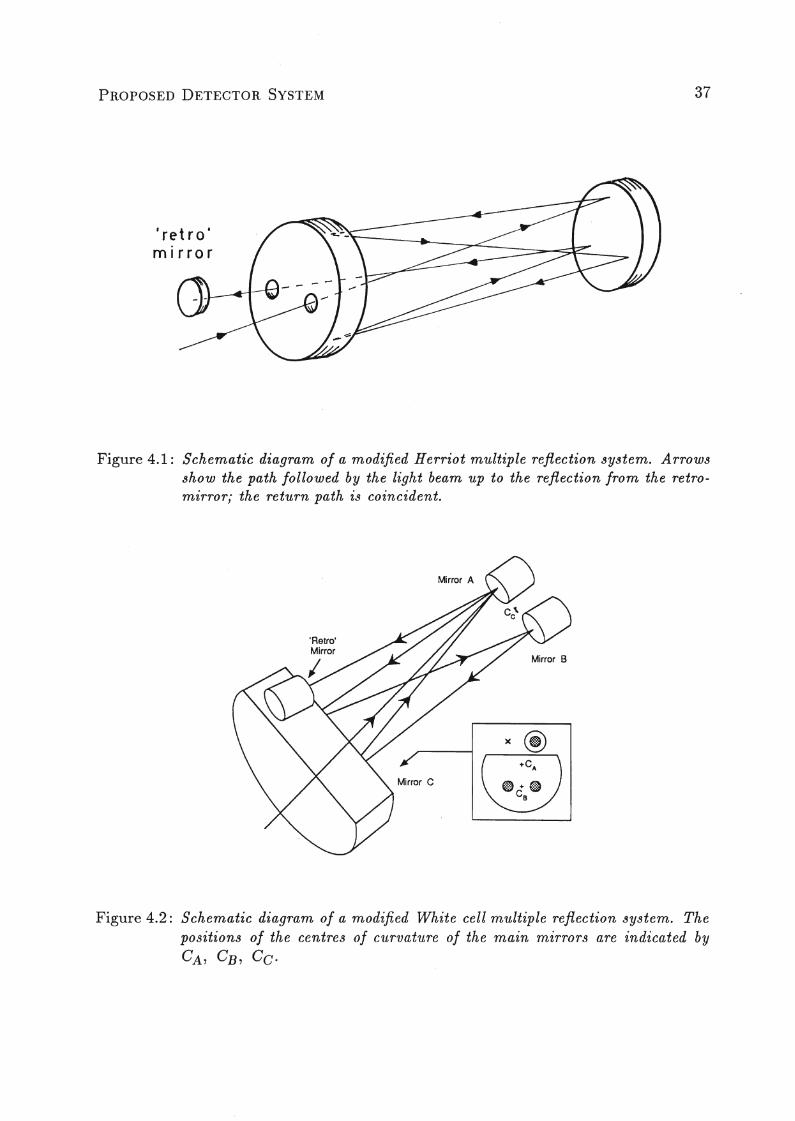
PROPOSED DETECTOR SYSTEM
'retro'm i r ro r
37
Figure 4.1: Schematic diagram of a modified Herriot multiple reflection system. Arrowsshow the path followed by the light beam up to the reflection from the retromirror; the return path is coincident.
'Retro'Mirror
Mirror B
Figure 4.2: Schematic diagram of a modified White cell multiple reflection system. Thepositions of th,e centres of curvature of the main mirrors are indicated by
CA, CB, CC·
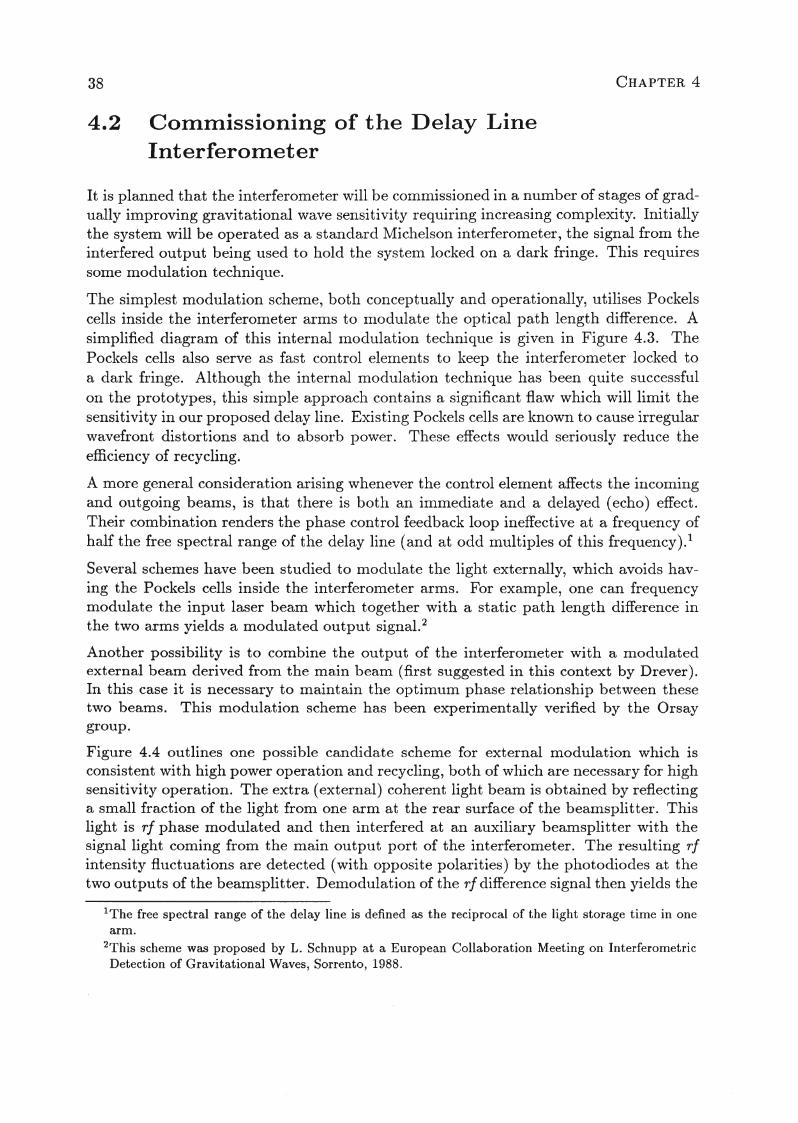
38 CHAPTER 4
4.2 Commissioning of the Delay LineInterferometer
It is planned that the interferometer will be commissioned in a number of stages of gradually improving gravitational wave sensitivity requiring increasing complexity. Initiallythe system will be operated as a standard Michelson interferometer, the signal from theinterfered output being used to hold the system locked on a dark fringe. This requiressome modulation technique.
The simplest modulation scheme, both conceptually and operationally, utilises Pockelscells inside the interferometer arms to modulate the optical path length difference. Asimplified diagram of this internal modulation technique is given in Figure 4.3. ThePockels cells also serve as fast control elements to l{eep the interferometer locked toa dark fringe. Although the internal modulation technique has been quite successfulon the prototypes, this simple approach contains a significant flaw which will limit thesensitivity in our proposed delay line. Existing Pocl{els cells are known to cause irregularwavefront distortions and to absorb power. These effects would seriously reduce theefficiency of recycling.
A more general consideration arising wllenever the control element affects the incomingand outgoing beams, is that there is both an immediate and a delayed (echo) effect.Their combination renders the phase control feedback loop ineffective at a frequency ofhalf the free spectral range of the delay line (and at odd multiples of this frequency).l
Several schemes have been studied to modulate the light externally, which avoids having the Pockels cells inside the interferometer arms. For example, one can frequencymodulate the input laser beam which togetller with a static path length difference inthe two arms yields a modulated output signal. 2
Another possibility is to combine the output of the interferometer with a modulatedexternal beam derived from the main beanl (first suggested in this context by Drever).In this case it is necessary to maintain the optimum phase relationship between thesetwo beams. This modulation scheme has been experimentally verified by the Orsaygroup.
Figure 4.4 outlines one possible candidate scheme for external modulation which isconsistent with high power operation and recycling, both of which are necessary for highsensitivity operation. The extra (external) coherent light beam is obtained by reflectinga small fraction of the light from one arm at the rear surface of the beamsplitter. Thislight is rf phase modulated and then interfered at an auxiliary beamsplitter with thesignal light coming from the main output port of the interferometer. The resulting rfintensity fluctuations are detected (with opposite polarities) by the photodiodes at thetwo outputs of the beamsplitter. Demodulation of the rf difference signal then yields the
1The free spectral range of the delay line is defined as the reciprocal of the light storage time in onearm.
2This scheme was proposed by L. Schnupp at a European Collaboration Meeting on InterferometricDetection of Gravitational Waves, Sorrento, 1988.
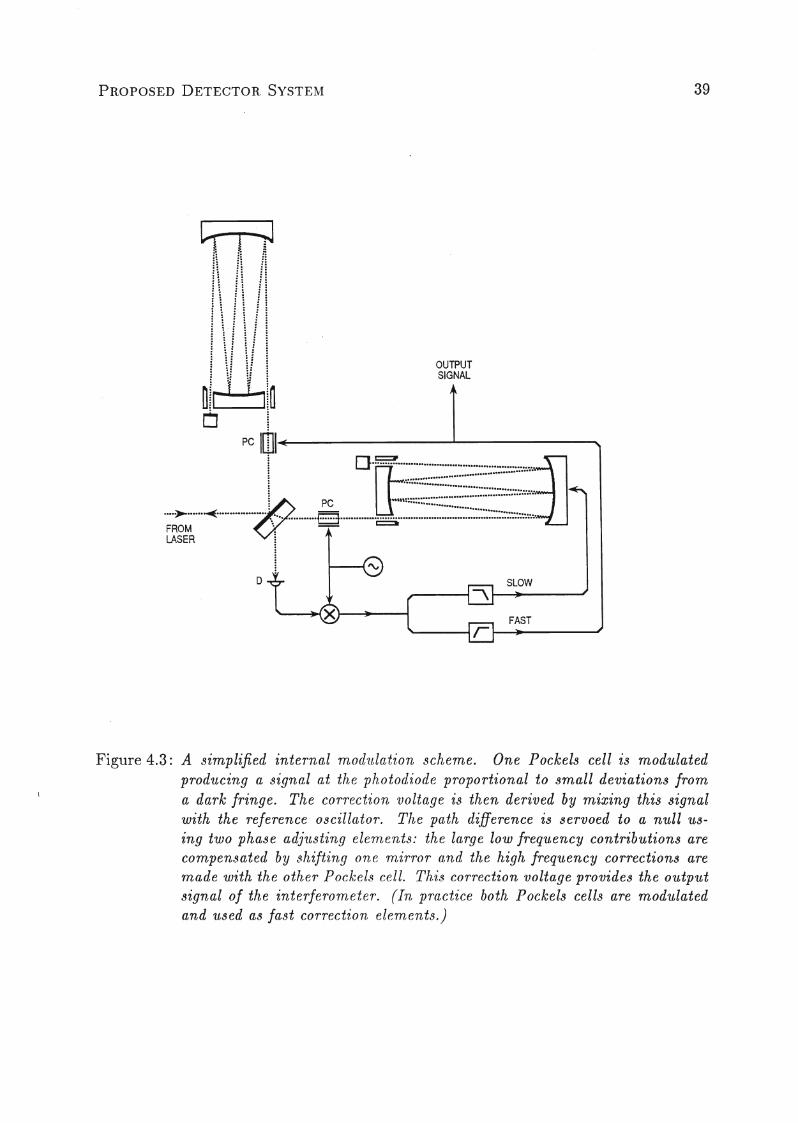
PROPOSED DETECTOR SYSTEM 39
FAST
SLOW
OUTPUTSIGNAL
o
c:r=r=1J
[j !PC Iilll~-----"-------'
.;:~ ~ ,; ····..·····t·····j·..··..····..·~······ ..············..··· ::.::::.:.~~~,
LASER
Figure 4.3: A simplified internal mod'ulation scheme. One Pockels cell is modulatedproducing a signal at the photodiode proportional to small deviations froma dark fringe. The correction voltage is then derived by mixing this signalwith the reference oscillator. The path difference is servoed to a null using two phase adjusting elemen,ts: the large low frequency contributions arecompensated by shifting o'ne mirror and the high frequency corrections aremade with the other Pockels cell. This correction voltage provides the outputsignal of the interferometer. (In practice both Pockels cells are modulatedand used as fast correction, elements.)
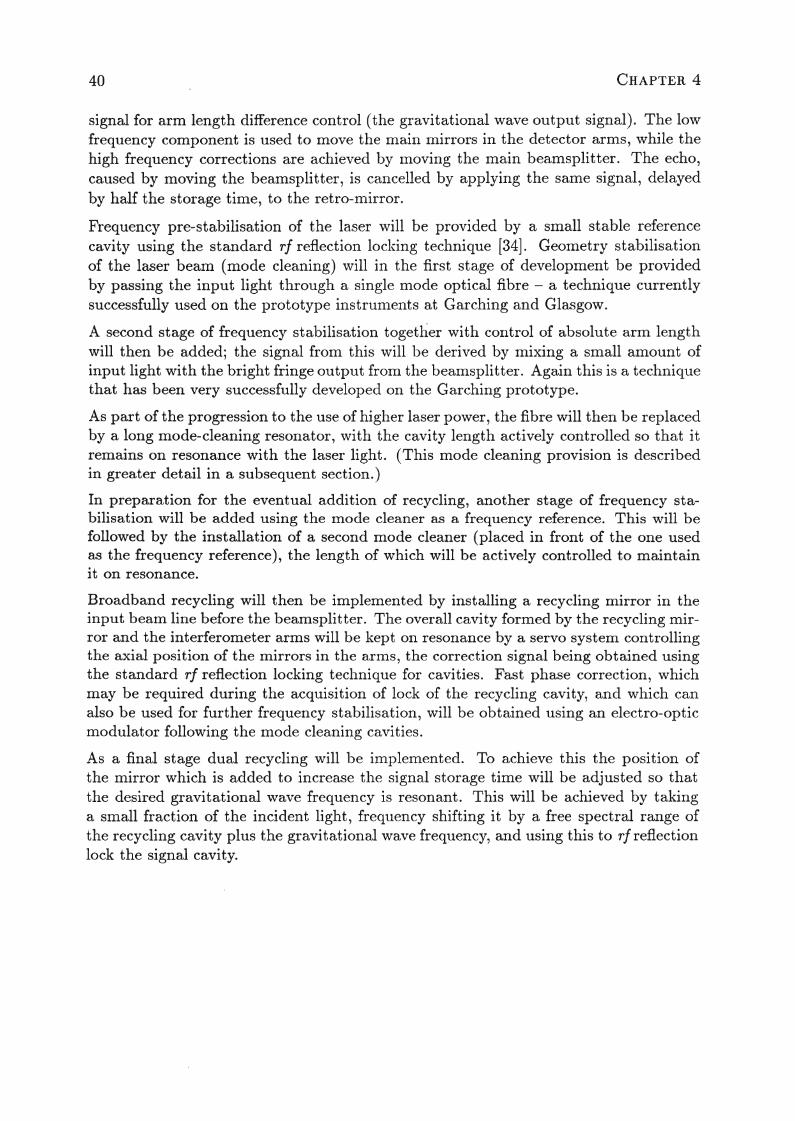
40 CHAPTER 4
signal for arm length difference control (the gravitational wave output signal). The lowfrequency component is used to move the main mirrors in the detector arms, while thehigh frequency corrections are achieved by moving the main beamsplitter. The echo,caused by moving the beamsplitter, is cancelled by applying the same signal, delayedby half the storage time, to the retro-mirror.
Frequency pre-stabilisation of the laser ,viII be provided by a small stable referencecavity using the standard rf reflection locl(ing tecllnique [34]. Geometry stabilisationof the laser beam (mode cleaning) will in tIle first stage of development be providedby passing the input light through a single mode optical fibre - a technique currentlysuccessfully used on the prototype instrunlents at Garching and Glasgow.
A second stage of frequency stabilisation togeth~er with control of absolute arm lengthwill then be added; the signal from this "viII be derived by mixing a small amount ofinput light with the bright fringe output from the beamsplitter. Again this is a techniquethat has been very successfully developed on the Garching prototype.
As part of the progression to the use of higller laser power, the fibre will,then be replacedby a long mode-cleaning resonator, with the cavity length actively controlled so that itremains on resonance with the laser light. (This mode cleaning provision is describedin greater detail in a subsequent section.)
In preparation for the eventual addition of recycling, another stage of frequency stabilisation will be added using the mode cleaner as a frequency reference. This will befollowed by the installation of a second mode cleaner (placed in front of the one usedas the frequency reference), the lengtll of which will be actively controlled to maintainit on resonance.
Broadband recycling will then be implemented by installing a recycling mirror in theinput beam line before the beamsplitter. The overall cavity formed by the recycling mirror and the interferometer arms will be kept on resonance by a servo system controllingthe axial position of the mirrors in the arms, the correction signal being obtained usingthe standard rf reflection locking tecllnique for cavities. Fast phase correction, whichmay be required during the acquisition of lock of the recycling cavity, and which canalso be used for further frequency stabilisation, will be obtained using an electro-opticmodulator following the mode cleaning cavities.
As a final stage dual recycling will be implemented. To achieve this the position ofthe mirror which is added to increase tIle signal storage time will be adjusted so thatthe desired gravitational wave frequency is resonant. This will be achieved by takinga small fraction of the incident light, frequency shifting it by a free spectral range ofthe recycling cavity plus the gravitational wave freq~ency, and using this to rf reflectionlock the signal cavity.
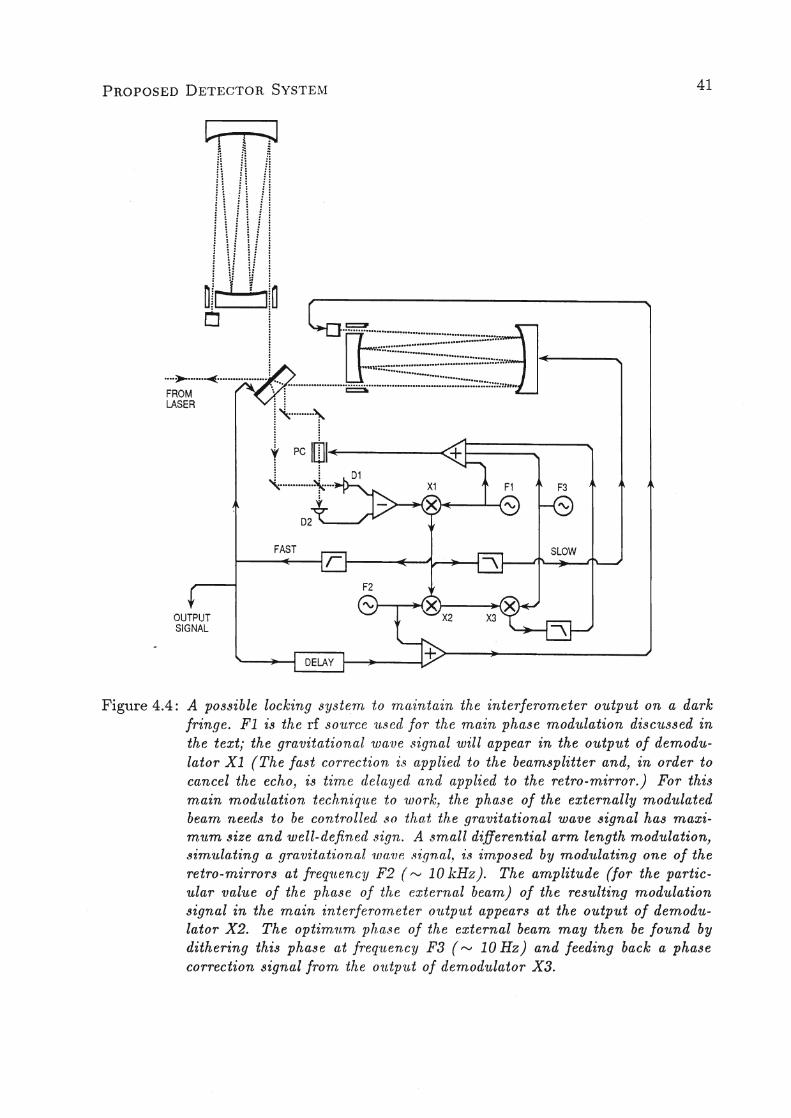
PROPOSED DETECTOR SVSTE11 41
FAST
OUTPUTSIGNAL
1!1Ji\
[:j I ~, ..[I:~~:~~~~~~~:::::::::~~~:~~.~::.~ .."'~::::::::::::::::::::::::: .
....~ ~................... . . :::::::::::::::::::::::"'"FROM ~ ~ c:::JII
LASER ~ ~~ '\: ,: :
t PC Irnl~-----<: :{ +.
Figure 4.4: A possible locking syste,m to maintain the interferometer output on a darkfringe. Fi is the rf source 'used for the main phase modulation discussed inthe text; the gravitational wave ..t;ignal will appear in the output of demodulator Xl (The fast correction, i.s applied to the beamsplitter and, in order tocancel the echo, is time delayed and applied to the retro-mirror.) For thismain modulation techniq'ue to work, the phase of the externally modulatedbeam needs to be con,trolled t.Q,O that the gravitational wave signal has maximum size and well-defined sign. A small differential arm length modulation,simulating a gravita.tion,a.l 'lJJ(J/lJe ,f3ign,a(, is imposed by modulating one of theretro-mirrors at freq'llency F2 ('" 10 ](Hz). The amplitude (for the particular value of the phase of the external beam) of the resulting modulationsignal in the main interferometer O'lltput appears at the output of demodulator X2. The optim,1lm, pha,f3e of the external beam may then be found bydithering this phase at freq'uency F3 ('" 10 Hz) and feeding back a phasecorrection signal from the O'lltp'llt of demodulator X3.
42 CHAPTER 4
4.3 Proposed Second Detector with Fabry-PerotCavities
This interferometer based on Fabry-Perot cavities will use two 400 kg test masses ineach arm and is mainly intended for operation at lower frequencies between 100 Hz anda few hundred Hz. The mirrors may be an integral part of the test masses, achievedby either fusing or optically contacting the optically ground mirror substrates to largertest masses. The cavities will be of the flat/ curve arrangement with flats at the nearend and curves of 4.5 km radius at the far end. Reaction masses will be provided foreach test mass to allow control of cavity lengths. A possible arrangement for controllingthe interferometer is shown in Figure 4.5.
Recycling and dual recycling will be added as for the delay line case. Note that caremust be taken that the phase modulation for the main cavity locking signals is able topass into the overall cavity formed by the recycling mirror and the arms; this can beachieved by using a frequency at a free spectral range of this overall cavity.
To ease acquisition of lock of the whole system one possibility is to use a separate opticalinterferometer to damp and lock the inner interferometer formed by the beamsplitterand the near end test masses. This would be illuminated by a stabilised Helium Neonlaser. It would be expected that this auxiliary inte~ferometerwould be turned off whenthe system is fully locked with the main illuminating laser.
4.4 Interferometer Control Systems
4.4.1 Axial control of main interferometer components
For the delay line based interferometer there are four control systems associated withthe axial control of the main interferometer components - to control differential armlength to keep the interferometer on a null fringe and provide the main signal output for searching for gravitational waves; to control absolute arm lengths to minimiselight scattering problems; to maintain the overall cavity formed when recycling is usedon resonance; and to maintain the correct resonance conditions for the dual recyclingsystem.
For the possible Fabry-Perot based system for the second interferometer an extra controlsystem to allow independent locking of the two Fabry-Perot cavities is required, and itwould be advantageous to have two further auxiliary systems to help with acquisitionof lock.
4.4.2 Alignment control of the interferometer and associatedoptical ,components
There are many places in any design of interferometric receiver where it is vital that relative alignment of interfering light beams be optimised and actively controlled. Examples
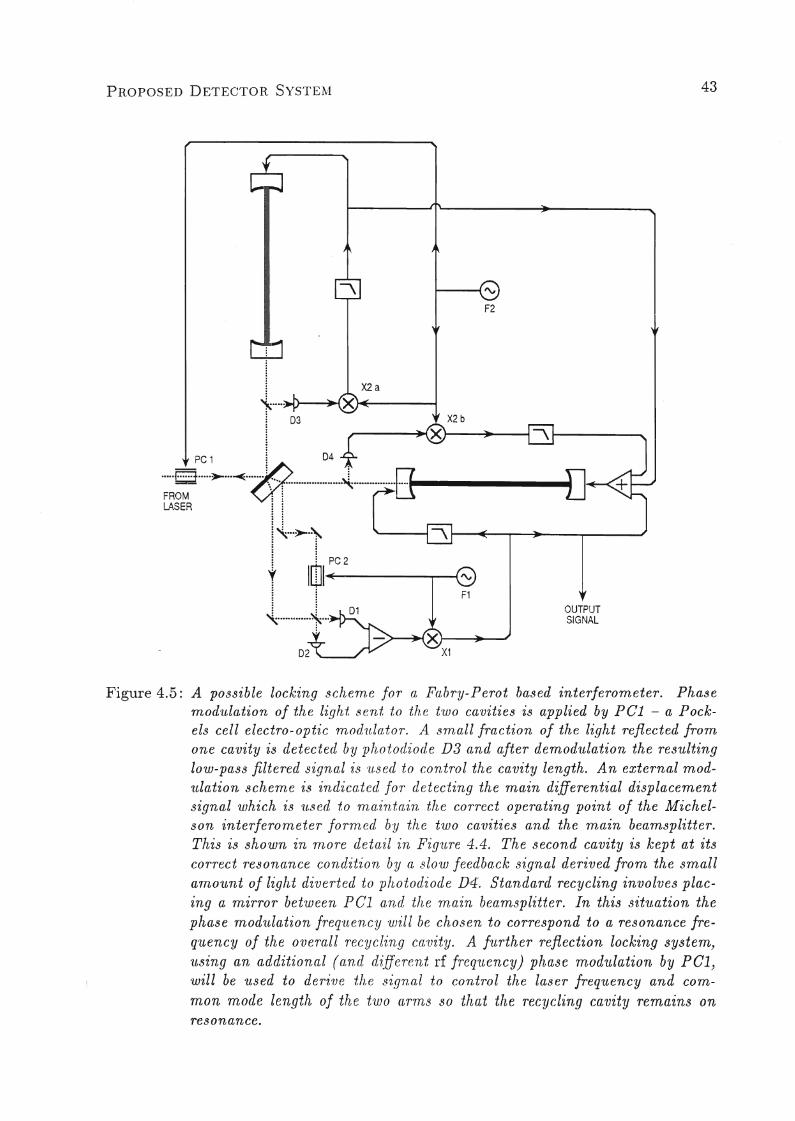
PROPOSED DETECTOR SYSTE~f 43
1---.... '"
F2
X2a
OUTPUTSIGNAL
.---_....---f\Io-----.....
\ .......)--~
I D3
.....~~..~ -e: lt> D4 ~ [1 :nFR~ ar······················\\;·..·············n---------LJLASER 1I
~~...~.~
I I PC2
t lillI~-----.. '":: F1
~ ~ .
Figure 4.5: A possible locking scheme for a Fabry-Perot based interferometer. Phasemod'l1,lation of the light ,-c;erl/t to the tVJO cavities is applied by pe1 - a Pockels cell electro-optic mod·ulator. A small fraction of the light reflected fromone cavity is detected by photodiode D3 and after demodulation the resultinglow-pass filtered signal is 'used to COrl,trol the cavity length. An external mod'lllation scheme is indicated for detecting the main differential displacementsignal which is 'llsed to mair~tain the correct operating point of the Michelson interferometer forrned by the (wo cavities and the main beamsplitter.This is shown in more detail in Fig1.l,re 4.4. The second cavity is kept at itscorrect resonance cOrl,(litior~ by a slow feedback signal derived from the smallamount of light diverted to photodiode D4. Standard recycling involves placing a mirror between PC] an,d the rnain beamsplitter. In this situation thephase mod1.llation freq'uen,cy 'uJil1 be chosen to correspond to a resonance frequency of the overall recyclin,g ca/uity. A f'll,rther reflection locking system,'llsing an additional (an,d different rf jreq1lency) phase modulation by PCl,will be used to deri've the signal to control the laser frequency and com-mon mode length of the t'UJO arms so that the recycling cavity remains onresonance.
44 CHAPTER 4
jnclude the alignment of the mode cleaning cavities for maximum power throughput,the adjustment of the beams returning from the two interferometer arms to optimisefringe visibility, and the alignment of the mirrors used for standard and dual recycling.
For precision of adjustment, the signals used to maintain alignment of two interferingbeams will have to be derived from a direct measurement of the phase gradient betweenthe beams. The proposed method of achieving this is to employ an extension of thestandard differential phase modulation technique used to obtain the signal to lock therelative average phase of two beams. The addition is that a two axis photodetector(such as a quadrant device) is also used to monitor the interference pattern. Decodingthe signals from this detector gives a measure of the differential phase gradient in twoorthogonal directions. Information on all four degrees of freedom is obtained by makingsuch a measurement at two spatially separated locations along the beam path. Thistechnique has been successfully applied to the case of cavity alignment on tl;1e 40 mprototype at Caltech.
Valid signals for this type of alignment scheme are only available when the relative phaseof the interfering beams is stably locked. It is therefore necessary that there are othercoarser controls which are sufficiently accurate for initial alignment. Optical levers andother motion sensitive optical sensors will be used for this, and will also provide themethod of maintaining alignment during short losses of lock of the interference. Theywill also provide signals to allow damping of some of the mechanical degrees of freedomof the optical components involved. Two optical levers will be used for each mass tobe controlled; one will act locally to the mass, while the other will operate with higherprecision by acting over the characteristic length of the relevant optical cell - up to300 m for the mode cleaners, and 3 km for the main arms of the interferometer. Thesesystems will use either He-Ne light or possibly light from a solid state laser. Automaticsystems will handle the transfer of feedback control signals from the three alignmentmonitors.
Systems of the type described above will be used for -
• alignment of each of the two mode cleaner cavities,
• alignment of each of the two interferometer arms (either delay lines or FabryPerots, and
• alignment of each of the two recycling systems.
The systems will also allow damping of some mechanical movements of the opticalcomponents involved.
Simpler systems using optical levers and other motion sensitive optical sensors will beused to align and stabilise the positions of other suspended optical components such asmodulators, mode matching lenses and beam steering mirrors.
There will be six control systems for alignment of the cavities and arms, each operatingin two dimensions, and approximately thirty systems for control of orientation andmovement of components, each operating in up to four degrees of freedom.
PROPOSED DETECTOR SYSTEM
4.5 Laser Stabilisation Requirements
4.5.1 Mode cleaning and frequency stabilisation
45
Experience with the prototypes have shown that fluctuations in shape, orientation,and position, of the input laser beam are important noise sources. These geometryfluctuations can be considered to be variations in the mode content of the beam. Theycan be attenuated by transmitting the light through "mode cleaning devices", such assingle mode glass fibers (as suggested by Weiss), or resonant cavities [35].
To reduce geometry fluctuations of the laser beam to an acceptable level, it is consideredessential that mode cleaning is incorporated in the design of both delay line and FabryPerot systems. To achieve our desired sensitivity goal the mode cleaning has to providea reduction in the major fluctuations in the geometry of the beam by a factor of f'V 103
in the hundred Hz region and somewhat less at higher frequencies [3]. Resonant cavitiesshould be able to handle much higher optical power than the currently used single modefibres, and will also provide the important additional benefit of passive filtering actionfor fast fluctuations of laser amplitude and frequency. \
High efficiency of optical throughput is of prime importance both for good sensitivityin the interferometer, and also to avoid possible problems due to heating of the modecleaner mirrors when many tens of watts are being transmitted. Following a conservativeapproach, knowing from experiment that f'V 0.25 W loss per mirror can be tolerated,and making the reasonable assumption that mirror losses will be f'V 100 ppm, it seemsappropriate to choose a finesse for the cavity of f'V 100. Such a cavity will use equalreflectivity mirrors of R f'V 97%, and with curvatures suitably chosen for optimum modecleaning action [35], giving good power transmission.
In order to achieve the required mode cleaning performance two similar cavities willtherefore be used in cascade. One mode cleaner cavity will also be used as the fastreference for the second stage of frequency stabilisation of the laser. It is therefore important that it is long enough for sufficient (shot noise limited) stability to be obtained.
A reduction of laser frequency noise down to f'V 3 X 10⁻⁸ Hz/y'Hz should be sufficientto keep direct coupling by scattered light to the interferometer output to an equivalentlevel of h f'V 10-24
/ y'Hz - our eventual sensitivity goal at f'V 100 Hz as limited by photonnoise. Somewhat better stability would be useful with a Fabry-Perot system, thoughin this case balancing of the responses of the cavities in the two arms also helps rejectany residual frequency fluctuations. With recycling the overall cavity formed in theinterferometer system will have a linewidth of f'V 3 Hz and will therefore provide passivefiltering of laser frequency fluctuations by a factor of f'V 60 at 100 Hz and more at higherfrequencies.
It seems appropriate to opt for a relatively long mode cleaning cavity - 100 m. This willgive a shot noise frequency stability of the transmitted light of f'V 1.. 7 X 10⁻⁶ Hz/y'Hzwith 10 W of light, which seems a satisfactory level of performance.
To achieve this level of stability will require adequate mode cleaning of the light priorto the cavity used as the frequency reference. This will come partly from the first 100 m
46 CHAPTER 4
cavity, with any extra geometry stabilisation necessary being provided by an active beampointing system, or by a.n additional sl10rt resonant cavity. Very higll servo gain will berequired to reach the frequency stability goal. As mentioned earlier, pre-stabilisationof the laser to a small stable reference cavity (and possibly to an atomic line) will beperformed, both for good long term stability, and also to ease the achievement of thenecessary high gain. Two stage frequency stabilisation systems have been developedfor both the GarcIling and Glasgow prototypes. At Glasgow, using a small rigid cavitytogether with a 10 m higher finesse cavity, loop ga.ins of r-..I 108 at 1 kHz have beenachieved without any intracavity device in tIle laser. Already this performance wouldbe satisfactory if Nd:YAG or argolllasers are used.
It should be noted that the design of tIle vacuum system is such that it would bestraightforward to increase the length of tIle mode cleaning cavities should extra passivefiltering of fast fluctuations of laser frequency and amplittlde be required.
4.5.2 Pow-er stabilisation
Stabilisation of the low frequency povver fluctuations of the illuminating laser is requiredprimarily to avoid the coupling of this noise to the interferometer output due to unavoidable slight offsets of the fringe locking point. Another potential route for couplingis via unbalanced radiation pressure effects in the two arms.
A satisfactory technique developed for high gain stabilisation of power fluctuations isto compare the photocurrent produced by a sample of the light with a reference value,and use the resulting signal to feedbacl<: to tIle laser power supply. This has beendemonstrated at Orsay (VIRGO) and at MPQ to provide performance which shouldbe adequate for our proposed system. If more gain-bandwidth is required the feedbacksignal can be used to adjust an electro-optic attenuator placed in the optical path beforethe pickoff point. A suitable attenuator for plane polarised light can be constructed usingmultiple Pockels cells, together with an allalysing polariser, and such a system has beenstudied in detail at Glasgow [36].
4.6 Laser Systems
Currently there are two types of lasers suitable as light sources for interferometric gravitational wave detectors: argon ion lasers alld Nd:YAG lasers. The principle advantage ofthe argon ion laser is that the technology already exists. At present all major prototypeexperiments are using argon ion lasers operating at .514 nm. Nd:YAG lasers suitable forour purposes, on the other hand, are just novv being developed and the state of the art isprogressing rapidly. The chief advantage is that they are more efficient and have higheroutput power. Another consideration is that tIle Nd:YAG high power line is at 1064nmwhich then must be frequency doubled in order to obtain light with a wavelength closeto that of the argon laser. This wavelength is preferred because shorter wavelengthallow smaller beam diameters leading to smaller optical components. Another practical advantage is that visible light is easier to work with than infrared. Thus, on the
PROPOSED DETECTOR SYSTEM 47
whole, the doubled Nd:YAG laser approach is the favoured scheme when the technologybecomes available.
4.6.1 Argon ion laser
At present the argon ion laser is still the best choice if one considers power to wavelengthratio, mode purity of the beam, stability, and reliability. The most powerful argon ionlasers con1.mercially available offer a multi line power of 25 W. For single mode operationthis corresP9nds to about 6 W, perhaps up to 8 W under optimum conditions. To arrive-at higher light powers it has been proposed to add the output of several lasers coherently.For this purpose these lasers could be seeded with the light from a stabilised masterlaser, in this way forcing all lasers to oscillate locked in phase. The feasibilities ofthis technique and of other schemes for coherent addition have already been verifiedexperimentally in Orsay and in Glasgow [37,38]. The major disadvantage of this typeof laser is its rather poor efficiency. For tIle required single line, single mode operationonly a few times 10-4 of the input power is converted into light. This means that 1 MWof continuous power would be necessary to sustain laser light powers of around 100.W.
4.6.2 Nd:YAG laser
Over the last few years a very promising alternative to the argon ion laser has beenunder development: the Nd:YAG laser. Although mainly used as a pulsed laser in thepast, there are now commercially available models offering up to 1 kW of continuouswave light power, although in multi line mode. These types are pumped by dischargelamps, giving an efficiency of about 1%.
Frequency doubling techniques are under active development and already 2 W singlemode of continuous frequency doubled light have been observed from a flash lamppumped laser at MPQ and 6.5 W cw have been obtained from a similar laser by aresearch group in the Research Institute of Synthetic Crystals, Beijing, China.
Semiconductor laser diodes can pump Nd:YAG much more efficiently than flash lamps(1'.1 10% has been achieved). So far only low power versions of this type are commerciallyavailable, the main reason for this being the fact that the price for laser diodes is stillrather high. But the evolution in this field is rather spectacular, and the price isexpected to drop to an economical level in the. relatively near future. Developmentof diode-pumped Nd:YAG lasers is progressing worldwide. The Laser-Zentrum at theUniversitiit Hannover is working on such systems and on the provision of frequencydoubled light in support of this proposal. Similar laser development is being pursuedat Stanford and Orsay in support of the LIGO and VIRGO projects respectively.
For Nd:YAG lasers to be used for gravitational wave interferometers they must, like theargon ion lasers, be operated, single line, single mode, and also need to be frequencystabilised. First experiments is this field with light at 1064nm [39] showed (for anoutput power of 100mW) that the Nd:YAG laser can definitely compete with the argon
48 CHAPTER 4
ion laser in terms of noise performance. Very recent results from Orsay suggest this isalso true for much higher laser powers (up to 18 W).
Our intention is to use frequency doubled Nd:YAG light for the interferometers. Inthe unlikely circumstance of suitable Nd:YAG laser systems not being ready for initialoperation of the interferometers, we still have the possibility of starting using argon ionlasers.
Chapter 5
The Vacuum System
5.1 Introduction
In order to accommodate two interferometer systems with reasonable ease of access,separate vacuum tanks are provided for the test masses of the delay line and for,the testmasses of the Fabry-Perot based system. Thus two tanks are required at each end ofboth arms. These tanks are chosen to be of 3 m diameter with access horizontally fromthe side, the size being determined by the need to accommodate a double pendulumsuspension and five layer isolation stack for each test mass, and also to accommodatereaction masses for the test masses whose axial positions have to be controlled. Thepipe diameter has to allow free passage of the beams for the two interferometers, anddesign indicates that a free internal diameter of 1.26 m is adequate. The basic diameterof the Eipe has to be some 12 cm larger to allow for baffles to be installed to reducethe effects of scattered light on the operation of the interferometers. A central tankto accommodate the beamsplitters and other optical components is required and thisshould be 4 m diameter. One input and one output tank is also required for eachinterferometer to hold beam conditioning and recycling optics. The proposed vacuumsystem is shown in outline in Figure 5.1 .
A further design feature of the interferometers is the use of long mode cleaning cavitiesfor the input light, as discussed in Chapter 4. The two mode cleaners for a singleinterferometer would be housed in a pipe of 0.4 m diameter running parallel to one ofthe arms; the mode cleaners for the second receiver would be housed in a similar pipelying along the other arm.
5.2 Detailed Description
As discussed widely in earlier proposals a high vacuum is required for the system.To achieve the goals of this proposal the average pressure should be no greater thanI'J 10-8 mbar (hydrogen) with a partial pressure of heavier molecules, such as water andnitrogen, not exceeding I'J 10-9 mbar in total.
49
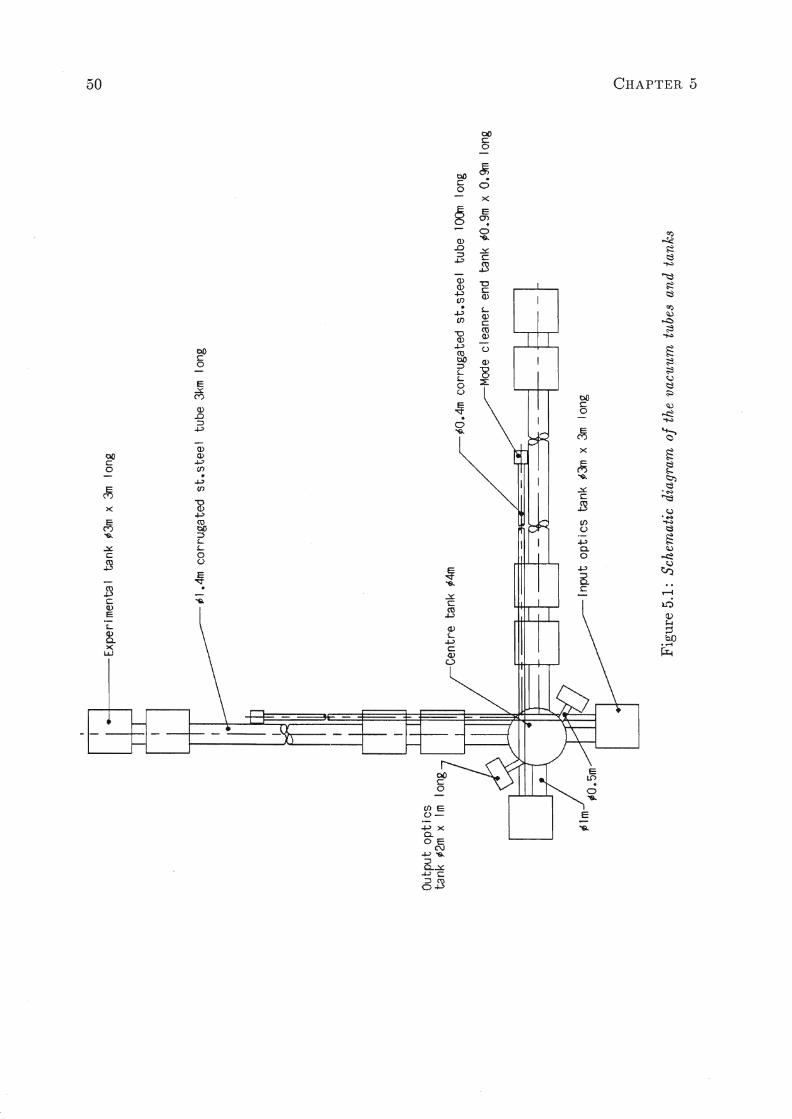
• I Experimenta I tank ,s3m x 3m long
Oto
Input optics tank ~3m x 3m long
Cl~
>~
~M~
01
~O.4m corrugated st.steel tube lOOm long
Mode cleaner end tank ~O.9m x O.9m long
~1.4m corrugated st.steel tube 3km long
Figure 5.1: Schematic diagram of the vacuum tubes and tanks
Centre tank ;4m
Output opticstank ~2m x Im
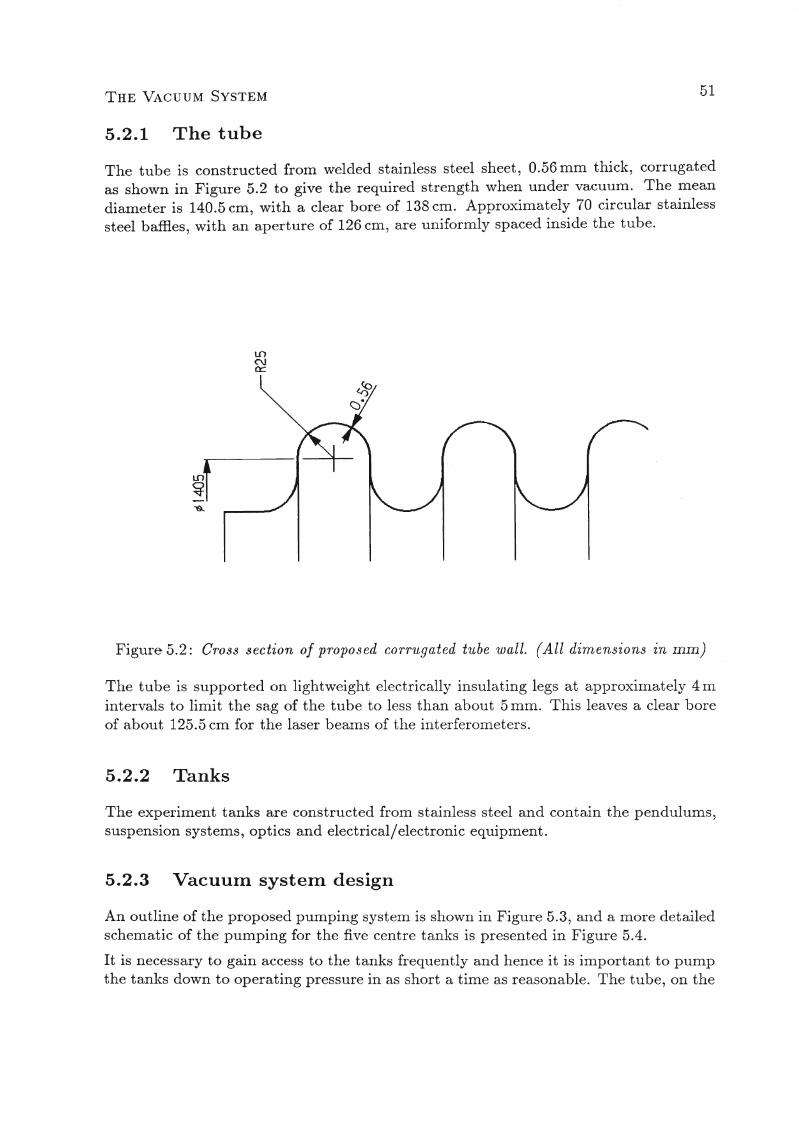
THE VACUUM SYSTEM 51
5.2.1 The tube
The tube is constructed from welded stainless steel sheet, 0.56 mm thick, corrugatedas shown in Figure 5.2 to give the required strength when under vacuum. The meandiameter is 140.5 cm, with a clear bore of 138 cm. Approximately 70 circular stainlesssteel baffles, with an aperture of 126 cm, are uniformly spaced inside the tube.
Figure 5.2: Cross section of proposed corrugated tube wall. (All dimensions in mm)
The tube is supported on lightweight electrically insulating legs at approximately 4 mintervals to limit the sag of the tube to less than about 5 mm. This leaves a clear boreof about 125.5 cm for the laser beams of the interferometers.
5.2.2 Tanks
The experiment tanks are constructed from stainless steel and contain the pendulums,suspension systems, optics and electrical/electronic equipment.
5.2.3 VacuuIn systeIn design
An outline of the proposed pumping system is shown in Figure 5.3, and a more detailedschematic of the pumping for the five centre tanks is presented in Figure 5.4.
It is necessary to gain access to the'tanks frequently and hence it is important to pumpthe tanks down to operating pressure in as short a time as reasonable. The tube, on the
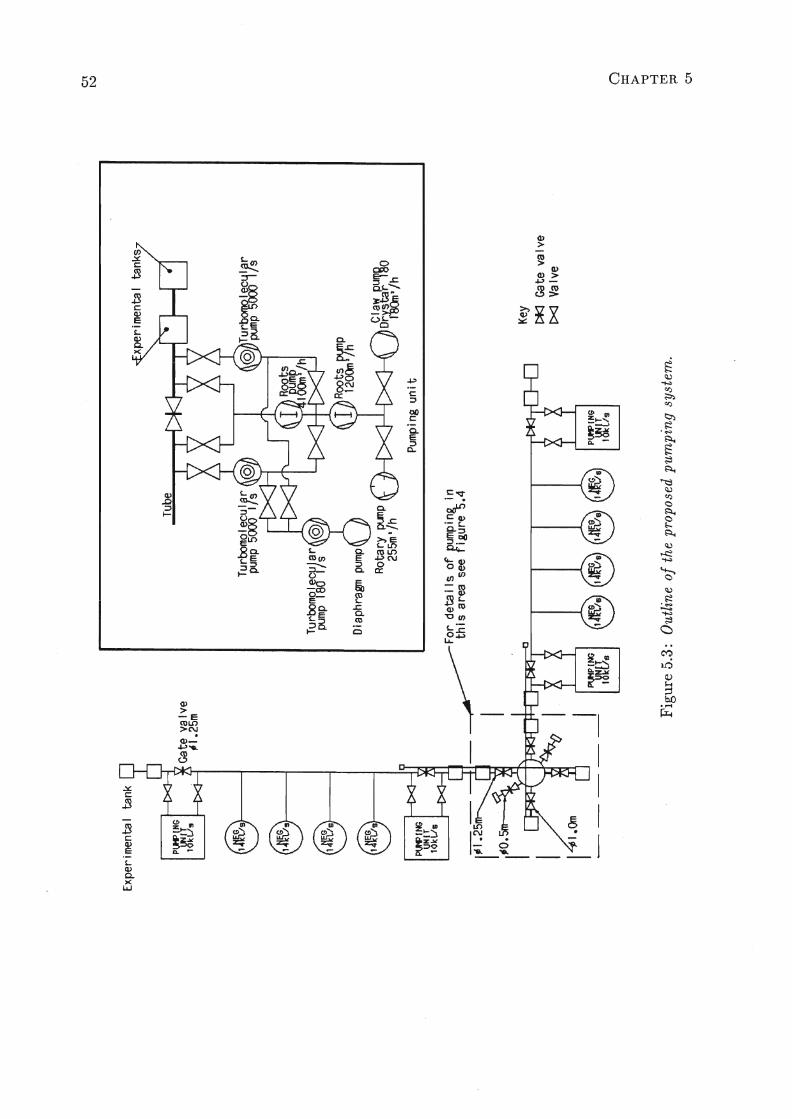
01tv
Cl~
>~
~ttj
~
<:..n
Key[:;:4<] Ca te va I ve[><J Va Ive
Claw pumcDr.Y~tar/ l~O
Il3On' h
xper imenta I tanks
PIJFIHG
l~lJ9
Pumping unit
Tube
TU.rbomoJ..ecu Jarpump loo I/s
Diaphragm pump
Rotary punp255m'/h
MP ING
1~~lJs
Figure 5.3: Outline of the proposed pumping system.
~For details of pumping in~ this area see figure-S.4
Gate valve"1.25m
lJ\~/gJ I
lltc~SJ I
l~~G/SJ I
1~~9J I
PlWlNGIJ4IT
10kVs
Experimental tank
THE VACUUM SYSTEM 53
other hand, contains no equipment and should not need to be accessed. Therefore largegate valves of 125 cm bore are used to isolate the tanks from each 3 km length of tube.Other gate valves isolate the various tanl<:s in the centre station, enabling modificationsto be carried out whilst part of the detector is still operating.
The processing and pump down of the tube can take several weeks. The tanks shouldbe down to pressure in several days.
To reduce the pumping requirements, the whole system is built to UHV standards usingonly metals and ceramics in the vacuum except for Viton seals in the large gate valves.The tube will be given a light bake, 150°C to 200°C, in air for 24 hours followed by avacuum bake at the same temperature for 3 days. Experiments show that the benefitsof tp.e air bake are retained after letting the system up to air. The vacuum bake mustbe repeated after each let up. The specific surface outgassing rate has been measuredto be rv 10-12 mbar 1/s/cm2 with this treatment after 3 days.
The tanks cannot be baked at this temperature when full of equipment. At best, a 80aCvacuum bake is assumed, to drive off most of the water. The surface areas of the tanksand equipment are not well known but are estimated at 106 cm2 per tank. The specificsurface outgassing rate is assumed to be 10-11 mbarl/s/cm2
•
With the above parameters the pumping system can be designed. The two tanks atthe ends of the tubes are pumped by a 50001/s turbomolecular pump. Another 5000l/sturbomolecular pump at each end of the two tubes contributes mainly to the tankpumping when the 125 cm diameter gate valves are open. A further 50001/s and four2200 1/s turbomolecular pumps are used to pump the centrally located tanks.
In addition to the turbopumps at the ends of each 3km arm there are four 14,0001/snon-evaporable getter pumps spaced along each of the arms. The pumping systemshown in Figure 5.3 should produce an average pressure below 10-8 mbar at the statedoutgassing loads.
The turbomolecular pumps have gate or butterfly valves to isolate them from the vacuumtanks and tube. Like the tube gate valves, these are all-metal, except for the Viton gateseals.
The turbomolecular pumps are backed by a special high compression ratio turbomolecular pump which can be operated at high backing pressures. This latter feature enablesthe use of a dry (oil free) diaphragm-type backing pump.
The roughing pumps consist of a combination of roots, claw and rotary vane pumps,located at both ends of each tube arm. Roughing is expected to take 18 hours fromatmosphere to 10-2 mbar for the tubes and 20 minutes for the two tanks on the ends ofthe arms. These pumps are also to be used to back the turbomolecular pumps at thehigher throughputs.
The NEG pumps do not require backing pumps, but need activating at 800ae by electrical (ohmic) heating from a suitable power supply.
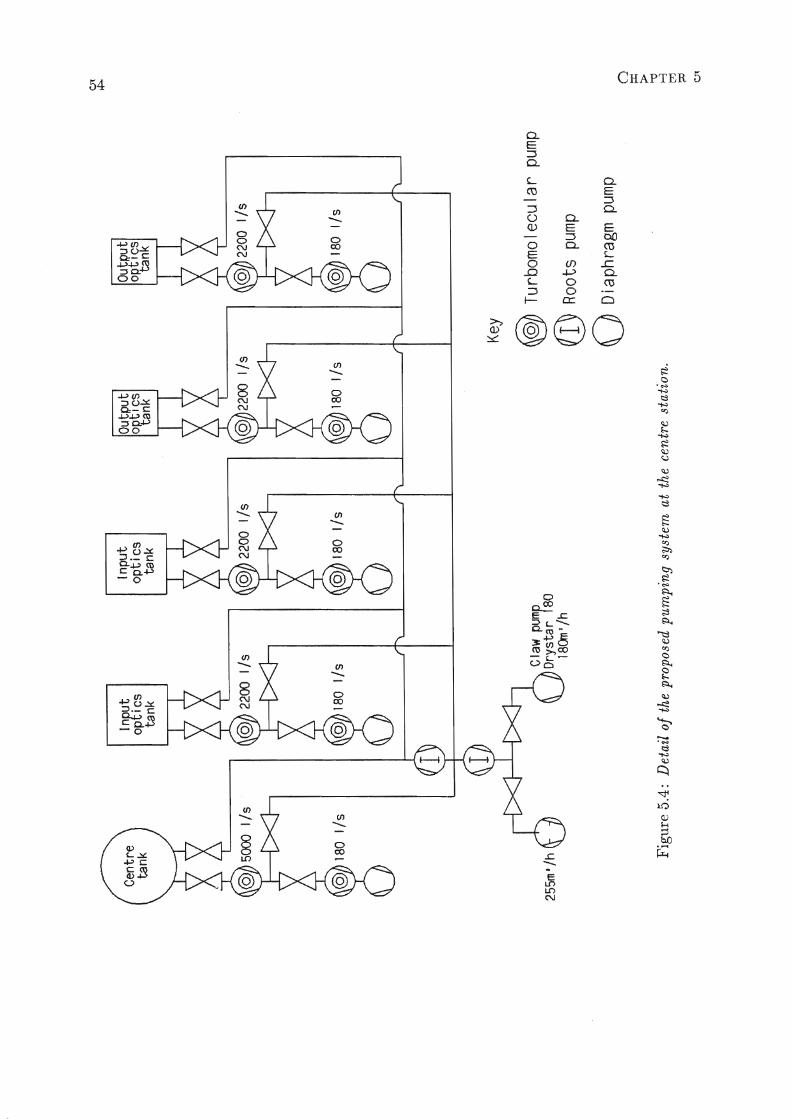
C}1~
Cl::t:>~
~M~
CJ1
OutputoRtics
tank
Key
~ Turbomolecular pump
@ Roots pump
~ Diaphragm pump
Outputoptics
tank
Inputoptics
tank
Claw pumpDrystar f80
18()n'/h
Inputoptics
tank
Figure 5.4: Detail of the proposed pumping system at the centre station.
255m'/h
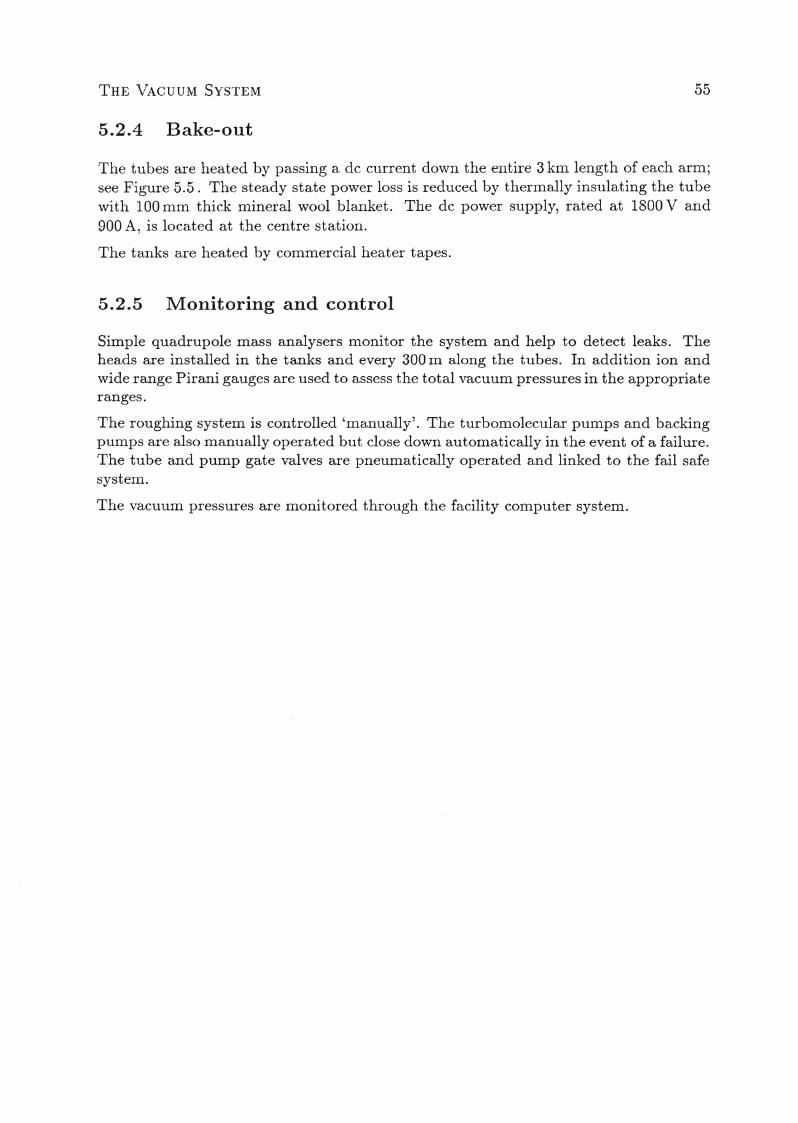
THE VACUUM SYSTEM
5.2.4 Bake-out
55
The tubes are heated by passing a dc current down the entire 3 km length of each arm;see Figure 5.5. The steady state power loss is reduced by thermally insulating the tubewith 100 mm thick mineral wool blanket. The dc power supply, rated at 1800 V and900 A, is located at the centre station.
The tanks are heated by commercial heater tapes.
5.2.5 Monitoring and control
Simple quadrupole mass analysers monitor the system and help to detect leaks. Theheads are installed in the tanks and every 300~ along the tubes. In addition ion andwide range Pirani gauges are used to assess the total vacuum pressures in the appropriateranges.
The roughing system is controlled 'manually'. The turbomolecular pumps and backingpumps are also manually operated but close down automatically in the event of a failure.The tube and pump gate valves are pneumatically operated and linked to the fail safesystem.
The vacuum pressures are monitored through the facility computer system.
Ps1Jl800V900A
3km Vacuum tube
1.7a1068kW at 200·C
Cable 3xO.95 cm~(900A)
CJl~
Figure 5.5: Outline of the propos ed system for baking the vacuum t1lbes. Cl~
>~
~M~
CJl
Chapter 6
Vibration Isolation
6.1 Introduction
The extent to which long baseline interferometric detectors can be operated with reasonable sensitivity at the lower end of the frequency spectrum will depend crucially onthe level of seismic and mechanical isolation achievable [40]. The design of a vibrationisolation system must allow for vibrations which may be ground borne, air borne, orstructure borne, and which may arise either outside the detector (i. e. environmentalnoise including seismic noise) or associated with the detector (vacuum pumps etc.). Theaim of the currently proposed isolation system is to reduce the effect of all· such vibrations on the components of the detector (especially the test masses and other opticalcomponents) to allow the photon noise limited design sensitivity shown in Figure 3.3for burst sources to be achieved. This implies that a limit to sensitivity due to seismicnoise of h rv 10-23 or better for pulses at 100 Hz should be sought. A system designed tomeet this criterion is expected to be more than adequate for frequencies above 100 Hz.Modifications may be added at a later date to extend the performance to frequenciesbelow 100 Hz. For example a compact multiple pendulum system is under considerationat the Max-Planck-Institut for this purpose.
Once the levels of noise from the various sources and the acceptable level at each of thevulnerable components has been established, the necessary degree of isolation can becomputed. Vibrations can of course be transmitted by several routes, and each routemust be considered. Figure 6.1 shows schematically some of the possible vibration routesin the proposed design. The figure does not show the possibility of the conversion oflow frequency noise to high frequency noise by non-linear components (an effect that weare confident can be kept small by suitable design), nor does it show any cross-couplingof vertical noise into the horizontal direction. This latter effect is very important andhas the consequence that a high level of vertical isolation is required; the overall systemdesigned to incorporate this vertical isolation is expected to have more than adequatedirect horizontal isolation. Figure 6.2 shows a subset of the system, relating seismicmotions to motions of the test mass by the most critical route.
57
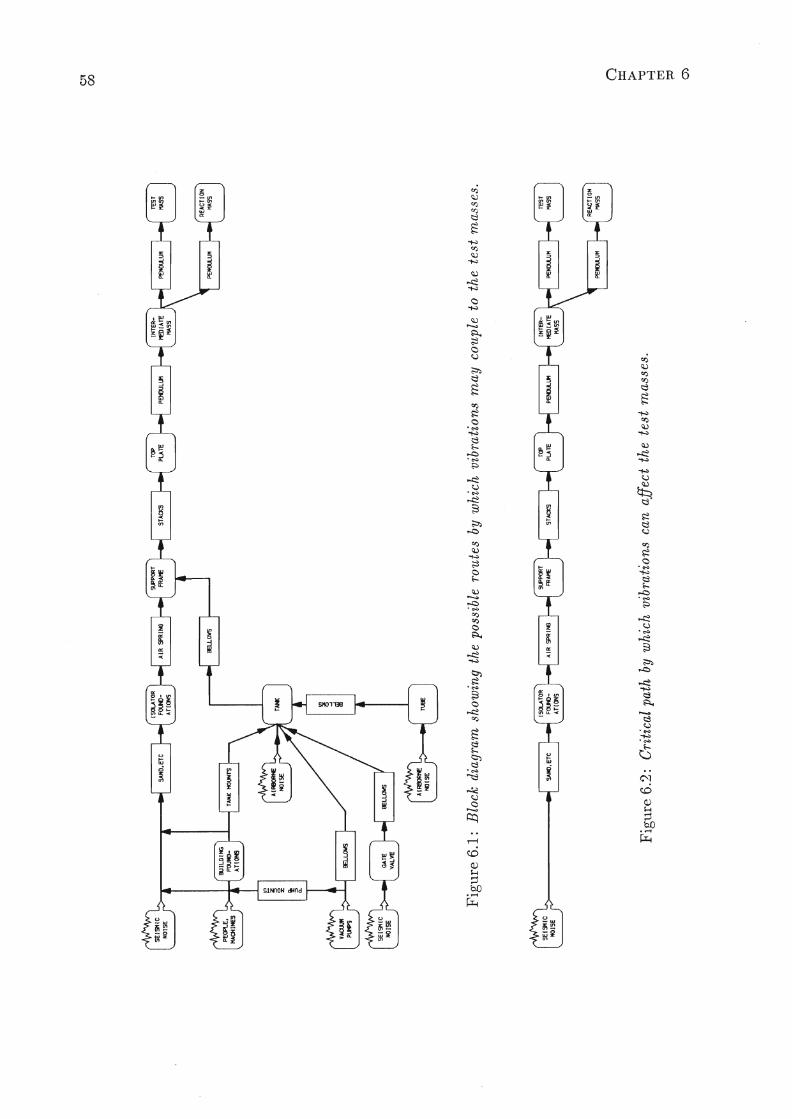
Figure 6.1: Block diagram showing the possible routes by which vibrations rnay cO~llple to the test rnasses.
Figure 6.2: Critical path by which vibrations can affect the test mass es.
et00
Cl~
>""d~M~
0)
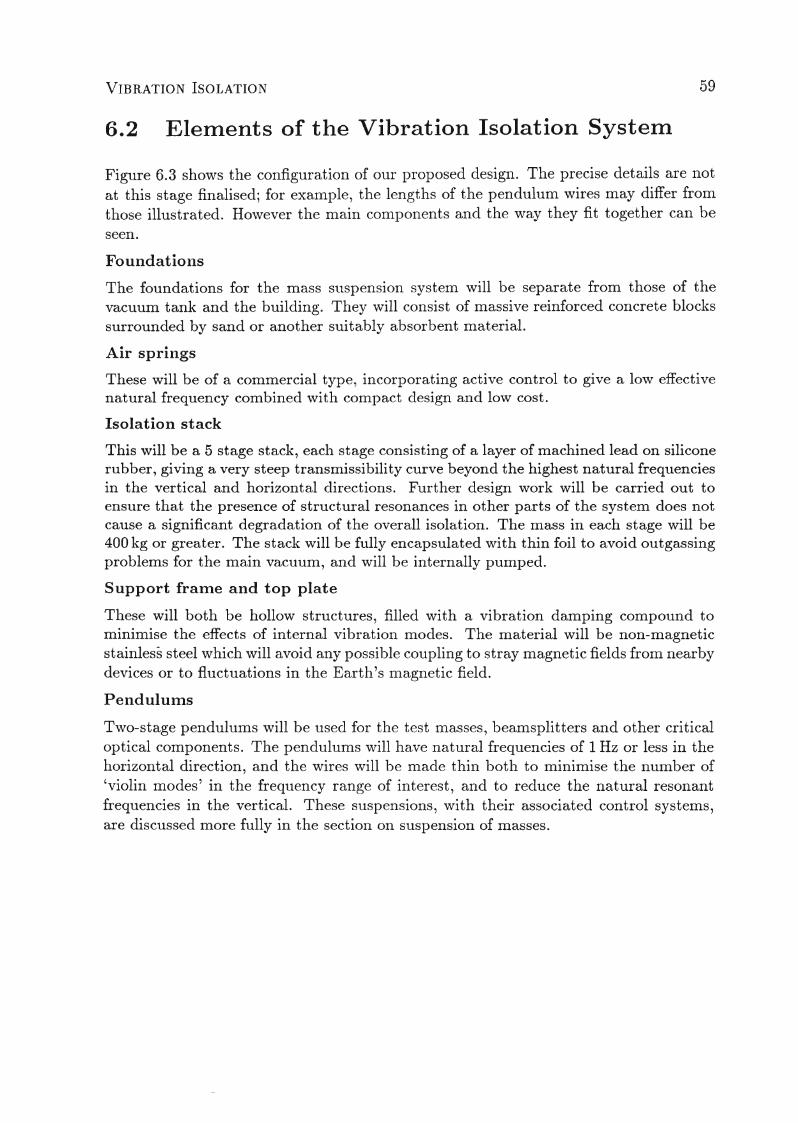
VIBRATION ISOLATION
6.2 Elements of the Vibration Isolation System
59
Figure 6.3 shows the configuration of our l)rOposed design. The precise details are notat this stage finalised; for example, tIle lengths of tIle pendulum wires may differ fromthose illustrated. However tIle main conlponents and the way they fit together can beseen.
Foundations
The foundations for the mass stlspension system will be separate from those of thevacuum tank and the building. They will consist of massive reinforced concrete blockssurrounded by sand or another suitably absorbent material.
Air springs
These will be of a commercial type, incorporating active control to give a low effectivenatural frequency combined with compact design and low cost.
Isolation stack
This will be a 5 stage stack, each stage consisting of a layer of machined lead on siliconerubber, giving a very steep transmissibility curve beyond the highest natural freqtlenciesin the vertical and horizontal directions. Further design work will be carried out toensure that the presence of structural resonances in other parts of the system does notcause a significant degradation of the overall isolation. The mass in each stage will be400 kg or greater. The stack will be fully encapsulated with thin foil to avoid outgassingproblems for the main vacuum, and will be internally pumped.
Support frame and top plate
These will both be hollow structtlres, filled with a vibration damping compound tominimise the effects of internal vibration modes. The material will be non-magneticstainless steel which will avoid any possible coupling to stray magnetic fields from nearbydevices or to fluctuations in the Earth's magnetic field.
Pendulums
Two-stage pendulums will be used for the test masses, beamsplitters and other criticaloptical components. The pendulums will have natural frequencies of 1 Hz or less in thehorizontal direction, and the wires will be made thin both to minimise the number of'violin modes' in the frequency range of interest, and to reduce the natural resonantfrequencies in the vertical. These suspensions, with their associated control systems,are discussed more fully in the section on suspension of masses.
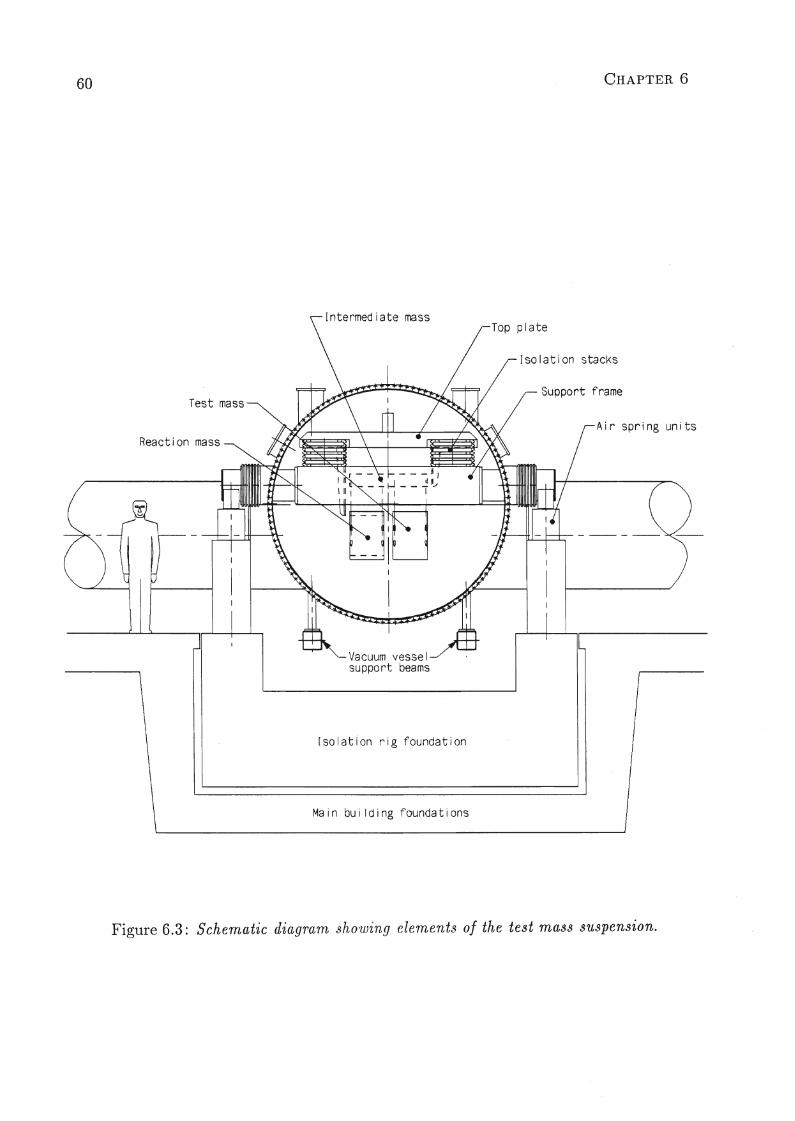
60
Test mass
Reaction mass
CHAPTER 6
Intermediate massTop plate
Isolation stacks
Support frame
Air spring units
Vacuum vesselsupport beams
[solation rig foundation
Main bUilding foundations
Figure 6.3: Schematic diagram sho'wing elements of the test mass suspension.
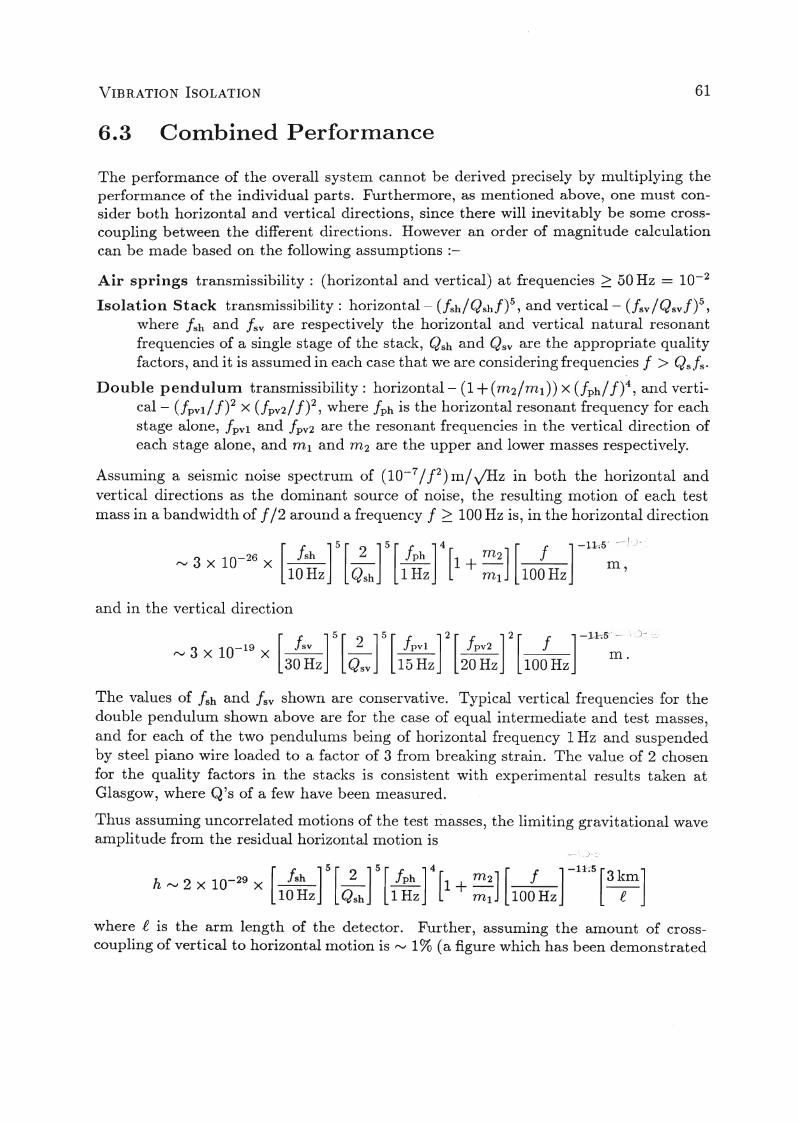
VIBRATION ISOLATION
6.3 Combined Performance
61
The performance of the overall system cannot be derived precisely by multiplying theperformance of the individual parts. Furthermore, as mentioned above, one must consider both horizontal and vertical directions, since there will inevitably be some crosscoupling between the different directions. However an order of magnitude calculationcan be made based on the following assumptions :-
Air springs transmissibility: (horizontal and vertical) at frequencies ~ 50 Hz = 10-2
Isolation Stack transmissibility: horizontal- (fsh/Qshf)5, and vertical- (fsv/Qsvf)5,where fsh and fsv are respectively the horizontal and vertical natural resonantfrequencies of a single stage of the stack, Qsh and Qsv are the appropriate qualityfactors, and it is assumed in each case that we are considering frequencies f > Qsfs.
Double pendulum transmissibility: horizontal- (1+(m2/ml)) x (fph/ f)4, and vertical - (fpvl/ f)2 x (fpv2/ f)2, where fph is the horizontal resonant frequency for eachstage alone, fpvl and f pv2 are the resonant frequencies in the vertical direction ofeach stage alone, and ml and m2 are the upper and lower masses respectively.
Assuming a seismic noise spectrum of (10-7/ f2) m/y'Hz in both the horizontal and
vertical directions as the dominant source of noise, the resulting motion of each testmass in a bandwidth of f /2 around a frequency f 2: 100 Hz is, in the horizontal direction
rv 3 X 10-26 X [~] 5 [~] 5 [ fph ] 4 [1 + m 2 ] [ f ] -11.5~ r).
10Hz Qsh 1Hz ml 100Hz '
and in the vertical direction
[ ]5[ ]5[ ]2[ ]2[ ]-1~.5'3 10-19 !sv 2 !pv1 !pv2 ! .
rv X X 30Hz Qsv 15Hz 20Hz 100Hz m.
The values of fsh and fsv shown are conservative. Typical vertical frequencies for thedouble pendulum shown above are for the case of equal intermediate and test masses,and for each of the two pendulums being of horizontal frequency 1 Hz and suspendedby steel piano wire loaded to a factor of 3 from breaking strain. The value of 2 chosenfor the quality factors in the stacks is consistent with experimental results taken atGlasgow, where Q's of a few have been measured.
Thus assuming uncorrelated motions of the test masses, the limiting gravitational waveamplitude from the residual horizontal motion is
h rv 2 X 10-29 X [~] 5 [~] 5 [ fph ] 4 [1 + m 2 ] [ f ] -1 .5 [3 km]10 Hz Qsh 1 Hz ml 100 Hz /!,
where /!, is the arm length of the detector. Further, assuming the amount of crosscoupling of vertical to horizontal motion is rv 1% (a figure which has been .demonstrated
62 CHAPTER 6
by the VIRGO group at Pisa for their multiple pendulum suspension system [41]), theresidual vertical motion leads to a limiting amplitude of
[ ]5[ ]5[ ]2[ ]2[ ]-11.5[ ]-24 !sv 2 !pvl !pv2 ! 3 kmh '" 2 x 10 x 30Hz Qsv 15Hz 20Hz 100Hz -,e- ·
Thus we may conclude from these figures that the system should provide adequateisolation in the region of 100 Hz and above. However if more isolation were requiredin the vertical direction, this could be implemented by incorporating a spring of lownatural resonant frequency as the first stage in the double pendulum, in the mannercurrently used in the prototype detector at Garching.
It should be noted that these simplified formulae will not apply above a few hundredHz due to the presence of wire resonances and internal modes of the isolation system.However the isolation provided by the,proposed system is in general increasing as a verysteep function of frequency, and thus we expect that at these higher frequencies it willbe more than adequate.
More accurate calculations based on the scheme outlined above have been done using thefinite element method, and preliminary results suggest that the performance estimatesgiven here are of the correct magnitude.
There are a number of possibilities for improving the seismic isolation at frequenciesbelow 100 Hz. One approach is the use of active isolation systems of a number of types[42,43,44,45,46,47]. Another approach is to increase the level of passive isolation. Wenote that there is some very promising work being done in this field by the VIRGO groupusing a multiple pendulum isolation system at Pisa [41,48].
6.4 Suspension of Test Masses and Other OpticalElements
For the test masses which require axial displacement to allow arm length control, reaction masses of equal mass suspended from the same intermediate mass will be installed.(See Figure 6.3.) This feature is implemented for several reasons. Firstly, it implies thatto first order no force is applied to the common point of suspension of the test mass,and reaction mass, thus minimising the likelihood of exciting any resonances of the topplate or its support frame. Secondly, it avoids the possibility of directly coupling in seismic and mechanic.al vibrations of any fixed backing plate used to support the feedbacktransducers. Thirdly, it avoids the possibility of res'onances of such a plate limiting thebandwidth of the axial control systems. The intermediate mass will be approximatelythe same mass as the test mass/reaction mass combination in each case.
The axial control signals will be split, the low frequency part going to electromagnetic(coil/magnet) drive systems for the intermediate suspension masses and the higher frequency parts being applied between the test masses and reaction masses by electrostaticor electromagnetic drive systems. Orientation of the test masses in tilt and rotation will
VIBRATION ISOLATION 63
be achieved by orientation of the intermediate suspension masses with respect to thetop plate on the isolation stack by means of coil magnet drive systems. This reducesthe amount of magnetic material directly on the test masses themselves. It also definesthat the intermediate masses should be on single wire loop suspensions while the testmasses should be on double wire loop suspensions. The intermediate masses and reaction masses should be damped electronically to the top plate of the stacks to damp outunwanted normal modes of the system.
A number of other optical items must be suspended. The beamsplitters and recyclingmirrors in the central tank are to be hung as double pendulums, feedback to thembeing implemented with respect to a base plate hung and damped to the top plateof the antivibration stack in this tank. Other mirrors, Brewster angle splitters andexternal modulation units will be suspended in a similar way or mounted directly onthe suspended plate.
The mirrors for the. mode cleaners are to be suspended as single pendulums and dampedand controlled with respect to suspended base plates as for the components in the centraltank. Other optical components on the input beam line in the tank containing the inputoptics are to be mounted directly on a suspended base plate.

64
Chapter 7
Data Acquisition and Analysis
7.1 Data Acquisition
Various aspects of data acquisition and data analysis for gravitational wave detectionhave received great attention starting from the earliest days of Weber's resonant barantennas, and the methods were continually refined in the subsequent two decades. Inmany respects one will be able to draw upon this experience.
One distinguishing feature of the data produced by the proposed interferometric gravitational wave detector is its broadband nature, resulting in storage requirements of theorder of a few terabytes per year of operation (1 TB = 1012 Bytes). It is obvious thatthe acquisition, storage, exchange, and analysis of such large amounts of data need to bediscussed in detail. But it will be shown that, even with today's commercially availableequipment, the task is manageable, at a cost that is within reason. Developments inthe next few years can be expected to improve the performance and at the same timereduce the prices of the electronic equipment considerably.
7.1.1 The interferoIneter signal and auxiliary data
In the mode in which the antenna is to be operated it is the compensating signalrequired to keep the interference of the recombined beams near minimum that is laterto be analysed for gravitational wave signals. This signal requires sampling at a rate ofrv 10 kHz as will be discussed later.
In addition to this signal proper, there are various operational data ("housekeepingdata") that are necessary to characterise the operational status and the level of external noise contributions. The most important of these are such sources as seismic andacoustic noise and also fluctuations in the laser light (frequency, power, beam geometry).Particularly in the early experimental stages, such signals would also require samplingat kHz rates.
Furthermore, there will be slowly varying operational and environmental parameterssuch as vacuum pressure, meteorological or geomagnetic data; error point signals from
65
66 CHAPTER 7
some of the detector's main servo loops also should be recorded. Flexibility for addingsuch parameters must be provided.
7.1.2 Data voluIne
Typically, for target frequencies up to several kHz (see Chapter 2) a sampling rate ofnot less than 10 kHz would be advisable. In order to provide sufficient dynamic range,an AID conversion resolution of 16 bit (2 Bytes) seems a reasonable choice.
Together with the housekeeping information, data rates between 30 and 100 kBls mayhave to be read out and stored. This data rate may vary, depending on the particularastrophysical goal, on the amount of narrowbanding, and on the desire to find correlations, or transfer functions, between external noise sources and the interferometersignal, particularly in the starting phases of the experiment.
At any rate one must envisage a data volume of the order of 1 to 3 TB (1012 Bytes) peryear of operation. These data will have to be read out and stored (archived), but alsocopied and shipped for coincidence analysis with data of other installations.
7.1.3 Storage media
While the data rate of up to 100kB/s could easily be handled by local area networks(LANs), transmission to a distant computing centre would be very expensive. Therefore,storage on site, i. e. at the location of the exp~riment, is required.
Th~re are, at present, several well-established storage schemes, using either magnetictape cassettes or optical discs. Very promising, both in storage density and in price, arethe recently announced optical paper tapes [49].
In selecting the storage scheme, an important point is that a WORM system (write once- read many times) is sufficient. Most of the optical disk systems now on the marketare of the WO.RM type. Tapes do not allow in-place changes, so in practice they can alsobe considered WORM media.
One distinction between tapes and optical disks is given by the access they allow. Opticaldisks allow some faster quasi-random access, while tapes are, even with fast forwardand re-wind, essentially sequential. But the main usages of the data, particularly ina first scan through them, will be sequential; only later will closer looks into the datarequire a more random access, but there the retrieval of the proper volume (disk ortape) can be expected to take more time than locating the interesting data inside thisvolume.
7.1.4 Hardw-are cost
Tape cassettes (video cassettes or digital audio cassettes) have now reached such a highdata capacity (up to several GB) that exchange of the cassette will in general be required
DATA ACQUISITION AND ANALYSIS 67
only every 6 to 24 hours. Storage for a full year of data would currently cost about£10 k. Optical disks offer comparable storage capacities and densities, but currentlyare still a factor of 30 to 100 more expensive; this may change in time scales of a fewyears.
For data exchange with the collaborating laboratories some further expenditure forstorage media will arise. But by using tape cassettes or erasable optical disks, only aone-off investment for about one year's worth of data is needed (assuming that eachlaboratory takes responsibility for archiving its own data).
The investment cost of the drives is in the order of several thousand pounds, both formagnetic and optical devices. A minimum of two drives is required, and an additionalstandby drive would be very desirable. Furthermore at least two drives are needed atthe computing centre.
One further aspect is the space taken by archiving the data taken over many years. Themagnetic tape cassettes from a full year's run would fill only a fraction of a cubic meter;and again optical disks would not be much different. Thus to have many years of data,together with copies from collaborating laboratories, would not present serious spaceproblems.
The choice of the medium should not be made at the moment. The market is undergoingsuch rapid changes that by the time the large amounts of data need to be written, newdevelopments may well have come up (such as "digital paper"), and prices for the mediawill certainly drop further.
Good coordination between the groups for maximum compatibility will be required toensure an easy international exchange of data. This concerns the choice of the storagemedium as well as the data format on these media. But again, it appears premature tomake any decisions on that now.
7.1.5 Data integrity
High standards of reliability and integrity are required for all of the data that are tobe read out from the detector system. An important aspect is to avoid all mutualinterference (cross-talk) between individual signals, and in particular to avoid hum atthe mains frequency and its harmonics. Ample use of isolating amplifiers (to avoidground loops), and early AID conversion (to avoid cross talk) are reasonable safetymeasures, and the expense of such measures is affordable (of order £10 k in all). Forsignals which have to be sent along the length of the arms, transmission via glass fibresis to be preferred.
The magnetic as well as the optical storage schemes provide ample error correction,a typical specification being, say, one unrecovered error in 1013 bits, i. e. of order onesingle bit error once a year.
68 CHAPTER 7
7.1.6 TiIlling accuracy
Coincidence observations of short burst GW signals from distant antennas as well as thesearch for long term periodic GW signals require stable and synchronised clocks to beavailable at each receiving station. It is convenient to synchronise the sampling pulseswith the clock pulses to avoid having to record high-accuracy time information.
Integration times of about a year, as may be used for the detection of periodic GWsignals, require a long term clock stability of < 10-11 . Caesium atomic clocks, having arate stability of < 10-12 would provide adequate timing. More economically, however,accurate relative timing may be achieved by synchronising the respective local timeswith time signals broadcast by special radio transmitting stations.
The relative deviation between different local times should be only a very small fractionof the gravitational wave propagation time between the different antenna sites. Onewould want a relative accuracy of better than 50-100 ps for antenna separations of about1000 km. The time signal of the German transmitter station DCF 77 near Frankfurt,operated by the PTB, would yield this timing accuracy over distances of several hundredkilometers. At sites where continuous reception of a broadcast time signal is possible,local atomic clocks may not be required.
7.1.7 Data acquisition cOlllputer
A dedicated computer is required for each interferometer, equipped with sufficiently fastdata access, with enough data handling speed to properly' pack and edit the data, withenough internal storage (hard disk) to bridge tape exchange on one of the drives. Anew generation PC, with a fast processor board, is bound to fulfill these requirements.
For reasons of data security, this data acquisition computer, running a relatively simple,well tested program, should be completely separate from a further computer on whichvarious schemes of on-line data analysis or reduction will be tested. Programming ofsuch an "intelligent" data processor will involve many trials and alterations, all of whichwould endanger the continuity of data storage. Moreover, it may be a more complexsystem than the acquisition computer, and one must not allow any failures in it to affectacquisition and storage.
7.2 Data Analysis
The large volume of data that an interferometric detector will acquire poses considerabledifficulties for analysis. Since ideally the experiment will take data 24 hours a day, 365days a year, and since interesting events (such as supernova explosions) must be reportedto the astronomical community as quickly as possible, the data analysis system mustbe able to search the data in real time for at least the likely burst sources, particularlygravitational collapses and coalescing binaries. Moreover, it must be able to handle,with less immediacy, such tasks as pulsar searches and cross-correlation experiments.
DATA ACQUISITION AND ANALYSIS 69
These requirements seem best satisfied by having two separate computer installationsfor different phases of the analysis:
• two on-line systems (one per interferometer), each capable of searching for coalescing binaries and supernovae in real time in an interferometer output, and
• an off-line system capable of performing cross-correlations, pulsar searches, refinement of the analysis of events picked up by the on-line detector, the analysis ofdata from other detectors, and so on.
In addition, the international laser interferometric detector community may decide topool resources to get a very fast computer to do all-sky, wide-bandwidth pulsar searches,which are beyond the capability of the off-line computer system we propose here. If thisoccurs, we will be expected to contribute, and we would bid to have this located in theGerman-British collaboration.
We shall consider the operational requirements for both the on-line and off-line systemsin turn. We are guided by the extensive discussion of these points in a forthcomingbook [23].
7.2.1 The on-line cOInputer systeIn
The most demanding job for the on-line system is to perform matched filtering forcoalescing binary waveforms. Other tasks, such as calibrating the data, pre-whiteningthe noise (if necessary), checking vetoes and other housekeeping data, and searching thetime-series data for gravitational collapse-type events, while not negligible, are muchless demanding.
The set of filters for simple Newtonian point-mass coalescing binaries has a number ofparameters: the mass parameter M, the amplitude of the signal, its time of arrival(defined as the time when it reaches a certain fiducial frequency, say 100 Hz, in thedetector), and the phase <p of the wave when it arrives. By correlating the data continuously with a template of the expected waveform from a particular binary system,one finds the signal's time-of arrival and amplitude from the time the correlation is amaximum and the value of that maximum. Thus, the stored templates form only atwo-parameter set, depending on M and <p.
Despite the fact that there is some evidence that all known neutron stars have a mass ofabout 1.4 M 0 , we cannot afford to make that assumption here; moreover, there should besome systems containing black holes of unknown ·mass. We must therefore be preparedto search for coalescing binary signals with mass parameters in a range something like0.1-20 M 0 . Studies of the overlap between filters with slightly different mass parameterslead to the conclusion that we should provide for the ability to apply about 1000 filtersto each stretch of data.
Given data sampled at 20 kHz, with two Bytes per datum, and given a typical filterduration of 2 seconds, then one can show that performing these correlations by fastFourier transforms (FFTs) will require a processing speed of 60 Mflops and RAM storagefor the filters of 16 MB. Each detector should have such a capability, for although the
70 CHAPTER 7
low-frequency detector should see more coalescing binaries, the high-frequency detectorwill need to search for them too, especially black hole coalescences, whose ultimategravitational wave frequency may reach 10 kHz if the black holes are of solar mass.
Computer technology develops so quickly that it would be unwise to try to specify theshape of such a system today, when it will not begin to be used for another five yearsor so. Repeated correlations on the same data set can be performed in a highly parallelfashion, so it is reasonable to expect that there will be a host computer running aparallel array of a number of computing elements. Such systems are easy to expand forany future developments.
Software for this analysis problem will not be trivial. While filtering is well understood,the on-line system has other elements that require more sophistication. In particular, itmust have the ability to clean up or reject data under a variety of (possibly unforeseen)experimental conditions. It must also be able to make lists of possible events (thresholdcrossings) and to send such lists to the off-line computer system, which will forwardthem to other detector sites and search for coincidences. Such systems are under development at Cardiff, with the assistance of a group at the Inter-University Centre forAstronomy and Astrophysics (IUCAA) at Pune University, India. This work is alsobeing coordinated with that in other detector groups through the international dataanalysis working party, chaired by Schutz.
The specification for each on-line system is thus:
• Computing speed: 60 Mflops,
• Memory: 16 MB,
• Communications: appropriate software and connections to electronic mail networks for the automatic transmission, perhaps hourly, of lists of candidate eventsto the off-line computer.
7.2.2 The off-line computer system
As we remarked in Chapter 2, certain kinds of off-line data analysis can absorb as muchcomputing power as one can throw at them: a broadband all-sky search for unknownpulsars, using data taken by a single detector for 4 months, is beyond the capabilityof any foreseeable computer. The final size and speed of the off-line computer will begoverned by computing technology at the time it is acquired.
The data that are taken at the detector will be stored on the archive medium (highdensity digital tapes, optical discs, or optical paper) at the detector site, and thentransported to the off-line site, where it will be processed and then stored along withdata sets from other detectors around the world.
There are many tasks that the central off-line computer will have to perform:
• It must refine the estimates of filter parameters produced for candidate events bythe first pass through the on-line system.
DATA ACQUISITION AND ANALYSIS 71
• It must accept event lists from the on-line system, forward them to computersat other detector sites around the world, and receive their lists in return. Itmust search these lists for coincidences within allowable time-delay windows, andthen solve the "inverse problem" for real coincidences, i. e. infer the amplitude,polarisation, and direction of travel of the gravitational wave. It must then beable to notify cooperating astronomers, possibly by automatic electronic mail, ofany events that might be observable, either from the ground or from satellites.There might be only an hour or so before a nearby coalescing binary might producean optical display, and only a few hours for a supernova.
• It must be able to do cross-correlations between two detector outputs to search fora stochastic background. Narrow-band data will probably be used for maximumsensitivity.
• It must be able to process narrow-band data in an all-sky search for unknownpulsars in that frequency bandwidth, using FFTs to analyse the data from asingle detector (i. f., not cross-correlating with other detectors).
• It must be able to correlate wideband. data from two detectors in order to searchfor any unpredicted signals that consist of wavetrains lasting 10 or more cycles,too weak to be seen in the time-series data of either detector.
• It must be able to search archived data in the light of subsequent information,such as looking for gravitational wave counterparts of events detected optically,or filtering old data for new predicted classes of sources for which theorists havedeveloped waveform templates. These data must be accessible not only to projectscientists and collaborators, but also - after a time to be agreed among the international laser interferometer community - to other scientists who wish to useit.
From this list, which is not necessarily exhaustive, the most demanding task is the processing of narrow-band data for an all-sky pulsar search. There is no simple criterion forthe sensitivity one would like to achieve, but a computing speed of 300 Mflops is likelyto be achieveable at reasonable cost in· a few years, and as described in Chapter 2 itwould permit a narrow-band observation lasting about 2 weeks, with quite interestingsensitivity. In order to perform the required FFTs, it would only need a memory of2Brint Bytes, or about 5 MB for this operation. The original data set is of course muchlarger, but it is reduced to this by heterodyning the original frequency of observationdown to zero, and then resampling at about 4 Hz, the Nyquist frequency for the 2 Hzband-limited data set produced by heterodyning. (See [23] for details.) For the datataken during a 100 hour test run (see Appendix A) a slightly different technique, reducing the amount of computing required, is being developed at the MPQ in Garching[50].
As with the on-line computer, this sort of computing speed would probably be achievedin a parallel array, but the software to achieve these sorts of speeds by coordinatingall the computing elements to work on a single FFT will have to be carefully designed.Algorithms to do this are already available - one has been supplied with the N-Cubecomputer mention~d below - and we will test it and others. Another advantage of
72 CHAPTER 7
having a parallel array is that when some of the other tasks are being performed itcould in principle be subdivided to allow several of them to go on at once, for instancemaking two different searches on archived data.
The tasks required of the off-line computer demand a general-purpose computer witha sophisticated operating system, a multi-user machine that can communicate withmany other computers simultaneously, and that can supervise the work of its attachedparallel array to allow simultaneous use of different sections of it for smaller jobs whenit is not doing an all-sky search. Such facilities are already available to some degree,and we are experimenting at present at Cardiff with a Sun 3/260 computer whichhosts a 128-element N-Cube computer. The N-Cube can be subdivided among severalusers; when acting together the processors can reach a total rate of 40 Mflops on certainbenchmark problems. It is also probably the ideal parallel architecture for performingFFTs, since its architecture minimises average communication times among processors.The fastest N-Cube available today can probably run FFTs at well above 1 Gflop, butat a considerable price. Given faster processors in a few years, a goal of 300 Mflops ata price of £200k does not seem unreasonable.
The choice of operating system and to some extent of the hardware will be made incoordination with the other international detectors, since the software for many aspectsof the analysis should be as transportable as possible. Some of these choices will bemade soon, and acquisition of equipment for the development of prototype analysissystems will need to be done soon after the project is approved. This can probably takethe form of purchasing one of the workstations earlier than the rest of the equipment.
Associated with the off-line computer would be a number of peripherals, such as dataarchive equipment and suitable readers, a good-quality printer, a small number of workstations connected to the main computer by a fast network (which can access the parallelarray and can also work independently to develop further software), and communicationconnections to international academic networks.
We can summarise the specification for the off-line system as follows:
• Computer: multiuser machine with a sophisticated operating system.
• Attached parallel processor: capable of 300 Mflops on a coordinated FFT acrossall elements. It must be able to be subdivided for independent work on differenttasks, this reconfiguring being performed by software.
• Peripherals: workstations, archive data storage and reading equipment, communications to the academic networks, laser printer.

Chapter 8
Site, Buildings, and Services
8.1 Site
8.1.1 Choice of site
Both the UK and the German teams have been working on identifying suitable sites forthe construction of an antenna.
In the UK, a search was carried out for suitable sites and one, at Tentsmuir Forest nearSt. Andrews, Scotland, has been selected. This site is large enough to allow the armsto be 2.6 km long.
Outline planning permission has been obtained to build such a detector. Full permissionfor an earlier proposal having arms only 1 km long is also held. Because all of theimportant issues have already been addressed, it is estimated that full permission forthe larger detector will take about one year to obtain and this process has started. Aseismic survey has been done at the site by the British Geological Survey, which showsthat the displacement noise levels are typically given by
which will be handled well by the proposed isolation system. Initial discussions withthe Forestry Commission, which owns the land, have shown them to be supportive ofthe project, and an arrangement has been agreed whereby the land could be leased toGlasgow University at very low cost.
In Germany a survey has been done of potential sites in Bavaria. After aerial surveys,site surveys, seismic surveys and outline costings, four sites were found to be well suitedto the present purpose. A similar search for the whole of the Federal Republic is nearlycompleted, and there are also suitable sites for the experiment in North Germany.Negotiations with landowners are soon to begin and initial planning enquiries have beenmade. The Ministerium fiir Wissenschaft und Kunst of Bavaria is actively investigatingthe site question.
73
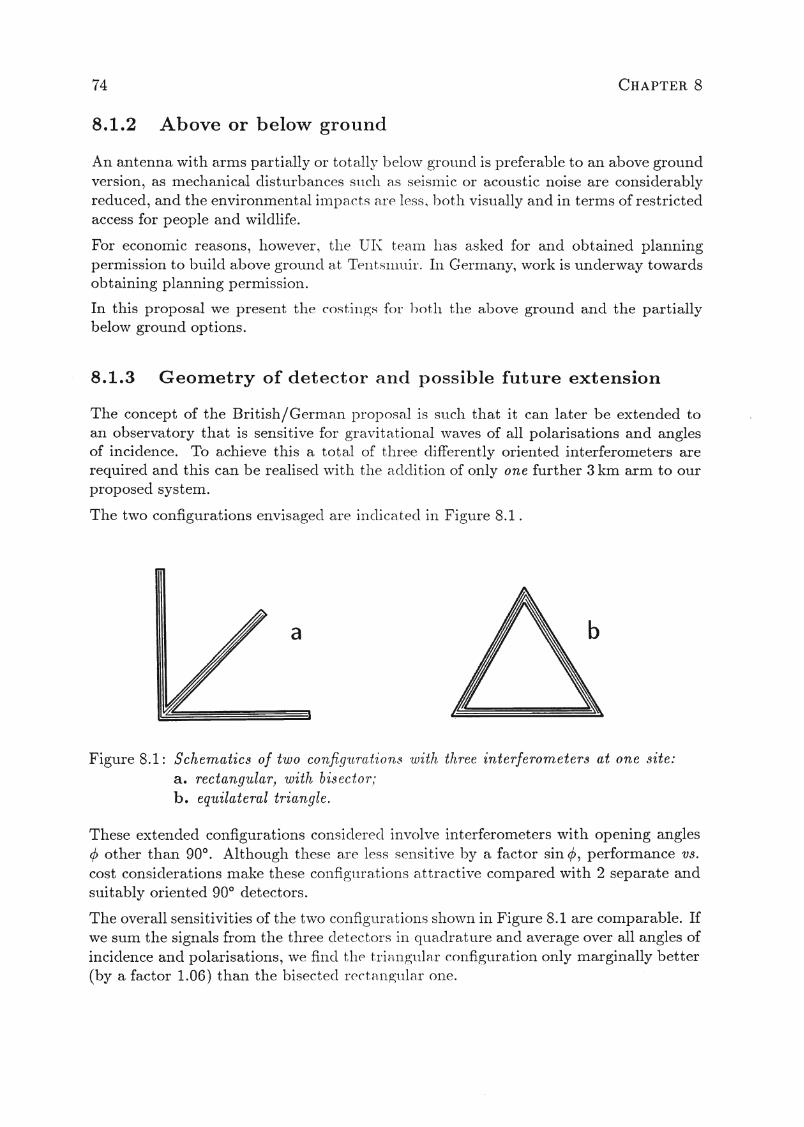
74 CHAPTER 8
8.1.2 Above or below ground
An antenna witll arnlS partially or totall}T l)elo\v grOtlllcl is preferable to an above groundversion, as mechanical distllrballces SllCll as seiSlllic or acoustic noise are considerablyreduced, and the environlnental illl1)acts a.re less'l l)otIl vistlally and in terms of restrictedaccess for people and wildlife.
For economic reasons, 110vvever., tIle UI\: teall1 llas asl(ed for and obtained planningpermission to bllild above grOtlllcl at Tellts11ltlir. III Germany, work is llnderway towardsobtaining planning permission.
In this proposal we present tIle COSti11gs for l)otll tIle a.hove ground and the partiallybeIovv ground options.
8.1.3 Geometry of detector and possible future extension
TIle concept of tIle British/Gernla.ll IJrOlJosal is stle.}l tllat it can later be extended toan observatory tllat is sensitive for gra\rita,tio1lal \vaves of all polarisations and anglesof incidence. To achieve this a total of tIlree clifferently oriented interferometers arerequired and this can be realisecl vvitll tIle a.clclition of only one further 3 km arm to ourproposed system.
The two configurations envisa.gecl a.re illclicatecl ill Figtlre 8.1 .
a
Figtlre 8.1: Schematics of t'wo conjig'l.l,ration,s 'with three interferometers at one site:a. rectangular, with bisector.;b. equilateral triangle.
These extended configurations consiclerecl in'vc>lve illterferometers witll opening angles<P other tllan 90°. Althougll tllese are less sellsitive l)y a factor sin <p, performance vs.cost considerations mal(e tllese cOllfigtlratiolls attractive compared with 2 separate andsuitably oriented 90° detectors.
The overall sensitivities of tIle tvvo cOllfigtlratiolls sho\vn in Figure 8.1 are comparable. Ifvve SlIm the signals frolTI the tllree eletectors ill qtlaelrattlre and average over all angles ofincidence and polarisations, vve fillel tllf' triallgtllar cOllfigtlration only marginally better(by a factor 1.06) than tIle bisectecl rectallg111ar one.
SITE, BUILDINGS, AND SERVICES 75
The triangular configuration has the advantage of having a more even response to polarisation and direction of propagation of the incoming radiation.
However, if our aim is to achieve the highest probability of successful detection at asearly a stage as possible we believe it is best to aim for the geometrical arrangementthat gives the highest sensitivity for the first detector built - i. e. to have the initiallyconstructed arms at 90° to each other.
8.2 Buildings and Tube Housings
The Council Works Unit of SERC made a study of the civil engineering requirements ofa Gravitational Wave Detector at the time of an earlier proposal to build a 1 km device.Outline plans were made of the buildings and the vacuum tube housings, and cost estimates were prepared. The CWU have since updated this work to allow for inflation, forthe additional arm length, and for changes in the specifications of the buildings. Theseestimates are only accurate to within ±25% because of the unquantifiable nature ofseveral factors pertaining to such work. The CWU have also prepared similar estimatesof the cost of building partially below ground tunnels in the UK.
The proposed arrangement will require three buildings and approximately 6 km of housing (the Tentsmuir site requires only 5.2 km of housing because of limitations on thesize of the site).
8.2.1 Buildings
Three main buildings are needed: the central building and the two end-stations. Thebuildings will be as simple as possible whilst still satisfying their functional requirements,minimising both construction and maintenance costs.
There will be a central building which houses the vacuum tanks for the central masses,the beamsplitters, and the input and output optics. There will also be space for acomputer room, offices, a workshop, a mess, and toilets. The total area of the centralbuilding will be about 900m2 •
The end stations each house two vacuum tanks for the end masses, and incorporate asmall office and toilet. The floor area of each end station will be about 350m2
•
8.2.2 Tube housings
Two options have been considered for the housings. For reasons explained above it is notpossible at this stage to choose between the above ground housing shown in Figure 8.2and the partially below ground housing shown in Figure 8.3. In any case the exactdetails of the housing will depend on the choice of site.
In the above-ground case, the enclosure would take the form of a 'tunnel' approximately2 m wide by 2 m high with a steel skeleton, clad in profiled metal sheeting, built on a
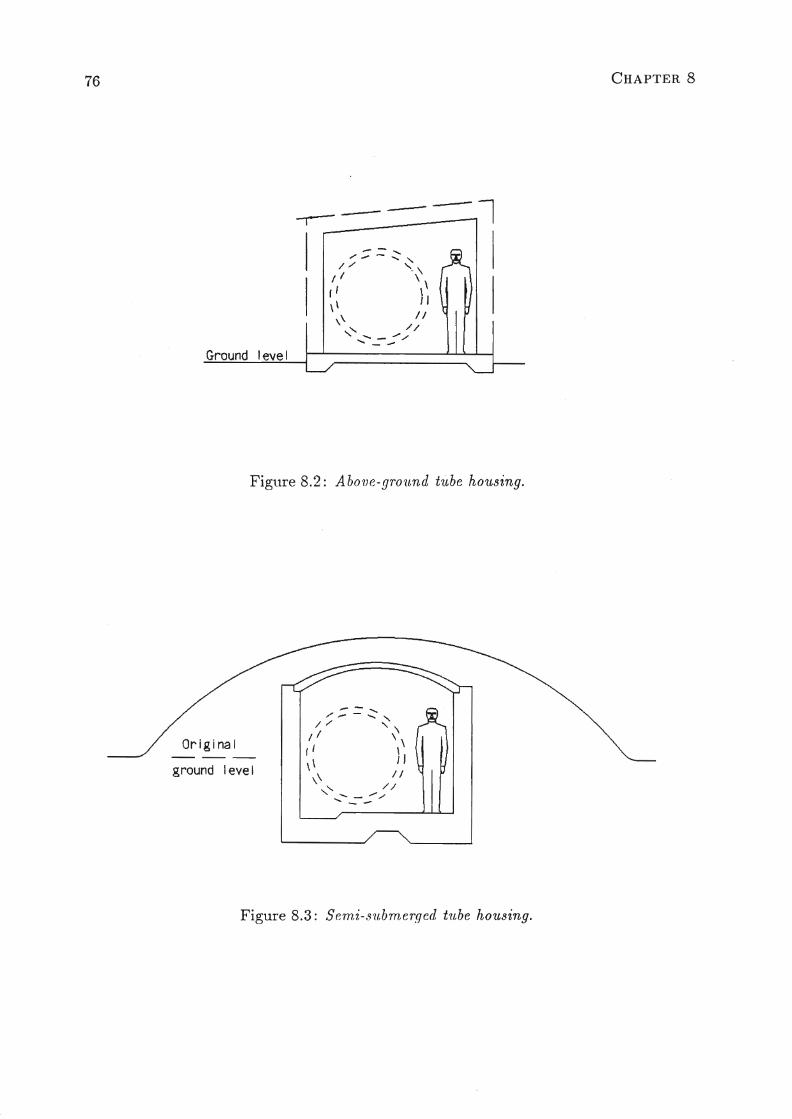
76
Ground level
CHAPTER 8
Figtlre 8.2: Above-gro'nnd tube housing.
Origi na I
ground level
Figure 8.3: Sem,i-S'll,bmerged t'llbe housing.

SITE, BUILDINGS, AND SERVICES 77
continuous raft foundation. This would protect the vacuum tube from the weather andfrom vandalism.
If the arms were required to be partially below ground then a concrete structure wouldbe built in a trench and the spoil heaped back over the top to form a mound. Thiswould require drainage as well as ventilation, lighting, escape routes, and so on. Theexact form would depend on the site conditions; that shown in the figure is derived fromone of several options considered by Dorsch Consult in a feasibility study carried outfor MPQ.
8.3 Services
8.3.1 Mechanical and electrical
All buildings will be provided with small power and lighting. All buildings except thegarage and tube housing will be provided with heating; the computer room will beair conditioned; the buildings will have minimal external lighting; there will be fireextinguishers in all buildings and hydrants in the main building. A main electricalsupply will be provided via a substation giving a total capacity of 2 MVA.
8.3.2 Water
The site will be provided with a mains water supply which will be distributed to allbuildings. In addition there will be a closed system water cooling unit supplied tothe main building with a cooling capacity of up to 100 kW. Waste water from all thebuildings will go to septic tanks local to each building.
8.3.3 Other services
The intention would be to provide only basic unpaved tracks for the full length of eacharm. At Tentsmuir this would involve grading and compacting the existing sand/gravelsurface for new tracks; there is already a considerable length of track which could beused as it is. At other sites it may be necessary to import granular material to form asuitable track. No kerbs or drainage will be supplied.
Roof drainage will be to soakaways local to each building. It is not envisaged that a gassupply will be available. In the above-ground case footbridges will be provided over thetube housing every 1 km, and a single vehicle bridge will also be provided.

78

Chapter 9
Project Organisation and Costing
9.1 Management
It would be premature at this stage to attempt to put forward more than an outline ofhow the project might be managed, because the details will have to be agreed between allthe participating institutions and the funding agencies. In addition, the legal structuresand the mechanisms for financial control must take account of national practices andrequirements appropriate to the actual site, which has yet to be selected.
Because the overall timescale and the total cost of the project could depend criticallyon the choice of site and construction method (i. e. above or partially below ground),it is suggested that an outline agreement, perhaps in the form of a Memorandum ofUnderstanding between the interested parties, and in particular between the BMFTand SERC, is established as soon as possible. This will enable the limited infrastructureneeded to support the initial phase of the project to be established and appropriatelyresourced, and in particular will provide an agreed mechanism whereby crucial earlydecisions can be taken with minimum delay.
It is suggested that a Project Leader, a Project Engineer and a Project Administratorare appointed as part of this initial agreement. Each might be expected to be an existingemployee of one or other of the collaborating institutes, but could, if necessary, be anew appointment. These three would constitute the core of the project team, and wouldbe responsible for the day to day management of the project, with the Project Leadercarrying ultimate responsibility.
A Steering Committee, comprising independent nominees from the institutes and agencies plus the Project Leader, should also be set up without delay. Its meetings would normally be attended by representatives of all the research groups involved in the project.One of its first tasks would be to consider the input from the project team on the choiceof site and the optimisation of the overall design, within such financial constraints asmay be applied. The Steering Committee would be able to seek advice, if it wished,from independent experts, so that it would be able to recommend a particular designand site choice to the collaborating institutes and agencies and would be able to assistthem in arriving at a final decision.
79
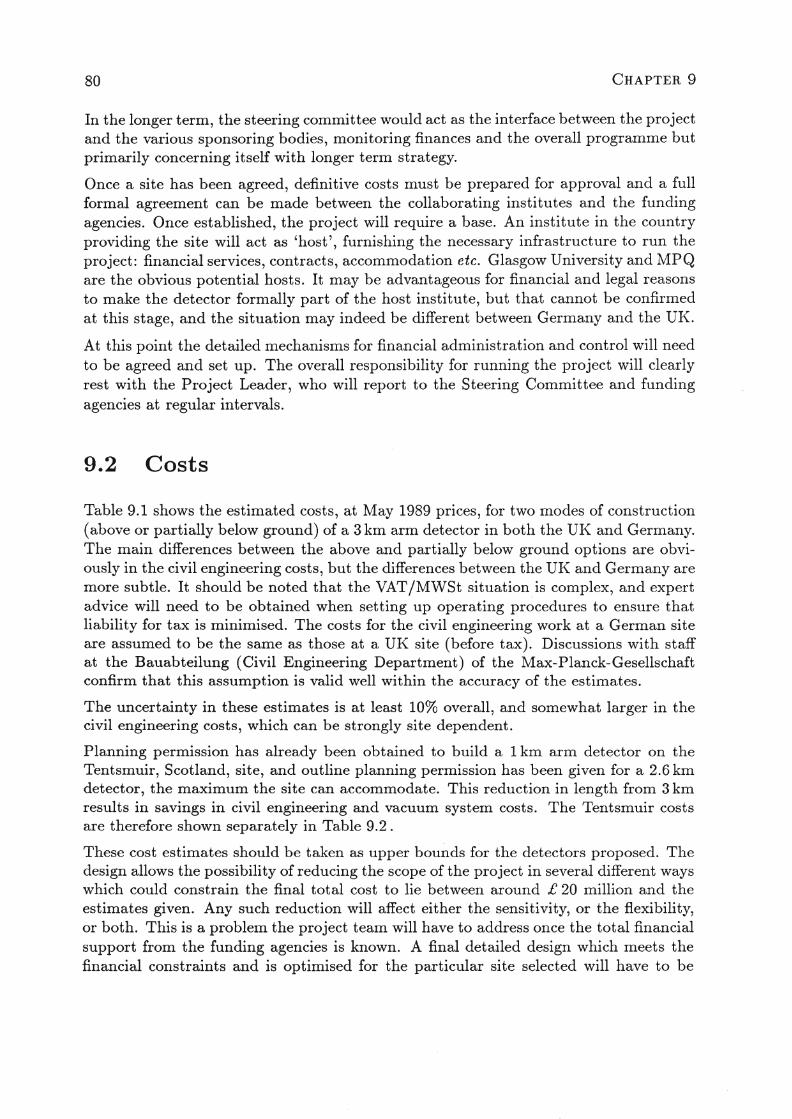
80 CHAPTER 9
In the longer term, the steering committee would act as the interface between the projectand the various sponsoring bodies, monitoring finances and the overall programme butprimarily concerning itself with longer term strategy.
Once a site has been agreed, definitive costs must be prepared for approval and a fullformal agreement can be made between the collaborating institutes and the fundingagencies. Once established, the project will require a base. An institute in the countryproviding the site will act as 'host', furnishing the necessary infrastructure to run theproject: financial services, contracts, accommodation etc. Glasgow University and MPQare the obvious potential hosts. It may be advantageous for financial and legal reasonsto make the detector formally part of the host institute, but that cannot be confirmedat this stage, and the situation may indeed be different between Germany and the UK.
At this point the detailed mechanisms for financial administration and control will needto be agreed and set up. The overall responsibility for running the project will clearlyrest with the Project Leader, who will report to the Steering Committee and fundingagencies at regular intervals.
9.2 Costs
Table 9.1 shows the estimated costs, at May 1989 prices, for two modes of construction(above or partially below ground) of a 3 km arm detector in both the UK and Germany.The main differences between the above and partially below ground options are obviously in the civil engineering costs, but the differences between the UK and Germany aremore subtle. It should be noted that the VAT/MWSt situation is complex, and expertadvice will need to be obtained when setting up operating pr~cedures to ensure thatliability for tax is minimised. The costs for the civil engineering work at a German siteare assumed to be the same as those at a UK site (before tax). Discussions with staffat the Bauabteilung (Civil Engineering Department) of the Max-Planck-Gesellschaftconfirm that this assumption is valid well within the accuracy of the estimates.
The uncertainty in these estimates is at least 10% overall, and somewhat larger in thecivil engineering costs, which can be strongly site dependent.
Planning permission has already been obtained to build a 1 km arm detector on theTentsmuir, Scotland, site, and outline planning permission has been given for a 2.6 kmdetector, the maximum the site can accommodate. This reduction in length from 3 kmresults in savings in civil engineering and vacuum system costs. The Tentsmuir costsare therefore shown separately in Table 9.2.
These cost estimates should be taken as upper bounds for the detectors proposed. Thedesign allows the possibility of reducing the scope of the project in several different wayswhich could constrain the final total cost to lie between around £ 20 million and theestimates given. Any such reduction will affect either the sensitivity, or the flexibility,or both. This is a problem the project team will have to address once the total financialsupport from the funding agencies is known. A final detailed design which meets thefinancial constraints and is optimised for the particular site selected will have to be

PROJECT ORGANISATION AND COSTING
Project built above ground
MAY 1989 PRICES UK Site German Site
£M MDM £M MDM1. Civil Engineering work 7.11 21.52 7.11 21.52
2. CWU fees 0.98 2.95 0.05 0.15
3. Other fees 0.98 2.954. Vacuum system 7.13 21.57 7.13 21.575. Experimental stations 5.59 16.92 5.59 16.926. Control system 1.14 3.46 1.14 3.467. Data acquisition 0.64 1.92 0.64 1.928. Optics and lasers 3.75 11.36 3.75 11.369. Travel and subsistence 0.34 1.03 0.44 1.3310. Tax 1.66 5.01 0.05 0.14
Total excluding RAL effort 28.34 85.74 26.88 81.32
11. RAL manpower costs 1.24 3.75 1.24 3.75Total cost 29.58 89.49 28.12 85.07
81
Project built partially below ground
MAY 1989 PRICES UK Site German Site
£M MDM £M MDM1. Civil Engineer~ng work 11.92 36.06 11.92 36.062. CWU fees 0.98 2.95 0.05 0.153. Other fees 0.98 2.954. Vacuum system 7.13 21.57 7.13 21.575. Experimental stations 5.59 16.92 5.59 16.926. Control system 1.14 3.46 1.14 3.467. Data acquisition 0.64 1.92 0.64 1.928. Optics and lasers 3.75 11.36 3.75 11.369. Travel and subsistence 0.34 1.03 0.44 1.3310. Tax 2.38 7.19 0.05 0.14
Total excluding RALeffort 33.87 102.46 31.69 95.68
11. RAL manpower costs 1.24 3.75 1.24 3.75Total cost 35.11 106.21 32.93 99.61
Table 9.1: Estimated costs for a typical UK site and a German site, May 1989 prices
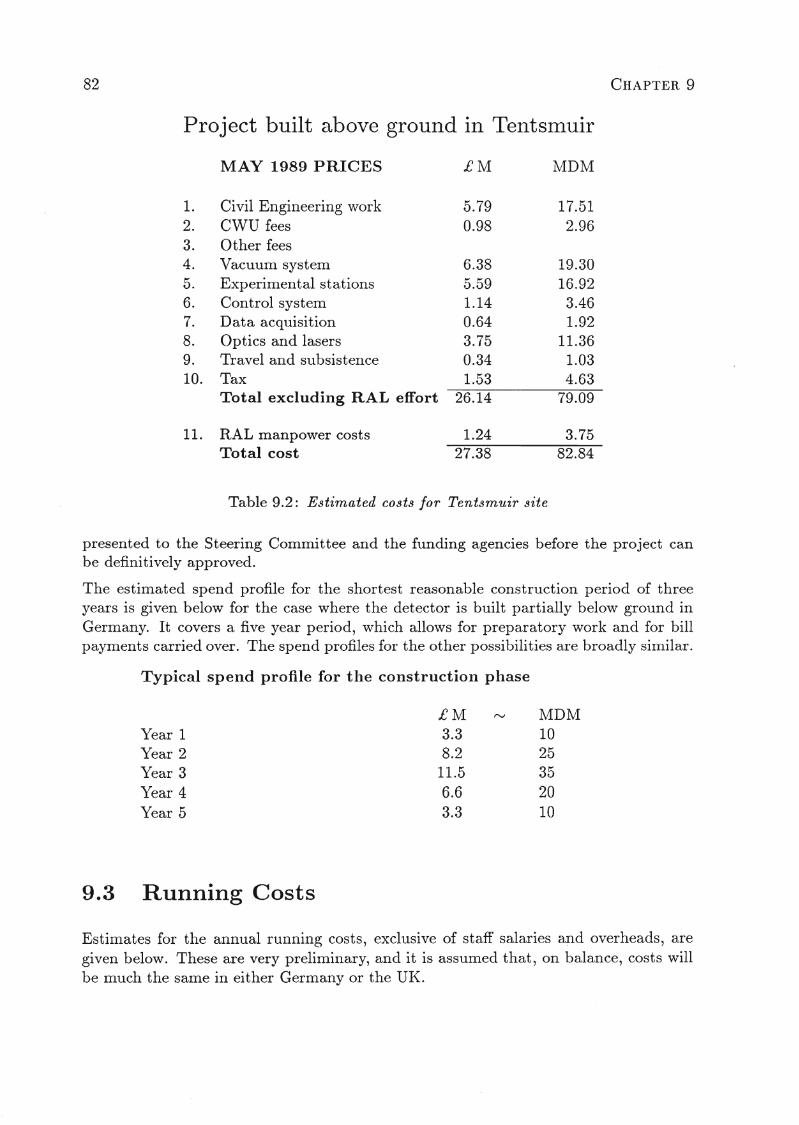
82
Project built above ground in Tentsmuir
MAY 1989 PRICES £M MDM
1. Civil Engineering work 5.79 17.512. CWU fees 0.98 2.963. Other fees4. Vacuum system 6.38 19.305. Experimental stations 5.59 16.926. Control system 1.14 3.467. Data acquisition 0.64 1.928. Optics and lasers 3.75 11.369. Travel and subsistence 0.34 1.0310. Tax 1.53 4.63
Total excluding RAL effort 26.14 79.09
11. RAL manpower costs 1.24 3.75Total cost 27.38 82.84
Table 9.2: Estimated costs for Tentsmuir site
CHAPTER 9
presented to the Steering Committee and the funding agencies before the project canbe definitively approved.
The estimated spend profile for the shortest reasonable construction period of threeyears is given below for the case where the detector is built partially below ground inGermany. It covers a five year period, which allows for preparatory work and for billpayments carried over. The spend profiles for the other possibilities are broadly similar.
Typical spend profile for tIle construction phase
£M r"..I MDMYear 1 3.3 10Year 2 8.2 25Year 3 11.5 35Year 4 6.6 20Year 5 3.3 10
9.3 Running Costs
Estimates for the annual running costs, exclusive of staff salaries a~d overheads, aregiven below. These are very preliminary, and it is assumed that, on balance, costs willbe much the same in either Germany or the UK.
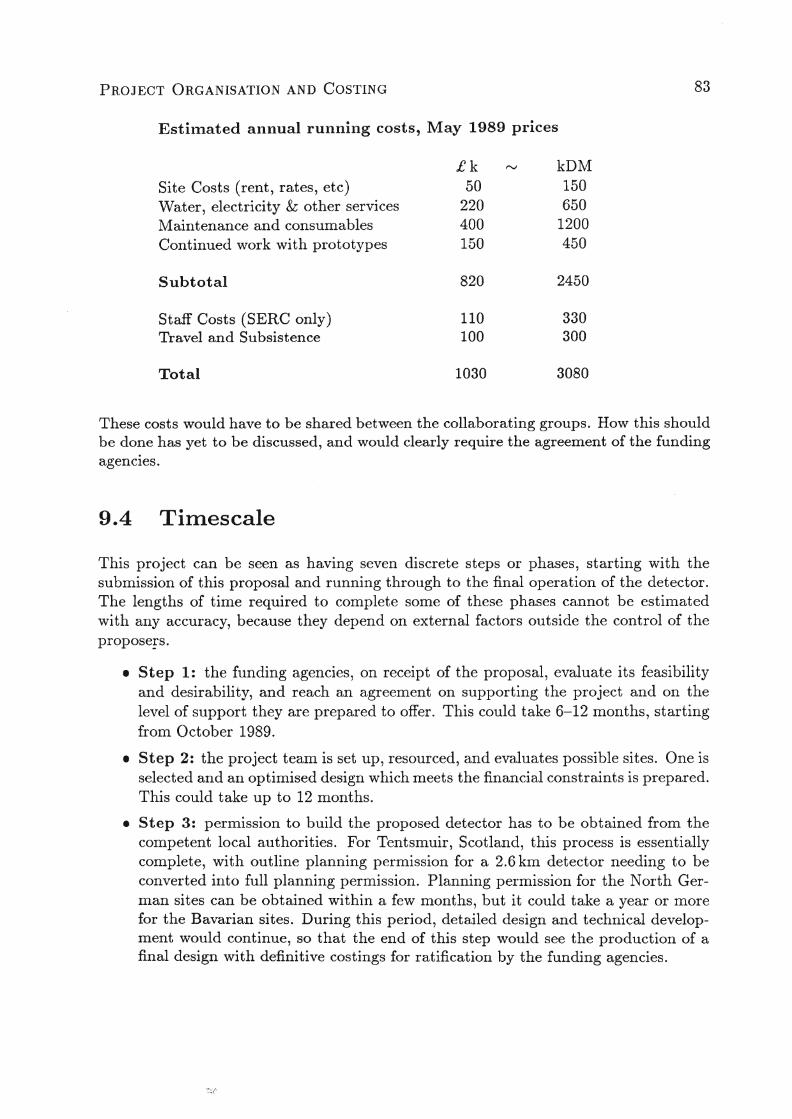
PROJECT ORGANISATION AND COSTING
Estimated annual running costs, May 1989 prices
£k "-I kDMSite Costs (rent, rates, etc) 50 150Water, electricity & other services 220 650Maintenance and consumables 400 1200Continued work with prototypes 150 450
Subtotal 820 2450
Staff Costs (SERC only) 110 330Travel and Subsistence 100 300
Total 1030 3080
83
These costs would have to be shared between the collaborating groups. How this shouldbe done has yet to be discussed, and would clearly require the agreement of the fundingagencies.
9.4 Timescale
This project can be seen as having seven discrete steps or phases, starting with thesubmission of this proposal and running through to the final operation of the detector.The lengths of time required to complete some of these phases cannot be estimatedwith any accuracy, because they depend on external factors outside the control of theproposers.
• Step 1: the funding agencies, on receipt of the proposal, evaluate its feasibilityand desirability, and reach an agreement on supporting the project and on thelevel of support they are prepared to offer. This could take 6-12 months, startingfrom October 1989.
• Step 2: the project team is set up, resourced, and evaluates possible sites. One isselected and an optimised design which meets the financial constraints is prepared.This could take up to 12 months.
• Step 3: permission to build the proposed detector has to be obtained from thecompetent local authorities. For Tentsmuir, Scotland, this process is essentiallycomplete, with outline planning permission for a 2.6 km detector needing to beconverted into full planning permission. Planning permission for the North German sites can be obtained within a few months, but it could take a year or morefor the Bavarian sites. During this period, detailed design and technical development would continue, so that the end of this step would see the production of afinal design with definitive costings for ratification by the funding agencies.
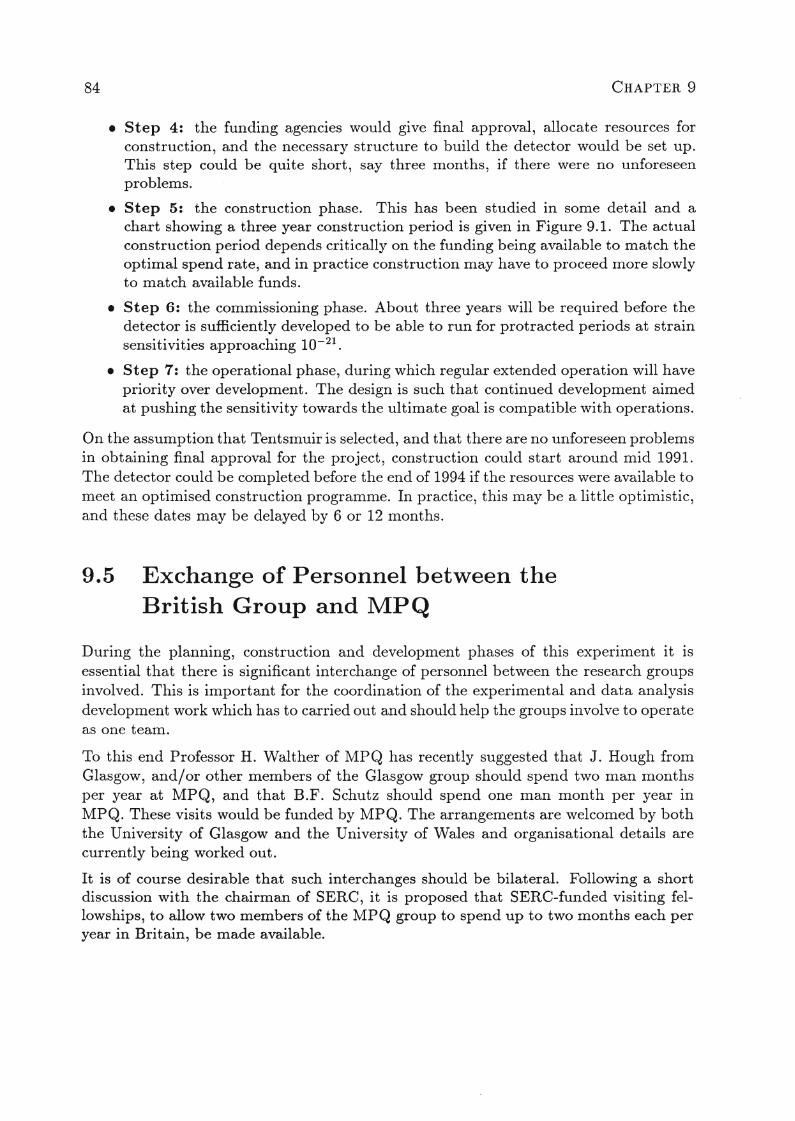
84 CHAPTER 9
• Step 4: the funding agencies would give final approval, allocate resources forconstruction, and the necessary structure to build the detector would be set up.This step could be quite short, say three months, if there were no unforeseenproblems.
• Step 5: the construction phase. This has been studied in some detail and achart showing a three year construction period is given in Figure 9.1. The actualconstruction period depends critically on the funding being available to match theoptimal spend rate, and in practice construction may have to proceed more slowlyto match available funds .
• Step 6: the commissioning phase. About three years will be required before thedetector is sufficiently developed to be able to run for protracted periods at strainsensitivities approaching 10-21 •
• Step 7: the operational phase, during which regular extended operation will havepriority over development. The design is such that continued development aimedat pushing the sensitivity towards the ultimate goal is compatible with operations.
On the assumption that Tentsmuir is selected, and that there are no unforeseen problemsin obtaining final approval for the project, construction could start around mid 1991.The detector could be completed before the end of 1994 if the resources were available tomeet an optimised construction programme. In practice, this may be a little optimistic,and these dates may be delayed by 6 or 12 months.
9.5 Exchange of Personnel between theBritish Group and MPQ
During the planning, construction and development phases of this experiment it isessential that there is significant interchange of personnel between the research groupsinvolved. This is important for the coordination of the experimental and data analysisdevelopment work which has to carried out and should help the groups involve to operateas one team.
To this end Professor H. Walther of MPQ has recently suggested that J. Hough fromGlasgow, and/or other members of the Glasgow group should spend two man monthsper year at MPQ, and that B.F. Schutz should spend one man month per year inMPQ. These visits would be funded by MPQ. The arrangements are welcomed by boththe University of Glasgow and the University of Wales and organisational details arecurrently being worked out.
It is of course desirable that such interchanges should be bilateral. Following a shortdiscussion with the chairman of SERC, it is proposed that SERC-funded visiting fellowships, to allow two members of the MPQ group to spend up to two months each peryear in Britain, be made available.
Design
Civi I TenderBui Id
Desi~n
Vacuum Tender& tube Procure Manufacture Install
StudY TenderMechanical Desi~n [nstall
t-1anufacture
Stud_YControl Design lnsta IIsystem Manufacture
Stud.y ProcureOptics Soec Install
Tender
Stud_v ProcureLasers Soec
Tender Install
Desig.n!LayoutElectrica I Procure
Install
General ManagementManagement
Year I Year 2 Year 3
~~o~
Mo..-3
o~Cl>Z~
00
~~
oz>Zt:l
Clo00..-3~
ZCl
Figure 9.1: Schedule for the construction phase. 00C;l

86
Appendix A
The Prototype Detectors atGarching and Glasgow
A.I Introduction
Delay line detectors have been under development at the Max-Planck-Institut, Munichand later Garching, since 1974, initially on a 3m baseline [51], and later on a baselineof 30m [52].
The Fabry-Perot based prototype detector of 10 m arm length at the University ofGlasgow has been under development for the last ten years [53] and followed earlierwork that began around 1976 on a small scale delay line interferometer.
While most work on these instruments has been devoted to improving their sensitivities,periods of data taking have been undertaken, the most recent being a joint effort betweenGarching and Glasgow of 100 hours continuous duration. This run was carried out justafter the reported optical observation of the pulsar in SN 1987a and demonstrated thehigh duty cycle possible with such instruments (89% and 99% for the Glasgow andGarching detectors, respectively).
A.2 The Prototype Detectors at Garching
A.2.1 The 3 III prototype
At the Max-Planck-Institut fur Astrophysik, investigations of the laser interferometricscheme were begun in 1974. A prototype, using an argon ion laser, was built, with arms3 m in length. After a brief pilot phase with a small rigid interferometer, it was thenoperated with optical delay lines (up to N = 138 beams). The set-up [51], even then,was quite similar to the current 30 m prototype that is shown in Figure A.l .
The choice of the delay line scheme, with its ease of alignment and benign behaviourwith respect to mirror motions may have played an important role in the rapid progress
87
88 ApPENDIX A
achieved. Quite early, the prototype reached a respectable level of sensitivity and a highlevel of reliability and stability. Tllese feat tIres made this prototype an ideal test bedfor the study of various noise effects, some qtlite l.lnforeseen [54].
The effects of various fluctuations in tIle laser illulnination were studied, and remedieswere proposed and implemented. III particular, the mecllanisms by which scattered lightintroduces noise were studied in great detail [55]. A two-stage frequency stabilisationwas conceived [56] and later implemented. Furthermore, schemes of additional phasemodulations for "washing out" the scattered light echoes were developed and successfullytested [57, 58].
The effects due to fluctuations in the laser beam geometry (in lateral position, pointing,beam width) were studied, and a suitable remedy, the "mode cleaner", was found andimplemented [35].
It was only through the combined application of all these measures that the sensitivitywas further improved [59], eventually to reach the fundamental limit of shot noise, forsteadily increasing levels of light power.
An important improvement also came from tIle study of the mechanical behaviour of thesuspended optical components (mirrors, beamsplitter, Pockels cells). The mechanicalresonances, typically in the kHz range (and mostly at relatively low Q values), were dueto the way the optical components were attached to the "test masses". After trying outseveral schemes of mechanically fastening, or of glueing, the mirrors to their mounts,the radical solution of hanging the bare mirrors was found to be the most successful[59], not only for the far end mirrors, but also for the various components in the centraltank [52].
A.2.2 The 30 III prototype
With the move of the Institut fur Astropllysik to Garching, planning for a prototype ofincreased length, 30 m, was begun. This 30 m prototype was commissioned in 1983. Thearms extend outside the building, the vacuum tubes are supported over a concrete bedlater covered with concrete arches, thermal insulation, and finally soil. This housingprovides reasonable protection from weatller, temperature changes, and acoustic noise.
Most features of the general concept were taken over from the 3 ill prototype, but largertubes and tanks were chosen so as to accommodate larger mirrors and possibly a highernumber of beams.
For seismic isolation a straightforward two-pendulum scheme is used. The four mirrors,the beamsplitter, the two Pockels cells, a,nd a beam steering block are all suspended separately. Active damping ("local control") is provided via shadow-sensors incorporatedinto the coil-and-magnet systems by which the position of the components is controlled[52].
The laser beam is guided into the central vacuum tank via an optical fibre, the end ofwhich is mounted to the (seismically isolated) beam steering block. The optical fibre isof the monomode type and thus also serves as a "mode cleaner".
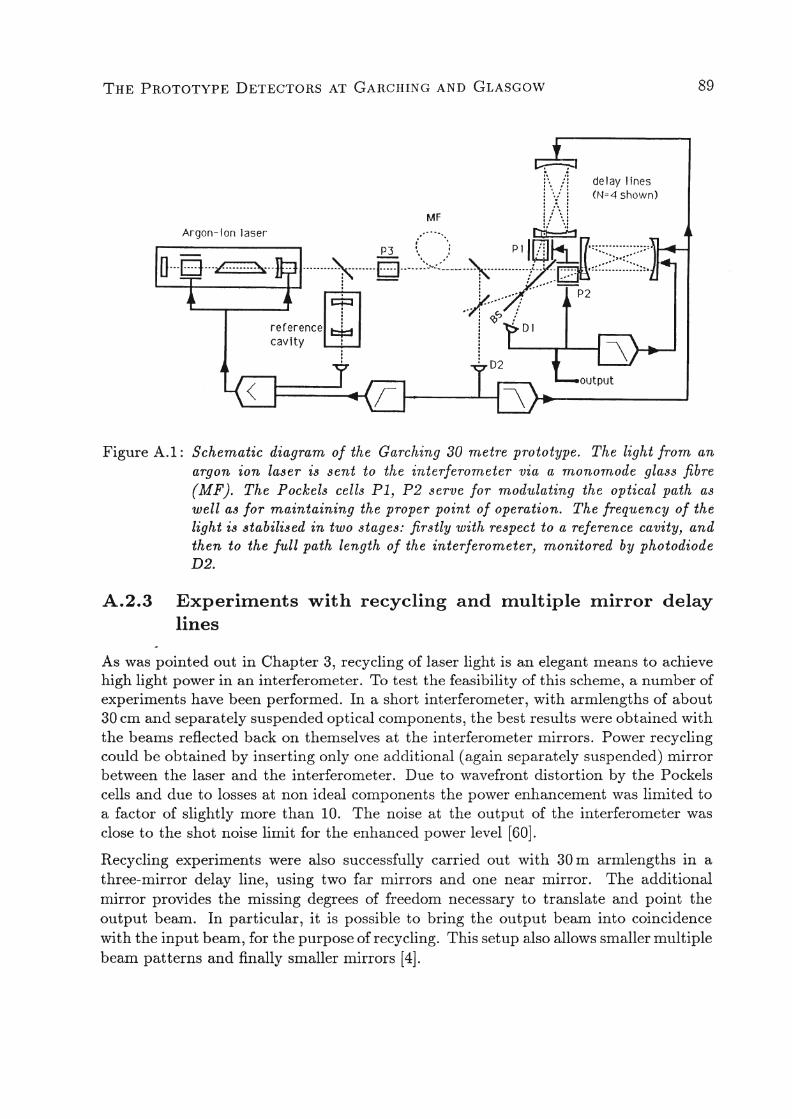
THE PROTOTYPE DETECTORS AT GARCHING AND GLASGOW 89
1'.,/1 J ~~~~~S~~\~~)MF !! \i
Argon-Ion laser P3 (........ Pll~: :
c::+::::I •.... -.. " .:: •• -: c- :. . ~.) ,
reference ~ i : D1caVity : i. .: :
Figure A.I: Schematic diagram of the Garching 30 metre prototype. The light from anargon ion laser is sent to the interferometer via a monomode glass fibre(MF). The Pockels cells Pl, P2 serve for modulating the optical pa.th aswell as for maintaining the proper point of operation. The frequency of thelight is stabilised in two stages: firstly with respect to a reference cavity, andthen to the full path length of the interferometer, monitored by photodiodeD2.
A.2.3 ExperiIllents with recycling and multiple mirror delaylines
As was pointed out in Chapter 3, recycling of laser light is an elegant means to achievehigh light power in an interferometer. To test the feasibility of this scheme, a number ofexperiments have been performed. In a short interferometer, with armlengths of about30 cm and separately suspended optical components, the best results were obtained withthe beams reflected back on themselves at the interferometer mirrors. Power recyclingcould be obtained by inserting only one additional (again separately suspended) mirrorbetween the laser and the interferometer. Due to wavefront distortion by the Pockelscells and due to losses at non ideal components the power enhancement was limited toa factor of slightly more than 10. The noise at the output of the interferometer wasclose to the shot noise limit for the enhanced power level [60].
Recycling experiments were also successfully carried out with 30 m armlengths in athree-mirror delay line, using two far mirrors and one near mirror. The additionalmirror provides the missing degrees of freedom necessary to translate and point theoutput beam. In particular, it is possible to bring the output beam into coincidencewith the input beam, for the purpose of recycling. This setup also allows smaller multiplebeam patterns and finally smaller mirrors [4].
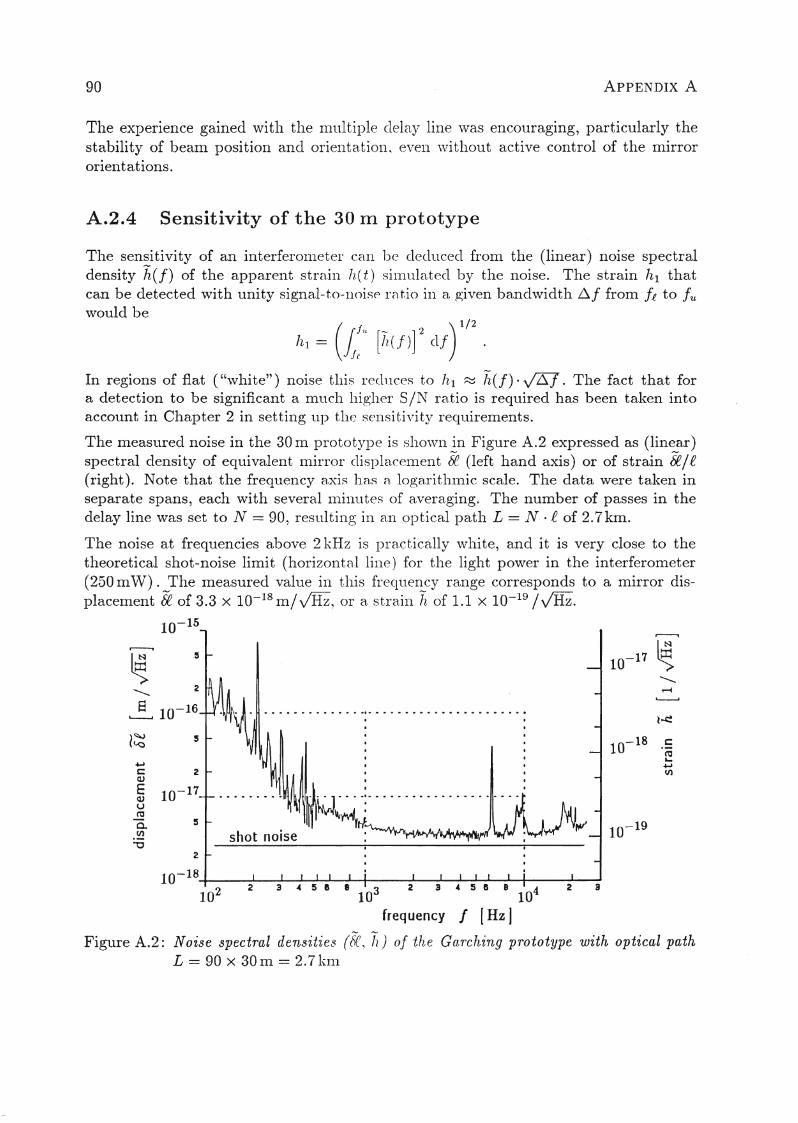
90 ApPENDIX A
TIle experience gained \vitll tIle llll11til)le clelay' lille "vas encouraging, particularly thestability of beam position ancl oriellta.tioll~ e'vell \vitIl0l1t active control of the mirrororientations.
A.2.4 Sensitivity of the 30 III prototype
TIle sensitivity of an interferol1leter ea1l l)c cleclllcecl frOITI tIle (linear) noise spectraldensity h(f) of the apparent stra.ill h(t) sirrllllatecl l)y the noise. TIle strain 1~1 thatcan be detected with unity sig11al-to-Iloise ratio ill a, given ba,nclvvidtll ~f from ff. to fuvvouId be
hI = (I:" [h( f)] 2 elf) 1/2 .
In regions of flat ("vvhite") 110ise tllis reclllces to hI ~ h(f)· VEl. TIle fact that fora detection to be significant a mtlc.ll lligl1er SIN ratio is reqtlired has been tal{en intoaccount in Cllapter 2 in setti11g t11) tIle se11sitiv'it~y reCltlirements.
The measured noise in tIle 30 m prototYl)e is S110\Vll in Figure A.2 expressed as (linear)spectral density of equivalent mirror c1isl)lace111ent be (left hand axis) or of strain Eflf,(right). Note that the freque11cy axis 118S a logaritll11lic scale. The data were tal(en inseparate spans, each with several I11iI1tltes of a:veraging. The number of passes in thedelay line was set to N = 90, restllti11g ill a.Il 0l)tical path L = N · f, of 2.7 km.
The noise at frequencies above 2l(Hz is 1)ractical1y vvhite, and it is very close to thetheoretical sl10t-noise limit (horizol1tal Ii1le) for tIle ligllt povver in the interferometer(250 mW). The measured VaItle ill tllis freClllency raI1ge corresponds to a mirror displacement Ef of 3.3 x 10⁻¹⁸ m/VIh, or a straiI1 h of 1.1 X 10⁻¹⁹ / VIh.
10-15
2
shot noise
10-17 ~.............,.-4
~~
10-18 c~...~
en
2
10-18-+-__040----'_.....---~___'--+__--'-_ _.Ao_....._.._..._.._.._..._..._+_----
102 103 104 3
frequency f [Hz]Figtlre A.2 : Noise spectral densities (8C, h,) of the Garching prototype with optical path
L = 90 x 30m = 2.71(111
THE PROTOTYPE DETECTORS AT GARCHING AND GLASGOW 91
The lowest mechanical resonances of the mirrors (6.3kHz), of the Pockels cells (9 to10kHz) and of the 'Zerodur' reference cavity (16 to 20kHz) are all well above themeasurement window envisaged (several hundred Hz up to a few kHz). The high noisecontribution at low frequencies « 500 Hz) is seen to be due to insufficient seismicisolation. A remedy here will require more elaborate, but straightforward, suspensionsystems, of the type discussed in Chapter 6.
A.3 The Prototype 10 m Detector at Glasgow
A.3.1 Introduction
The Fabry-Perot based prototype detector at the University of Glasgow has been underdevelopment for the last ten years and followed earlier work on a small scale delay lineinterferometer. While most work on the instrument has been devoted to improving itssensitivity, two periods of data taking have been undertaken, the more recent being inconjunction with the detector at the Max-Planck-Institut, Garching.
A.3.2 General description
The prototype detector has two perpendicular arms each of 10 m length formed betweenfused silica test masses which are hung as pendulums. A schematic diagram of the layoutis shown in Figure A.3. Ultra low loss dielectric mirrors are optically contacted on tothe four test masses in the arms to form very high finesse cavities in each arm. Finessesof approximately 4000 are achieved for illuminating light of wavelength 514 nm from anargon lC1ser, and this number is equivalent to having more than 1000 passes up and downeach cavity. The argon laser light enters the system through a single mode optical fibre.Optical isolation of the cavities, fibre and laser is provided by Faraday effect isolators.The light from the fibre reaches a beamsplitter mounted on a fifth mass suspended as apendulum and the cavities are illuminated through polarisers and quarter wave platesby the beams from this splitter. The polariser / quarter-wave-plate combinations act sothat the light impinging on the cavities is of circular polarisation which allows isolationof the cavities from each other and separation of the light reflected from each cavity.The beamsplitter and cavities are all contained in a vacuum system at a pressure ofrv 5 X 10⁻⁴ mbar. All the test masses in the system and the beamsplitter mass have theirorientations (tilt and rotation) damped and controlled by servo systems. Most of theseuse light from a helium neon laser reflected from a mirror on the mass on to a positionsensing diode as an angular displacement sensor, and control is by electromagnetic driveto the tops of the four wires which suspend each mass. However one mass uses a systemof combined shadow detectors / coil magnet feedback elements, sensing the orientationof the mass and feeding back on it directly. This last arrangement was developed by thegroup in the Max-Planck-Institut, Garching. The orientation controls are such that themirrors on the masses may be turned very finely to allow the resonances of the cavitiesto be optimised.
92 ApPENDIX A
A.3.3 Operation of the detector
The laser has to be frequency locked to one of the cavities - the primary cavity - to keepthis cavity resonating. In more detail the laser is locked to the cavity at frequenciesabove a few Hz but at lower frequencies the distance between the masses is damped andlocked to the frequency of the laser. (Until recently the feedback element in the laserwas an electro-optic modulator). The other cavity - the secondary cavity - then has itslength locked so that it resonates with the light from the laser. The length is adjusted bymeans of coils which can push on magnets mounted on one of the test masses. Presentlythe signal to be recorded from the detector is taken early in this second loop.
Note the use of electronic subtraction of the error point signal in the primary loopfrom the detected signal in the secondary loop. This cancels the effect of any residualfrequency fluctuations of the laser.
The laser and cavity servo loops use the Tf sideband reflection locking technique. Phasemodulation at 12 MHz is put on to the input laser beam by a phase modulator. Thelight directly reflected from the front mirror of each cavity retains the sidebands ofthis modulation but the light which enters a cavity and then leaks back out has thesidebands removed. The effect of this is that the total reflected light from each cavitybecomes amplitude modulated at the original modulation frequency, with the amount ofamplitude modulation being proportional to the phase difference between the incidentlaser light and the light stored in the cavity. The levels of modulation can be sensed bysynchronous detection and provide the basic signals for the two main feedback loops.
Two other stabilisation systems are also used. The laser amplitude is controlled andstabilised by means of a diode sensing / Pockels cell feedback arrangement. To ease theacquisition of lock, the initial swinging of the masses in the secondary cavity is dampeddown by means of illuminating the cavity with helium neon light, sensing the movingFabry-Perot fringes and feeding back a derived damping signal to the suspension pointsof the masses. (This system is not shown in Figure A.3.)
A.3.4 Sensitivity of the 10 In detector
The detector sensitivity has been steadily improving over the ten years that it has beenunder development. To a great extent this improvement has been due to the work carriedout on stabilising the frequency, power and geometry of the light from the illuminatinglaser. However, the most important (and surprising) noise source discovered has beenassociated with the bonding of the mirrors to the test masses. Different types of bondwere tried ranging from apiezon grease through cyanoacrylate glue to optical contacting,with the best performance being obtained with optical contacting. Displacement noiselevels of "-J 1.7 X 10⁻¹⁸ m/VHz over a range of frequency between 1500 Hz and 2500 Hzare typically observed. (See Figure A.4.)
The performance is still not at the level set by shot noise in the photocurrent from thelight detected ("-J 30 mW from each cavity) and the detector also exhibits occasionalexcess noise pulses. Recently work has been focussed on reducing slight fluctuations in
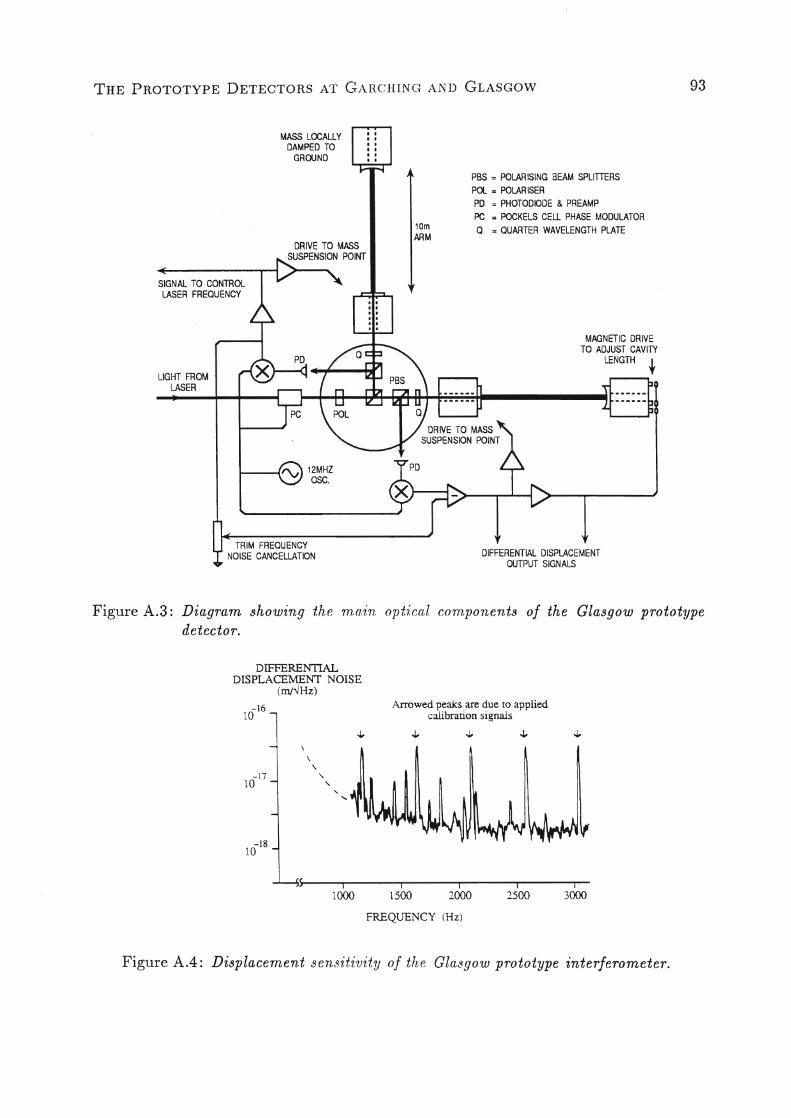
THE PROTOTYPE DETECTORS AT GAIl(jlIINC~ AND GLASGOW 93
MASS LOCALLYDAMPED TO
GROUND
SIGNAL TO CONTROlLASER FREQUENCY
LIGHT FROMLASER
to----t"v 12MHZOSC.
TRIM FREQUENCYNOISE CANCELLATION
10mARM
PBS = POLARISING BEAM SPUTTERSPal = POLARISERPO = PHOTODIODE & PREAMPPC = POCKELS CELL PHASE MODULATORQ = QUARTER WAVELENGTH PLATE
MAGNETIC DRIVETO ADJUST CAVITY
LENGTH t
DIFFERENTIAL DISPLACEMENTOUTPUT SIGNALS
Figure A.3: Diagram showing the m,ai71, optical com,ponents of the Glasgow prototypedetector.
DIFFERENTIALDISPLACE1JtENT NOISE
(m/~Hz)
-1610
\
\\
-17 "10 "
" ......
-1810
Arrowed peaks are due to appliedcalibration signals
i1000
i1500
I2000
i2500
i3000
FREQUENCY (Hz)
Figure A.4: Displacement se71,siti'vity of the Glasgow prototype interferometer.
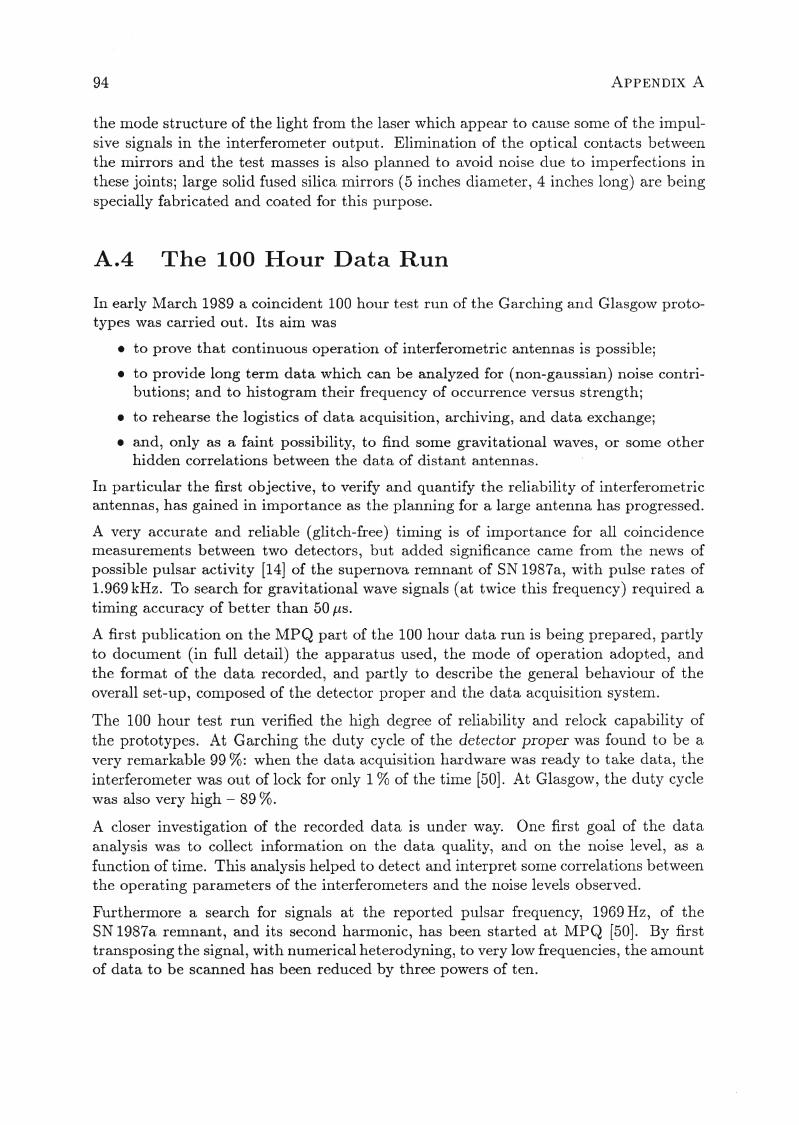
94 ApPENDIX A
the mode structure of the light from the laser which appear to cause some of the impulsive signals in the interferometer output. Elimination of the optical contacts betweenthe mirrors and the test masses is also planned to avoid noise due to imperfections inthese joints; large solid fused silica mirrors (5 inches diameter, 4 inches long) are beingspecially fabricated and coated for this purpose.
A.4 The 100 Hour Data Run
In early March 1989 a coincident 100 hour test run of the Garching and Glasgow prototypes was carried out. Its aim was
• to prove that continuous operation of interferometric antennas is possible;
• to provide long term data which can be analyzed for (non-gaussian) noise contributions; and to histogram their frequency of occurrence versus strength;
• to rehearse the logistics of data acquisition, archiving, and data exchange;
• and, only as a faint possibility, to find some gravitational waves, or some otherhidden correlations between the data of distant al1tennas.
In particular the first objective, to verify and quantify the reliability of interferometricantennas, has gained in importance as the planning for a large antenna has progressed.
A very accurate and reliable (glitch-free) timing is of importance for all coincidencemeasurements between two detectors, but added significance came from the news ofpossible pulsar activity [14] of the supernova remnant of SN 1987a, with pulse rates of1.969kHz. To search for gravitational wave signals (at twice this frequency) required atiming accuracy of better than 50 flS.
A first publication on the MPQ part of the 100 hour data run is being prepared, partlyto document (in full detail) the apparatus used, the mode of operation adopted, andthe format of the data recorded, and partly to describe the general behaviour of theoverall set-up, composed of the detector proper and the data acquisition system.
The 100 hour test run verified the high degree of reliability and relock capability ofthe prototypes. At Garching the duty cycle of the detector proper was found to be avery remarkable 99 %: when the data acquisition hardware was ready to take data, theinterferometer was out of lock for only 1 % of the time [50]. At Glasgow, the duty cyclewas also very high - 89 %.
A closer investigation of the recorded data is under way. One first goal of the dataanalysis was to collect information on the data quality, and on the noise level, as afunction of time. This analysis helped to detect and interpret some correlations betweenthe operating parameters of the interferometers and the noise levels observed.
Furthermore a search for signals at the reported pulsar frequency, 1969 Hz, of theSN 1987a remnant, and its second harmonic, has been started at MPQ [50]. By firsttransposing the signal, with numerical heterodyning, to very low frequencies, the amountof data to be scanned has been reduced by three powers of ten.

Appendix B
International Collaborations
The German and British groups play a strong part in a number of international collaborations aimed at the development and operation of gravitational wave detectors usinglaser interferometry.
B.1 European Collaborations
In particular a strong European collaporation was set up about four years ago betweenthe groups in Britain, France, Italy and Germany with the general aim of coordinatingthe development of gravitational wave detectors in Europe. Tllis collaboration has beenstrongly underpinned by the existence of EC-sponsored twinning contracts betweenthe research groups in the four countries. These contracts provided funding for somecollaborative experimental developments relevant to high power laser interferometryfor gravitational wave detectors. Work on high power lasers, on the testing of ultrahigh quality mirrors, and on the development of seismic isolation systems was carriedout between the groups. Several meetings were also held for the exchange of resultsand ideas. A new application for further EC funding for such work is currently inpreparation.
One aim of the Europearl collaboration has been to encourage funding of at least twodetectors in Europe [61]. It is planned that these detectors would operate together, andwith the detectors in the USA as a worldwide network.
B.2 Australian Collaboration
A further collaboration has been formed between the British/German group and tworesearch groups in Australia, one at the University of Western Australia and one atthe Australian National University, who are proposing to build a similar long baselinedetector [7]. In return for making available the engineering designs and plans for theGerman/British detector, our group will be given first access, if desired, to a secondinterferometer planned for the Australian system.
95
96
B.3 Worldwide Collaboration
ApPENDIX B
During the last year a worldwide collaboration involving Britain, France, Germany, Italyand the USA has been formed. Eight working groups - an extension of groups originallyset up in Europe - have been created, covering lasers, optics, simulation, vacuum, controlsystems, isolation systems, data acquisition and data analysis, with representation fromthe research groups of the participating countries. The aim of these is to encourage fullcollaboration on experimental design and development and to coordinate experimentsto be carried out with the large detectors.
B.4 Specialised Collaborations
One other collaboration of a smaller scale and more specialised nature is being set up.This entails a data analysis group at the Inter-University Centre for Astrophysics andAstronomy, Pune, India having an agreement to work with the relevant part of ourgroup led by Bernard Schutz at the University of Wales.
References
[1] R.L. Forward: Wideband laser interferometer gravitational radiation experiment,Phys. Rev. D 17 (1978) 379-390
[2] R. Weiss: Electromagnetically coupled broadband gravitational antenna, QuarterlyProgress Report, Research Laboratory of Electronics, MIT 105 (1972) 54-76
[3] J. Hough, B.J. Meers, G.P. Newton, N.A. Robertson, H. Ward, B.F. Schutz,R.W.P. Drever: A British Long Baseline Gravitational Wave Observatory, Design Study Report GWD/RAL/86-001 (1986)
[4] K. Maischberger, A. Riidiger, R. Schilling, L. Schnupp, D. H. Shoemaker,W. Winkler: Vorschlag fUr den Bau eines groften Laser-Interferometers zur Messung von Gravitationswellen, June 1985, MPQ Report 96,-. updated version, June 1987, MPQ Report 129,- English translations of chapter summaries: MPQ Report 131
[5] R. Vogt: The LIGO project - a progress report, talk given at the Twelfth Intern.Conf. on General Relativity and Gravitation (GRI2), Boulder 1989, to be reportedixi" the Conference Proceedings, Cambridge University Press, New York (in press)
[6] A. Giazotto, A. Brillet, et al.: The VIRGO Project, (1989)
[7] D. Blair, J. Ferreirinho, P. Veitch, R.J. Sandeman, H.A. Bachor, D. McClelland,A. Wrightson: Propo~al for the A ustralian International Gravitational Observatory, (1989)
[8] K.S. Thorrie: Gravitational Radiation in: 300 Years of Gravitation, Eds.S.W. Hawking, W. Israel, Cambridge University Press (1987)
[9] B.F. Schutz, Ed.: Gravitational Wave Data Analysis, Kluwer, Dordrecht (1989)
[10] C.M. Will: Theory and Experiment in Gravitational Physics, Cambridge University Press, Cambridge, England (1981)
[11] B.F. Schutz: Data analysis requirements of networks of detectors, in: GravitationalWave Data Analysis, Ed. B.F. Schutz, Kluwer, :Qordrecht (1989) 315-326
[12] T. Piran, R.F. Stark: Numerical relativity, rotating gravitational collapse, andgravitational radiation, in: Dynamical Spacetimes and Numerical Relativity, Ed.J.M. Centrella, Cambridge University Press, Cambridge, England (1986) 40-73
97
98 REFERENCES
[13] B.F. Schutz: Gravitational wave sources and their detectability, Class. Quant.Grav. (1989) (in press)
[14] J. Kristian et al.: Submillisecond optical pulsar in supernova 1987 A, Nature 338(1989) 234-236
[15] S. Anderson, P. Gorham, S. Kulkarni, T. Prince, and A. Wolszczan: PSR
2127+11C, I.A.V. Circ. 4772 (1989),- and also private communication
[16] J.G. AbIes, C.E. Jacka, D. McConnell, P.A. Hamilton, P.M. McCulloch, andP.J. Hall: PSR 0021-72A and 0021-72B, I.A.V. Circ. 4602 (1988)
[17] A. Krolak: Coalescing binaries to post-Newtonian order, in: Gravitational WaveData Analysis, Ed. B.F. SC}lutz, Kluwer, Dordrecht (1989) 59-69
[18] M. Tinto: Coincidence probabilities for networks of laser interferometric detectorsobserving coalescing compact binaries, in: Gravitational Wave Data Analysis, Ed.B.F. Schutz, Kluwer, Dordrecht (1989) 299-313
[19] J.P.A. Clark, E.P.J. van den Heuvel, W. Sutantyo: Formation of neutron starbinaries and their importance for gravitation,al radiation, Astron. & Astrophys.72 (1979) 120-128
[20] R.W.P. Drever: Interferometric detectors of gravitational radiation, in: Gravitational Radiation, Les Houches 1982, Eds. N. Deruelle, T. Piran, North-HollandPubl. Co. (1983) 321-338
[21] J.-Y. Vinet, B.J. Meers, C. Nary Man, A. Brillet: Optimization of long-baselineoptical interferometers for gravitational-wave detection, Phys. Rev. D 38 (1988)433-447
[22] B.J. Meers: Recycling in laser interferometric gravitational wave detectors, Phys.Rev. D 38 (1988) 2317-2326
[23] B.F. Schutz: Data processing analysis and storage for interfermetric antennas, in:The Detection of Gravitational Radiation, Ed. D. Blair, Cambridge UniversityPress, Cambridge, England, (in press)
[24] B.F. Schutz: Determining the Hubble constant from gravitational wave observations, Nature 323 (1986) 310-311
[25] D. Herriot, H. Kogelnik, R. Kompfner: Off-axis paths in spherical mirror interferometers, Appl. Opt. 3 (1964) 523-526
[26] R.W.P. Drever and Colleagues: Gravitational wave detectors using laser interferometers and optical cavities: Ideas, principles and prospects, in: QuantumOptics, Experimental Gravitation, and Measurement Theory, Eds. P. Meystre,M.O. Scully, Plenum Press New York (1983) 503-514
[27] C.M. Caves: Quantum-mechanical radiation-pressure fluctuations in an interferometer, Phys. Rev. Lett. 45 (1980) 75-79
REFERENCES 99
,(28] R. Loudon: Quantum limit on the Michelson interferometer used for gravitational-wave detection, Phys. Rev. Lett. 47 (1981) 815-818
[29] L.A. Wu, M. Xiao, and H.J. Kimble: Squeezed states of light from an opticalparametric oscillator, J. Opt. Soc. Am. B 4 (1987) 1465
[30] M. Xiao, L.A. Wu and H.J. Kimble: Precision measurement beyond the shot-noiselimit, Phys. Rev. Lett. 59, (1987) 278-281; P. Grangier, R. E. Slusher, B. Yurkeand A. LaPorta: Squeezed-light-enhanced polarization interferometer, Phys. Rev.Lett. 59 (1987) 2153-2156
[31] C.M. Caves: Quantum-mechanical noise in an interferometer, Phys. Rev. D 23(1981) 1693-1708
[32] J. Gea-Banacloche and G. Leuchs: Squeezed states for interferometric gravitational wave detectors, J. Modern Opt. 34 (1987) 793; for imperfect interferometers see: J. Gea-Banacloche and G. Leuchs, J. Opt. Soc. Am. B 4, (1987) 1667;J. Gea-Banacloche and G. Leuchs, J. Modern Opt. in print (1989)
[33] J. Gea-Banacloche and G. Leuchs: Use of squeezed states in interferometric gravitational wave detectors, in: The Detection of Gravitational Radiation, Ed.D. Blair, Cambridge University Press, Cambridge, England (1989)
[34] R.W.P. Drever, J.L. Hall, F.V. Kowalski, J. Hough, G.M. Ford, A.J. Munley,H. Ward: Laser phase and frequency stabilization using an optical resonator Appl.Phys. B 31 (1983) 97-105
[35] A. Riidiger, R. Schilling, L. Schnupp, W. Winkler, H. Billing, K. Maischberger:A mode selector to suppress fluctuations in laser beam geometry, Optica Acta 28(1981) 641-658
[36] N.A. Robertson, S. Hoggan, J.B. Mangan, J. Hough: Intensity stabilisation of anargon laser using an electro-optic modulator - Performance and limitations Appl.Phys. B 39 (1986) 149-153
[37] C.N. Man, A. Brillet: Injection locking of argon-ion lasers, Opt. Lett. 9 (1984)333-334
[38] G.A. Kerr, J. Hough: Coherent Addition of Laser Oscillators for Use in Gravitational Wave Antennas, to appear in Appl. Phys. B (accepted for publication)
[39] D. Shoemaker, A. Brillet, C.N. Man, O. Cregut, G. Kerr: Frequency-stabilizedlaser-diode-pumped Nd: YAG laser, Opt. Lett. 14 (1989) 609-611
[40] N.A. Robertson: Seismic Isolation, in: The Detection of Gravitational Radiation,Ed. D. Blair, Cambridge University Press, Cambridge, England (in press)
[41] R. Del Fabbro, A. Di Virgilio, A. Giazotto, H. Kautzky, V. Montelatici,D. Passuello: Low Frequency Behaviour of the Pisa Seismic Noise Super-Attenuatorfor Gravitational Wave Detection, Phys. Lett. A (Netherlands) 133 (1988)471-475
100 REFERENCES
[42] N.A. Robertson, R.W.P. D~ever, I. Kerr, J. Hough: Passive and active seismicisolation for gravitational radiation detectors and other instruments, J. Phys. E:Sci. Instrum. 15 (1982) 1101-1105
[43] R.L. Rinker, J.E. Faller: 'Super spring' - A long period vibration isolation,in: Precision Instruments and Fundamental Constants 11, Eds. B.N. Taylor,W.D. Phillips, National Bureau of Standard.s (USA), Spec. Pub. 617 (1984)411-417
[44] P.R. Saulson: Vibration isolation for broadband gravitational wave antennas, Rev.Sci. Instrum. 55 (1984) 1315-1320
[45] A. Giazotto, D. Passuello, A. Stefanini: One-mile equivalent length interferometricpendulum for !Jei!Jmic noise reduction Rev. Sci. Instrum. 57 (1986) 1145-1151
[46] E. Campani, A. Giazotto, D. Passuello: Performance of an analogue phase followerRev. Sci. Instrum. 57 (1986) 79-81
[47] Y.T. Chen, R.W.P Drever, talk given at the International Conference on Experimental Gravitational Physics, Guangzhou 1987 (unpublished)
[48] R. Del Fabbro, A. Di Virgilio, A. Giazotto, H. Kautzky, V. Montelatici,D. Passuello: First Results from the Pisa Seismic Noise Super-Attenuator for LowFrequency Gravitational Wave Detection, Phys. Lett. A (Netherlands) 132 (1988)237-240
[49] D. Pountain: Digital Paper, Byte 14 (1989) 274-280
[50] T.M. Niebauer, A. Riidiger,R. Schilling, L. Schnupp, W. Winkler, G. Leuchs:Some re!Jults from a 100 hour data run with the Garching 30m prototype, talkgiven at the Twelfth Intern. Conf. on General Relativity and Gravitation (GR12),Boulder 1989, to be reported in the Conference Proceedings, Cambridge UniversityPress, New York (in press)
[51] H. Billing, K. Maischberger, A. Riidiger, R. Schilling, L. Schnupp, W. Winkler:An argon laser interferometer for the detection of gravitational radiation, J. Phys.E: Sci. Instrum. 12 (1979) 1043-1050
[52] D. Shoemaker, R. Schilling, L. Schnupp, W. Winkler, K. Maischberger, A. Riidiger:Noise behavior of the Garching 30 meter prototype gravitational wave detector,Phys. Rev. D 38 (1988) 423-432
[53] H. Ward et al.: The Glasgow gravitational wave detector - present progres8 andfuture plans, in: Experimental Gravitational Pbysics, (Proc. Guangzhou 1987),Eds. P.F. Michelson, Hu En-ke, G. Pizzella, World Scientific (1988) 322-327
[54] K. Maischberger, A. Riidiger, R. Schilling, L. Schnupp, W. Winkler, H. Billing:Noise investigations in a laser interferometer for the detection of gravitationalradiation, Proc. Second Marcel Grossmann Meeting on General Relativity, Trieste1979, Ed. R. Ruffini, North-Holland Publ. Co. (1982) 1083-1100
[55] W. Winkler: Eine opti!Jche Verzogerungsleitung fur ein Breitband- Gravitationswellenexperiment, Ph.D. Thesis, Miinchen 1983, Internal Report MPQ 74
REFERENCES
[56]
[57]
[58]
[59]
[60]
[61]
101
H. Billing, W. Winkler, R. Schilling, A. Riidiger, K. Maischberger, L. Schnupp:The Munich gravitational wave detector using laser interferometry, in: QuantumOptics, Experimental Gravitation, and Measurement Theory, Eds. P. Meystre,M.G. Scully, Plenum Press New York (1983) 525-566
R. Schilling, L. Schnupp, W. Winkler, H. Billing, K. Maischberger, A. Riidiger:A method to blot out scattered light effects and its application to a gravitationalwave detector, J. Phys. E: Sci. Instrum.#14 (1981) 65-70
L. Schnupp, W. Winkler, K. Maischberger, A. Riidiger, R. Schilling: Reductionof noise due to scattered light in gravitational wave antennas by modulating thephase of the laser light, J. Phys. E: Sci. Instrum. 18 (1985) 482-485
R. Schilling, L. Schnupp, D.H. Shoemaker, W. Winkler, K. Maischberger,A. Riidiger: Improved sensitivities in laser interferometers for the detection ofgravitational waves, Journees Relativistes, Aussois 1984; Proceedings in: Gravitation, Geometry, and Relativistic Physics, Lecture Notes in Physics 212 (1984)213-221
K. Maischberger, A. Riidiger, R. Schilling, L. Schnupp, W. Winkler and G. Leuchs:Status of the Garching 30 meter prototype for a large gra"vitational wave detector, in: Experimental Gravitational Physics, (Proc. Guangzhou 1987), Eds.P.F. Michelson, Hu E~-ke, G. Pizzella, World Scientific (1988) 316-321
Report of an Ad-hoc working group on the future of interferome.tric gravitationalwave antennas in Europe, March 1988 - copies submitted to SERC and BMFT in1988