Embed Size (px)
Citation preview
PROPOSAL FOR THE PROVISION OF FIRE
DEPARTMENT‐BASED ADVANCED LIFE SUPPORT AND
TRANSPORTATION
CITY OF GALVESTON FIRE DEPARTMENT
GALVESTON, TX
MARCH, 2013

2
3
TABLE OF CONTENTS
I – Introduction
II – Executive Summary
III – Geographic Overview
IV – Methodology
V – EMS Operations
VI – Advantages of Fire Based EMS
VII – EMS Staffing and Deployment Analysis
VIII – Cost Assumptions and Calculations

4
5
INTRODUCTION
This report presents a brief Geographic Information System (GIS) analysis of the City of Galveston Fire
Department deployment as a foundation for the proposed integration of fire, EMS and patient
transportation.
The goal of this proposal is to provide the citizens of Galveston a full service, out‐of‐hospital emergency
medical care system. This system will include the provision of rapid response, treatment, and transport
for the purpose of improving the quality of patient care. Through employee teamwork and a distinctive
command structure, this proposed Fire Department based system will deliver the optimum level of EMS
response and patient care, including transport.
The Galveston Fire Department (GFD) protects lives and property through fire prevention, public
education, firefighter safety, fire & rescue operation, emergency medical service and disaster
management. The vision for this program is one of growth and adaptation, as necessary, to maintain
and enhance the quality of services delivered. This continuous improvement will facilitate safe, efficient
and effective emergency response and patient care leading to positive outcomes for those requiring
service.
Scope and Objectives This report examines the provision of emergency response services provided by the City of Galveston
Fire Department.
Issues evaluated by this report include:
Fire department proposed EMS response capabilities, staffing arrangements and safe work
practices
Strengths of the Fire Department in provision of EMS
Future goals and ways to improve services
Cost assumptions and projected revenue

6
7
EXECUTIVE SUMMARY
Galveston Fire Department provides a variety of emergency services to the local area population.
According to the 2011 census bureau estimation, Galveston has a population of 48,444 people1.
The Galveston Fire Department (GFD) has long provided fire suppression and emergency medical first
response services to the citizens of Galveston. The GFD has successfully implemented a BLS (Basic Life
Support) first responder program which, in most cases, arrives prior to the county transport unit, and
provides early, essential primary patient care using existing cross‐trained multi‐role firefighters. In doing
so, the Fire Department has essentially subsidized the county ambulance service by performing the
time critical first response activity, while the ambulance service provides revenue generating
transport.
The City should consider offering those services now provided by the county transport provider, thus
ensuring that the city has sole authority over EMS system design and quality. The Fire Department is
proposing to assume the ambulance transportation role for Galveston residents and visitors, continuing
the fire department’s tradition of superior care which is ethically based and financially viable for the
long term. With the demonstrated commitment and extensive experience of city leaders, GFD is the
best organization to help the city implement its vision of an innovative, patient focused and clinically
superior fully integrated EMS system. Therefore, it is recommended that the GFD integrate patient
transport into the realm of services they now provide.
The Galveston Fire Department currently provides the following services:
Fire Suppression
Fire Prevention & Fire Investigation
Emergency Medical Services
HazMat Response
Rescue and Marine Operations
Galveston EMS History In the early 1970’s Dr. Truman G. Blocker, President of UTMB at Galveston, Dr. Sally Abston, Dr. Byron J.
Bailey as well as several other prominent physicians in the community approached the Moody
Foundation of Galveston about assisting with the formation of an EMS system on Galveston Island.
Blocker, a burn surgeon who had witnessed the carnage of the Texas City disaster in 1947, along with his
associates, had determined that the time was right for such a system. They based their recommendation
on the American Heart Association’s CPR science as well as the National Highway Transportation Safety
Administration’s white paper which dealt with morbidity and mortality on the nation’s highways. The
Galveston Emergency Medical Services system was ultimately set up under the direction of the
Galveston County Health District, as a third city service, where it has remained for the past 40 years.
1 U.S. Census Bureau web site < http://quickfacts.census.gov/qfd/states/48/4828068.html> last visited 1/29/2012.
8
Recommendations The Galveston Fire Department should provide emergency medical transport services in its
service area at the Advanced Life Support (ALS) level. The distinction between the basic
level provider (EMT‐B) and the more advanced level Paramedic training, is the delivery of
Advanced Life Support (ALS), and advanced levels of care, such as drug administration,
intubation, and intravenous (I.V.) therapy.
The Galveston Fire Department should add 28 full time firefighter/paramedic positions 1
full time training officer position, 1 full time quartermaster position and 1 full time Assistant
Chief of EMS position to appropriately deploy four ambulances staffed with a minimum of 1
FF/EMT‐P and 1 FF/EMT‐B at all times.
9
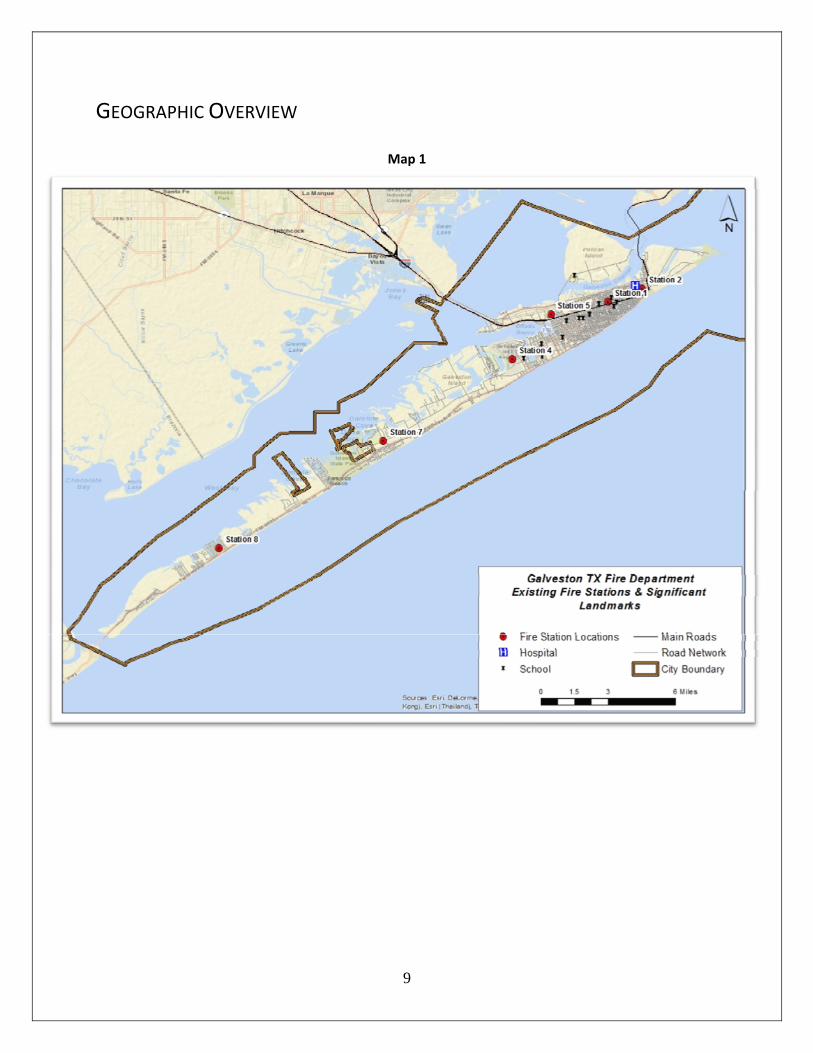
GEOGRAPHIC OVERVIEW
Map 1
10
Geospatial Characteristics Galveston is the county seat of Galveston County, Texas. It is located at the south of the state, about 50
miles south of Houston2. The city is located on an island connected to the main land by bridges. It is an
attractive tourist destination with approximately 6 million tourists a year.
Topography
The urban area is relatively flat. Areas that are flat allow the fire apparatus to travel at designated
speed limits; however they are exposed to flooding.
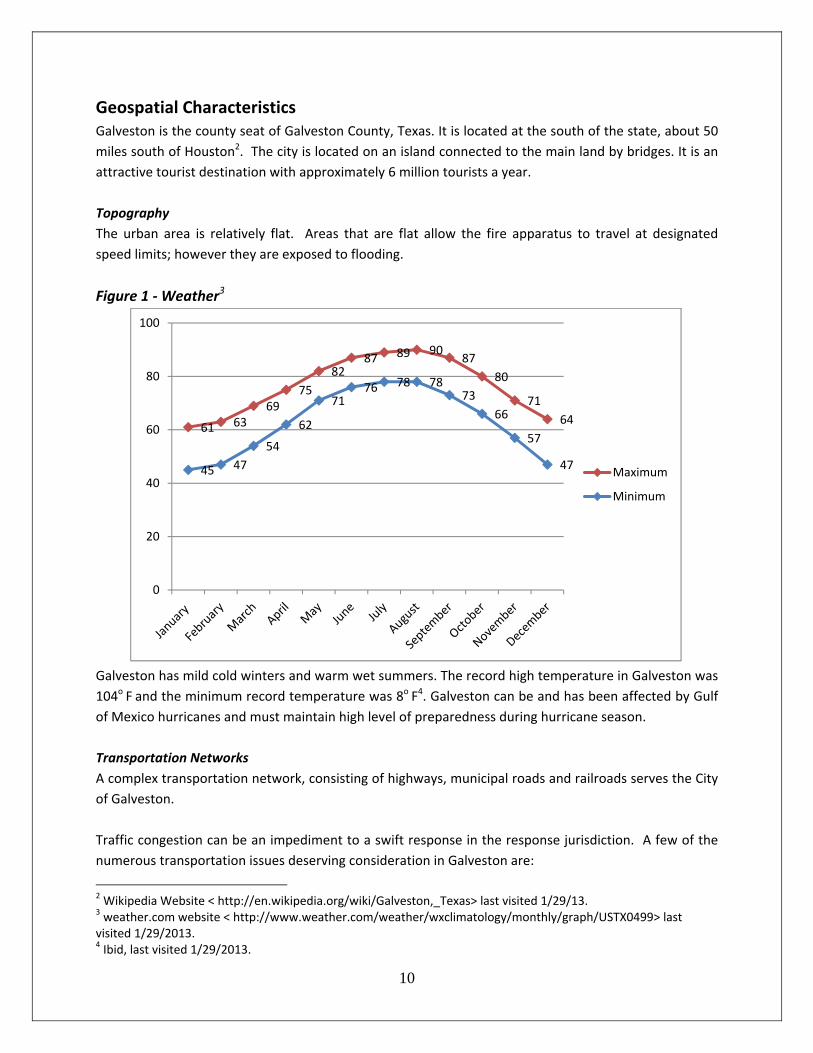
Figure 1 ‐ Weather3
Galveston has mild cold winters and warm wet summers. The record high temperature in Galveston was
104o F and the minimum record temperature was 8o F4. Galveston can be and has been affected by Gulf
of Mexico hurricanes and must maintain high level of preparedness during hurricane season.
Transportation Networks
A complex transportation network, consisting of highways, municipal roads and railroads serves the City
of Galveston.
Traffic congestion can be an impediment to a swift response in the response jurisdiction. A few of the
numerous transportation issues deserving consideration in Galveston are:
2 Wikipedia Website < http://en.wikipedia.org/wiki/Galveston,_Texas> last visited 1/29/13. 3 weather.com website < http://www.weather.com/weather/wxclimatology/monthly/graph/USTX0499> last visited 1/29/2013. 4 Ibid, last visited 1/29/2013.
61 6369
75
8287 89 90
87
80
71
64
45 47
54
62
7176 78 78
73
66
57
47
0
20
40
60
80
100
Maximum
Minimum
11
Forecasted increases in population and employment
Forecasted increase in tourism
Forecasted increases in “trips”
Heavy vehicle traffic and bridge crossings
Sandy and muddy roads
Future land use creating increased demand for commuter, personal, and commercial trips
Tourism
Galveston is a major tourist destination that hosts about 6 million visitors each year. Many come to the
beach and associated attractions. More come for the 150+ special events hosted on the Island. The two week Mardi Gras in February each year and the 5 day Motorcycle rally in November historically bring over 400,000 visitors to Galveston. Almost every weekend there is a festival or some other event that draw thousands of visitors to our City for a weekend. All of these events increase the call volume and at times place the FD in a critical resource mode for hours at a time.

12
13
METHODOLOGY
OVERVIEW
Once the domain of cartographers, computer‐assisted drawing technicians, mainframes, and
workstations, geographic information systems (GIS) mapping has migrated to the desktop. With ArcGIS,
a user can create intelligent, dynamic maps, using data from virtually any source and across most
popular computing platforms to display information that has a geographic aspect. The ArcGIS software,
a product of ESRI, Inc., allows desktop users to work simultaneously with maps, database tables, charts,
and graphics, and is an effective tool for conducting computerized system analysis and management.
Geographic information systems are used by government agencies, nonprofit organizations, and
businesses to describe and analyze the physical world. Simply put, a GIS combines layers of information
about a geographic region to give you a better understanding of that region. Layers of information can
be combined depending on the purpose of the study, forming a computer model of a jurisdiction on
which many types of analysis can be made. In the public safety sector, and for the purposes of this
analysis, GIS software uses geography and computer‐generated maps as an interface for integrating and
accessing location‐based information. For example, the location of fire stations can be layered on a
jurisdiction’s geography including the road network, water features, building footprints, or any other
feature that has been digitized and assigned a location. In this manner, GIS allows public safety
personnel to effectively plan for emergency response, determine mitigation priorities, analyze historical
events, and predict future events. GIS can also be used to provide critical information to emergency
responders upon dispatch or while en route to an incident to assist in tactical planning.
The Role of the National Fire Protection Association (NFPA)
The mission of the NFPA is to reduce the worldwide burden of fire and other hazards on the quality of
life by providing and advocating scientifically‐based consensus codes and standards, research, training,
and education, and recommends that all fire departments establish a policy of providing and operating
with “the highest possible levels of safety and health for all members.”5
The recommendations and analysis contained in this study are guided by NFPA standards for two
important reasons. First, NFPA standards provide fire departments with a measure of “interoperability.”
Interoperability enables fire service personnel in the chain of command to speak the same language and
conform to the same operational guidelines. NFPA standards provide the fire service with a common
language, common definitions, and common requirements that are meant to foster the safe and
effective delivery of fire suppression, rescue, EMS, and special services to a given community. Second,
NFPA standards are formulated via consensus development. Development of NFPA standards are the
result of scientific research, empirical studies, and consensus among technical experts and the
organizations they are affiliated with. Combined, these factors legitimate NFPA standards as the
yardstick by which fire departments are measured internationally.
5 NFPA Mission Statement.
14
Examples of some NFPA codes and standards include:
• NFPA 101, Life Safety Code, is currently used in every U.S. state and adopted statewide in 43 states
and addresses minimum building design, construction, operation, and maintenance requirements
necessary to protect building occupants from danger caused by fire, smoke, and toxic fumes. NFPA 101
is recognized and utilized by numerous federal government agencies, including the Department of
Veterans Affairs and the Centers for Medicare and Medicaid Services.6
• NFPA 1404, Standard for Fire Service Respiratory Protection Training, which specifies the minimum
requirements for a fire service respiratory protection program (NFPA 1989). This standard concentrates
on the training component of a respiratory protection program, including the evolution of respiratory
protection training, current equipment, and recent fire experience.7
• NFPA 1561, Standard on Fire Department Incident Management System, which provides minimum
criteria for emergency incident management. Such incident management systems are intended to
provide structure, coordination, and effectiveness during emergency incidents to enhance safety and
health of fire department members and other persons involved.
• NFPA 1971, Standard on Protective Ensemble for Structural Fire Fighting, which specifies minimum
requirements for the design, performance, testing, and certification of the elements of the protective
ensemble including coats, trousers, helmets, gloves, footwear, and interface items for protection from
the hazards of structural firefighting operations.
• NFPA 1981, Standard on Open‐Circuit Self‐Contained Breathing Apparatus for the Fire Service, which
specifies minimum requirements for the design, performance, testing, and certification of self‐contained
breathing apparatus (SCBA) respirators used by the fire service. Requirements are in addition to U.S.
OSHA respirator certification under 42 CFR 84.
• NFPA 1982, Standard on Personal Alert Safety Systems, which specifies minimum requirements for the
design, performance, testing, and certification of personal alert safety systems (PASS) that monitor a fire
fighter's motion and automatically emit an alarm if a fire fighter becomes incapacitated.
On account of their emphasis on safe and effective fire suppression, rescue and EMS operations, the two
standards that will be referenced most often throughout this analysis are NFPA 1500 and NFPA 1710.
NFPA 1500, Standard on Fire Department Occupational Safety and Health Program, specifies (1) the
minimum requirements for a fire department’s occupational safety and health program, and (2) the
safety procedures for members involved in rescue, fire suppression, and related activities. This standard
addresses organization, training and education, vehicles, equipment, protective clothing, emergency
operations, facilities, medical and physical criteria, and member assistance programs. NFPA 1500
6 NFPA; site visited July 7, 2012. <http://www.nfpa.org/assets/files/PDF/CodesStandards/NFPA101FactSheet0809.pdf>. 7 Reference NFPA 1500 for requirements concerning use of SCBA in fire fighting operations and NFPA 1852 for the selection, care, and maintenance of SCBA, and respiratory breathing air quality content.
15
recommends that a “minimum acceptable fire company staffing level should be four members
responding on or arriving with each Engine and each Ladder Company responding to any type of fire.”
The purpose of NFPA 1710, Standard for the Organization and Deployment of Fire Suppression
Operations, Emergency Medical Operations and Special Operations to the Public by Career Fire
Departments, is “to specify the minimum criteria addressing the effectiveness and efficiency of the
career public fire suppression operations, emergency medical service, and special operations delivery in
protecting the public of the jurisdiction and the occupational safety and health of fire department
employees.”8 The standard recommends “fire companies, whose primary functions are to pump and
deliver water and perform basic firefighting at fires, including search and rescue… shall be staffed with a
minimum of four on‐duty personnel.9 Fire companies whose primary functions are to perform the
variety of services associated with truck work, such as forcible entry, ventilation, search and rescue,
aerial operations for water delivery and rescue, utility control, illumination, overhaul and salvage work…
shall [also] be staffed with a minimum of four on‐duty personnel.10 Fire Departments that provide
emergency medical services “shall establish…240 seconds or less for the arrival of a unit with first
responder with automatic external defibrillator (AED) or higher level capability at an emergency medical
incident”11. Additionally, it shall establish service with “480 seconds or less travel time for the arrival of
an advanced life support (ALS) unit at an emergency medical incident…”12
ARCGIS 10.1 AND NETWORK ANALYST GEOGRAPHIC INFORMATION SYSTEMS
ArcGIS’s Network Analyst is an extension, or software tool, that manipulates the network data
incorporated into a GIS. Networks are interconnected line features, visually represented as roads,
rivers, pipelines, or trails. From this data, it is possible to determine the best route between two spots
or amongst several points, calculate travel cost in distance or time, find the closest facility to an address,
or model service areas.
Travel speed is based on road type, as assigned by the U.S. Census Bureau. The ArcView 10 software
Network Analyst extension uses the TeleAtlas Dynamap®/Transportation v 10.3™ street database, which
offers the most comprehensive and up‐to‐date U.S. street and address data available.
ASSIGNED ROAD SPEEDS
A great deal of geographic street data originates from the US Census Bureau TIGER files. One of the
attributes extracted from these files is the Census Feature Classification Code (CFCC), which describes
street characteristics, among others. The CFCC is a three‐character code: the first character is a letter
describing the feature class; the second character is a number describing the major category; and the
third character is a number describing the minor category. Based on the CFCC codes, a GIS user
8 NFPA 1710, § 1.2.1. 9 NFPA 1710, § 5.2.3.1 and § 5.2.3.1.1. 10 NFPA 1710, § 5.2.3.2 and § 5.2.3.2.1. 11 NFPA 1710, § 4.1.2.1(4). 12 NFPA 1710, § 4.1.2.1(5).
16
employing the ArcGIS Network Analyst extension is able to calculate the driving time for each line
segment in a road network (i.e., the roads in a city, county, or other jurisdiction).
Primary Highways with Limited Access – 65 mph
Interstate highways and some toll highways are in this category (A1) and are distinguished by the
presence of interchanges. These highways are accessed by way of ramps and have multiple lanes of
traffic. The opposing traffic lanes are divided by a median strip.
Primary Roads without Limited Access – 55‐45 mph
This category (A2) includes nationally and regionally important highways that do not have limited access
as required by category A1. It consists mainly of US highways, but may include some state highways and
county highways that connect cities and larger towns. A road in this category must be hard‐surface
(concrete or asphalt). It has intersections with other roads, may be divided or undivided, and have
multi‐lane or single‐lane characteristics.
Secondary and Connecting Roads – 35 mph
This category (A3) includes mostly state highways, but may include some county highways that connect
smaller towns, subdivisions, and neighborhoods. The roads in this category generally are smaller than
roads in Category A2, must be hard‐surface, and are usually undivided with single‐lane characteristics.
These roads usually have a local name along with a route number and intersect with many other roads
and driveways.
Local, Neighborhood, and Rural Roads – 25 mph
A road in this category (A4) is used for local traffic and usually has a single lane of traffic in each
direction. In an urban area, this is a neighborhood road and street that is not a thoroughfare belonging
in categories A2 or A3. In a rural area, this is a short‐distance road connecting the smallest towns; the
road may or may not have a state or county route number. Scenic park roads, unimproved or unpaved
roads, and industrial roads are included in this category. Most roads in the Nation are classified as A4
roads.
Vehicular Trails – 5‐1 mph
A road in this category (A5) is usable only by four‐wheel drive vehicles, is usually a one‐lane dirt trail,
and is found almost exclusively in very rural areas. Sometimes the road is called a fire road or logging
road and may include an abandoned railroad grade where the tracks have been removed. Minor,
unpaved roads usable by ordinary cars and trucks belong in category A4, not A5.
Road with Special Characteristics – 55‐20 mph (or less)*
This category (A6) includes roads, portions of a road, intersections of a road, or the ends of a road that
are parts of the vehicular highway system and have separately identifiable characteristics.
17
Road as Other Thoroughfare –15‐ 5 mph (or less)*
A road in this category (A7) is not part of the vehicular highway system. It is used by bicyclists or
pedestrians, and is typically inaccessible to mainstream motor traffic except for private‐owner and
service vehicles. This category includes foot and hiking trails located on park and forestland, as well as
stairs or walkways that follow a road right‐of‐way and have names similar to road names.
TURN DELAY TIME TABLE
Travel time and speed would be different in the urban areas, where the travel area will be more
complex than in rural areas due to number of roads intersections, turns, and traffic lights. ArcGIS
Network analyst allows implementing time delays in the analysis based on turn type, assigned based on
statistical information. For each turn category, the current assigned travel time delay, in seconds, is
shown in the table below:
Straight: (Across Local Road) 5 sec
Reverse 12 sec
Right Turn 3 sec
Left Turn 8 sec
ASSUMPTIONS
Several key assumptions must be addressed prior to drawing any conclusions from this analysis:
Modeled travel speeds are based on reasonable and prudent road speeds, as defined by the U.S.
Census Bureau. Actual response speeds may be slower, and the associated travel times
greater, with any traffic congestion or any other unpredictable impedances including, but not
limited to:
Traffic Incidents: collisions and vehicle breakdowns causing lane blockages
and driver distractions.
Work Zones: construction and maintenance activity that can cause added
travel time in locations and times where congestion is not normally present.
Weather: reduced visibility, road surface problems and uncertain waiting
conditions result in extra travel time and altered trip patterns.
Demand Changes: traffic volume varies from hour‐to‐hour and day‐to‐day
and this causes travel time, crowding and congestion patterns to disappear or to
significantly worsen for no apparent reason in some locations.
Special Events: an identifiable case of demand changes where the volume and
pattern of the change can frequently be predicted or anticipated.
18
Traffic Control Devices: poorly timed or inoperable traffic signals,
drawbridges, railroad grade crossing signals or traveler information systems
contribute to irregularities in travel time.
Inadequate Road or Transit Capacity: the urban areas are not adding enough
capacity, improving operations or managing demand well enough to keep
congestion from growing larger.13
If primary units are unavailable, for any reason (e.g., simultaneous emergencies, scheduled training, or
as a result of mutual aid obligations), to respond to an emergency, travel times will be greater as more
distantly‐located secondary apparatus will be required to respond to an emergency in the primary
unit’s stead, and with potential delays.
The time from arrival of the apparatus to the onset of interior fire suppression operations and/or
initiation of critical emergency medical interventions by that crew (access interval) must be considered
when analyzing response system capabilities. In reality, the access interval is dependent upon factors
including, but not limited to, distance from the apparatus to the task location and the elevation of the
fire or EMS location (i.e., high rise structures). Locked doors or security bars which must be breached
also act as impediments to access, as do traumatized family members, crowds, whether or not the scene
is secured by police, parked cars, and a host of other unpredictable conditions. Impediments like these
may add to the delay between the discovery of a fire and implementation of an actual fire attack, and to
the delay between the discovery of an individual in medical distress and the initiation of emergency
medical care.
13 David Schrank and Tim Lomax, The 2005 Urban Mobility Report, (Texas Transportation Institute, Texas A&M University: May 2005).
19
EMS OPERATIONS
The business of providing emergency services has always been labor intensive, and remains so to this
day. Although new technology has improved firefighting equipment and protective gear, and has led to
advances in modern medicine, it is the fire fighters who still perform the critical tasks necessary to
contain and extinguish fires, rescue trapped occupants from a burning structure, and provide emergency
medical and rescue services.
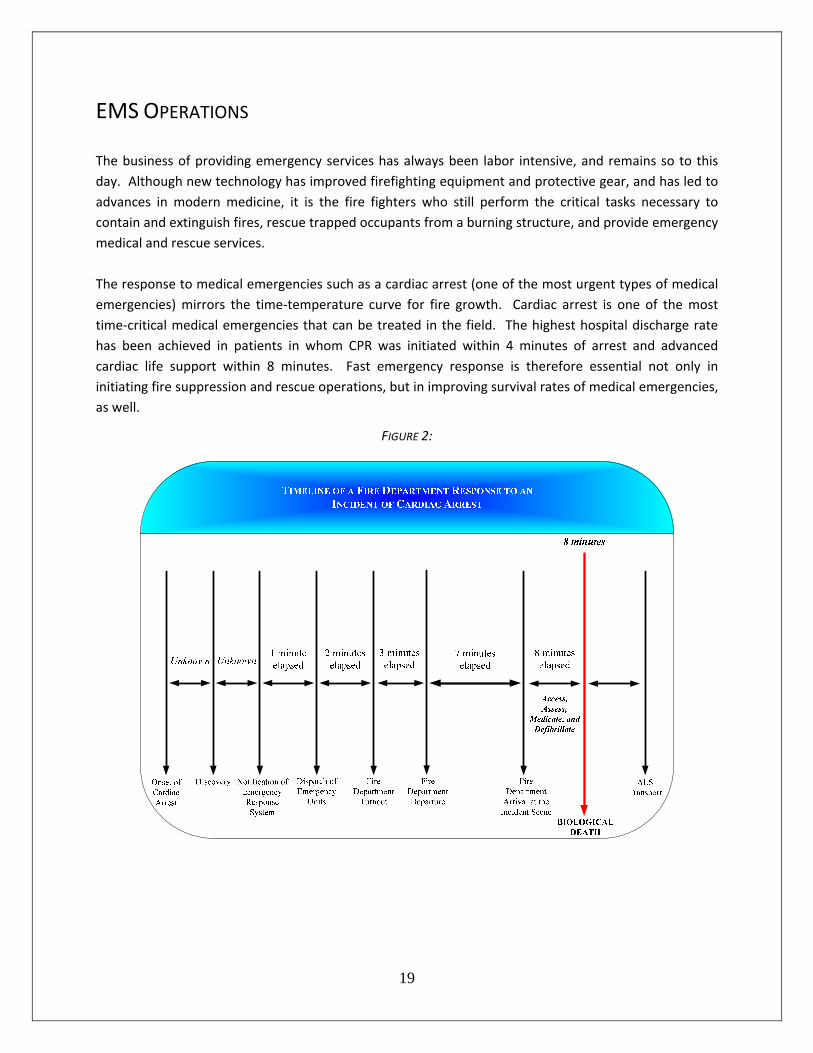
The response to medical emergencies such as a cardiac arrest (one of the most urgent types of medical
emergencies) mirrors the time‐temperature curve for fire growth. Cardiac arrest is one of the most
time‐critical medical emergencies that can be treated in the field. The highest hospital discharge rate
has been achieved in patients in whom CPR was initiated within 4 minutes of arrest and advanced
cardiac life support within 8 minutes. Fast emergency response is therefore essential not only in
initiating fire suppression and rescue operations, but in improving survival rates of medical emergencies,
as well.
FIGURE 2:
20
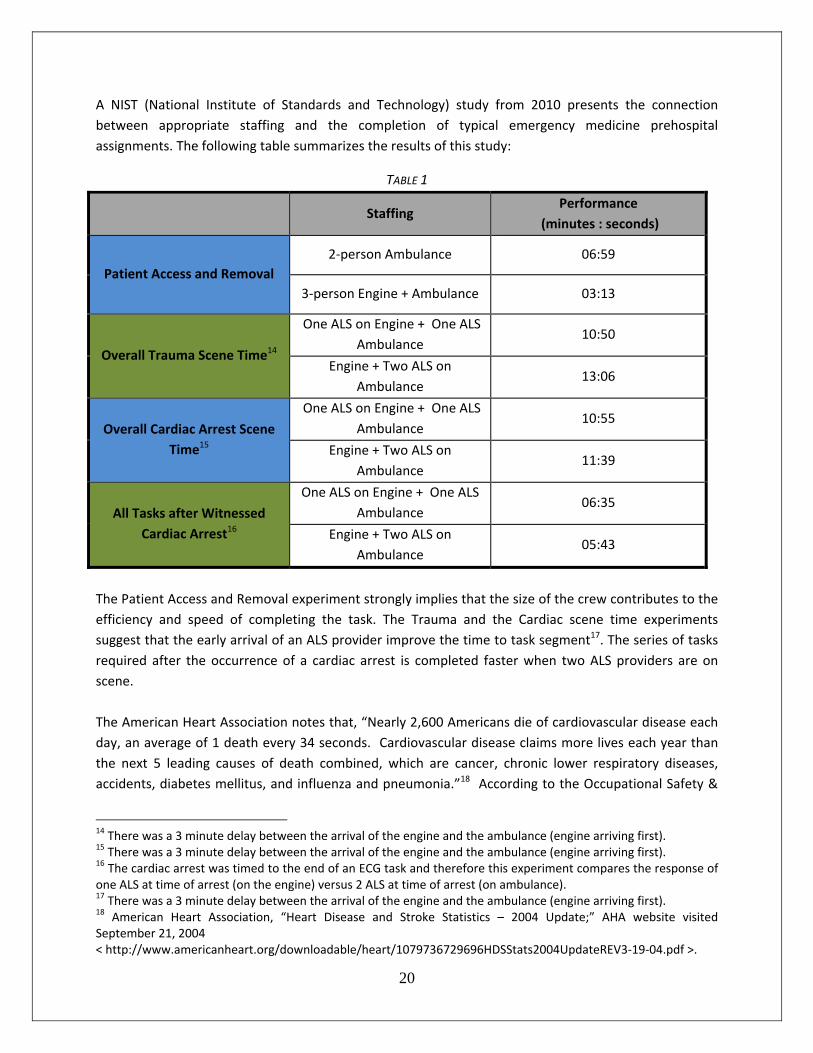
A NIST (National Institute of Standards and Technology) study from 2010 presents the connection
between appropriate staffing and the completion of typical emergency medicine prehospital
assignments. The following table summarizes the results of this study:
TABLE 1
Staffing Performance
(minutes : seconds)
Patient Access and Removal 2‐person Ambulance 06:59
3‐person Engine + Ambulance 03:13
Overall Trauma Scene Time14
One ALS on Engine + One ALS
Ambulance 10:50
Engine + Two ALS on
Ambulance 13:06
Overall Cardiac Arrest Scene
Time15
One ALS on Engine + One ALS
Ambulance 10:55
Engine + Two ALS on
Ambulance 11:39
All Tasks after Witnessed
Cardiac Arrest16
One ALS on Engine + One ALS
Ambulance 06:35
Engine + Two ALS on
Ambulance 05:43
The Patient Access and Removal experiment strongly implies that the size of the crew contributes to the
efficiency and speed of completing the task. The Trauma and the Cardiac scene time experiments
suggest that the early arrival of an ALS provider improve the time to task segment17. The series of tasks
required after the occurrence of a cardiac arrest is completed faster when two ALS providers are on
scene.
The American Heart Association notes that, “Nearly 2,600 Americans die of cardiovascular disease each
day, an average of 1 death every 34 seconds. Cardiovascular disease claims more lives each year than
the next 5 leading causes of death combined, which are cancer, chronic lower respiratory diseases,
accidents, diabetes mellitus, and influenza and pneumonia.”18 According to the Occupational Safety &
14 There was a 3 minute delay between the arrival of the engine and the ambulance (engine arriving first). 15 There was a 3 minute delay between the arrival of the engine and the ambulance (engine arriving first). 16 The cardiac arrest was timed to the end of an ECG task and therefore this experiment compares the response of one ALS at time of arrest (on the engine) versus 2 ALS at time of arrest (on ambulance). 17 There was a 3 minute delay between the arrival of the engine and the ambulance (engine arriving first). 18 American Heart Association, “Heart Disease and Stroke Statistics – 2004 Update;” AHA website visited September 21, 2004 < http://www.americanheart.org/downloadable/heart/1079736729696HDSStats2004UpdateREV3‐19‐04.pdf >.
21
Health Administration, there are 300,000 – 400,000 deaths per year in the United States from cardiac
arrest,19 making it one of the leading causes of death in the nation. Most cardiac arrest deaths occur
outside the hospital, resulting in survival rates ranging between 1% and 5%.
Despite low out of hospital survival rates, cardiac arrest remains one of the most time‐critical medical
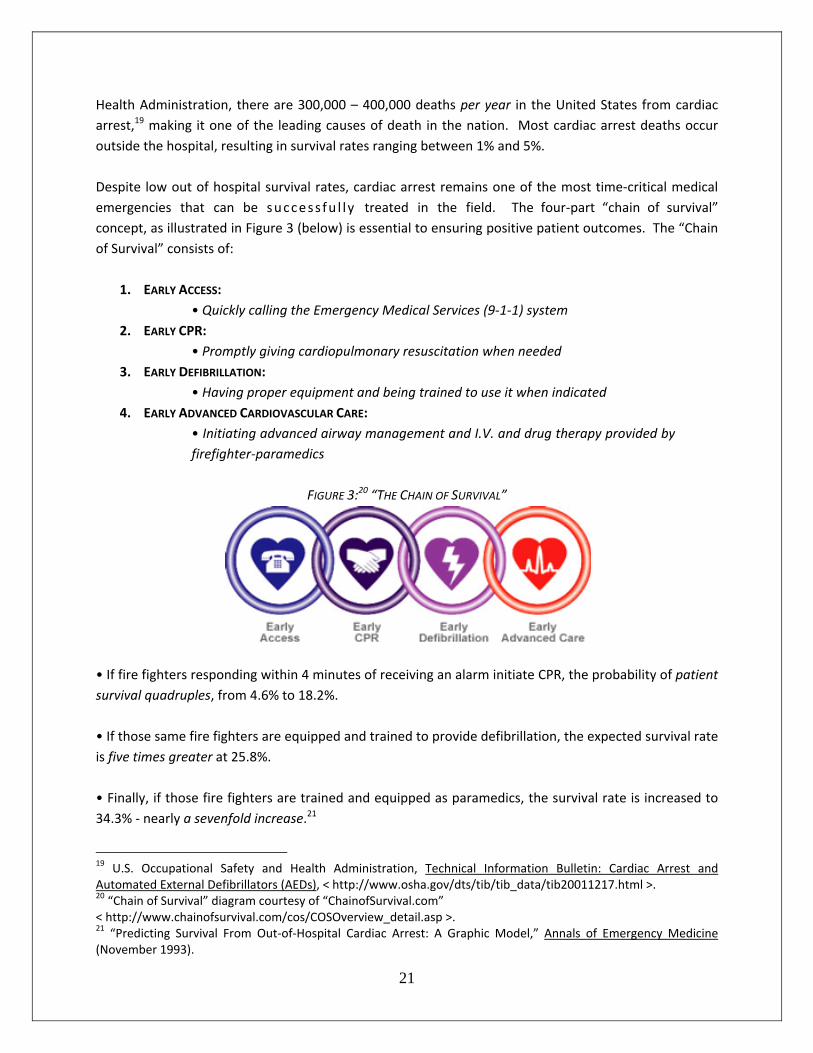
emergencies that can be success fu l ly treated in the field. The four‐part “chain of survival”
concept, as illustrated in Figure 3 (below) is essential to ensuring positive patient outcomes. The “Chain
of Survival” consists of:
1. EARLY ACCESS:
• Quickly calling the Emergency Medical Services (9‐1‐1) system
2. EARLY CPR:
• Promptly giving cardiopulmonary resuscitation when needed
3. EARLY DEFIBRILLATION:
• Having proper equipment and being trained to use it when indicated
4. EARLY ADVANCED CARDIOVASCULAR CARE:
• Initiating advanced airway management and I.V. and drug therapy provided by
firefighter‐paramedics
FIGURE 3:20 “THE CHAIN OF SURVIVAL”
• If fire fighters responding within 4 minutes of receiving an alarm initiate CPR, the probability of patient
survival quadruples, from 4.6% to 18.2%.
• If those same fire fighters are equipped and trained to provide defibrillation, the expected survival rate
is five times greater at 25.8%.
• Finally, if those fire fighters are trained and equipped as paramedics, the survival rate is increased to
34.3% ‐ nearly a sevenfold increase.21
19 U.S. Occupational Safety and Health Administration, Technical Information Bulletin: Cardiac Arrest and Automated External Defibrillators (AEDs), < http://www.osha.gov/dts/tib/tib_data/tib20011217.html >. 20 “Chain of Survival” diagram courtesy of “ChainofSurvival.com” < http://www.chainofsurvival.com/cos/COSOverview_detail.asp >. 21 “Predicting Survival From Out‐of‐Hospital Cardiac Arrest: A Graphic Model,” Annals of Emergency Medicine (November 1993).
22
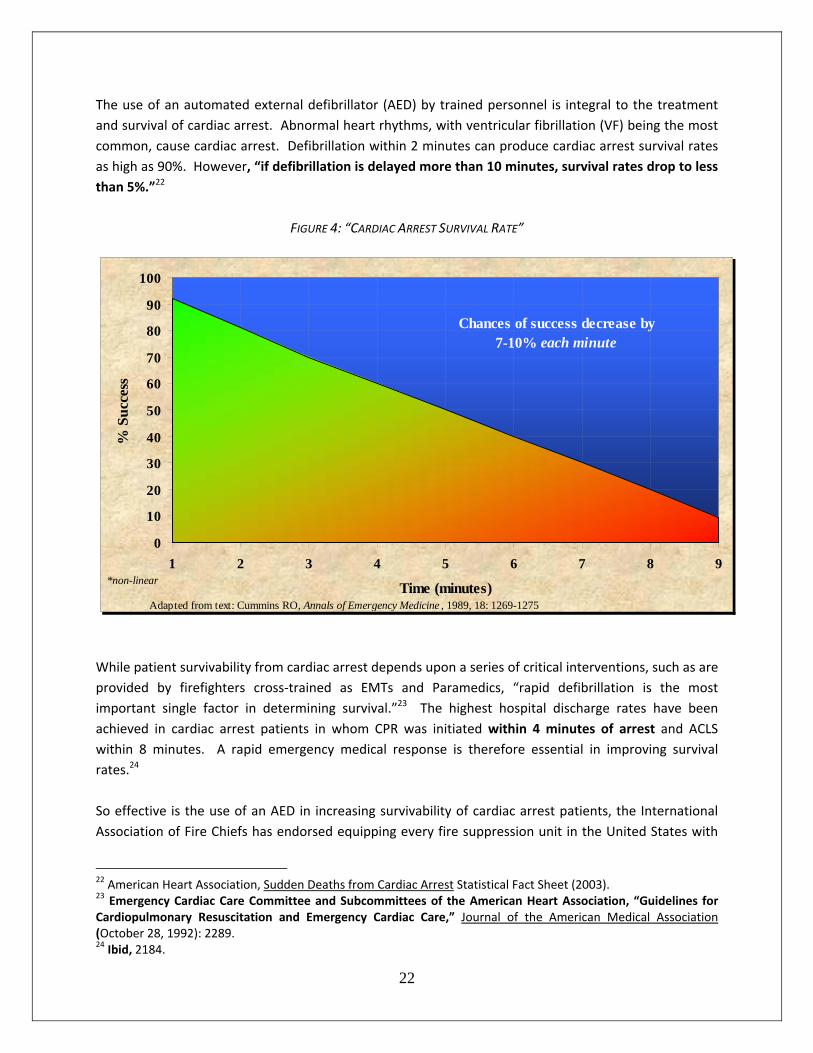
The use of an automated external defibrillator (AED) by trained personnel is integral to the treatment
and survival of cardiac arrest. Abnormal heart rhythms, with ventricular fibrillation (VF) being the most
common, cause cardiac arrest. Defibrillation within 2 minutes can produce cardiac arrest survival rates
as high as 90%. However, “if defibrillation is delayed more than 10 minutes, survival rates drop to less
than 5%.”22
FIGURE 4: “CARDIAC ARREST SURVIVAL RATE”
While patient survivability from cardiac arrest depends upon a series of critical interventions, such as are
provided by firefighters cross‐trained as EMTs and Paramedics, “rapid defibrillation is the most
important single factor in determining survival.”23 The highest hospital discharge rates have been
achieved in cardiac arrest patients in whom CPR was initiated within 4 minutes of arrest and ACLS
within 8 minutes. A rapid emergency medical response is therefore essential in improving survival
rates.24
So effective is the use of an AED in increasing survivability of cardiac arrest patients, the International
Association of Fire Chiefs has endorsed equipping every fire suppression unit in the United States with
22 American Heart Association, Sudden Deaths from Cardiac Arrest Statistical Fact Sheet (2003). 23 Emergency Cardiac Care Committee and Subcommittees of the American Heart Association, “Guidelines for Cardiopulmonary Resuscitation and Emergency Cardiac Care,” Journal of the American Medical Association (October 28, 1992): 2289. 24 Ibid, 2184.
0
10
20
30
40
50
60
70
80
90
100
1 2 3 4 5 6 7 8 9
Time (minutes)
% S
ucc
ess
Chances of success decrease by7-10% each minute
*non-linear
Adapted from text: Cummins RO, Annals of Emergency Medicine , 1989, 18: 1269-1275
23
an automated external defibrillator.25 Mirroring this recommendation, NFPA 1710 states, “the fire
department… shall ensure [that] emergency medical response capability includes personnel, equipment,
and resources to deploy at the first responder level with automatic external defibrillator (AED) or higher
treatment level.”26 In accordance with NFPA Standard 1710, Section 4.3.2, the Galveston Fire
Department equips all of its ambulances and the suppression units with AEDs and ensures all fire
fighters are trained in their proper and effective operation. 27
Moreover, the NFPA 1710 Standard requires that a “fire department shall establish the response time
objectives of 4 minutes or less for the arrival of a unit with first responder or higher capability at an
emergency medical incident.”28
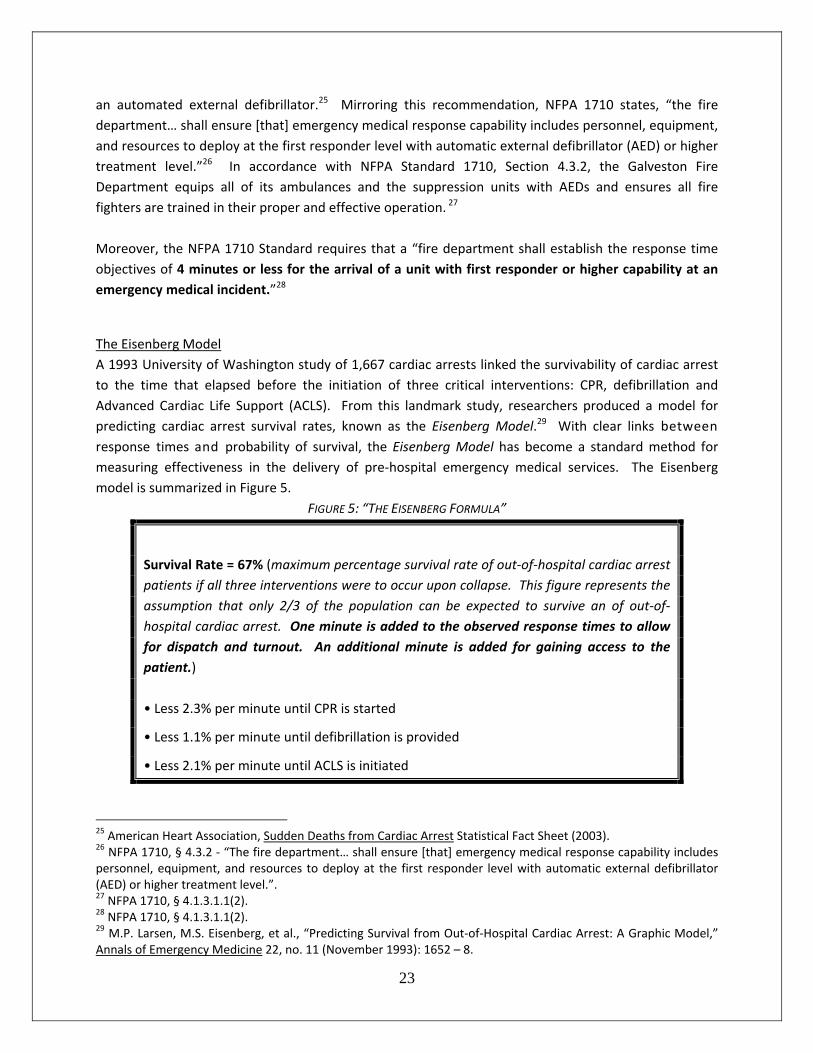
The Eisenberg Model
A 1993 University of Washington study of 1,667 cardiac arrests linked the survivability of cardiac arrest
to the time that elapsed before the initiation of three critical interventions: CPR, defibrillation and
Advanced Cardiac Life Support (ACLS). From this landmark study, researchers produced a model for
predicting cardiac arrest survival rates, known as the Eisenberg Model.29 With clear links between
response times and probability of survival, the Eisenberg Model has become a standard method for
measuring effectiveness in the delivery of pre‐hospital emergency medical services. The Eisenberg
model is summarized in Figure 5.
FIGURE 5: “THE EISENBERG FORMULA”
Survival Rate = 67% (maximum percentage survival rate of out‐of‐hospital cardiac arrest
patients if all three interventions were to occur upon collapse. This figure represents the
assumption that only 2/3 of the population can be expected to survive an of out‐of‐
hospital cardiac arrest. One minute is added to the observed response times to allow
for dispatch and turnout. An additional minute is added for gaining access to the
patient.)
• Less 2.3% per minute until CPR is started
• Less 1.1% per minute until defibrillation is provided
• Less 2.1% per minute until ACLS is initiated
25 American Heart Association, Sudden Deaths from Cardiac Arrest Statistical Fact Sheet (2003). 26 NFPA 1710, § 4.3.2 ‐ “The fire department… shall ensure [that] emergency medical response capability includes personnel, equipment, and resources to deploy at the first responder level with automatic external defibrillator (AED) or higher treatment level.”. 27 NFPA 1710, § 4.1.3.1.1(2). 28 NFPA 1710, § 4.1.3.1.1(2). 29 M.P. Larsen, M.S. Eisenberg, et al., “Predicting Survival from Out‐of‐Hospital Cardiac Arrest: A Graphic Model,” Annals of Emergency Medicine 22, no. 11 (November 1993): 1652 – 8.
24
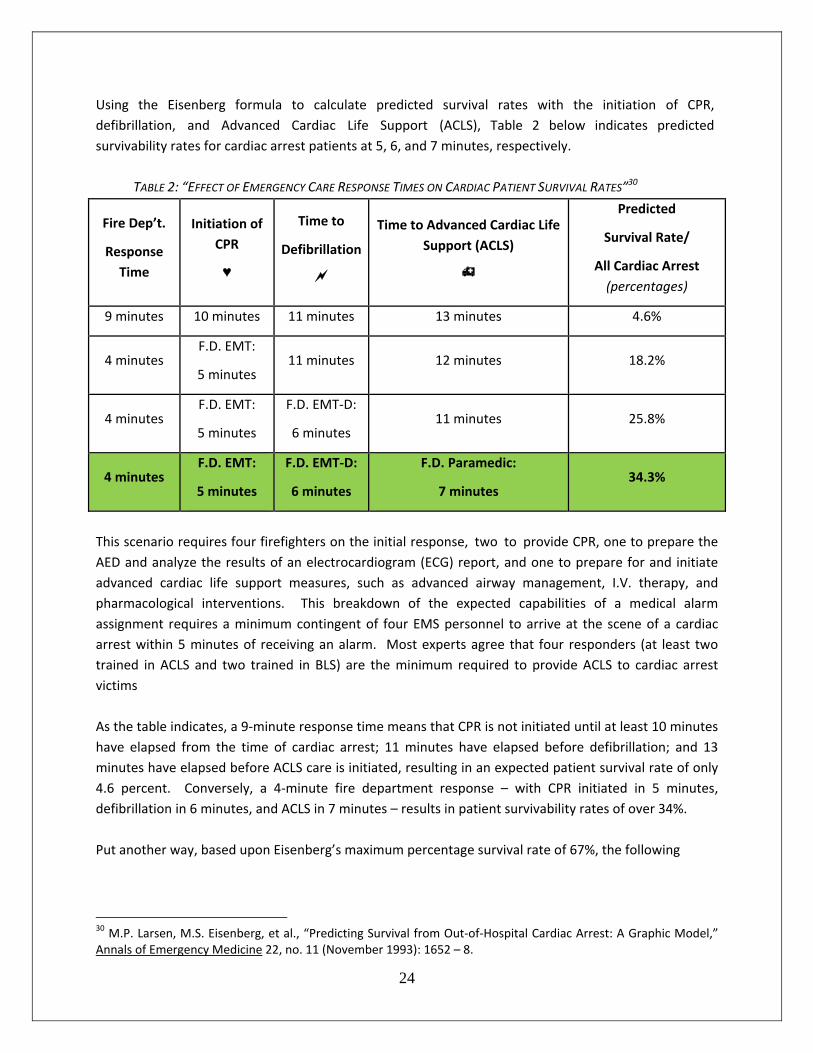
Using the Eisenberg formula to calculate predicted survival rates with the initiation of CPR,
defibrillation, and Advanced Cardiac Life Support (ACLS), Table 2 below indicates predicted
survivability rates for cardiac arrest patients at 5, 6, and 7 minutes, respectively.
TABLE 2: “EFFECT OF EMERGENCY CARE RESPONSE TIMES ON CARDIAC PATIENT SURVIVAL RATES”30
Fire Dep’t.
Response
Time
Initiation of
CPR
♥
Time to
Defibrillation
Time to Advanced Cardiac Life
Support (ACLS)
Predicted
Survival Rate/
All Cardiac Arrest
(percentages)
9 minutes 10 minutes 11 minutes 13 minutes 4.6%
4 minutes F.D. EMT:
5 minutes 11 minutes 12 minutes 18.2%
4 minutes F.D. EMT:
5 minutes
F.D. EMT‐D:
6 minutes 11 minutes 25.8%
4 minutes F.D. EMT:
5 minutes
F.D. EMT‐D:
6 minutes
F.D. Paramedic:
7 minutes 34.3%
This scenario requires four firefighters on the initial response, two to provide CPR, one to prepare the
AED and analyze the results of an electrocardiogram (ECG) report, and one to prepare for and initiate
advanced cardiac life support measures, such as advanced airway management, I.V. therapy, and
pharmacological interventions. This breakdown of the expected capabilities of a medical alarm
assignment requires a minimum contingent of four EMS personnel to arrive at the scene of a cardiac
arrest within 5 minutes of receiving an alarm. Most experts agree that four responders (at least two
trained in ACLS and two trained in BLS) are the minimum required to provide ACLS to cardiac arrest
victims
As the table indicates, a 9‐minute response time means that CPR is not initiated until at least 10 minutes
have elapsed from the time of cardiac arrest; 11 minutes have elapsed before defibrillation; and 13
minutes have elapsed before ACLS care is initiated, resulting in an expected patient survival rate of only
4.6 percent. Conversely, a 4‐minute fire department response – with CPR initiated in 5 minutes,
defibrillation in 6 minutes, and ACLS in 7 minutes – results in patient survivability rates of over 34%.
Put another way, based upon Eisenberg’s maximum percentage survival rate of 67%, the following
30 M.P. Larsen, M.S. Eisenberg, et al., “Predicting Survival from Out‐of‐Hospital Cardiac Arrest: A Graphic Model,” Annals of Emergency Medicine 22, no. 11 (November 1993): 1652 – 8.
25
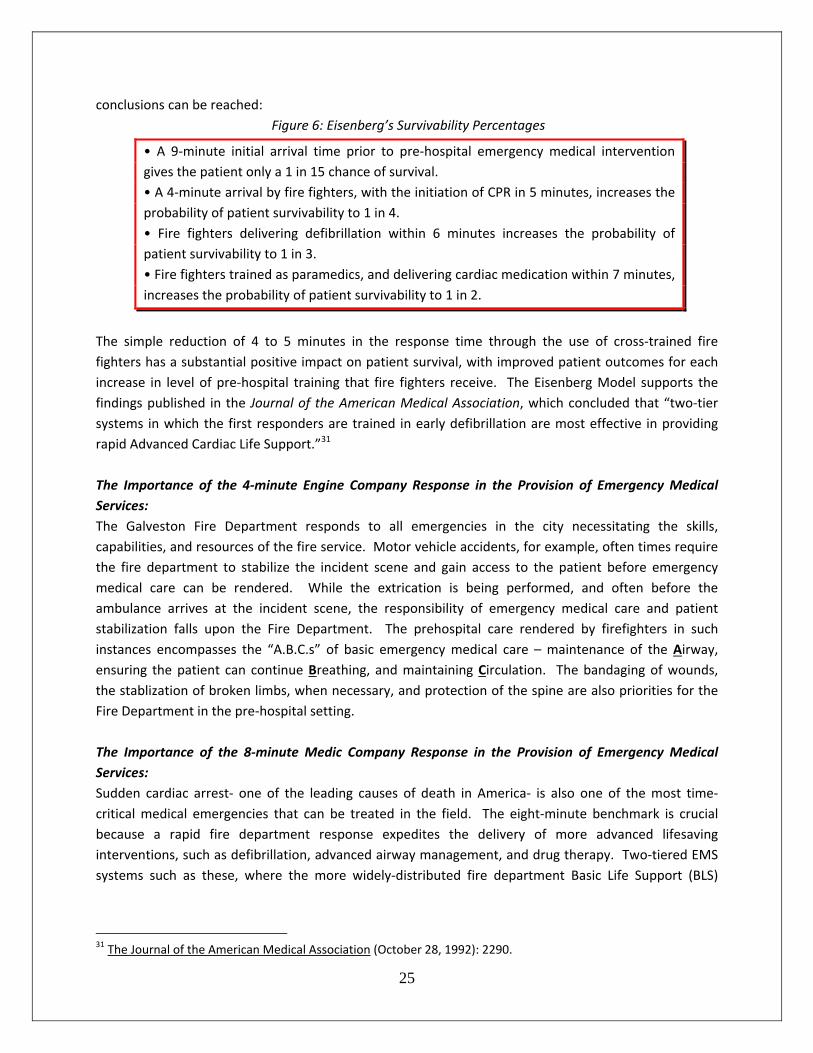
conclusions can be reached:
Figure 6: Eisenberg’s Survivability Percentages
• A 9‐minute initial arrival time prior to pre‐hospital emergency medical intervention
gives the patient only a 1 in 15 chance of survival.
• A 4‐minute arrival by fire fighters, with the initiation of CPR in 5 minutes, increases the
probability of patient survivability to 1 in 4.
• Fire fighters delivering defibrillation within 6 minutes increases the probability of
patient survivability to 1 in 3.
• Fire fighters trained as paramedics, and delivering cardiac medication within 7 minutes,
increases the probability of patient survivability to 1 in 2.
The simple reduction of 4 to 5 minutes in the response time through the use of cross‐trained fire
fighters has a substantial positive impact on patient survival, with improved patient outcomes for each
increase in level of pre‐hospital training that fire fighters receive. The Eisenberg Model supports the
findings published in the Journal of the American Medical Association, which concluded that “two‐tier
systems in which the first responders are trained in early defibrillation are most effective in providing
rapid Advanced Cardiac Life Support.”31
The Importance of the 4‐minute Engine Company Response in the Provision of Emergency Medical
Services:
The Galveston Fire Department responds to all emergencies in the city necessitating the skills,
capabilities, and resources of the fire service. Motor vehicle accidents, for example, often times require
the fire department to stabilize the incident scene and gain access to the patient before emergency
medical care can be rendered. While the extrication is being performed, and often before the
ambulance arrives at the incident scene, the responsibility of emergency medical care and patient
stabilization falls upon the Fire Department. The prehospital care rendered by firefighters in such
instances encompasses the “A.B.C.s” of basic emergency medical care – maintenance of the Airway,
ensuring the patient can continue Breathing, and maintaining Circulation. The bandaging of wounds,
the stablization of broken limbs, when necessary, and protection of the spine are also priorities for the
Fire Department in the pre‐hospital setting.
The Importance of the 8‐minute Medic Company Response in the Provision of Emergency Medical
Services:
Sudden cardiac arrest‐ one of the leading causes of death in America‐ is also one of the most time‐
critical medical emergencies that can be treated in the field. The eight‐minute benchmark is crucial
because a rapid fire department response expedites the delivery of more advanced lifesaving
interventions, such as defibrillation, advanced airway management, and drug therapy. Two‐tiered EMS
systems such as these, where the more widely‐distributed fire department Basic Life Support (BLS)
31 The Journal of the American Medical Association (October 28, 1992): 2290.
26
providers arrive in advance of Advanced Life Support (ALS) providers, have improved survival rates over
one‐tiered systems, particularly when the first responder provides automated external defibrillation.32
According to the Journal of the American Medical Association, “two‐tier systems in which the first
responders are trained in early defibrillation are most effective in providing rapid Advanced Cardiac Life
Support (ACLS).”33 Cardiac arrest victims have a 33% higher survival rate when Paramedics arrive
within eight minutes, according to the American Heart Association. After eight minutes, the prospects
of recovery decreases rapidly.34 Hence, by gaining access to the scene and ensuring patient stabilization
by initiating CPR, and providing defibrillation and airway management, Galveston firefighters set the
stage for the arrival of ALS units, the provision of ACLS, and the opportunity for increased patient
survivability. A timeline of a typical emergency response to an incident of sudden cardiac arrest is
provided on Page 47: Timeline of a Typical Emergency Response to an Incident of Cardiac Arrest.
32 Analysis of some systems with high survival rates for out‐of‐hospital cardiac arrest reveals common practices of (1) multi‐tiered systems deployed by a 911 priority dispatch system, (2) aggressive use of fire department apparatus for first response and automated defibrillation, (3) intensive medical supervision, and (4) widespread citizen awareness and CPR training. 33 The Journal of the American Medical Association (October 28, 1992): 2290. 34 Matthew Cella, “Response Rate of EMS Declines,” The Washington Times, 1 April 2003.
27
ADVANTAGES OF FIRE BASED EMS
Fire/EMS Response Effectiveness
The fire service’s wide range of capabilities enables fire department personnel to respond effectively to
diverse incidents, including victim search and rescue, extrication, hazardous materials releases, and
natural disasters, to name but a few. Fire fighters are uniquely trained and equipped to effectively
handle the most time‐critical emergency on scene. Owing to their strategic distribution throughout a
given community, the responsibility to respond to medical emergencies is often delegated to multi‐role
fire fighters cross‐trained as emergency medical technicians (EMTs).
Recognizing the importance of a rapid response to increased survivability rates from cardiac arrests and
other medical emergencies, the NFPA 1710 Standard requires that a “fire department shall establish the
response time objectives of 4 minutes or less for the arrival of a unit with first responder or higher
capability at an emergency medical incident.”35 While patient survivability from cardiac arrest depends
upon a series of critical interventions such as those provided by fire fighter/EMT’s, “rapid defibrillation is
the most important single factor in determining survival.”36 Abnormal heart rhythms, with ventricular
fibrillation (VF) being the most common, cause cardiac arrest. The highest hospital discharge rates have
been achieved in cardiac arrest patients in whom CPR was initiated within 4 minutes of arrest and ACLS
within 8 minutes. A rapid emergency medical response is therefore essential in improving survival
rates.37
Emergency Response System Design
This proposal outlines an EMS system design that would improve local pre‐hospital care services. As a
result of system implementation, the City of Galveston will achieve the following system
enhancements:
Enhance emergency medical response and transport by deploying ALS transport capable
vehicles in addition to the deployed Engine Companies in the City of Galveston.
An integrated fire‐based EMS system will allow the GFD to respond, treat, and transport
patients rather than handing those patients off to another provider, promoting continuity of
care.
35 NFPA 1710, § 4.1.3.1.1(2). 36 Emergency Cardiac Care Committee and Subcommittees of the American Heart Association, “Guidelines for Cardiopulmonary Resuscitation and Emergency Cardiac Care,” Journal of the American Medical Association (October 28, 1992): 2289. 37 Emergency Cardiac Care Committee and Subcommittees of the American Heart Association, “Guidelines for Cardiopulmonary Resuscitation and Emergency Cardiac Care,” Journal of the American Medical Association (October 28, 1992): 2184.
28
Fire Chief control of fire suppression, rescue, and EMS services for the municipality.
More efficient use of tax dollars, increased productivity, and enhanced fire/EMS capabilities
through the use of cross‐trained/multi role firefighters providing two essential services within
one department.
The Medical Direction system will remain intact to ensure direct medical control, training and
quality assessment/control for all pre‐hospital care. The Medical Director will maintain complete
control over all clinical patient care and transport protocols.
A Fire Based EMS system design allows responding personnel to handle the most time critical
emergency, be it fire suppression, rescue, or medical emergency.
Cross‐trained/multi‐role personnel may be rotated between response and transport vehicles,
allowing the city to maintain the 7(k) exemption under FLSA38.
Cross‐trained/multi‐role personnel assigned to the transport units and equipped with fire
suppression protective gear are available to enhance fire protection activities as necessary,
including compliance with the federal OSHA “2 In/2 Out” regulations for fire suppression,
rescue, or medical emergency.
System Design Objectives:
The proposed models will allow the GFD to implement ALS response and transport services with a
moderate investment in personnel and capital equipment, which will be recouped within two to three
year39. Through a multi‐step transition, the GFD will assume Advanced Life Support response and patient
transportation. Following is a planning template/checklist outlining the objectives that must be met in
order to implement the Galveston Fire Department‐Based EMS system. Many of these objectives may
be pursued and accomplished simultaneously.
The City of Galveston establishes an enterprise fund account through which ambulance transportation costs and revenue are coordinated. Start‐up costs would be budgeted and placed in this special fund, to be replaced by ambulance transportation revenue as it becomes available. For example, budget start‐up costs plus six months of operations costs ($2,974,519.7540) would be deposited to the fund to cover the delay between billing for services provided and actual collection of transport revenue. Revenue
38 Section 7(k) of the FLSA provides a partial overtime exemption for fire protection personnel who are employed by public agencies on a work period basis, employed by an organized fire department or fire protection district, who have been trained to the extent required by state statute or local ordinance, who have the legal authority and responsibility to engage in the prevention, control, or extinguishment of fires, including such non‐firefighting activities as housekeeping, equipment maintenance, etc. This also includes rescue and ambulance personnel that form an integral part of the public agency’s fire protection activities 29CFR 553.210(a). 39 See Summary table on page 42. 40 See “Start Up Budget and Six Month Operation Costs” on page 46.
29
accumulated in this fund would be solely dedicated for further maintenance and improvements of the Fire and EMS system, as determined by fire department administration.
Galveston Fire Department secures all necessary authorization from the Texas State
Department of Health;
Galveston Fire Department secures all necessary equipment from various vendors to
provide ALS patient transportation;
Galveston Fire Department hires 31 FF/Paramedics as full‐time employees of the GFD.
Upon completion of employee training/orientation, Galveston Fire Department assumes
responsibility for Advanced Life Support Response and Patient Transportation;
Galveston Fire Department fills select future vacancies with FF/EMT‐P’s.
Galveston Fire Department may contract out EMS billing (for an agreeable fee of collected
revenue) so that the City of Galveston will receive maximum monetary benefits;
EMS Advanced Life Support (ALS) continuing education begins for selected department
personnel. This training will begin immediately for the certified Paramedics and will be
conducted by EMS training coordinators.
The integration of ALS transport services into the Galveston Fire Department will provide:
A commitment to clinical and professional standards and staffing requirements through
innovative staffing, human relations, leadership, and clinical training;
A commitment to operate under the City’s command and control structure and policies
with the integrated approach to EMS;
A comprehensive personnel training program that not only meets but exceeds State and
Federal requirements;
A commitment to meet and exceed current medical protocols, policies and procedures by
working closely with all EMS stakeholders to constantly improve the quality of EMS
delivered;
A successful recruitment, screening, and orientation program that will attract the best
medical personnel to serve the City of Galveston;

30
31
STAFFING AND DEPLOYMENT ANALYSIS
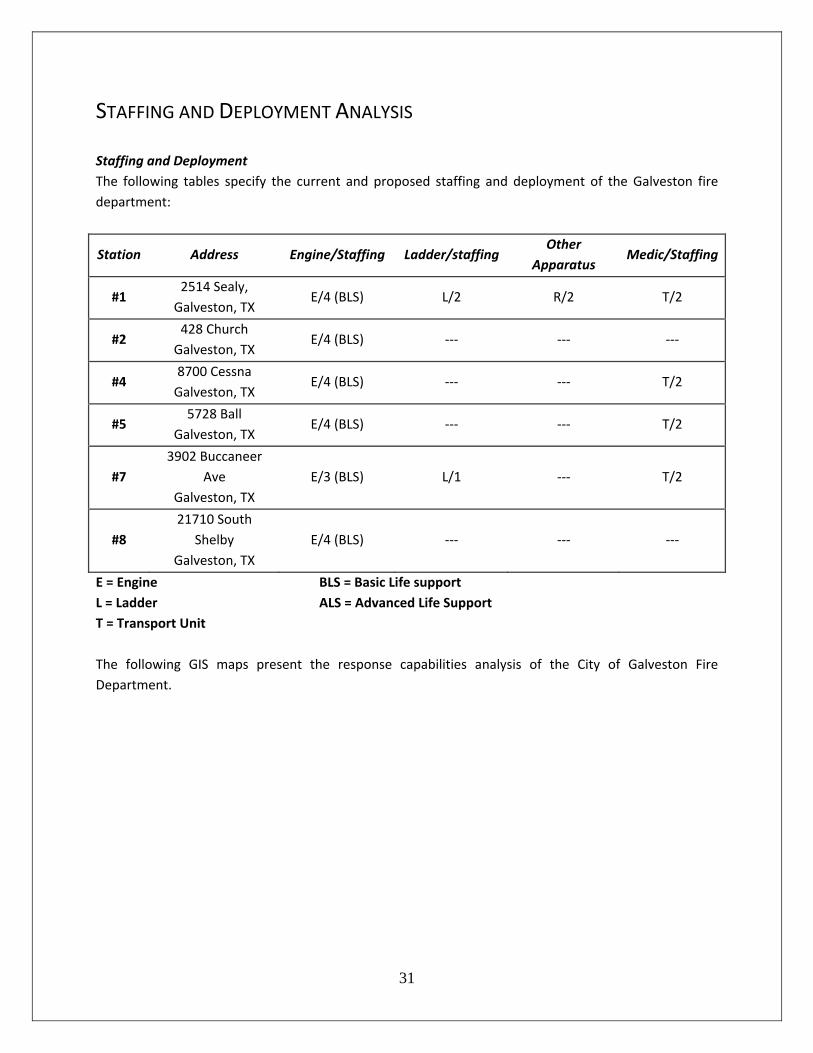
Staffing and Deployment
The following tables specify the current and proposed staffing and deployment of the Galveston fire
department:
Station Address Engine/Staffing Ladder/staffing Other
Apparatus Medic/Staffing
#1 2514 Sealy,
Galveston, TX E/4 (BLS) L/2 R/2 T/2
#2 428 Church
Galveston, TX E/4 (BLS) ‐‐‐ ‐‐‐ ‐‐‐
#4 8700 Cessna
Galveston, TX E/4 (BLS) ‐‐‐ ‐‐‐ T/2
#5 5728 Ball
Galveston, TX E/4 (BLS) ‐‐‐ ‐‐‐ T/2
#7
3902 Buccaneer
Ave
Galveston, TX
E/3 (BLS) L/1 ‐‐‐ T/2
#8
21710 South
Shelby
Galveston, TX
E/4 (BLS) ‐‐‐ ‐‐‐ ‐‐‐
E = Engine
L = Ladder
T = Transport Unit
BLS = Basic Life support
ALS = Advanced Life Support
The following GIS maps present the response capabilities analysis of the City of Galveston Fire
Department.
32
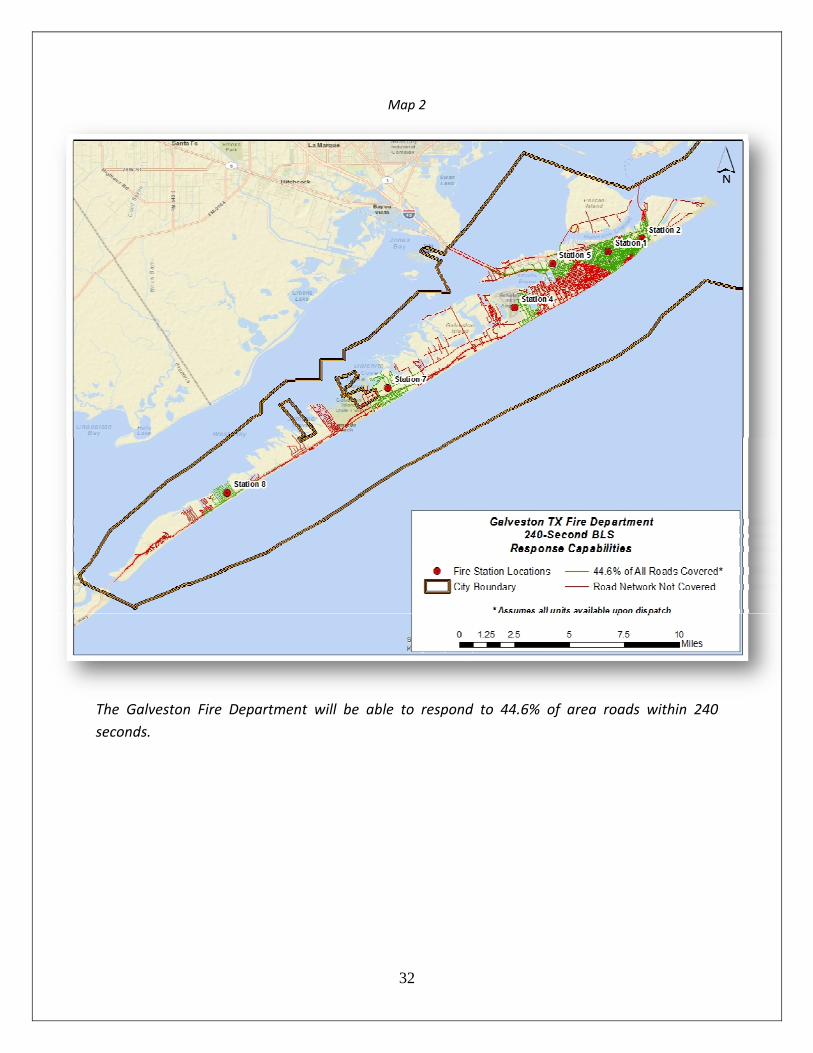
Map 2
The Galveston Fire Department will be able to respond to 44.6% of area roads within 240
seconds.

33
Map 3
The current Galveston EMS provider is capable of responding to 64.5% of area roads within 480
seconds.
34
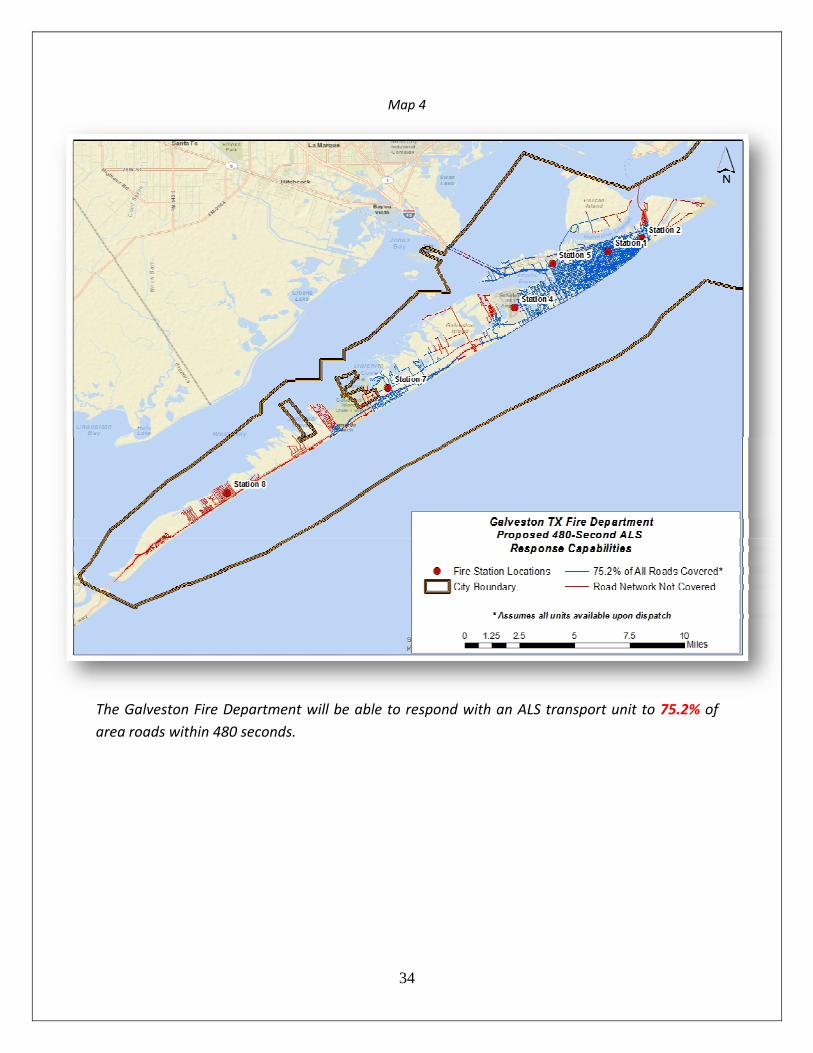
Map 4
The Galveston Fire Department will be able to respond with an ALS transport unit to 75.2% of
area roads within 480 seconds.
35
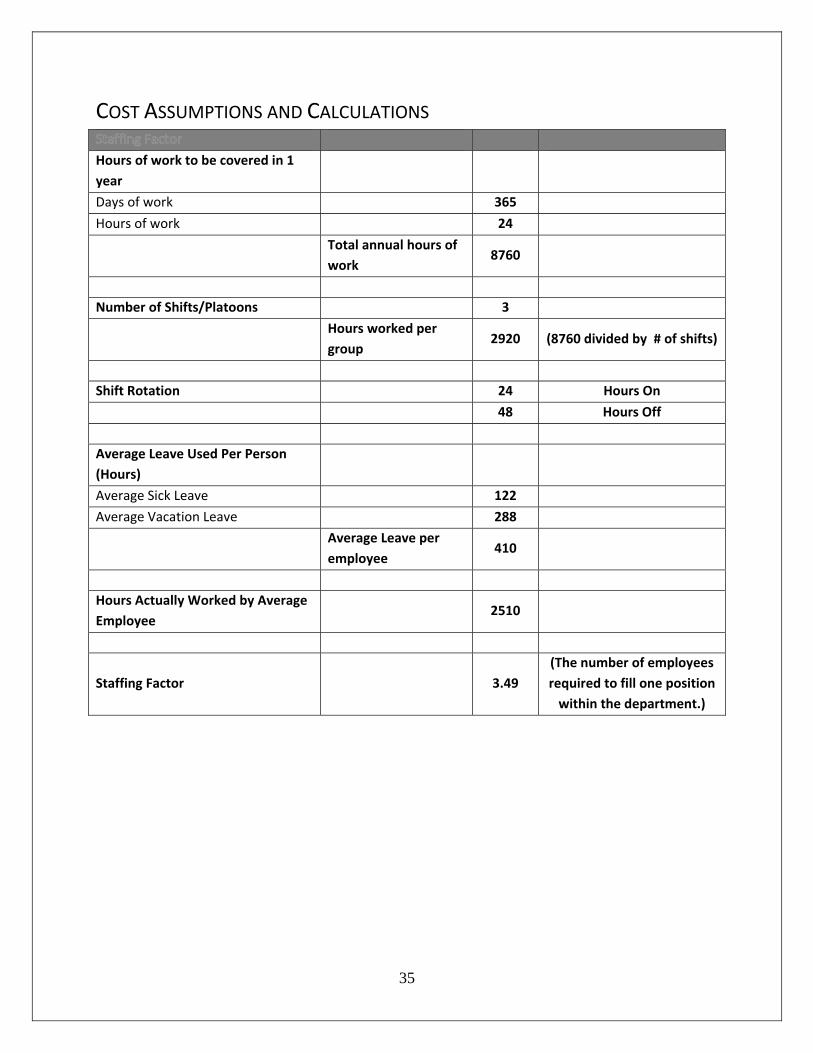
COST ASSUMPTIONS AND CALCULATIONS
Hours of work to be covered in 1
year
Days of work 365
Hours of work 24
Total annual hours of
work 8760
Number of Shifts/Platoons 3
Hours worked per
group 2920 (8760 divided by # of shifts)
Shift Rotation 24 Hours On
48 Hours Off
Average Leave Used Per Person
(Hours)
Average Sick Leave 122
Average Vacation Leave 288
Average Leave per
employee 410
Hours Actually Worked by Average
Employee 2510
Staffing Factor
3.49
(The number of employees
required to fill one position
within the department.)
36
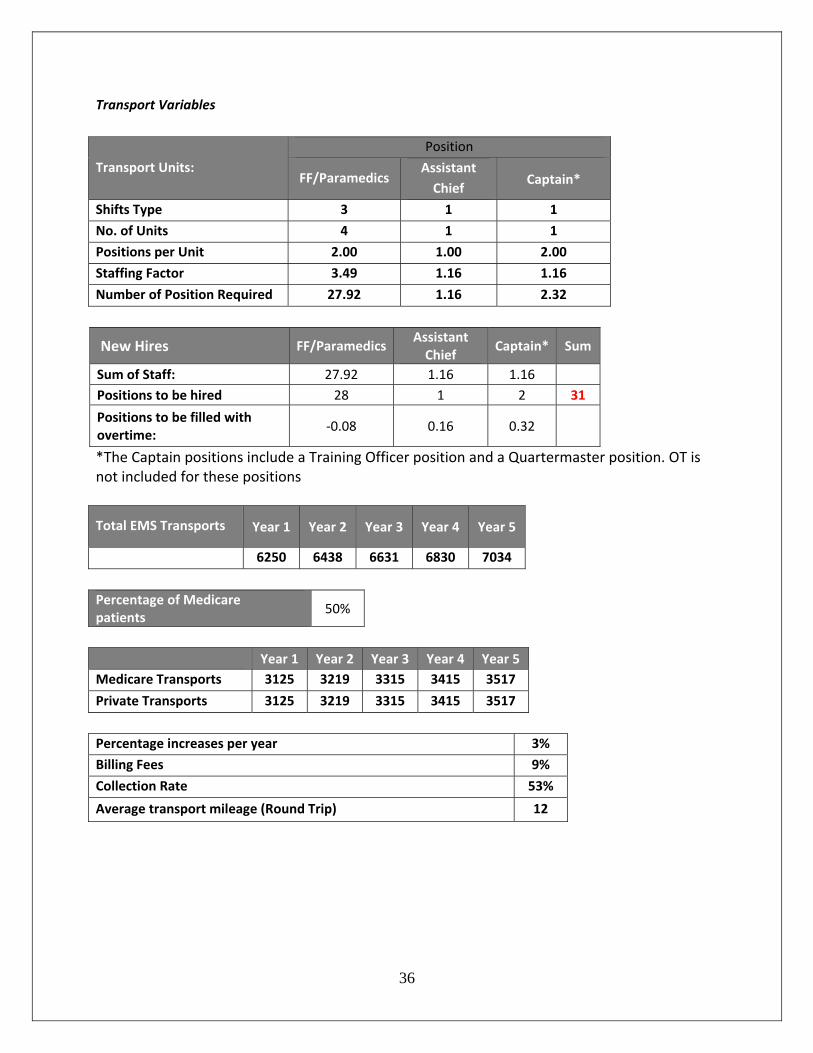
Transport Variables
Transport Units:
Position
FF/Paramedics Assistant
Chief Captain*
Shifts Type 3 1 1
No. of Units 4 1 1
Positions per Unit 2.00 1.00 2.00
Staffing Factor 3.49 1.16 1.16
Number of Position Required 27.92 1.16 2.32
New Hires FF/ParamedicsAssistant Chief
Captain* Sum
Sum of Staff: 27.92 1.16 1.16
Positions to be hired 28 1 2 31
Positions to be filled with overtime:
‐0.08 0.16 0.32
*The Captain positions include a Training Officer position and a Quartermaster position. OT is not included for these positions
Total EMS Transports Year 1 Year 2 Year 3 Year 4 Year 5
6250 6438 6631 6830 7034
Percentage of Medicare patients
50%
Year 1 Year 2 Year 3 Year 4 Year 5
Medicare Transports 3125 3219 3315 3415 3517
Private Transports 3125 3219 3315 3415 3517
Percentage increases per year 3%
Billing Fees 9%
Collection Rate 53%
Average transport mileage (Round Trip) 12
37
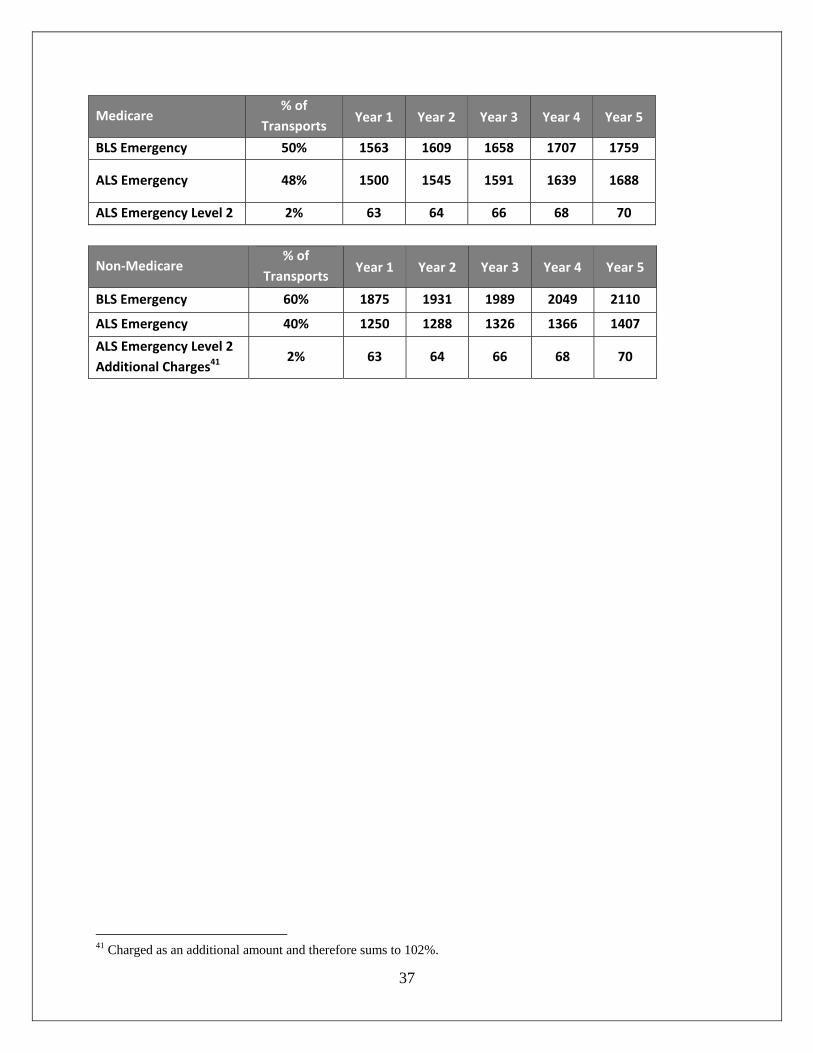
Medicare % of
Transports Year 1 Year 2 Year 3 Year 4 Year 5
BLS Emergency 50% 1563 1609 1658 1707 1759
ALS Emergency 48% 1500 1545 1591 1639 1688
ALS Emergency Level 2 2% 63 64 66 68 70
Non‐Medicare % of
Transports Year 1 Year 2 Year 3 Year 4 Year 5
BLS Emergency 60% 1875 1931 1989 2049 2110
ALS Emergency 40% 1250 1288 1326 1366 1407
ALS Emergency Level 2
Additional Charges41 2% 63 64 66 68 70
41 Charged as an additional amount and therefore sums to 102%.
38
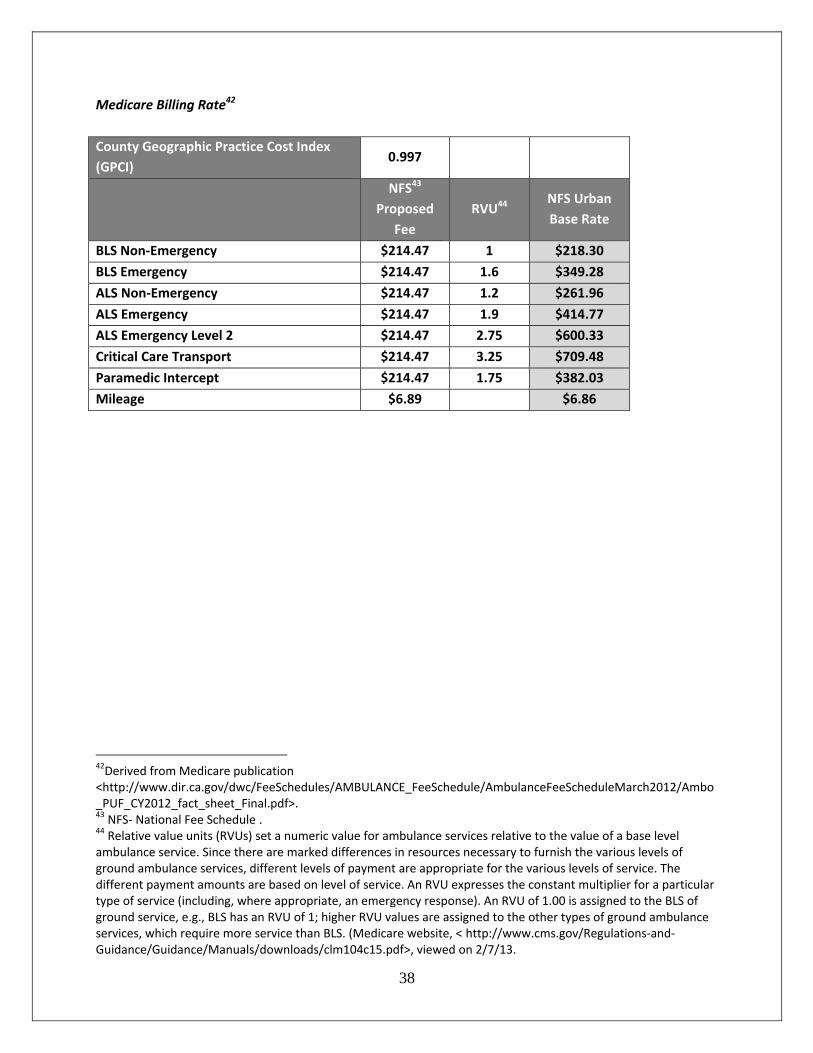
Medicare Billing Rate42
County Geographic Practice Cost Index
(GPCI) 0.997
NFS43
Proposed
Fee
RVU44 NFS Urban
Base Rate
BLS Non‐Emergency $214.47 1 $218.30
BLS Emergency $214.47 1.6 $349.28
ALS Non‐Emergency $214.47 1.2 $261.96
ALS Emergency $214.47 1.9 $414.77
ALS Emergency Level 2 $214.47 2.75 $600.33
Critical Care Transport $214.47 3.25 $709.48
Paramedic Intercept $214.47 1.75 $382.03
Mileage $6.89 $6.86
42Derived from Medicare publication <http://www.dir.ca.gov/dwc/FeeSchedules/AMBULANCE_FeeSchedule/AmbulanceFeeScheduleMarch2012/Ambo_PUF_CY2012_fact_sheet_Final.pdf>. 43 NFS‐ National Fee Schedule . 44 Relative value units (RVUs) set a numeric value for ambulance services relative to the value of a base level ambulance service. Since there are marked differences in resources necessary to furnish the various levels of ground ambulance services, different levels of payment are appropriate for the various levels of service. The different payment amounts are based on level of service. An RVU expresses the constant multiplier for a particular type of service (including, where appropriate, an emergency response). An RVU of 1.00 is assigned to the BLS of ground service, e.g., BLS has an RVU of 1; higher RVU values are assigned to the other types of ground ambulance services, which require more service than BLS. (Medicare website, < http://www.cms.gov/Regulations‐and‐Guidance/Guidance/Manuals/downloads/clm104c15.pdf>, viewed on 2/7/13.
39
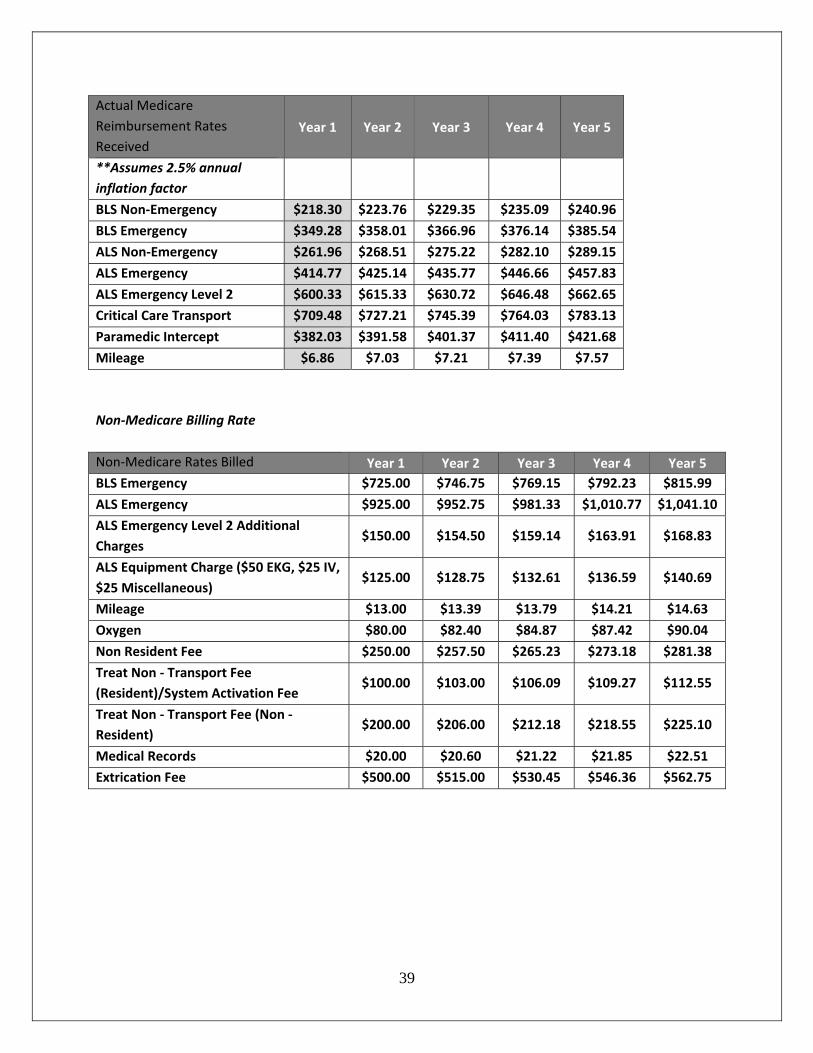
Actual Medicare
Reimbursement Rates
Received
Year 1 Year 2 Year 3 Year 4 Year 5
**Assumes 2.5% annual
inflation factor
BLS Non‐Emergency $218.30 $223.76 $229.35 $235.09 $240.96
BLS Emergency $349.28 $358.01 $366.96 $376.14 $385.54
ALS Non‐Emergency $261.96 $268.51 $275.22 $282.10 $289.15
ALS Emergency $414.77 $425.14 $435.77 $446.66 $457.83
ALS Emergency Level 2 $600.33 $615.33 $630.72 $646.48 $662.65
Critical Care Transport $709.48 $727.21 $745.39 $764.03 $783.13
Paramedic Intercept $382.03 $391.58 $401.37 $411.40 $421.68
Mileage $6.86 $7.03 $7.21 $7.39 $7.57
Non‐Medicare Billing Rate
Non‐Medicare Rates Billed Year 1 Year 2 Year 3 Year 4 Year 5
BLS Emergency $725.00 $746.75 $769.15 $792.23 $815.99
ALS Emergency $925.00 $952.75 $981.33 $1,010.77 $1,041.10
ALS Emergency Level 2 Additional
Charges $150.00 $154.50 $159.14 $163.91 $168.83
ALS Equipment Charge ($50 EKG, $25 IV,
$25 Miscellaneous) $125.00 $128.75 $132.61 $136.59 $140.69
Mileage $13.00 $13.39 $13.79 $14.21 $14.63
Oxygen $80.00 $82.40 $84.87 $87.42 $90.04
Non Resident Fee $250.00 $257.50 $265.23 $273.18 $281.38
Treat Non ‐ Transport Fee
(Resident)/System Activation Fee $100.00 $103.00 $106.09 $109.27 $112.55
Treat Non ‐ Transport Fee (Non ‐
Resident) $200.00 $206.00 $212.18 $218.55 $225.10
Medical Records $20.00 $20.60 $21.22 $21.85 $22.51
Extrication Fee $500.00 $515.00 $530.45 $546.36 $562.75
40
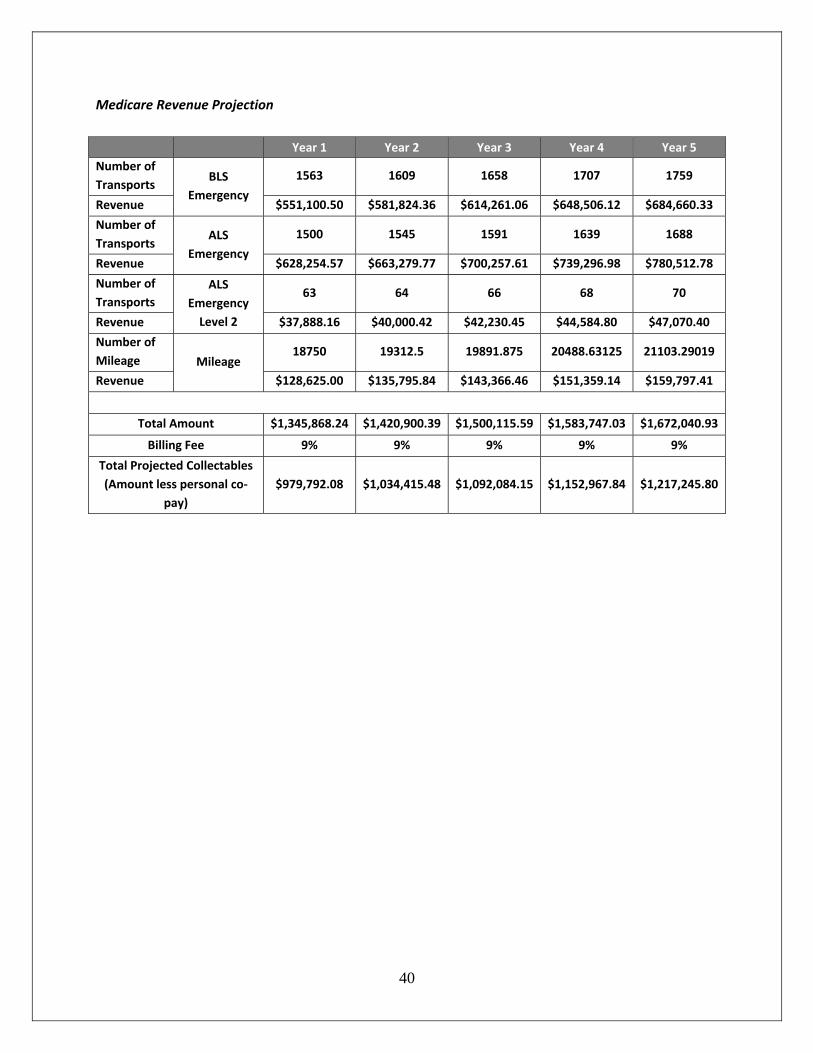
Medicare Revenue Projection
Year 1 Year 2 Year 3 Year 4 Year 5
Number of
Transports BLS
Emergency
1563 1609 1658 1707 1759
Revenue $551,100.50 $581,824.36 $614,261.06 $648,506.12 $684,660.33
Number of
Transports ALS
Emergency
1500 1545 1591 1639 1688
Revenue $628,254.57 $663,279.77 $700,257.61 $739,296.98 $780,512.78
Number of
Transports
ALS
Emergency
Level 2
63 64 66 68 70
Revenue $37,888.16 $40,000.42 $42,230.45 $44,584.80 $47,070.40
Number of
Mileage Mileage 18750 19312.5 19891.875 20488.63125 21103.29019
Revenue $128,625.00 $135,795.84 $143,366.46 $151,359.14 $159,797.41
Total Amount $1,345,868.24 $1,420,900.39 $1,500,115.59 $1,583,747.03 $1,672,040.93
Billing Fee 9% 9% 9% 9% 9%
Total Projected Collectables
(Amount less personal co‐
pay)
$979,792.08 $1,034,415.48 $1,092,084.15 $1,152,967.84 $1,217,245.80
41
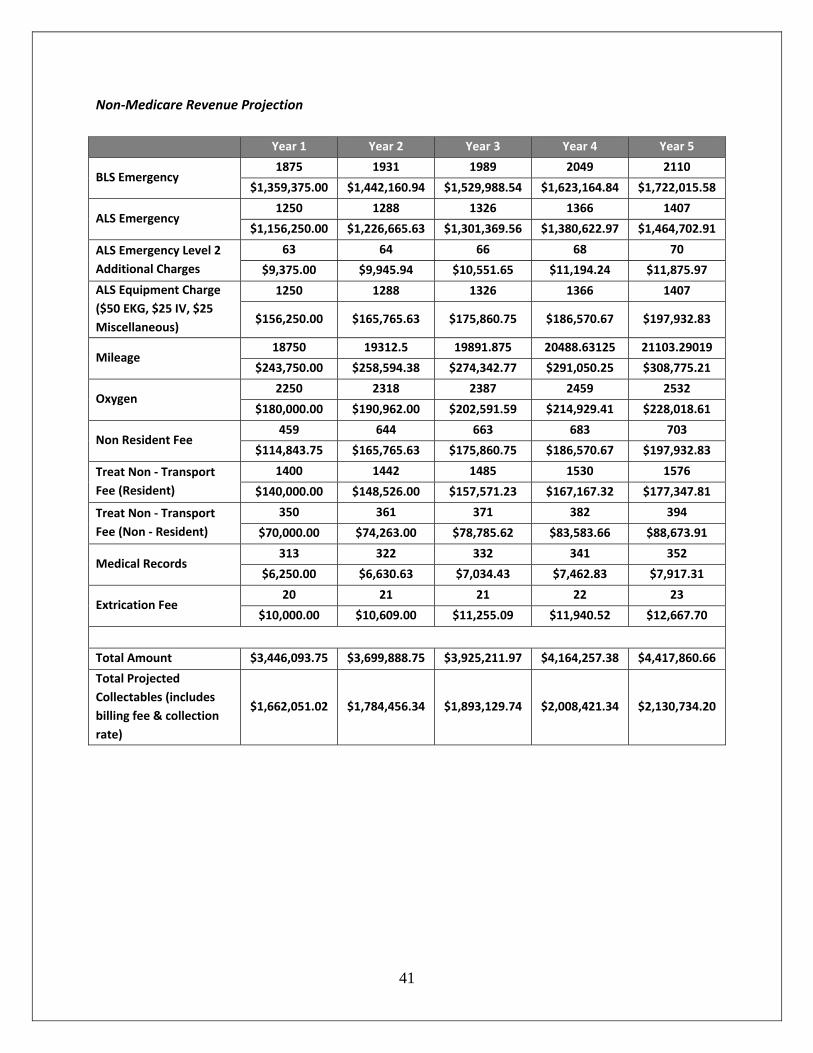
Non‐Medicare Revenue Projection
Year 1 Year 2 Year 3 Year 4 Year 5
BLS Emergency 1875 1931 1989 2049 2110
$1,359,375.00 $1,442,160.94 $1,529,988.54 $1,623,164.84 $1,722,015.58
ALS Emergency 1250 1288 1326 1366 1407
$1,156,250.00 $1,226,665.63 $1,301,369.56 $1,380,622.97 $1,464,702.91
ALS Emergency Level 2
Additional Charges
63 64 66 68 70
$9,375.00 $9,945.94 $10,551.65 $11,194.24 $11,875.97
ALS Equipment Charge
($50 EKG, $25 IV, $25
Miscellaneous)
1250 1288 1326 1366 1407
$156,250.00 $165,765.63 $175,860.75 $186,570.67 $197,932.83
Mileage 18750 19312.5 19891.875 20488.63125 21103.29019
$243,750.00 $258,594.38 $274,342.77 $291,050.25 $308,775.21
Oxygen 2250 2318 2387 2459 2532
$180,000.00 $190,962.00 $202,591.59 $214,929.41 $228,018.61
Non Resident Fee 459 644 663 683 703
$114,843.75 $165,765.63 $175,860.75 $186,570.67 $197,932.83
Treat Non ‐ Transport
Fee (Resident)
1400 1442 1485 1530 1576
$140,000.00 $148,526.00 $157,571.23 $167,167.32 $177,347.81
Treat Non ‐ Transport
Fee (Non ‐ Resident)
350 361 371 382 394
$70,000.00 $74,263.00 $78,785.62 $83,583.66 $88,673.91
Medical Records 313 322 332 341 352
$6,250.00 $6,630.63 $7,034.43 $7,462.83 $7,917.31
Extrication Fee 20 21 21 22 23
$10,000.00 $10,609.00 $11,255.09 $11,940.52 $12,667.70
Total Amount $3,446,093.75 $3,699,888.75 $3,925,211.97 $4,164,257.38 $4,417,860.66
Total Projected
Collectables (includes
billing fee & collection
rate)
$1,662,051.02 $1,784,456.34 $1,893,129.74 $2,008,421.34 $2,130,734.20
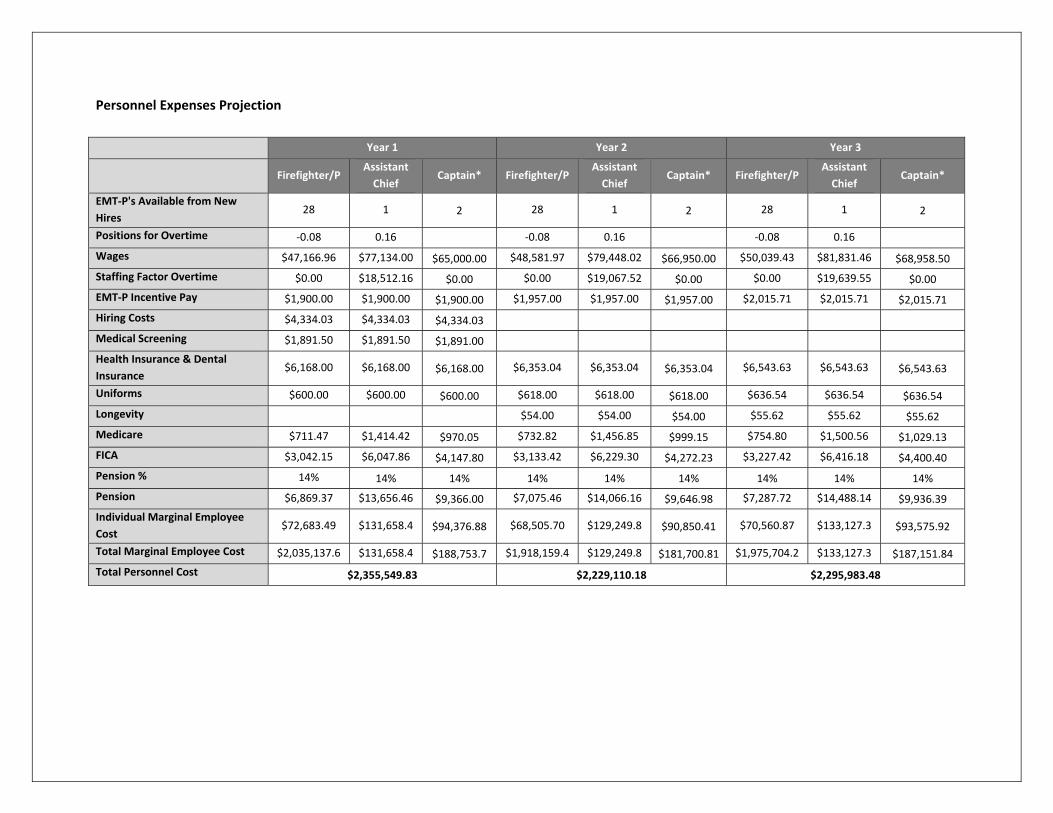
Personnel Expenses Projection
Year 1 Year 2 Year 3
Firefighter/P
Assistant
Chief Captain* Firefighter/P
Assistant
Chief Captain* Firefighter/P
Assistant
Chief Captain*
EMT‐P's Available from New
Hires 28 1 2 28 1 2 28 1 2
Positions for Overtime ‐0.08 0.16 ‐0.08 0.16 ‐0.08 0.16
Wages $47,166.96 $77,134.00 $65,000.00 $48,581.97 $79,448.02 $66,950.00 $50,039.43 $81,831.46 $68,958.50
Staffing Factor Overtime $0.00 $18,512.16 $0.00 $0.00 $19,067.52 $0.00 $0.00 $19,639.55 $0.00
EMT‐P Incentive Pay $1,900.00 $1,900.00 $1,900.00 $1,957.00 $1,957.00 $1,957.00 $2,015.71 $2,015.71 $2,015.71
Hiring Costs $4,334.03 $4,334.03 $4,334.03
Medical Screening $1,891.50 $1,891.50 $1,891.00
Health Insurance & Dental
Insurance $6,168.00 $6,168.00 $6,168.00 $6,353.04 $6,353.04 $6,353.04 $6,543.63 $6,543.63 $6,543.63
Uniforms $600.00 $600.00 $600.00 $618.00 $618.00 $618.00 $636.54 $636.54 $636.54
Longevity $54.00 $54.00 $54.00 $55.62 $55.62 $55.62
Medicare $711.47 $1,414.42 $970.05 $732.82 $1,456.85 $999.15 $754.80 $1,500.56 $1,029.13
FICA $3,042.15 $6,047.86 $4,147.80 $3,133.42 $6,229.30 $4,272.23 $3,227.42 $6,416.18 $4,400.40
Pension % 14% 14% 14% 14% 14% 14% 14% 14% 14% Pension $6,869.37 $13,656.46 $9,366.00 $7,075.46 $14,066.16 $9,646.98 $7,287.72 $14,488.14 $9,936.39
Individual Marginal Employee
Cost $72,683.49 $131,658.4 $94,376.88 $68,505.70 $129,249.8 $90,850.41 $70,560.87 $133,127.3 $93,575.92
Total Marginal Employee Cost $2,035,137.6 $131,658.4 $188,753.7 $1,918,159.4 $129,249.8 $181,700.81 $1,975,704.2 $133,127.3 $187,151.84
Total Personnel Cost $2,355,549.83 $2,229,110.18 $2,295,983.48
43
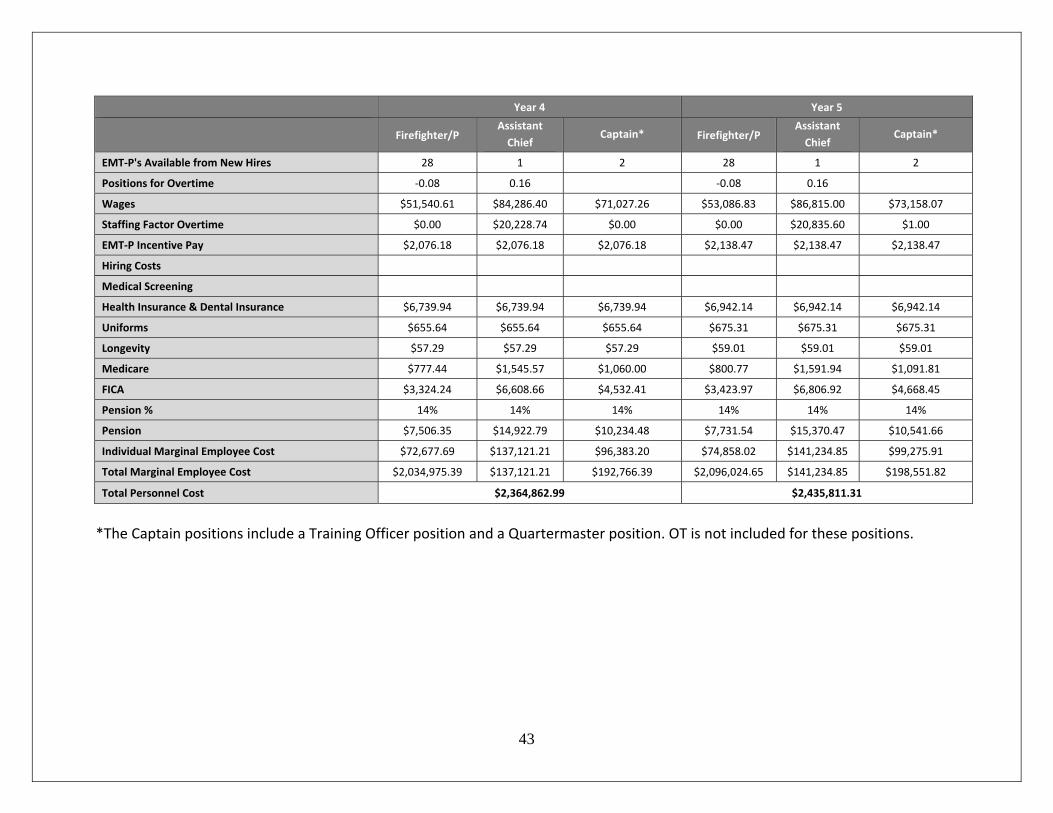
Year 4 Year 5
Firefighter/P
Assistant
Chief Captain* Firefighter/P
Assistant
Chief Captain*
EMT‐P's Available from New Hires 28 1 2 28 1 2
Positions for Overtime ‐0.08 0.16 ‐0.08 0.16
Wages $51,540.61 $84,286.40 $71,027.26 $53,086.83 $86,815.00 $73,158.07
Staffing Factor Overtime $0.00 $20,228.74 $0.00 $0.00 $20,835.60 $1.00
EMT‐P Incentive Pay $2,076.18 $2,076.18 $2,076.18 $2,138.47 $2,138.47 $2,138.47
Hiring Costs
Medical Screening
Health Insurance & Dental Insurance $6,739.94 $6,739.94 $6,739.94 $6,942.14 $6,942.14 $6,942.14
Uniforms $655.64 $655.64 $655.64 $675.31 $675.31 $675.31
Longevity $57.29 $57.29 $57.29 $59.01 $59.01 $59.01
Medicare $777.44 $1,545.57 $1,060.00 $800.77 $1,591.94 $1,091.81
FICA $3,324.24 $6,608.66 $4,532.41 $3,423.97 $6,806.92 $4,668.45
Pension % 14% 14% 14% 14% 14% 14%
Pension $7,506.35 $14,922.79 $10,234.48 $7,731.54 $15,370.47 $10,541.66
Individual Marginal Employee Cost $72,677.69 $137,121.21 $96,383.20 $74,858.02 $141,234.85 $99,275.91
Total Marginal Employee Cost $2,034,975.39 $137,121.21 $192,766.39 $2,096,024.65 $141,234.85 $198,551.82
Total Personnel Cost $2,364,862.99 $2,435,811.31
*The Captain positions include a Training Officer position and a Quartermaster position. OT is not included for these positions.
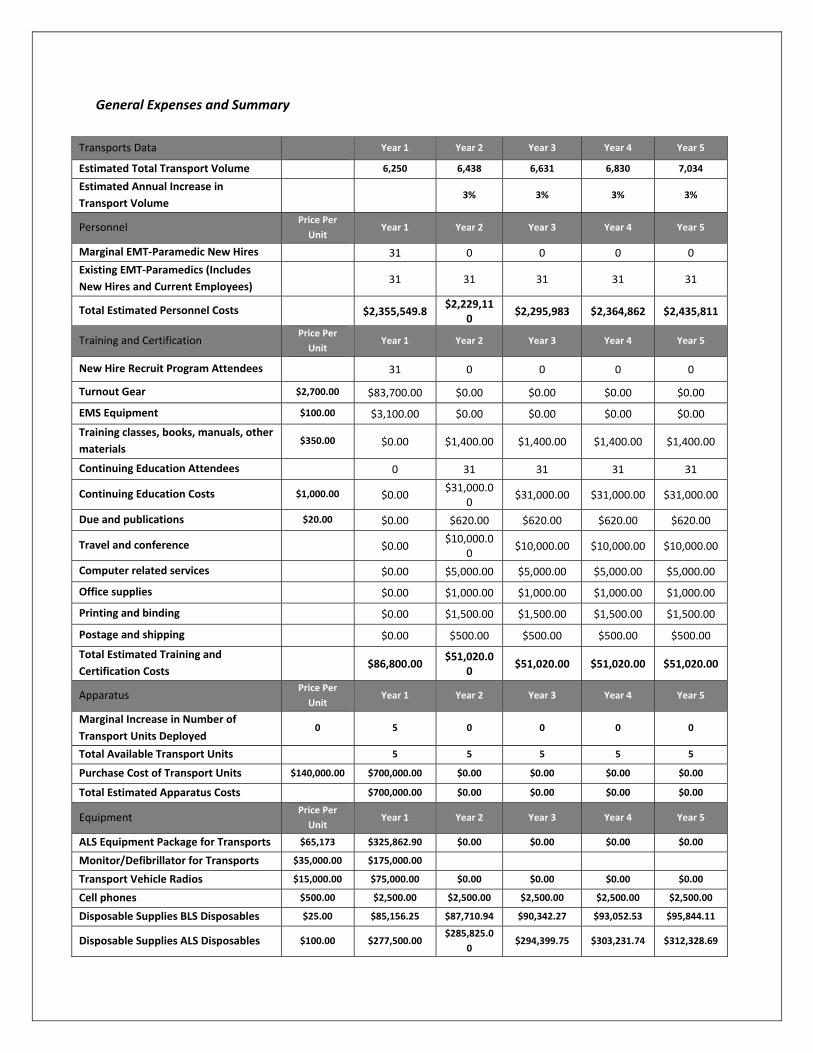
General Expenses and Summary
\
Transports Data
Year 1 Year 2 Year 3 Year 4 Year 5
Estimated Total Transport Volume 6,250 6,438 6,631 6,830 7,034
Estimated Annual Increase in
Transport Volume 3% 3% 3% 3%
Personnel Price Per
Unit Year 1 Year 2 Year 3 Year 4 Year 5
Marginal EMT‐Paramedic New Hires 31 0 0 0 0
Existing EMT‐Paramedics (Includes
New Hires and Current Employees) 31 31 31 31 31
Total Estimated Personnel Costs
$2,355,549.8 $2,229,11
0 $2,295,983 $2,364,862 $2,435,811
Training and Certification Price Per
Unit Year 1 Year 2 Year 3 Year 4 Year 5
New Hire Recruit Program Attendees
31 0 0 0 0
Turnout Gear $2,700.00 $83,700.00 $0.00 $0.00 $0.00 $0.00
EMS Equipment $100.00 $3,100.00 $0.00 $0.00 $0.00 $0.00
Training classes, books, manuals, other
materials $350.00 $0.00 $1,400.00 $1,400.00 $1,400.00 $1,400.00
Continuing Education Attendees
0 31 31 31 31
Continuing Education Costs $1,000.00 $0.00 $31,000.0
0 $31,000.00 $31,000.00 $31,000.00
Due and publications $20.00 $0.00 $620.00 $620.00 $620.00 $620.00
Travel and conference
$0.00 $10,000.0
0 $10,000.00 $10,000.00 $10,000.00
Computer related services
$0.00 $5,000.00 $5,000.00 $5,000.00 $5,000.00
Office supplies
$0.00 $1,000.00 $1,000.00 $1,000.00 $1,000.00
Printing and binding
$0.00 $1,500.00 $1,500.00 $1,500.00 $1,500.00
Postage and shipping
$0.00 $500.00 $500.00 $500.00 $500.00
Total Estimated Training and
Certification Costs $86,800.00
$51,020.00
$51,020.00 $51,020.00 $51,020.00
Apparatus Price Per
Unit Year 1 Year 2 Year 3 Year 4 Year 5
Marginal Increase in Number of
Transport Units Deployed 0 5 0 0 0 0
Total Available Transport Units 5 5 5 5 5
Purchase Cost of Transport Units $140,000.00 $700,000.00 $0.00 $0.00 $0.00 $0.00
Total Estimated Apparatus Costs $700,000.00 $0.00 $0.00 $0.00 $0.00
Equipment Price Per
Unit Year 1 Year 2 Year 3 Year 4 Year 5
ALS Equipment Package for Transports $65,173 $325,862.90 $0.00 $0.00 $0.00 $0.00
Monitor/Defibrillator for Transports $35,000.00 $175,000.00
Transport Vehicle Radios $15,000.00 $75,000.00 $0.00 $0.00 $0.00 $0.00
Cell phones $500.00 $2,500.00 $2,500.00 $2,500.00 $2,500.00 $2,500.00
Disposable Supplies BLS Disposables $25.00 $85,156.25 $87,710.94 $90,342.27 $93,052.53 $95,844.11
Disposable Supplies ALS Disposables $100.00 $277,500.00 $285,825.0
0 $294,399.75 $303,231.74 $312,328.69
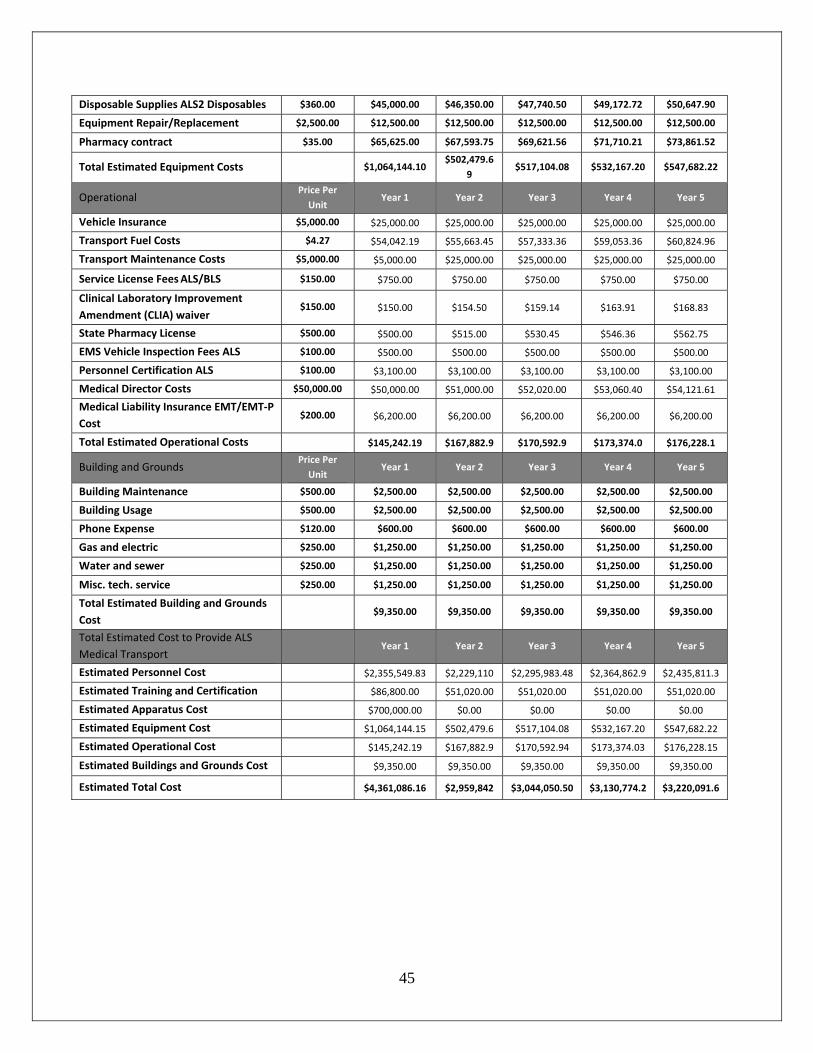
45
Disposable Supplies ALS2 Disposables $360.00 $45,000.00 $46,350.00 $47,740.50 $49,172.72 $50,647.90
Equipment Repair/Replacement $2,500.00 $12,500.00 $12,500.00 $12,500.00 $12,500.00 $12,500.00
Pharmacy contract $35.00 $65,625.00 $67,593.75 $69,621.56 $71,710.21 $73,861.52
Total Estimated Equipment Costs
$1,064,144.10 $502,479.6
9 $517,104.08 $532,167.20 $547,682.22
Operational Price Per
Unit Year 1 Year 2 Year 3 Year 4 Year 5
Vehicle Insurance $5,000.00 $25,000.00 $25,000.00 $25,000.00 $25,000.00 $25,000.00
Transport Fuel Costs $4.27 $54,042.19 $55,663.45 $57,333.36 $59,053.36 $60,824.96
Transport Maintenance Costs $5,000.00 $5,000.00 $25,000.00 $25,000.00 $25,000.00 $25,000.00
Service License Fees ALS/BLS $150.00 $750.00 $750.00 $750.00 $750.00 $750.00
Clinical Laboratory Improvement
Amendment (CLIA) waiver $150.00 $150.00 $154.50 $159.14 $163.91 $168.83
State Pharmacy License $500.00 $500.00 $515.00 $530.45 $546.36 $562.75
EMS Vehicle Inspection Fees ALS $100.00 $500.00 $500.00 $500.00 $500.00 $500.00
Personnel Certification ALS $100.00 $3,100.00 $3,100.00 $3,100.00 $3,100.00 $3,100.00
Medical Director Costs $50,000.00 $50,000.00 $51,000.00 $52,020.00 $53,060.40 $54,121.61
Medical Liability Insurance EMT/EMT‐P
Cost $200.00 $6,200.00 $6,200.00 $6,200.00 $6,200.00 $6,200.00
Total Estimated Operational Costs $145,242.19 $167,882.9 $170,592.9 $173,374.0 $176,228.1
Building and Grounds Price Per
Unit Year 1 Year 2 Year 3 Year 4 Year 5
Building Maintenance $500.00 $2,500.00 $2,500.00 $2,500.00 $2,500.00 $2,500.00
Building Usage $500.00 $2,500.00 $2,500.00 $2,500.00 $2,500.00 $2,500.00
Phone Expense $120.00 $600.00 $600.00 $600.00 $600.00 $600.00
Gas and electric $250.00 $1,250.00 $1,250.00 $1,250.00 $1,250.00 $1,250.00
Water and sewer $250.00 $1,250.00 $1,250.00 $1,250.00 $1,250.00 $1,250.00
Misc. tech. service $250.00 $1,250.00 $1,250.00 $1,250.00 $1,250.00 $1,250.00
Total Estimated Building and Grounds
Cost $9,350.00 $9,350.00 $9,350.00 $9,350.00 $9,350.00
Total Estimated Cost to Provide ALS
Medical Transport Year 1 Year 2 Year 3 Year 4 Year 5
Estimated Personnel Cost $2,355,549.83 $2,229,110 $2,295,983.48 $2,364,862.9 $2,435,811.3
Estimated Training and Certification $86,800.00 $51,020.00 $51,020.00 $51,020.00 $51,020.00
Estimated Apparatus Cost $700,000.00 $0.00 $0.00 $0.00 $0.00
Estimated Equipment Cost $1,064,144.15 $502,479.6 $517,104.08 $532,167.20 $547,682.22
Estimated Operational Cost $145,242.19 $167,882.9 $170,592.94 $173,374.03 $176,228.15
Estimated Buildings and Grounds Cost $9,350.00 $9,350.00 $9,350.00 $9,350.00 $9,350.00
Estimated Total Cost
$4,361,086.16 $2,959,842 $3,044,050.50 $3,130,774.2 $3,220,091.6
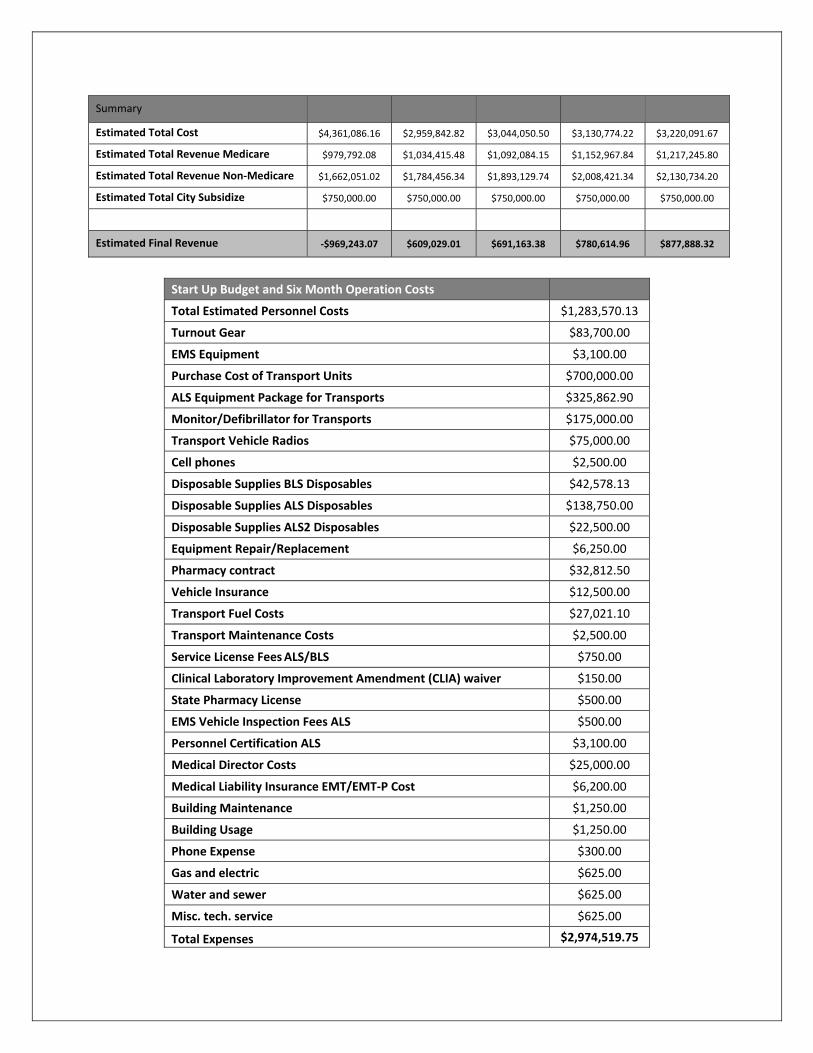
Summary
Estimated Total Cost $4,361,086.16 $2,959,842.82 $3,044,050.50 $3,130,774.22 $3,220,091.67
Estimated Total Revenue Medicare $979,792.08 $1,034,415.48 $1,092,084.15 $1,152,967.84 $1,217,245.80
Estimated Total Revenue Non‐Medicare $1,662,051.02 $1,784,456.34 $1,893,129.74 $2,008,421.34 $2,130,734.20
Estimated Total City Subsidize $750,000.00 $750,000.00 $750,000.00 $750,000.00 $750,000.00
Estimated Final Revenue ‐$969,243.07 $609,029.01 $691,163.38 $780,614.96 $877,888.32
Start Up Budget and Six Month Operation Costs
Total Estimated Personnel Costs $1,283,570.13
Turnout Gear $83,700.00
EMS Equipment $3,100.00
Purchase Cost of Transport Units $700,000.00
ALS Equipment Package for Transports $325,862.90
Monitor/Defibrillator for Transports $175,000.00
Transport Vehicle Radios $75,000.00
Cell phones $2,500.00
Disposable Supplies BLS Disposables $42,578.13
Disposable Supplies ALS Disposables $138,750.00
Disposable Supplies ALS2 Disposables $22,500.00
Equipment Repair/Replacement $6,250.00
Pharmacy contract $32,812.50
Vehicle Insurance $12,500.00
Transport Fuel Costs $27,021.10
Transport Maintenance Costs $2,500.00
Service License Fees ALS/BLS $750.00
Clinical Laboratory Improvement Amendment (CLIA) waiver $150.00
State Pharmacy License $500.00
EMS Vehicle Inspection Fees ALS $500.00
Personnel Certification ALS $3,100.00
Medical Director Costs $25,000.00
Medical Liability Insurance EMT/EMT‐P Cost $6,200.00
Building Maintenance $1,250.00
Building Usage $1,250.00
Phone Expense $300.00
Gas and electric $625.00
Water and sewer $625.00
Misc. tech. service $625.00
Total Expenses $2,974,519.75
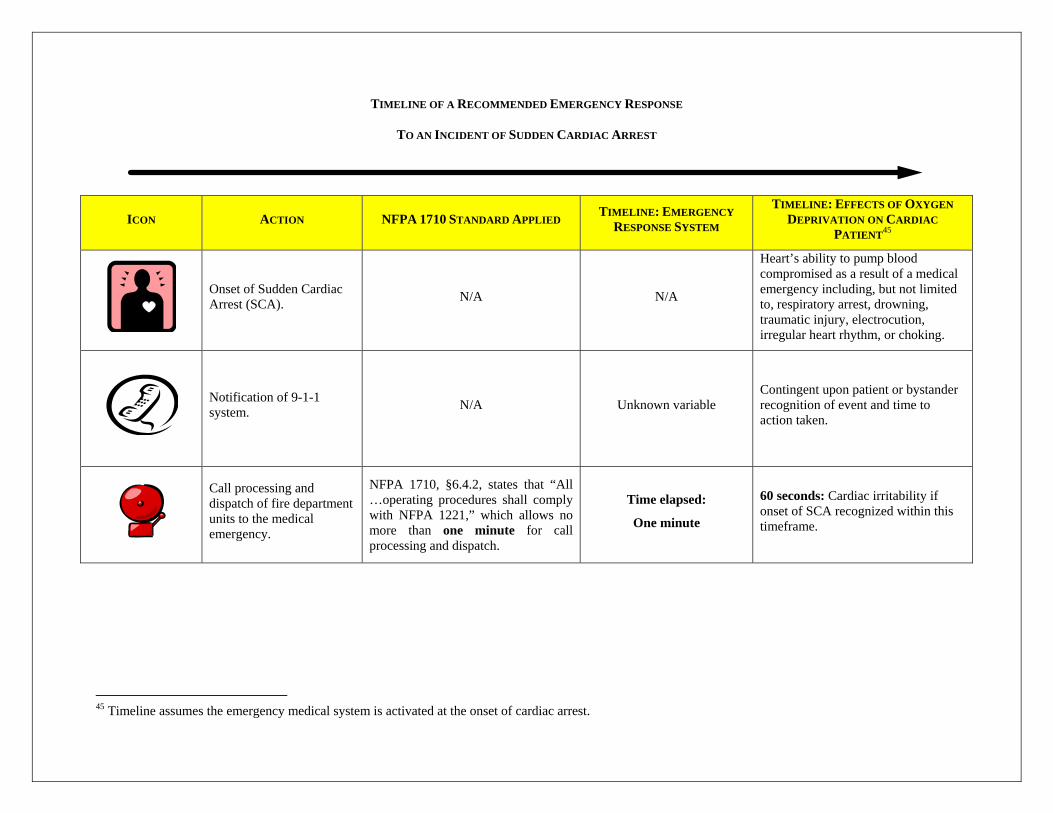
TIMELINE OF A RECOMMENDED EMERGENCY RESPONSE
TO AN INCIDENT OF SUDDEN CARDIAC ARREST
ICON ACTION NFPA 1710 STANDARD APPLIED TIMELINE: EMERGENCY
RESPONSE SYSTEM
TIMELINE: EFFECTS OF OXYGEN
DEPRIVATION ON CARDIAC
PATIENT45
Onset of Sudden Cardiac Arrest (SCA).
N/A N/A
Heart’s ability to pump blood compromised as a result of a medical emergency including, but not limited to, respiratory arrest, drowning, traumatic injury, electrocution, irregular heart rhythm, or choking.
Notification of 9-1-1 system.
N/A Unknown variable Contingent upon patient or bystander recognition of event and time to action taken.
Call processing and dispatch of fire department units to the medical emergency.
NFPA 1710, §6.4.2, states that “All …operating procedures shall comply with NFPA 1221,” which allows no more than one minute for call processing and dispatch.
Time elapsed:
One minute
60 seconds: Cardiac irritability if onset of SCA recognized within this timeframe.
45 Timeline assumes the emergency medical system is activated at the onset of cardiac arrest.
48
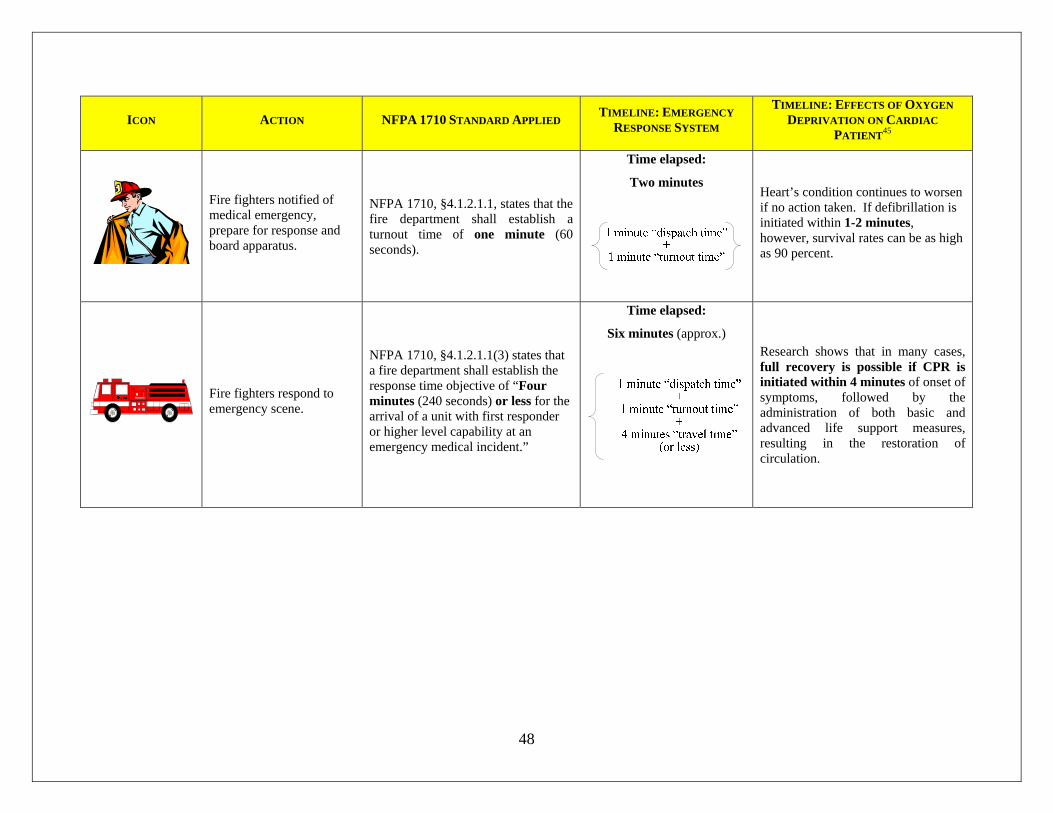
ICON ACTION NFPA 1710 STANDARD APPLIED TIMELINE: EMERGENCY
RESPONSE SYSTEM
TIMELINE: EFFECTS OF OXYGEN
DEPRIVATION ON CARDIAC
PATIENT45
Fire fighters notified of medical emergency, prepare for response and board apparatus.
NFPA 1710, §4.1.2.1.1, states that the fire department shall establish a turnout time of one minute (60 seconds).
Time elapsed:
Two minutes
Heart’s condition continues to worsen if no action taken. If defibrillation is initiated within 1-2 minutes, however, survival rates can be as high as 90 percent.
Fire fighters respond to emergency scene.
NFPA 1710, §4.1.2.1.1(3) states that a fire department shall establish the response time objective of “Four minutes (240 seconds) or less for the arrival of a unit with first responder or higher level capability at an emergency medical incident.”
Time elapsed:
Six minutes (approx.)
Research shows that in many cases, full recovery is possible if CPR is initiated within 4 minutes of onset of symptoms, followed by the administration of both basic and advanced life support measures, resulting in the restoration of circulation.
49
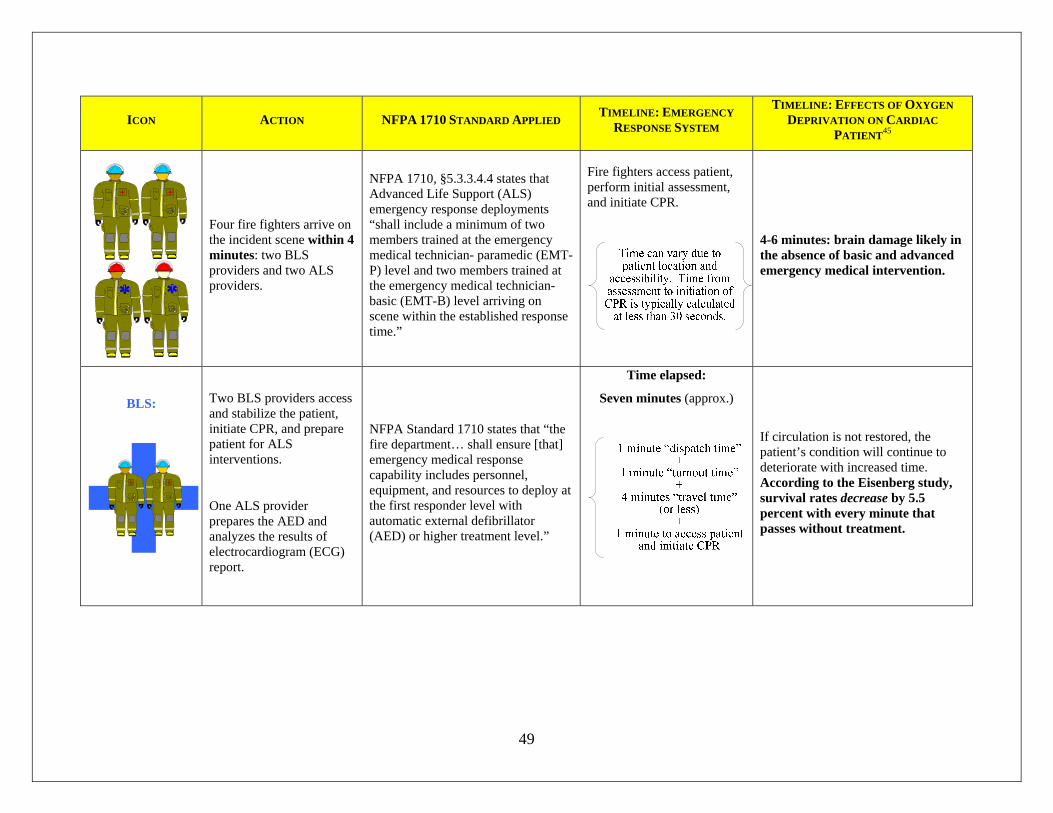
ICON ACTION NFPA 1710 STANDARD APPLIED TIMELINE: EMERGENCY
RESPONSE SYSTEM
TIMELINE: EFFECTS OF OXYGEN
DEPRIVATION ON CARDIAC
PATIENT45
Four fire fighters arrive on the incident scene within 4 minutes: two BLS providers and two ALS providers.
NFPA 1710, §5.3.3.4.4 states that Advanced Life Support (ALS) emergency response deployments “shall include a minimum of two members trained at the emergency medical technician- paramedic (EMT-P) level and two members trained at the emergency medical technician- basic (EMT-B) level arriving on scene within the established response time.”
Fire fighters access patient, perform initial assessment, and initiate CPR.
4-6 minutes: brain damage likely in the absence of basic and advanced emergency medical intervention.
BLS:
Two BLS providers access and stabilize the patient, initiate CPR, and prepare patient for ALS interventions.
One ALS provider prepares the AED and analyzes the results of electrocardiogram (ECG) report.
NFPA Standard 1710 states that “the fire department… shall ensure [that] emergency medical response capability includes personnel, equipment, and resources to deploy at the first responder level with automatic external defibrillator (AED) or higher treatment level.”
Time elapsed:
Seven minutes (approx.)
If circulation is not restored, the patient’s condition will continue to deteriorate with increased time. According to the Eisenberg study, survival rates decrease by 5.5 percent with every minute that passes without treatment.
50
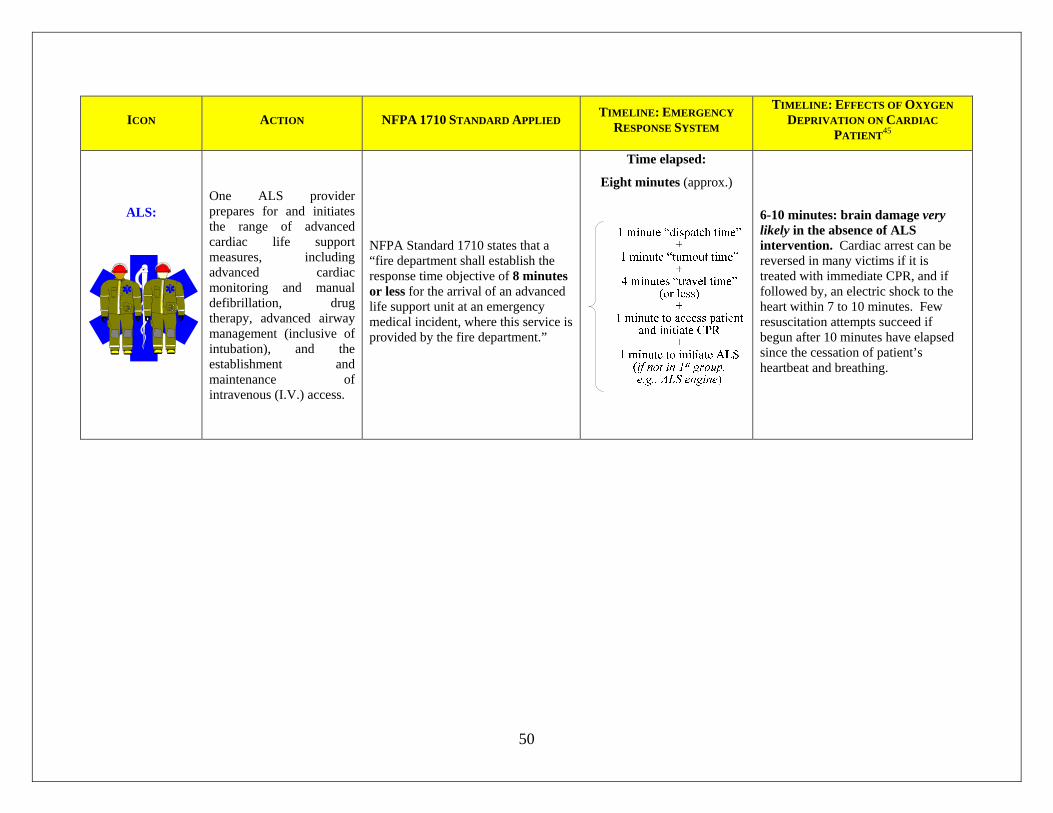
ICON ACTION NFPA 1710 STANDARD APPLIED TIMELINE: EMERGENCY
RESPONSE SYSTEM
TIMELINE: EFFECTS OF OXYGEN
DEPRIVATION ON CARDIAC
PATIENT45
ALS:
One ALS provider prepares for and initiates the range of advanced cardiac life support measures, including advanced cardiac monitoring and manual defibrillation, drug therapy, advanced airway management (inclusive of intubation), and the establishment and maintenance of intravenous (I.V.) access.
NFPA Standard 1710 states that a “fire department shall establish the response time objective of 8 minutes or less for the arrival of an advanced life support unit at an emergency medical incident, where this service is provided by the fire department.”
Time elapsed:
Eight minutes (approx.)
6-10 minutes: brain damage very likely in the absence of ALS intervention. Cardiac arrest can be reversed in many victims if it is treated with immediate CPR, and if followed by, an electric shock to the heart within 7 to 10 minutes. Few resuscitation attempts succeed if begun after 10 minutes have elapsed since the cessation of patient’s heartbeat and breathing.