Embed Size (px)
DESCRIPTION
Water Sustainability Indexes and Water Governance. Proposal of implementation of an SPATIAL COVERAGE WATER MONITORING INDEX – SCWMI. Solutions for Water platform - World Water Forum 6th - Marseille 2012. MIDAGLIA, CARMEN LUCIA VERGUEIRO (1); CETESB, S. PAULO, BRAZIL - PowerPoint PPT Presentation
Citation preview
Proposal of implementation of an SPATIAL COVERAGE WATER
MONITORING INDEX – SCWMI.
Solutions for Water platform - World Water Forum 6th - Marseille 2012
MIDAGLIA, CARMEN LUCIA VERGUEIRO (1); CETESB, S. PAULO, BRAZIL OVANDO CRESPO, CRISTINA KAREN (2); UMSS, BOLIVIA
MACHADO, REINALDO PAUL PEREZ (3); USP, S. PAULO; BRAZIL
Water Sustainability Indexes and Water Governance
Main Objetive: To introduce SCWMI (MIDAGLIA, 2009) as an index that interprets and summarizes CETESB- São Paulo State Environmental Agency monitoring network through the evolution of its coverage by means of the spatial density of network monitoring and the respective average values for the IQA - Índice de Qualidade de Água (Water Quality Index) by establishing a comparison between the population growth through the evolution of the population density rate in the state of São Paulo and also as a function of the macro use of the soil. The consequences of such growth may be seen through spatial analysis operations the aim of which is at establishing an index factor which summarizes the adjustment and the network spatial scope supported by a geo-processing platform developed in the ILWIS-3.4 (Integrated Land and Water Information System, (ITC, 2004). Such index would analyze whether the amount of the points monitored has kept the spatial capacity of representing the conditions of the quality of the water in function of the anthropogenic pressure found by the growth and densification of the urban areas in the State over water bodies and the possible loss of its ecological integrity. It could be used among many others Water Sustainability Indexes for Water Governance.
Solutions for Water platform: Proposal of implementation of an SPATIAL
COVERAGE WATER MONITORING INDEX – SCWMI.
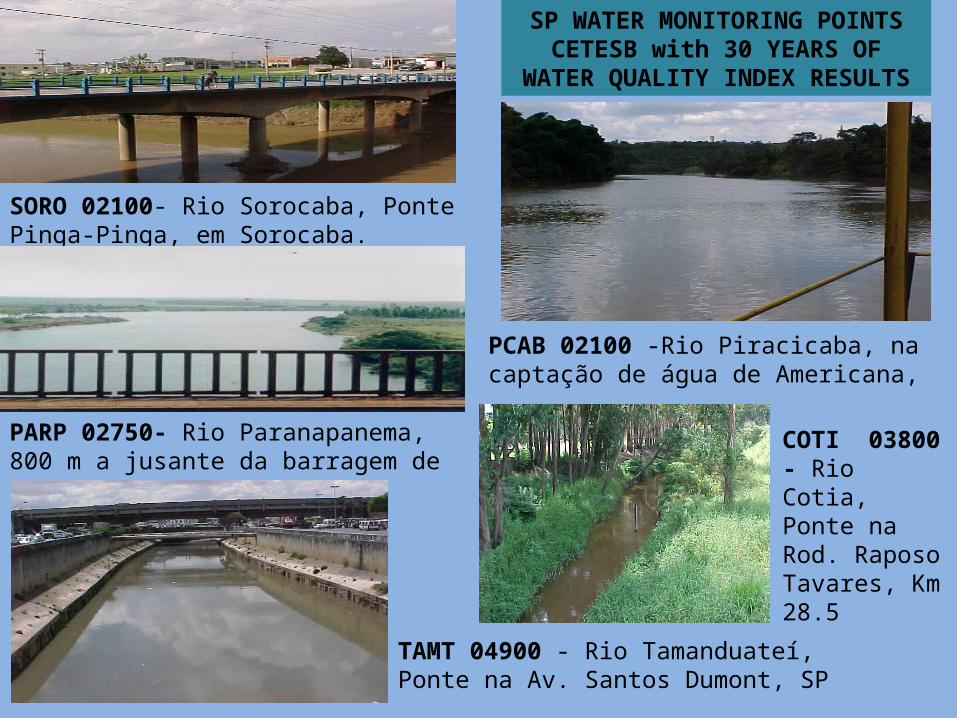
SORO 02100- Rio Sorocaba, Ponte Pinga-Pinga, em Sorocaba.
PARP 02750- Rio Paranapanema, 800 m a jusante da barragem de Capivara
SP WATER MONITORING POINTS CETESB with 30 YEARS OF WATER
QUALITY INDEX RESULTS
PCAB 02100 -Rio Piracicaba, na captação de água de Americana,
COTI 03800 - Rio Cotia, Ponte na Rod. Raposo Tavares, Km 28.5
TAMT 04900 - Rio Tamanduateí, Ponte na Av. Santos Dumont, SP

The network for monitoring the quality of surface waters is an important tool in the state management of the quality of water evaluation for its background and geographical distribution.SCWMI index comparatively evaluates the spatial evolution of such network in the interior of the state of São Paulo through the number of point samples and its respective spatial density in 30 years and the demographic growth, through average population density of the municipalities included in the 22 existing–UGRHIs (Unidades Gerenciamento de Recursos Hídricos), local acronym for WRMUs-Water Resources Management Units. The new index has analyzed whether the amount of monitored points has annually kept the spatial capacity to represent the quality of water conditions as a function of the intense anthropogenic pressure found due to the growth in urban areas within the state over the water bodies, and also the possible loss of its ecologic integrity. This vulnerability study maps may also show whether it is necessary to increase or reduce the network in certain WRMUs, invest in protection or in environmental recuperation.
ANALYSIS OF THE ANTHROPIC PRESSURE OVER THE SURFACE WATER MONITORING NETWORK OF SÃO PAULO STATE BYMEANS OF MULTI-CRITERIA EVALUATION AND A SPATIAL COVERAGE WATER MONITORING INDEX – SCWMI

SCENARIO 2010 to estimate the SCWMI for São Paulo State
+ =>
Number of Points 2010 (weight 0,25)
Network Density 2010 (weight 0.75)
Water Management index 2010
x 0,10
=>
2010 SCWMI –Spatial Coverage Water Monitoring index Map /
Index classes Spatial Slicing to SCWMI
+X
2010 Water Quality Index
Moving Average 2010 x 0,45
=>=> Resulting SMCE Index from decision tree / ILWIS 3.4
X
Macro Land USE (peso 0,30)
Antropic Pressure Index
2010 x 0,45
Populational Density 2010 (weight 0,70)
+

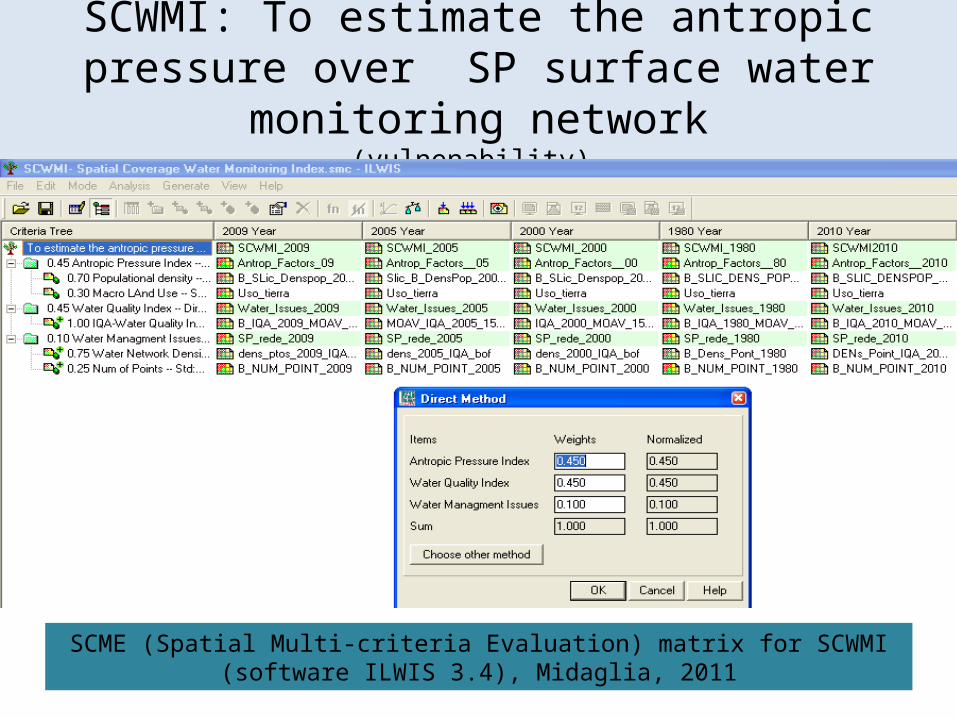
SCWMI: To estimate the antropic pressure over SP surface water monitoring network
(vulnenability)
SCME (Spatial Multi-criteria Evaluation) matrix for SCWMI (software ILWIS 3.4), Midaglia, 2011

SP 1980 SCWMI MAP with annual IQA average
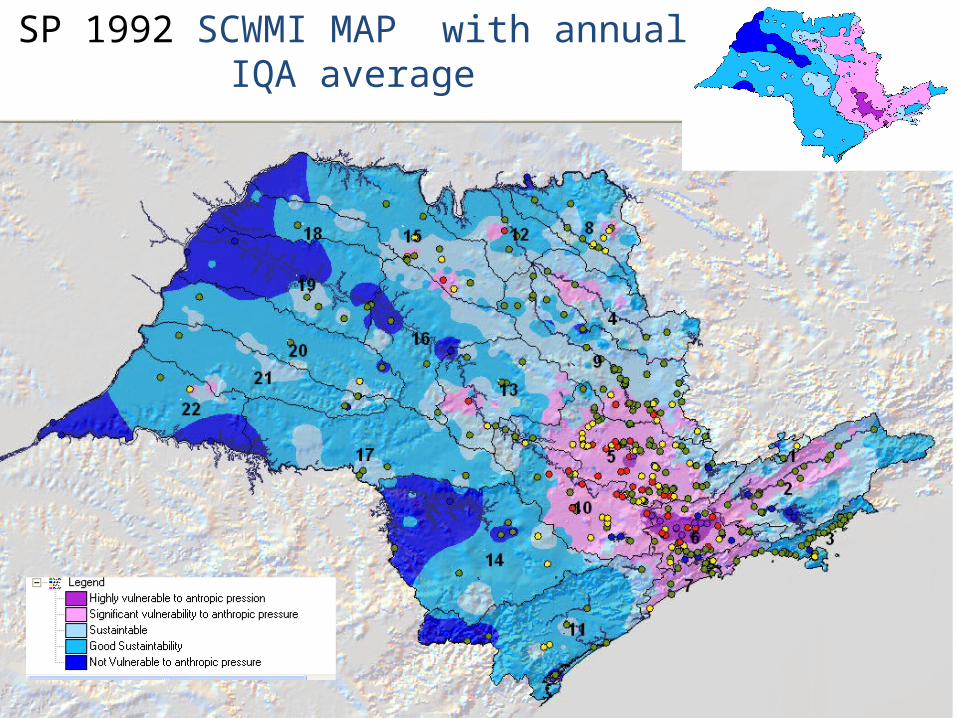
SP 1992 SCWMI MAP with annual IQA average

SP 2002 SCWMI MAP with annual IQA average
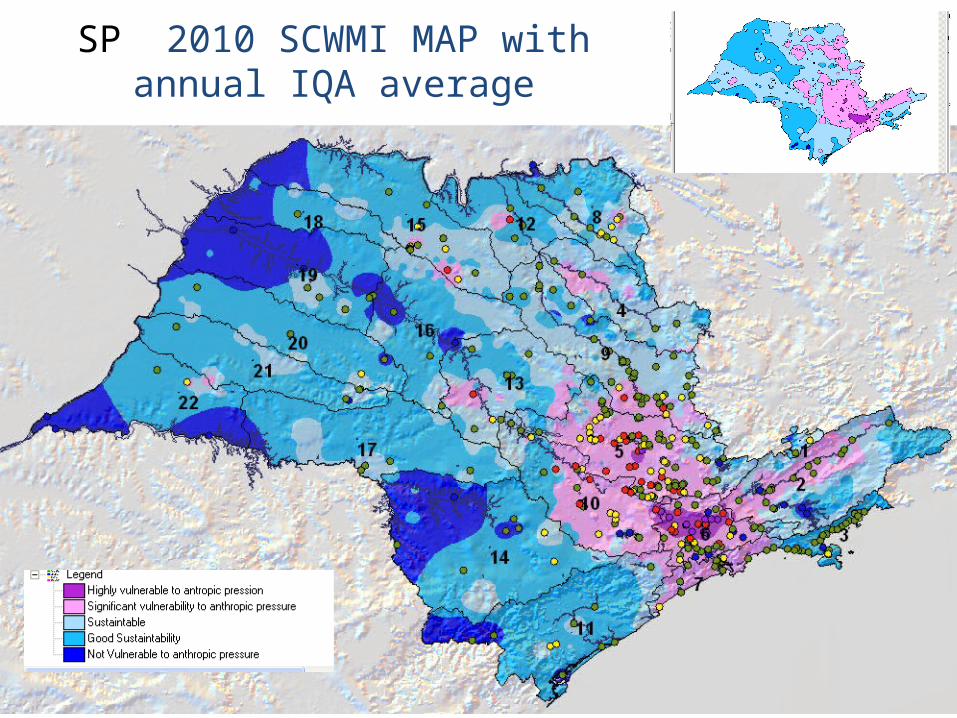
SP 2010 SCWMI MAP with annual IQA average

For effect of interpretation of the results generated, the interval of the SCWMI index was
divided in 5 classes and 2 categories (vulnerable and non-vulnerable) which define the
degree of the network spatial scope and its vulnerability in face of the anthropogenic
pressures It is noticed that this fact predominates in WRMUs of industrial nature or process
of industrialization land-use, where the majority of the population of the state is found. In
these ones, the problem is not the lack of monitoring, but rather the existence of stretches of
critical rivers (bad or poor IQA-Water Quality Index), many of them already detected by the
monitoring network in its early years, and that still remained. especially in the WRMU 6 –
Alto Tietê, which in 2010 had its worst score of 0.24, which means a higher risk. On the
other hand, the north coast, with a high density of points, and good water quality index
average, shows a sustainable SCWMI index rates. In this case, a reduction of the number of
monitoring would be possible because the network shall aim at having the best coverage in
the state as a whole. The confrontation between the selected years shows that even tough
the network is spreading all State, the population growth is pressuring the water resources
specially at urban areas with high population density.
Conclusions:

The SCWMI reading found that the Sao Paulo (CETESB) monitoring inland waters network
grew so as to be present in all units (as of 2001), and that regarding territory, they were
found to be adequate in most of the period evaluated. It has increased from 84 to 343
points and reached the density by the CEE criterion. However, it appears vulnerable to high
anthropogenic pressure over water resources due to the multiple use of water resources
and the economic activities in the region for greater economic development in the country,
the network performance of which, when measured by SCWMI, proved to be vulnerable. In
1980, with few points the vulnerable are was bigger. Later, with more points, the stressed
area was better shaped. The index also could not map any non vulnerable area in 1980.
During the 30 years studied, the history of monitoring of surface water in the State of São
Paulo was told with the resulting index of the combination matrix comparing social and
environmental factors and the SCWMI can analyze the territorial dimensions to classify the
Water Management Units as for their vulnerability in terms of monitoring, showing the
unequal coverage of the network in the territory in which it operates, one of the regions
with more pressure for the multiple use of water in Latin America.
References: MIDAGLIA, C. L.V. 2009. Proposta de Implantação do
Índice de Abrangência Espacial de Monitoramento - IAEM por meio da Análise
da Evolução da Rede de Qualidade das Águas Superficiais do Estado de São
Paulo.2009. 230 f.. Tese de Doutorado – Programa de Pós-Graduação do
Departamento de Geografia. Faculdade de Filosofia, Letras e Ciências
Humanas da Universidade de São Paulo – USP
MIDAGLIA,C.L.; TASHIBANA, E.; KAWAKUBO, F. Análise da Pressão Antrópica Sobre A Rede de Monitoramento das Águas Superficiais do Estado de São Paulo por Meio da Avaliação Multi-Criterio e do Iaem-Índice de Abrangência Espacial do Monitoramento. Anais do Simpósio Internacional: Anais do II SIMPÓSIO INTERNACIONAL CAMINHOS ATUAIS DA CARTOGRAFIA NA GEOGRAFIA 12 /2010http://www.2cartogeo.com.br/Anais_2CARTOGEO.pdf