Embed Size (px)
Citation preview
Report No 2005/16 Proposal to increase MEPS for Room Air Conditioners and harmonise MEPS
for single and three-phase units
Regulatory Impact Statement
Draft final report – 21 June 2005
Prepared for
Australian Greenhouse Office
Prepared by
Syneca Consulting

Proposal to increase MEPS for RACs and harmonise MEPS for single & three-phase units - Draft final RIS
Contents
Abbreviations .............................................................................................................iv
Executive summary ....................................................................................................v
1 The context for regulation ...................................................................................1 1.1 Three-part proposal 1 1.2 National Greenhouse Strategy 2 1.3 Nationally consistent energy efficiency program 3 1.4 NAEEEP’s policy framework 3 1.5 Industry and trade structure, including the Trans Tasman Mutual Recognition
Agreement 4 1.6 Contribution of air conditioners to greenhouse emissions 5 1.7 Market failure 6
2 The objective ........................................................................................................8 2.1 NAEEEC’s air conditioner strategy 8 2.2 Objectives against which the new proposals are to be assessed 11
3 Options................................................................................................................13 3.1 The BAU option 13 3.2 Stringency options 13 3.3 Timing options 17 3.4 Alternative policy approaches 18 3.5 Conclusion 19
4 Impact analysis of the changes proposed for October 2008..........................21 4.1 Impact on energy efficiency, energy use and greenhouse emissions 21 4.2 Impact on users 23 4.3 Business compliance costs 27 4.4 Impact on government 29 4.5 National costs and benefits 30
5 Impact analysis of the changes proposed for October 2006..........................32 5.1 Impact on energy efficiency, energy use and greenhouse emissions 32 5.2 Impact on users 33 5.3 Business compliance costs 33 5.4 Impact on government 34 5.5 National costs and benefits 34
i

Proposal to increase MEPS for RACs and harmonise MEPS for single & three-phase units - Draft final RIS
6 Harmonise MEPS for single-phase and three-phase air conditioners...........36 6.1 About the proposal 36 6.2 Impact of the proposal 37
7 Consultation .......................................................................................................39 7.1 History of the existing MEPS arrangements 39 7.2 Consultations for the new 2006 and 2008 proposals 40
8 Recommendations .............................................................................................45
9 Implementation and review ...............................................................................47
References.................................................................................................................49
Appendices Appendix 1: Technical background & tabulation of MEPS proposals ..................................51 Appendix 2: Availability of high efficiency RACs in other countries ...................................53 Appendix 3: Projected sales of refrigerative air conditioners ................................................58 Appendix 4: Baseline assumptions for the benefit cost analysis............................................61
Tables Table 1.1: Projected energy use and greenhouse emissions due to electrical HVAC
equipment: 1990, 2000 and 2008-2012 ....................................................................5 Table 2.1: Australian MEPS and equivalent Korean MEPS for RACs of less than 10 kW
cooling capapcity ....................................................................................................10 Table 3.1: Measures of cross trade in RACs between 50 Hz and 60 Hz countries, 2002........16 Table 3.2: European scheme for energy labelling, introduced January 2004, applying to air
conditioners with cooling capacity up to 12 kW ....................................................17 Table 4.1: Average characteristics of non-complying models.................................................21 Table 4.2: Benefits and costs from a user perspective.............................................................24 Table 4.3: Sensitivity analysis of impact on aggregate energy and installation costs, 2007-
2016 ........................................................................................................................26 Table 4.4: Benefits and costs from a national perspective ($M, 2007-2016) ..........................31 Table 5.1: Impact on energy efficiency and greenhouse emissions.........................................32 Table 5.2: Benefits and costs from a user perspective.............................................................33 Table 5.3: Sensitivity analysis of impact on aggregate energy and installation costs, 2008-
2018 ........................................................................................................................34 Table 5.4: Benefits and costs from a national perspective.......................................................35 Table 6.1 Benefits and costs from a user perspective.............................................................37 Table 6.2: Benefits and costs from a national perspective.......................................................38 Table 8.1 Assessment summary – proposals for October 2008..............................................45 Table 8.2 Assessment summary – proposals for October 2006..............................................46 Table 8.3 Assessment summary – eliminate diffferences between single-phase and three-
phase air conditioners .............................................................................................46
Figures Figure 4.1: Scenarios for energy use by RACs, <10kW ...........................................................22
ii

Proposal to increase MEPS for RACs and harmonise MEPS for single & three-phase units - Draft final RIS
Figure 4.2: Scenarios for GHG emissions from RACs, <10kW ...............................................22 Figure 4.3: Schematic presentation of transition to high efficiency path..................................28
iii

Proposal to increase MEPS for RACs and harmonise MEPS for single & three-phase units - Draft final RIS
Abbreviations
AGO Australian Greenhouse Office
AREMA Australian Refrigeration Equipment Manufacturers Association
AS/NZS Australian Standard/New Zealand Standard
BAU business as usual
COAG Council of Australian Governments
COP coefficient of performance
DoE (US) Department of Energy
DPIE Department of Primary Industries and Energy
EEWG Energy Efficiency Working Group
EER energy efficiency ratio
EES Energy Efficient Strategies Pty Ltd
ESSA Energy Supply Association of Australia
GWA George Wilkenfeld and Associates
GWh 106 kWh
HVAC heating, ventilation and air conditioning
kW kilowatts
kWh kilowatt/hours
LBNL Lawrence Berkeley National Laboratories
LCC life cycle cost
MCE Ministerial Council on Energy
MEPS minimum energy performance standards
Mt CO2e Mega tonnes of greenhouse emissions, measured as equivalent units of carbon dioxide
NAEEEC National Appliance and Equipment Energy Efficiency Committee
NAEEEP National Appliance and Equipment Energy Efficiency Program
NATA National Association of Testing Authorities
NGS National Greenhouse Strategy
PJ petajoule
RAC room air conditioner
RIS Regulatory Impact Statement
UNSW University of New South Wales
iv

Proposal to increase MEPS for RACs and harmonise MEPS for single & three-phase units - Draft final RIS
Executive summary This is a regulatory impact statement addressing a proposal to increase the minimum energy performance standards (MEPS) for non-ducted air conditioners of up to 10 kW, hereafter referred to as room air conditioners (RACs), and to harmonise MEPS arrangements for single-phase and three-phase air conditioners. The proposal relates to refrigerative air conditioners including cooling only models and those that can be configured for reverse cycle operation. A revised Standard, incorporating the proposed changes, would be given legal effect under State and Territory legislation. Virtually all RACs are imported, mainly from Asian suppliers. The minimum efficiency of RACs is currently governed by MEPS introduced in October 2004, with a further increase already scheduled for October 2007. The new proposal has been put forward by the National Appliance and Equipment Energy Efficiency Committee (NAEEEC). NAEEEC is comprised of officials from Commonwealth, State and Territory government agencies, plus representatives from New Zealand, responsible for implementing product energy efficiency initiatives in those jurisdictions. NAEEEC reports through the Energy Efficiency Working Group (EEWG) to the Ministerial Council on Energy (MCE).
About the proposal The new proposal may be regarded as having three parts that require separate decisions. The first part is to implement more stringent MEPS for certain RAC sizes and types from October 2008. The proposal follows a lead recently set by Korea. Korea implemented new MEPS in October 2004 and it is proposed that Australia follow Korea with a lag of 4 years. No further increases would be proposed before October 2012. The second part of the proposal relates only to household (non-commercial) RACs of less than 7.5 kW. It is proposed to introduce an intermediate increase in MEPS at the mid-point between October 2004 and October 2008 – that is, October 2006. The MEPS for these air conditioners would therefore rise in two stages, first in October 2006 and subsequently in October 2008. The intermediate MEPS would be at the level currently scheduled for October 2007 and may be regarded as bringing forward the October 2007 MEPS by one year. The third part of the proposal is relatively minor. It will eliminate historical differences between the MEPS applying to single-phase and three-phase air conditioners. Currently there are several sub-markets where different MEPS apply to single-phase and three-phase appliances with the same range of applications. The first part of the proposal is about the medium term stringency of the MEPS applying to RACs, aiming to follow the Korean lead by October 2008. The availability of product to meet the higher MEPS is the main concern. The second part of the proposal is about the transition path, with an intermediate increase proposed for October 2006. While there is much less concern about the availability of product to meet the proposed 2006 MEPS, the schedule of change becomes more crowded and there will be some increase in adjustment costs.
Development of the proposal and consultation with industry The proposals were actually developed and put to industry in reverse order. NAEEEC first re-opened discussions with industry in April 2004, presenting new evidence that more efficient air conditioners are already available. This was at a time when mainstream adoption of residential air conditioning had created a sense of urgency about the need to increase the penetration of more efficient air conditioners. There was broad industry agreement that the October 2007 MEPS could be brought forward by 18 months. Subsequently, in response to the
v

Proposal to increase MEPS for RACs and harmonise MEPS for single & three-phase units - Draft final RIS
Korean initiative, NAEEEC also re-opened the issue of the medium term stringency of the MEPS. In the consultation RIS that was then circulated to industry, NAEEEC actually proposed a more demanding schedule than is presented here. It was proposed that the Korean MEPS be implemented from October 2007 and the existing October 2007 MEPS brought forward to create an intermediate increase in April 2006. This drew a critical response from industry, the main objections being that:
o The high efficiencies claimed for other countries may be illusory and difficult to achieve, particularly where the evidence is drawn from product catalogues rather than independent test results.
o The consultation RIS made unrealistic assumptions about the ready availability of more efficient products and components, under-estimating the cost and lead time required to identify and redesign models for the Australian market. Some suppliers suggested that the implementation of more demanding medium term MEPS be deferred by another 2-3 years, to 2009 or 2010.
o There were unrealistic assumptions about the degree to which the effective implementation of the RIS could be deferred by the carry-over of non-complying stock.
o If the medium term MEPS are to be set at more stringent levels it would be more appropriate to adopt benchmarks that have been determined for labelling purposes throughout Europe.
o The regulations would need to be more effectively policed. There was some difference of views about the feasibility of deferring the intermediate MEPS, given that industry had broadly endorsed the proposal to bring the October 2007 MEPS forward. NAEEEC’s response has been to:
o defer the Korean-based MEPS by 12 months (from October 2007 to October 2008), with a corresponding 6 month adjustment to the intermediate step (from April 2006 to October 2006);
o give an undertaking that conflicting claims about the availability of more efficient product will be tested by importing a selection of units from major suppliers and having them tested in independent Australian laboratories;
o reaffirm its commitment to make no further changes to the MEPS regime before October 2012;
o reaffirm its commitment to pro-active policing of the regulations rather than simply responding to complaints about unfair competition from non-complying products.
The following considerations have been important for NAEEEC:
o There is evidence that more efficient products are available in all major markets around the world, summarised in appendix 2 of this RIS. Particularly compelling are the very high efficiencies achieved by all of the smaller split models that are supplied to the Japanese market.
o Australia’s supply structure is not unusual. It is dominated by the supplier brands and manufacturing countries that provide high efficiency products to markets throughout the world.
o Australia should continue to take its regulatory lead from the standards adopted by its major suppliers, which are Asian, not European.
vi

Proposal to increase MEPS for RACs and harmonise MEPS for single & three-phase units - Draft final RIS
o It is accepted that significant lead times are incorporated into the regulatory schedules of the major manufacturing countries, leading up to the implementation of their MEPS. However, these processes are complete before the cycle starts in Australia, since Australia follows the implementation of those MEPS with a further lag. NAEEEC therefore takes into consideration that (a) Australia does not require new product to be developed from scratch, but for existing products to be modified at most, and (b) the development lag allowed by Australia is in addition to development lags in major supplying countries.
o Adoption of the next-best European benchmarks would deliver only about 40% of the gains expected by adopting the new Korean MEPS. The European benchmarks are for labelling purposes, not MEPS.
o While suppliers put considerable value on the additional lead time, NAEEEC is concerned that there is a significant loss of net benefits to users. The additional year of lead time for the Korean-based MEPS, to October 2008, reduces the net benefit by $12-16 million. This is the net present value over the life of the more efficient air conditioners that would otherwise have been supplied during that year. Deferral of the intermediate MEPS, from April to October 2006, will reduce net benefits by $3-5 million. Also, some suppliers have already started to plan for implementation from April 2006 and may be reluctant to revise the new product schedules.
The problem addressed by the regulation The proposal is an element of the National Appliance and Equipment Energy Efficiency Program (NAEEEP), which is jointly managed and funded by the Commonwealth, State and Territory governments. NAEEEP is part of the National Greenhouse Strategy and targets the energy efficiency of consumer appliances, industrial and commercial equipment. Electrical cooling and heating equipment contribute significantly to greenhouse gas emissions, accounting for an estimated 4.4% of total emissions in 2000. Earlier projections, which had the emissions share growing 5.6% in 2010, turned out to be conservative. There has been such strong growth in the stock of air conditioners, with household ownership at least doubling over the last 10 years, that the more immediate concern is to accommodate the increased peak load demand for electricity generation and network capacity.
The objective The objective of the proposed regulation is to further reduce Australia’s greenhouse gas emissions from the use of air conditioners, subject to the following constraints:
o The measures need to be cost-effective for the broad community of users of air conditioners.
o The measures need to be efficiently designed, minimising adverse impacts on manufacturers and suppliers, and minimising adverse impacts on product quality and function.
o The measures need to be clear and comprehensive, minimising potential for confusion or ambiguity for users and suppliers.
Cost-effectiveness is interpreted in terms of the interests of the broad community of users. In pursuing this objective NAEEEP has followed a policy of adopting ‘world’s best regulatory practice’. This involves setting MEPS at levels broadly comparable with the most demanding MEPS adopted by Australia’s trading partners, but following that lead with a lag of several years. Given Australia’s status as a large net importer of electrical appliances and equipment, it is considered inappropriate to take the lead or to otherwise adopt standards that put Australia significantly at odds with its trading partners.
Impact for the medium term changes proposed for October 2008 Impact on energy efficiency and greenhouse emissions
vii

Proposal to increase MEPS for RACs and harmonise MEPS for single & three-phase units - Draft final RIS
About 96% of the RACs that are currently registered for sale do not comply with the new proposal and would need to be replaced by more efficient models. However most would also need to be replaced to meet the existing 2007 MEPS. The additional efficiency increases are in the range 3-9%, with the greatest increase required from split units of less than 4 kW cooling capacity. The minimum EER for these units rises from 3.05 to 3.33 under the new proposal. The reductions in energy use and greenhouse emissions amount to about 1.3% of BAU energy use and emissions in 2010, which is the mid-point of the first commitment period under international arrangements to reduce emissions. This builds to 5.8% over the 10 year life of the regulation, to 2018. Impact on users It is estimated that, from a user perspective, the proposal will raise the cost of air conditioners by $127 million but deliver energy savings worth $209 million. The net benefit is $82 million and the overall benefit/cost ratio is 1.6. Most of these benefits are from split units configured for reverse cycle operation, reflecting their large market share. The cost benefit analysis remains positive under reasonable variations in the underlying assumptions. Business compliance costs The additional adjustment costs incurred by suppliers are put at $9 million, which is large relative to an earlier estimate of $3 million for additional costs incurred to introduce the 2007 MEPS. (It is also in addition to the 2007-related costs.) This recognises that an unusually high number of product changes will be required over the next several years, and the crowded schedule means there are fewer opportunities to integrate the changes with normal processes of product renewal. That said, attempts to engage suppliers in estimating these costs have been almost completely unsuccessful. NAEEEC aims to provide sufficient lead to keep adjustment costs at reasonable levels and further quantitative feedback from suppliers would be welcome. Net national benefit The overall national perspective is not very different from the user perspective. The main reason is that, because a large share of energy savings occur in peak periods, the electricity tariff is a reasonable approximation of the avoidable cost of electricity. Also, the additional adjustment costs incurred by suppliers are small relative to user benefits, and the impact on taxpayers is small enough to be ignored. The benefits are large compared to previous estimates for air conditioning MEPS, reflecting more realistic assumptions for the continued growth of air conditioner ownership and for the associated sales.
Impact analysis for the intermediate changes proposed for October 2006 Impact on energy efficiency and greenhouse emissions Compliance with the proposed MEPS would require significant increases in energy efficiency from about 87% of currently registered models, delivering an average 6.9% reduction in the energy used by non-complying models. Relative to the BAU scenario for these units, the proposal would deliver energy and emissions savings of 0.7% in 2010. However there is more than usual uncertainty about this estimate. The regulation has a short life of only 1 year before the October 2007 MEPS would otherwise have taken effect, and sales could depart significantly from trend over that period. Impact on users It is estimated that the proposal will raise the cost of air conditioners by $15.5 million but deliver energy savings worth $28 million. The net benefit is $12.5 million and the overall benefit/cost ratio is 1.8. The result is robust under varying assumptions but remains sensitive to cyclical variations in sales over this period. Business compliance costs
viii

Proposal to increase MEPS for RACs and harmonise MEPS for single & three-phase units - Draft final RIS
The additional adjustment costs have been put at $3 million and therefore are relatively modest compared to the net benefits to users. Again, these are additional to any costs incurred to implement the scheduled 2007 MEPS, which are taken to define the BAU case. Net national benefit The net national benefit is put at $9.5 million, being the user benefits of $12.5 million minus the adjustment costs of $3 million. There are a number of reasons why the estimate is less robust than it might be.
o There is uncertainty about how suppliers will respond to the short life of the October 2006 regulation. Some may bring elements of the 2008 proposals forward, thereby avoiding the two-stage adjustment process to some degree. Others may use all possible means to delay their response.
o There is unavoidable uncertainty about cyclical effects on sales during the short life of the regulation.
o Some suppliers have already started to prepare for implementation, in which case some of the expected costs are sunk and can be put aside.
Impact analysis for proposals to eliminate MEPS differences between single-phase and three-phase units Currently there are several sub-markets where different MEPS apply to single-phase and three-phase appliances with the same range of applications. These should be eliminated to create a level playing field. The proposal has two significant effects. One is to increase the MEPS applying to three-phase non-ducted split units in the range 7.5-10 kW, bringing then into line with changes proposed for their single-phase equivalents in 2007 and 2008. The other relates to ducted units, increasing the MEPS applying to single-phase units with cooling capacity greater than 10 kW, to bring them into line with their three-phase equivalents and aligning the MEPS applying to three-phase units less than 10 kW, with the levels applicable to the single-phase units of the same capacity. These changes will generate benefits of about $5 million.
Recommendation Despite uncertainties, the proposal is consistent with the National Greenhouse Strategy. It meets the requirements of the Prime Minister’s statement of November 20, 1997, delivering . . . realistic, cost-effective reductions in key sectors where emissions are high or growing strongly, while also fairly spreading the burden of action across the economy. He also stated that the Government is . . . prepared to ask industry to do more than they would otherwise be prepared to do, that is, go beyond a “no regrets”, minimum cost approach where this is sensible in order to achieve effective and meaningful outcomes. Importantly, NAEEEC will manage the risks relating to product availability by obtaining a selection of products from supplier countries and testing their efficiency in independent Australian laboratories. It is recommended that States and Territories implement the proposed mandatory minimum energy performance standards. This will require States and Territories to amend existing regulations governing appliance energy labelling and MEPS.
ix

Proposal to increase MEPS for RACs and harmonise MEPS for single & three-phase units - Draft final RIS
1 The context for regulation
1.1 Three-part proposal This document addresses a three part proposal to increase the minimum energy performance standards (MEPS) for certain room air conditioners (RACs) and to eliminate differences in the MEPS requirements for single-phase and three-phase air conditioners. The key terminology is defined as follows:
o Air conditioners are defined here as refrigerative air conditioners configured for either cooling only or reverse cycle1 operation, and exclude evaporative coolers.
o RACs are non-ducted air conditioners designed to service a single room, in contrast to a ducted unit servicing multiple rooms.
o ‘Phase’ is a characteristic of the electricity service. A single-phase line carries relatively light electrical loads capable of serving the needs of most residential customers and small commercial customers (electrical input power typically up to around 6 kW), whereas a three-phase service carries the heaver electrical loads required by larger commercial and industrial customers. Residential users with large air conditioners or bore pumps may require a three-phase service.
o For regulatory purposes the ‘capacity’ of these both cooling only and reverse cycle air conditioners is defined as their cooling power output, measured in kilowatts (kW). Many RACs are less than 4 kW but they range is size up to more than 10kW.
The first part of the proposal is to increase the MEPS for single-phase RACs of less than 10 kW. MEPS for these units were first introduced at a relatively low level in October 2004 and an increase is already scheduled for October 2007, bringing the Australian MEPS into line with existing Taiwanese MEPS. The Taiwanese MEPS have now been bettered by MEPS that Korea adopted in October 2004. The new proposal is that Australia follow the Korean lead with a 4 year lag, from October 2008. MEPS would therefore increase in October 2007 and again in October 2008. The second part of the proposal will bring the scheduled 2007 MEPS forward by 12 months, to October 2006, but only for RACs of less than 7.5 kW cooling capacity, and only for units that are used by or marketed to residential users (i.e. excluding commercial only models). The MEPS for these air conditioners would therefore increase in October 2006 and subsequently in October 2008. In the absence of this part of the proposal, MEPS for these units would otherwise increase in October 2007 and October 2008. MEPS changes for other types of units (commercial models and models greater than or equal to 7.5 kW) will be according to the October 2007 and October 2008 timetable. The third part of the proposal is to eliminate historical differences between the MEPS applying to single-phase and three-phase air conditioners. Currently there are several sub-markets where different MEPS apply to single-phase and three-phase appliances that essentially have
1 The air conditioners that will be subject to the proposed MEPS are of the vapour compression or refrigerative type. They can be designed as ‘cooling only’ devices that pump heat out of a building, or they can be configured for a ‘reverse cycle’ that allows the equipment to be used for either cooling or heating. The latter are often referred to as ‘heat pumps’, distinguishing the reverse cycle equipment from the cooling-only air conditioners. We refer to both as air conditioners. Products that only heat are not affected by this proposal.
1

Proposal to increase MEPS for RACs and harmonise MEPS for single & three-phase units - Draft final RIS
the same range of applications. The arrangements for both ducted and non-ducted units will be brought into line. The proposals addressed in this document are NAEEEC’s response to a number of developments.
o There is new evidence that more efficient air conditioners are already available in a number of supplier countries, indicating that there is little impediment to earlier implementation of the MEPS for some products that were originally proposed for 2007.
o The mainstream adoption of air conditioning over recent years, particularly in new houses, has created a sense of urgency that any opportunity to increase the penetration of more efficient air conditioners should not be missed. A related concern is the growth in peak loads that air conditioners are putting on electricity networks. There is a related proposal to require mandatory external load control capability for new air conditioners from 2008.
o Korea’s recent adoption of more stringent MEPS for RACs provides an opportunity to follow that lead while still providing industry with reasonable lead time.
More generally, the proposal is part of the National Appliance and Equipment Energy Efficiency Program (NAEEEP), which is an element of the National Greenhouse Strategy (NGS). The remainder of this section explains the broader policy context.
1.2 National Greenhouse Strategy The Australian Government’s response to concerns about the environmental, economic and social impacts of global warming was enunciated in the Prime Minister’s statement of November 20, 1997, Safeguarding the Future: Australia’s Response to Climate Change. The Prime Minister noted that the Government was seeking . . . realistic, cost-effective reductions in key sectors where emissions are high or growing strongly, while also fairly spreading the burden of action across the economy. He also stated that the Government is . . . prepared to ask industry to do more than they would otherwise be prepared to do, that is, go beyond a “no regrets”2, minimum cost approach where this is sensible in order to achieve effective and meaningful outcomes. The NGS was subsequently endorsed by the Commonwealth, States and Territories as a commitment by governments to an effective national greenhouse response.
The Strategy maintains a comprehensive approach to tackling greenhouse issues. The range of actions it encompasses reflects the wide-ranging causes of the enhanced greenhouse effect and the pervasive nature of its potential impacts on all aspects of Australian life and the economy. (NGS 1998)
The NGS is also the mechanism through which Australia will meet its international commitments as a party to the United Nations Framework Convention on Climate Change. The Australian government has announced its intention to meet an overall target by 2008-2012 of 108% of its 1990 emissions which is, in effect, a 30% reduction on the projected “business as usual” (BAU) outcomes in the absence of interventions.
2 The Productivity Commission has defined ‘No regrets’ policy options as measures that … have net benefits (or at least no net cost) in addition to addressing the enhanced greenhouse effect. A more intuitive interpretation of ‘no regrets’ measures could be that they are actions which would still be considered worthwhile even in the absence of concerns about the potential adverse impact of global warming. (PC 1997: page vii). This may involve imposing additional business costs on suppliers if the resulting more efficient products deliver a net benefit to the wider community.
2

Proposal to increase MEPS for RACs and harmonise MEPS for single & three-phase units - Draft final RIS
1.3 Nationally consistent energy efficiency program The proposed regulation is an element of the National Appliance and Equipment Energy Efficiency Program (NAEEEP). The NAEEEP is part of the National Greenhouse Strategy and targets the energy efficiency of consumer appliances, industrial and commercial equipment. The main tools of the Program are mandatory energy efficiency labelling and minimum energy performance standards, and voluntary measures including endorsement labelling, training and support to promote the best available products. The NAEEEP’s governance structure is as follows:
o The Program is the direct responsibility of the National Appliance and Equipment Energy Efficiency Committee (NAEEEC). It is comprised of officials from the Commonwealth, State and Territory government agencies, plus representatives from New Zealand, responsible for implementing product energy efficiency initiatives in those jurisdictions.
o The NAEEEC reports through the Energy Efficiency Working Group (EEWG) to the Ministerial Council on Energy (MCE), which is made up of the Ministers with portfolio responsibility for implementation of the National Greenhouse Strategy in this field.
o The MCE has charged EEWG to manage the overall policy and budget of the national program.
The NAEEEP relies on State and Territory legislation for legal effect. This involves the use of state and territory legislation to enforce relevant Australian Standards for each specific product type.
1.4 The NAEEEP’s policy framework The broad policy directions of the NAEEEP were reviewed in 1998-99 and again in 2000-01, with recommendations brought together in two ‘Future Directions’ documents (NAEEEC 1999 and NAEEEC 2001). The MCE subsequently endorsed certain changes, with the result that the NAEEEP operates with the authority of the MCE with respect to broad policy objectives. These relate to product coverage, communication, and procedures and timetable for products proposed for regulation.
Product coverage Any type of consumer appliance, industrial or commercial equipment is eligible for inclusion in the NAEEEP, provided it is identified as a likely contributor to the growth in energy demand or greenhouse gas emissions. The selection criteria include potential for greenhouse or energy savings, environmental impact of the fuel type, opportunity to influence purchase, market barriers, access to testing facilities, and administrative complexity. The measures adopted by the NAEEEP are subject to a community cost benefit analysis and consideration of whether the measures are generally acceptable to the community.
Communication The NAEEEC develops its product strategies through a transparent planning process, including, providing stakeholders with formal opportunities for providing comment and feedback.
Procedures and timetable In respect of any proposal to implement MEPS, a significant initiative in recent years has been the decision by the MCE to match the best MEPS levels of Australia’s trading partners, after taking account of differences in test methods and other relevant differences such as climate or consumer preferences. The explicit adoption of ‘world’s best regulatory practice’ focuses attention on specific options, provides stakeholders with confidence that proposed MEPS are
3
Proposal to increase MEPS for RACs and harmonise MEPS for single & three-phase units - Draft final RIS
technically feasible, and thereby avoids the long and many-sided debates about technical options that have characterised the development process in the past. Related to that, the NAEEEP uses the standards machinery that is familiar to industry. Labelling and MEPS requirements are set out in the Australian and New Zealand Standards and developed within the consultative machinery of Standards Australia. On occasion, this has required the development of a new standard, for example, to harmonise Australian testing standards with testing procedures commonly used by trading partners. In the present case, the new MEPS would be set out in a revision of the Australian and New Zealand Standard AS/NZS 3823.2, Performance of household electrical appliances – air conditioners and heat pumps. (Part 2 of this standard deals with energy labelling and minimum energy performance standards.) These arrangements are explained in chapter 8, dealing with implementation of the proposals. The NAEEEP has adopted a standard legislative timetable, designed to implement any proposed MEPS within 3 to 5 years, giving industry some certainty about the process while also providing industry with adequate notice of new MEPS.
1.5 Industry and trade structure, including the Trans Tasman Mutual Recognition Agreement
The formal requirements of the MEPS fall on importers and manufacturers. For the purposes of the regulation they are regarded as the suppliers of air conditioners to the Australian market. All RACs falling within the scope of this proposal are imported into Australia. The supplier structure in Australia has two main levels. Several thousand businesses are engaged in the retailing, installation and maintenance of air conditions. (A search of the yellow pages produces a list of 5,000 businesses but there is a certain amount of duplication in business names.) These range in size from national discount stores to small and medium-sized businesses operating locally. The wholesale/importer level is more concentrated. BIS Shrapnel (2002) report that 8 major brands account for about 75% of total sales. Another 120 brands are registered with the AGO, indicating that the market also accommodates a significant number of other importers and wholesalers. Allowing for the fact that some businesses have multiple brands, it seems that about 100 separate business entities are engaged in importing. A proportion of these would be on a very small scale. Anecdotally, the industry is aware that some small suppliers would take one container load from time to time as a suitable distribution opportunity arises. 60 of the registered brands have 5 or fewer models against their name. Some ducted units are affected by the third part of the proposal, eliminating differences between single-phase and three-phase units. These are mostly imported but single-phase ducted units are also manufactured in Australia. Air conditioners are subject to the provisions of the Trans Tasman Mutual Recognition Agreement, which provides that a product that is legally sold in New Zealand can also legally be sold in Australia. Accordingly, Australia and New Zealand3 work together to keep MEPS at the same level, using joint standards and processes to develop and implement proposals. At worst, there has been some variation in the regulatory dates, with actual dates announced by gazette notice. All air conditioning standards are joint standards with New Zealand. The regulatory authorities in both countries are concerned with broadly the same issues, although with somewhat different emphasis. In particular, New Zealand is more concerned about the heating performance of reverse cycle air conditioners at the lower temperatures experienced in New Zealand. Certain labelling changes are now proposed to ensure that New
3 The coordinating agencies are the Australian Greenhouse Office and New Zealand’s Energy Efficiency and Conservation Authority.
4
Proposal to increase MEPS for RACs and harmonise MEPS for single & three-phase units - Draft final RIS
Zealand consumers are adequately informed about heating performance. These will benefit Australian consumers who experience similar conditions. However the consultative processes proceed independently in Australia and New Zealand, and are based on separate consultative documents. In New Zealand the consultative document does not have the formal status of a draft RIS. Consultation was undertaken through a study to analyse the potential New Zealand impacts of the 2006 and 2008 MEPS proposals for air conditioners. Each country may be regarded as addressing the issues from its own national perspective at this stage. Any differences are subsequently addressed by negotiation and agreement between governments in accordance with the TTMRA strategic objectives and principles. That process has now run its course and it is expected that the proposals put in this document will also be adopted by New Zealand.
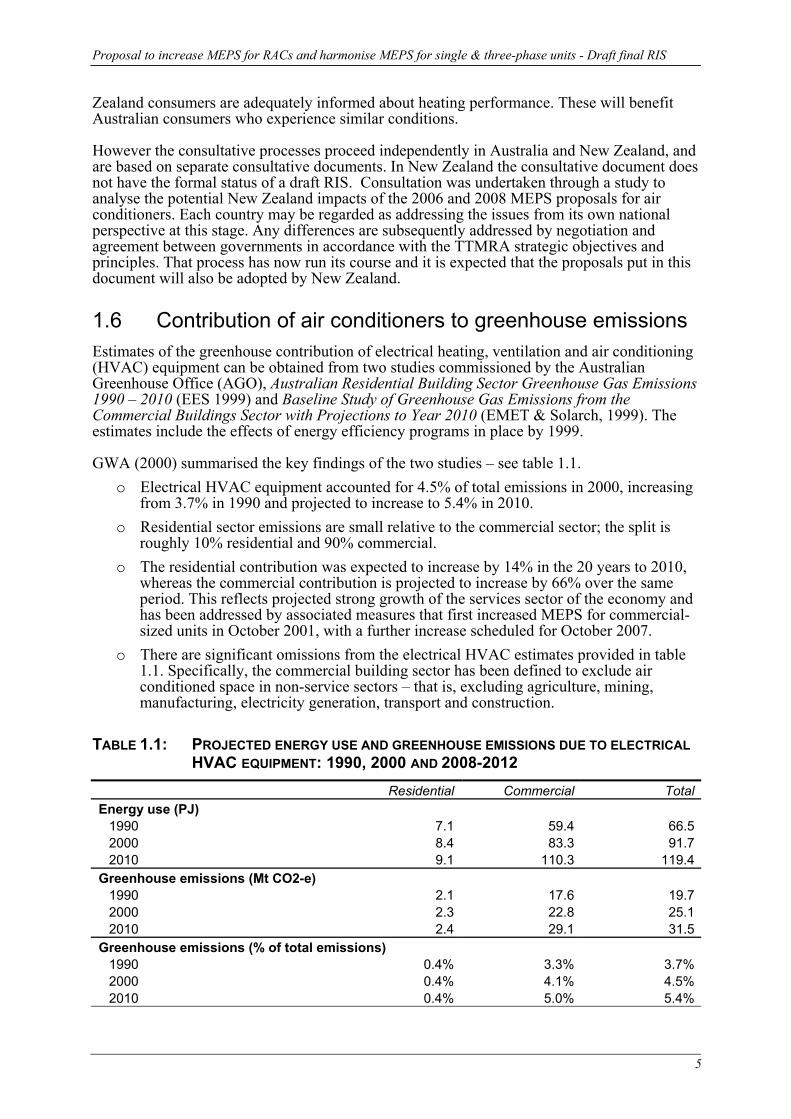
1.6 Contribution of air conditioners to greenhouse emissions Estimates of the greenhouse contribution of electrical heating, ventilation and air conditioning (HVAC) equipment can be obtained from two studies commissioned by the Australian Greenhouse Office (AGO), Australian Residential Building Sector Greenhouse Gas Emissions 1990 – 2010 (EES 1999) and Baseline Study of Greenhouse Gas Emissions from the Commercial Buildings Sector with Projections to Year 2010 (EMET & Solarch, 1999). The estimates include the effects of energy efficiency programs in place by 1999. GWA (2000) summarised the key findings of the two studies – see table 1.1.
o Electrical HVAC equipment accounted for 4.5% of total emissions in 2000, increasing from 3.7% in 1990 and projected to increase to 5.4% in 2010.
o Residential sector emissions are small relative to the commercial sector; the split is roughly 10% residential and 90% commercial.
o The residential contribution was expected to increase by 14% in the 20 years to 2010, whereas the commercial contribution is projected to increase by 66% over the same period. This reflects projected strong growth of the services sector of the economy and has been addressed by associated measures that first increased MEPS for commercial-sized units in October 2001, with a further increase scheduled for October 2007.
o There are significant omissions from the electrical HVAC estimates provided in table 1.1. Specifically, the commercial building sector has been defined to exclude air conditioned space in non-service sectors – that is, excluding agriculture, mining, manufacturing, electricity generation, transport and construction.
TABLE 1.1: PROJECTED ENERGY USE AND GREENHOUSE EMISSIONS DUE TO ELECTRICAL
HVAC EQUIPMENT: 1990, 2000 AND 2008-2012 Residential Commercial TotalEnergy use (PJ)
1990 7.1 59.4 66.52000 8.4 83.3 91.72010 9.1 110.3 119.4
Greenhouse emissions (Mt CO2-e) 1990 2.1 17.6 19.72000 2.3 22.8 25.12010 2.4 29.1 31.5
Greenhouse emissions (% of total emissions) 1990 0.4% 3.3% 3.7%2000 0.4% 4.1% 4.5%2010 0.4% 5.0% 5.4%
5

Proposal to increase MEPS for RACs and harmonise MEPS for single & three-phase units - Draft final RIS
Greenhouse emissions (% of 1990 level) 1990 100.0% 100.0% 100.0%2000 109.5% 129.8% 127.7%2010 114.3% 165.6% 160.1%
Source: GWA 2000 (drawing on EES 1999 and EMET et al, 1999) RACs of less than 10 kW probably accounted for about 15% of the 2000 energy use and emissions reported in table 1.1. Important considerations are that, firstly, RACs are a subset of all air conditioners and, secondly, other types of conditioning equipment are also included in the broad definition of ‘electrical HVAC’ equipment. In the residential sector, for example, table 1.1 includes contributions from electric resistance heaters and evaporative coolers. In the commercial sector, table 1.1 includes contributions from the purpose built installations that serve larger buildings, generally incorporating central cooling towers. That said, the original AGO studies did not anticipate the dramatic growth of air conditioner use that has occurred in recent years. Revised emissions projections for electrical HVAC equipment would show that more widespread and intensive use of RACs has been an important driver of emissions growth.
1.7 Market failure There is certainly technical scope to increase the efficiency of air conditioners. Efficiency variations of 20-30% are readily observed in the Australian market, even putting aside the extremes of high and low efficiency. More energy efficient product is available overseas. However it is conceivable that the purchase of less efficient product is rational, for example, where consumers have low energy costs or use the appliance infrequently. Is there any reason to believe that consumers systematically fail to minimise the ‘whole of life’ cost of air conditioners, creating scope for welfare-improving government intervention? First, consumers may not pay the full cost of energy; they can’t make rational choices if the prices that they pay for goods and services are not cost-reflective. The major failure in the present context is that the adverse environmental impacts of energy consumption, particularly climate change, are not factored into energy charges. Secondary failures arise from the complex nature of electricity production and distribution, with the cost of supply varying significantly from hour to hour and from place to place, and little of that variation reflected in residential electricity charges. A further difficulty is that, to give an appropriate weight to the price signals that they do receive, consumers need to calculate energy costs over the life of the appliance. This requires a considerable amount of information – about the life of the appliance, how long the consumer will stay in the current residence, future energy charges, usage patterns and the relationship between usage patterns and energy consumption, and how their preferences for air conditioning will be altered by the experience of air conditioning. It would be unreasonable to expect more than a small proportion of users to pursue the issue to this level of detail. Even long-time users may be quite uncertain about the running cost of air conditioners. Because they are charged only for the total amount of electricity used, with no separate monitoring of individual appliances, they are in a poor position to assess investments in the energy efficiency of any appliance. Often, the selection of an air conditioner is a relatively minor element of a more complex purchasing decision. For example, the air conditioner may be offered to new home buyers as part of a home and land package, or as part of a rental property offered to tenants. It is understandable that the consumer gives little consideration to the efficiency of the air conditioner in these situations; other long term and costly decisions are being made at the same time. The selection is effectively delegated to the property developer, builder or landlord, who does not pay the energy bills.
6

Proposal to increase MEPS for RACs and harmonise MEPS for single & three-phase units - Draft final RIS
Finally, even if full information about life cycle costs were readily available there is room to doubt that the consumer response would always be fully rational. Air conditioners are often purchased during extreme weather, with a pronounced sales peak during summer, suggesting that consumers are focused on an immediate need to relieve discomfort and may not pay much attention to the longer term costs. Suppliers accept that there is market failure. They say that energy efficiency is not a primary or even a significant consideration in consumer purchases. The apparent lack of concern is at odds with the fact that energy costs contribute significantly to the ‘whole of life’ or ‘lifecycle’ costs of using an appliance. There is expert evidence that the energy efficiency of many air conditioners could be considerably improved at little or no cost to suppliers and hence consumers.
7

Proposal to increase MEPS for RACs and harmonise MEPS for single & three-phase units - Draft final RIS
2 The objective This chapter explains the objectives of the regulation, firstly in terms of completing the NAEEEC’s strategy for air conditioners (section 2.1), much of which has already been implemented, and secondly, in terms of the formal objectives against which the proposal is assessed in this RIS (section 2.2).
2.1 NAEEEC’s air conditioner strategy
Existing measures The proposed regulations will complete the NAEEEP’s package of air conditioner measures. The following elements of the strategy have already been implemented through successive amendments to Australian and New Zealand Standard AS/NZS 3823:
o The NAEEEC’s energy efficiency labelling scheme (the ‘Star’ scheme) is mandatory for residential air conditioners, which use only single-phase power. It has been in place nationally for 10 years (in some states for much longer) and remains the cornerstone of the national program.
o Suppliers of three-phase units have had the option of labelling since October 2001. However all of the conditions apply if that option is taken, including the requirement for physical product testing (simulations are not permitted). Marketing laws cover instances where suppliers inadvertently or intentionally label inaccurately.
o The regulation of performance standards for air conditioners commenced in October 2001 on a national scale, starting with air conditioners taking three-phase power and used primarily in commercial applications. This work was completed under the previous policy regime, that is, prior to the MCE decision to accelerate the development process by focusing on world’s best regulatory practice. These air conditioners account for about 75% of the energy consumed by the targeted air conditioners.
o MEPS coverage was extended to single-phase air conditioners in October 2004. These units are used primarily in the residential sector.
o The most recent changes to air conditioner MEPS also increased the stringency for both single-phase and three-phase air conditioners from October 2007, increasing efficiency requirements across both the commercial and residential sectors.
o The registration testing requirements have been reduced, cutting business costs. o AS/NZS 3823 also requires:
- all statements about cooling and heating capacity, energy consumption and energy efficiency to be consistent;
- the values to be determined under the test conditions specified in relevant Part 1 standard;
- products to meet requirements of the maximum cooling test in relevant Part 1 standard (labelled products only);
- products to be registered with a State or Territory energy agency; - statements about cooling and heating capacity, energy consumption and energy
efficiency to be subject to check-testing, using the procedure specified in Part 2 and the NAEEEC Administrative Guidelines.
o Australian test standards have been aligned with overseas testing procedures – specifically, ISO5151:1994 and ISO13253:1995. This will avoid the costs of duplicate tests, since many supplier countries have similar testing requirements as part of their MEPS and/or energy labelling arrangements.
8

Proposal to increase MEPS for RACs and harmonise MEPS for single & three-phase units - Draft final RIS
o The Standard now includes the definition of ‘high efficiency’ air conditioners.
How the existing 2007 MEPS were developed In developing the existing 2007 MEPS proposals, the NAEEEC followed the MCE policy directive to explore levels that are commensurate with MEPS adopted by Australia’s trading partners. Given Australia’s status as a large net importer of electrical appliances and equipment, NAEEEC considers that it could be excessively costly to adopt standards that put Australia significantly at odds with major trading partners. Accordingly, the NAEEEC described the development of the existing 2007 MEPS as follows.
The NAEEEC commissioned consultants to examine international developments. …The results were tested with key representatives from industry and other stakeholder groups and the outcome of this process is reported in this public profile. In general, USA MEPS being implemented in 2003/4 were considered the basis for MEPS proposed for Australia for three-phase air conditioners while the Taiwanese MEPS levels implemented in 2001 were considered the basis for MEPS proposed for Australia for single-phase air conditioners. These were chosen after detailed comparison of testing methods and comparison with Australian products showed they were the most stringent currently or proposed by the major trading partners. Although Japan has proposed more stringent levels for certain sizes of single-phase air conditioners, they are based on a sales weighted average efficiency and not directly translatable to Australian conditions. They do, however, establish that more efficient product will be readily available. (NAEEEC 2002)
Given an appropriate lead from a trading partner, the strategy has been to match international best practice within a few years of the leading country. Note the meaning of ‘best practice’ in this context. It is best practice in terms of regulation, eliminating the least efficient models, not best practice in terms of leading the process of technological development. The selection of a leading country for three-phase air conditioners was straightforward, since the USA is the only one of Australia’s major trading partners to adopt MEPS for the larger (commercial) air conditioners. In broad terms, the existing 2007 MEPS are set at levels that applied in the USA from October 2003 for smaller commercial units and from October 2004 for larger commercial units. Consequently about 75% of models on the Australian market in 2004 would not be eligible for registration in 2007. A number of Australia’s trading partners have adopted MEPS or MEPS-like arrangements for single-phase air conditioners. The NAEEEC’s consultants (EnergyConsult 2002) provided comparisons for existing MEPS in the USA, Chinese Taipei, Japan, Korea and China. The most stringent of these, Chinese Taipei (Taiwan), provided the lead for the existing 2007 MEPS. Consequently, about 90% of models on the market in 2004 would not be eligible for registration in 2007. A further element of the 2007 MEPS arrangement is to require any three-phase appliances that are designated by the supplier as high efficiency to comply with specific efficiency requirements that are set higher than the mandatory requirements that apply to all appliances. This is a form of energy labelling, designed to ensure that the designation of high efficiency retains a well-defined meaning for users and is not diluted to the point where any unit that is marginally better than the MEPS can be marketed as highly efficient. The high efficiency category also has a role in signalling the NAEEEC’s intentions beyond 2007, which it does in two ways:
o First, the NAEEEC has indicated to industry that, after 2007, there would be no further increases in MEPS until at least 2012, allowing time to recoup costs.
9
Proposal to increase MEPS for RACs and harmonise MEPS for single & three-phase units - Draft final RIS
o Second, the NAEEEC commits to industry that any future MEPS commencing not earlier than 2012 would not exceed the standard for the predefined high efficiency levels applicable from 2007. Industry has a clear view of the regulatory timetable for developments well into the next decade.
Harmonisation of Australian and New Zealand MEPS As noted already, Australia and New Zealand work together to try to keep MEPS levels the same, using joint standards and processes to develop and implement proposals.
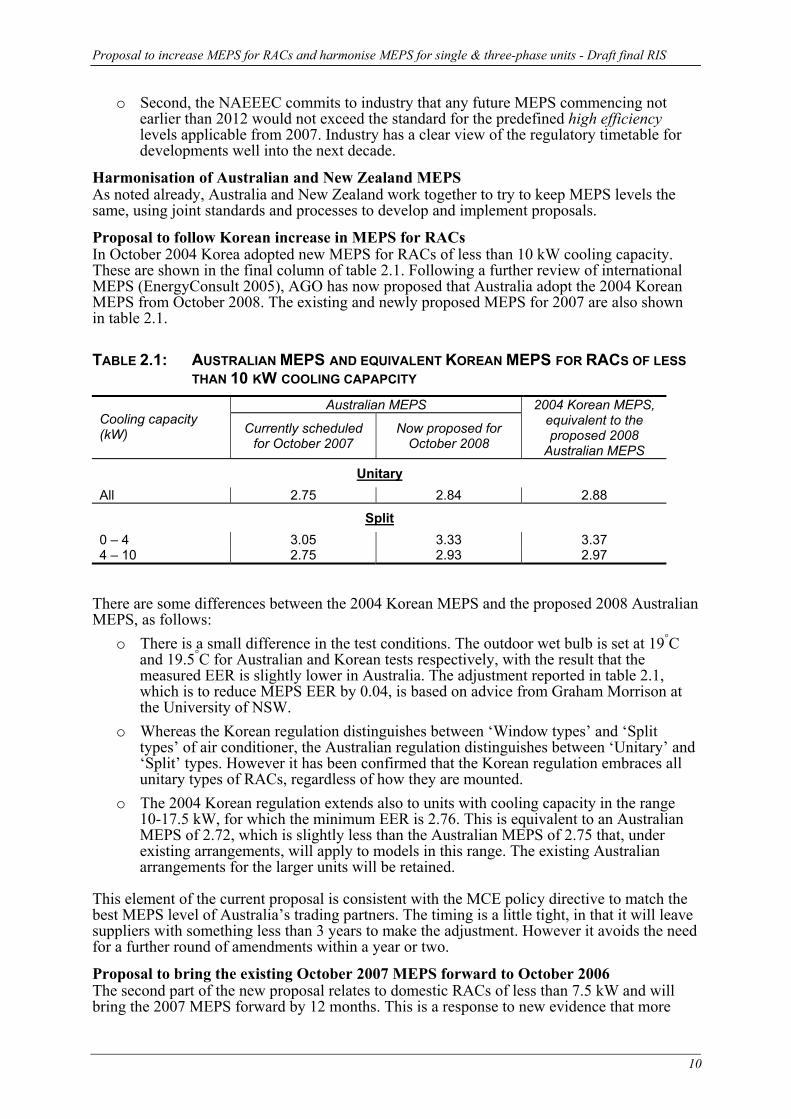
Proposal to follow Korean increase in MEPS for RACs In October 2004 Korea adopted new MEPS for RACs of less than 10 kW cooling capacity. These are shown in the final column of table 2.1. Following a further review of international MEPS (EnergyConsult 2005), AGO has now proposed that Australia adopt the 2004 Korean MEPS from October 2008. The existing and newly proposed MEPS for 2007 are also shown in table 2.1. TABLE 2.1: AUSTRALIAN MEPS AND EQUIVALENT KOREAN MEPS FOR RACS OF LESS
THAN 10 KW COOLING CAPAPCITY Australian MEPS
Cooling capacity (kW) Currently scheduled
for October 2007 Now proposed for
October 2008
2004 Korean MEPS, equivalent to the proposed 2008
Australian MEPS
Unitary All 2.75 2.84 2.88
Split 0 – 4 3.05 3.33 3.37 4 – 10 2.75 2.93 2.97
There are some differences between the 2004 Korean MEPS and the proposed 2008 Australian MEPS, as follows:
o There is a small difference in the test conditions. The outdoor wet bulb is set at 19°C and 19.5°C for Australian and Korean tests respectively, with the result that the measured EER is slightly lower in Australia. The adjustment reported in table 2.1, which is to reduce MEPS EER by 0.04, is based on advice from Graham Morrison at the University of NSW.
o Whereas the Korean regulation distinguishes between ‘Window types’ and ‘Split types’ of air conditioner, the Australian regulation distinguishes between ‘Unitary’ and ‘Split’ types. However it has been confirmed that the Korean regulation embraces all unitary types of RACs, regardless of how they are mounted.
o The 2004 Korean regulation extends also to units with cooling capacity in the range 10-17.5 kW, for which the minimum EER is 2.76. This is equivalent to an Australian MEPS of 2.72, which is slightly less than the Australian MEPS of 2.75 that, under existing arrangements, will apply to models in this range. The existing Australian arrangements for the larger units will be retained.
This element of the current proposal is consistent with the MCE policy directive to match the best MEPS level of Australia’s trading partners. The timing is a little tight, in that it will leave suppliers with something less than 3 years to make the adjustment. However it avoids the need for a further round of amendments within a year or two.
Proposal to bring the existing October 2007 MEPS forward to October 2006 The second part of the new proposal relates to domestic RACs of less than 7.5 kW and will bring the 2007 MEPS forward by 12 months. This is a response to new evidence that more
10

Proposal to increase MEPS for RACs and harmonise MEPS for single & three-phase units - Draft final RIS
efficient air conditioners are already available in a number of supplier countries, indicating that there is little impediment to earlier implementation of the 2007 MEPS. The investigation was undertaken by consultants to the NAEEEC, Danish Energy Management, and included adjustments for differences in testing methods. Catalogue data was examined for 5 APEC countries – Australia, China, Malaysia, Thailand and Korea – encompassing both split and window/wall units up to 16 kW of cooling capacity. Three groups of countries were identified:
o Thailand and Korea returned average energy efficiency ratios (EERs) of 3.16 and 3.22 respectively. Such product would easily comply with the 2007 MEPS.
o Malaysia’s average EER was somewhat lower at 2.93. o Australia and China returned average EERs of 2.68 and 2.66 respectively,
approximately 15% lower than for Thailand and Korea. This review of market trends in supplier countries was prompted by concerns about the impact of domestic air conditioners on electricity networks and generating capacity in Australia. The results of the study were presented to Australian industry representatives and other stakeholders in April 2004. Proposal to eliminate MEPS differences between single-phase and three-phase air conditioners It has been apparent for some time that there is no sound rationale for the existing differences between the MEPS for single-phase and three-phase air conditioners. Historically, the differences arose because the first round of air conditioner MEPS, introduced in October 2001, applied only to three-phase air conditioners. These are mainly larger units used in commercial and industrial applications, but the MEPS were defined for the whole range of product up to 65 kW, including the relatively small number of models in the range 0-10 kW. In the next round of MEPS, introduced in October 2004 and addressing single-phase product, it was found that somewhat more stringent MEPS were readily justified for units in the range 0-10 kW. From October 2004, therefore, different MEPS have applied to single-phase and three-phase units. The next opportunity to start eliminating these differences is October 2007. The options were discussed at a meeting of the Standards committee in May 2005 and it was decided to propose a cross-referencing arrangement between the MEPS for single-phase and three-phase units. The proposal is that the single-phase MEPS will take precedence in the range 0-10 kW, and the three-phase MEPS will take precedence for units greater than 10 kW. Emerging need to adjust the star rating bands for air conditioners Energy efficiency labels (star ratings) need to be adjusted from time to time, keeping pace with increasing efficiency and providing appropriate coverage of the range of efficiencies in the market place. Given the further increases in energy efficiency that will be required by the new MEPS proposals, this regrading will shortly become a priority for room air conditioners. The NAEEEC will develop proposals in 2005 for inclusion in the 2005 edition of the standard. The transition to the new star rating algorithm will be timed for October 2006 when the MEPS levels for many single-phase air conditioners are upgraded.
2.2 Objectives against which the new proposals are to be assessed
The objective of the proposed regulation is to further reduce Australia’s greenhouse gas emissions from the use of air conditioners, subject to the following constraints:
o The measures need to be cost-effective for the broad community of users of air conditioners.
11
Proposal to increase MEPS for RACs and harmonise MEPS for single & three-phase units - Draft final RIS
o The measures need to be efficiently designed, minimising adverse impacts on manufacturers and suppliers, and minimising adverse impacts on product quality and function.
o The measures need to be clear and comprehensive, minimising potential for confusion or ambiguity for users and suppliers.
Cost-effectiveness is interpreted in terms of the interests of the broad community of users.
12

Proposal to increase MEPS for RACs and harmonise MEPS for single & three-phase units - Draft final RIS
3 Options The purpose of this chapter is to identify feasible options for detailed consideration. There is also a brief explanation why other possible options have been put aside without further detailed consideration. The material is organised under the following headings.
o The BAU option o Stringency options o Timing options o Alternative policy approaches
Stringency is taken to be the primary issue. Appropriate timing is then determined in the light of that decision.
3.1 The BAU option The NAEEEC has the option of preserving the existing regulatory arrangements, which provide for increased MEPS from October 2007. This is called the BAU option. A RIS for the existing regulation was completed in December 2003 (Syneca 2003). The existing regulation is expected to have a significant impact on the market. About 89% of the currently registered single-phase models would not comply with the 2007 MEPS. In general, the smaller units (<4kW) return higher rates of non-compliance. The BAU option is necessarily included in the detailed impact analysis; it is the base case against which other options are compared.
3.2 Stringency options The existing regulation implements the best regulatory practice that was identified at the time. Korea has since introduced more stringent MEPS for RACs, applying from October 2004. The proposal is an obvious alternative to the BAU option, implementing the MCE’s policy directive to follow world’s best regulatory practice. Feasibility of following the Korean lead Some suppliers have questioned the feasibility of following the Korean lead. They say that, due to certain differences between the Australian and Korean markets, high efficiency products may not be available for the Australian market. Their specific concerns are that:
o The domestic Korean market is mainly for cooling only units that also dehumidify the conditioned air, whereas there has been strong trend in Australia to reverse cycle air conditioners. Where heating is not required, the refrigeration circuit can be optimised for higher cooling only performance. In particular the heat exchanger in the outdoor unit does not need to be optimised to limit the build up of frost that occurs in reverse cycle models.
o Korea’s electricity supply has a frequency of 60 Hz, whereas Australia is on 50 Hz. Modifications would be required to supply the Australian market.
o These differences are exacerbated by the relatively small size of the Australian market, limiting the ability of manufacturers to cost-effectively modify products that will be sold only in Australia.
13

Proposal to increase MEPS for RACs and harmonise MEPS for single & three-phase units - Draft final RIS
Given these concerns, the feasibility of the new proposal is argued on the grounds set out below. Technological issues There is no secret about how to increase the efficiency of air conditioners to the required levels. It is largely a matter of increasing the size of the heat exchangers, installing more efficient fans and compressors, and taking advantage of inverter technology. The more efficient units are somewhat bigger than otherwise but very much the close relatives of models already sold in Australia. Moreover, while the most advanced models are developed in Japan, Korea and Europe, the new designs are usually manufactured in the lower-wage countries (Thailand, China and Malaysia) within a year or two. Regarding differences in the frequency of the mains power supplies, it is necessary to distinguish between inverter and non-inverter products. The frequency difference is irrelevant for inverter product, because inverters convert the power supply to the required frequency in any case. Inverter products are increasingly favoured by international suppliers because they can operate in a range of supply conditions without modification. Also, inverter models are favoured by the MEPS in their current form. These models only have to comply with MEPS between 50% and 100% of rated capacity, which is a substantial concession. For non-inverter product the effect of replacing the 60 Hz motor with a 50 Hz motor, and making no other changes to an otherwise 60 Hz product, would be to reduce cooling and heating capacity with little adverse impact on energy efficiency4. That said, single speed motors and compressors are usually sold as an integrated package and these are optimised for one frequency or the other; a motor is rarely replaced without changing the compressor. More generally, it is standard practice for 60 Hz manufacturers, like the Koreans, to modify components and designs to satisfy the MEPS requirements of their 50 Hz customers. However it is recognised that implementation of even minor design changes can be costly and time-consuming. Manufacturers subject all changes to rigorous and multi-staged review before committing to large scale production. This suggests that there is a minimum fixed cost to making modifications, regardless of how minor that modification might appear to be. Availability of high efficiency products in other countries Appendix 2 provides a review of product availability in Europe, Asia and the US, including compliance with the proposed 2008 MEPS. Note that we refer here to products that were already available in overseas markets in 2004 and asking whether they would comply with the ‘Korean MEPS’ that are proposed for Australia from 2008. These data provide support for the following propositions regarding unitary air conditioners:
o With the exception of the US and possibly India, unitary models have a small share of the market for RACs. The same is true of Australia, and industry sources say that they expect further significant declines.
o The compliance rate is high in the US – 98% for 0-4 kW models and 61% for 4-10 kW models. The US is on 60 Hz supply frequency.
o 33% of the European models comply, but with marked differences between market segments. None of the 0-4 kW cooling units comply; all of the complying units are either reverse cycle or greater than 4 kW. Two manufacturers – Airwell and LG – account for 16 of the 19 complying models. Europe is on 50 Hz.
o The compliance rates for Indian and Thai models are 50% and 56% respectively. 80-90% of the models are within 10% of the 2004 Korean MEPS. Both countries are on 50 Hz.
4 Based on a personal communication with Professor Graham Morrison, MECHLAB@UNSW.
14

Proposal to increase MEPS for RACs and harmonise MEPS for single & three-phase units - Draft final RIS
o It is not possible to directly assess Japanese compliance with the Korean MEPS because, firstly, Japanese targets are set in terms of sales-weighted average efficiencies, not minimum efficiencies, and secondly, the target efficiency for reverse cycle units is defined in terms of the average efficiency across both the cooling and heating cycles. For unitary air conditioners, however, these targets are such that only a minority of Japanese models would need to comply with the Korean MEPS. Japan has a mixed power supply, with eastern and western Japan on 50 Hz and 60 Hz respectively.
o None of the existing Chinese (50 Hz) and Taiwanese (60 Hz) models comply with the Korean MEPS.
The data on split air conditioners can be summarised as follows:
o 14% of European models already comply with the Korean MEPS, with the rate of compliance systematically higher for larger models and for reverse cycle models. Seven of the 48 manufacturers on the Eurovent database account for 75% of the complying models – LG, Daikin, Hitachi, Mitsubishi, Toshiba, Panasonic and Fujitsu. Airwell is the next largest.
o Despite the inherent difficulties of assessing Japanese compliance with minimum standards such as the Korean MEPS, we do know that:
• The Japanese sales-weighted targets for smaller (<3.2 kW) reverse cycle splits are much more demanding than the corresponding Korean MEPS, and it has been reported that the standard has been exceeded by all products currently on the market (Murakoshi et al 2005: page 771). Moreover, many of the Japanese products exceed the Japanese targets by a good margin, taking the average efficiency over the heating and cooling cycles into the range 5.0-6.0. These targets were achieved in 2004, coinciding with the Korean MEPS.
• Japanese sales-weighted targets for smaller (<3.2 kW) cooling only units are also much more demanding than the corresponding Korean MEPS, to the point where relatively few products could possibly fail to comply with the Korean MEPS. However the target year for these units is 2007.
• The Japanese targets for other types of split units are either comparable to the Korean MEPS or a somewhat less demanding, and are to be achieved in 2007. At a minimum, a sizeable minority of sales will need to comply with the Korean MEPS
o Of the other Asian countries, only Korea (89%) and Thailand (66%) return high rates of compliance. The compliance rate is less than 10% in China, India and Taiwan. However, a large proportion of the models in all countries are within 10% of the Korean MEPS.
Trade in air conditioners The following findings are based on analysis of UN trade data5.
o Four countries – Korea, China, Thailand and Malaysia – account for three quarters of the trade of RACs. Korea and China have about 30% each, with Thailand and Malaysia on 11% and 7% respectively.
o Total trade is split 60:40 between exporters with mains power supplies of 50 Hz and 60 Hz respectively.
o There is considerable cross-trade between countries on 50 Hz and 60 Hz – see table 3.1. In particular, 65% of exports from 60 Hz exporters are to 50 Hz importers.
o The pattern of Australian imports broadly reflects the global pattern. In particular, about 60% comes from 50 Hz countries and 40% from 60 Hz countries. Very little now comes directly from Japan. Within the 60 Hz group, Korea has steadily increased its position at the expense of Taiwan, to the point where 90% of the 60 Hz supplies come
5 Available at http://unstats.un.org/unsd/comtrade/default.aspx
15
Proposal to increase MEPS for RACs and harmonise MEPS for single & three-phase units - Draft final RIS
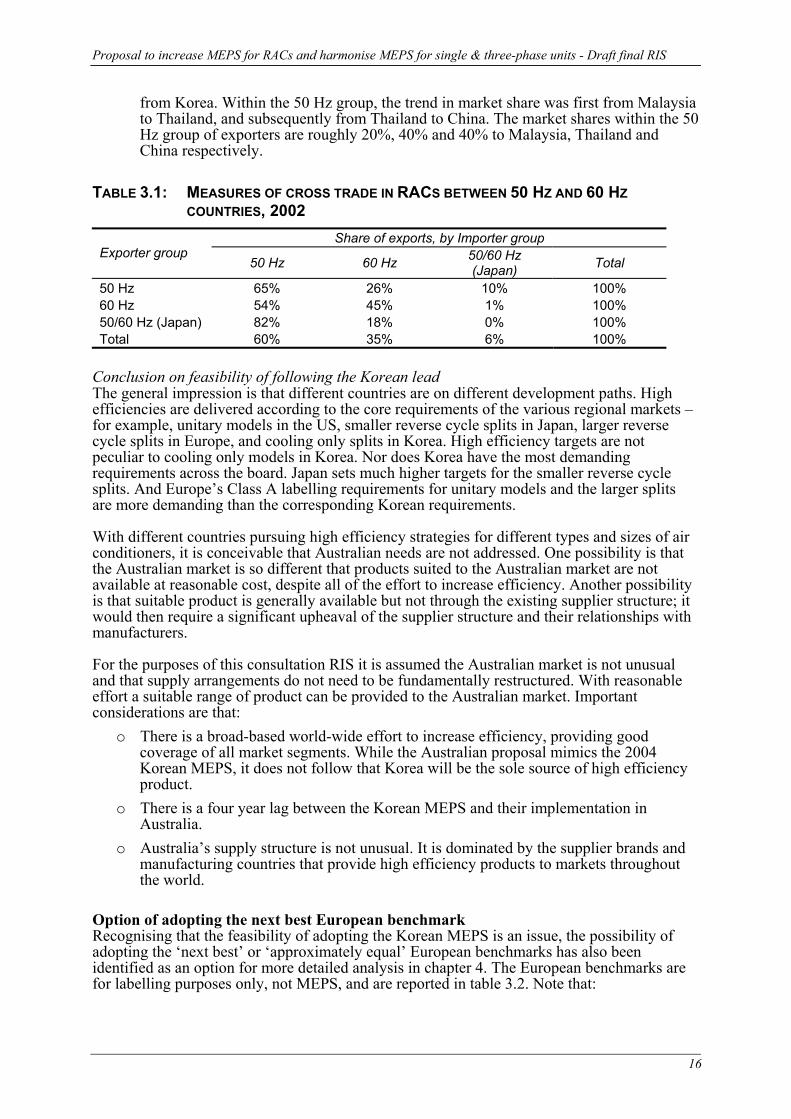
from Korea. Within the 50 Hz group, the trend in market share was first from Malaysia to Thailand, and subsequently from Thailand to China. The market shares within the 50 Hz group of exporters are roughly 20%, 40% and 40% to Malaysia, Thailand and China respectively.
TABLE 3.1: MEASURES OF CROSS TRADE IN RACS BETWEEN 50 HZ AND 60 HZ
COUNTRIES, 2002 Share of exports, by Importer group
Exporter group 50 Hz 60 Hz 50/60 Hz
(Japan) Total
50 Hz 65% 26% 10% 100% 60 Hz 54% 45% 1% 100% 50/60 Hz (Japan) 82% 18% 0% 100% Total 60% 35% 6% 100%
Conclusion on feasibility of following the Korean lead The general impression is that different countries are on different development paths. High efficiencies are delivered according to the core requirements of the various regional markets – for example, unitary models in the US, smaller reverse cycle splits in Japan, larger reverse cycle splits in Europe, and cooling only splits in Korea. High efficiency targets are not peculiar to cooling only models in Korea. Nor does Korea have the most demanding requirements across the board. Japan sets much higher targets for the smaller reverse cycle splits. And Europe’s Class A labelling requirements for unitary models and the larger splits are more demanding than the corresponding Korean requirements. With different countries pursuing high efficiency strategies for different types and sizes of air conditioners, it is conceivable that Australian needs are not addressed. One possibility is that the Australian market is so different that products suited to the Australian market are not available at reasonable cost, despite all of the effort to increase efficiency. Another possibility is that suitable product is generally available but not through the existing supplier structure; it would then require a significant upheaval of the supplier structure and their relationships with manufacturers. For the purposes of this consultation RIS it is assumed the Australian market is not unusual and that supply arrangements do not need to be fundamentally restructured. With reasonable effort a suitable range of product can be provided to the Australian market. Important considerations are that:
o There is a broad-based world-wide effort to increase efficiency, providing good coverage of all market segments. While the Australian proposal mimics the 2004 Korean MEPS, it does not follow that Korea will be the sole source of high efficiency product.
o There is a four year lag between the Korean MEPS and their implementation in Australia.
o Australia’s supply structure is not unusual. It is dominated by the supplier brands and manufacturing countries that provide high efficiency products to markets throughout the world.
Option of adopting the next best European benchmark Recognising that the feasibility of adopting the Korean MEPS is an issue, the possibility of adopting the ‘next best’ or ‘approximately equal’ European benchmarks has also been identified as an option for more detailed analysis in chapter 4. The European benchmarks are for labelling purposes only, not MEPS, and are reported in table 3.2. Note that:
16
Proposal to increase MEPS for RACs and harmonise MEPS for single & three-phase units - Draft final RIS
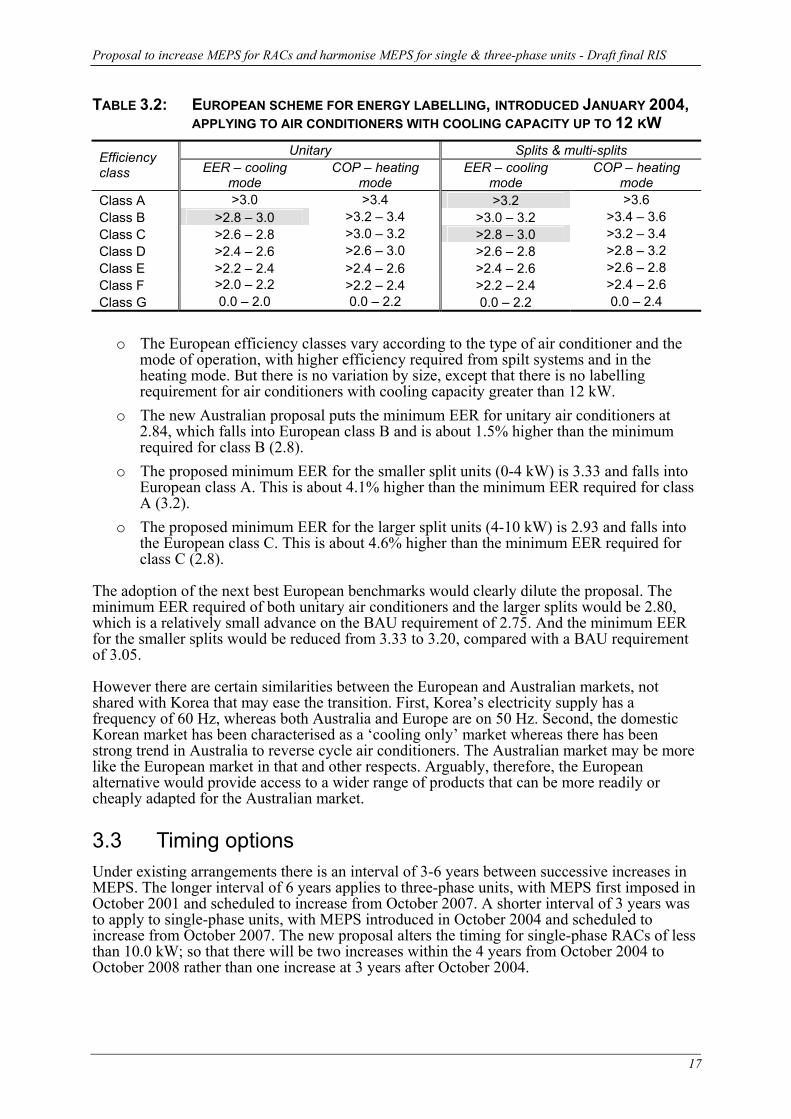
TABLE 3.2: EUROPEAN SCHEME FOR ENERGY LABELLING, INTRODUCED JANUARY 2004, APPLYING TO AIR CONDITIONERS WITH COOLING CAPACITY UP TO 12 KW
Unitary Splits & multi-splits Efficiency class EER – cooling
mode COP – heating
mode EER – cooling
mode COP – heating
mode Class A >3.0 >3.4 >3.2 >3.6 Class B >2.8 – 3.0 >3.2 – 3.4 >3.0 – 3.2 >3.4 – 3.6 Class C >2.6 – 2.8 >3.0 – 3.2 >2.8 – 3.0 >3.2 – 3.4 Class D >2.4 – 2.6 >2.6 – 3.0 >2.6 – 2.8 >2.8 – 3.2 Class E >2.2 – 2.4 >2.4 – 2.6 >2.4 – 2.6 >2.6 – 2.8 Class F >2.0 – 2.2 >2.2 – 2.4 >2.2 – 2.4 >2.4 – 2.6 Class G 0.0 – 2.0 0.0 – 2.2 0.0 – 2.2 0.0 – 2.4
o The European efficiency classes vary according to the type of air conditioner and the
mode of operation, with higher efficiency required from spilt systems and in the heating mode. But there is no variation by size, except that there is no labelling requirement for air conditioners with cooling capacity greater than 12 kW.
o The new Australian proposal puts the minimum EER for unitary air conditioners at 2.84, which falls into European class B and is about 1.5% higher than the minimum required for class B (2.8).
o The proposed minimum EER for the smaller split units (0-4 kW) is 3.33 and falls into European class A. This is about 4.1% higher than the minimum EER required for class A (3.2).
o The proposed minimum EER for the larger split units (4-10 kW) is 2.93 and falls into the European class C. This is about 4.6% higher than the minimum EER required for class C (2.8).
The adoption of the next best European benchmarks would clearly dilute the proposal. The minimum EER required of both unitary air conditioners and the larger splits would be 2.80, which is a relatively small advance on the BAU requirement of 2.75. And the minimum EER for the smaller splits would be reduced from 3.33 to 3.20, compared with a BAU requirement of 3.05. However there are certain similarities between the European and Australian markets, not shared with Korea that may ease the transition. First, Korea’s electricity supply has a frequency of 60 Hz, whereas both Australia and Europe are on 50 Hz. Second, the domestic Korean market has been characterised as a ‘cooling only’ market whereas there has been strong trend in Australia to reverse cycle air conditioners. The Australian market may be more like the European market in that and other respects. Arguably, therefore, the European alternative would provide access to a wider range of products that can be more readily or cheaply adapted for the Australian market.
3.3 Timing options Under existing arrangements there is an interval of 3-6 years between successive increases in MEPS. The longer interval of 6 years applies to three-phase units, with MEPS first imposed in October 2001 and scheduled to increase from October 2007. A shorter interval of 3 years was to apply to single-phase units, with MEPS introduced in October 2004 and scheduled to increase from October 2007. The new proposal alters the timing for single-phase RACs of less than 10.0 kW; so that there will be two increases within the 4 years from October 2004 to October 2008 rather than one increase at 3 years after October 2004.
17

Proposal to increase MEPS for RACs and harmonise MEPS for single & three-phase units - Draft final RIS
This is a more flexible arrangement than was proposed in the first consultation RIS. The first proposal was to implement the Korean-based MEPS from October 2007, with an intermediate step in April 2006 for household RACs less than 7.5 kW. Suppliers can keep to that schedule if they prefer to minimise the number of changes to their product range. Or they can take advantage of a further delay of one year, but would then need to make separate changes for 2007 and 2008 for selected products. The NAEEEC also explored the option of delaying the MEPS that are currently scheduled for October 2007, effectively deferring all final changes to October 2008. However this was not acceptable to some jurisdictions. They preferred to keep the gains that have already been secured from October 2007 (primarily for three-phase products) and to work around that to secure the gains to be had from the Korean-based MEPS. There is some benefit to industry to have MEPS increases staggered over several years to reduce work loads for registration. Based on that experience, the practical options are to shift the final implementation date for the Korean-based MEPS by 12 months, forwards or backwards, with commensurate adjustments to the intermediate step.
3.4 Alternative policy approaches The proposal is that the minimum energy efficiency of air conditioners be subject to explicit government regulation, that is one form of regulation. The ORR (1998) identifies a spectrum of regulatory approaches with explicit government regulation at one end of the spectrum and self-regulation at the other. Intermediate forms of regulation (quasi-regulation and co-regulation) are also identified. The differences can be summarised as follows:
o Self-regulation requires that the industry has a viable industry association with broad coverage and that members are sufficiently ‘of like mind’ and that they will voluntarily adhere to a code of conduct devised by the members. Minimal sanctions such as loss of membership or peer disapproval are all that is required to ensure broad compliance. The government role is reduced to facilitation and advice.
o Self-regulation merges into quasi-regulation, the latter distinguished by a stronger role for government in endorsing industry codes, providing technical guidance, or entering into government-industry agreements.
o Co-regulation describes the further stage where government provides some form of legislative underpinning for industry codes and standards. This may involve delegating regulatory powers to industry, enforcement of undertakings to comply with codes, or providing a fall-back position of explicit regulation in the event that industry fails to self-regulate.
These options have been addressed in the previous RIS (GWA 2000) under the heading of ‘Voluntary MEPS’, referring mainly to the option of self-regulation. Various difficulties were identified. The key difficulty is that the industry association (AREMA) represents the larger and medium suppliers only and is not broadly representative of the industry. The preconditions in terms of trust and confidence simply do not exist in the industry. It was determined from an early stage (mid 1990s) that AREMA was not a suitable vehicle for developing an energy efficiency code and that it would need to be developed as a government rather than an AREMA program. This consideration is fatal to options for quasi-regulation and co-regulation as well, both of which would promote AREMA as the de facto industry regulator. GWA further identified the following considerations:
o Users are too numerous and diverse to provide the institutional structure that would be required to impose standards on suppliers. More than 190 brands are currently registered with more than 3700 models on the market as of mid 2005.
o Governments could adopt efficiency standards for their own purposes but comprise too small a market to provide effective leadership to the market as a whole.
18

Proposal to increase MEPS for RACs and harmonise MEPS for single & three-phase units - Draft final RIS
o All APEC countries other than Japan have used explicit regulation to impose MEPS. Japan is recognised as a special case in terms of the close relationships between government and industry, industry’s willingness to provide governments with confidential information, and the effectiveness of formal sanctions.
In terms of the ORR’s checklist for assessing regulatory options (ORR 1998: Box D.2), it is also apparent that government is the active party. Government is responding to a significant public issue; it is convinced of the need for action; and it needs to ensure that there are specific achievements against the criteria of cost-effectiveness set out in the National Greenhouse Strategy. Overall, therefore, suppliers are neither strongly motivated nor well structured to take the initiative. The earlier RIS applies specifically to three-phase air conditioners. If anything, however, self-regulation and the intermediate forms of regulation would prove even more problematic in the case of single-phase air conditioners. The main issue is that AREMA would be even less representative of the suppliers of smaller air conditioners, who are more numerous than the suppliers of three-phase units. And consumers are even more fragmented and naïve. Accordingly, this RIS gives no further consideration to options for reducing the government role in the regulation of the energy efficiency of air conditioners. Option of using alternative instruments The ORR also identifies a number of alternative instruments that might be used instead of regulation. These include information and education campaigns; labelling requirements; taxes, subsidies and user charges; and tradable property rights. The information, education and labelling options are not given further consideration in this RIS. As discussed in chapter 2, the air conditioner strategy already includes initiatives of this kind, organized around the energy-labelling (star-rating) scheme. Air conditioners of less than 7.5 kW have been included in this scheme for 10 years6. Nevertheless, the NAEEEC considers that significant opportunities for cost-effective increases in energy efficiency remain. This basic proposition is assessed in chapter 4. The previous RIS also briefly considered the options for market based instruments – specifically, levies on the use of energy or on the use of inefficient equipment. However, these are major policy issues for the highest level of governments. They would not be decided by the NAEEEC or even necessarily by the MCE. Nor would they be decided in relation to specific items of equipment such as air conditioners, since such schemes would apply to inefficient equipment generally or to the use of energy generally. They were rejected in the previous RIS and no longer represent realistic alternatives that could be considered by the MCE. Accordingly, these options are not further considered in this RIS.
3.5 Conclusion Given the feasible options described above, the impact analysis has been organised in four chapters.
o Changes proposed for October 2008: Chapter 4 deals with the level of the 2008 MEPS for single-phase RACs up to 10 kW. Two feasible alternatives to the BAU option have been identified, following either the Korean or the European lead.
o Changes proposed for October 2006: Chapter 5 deals with the proposal to bring existing 2007 MEPS forward from October 2007 to October 2006, for RACs less than 7.5 kW. The only feasible option is simply to adopt this proposal.
6 The criterion for labelling was altered in 2001 from a capacity-based rule (<7.5 kW) to a rule based on the type of power supply. Specifically, labelling now is required only of single-phase models. These dominate the range of smaller models.
19
Proposal to increase MEPS for RACs and harmonise MEPS for single & three-phase units - Draft final RIS
o Changes proposed to eliminate MEPS differences between single-phase and three-phase air conditioners: Chapter 6 deals with the proposal to simplify and rationalise the MEPS schedule, eliminating some historical distinctions that are no longer justified.
o Consultation: Chapter 7 gives an account of consultations with suppliers and the NAEEEC’s response to supplier concerns about timing.
20

Proposal to increase MEPS for RACs and harmonise MEPS for single & three-phase units - Draft final RIS
4 Impact analysis of the changes proposed for October 2008
This chapter is concerned with the proposed 2008 MEPS for single-phase RACs of less than 10 kW cooling capacity. It provides assessments of the regulatory impact on energy use and greenhouse emissions, users, suppliers and government. These are brought together as an assessment of national costs and benefits in section 4.5. Appendices 3 and 4 explain modelling assumptions that are not otherwise detailed in this chapter.
4.1 Impact on energy efficiency, energy use and greenhouse emissions
The proposed regulation relates to about 1,750 of the air conditioner models that were registered with the AGO in August 2004. About 96% of these would not comply with the proposed new MEPS; the proportion falls to 92% if an alternate standard based on the next-best European benchmarks is adopted. Table 4.1 provides some further detail. Note that the analysis is in terms of 10 categories of air conditioner, distinguished by configuration (split or unitary), type (cooling only or reverse cycle) and size group. (Two categories that fall within scope of the regulation have been excluded. These are unitary air conditioners of 7.5-10 kW, both cooling only and reverse TABLE 4.1: AVERAGE CHARACTERISTICS OF NON-COMPLYING MODELS
Type of air conditioner
Non-complying
models (%)
Average cooling capacity
(kW)
BAU energy use
(kWh/yr)
Reduction in energy
use (kWh/yr)
Reduction in energy use (%)
Proposed MEPS, equivalent to the 2004 Korean MEPS Split, cooling only, 0-4kW 100.0% 3.0 650 52 8.0%
4-7.5 kW 92.8% 6.0 1,778 104 5.9% 7.5-10 kW 90.5% 8.3 2,458 147 6.0% Split, reverse cycle, 0-4kW 96.7% 3.0 676 48 7.1% 4-7.5 kW 94.6% 5.9 1,764 89 5.1%
7.5-10 kW 98.8% 8.3 2,478 126 5.1% Unitary, cooling only, 0-4kW 97.2% 2.4 593 17 2.9%
4-7.5 kW 96.2% 5.2 1,547 49 3.2% Unitary, reverse cycle, 0-4kW 97.3% 2.8 660 17 2.6%
4-7.5 kW 97.7% 5.3 1,526 41 2.7% Alternate MEPS, based on next best European benchmark
Split, cooling only, 0-4kW 95.8% 3.0 657 29 4.5% 4-7.5 kW 86.5% 6.1 1,793 31 1.7%
7.5-10 kW 85.7% 8.3 2,454 44 1.8% Split, reverse cycle, 0-4kW 95.5% 3.0 676 27 3.9% 4-7.5 kW 89.2% 5.9 1,771 27 1.5% 7.5-10 kW 95.0% 8.3 2,482 37 1.5% Unitary, cooling only, 0-4kW 88.7% 2.5 596 10 1.7%
4-7.5 kW 96.2% 5.2 1,547 28 1.8% Unitary, reverse cycle, 0-4kW 94.5% 2.8 661 10 1.5%
4-7.5 kW 96.6% 5.3 1,523 23 1.5%
21

Proposal to increase MEPS for RACs and harmonise MEPS for single & three-phase units - Draft final RIS
cycle, for which no models were recorded on the AGO register and/or few sales are recorded.) Large proportions of all 10 categories would need to be replaced, delivering energy savings in the range 2.5-8%. The larger gains are from the smaller splits that face the more demanding increase in minimum EER. Most of these models will be replaced to comply with the existing 2007 MEPS, which define the BAU scenario. However, the reductions in energy use reported in table 4.1 are additional to the energy savings expected from the existing 2007 MEPS; savings have not been double counted. See figures 4.1 and 4.2 for projections of energy use and greenhouse emissions under alternative MEPS arrangements. The overall shape of the projections – with large increases through to 2005, followed by continued but slower growth – reflects the large increases in the stock of air conditioners that have occurred since 1995. We expect the residential ownership ratio, which is the average number of air conditioners per household (including households without air conditioners), to increase by 127% from 0.32 in 1995 to 0.73/household in 2005. FIGURE 4.1: SCENARIOS FOR ENERGY USE BY RACS, <10KW
4,000
6,000
8,000
10,000
12,000
14,000
16,000
2000 2002 2004 2006 2008 2010 2012 2014 2016 2018 2020
With Korean MEPS from
2008
With MEPS based on European
benchmarks from 2008
GWh
BAU MEPS from 2007
FIGURE 4.2: SCENARIOS FOR GHG EMISSIONS FROM RACS, <10KW
4
6
8
10
12
14
2000 2002 2004 2006 2008 2010 2012 2014 2016 2018 2020
With Korean MEPS from
2008
With MEPS based on European
benchmarks from 2008
MT CO2e
BAU MEPS from 2007
22

Proposal to increase MEPS for RACs and harmonise MEPS for single & three-phase units - Draft final RIS
We estimate that the ownership ratio increased by 87% to 2003 (0.6/household), and allow for a relatively modest further increase before returning to more normal rate of growth. The ownership ratio would reach 0.82/household by 2010, consistent with 60% of households using air conditioners, and 1.35 air conditioners per household. A commensurate increase in non-residential ownership is also assumed. Regarding the impact of energy efficiency on this underlying projection, note that:
o The projection for emissions is somewhat flatter than for energy use. This reflects a projected reduction in the emissions intensity of electricity as generators become more efficient and switch from coal to fuels like gas and renewables that have lower emissions.
o It is assumed that 90% implementation is achieved in 2009 and 100% implementation from 2010. This makes a modest allowance for carry-over of non-complying stock that is acquired in the period before the formal introduction of the MEPS (October 2008).
o The proposed regulation is assumed to have a life of 10 years, terminating in October 2018. It is unreasonable to suppose that the efficiency of air conditioners purchased after 2018 would still be influenced by the 2008 MEPS. However the units purchased in the period to 2018 would deliver energy savings for the remainder of their lives, which would extend to about 2030.
o Suppliers anticipate the new MEPS by starting to introduce the more efficient units from 2007.
On these assumptions, the proposed regulation affects energy use and greenhouse emissions as follows:
o The reductions in energy use and emissions build to about 5.8% of the BAU scenario in 2018.
o Annual energy savings in 2018 are about 754 GWh per year and emissions are down by about 0.59 Mt CO2e per year.
o The savings account for about 1.3% of BAU energy use and emissions in 2010, which is the mid-point of the first commitment period (2008-12) under international arrangements to reduce greenhouse emissions.
o Over the life of the air conditioners affected by the regulation, total energy use and greenhouse emissions are reduced by about 7,808 GWh and 6.1 Mt CO2e respectively.
The second alternative, which is to adopt the next best European benchmarks, delivers about 37% of these benefits. Energy use and emissions are down by about 2.2% in 2018 and by 0.5% in 2010.
4.2 Impact on users Table 4.2 presents estimates of costs and benefits to users. Both costs and benefits are presented as impacts on the lifecycle costs of an air conditioner. Specifically, estimated increases in the installed cost of air conditioners are presented as a positive impact on the lifecycle cost – more efficient air conditioners are assumed to be more expensive. Benefits are presented as reductions in the present value of energy costs over the lifecycle, that is, as negative impacts on the total lifecycle costs of air conditioners. The net effect is a reduction in total lifecycle costs, also presented as a negative number. In all other respects the estimates in table 4.2 have been derived from standard cost-benefit analysis, with future values brought to account by discounting.
23

Proposal to increase MEPS for RACs and harmonise MEPS for single & three-phase units - Draft final RIS
TABLE 4.2: BENEFITS AND COSTS FROM A USER PERSPECTIVE Impact on lifecycle costs
Percentage increases in… Change in unit costs
($/kW)
Change in aggregate costs , 2008-2018
(present values, $M) Category of air conditioner
Effic-iency
Install cost
En’gy costs
Install costs
Net effect
En’gy costs
Install costs
Net effect
Benefit/ cost ratio
Proposed MEPS, equivalent to the 2004 Korean MEPS Split, CO, 0-4kW 8.7% 2.6% -12.6 8.8 -3.7 -10.6 7.5 -3.2 1.4
4-7.5 kW 6.2% 1.9% -12.1 4.4 -7.7 -14.0 5.1 -9.0 2.8 7.5-10 kW 6.4% 1.9% -12.4 6.2 -6.2 -3.5 1.7 -1.7 2.0 Split, RC, 0-4kW 9.0% 2.7% -11.5 11.6 0.1 -32.1 32.4 0.3 1.0
4-7.5 kW 6.3% 1.9% -10.6 5.8 -4.8 -97.5 53.0 -44.5 1.8 7.5-10 kW 6.4% 1.9% -10.6 8.0 -2.6 -21.8 16.4 -5.4 1.3 Unitary, CO, 0-4kW 3.0% 0.9% -5.1 2.0 -3.1 -9.7 3.8 -5.9 2.5
4-7.5 kW 3.3% 1.0% -6.6 1.7 -4.8 -7.3 1.9 -5.4 3.8 Unitary, RC, 0-4kW 3.2% 1.0% -4.5 2.3 -2.2 -5.1 2.6 -2.5 2.0
4-7.5 kW 3.2% 1.0% -5.4 1.9 -3.4 -7.1 2.6 -4.5 2.8 Total -208.7 127.0 -81.8 1.6
Alternate MEPS, based on next best European benchmark Split, CO, 0-4kW 4.7% 1.4% -7.0 4.0 -3.1 -5.9 3.3 -2.6 1.8
4-7.5 kW 1.7% 0.5% -3.5 1.0 -2.5 -3.9 1.1 -2.8 3.5 7.5-10 kW 1.8% 0.5% -3.7 1.5 -2.2 -1.0 0.4 -0.6 2.5 Split, RC, 0-4kW 4.9% 1.5% -6.4 5.2 -1.2 -18.0 14.6 -3.4 1.2
4-7.5 kW 1.8% 0.5% -3.1 1.4 -1.8 -27.7 12.1 -15.7 2.3 7.5-10 kW 1.8% 0.5% -3.1 1.9 -1.2 -6.3 3.8 -2.5 1.7 Unitary, CO, 0-4kW 1.8% 0.5% -3.0 1.0 -2.1 -5.4 1.7 -3.6 3.1
4-7.5 kW 1.8% 0.5% -3.7 0.8 -2.9 -4.2 0.9 -3.3 4.6 Unitary, RC, 0-4kW 1.8% 0.5% -2.6 1.1 -1.5 -2.9 1.2 -1.7 2.4
4-7.5 kW 1.8% 0.5% -3.0 0.9 -2.1 -4.0 1.2 -2.8 3.4 Total -79.2 40.3 -38.9 2.0
The underlying assumptions are briefly stated here; appendices 3 and 4 provide a full account.
o It is assumed that the increase in efficiency is the minimum required to achieve borderline compliance with the proposed MEPS.
o For reverse cycle units, the increase in the COP is set at 75% of the increase in the EER. (COP is a measure of efficiency in the heating cycle and is not directly regulated.)
o The impact on the installed cost of air conditioners has been assessed in terms of an assumed relationship between the percentage increase in efficiency and the percentage increase in installed cost. It is a two-stage process:
- For the alternative MEPS based on European benchmarks, the percentage increase in installed costs has been put at 25% of the increase in efficiency. That is, a 10% increase in efficiency is accompanied by a 2.5% increase in installed cost.
- For the further increase from the European benchmarks to the proposed MEPS, the percentage increase in cost has been put at 33% of the percentage increase in efficiency. This makes an allowance for increasing marginal costs of delivering further increases in efficiency.
o Estimates of the increase in installed cost were obtained by applying the percentage increase to baseline estimates of installed cost. The latter have been derived from the Rawlinsons Australian Construction Handbook (Rawlinsons 2004).
24

Proposal to increase MEPS for RACs and harmonise MEPS for single & three-phase units - Draft final RIS
o Estimates of the reduction in lifecycle energy cost have been obtained by applying the increase in efficiency to baseline estimates of lifecycle energy costs. The latter were based on the following assumptions:
- uniform asset life of 10 years; - discount rate of 10% in real terms; - residential and commercial energy charges of 12cents/kWh and 10cents/kWh
respectively. - residential and commercial operating hours or 500 and 1,500 hours per year
respectively; - 50:50 mix of cooling and heating hours for reverse cycle units.
o All cost and price estimates exclude GST. On these assumptions, the proposal would cost $127M and return benefits of about $209M. The net benefit is $82M and the overall benefit/cost ratio is 1.6. Most of these benefits are from split units of 4-7.5 kW, reflecting their large market share. The benefit/cost ratio varies considerably by type of air conditioner. For example, smaller splits return lower benefit/cost ratios reflecting shorter operating hours and higher baseline estimates of the installed cost per kW of cooling capacity. From the user perspective the European option is clearly second best. Sensitivity analysis There is considerable uncertainty about some of the parameters that determine the balance of costs and benefits. Sensitivity analysis of the benefit cost assessment is reported in table 4.3, indicating the nature and quantitative significance of the uncertainties. Relationship between COP and EER In the base case the increase in COP has been set at 75% of the increase in EER. A much weaker relationship, with COP increasing by only 50% of the increase in EER, would reduce the benefits by about 10%. Relationship between increase in installed cost and increase in efficiency There is little information to inform an assessment of cost increases, and most of that is from the US. Table 4.3 reports a sensitivity test for a large (50%) increase in the cost estimate. This reduces the net benefits to $19M and leaves the benefit/cost ratio at 1.1. Asset lives The available evidence on the life of air conditioners, all from overseas, indicates that our baseline setting of 10 years may be unreasonably short. However it is difficult to make sense of the reported sales of air conditioners, relative to stocks, without assuming a relatively short life. Testing on the upside, at 12 years, indicates that this is a significant parameter, increasing the estimate of benefits by about 11%. Trend in the cost of energy and appliances Like many manufactured products, the cost of air conditioners has fallen significantly over the last 10-20 years. A price series extracted from Rawlinsons Construction Cost Guide indicates that the real (inflation adjusted) cost of ducted systems fell by 42% between 1995 and 2004, and by 48% and 57% for split and wall/window types of RACs. Analysis of Australia’s trade data shows that the average price of imported units (in $US) has been falling at a trend rate of 3.7% per year. While this is crude figuring, and may be affected by changes in the composition of imports, it is consistent with trends in US prices for household appliances. These are reported by Meyer et al (2002) and indicate that the real cost of RACs fell at a trend rate of 4.7% per year over the period 1985-1998. Accordingly, the assumption for future appliance costs was tested on the downside. As noted in table 4.3, a 1% trend reduction in appliance costs adds about $5M to the value of the proposed regulation. A downwards trend of 2-3% per year would add $10-15M.
25

Proposal to increase MEPS for RACs and harmonise MEPS for single & three-phase units - Draft final RIS
TABLE 4.3: SENSITIVITY ANALYSIS OF IMPACT ON AGGREGATE ENERGY AND INSTALLATION COSTS, 2007-2016
Change in energy costs
(present values, $M)
Change in installation
costs (present values, $M)
Change in aggregate
lifecycle costs (present
values, $M)
Benefit/ cost ratio
Base case -208.7 127.0 -81.8 1.6
Relationship between COP and EER COP increases by 50% of increase in EER -186.4 127.0 -59.4 1.5
COP increases by 100% of increase in EER -230.4 127.0 -103.5 1.8
Relationship between increase in installed cost and increase in efficiency -25% -208.7 95.2 -113.5 2.2 +50% -208.7 190.4 -18.3 1.1
Asset lives Increased from 10 to 12 years -231.4 127.0 -104.5 1.8
Trends in the cost of appliances and electricity Appliance costs falling by 1% per year -208.7 121.7 -87.0 1.7
Electricity costs rising by 1% per year -236.5 127.0 -109.6 1.9
It is also reasonable to test on the upside for future trends in the cost of electricity. As noted in table 4.3, a 1% trend increase in electricity costs adds about $28M to the value of the proposed regulation. Ownership ratio The issue not addressed in table 4.3 is the ownership ratio. As discussed in appendix 3, it has been assumed that the large increases observed in the last few years will continue to 2005 before slowing to more moderate growth. However, there is a credible view that larger increases should be factored in. The net benefits from the proposal would increase accordingly. Equity considerations Expected increases in the market price of residential air conditioners would not have significant adverse equity implications. Based on the assessments provided in table 4.2, the increase in price would be in the order of $40-$80 for split units, up to $15 for unitary appliances, and would not be a significant impediment to the purchase of a long-lived asset such as an air conditioner. Most likely, cash-constrained buyers would purchase an air conditioner of marginally smaller capacity than otherwise, with costs substantially borne as some reduction in the functional value of the air conditioner in operation. It should also be kept in mind that, while total net benefits of the proposal may be positive, the benefits will be distributed unevenly between users, depending on the type of air conditioner used, the cost of energy and, most importantly, the intensity of use. Based on US assessments, a minority of low-intensity users will be worse off, at least in certain stages of the life cycle when dwellings are unoccupied for a large portion of the day, or where energy is particularly cheap. Lack of data on ownership patterns and user behaviour prevent more detailed quantitative assessment of these impacts.
26

Proposal to increase MEPS for RACs and harmonise MEPS for single & three-phase units - Draft final RIS
4.3 Business compliance costs The structure of the air conditioner industry is briefly explained in section 1.4. It can be summarised as follows:
o Virtually all RACs are imported; o the importation and wholesaling of RACs is dominated by 8 major brands that account
for 75% of sales; o a total of about 100 separate business entities may be involved in importing, with about
half of these operating on a small scale, importing a ‘container load’ at irregular intervals;
o several thousand businesses are engaged in the retailing, installation and maintenance of air conditioners.
The regulatory obligations fall entirely on the importer/wholesalers, which are regarded as the suppliers of air conditioners to the Australian market. In round figures, 50 of these may be small or medium-sized businesses. No change in the administrative arrangements No costs will be incurred on account of changes to the administrative arrangements. The requirements for product registration, including any associated testing, are unchanged, and would be required for the purposes of product labelling in any case, regardless of MEPS arrangements. However, there may be more paperwork during the adjustment phase, associated with the higher turnover of models. These are allowed for here as part of the adjustment costs. Adjustment costs – what are they? It is normal practice for suppliers of air conditioners to periodically upgrade the range of product that they offer to the market. Some models may be replaced quite regularly – say, every 2 years if not annually – although such changes are often only cosmetic. The cost of such alterations is a normal cost of doing business and would ultimately be recovered in the prices charged to customers. It is reasonable to expect some increase in these costs during the transition from an unregulated to a regulated regime. Any such additional costs may be regarded as ‘adjustment costs’. It is convenient to treat them here as ‘impacts on suppliers’ because it is not clear that abnormal adjustment costs can be fully passed onto customers in a highly competitive market7. Figure 4.3 puts this issue in this context. It shows an unregulated industry offering products with a broad range of energy efficiencies, initially weighted to the bottom of the range, but improving incrementally over time in line with background productivity improvements. The industry then shifts to a higher level in response to the introduction of MEPS in one or more stages (X1, X2 & X3) but resumes the normal rate of change thereafter, supported by periodic upward revision of MEPS (X4 & X5) to capture background improvements. Two factors drive the costs of adjustment associated with X1, X2 and X3. Firstly, the normal cycle of product renewal is interrupted during the transition period, shortening the life of products. The abnormal rate of product replacement will be associated with additional costs of reorganising the existing supply chain, for example:
o additional marketing costs, such as the printing of brochures, adjustment of marketing programs and communication with retailers;
7 This begs the question of how to distinguish between normal and abnormal costs. Arguably, suppliers understand that air conditioners are energy-intensive and that energy use has significant environmental consequences. The energy star labelling scheme has been in place for over a decade and MEPS have been discussed for almost as long. There should be a reasonable expectation that air conditioners will continue to attract the interest of regulators, with compliance costs built into the price structure.
27

Proposal to increase MEPS for RACs and harmonise MEPS for single & three-phase units - Draft final RIS
FIGURE 4.3: SCHEMATIC PRESENTATION OF TRANSITION TO HIGH EFFICIENCY PATH
Efficiency floor
Efficiency ceilingX = MEPS INCREASE
X1
X5X4 X3 X2
Efficiency
Time
o additional costs of regulatory compliance, including not only tests for energy
efficiency but also tests for safety and compatibility; o additional cost of providing repairers with training and information materials, or
reorganising arrangements for parts and maintenance; o additional cost of negotiating product specifications with manufacturers, including any
redesign or repackaging that may be required. The costs associated with a faster pace of change are reduced by the combination of advance, notice of new MEPS and provisions allowing one year for pre-MEPS stock to be cleared. This provides suppliers with options for integrating the required upgrades with their normal processes of product renewal. The impacts would be quite modest for the smaller products used in residential applications; their short lives create opportunities for a smooth transition. However, it may not be just a matter of accelerating the pace of change within a framework of familiar commercial relationships and technologies. The second cost factor is the possible need to abandon old relationships and to create new ones. For example, some suppliers may find that their existing manufacturers cannot supply complying product, requiring them to abandon those relationships and to forge new relationships with more capable manufacturers. Or they need to undertake research and development or otherwise redesign their product range. These costs can be contained by reducing the number of steps in the transition phase. As a final general observation, note that the adjustment costs associated with the transition phase deliver benefits over the long term, stretching beyond the life of the MEPS introduced during the transition phase. Referring again to figure 4,3, it is a once-only investment in the transformation of the industry that extends beyond the life of X3. Additional adjustment costs due to the proposal Suppliers are already committed to the adjustment costs associated with the existing 2007 MEPS. Our concern here is the amount of any additional adjustment costs associated with the more demanding proposal that is now put. Previous attempts to engage suppliers in the process of estimating these costs have been almost completely unsuccessful. The estimate provided in the RIS for the existing regulation was little more than guesswork. The component for single-phase units was only $3M but attracted no adverse comment from stakeholders. It was more than offset by the value of the
28

Proposal to increase MEPS for RACs and harmonise MEPS for single & three-phase units - Draft final RIS
AGO concessions on the number of models that needed to be tested for registration purposes. The low estimate is due to the following assumptions:
o A significant proportion of the non-complying models on the AGO register were identified as duplicates of other models or likely to have been replaced by more recent models. There is considerable scope for outdated models to accumulate in the register.
o It was assumed that a further proportion of the required replacements would be integrated with normal processes of model replacement, reflecting the high turnover of single-phase models under BAU conditions.
o Finally, it was assumed that a proportion of the replacement models could be introduced to the Australian market without incurring any additional costs of redesign or testing, and that some of the redesign costs would have been incurred in future years under the BAU scenario.
On these assumptions the average cost of renewing the product menu to comply with the existing 2007 MEPS was put at about $2,000 per non-complying model, of which there were about 1,500. The notion that tens of thousands of dollars needed to be spent for every such model was rejected. Turning now to the new proposal for 2008, the additional complication for suppliers in this case is that the schedule for change will become quite crowded. A two-step process of mandatory product renewal has been crowded into a time frame that previously accommodated only one mandatory renewal. This will reduce the opportunities to integrate the renewal process with normal processes of product renewal. The additional adjustment costs associated with the two-step process have been put at $9M, which is large, relative to the $3M estimate factored into the cost of the MEPS already scheduled for 2007. To repeat, this estimate has been developed with minimal input from suppliers. Impacts on employment and profitability The proposal is not expected to significantly affect the level of demand, which is expected to continue its strong growth over recent years. Similarly, there is no expectation that the proposals are of any general threat to employment in the supplier industry. However there may be significant adverse effects on smaller importer/wholesalers. Their adjustment costs would be spread over fewer sales in the first instance, although that would be a relatively temporary effect. The damage to their business would be greater over the longer term if they cannot establish suitable commercial relationships with suppliers of more efficient product.
4.4 Impact on government The impact of the proposals on the taxpayer will be minimal. Not only is the NAEEEP a relatively inexpensive program from the viewpoint of taxpayers, the majority of these costs would be incurred under BAU conditions. Once the proposed measures have been developed and implemented, there are few additional costs that can be attributed to the proposal. On the first point the ongoing costs of administering the MEPS initiative are in the order of $2M per year at most. This allows for the equivalent of two full-time staff members in each of the regulatory authorities of the larger states, a somewhat smaller resource commitment from the smaller states, and ongoing work by AGO staff at the national level. On the second point, the ongoing program of registration, monitoring and check-testing would be required for the purposes of the labelling program for single-phase units and the existing MEPS for three-phase units. The more demanding nature of the MEPS may justify some increase in the tempo of check-testing, at least for a period. However the additional costs would be less than $100,000 and can be safely ignored for the purposes of the RIS.
29
Proposal to increase MEPS for RACs and harmonise MEPS for single & three-phase units - Draft final RIS
4.5 National costs and benefits National costs and benefits are generally calculated as the sum of the costs and benefits falling on all parties – that is, users, suppliers and taxpayers. However there are two complications in this case. One is that some of the adjustment costs fall on the foreign owners of the multinational corporations that supply the Australian market; these do not strictly qualify as ‘national’ costs. This possibility is given no further consideration, if only because the adjustment costs have been assessed as relatively minor. The more difficult issue is the avoidable cost of electricity.
Avoidable cost of electricity The cost of electricity consists of the cost of electricity generation (including the energy lost as heat in transmission and distribution), the cost of network services (poles, wires and substations for transmission and distribution of electricity) and the market costs associated with functions such as metering, billing and advertising. These costs are recovered in the tariffs charged to users and users rightly look to the tariff schedules to determine the value of energy savings. However some of these costs are not avoidable. That is, they cannot be reduced by energy saving measures. Market costs are the obvious but relatively minor example, since market costs generally account for less than 5% of average costs. Less obviously, the large fixed costs of providing network services means that the marginal cost of providing additional network capacity is considerably less than the average costs. Based on a recent report to the Australian Building Codes Board8 (ABCB), the marginal network cost of a general increase in energy use might be reasonably put at about 30% of average network costs, although considerable uncertainty attaches to any such estimate. This is a more serious consideration since network costs account for about 70% of the average residential and small to medium commercial tariffs. If 70% of those costs are unavoidable, it follows that about half of the average cost of electricity is unavoidable (70% * 70% = 49%). However a further adjustment is required. Because network capacity is designed to cope with peak loads, the avoided network costs associated with any particular measure depends on the extent to which the measures reduce the peak load on the network. Some measures would have little or no impact on peak loads and would generate no such savings. Air conditioners are at the opposite extreme. In terms of the proportion of the energy that an appliance uses when the network is under peak load, air conditioners have a peak load factor that is 3-4 times greater than the average load profile that networks must accommodate9. It follows that, whereas the network savings associated with proportional reductions in all loads would be equal to about 30% of average costs, the network savings associated with more efficient air conditioners would be in the range 90-120% – that is, 3 to 4 times the 30%. Note the possibility that reduction in network costs associated with more efficient air conditioners may actually exceed the average cost of network services10. Given these particular circumstances arising from the peak load demands of air conditioners, it is reasonable to regard the marginal tariff as a conservative estimate of the avoided cost of electricity. This is particularly so given that generation costs also increase under peak loads, which means that air conditioners incur higher-than-average generation costs as well. Accordingly, the average electricity tariff has been retained as a reasonable estimate of the avoided costs of supplying the energy used by air conditioners.
8 Atech (2003), A Financial Analysis Procedure for Energy Efficiency in Buildings, Report to the Australian Building Codes Board 9This estimate reflects parameters developed by the Lawrence Berkeley National Laboratories (LBNL) and presented in a report to the US Department of Energy - LBNL (1997). The discussion there is in terms of the Conservation Load Factors of different appliances, and variations in the amount of energy that must be saved to reduce peak loads by 1 kW. 10 Mandatory load control is one further option being considered to help manage peak loads. This would require air conditioners to be configured for remote control by the utility.
30

Proposal to increase MEPS for RACs and harmonise MEPS for single & three-phase units - Draft final RIS
Findings Table 4.4 presents the cost benefit analysis from a national perspective. It is not very different from the user perspective. The main reason is that the electricity tariff is a reasonable approximation of the avoidable cost of electricity. This is not generally the case in industries with large fixed costs; it reflects the large share of energy savings that occur in peak periods. Also, the additional adjustment costs incurred by suppliers are small relative to user benefits. Table 4.4 also reports an additional set of sensitivity tests. It shows the impact of alternative estimates of the avoidable cost of electricity networks. We consider that the load profile of RACs is such that, at a minimum, the avoidable cost can be set equal to the average cost of networks (i.e., 100% of average cost). TABLE 4.4: BENEFITS AND COSTS FROM A NATIONAL PERSPECTIVE ($M, 2007-2016)
Impact on lifecycle costs of air conditioners acquired in the period 2008-2018 (present values, $M)
Avoidable energy costs
Installed cost of air
conditioners
Supplier adjustment
costs Net change
Benefit/ cost ratio
New proposal, based on 2004 Korean MEPS
-208.7 127.0 9.0 -72.8 1.5
Alternative proposal, based on next best European benchmarks
-79.2 40.3 9.0 -29.9 1.6
Sensitivity test for estimate of avoidable network costs 0% of average cost -68.4 127.0 9.0 67.6 0.5 50% of average cost -138.5 127.0 9.0 -2.6 1.0 100% of average cost -278.9 127.0 9.0 -142.9 2.1 150% of average cost -278.9 127.0 9.0 -142.9 2.1
31
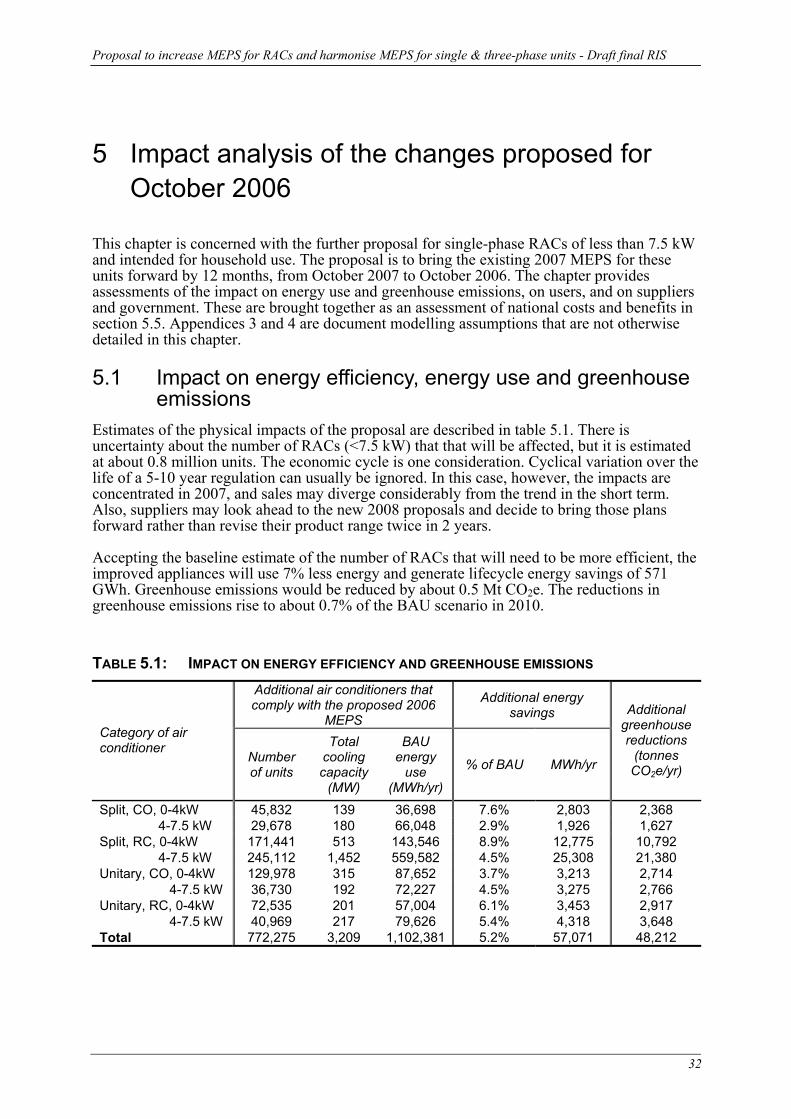
Proposal to increase MEPS for RACs and harmonise MEPS for single & three-phase units - Draft final RIS
5 Impact analysis of the changes proposed for October 2006
This chapter is concerned with the further proposal for single-phase RACs of less than 7.5 kW and intended for household use. The proposal is to bring the existing 2007 MEPS for these units forward by 12 months, from October 2007 to October 2006. The chapter provides assessments of the impact on energy use and greenhouse emissions, on users, and on suppliers and government. These are brought together as an assessment of national costs and benefits in section 5.5. Appendices 3 and 4 are document modelling assumptions that are not otherwise detailed in this chapter.
5.1 Impact on energy efficiency, energy use and greenhouse emissions
Estimates of the physical impacts of the proposal are described in table 5.1. There is uncertainty about the number of RACs (<7.5 kW) that that will be affected, but it is estimated at about 0.8 million units. The economic cycle is one consideration. Cyclical variation over the life of a 5-10 year regulation can usually be ignored. In this case, however, the impacts are concentrated in 2007, and sales may diverge considerably from the trend in the short term. Also, suppliers may look ahead to the new 2008 proposals and decide to bring those plans forward rather than revise their product range twice in 2 years. Accepting the baseline estimate of the number of RACs that will need to be more efficient, the improved appliances will use 7% less energy and generate lifecycle energy savings of 571 GWh. Greenhouse emissions would be reduced by about 0.5 Mt CO2e. The reductions in greenhouse emissions rise to about 0.7% of the BAU scenario in 2010. TABLE 5.1: IMPACT ON ENERGY EFFICIENCY AND GREENHOUSE EMISSIONS
Additional air conditioners that comply with the proposed 2006
MEPS
Additional energy savings
Category of air conditioner
Number of units
Total cooling capacity
(MW)
BAU energy
use (MWh/yr)
% of BAU MWh/yr
Additional greenhouse reductions
(tonnes CO2e/yr)
Split, CO, 0-4kW 45,832 139 36,698 7.6% 2,803 2,368 4-7.5 kW 29,678 180 66,048 2.9% 1,926 1,627 Split, RC, 0-4kW 171,441 513 143,546 8.9% 12,775 10,792 4-7.5 kW 245,112 1,452 559,582 4.5% 25,308 21,380 Unitary, CO, 0-4kW 129,978 315 87,652 3.7% 3,213 2,714 4-7.5 kW 36,730 192 72,227 4.5% 3,275 2,766 Unitary, RC, 0-4kW 72,535 201 57,004 6.1% 3,453 2,917 4-7.5 kW 40,969 217 79,626 5.4% 4,318 3,648 Total 772,275 3,209 1,102,381 5.2% 57,071 48,212
32

Proposal to increase MEPS for RACs and harmonise MEPS for single & three-phase units - Draft final RIS
5.2 Impact on users Table 5.2 presents estimates of the costs and benefits to users, mostly using the same cost benefit parameters (asset life, discount rate, energy tariffs, etc.) as for the new 2008 proposals. There is one difference; the percentage increase in installed cost has been put at 25% of the percentage increase in efficiency, which is the cost/efficiency relationship assumed for the European benchmarks. This is slightly weaker than the cost/efficiency relationship assumed for the more demanding Korean MEPS, for which the increase in installed cost was put at 33% of the percentage increase in efficiency. On these assumptions, earlier application of the 2007 MEPS would return energy savings worth $28M, at the expense of an additional $16M for the installed cost of air conditioners. The net benefit is $12M and the overall benefit/cost ratio is 1.8. The benefit/cost ratio increases with the size of the unit, reflecting more intensive use and lower unit cost of larger units ($/kW).
Sensitivity analysis Sensitivity analysis indicates that the cost benefit analysis is robust – see table 5.3. The most significant threats are that the increase in installation costs has been underestimated or that the additional sales affected by the measure have been overestimated. Our assessment of these uncertainties is expressed in the table. Specifically, a large (50%) increase in the estimate of the additional installation costs reduces the net benefit to $5M and the benefit cost ratio to 1.2. A significant reduction in the sales estimate (-30%) reduces the net benefit to $9M but leaves the benefit cost ratio unchanged.
5.3 Business compliance costs As discussed in section 4.3, the impact on suppliers is equated with costs of adjustment that may be incurred by suppliers as they respond to MEPS. They need not only change more rapidly than is usual but also make more demanding changes than is usual. However previous attempts to engage suppliers in estimating these costs have not been successful. The estimates presented here are guesstimates. One consideration in the present case is that the 2006 proposal provides for better separation of the existing 2007 MEPS increase and the newly proposed 2008 MEPS increase. The interval is increased from 1 to 2 years, creating more opportunities to integrate the changes with normal processes of product renewal. However, it is at the expense of an earlier initial increase TABLE 5.2: BENEFITS AND COSTS FROM A USER PERSPECTIVE
Impact on lifecycle costs Percentage
increases in… Change in unit costs (present values, $/kW)
Change in aggregate costs , 2006-2008
(present values, $M) Category of air conditioner
Effic-iency
Install cost
En’gy costs
Install costs
Net effect
En’gy costs
Install costs
Net effect
Benefit cost ratio
Split, CO, 0-4kW 10.4% 2.6% -16.3 8.8 -7.6 -1.3 0.8 -0.5 1.6 4-7.5 kW 4.3% 1.1% -8.9 2.5 -6.4 -1.0 0.3 -0.7 3.0 Split, RC, 0-4kW 14.8% 3.7% -20.1 15.7 -4.4 -5.9 5.4 -0.5 1.1 4-7.5 kW 8.0% 2.0% -14.4 6.1 -8.3 -12.9 6.5 -6.5 2.0 Unitary, CO, 0-4kW 4.7% 1.2% -8.2 2.6 -5.6 -1.5 0.6 -0.9 2.7 4-7.5 kW 6.8% 1.7% -14.1 3.0 -11.1 -1.7 0.4 -1.3 4.0 Unitary, RC, 0-4kW 9.6% 2.4% -13.9 5.7 -8.2 -1.6 0.8 -0.8 2.1 4-7.5 kW 9.7% 2.4% -16.5 4.9 -11.6 -2.2 0.8 -1.4 2.9
33
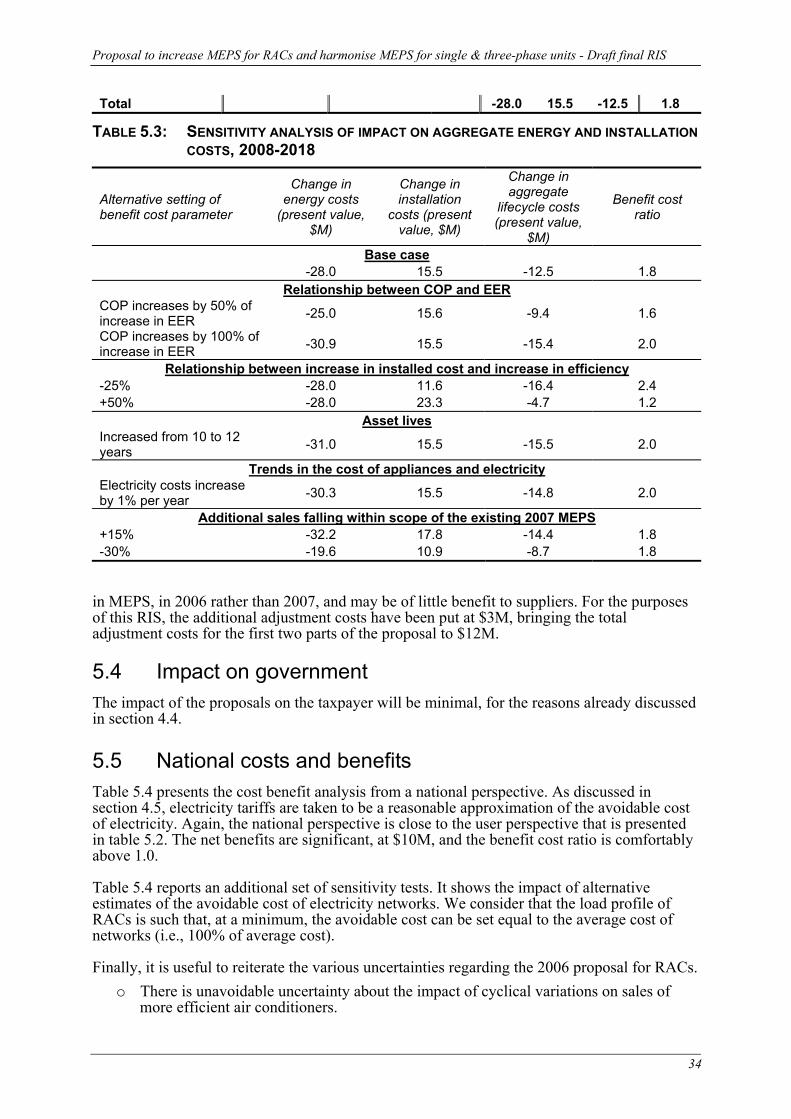
Proposal to increase MEPS for RACs and harmonise MEPS for single & three-phase units - Draft final RIS
Total -28.0 15.5 -12.5 1.8
TABLE 5.3: SENSITIVITY ANALYSIS OF IMPACT ON AGGREGATE ENERGY AND INSTALLATION COSTS, 2008-2018
Alternative setting of benefit cost parameter
Change in energy costs
(present value, $M)
Change in installation
costs (present value, $M)
Change in aggregate
lifecycle costs (present value,
$M)
Benefit cost ratio
Base case -28.0 15.5 -12.5 1.8
Relationship between COP and EER COP increases by 50% of increase in EER -25.0 15.6 -9.4 1.6
COP increases by 100% of increase in EER -30.9 15.5 -15.4 2.0
Relationship between increase in installed cost and increase in efficiency -25% -28.0 11.6 -16.4 2.4 +50% -28.0 23.3 -4.7 1.2
Asset lives Increased from 10 to 12 years -31.0 15.5 -15.5 2.0
Trends in the cost of appliances and electricity Electricity costs increase by 1% per year -30.3 15.5 -14.8 2.0
Additional sales falling within scope of the existing 2007 MEPS +15% -32.2 17.8 -14.4 1.8 -30% -19.6 10.9 -8.7 1.8
in MEPS, in 2006 rather than 2007, and may be of little benefit to suppliers. For the purposes of this RIS, the additional adjustment costs have been put at $3M, bringing the total adjustment costs for the first two parts of the proposal to $12M.
5.4 Impact on government The impact of the proposals on the taxpayer will be minimal, for the reasons already discussed in section 4.4.
5.5 National costs and benefits Table 5.4 presents the cost benefit analysis from a national perspective. As discussed in section 4.5, electricity tariffs are taken to be a reasonable approximation of the avoidable cost of electricity. Again, the national perspective is close to the user perspective that is presented in table 5.2. The net benefits are significant, at $10M, and the benefit cost ratio is comfortably above 1.0. Table 5.4 reports an additional set of sensitivity tests. It shows the impact of alternative estimates of the avoidable cost of electricity networks. We consider that the load profile of RACs is such that, at a minimum, the avoidable cost can be set equal to the average cost of networks (i.e., 100% of average cost). Finally, it is useful to reiterate the various uncertainties regarding the 2006 proposal for RACs.
o There is unavoidable uncertainty about the impact of cyclical variations on sales of more efficient air conditioners.
34

Proposal to increase MEPS for RACs and harmonise MEPS for single & three-phase units - Draft final RIS
o The increase in adjustment costs is uncertain. o Supplier preparations for October 2006 have already started, which means that some of
the adjustment costs have been incurred already and are not reversible. TABLE 5.4: BENEFITS AND COSTS FROM A NATIONAL PERSPECTIVE
Impact on lifecycle costs of air conditioners acquired in the period 2007-2016 (present values, $M)
Avoidable energy costs
Installed cost of air
conditioners
Supplier adjustment
costs Net change
Benefit/ cost ratio
Base case
National costs & benefits
-28.0 15.5 3.0 -9.5 1.5
Sensitivity test for estimate of avoidable network costs 0% of average cost -9.0 15.5 3.0 9.5 0.5 50% of average cost -18.5 15.5 3.0 0.0 1.0 100% of average cost -28.0 15.5 3.0 -9.5 1.5 150% of average cost -37.5 15.5 3.0 -19.0 2.0
35

Proposal to increase MEPS for RACs and harmonise MEPS for single & three-phase units - Draft final RIS
6 Harmonise MEPS for single-phase and three-phase air conditioners
The third part of the proposal is to eliminate historical differences between the MEPS applying to single-phase and three-phase air conditioners. Currently there are several sub-markets where different MEPS apply to single-phase and three-phase appliances with the same range of applications.
6.1 About the proposal Single-phase units dominate sales of air conditioners with less than 10 kW cooling capacity and three-phase units dominate where capacity exceeds 10 kW. It is therefore proposed to retain the existing arrangements for single-phase units with less than 10kW cooling capacity and require all three-phase models <10kW to comply with the single-phase arrangements. Conversely, it is proposed to retain the existing arrangements for three-phase units with greater than 10kW cooling capacity and require the all single-phase models >10kW to comply with the three-phase arrangements. The phase differences are thereby eliminated with minimum disruption. There are several sub-markets where standardisation would have little or no effect, as follows:
o Single-phase non-ducted air conditioners >10kW: Under existing arrangements these units must achieve a minimum EER of 2.75 by 2007, which is the same requirement for three-phase units in the range 10-19kW. A higher EER will be required of three-phase units greater than 19kW but there are no single-phase non-ducted units of the larger size.
o Three-phase split air conditioners <7.5kW: The AGO register contains only one 3-phase split model <7.5kW. This is a trivial proportion of the 1,500 models in the smaller sizes and can be ignored for the purposes of this RIS.
o Three-phase unitary air conditioners <10kW: The available market data suggests that sales of these types would be less than 50/year, and the AGO register contains no 3-phase window/wall models.
Significant impacts occur in the following markets:
o Three-phase non-ducted split air conditioners, 7.5-10kW: The effect of the proposal will be to increase the minimum EER for these units from 2.75 to 2.93. This would be implemented from 2008 and keeps to the proposed schedule for single-phase units, following the Korean lead set in 2004. (In fact, the proposal would fully implement the Korean MEPS, which makes no distinction between single-phase and three-phase units.) Three-phase models account for about 25% of the registered non-ducted splits in this range. Using model weights, it would be reasonable to put prospective sales in the range 15,000-20,000/year. None of the existing 3-phase models comply with the Korean standard.
o Ducted air conditioners: Under existing arrangements, single-phase ducted units would require an EER of 2.50 from 2008, and three-phase models would require 2.75. The proposal is to put all models <10kW on 2.50 in 2007 and all models >10kW on levels applicable to the corresponding three-phase capacity categories. Applying model weights to the available market data, annual sales are about 4,000/year for each category.
36

Proposal to increase MEPS for RACs and harmonise MEPS for single & three-phase units - Draft final RIS
6.2 Impact of the proposal Table 6.1 reports estimates of the costs and benefits. These are small relative to the first two parts of the proposal. The net benefit is $5M, compared with $73M and $10M for parts one and two respectively. Almost all these benefits are delivered by the increased efficiency of three-phase non-ducted splits. Regarding the ducted units, the benefits from more efficient single-phase units are neutralised by the reduced efficiency of three-phase units. We also find that:
o The findings are robust for reasonable variations in estimates of additional installation costs, energy savings and asset lives.
o The associated reductions in energy use and greenhouse emissions are also relatively small – at about 269 GWh and 0.2 MT CO2e respectively over the life of the air conditioners affected by this part of the regulation.
This figuring has not been separately tabulated, but is consistent with the findings reported in chapters 4 and 5. TABLE 6.1 BENEFITS AND COSTS FROM A USER PERSPECTIVE
Aggregate impact on lifecycle costs ($ million, 2008-2018)
Annual sales (2008, MW of
cooling capacity)
Energy savings
(MWh/year for 2008 cohort)
Installed cost Energy costs Net
change
Benefit cost ratio
Three-phase non-ducted split air conditioners, 7.5-10kW Cooling only 42.9 769.8 1.63 -3.85 -2.22 2.4 Reverse cycle 110.9 1,643.9 5.46 -8.55 -3.09 1.6 Sub-total 153.8 2,413.8 7.09 -12.40 -5.31 1.7
Ducted air conditioners 3-ph, CO, <10kW 1.8 -19.8 0.04 -0.08 -0.05 na 3-ph, RC, <10kW 68.9 -1,331.3 2.53 -5.68 -3.15 na 1-ph, CO, >10kW 5.3 0.0 0.00 0.00 0.00 na 1-ph, RC, >10kW 101.1 1,375.9 -2.48 5.87 3.39 2.4 Sub-total 177.1 24.8 0.09 0.11 0.20 na Total 331.0 2,438.6 7.18 -12.29 -5.11 1.7
The cost benefit analysis from a national perspective is reported in table 6.2, and also consistent with the findings reported in chapters 4 and 5. This includes a commensurate allowance for additional adjustment. We find that:
o There is little difference between the user and national perspective. o Sensitivity tests indicate that the positive finding is robust, except in the case where
avoidable network costs are set at unreasonably low levels – at 0% or 50% of average network costs.
37

Proposal to increase MEPS for RACs and harmonise MEPS for single & three-phase units - Draft final RIS
TABLE 6.2: BENEFITS AND COSTS FROM A NATIONAL PERSPECTIVE Impact on lifecycle costs of air conditioners acquired in
the period 2007-2017 (present values, $ million) Avoidable
energy costs
Installed cost of air
conditioners
Supplier adjustment
costs Net change
Benefit/ cost ratio
Base case
National costs & benefits
-12.3 7.2 0.25 -4.9 1.7
Sensitivity test for estimate of avoidable network costs 0% of average cost -3.9 7.2 0.25 3.5 0.5 50% of average cost -8.1 7.2 0.25 -0.7 1.1 100% of average cost -12.3 7.2 0.25 -4.9 1.7 150% of average cost -16.5 7.2 0.25 -9.0 2.2
38

Proposal to increase MEPS for RACs and harmonise MEPS for single & three-phase units - Draft final RIS
7 Consultation The issues related to energy efficiency programs for air conditioners generally, and MEPS in particular, have received considerable exposure over the last 10 years. This section provides a chronology of previous reports and consultations (section 7.1) and a more detailed account of the consultations undertaken to develop the existing proposals.
7.1 History of the existing MEPS arrangements October 2001 MEPS The following table provides the history of the consultative process leading up to the introduction of the preliminary MEPS for three-phase air conditioners in October 2001. 1993 National review of feasibility of MEPS for household air conditioners (and
other household appliances) by GWA 1994 National review of feasibility of MEPS for commercial air conditioners by
Energetics, Unisearch and GWA April 1994 Packaged air conditioners identified as one of the products potentially
suitable for MEPS and/or labelling, in Energetics 1994. March 1995 DPIE holds meeting in Sydney to discuss issues related to air conditioners.
Attended by representatives of AREMA, 4 suppliers electricity utilities, professional and standards associations and governments.
February 1996 Unisearch organises meeting in Sydney to discuss proposed MEPS program. Principles of “low-level” MEPS discussed, but actual levels not yet determined. Attended by representatives of AREMA, 19 suppliers (out of 65 invited).
March 1996 Unisearch reports to DPIE on changes affecting the air conditioner market since 1994, and on feedback from industry meetings.
June 1998 Unisearch reports to DPIE on energy efficiency program for air conditioners, including recommended MEPS levels and information disclosure provisions.
November 1999 Mechlab reports to AGO on proposals for revision of AS3823 Part 2 and a new Part 3 to give effect to recommended MEPS levels and option of computer simulation testing.
March 2000 Standards Australia issues drafts of new AS/NZS 3823 Part 1.2, revised AS/NZS 3823 Part 2, new AS/NZS 3823 Part 3. Comment period closed 30 April 2000.
March 2000 Before preparing the draft RIS, GWA presents issues paper (GWA 2000) to a steering group comprising members of AREMA.
August 2000 Air conditioner challenge - report on voluntary options, by EnergyConsult August 2000 Preliminary draft RIS circulated to AREMA members. GWA presents
preliminary findings at AREMA meeting MEPS for October 2004 and October 2007 The NAEEEC then commenced work on the proposals for new single-phase MEPS for 2004 and revised MEPS for 2007. GWA provided the NAEEEC with a second review of MEPS
39

Proposal to increase MEPS for RACs and harmonise MEPS for single & three-phase units - Draft final RIS
feasibility in December 2001 and a review of overseas MEPS was released in May 2002 (EnergyConsult 2002). This was followed by the industry meetings listed below. A consultation document (NAEEEC 2002) was also released, asking for comments by 1 November 2002. 27 March, 2002 Seminar on MEPS, Air Conditioning, Refrigeration and Building
Services Exhibition, Sydney Convention and Exhibition Centre 30 May 2002 Presentation to AREMA general meeting, Sydney 5 June 2002 Air Conditioner MEPS Steering Committee Meeting, Sydney 16 August 2002 Three-phase air conditioners – Potential MEPS 2007 Being Part Of
The Solution, Conference, Sydney 31 October 2002 MEPS Training Future Directions, Sydney 25 March 2003 NAEEEC Forum, Melbourne Regarding development of the relevant standard, Standards Australia issued a draft of a revised Part 2 of AS/NZS 3823 on 6 March 2003, asking for comment by 8 May 2003. Following some minor amendments (to accommodate changes in certain tests and to include water-cooled air conditioners), the new standard was formally adopted in November 2003. A number of consultative activities in connection with the drafting of the RIS for the 2007 MEPS, are as follows: June 2003 Phone interviews with a sample of 11 suppliers August 2003 Draft RIS released, with comments received to the end of October. September 2003 Presentation of draft RIS to the Air conditioner MEPS Steering
Committee October 2003 Request for information issued to industry, to address issues raised by
the Air conditioner MEPS Steering Committee No submissions were received in response to the draft RIS for the 2007 MEPS. The RIS was finalised in December 2003.
7.2 Consultations for the new 2006 and 2008 proposals The NAEEEC first re-opened discussions with industry in April 2004, presenting new evidence that more efficient air conditioners are already available. At the same time mainstream adoption of residential air conditioning had created a sense of urgency about the capital cost of the network enhancements and peak generating capacity needed to accommodate the increase in electricity usage. There was broad industry agreement that the October 2007 MEPS for household RACs less than 7.5 kW could be brought forward by 18 months. Subsequently, the NAEEEC responded to the Korean initiative by re-opening the issue of the medium term stringency of the MEPS. The NAEEEC released a series of analytical publications in late 2004 and early 2005:
o a longer term strategy for the demand management of small air conditioners in November 2004 (GWA 2004);
o an international review of MEPS in January 2005 (EnergyConsult 2005); o analysis of electrical peak loads in Victoria for 1999-2003 (EES 2005)
40

Proposal to increase MEPS for RACs and harmonise MEPS for single & three-phase units - Draft final RIS
The NAEEEC published the consultation RIS in February 2005 (Syneca 2005) and followed up with a presentation to industry in March 2005. A revised version of the relevant standard (AS/NZS3823.2), incorporating the new MEPS, is scheduled for the second half of 2005. In the consultation RIS, the NAEEEC actually proposed a more demanding schedule than is presented in this document. It was proposed to implement the Korean MEPS from October 2007 and create an intermediate step for household RACs less than 7.5kW, the latter achieved by bringing the existing October 2007 MEPS forward to April 2006. This drew a critical response from industry associations and from two suppliers, Panasonic and Daikin. Their responses are summarised here, followed by a statement of the NAEEEC’s response and a summary of the changes made to the RIS. Air conditioning and Refrigeration Equipment Manufacturers Association (AREMA)
MEPS level o Before imposing unquantifiable adjustment costs on the industry, the AGO should
obtain and test 6.8kW and 8.8kW Korean high efficiency models in an accredited Australian lab to validate and accurately benchmark the high efficiency claims.
o Consideration should be given to the adoption of European benchmarks. o Given the extreme efficiencies that would be required by the new MEPS, the standard
should incorporate a 5% tolerance or safety margin for testing purposes. o AREMA argues a case for allowing suppliers of wall/window units to keep some non-
complying product in the market provided the sales-weighted average efficiency of their products exceeded the MEPS. This is proposed as a low cost means of phasing out wall/window products. These are said to have a declining market share and mostly for replacement purposes.
Lead time and transition costs o The proposed timetable will impose substantial transition costs on suppliers and
ultimately consumers. o Industry originally agreed to bring the 2007 MEPS forward on the understanding that
there would be no further changes for 5 years. Policing
o The new regulations have been proposed before existing regulations are adequately policed.
Other assumptions in the RIS o The benefit cost analysis should take the current 2004 MEPS as the business-as-usual
situation, in preference to the MEPS that are scheduled for October 2007. Consumer Electronics Suppliers Association (CESA) Lead time and transition costs
o CESA expressed concern that they were not consulted earlier about the proposal to bring the October 2007 MEPS forward to April 2006. They should have been consulted at the same time as AREMA, especially given that members of CESA sell more RACs than members of AREMA. Although some suppliers belong to both associations, it can’t be assumed that AREMA will advise CESA.
o The proposed schedule does not allow sufficient time for manufacturers to conduct R&D, redesign, develop, trial, test, transport and market new and amended product.
o CESA requires at least 3 years notice from regulation being finalized and members are strongly opposed to 18 months between first and second stage.
41

Proposal to increase MEPS for RACs and harmonise MEPS for single & three-phase units - Draft final RIS
o The RIS made unrealistic assumptions about the degree to which the effective implementation of the RIS could be deferred by the carry-over of non-complying stock.
Australian Electrical and Electronic Manufacturers Association (AEEMA)
MEPS level o A shortage of high efficiency compressor manufacturers makes the RIS targets
difficult to meet. o Due to the small global market that Australia represents, it is not economically viable
to redesign this product for the Australian market, particularly as it is in the mature phase of its life cycle.
o MEPS requirements may be difficult to achieve across the full range of products, including both split and window/wall units, both cooling only and reverse cycle units, and units with and without inverters. The MEPS should be reviewed to ensure that these levels can be achieved.
Lead time and transition costs o The proposed timeframe is unrealistic. To complete the cycle from conception to
implementation manufacturers would need at least 3 years after publication of a new standard. Major redesign is required – involving R&D, product development, tooling, manufacturing, planning, field trials, product construction, shipping etc. For example, the timeframe for refrigerator MEPS was 3 years after completion of the standard.
o Manufacturers can only commit to manufacturing product based on an actual regulation, that is, an actual change to the standard, not on a draft RIS. However the proposed implementation data of April 2006 is only 12 months away and the new standard is not yet in place.
o The requirement for the second MEPS levels in October 2007 is also impractical for suppliers to achieve.
o The RIS made unrealistic assumptions about the degree to which the effective implementation of the RIS could be deferred by the carry-over of non-complying stock.
Policing o Industry requires a national policing measure that ensures small suppliers are check
tested without the cost being borne by large suppliers or industry association members. Other assumptions in the RIS
o Heating efficiency gains achieved with reverse cycle air conditioning are not considered in the RIS. If these energy savings were promoted by the AGO considerable reductions in greenhouse gas emissions from heating would be achieved.
Panasonic If you apply proposed new MEPS levels, some of our models cannot sell any more. If you introduce this kind of very high MEPS level, we need at least 3 years to re-design new and existing models. Daikin Daikin participated in AREMA’s submission and supports their comments in general. However, given that industry has agreed to bring the existing 2007 MEPS (for units < 7.5 kW) forward to April 2006, Daikin considers that it would be difficult to now reject the proposal. Regarding the further transition to the new MEPS that are proposed for October 2007, Daikin says that more time is needed. Daikin considers that anything less than 5 years lead time is too
42

Proposal to increase MEPS for RACs and harmonise MEPS for single & three-phase units - Draft final RIS
short for manufacturers to adjust to new MEPS. This is the lead time typically allowed in Japan, except for special cases. And 5 years is a reasonable lead time given the development situation and total development schedule. Daikin says they cannot accept the further increase at this late stage. The NAEEEC’s response The NAEEEC’s response has been to:
o defer the Korean-based MEPS by 12 months, with a corresponding 6 month deferral to the intermediate step;
o give an undertaking that conflicting claims about the availability of more efficient product will be tested by importing a selection of units from major suppliers and having them tested in independent Australian laboratories;
o reaffirm its commitment to make no further changes to the MEPS regime until October 2012;
o reaffirm its commitment to pro-active policing of the regulations rather than simply responding to complaints about unfair competition from non-complying products.
Important considerations for the NAEEEC have been:
o There is evidence that more efficient products are available in all major markets around the world, summarised in appendix 2 of this RIS.
o Australia’s supply structure is not unusual. It is dominated by the supplier brands and manufacturing countries that provide high efficiency products to markets throughout the world.
o Australia should continue to take its regulatory lead from the standards adopted by its major suppliers, which are Asian, not European.
o It is accepted that significant lead times are incorporated into the regulatory schedules of the major manufacturing countries, leading up to the implementation of their MEPS. However, these processes are complete before the cycle starts in Australia, since Australia follows the implementation of those MEPS with a further lag. The NAEEEC therefore takes into consideration that (a) Australia does not require new product to be developed from scratch, but for existing products to be modified, and (b) the development lag allowed by Australia is in addition to development lags in major supplying countries.
o Adoption of the next-best European benchmarks would deliver only about 40% of the gains expected by adopting the new Korean MEPS.
o While suppliers put considerable value on the additional lead time, the NAEEEC is concerned that there is a significant loss of net benefits to users. An additional year of lead time has been provided for the Korean-based MEPS, reducing the net benefit by $12-16 M. Deferral of the intermediate MEPS, from April to October 2006, will reduce net benefits by $3-5 M.
Changes to the RIS The following changes have been made to this final RIS, compared with the draft that was circulated for consultative purposes.
o It is accepted that the RIS made unrealistic assumptions about the degree to which the effective implementation of the RIS could be deferred by the carry-over of non-complying stock. The benefit cost calculations are now based on the assumption that, for major suppliers, there would be relatively few sales of non-complying product after the implementation date.
o The timeframe for the benefit cost assessments has been altered to preserve a 10 year life for the proposed regulation.
43

Proposal to increase MEPS for RACs and harmonise MEPS for single & three-phase units - Draft final RIS
Certain suggestions made by stakeholders have not been adopted. First, the suggestion that a sales-weighted compliance scheme be adopted for certain types of products has not been explicitly considered. This would be a major change to the regulatory regime in Australia, potentially requiring industry-wide reporting of sales data to government and significant increases in administration and compliance costs. Second, the existing regulation has been taken as defining the BAU scenario after 2007. The effect is to accept that that decision had been taken and it is necessary to focus on the impacts of any further changes relative to the status quo.
44

Proposal to increase MEPS for RACs and harmonise MEPS for single & three-phase units - Draft final RIS
8 Recommendations It is recommended that States and Territories implement the proposals to:
o apply more stringent MEPS to RACs up to 10 kW from October 2008, effectively following the Korean lead;
o require an intermediate increase for household RACs less than 7.5 kW from October 2006, effectively bringing the existing 2007 MEPS for these units forward by 1 year;
o eliminate MEPS differences between single-phase and three-phase units. This will require State and Territories to adopt amended regulations governing appliance energy labelling and MEPS. Tables 8.1, 8.2 and 8.3 summarise our assessments of the options against the objectives of the proposed regulation. TABLE 8.1 ASSESSMENT SUMMARY – PROPOSALS FOR OCTOBER 2008 Objective RECOMMENDED OPTION
Implement new MEPS for RACs based on most recent Korean MEPS
SECOND BEST OPTION Implement new MEPS for RACs based
on next best European benchmarks
Reduction in greenhouse emissions
Greenhouse emissions from the targeted categories of air conditioner will be reduced by about 1.3% in 2010.
Greenhouse emissions from the targeted air conditioners will be reduced by about 0.5 % in 2010.
Cost effective for users
Total benefits exceed total costs by a significant margin - $73M. But there would be some losers amongst those with low energy costs or who use air conditioners sparingly.
Total benefits exceed total costs by a lesser margin - $30M. There would be fewer losers amongst those with low energy costs or who use air conditioners sparingly.
Minimise adverse effects on manufacturers and suppliers
The additional adjustment cost to suppliers has been estimated at $9M, excluding costs that will be incurred to implement the existing 2007 MEPS.
The additional adjustment cost to suppliers has been estimated at $9M, excluding costs that will be incurred to implement the existing 2007 MEPS.
Minimise potential for confusion or ambiguity
There is some potential for confusion because the new MEPS will be implemented only 1 year after the existing 2007 MEPS. The larger suppliers, accounting for the bulk of the industry, are already aware of the proposals. The remaining communications issues need to be identified and addressed by NAEEEC.
There is some potential for confusion because the new MEPS will be implemented only 1 year after the existing 2007 MEPS. The larger suppliers, accounting for the bulk of the industry, are already aware of the proposals. The remaining communications issues need to be identified and addressed by NAEEEC.
45

Proposal to increase MEPS for RACs and harmonise MEPS for single & three-phase units - Draft final RIS
TABLE 8.2 ASSESSMENT SUMMARY – PROPOSALS FOR OCTOBER 2006 Objective RECOMMENDED OPTION
Implement October 2006 proposals for household RACs <7.5 kW
SECOND BEST OPTION (BAU) Abandon October 2006 proposals for
household RACs <7.5 kW
Reduction in greenhouse emissions
Greenhouse emissions from the targeted air conditioners will be reduced by about 0.7% in 2010, relative to the BAU scenario.
Greenhouse emissions from the targeted air conditioners may have stabilised by 2010, with the growth of air conditioner ownership roughly offset by the falling emissions intensity of electricity generation. However there is significant upside risk; ownership may continue to grow strongly.
Cost effective for users
Total benefits exceed total costs by a comfortable margin - $10M. However there is some uncertainty about the estimate. The regulation has a short life (1 year) and its impact may be affected by the economic cycle.
The very worst air conditioners will have been removed by the 2004 MEPS, delivering some benefits to users.
Minimise adverse effects on manufacturers and suppliers
The adjustment costs are modest in comparison to the net benefits to users - $3M.
The BAU scenario for suppliers is for continued strong demand for air conditioners.
Minimise potential for confusion or ambiguity
Suppliers are generally aware of the proposals but some may find it difficult to fully commit to the changes until the regulatory decision is finalised.
Some suppliers have already responded to the announced changes and may be disadvantaged by a decision not to proceed.
TABLE 8.3 ASSESSMENT SUMMARY – ELIMINATE DIFFFERENCES BETWEEN SINGLE-
PHASE AND THREE-PHASE AIR CONDITIONERS Objective RECOMMENDED OPTION
Eliminate differences SECOND BEST OPTION (BAU)
Retain differences
Reduction in greenhouse emissions
Minor improvements due to increased efficiency of 3-phase non-ducted splits. But offsetting effects on 1-phase and 3-phase ducted units.
None
Cost effective for users
Total benefits exceed total costs by $5M.
No benefits to users
Minimise adverse effects on manufacturers and suppliers
The changes will be integrated with other changes that are scheduled or proposed for 2007 and 2008
Meaningless distinctions would be retained.
Minimise potential for confusion or ambiguity
Proposed arrangements are more readily understood.
MEPS schedule would remain unnecessarily complex beyond 2008.
46

Proposal to increase MEPS for RACs and harmonise MEPS for single & three-phase units - Draft final RIS
9 Implementation and review The national legislative scheme for mandatory energy labelling and performance standards relies on State and Territory legislation to give it legal effect. This creates some potential for inconsistencies in the operations of the various regulatory agencies, creating additional costs and inconvenience to industry. The NAEEEC published a set of administrative guidelines to minimize those risks (NAEEEC 2000). The Guidelines are not legally binding but they are intended as a guide for State and Territory regulatory agencies to facilitate uniform and consistent practice among the States and Territories, delivering consistent outcomes for all affected products irrespective of the product or jurisdiction. Key elements of the scheme are as follows:
o The technical details of the MEPS are contained in Australian and New Zealand Standards that are incorporated by reference into the State and Territory legislation. These standards do not vary between States. The format and content of the standards are also familiar to industry, as are the operations of Standards Australia.
o Changes to the technical detail in Standards are subject to transition periods that are negotiated between industry and government.
o To minimize trade barriers, State and Territory regulatory agencies support a policy of adopting international standards wherever appropriate.
o Grandfathering arrangements are adopted, allowing reasonable time for the phasing out of non-complying stock.
o All States and Territories accept the registration of an appliance undertaken in another State.
o State and Territory regulatory agencies have set target time periods within which they aim to process applications.
o Proposed changes in administrative and operating practices are subject to consultation between states.
o It is proposed that after October 2004, appliance registration testing must be conducted by a laboratory accredited by the National Association of Testing Authorities (NATA).
o Compliance monitoring takes the form of a program of check-testing by accredited laboratories.
o Equipment is selected for check-testing on the basis of risk factors rather than randomly. The risk factors are as follows:
- history of success and failure in check tests; - age of models, with newer models given greater attention, reflecting the
prospect of longer life in the market; - high volume sales; - claims of high efficiency; - complaints from third parties.
o There are several sanctions. There is a ‘shaming’ option involving publication of failed brands or models in the AGO annual report. The second option is de-registration by the state authorities, subject to ‘show cause’ procedures. Subsequent sale of de-registered appliances would be a criminal offence. Re-registration of models that are subject to MEPS are subject to new registration tests. The third option involves legal action by the ACCC.
47
Proposal to increase MEPS for RACs and harmonise MEPS for single & three-phase units - Draft final RIS
o Standard statistical criteria are applied to deal with normal variation in the performance of equipment selected for check-testing. (A sample of only one is selected initially, with a further sample of 3 selected if the first fails.)
o Laboratories that produce misleading test results may also be denied further registration business.
o In due course the introduction of more stringent MEPS will also be handled nationally. This is likely to be in 2012. Further increases in the stringency levels at that time will be subject to the same processes of industry consultation and a RIS.
o The NAEEEC holds a consultation forum each year, providing an opportunity for stakeholders to raise concerns about the operation of the Standards or the Guidelines.
The check-testing and sanctions regime is obviously critical. Currently, check-testing expenditure (on all products) is running at about $350,000 per year, and accounts for about 25% of the NAEEEC’s budget. The 2002 program included 160 laboratory tests, 126 tests as part of the standards development program and 34 as part of the enforcement program. There were 12 instances where the claimed energy efficiency was not supported by testing conducted at NATA accredited laboratories. State regulators subsequently de-registered six products, negotiated acceptable outcomes including re-labelling of another four products and several three-phase air conditioners were found to be non-compliant with MEPS. Discussions with industry indicate that the check-testing and sanctions regime is adequate, provided it is adequately resourced. The commercial consequences of loss of reputation are considered to be serious. More generally, industry had no adverse comment on the regime for implementation and review of the MEPS. The review functions are not centralised. Each State and Territory has its own arrangements for review, in some cases triggered by 5 year sunset provisions. However the NAEEEP anticipates this cycle somewhat, with a general commitment to provide a minimal interval of 4 years between increases in the stringency of MEPS. Finally, it is important to note that the NAEEEP monitors market developments continuously, using the AGO’s product register. Given the concerns about possible adverse effects on the heating efficiency of reverse cycle units, arising because only the cooling efficiency is directly regulated, there will be a particular focus on trends in the heating efficiency of newly registered models.
48
Proposal to increase MEPS for RACs and harmonise MEPS for single & three-phase units - Draft final RIS
References AGO (2003a), Stationary Energy Sector Greenhouse Gas Emissions Projections 2003, Report
by the Interdepartmental Greenhouse Projections Group, August.
AGO (2003b), Tracking to the Kyoto Target: Greenhouse Emissions Trends, 1990-2012, September.
Atech (2003), A Financial Analysis Procedure for Energy Efficiency in Buildings, Report to the Australian Building Codes Board
BIS Shrapnel (2002), The Household Appliances Market in Australia, 2002-2004, Vol 3.
COAG (2004), Principles and Guidelines for National Standard Setting and Regulatory Action by Ministerial Councils and Standard-Setting Bodies.
Dale L, D Millstein, K Coughlin, R Van Buskirk, G Rosenquist, A Lekov & S Bhuyan (2004), An Analysis of Price Determination and Markups in the Air-Conditioning and Heating Equipment Industry, Report by Lawrence Berkeley National Laboratory & Rutgers University to the DoE, January.
DOE (1997), Technical Support Document for Energy Conservation Standards for Room Air Conditioners, prepared for DOE by LBNL.
DOE (2002), Technical Support Document: Energy Efficiency Standards for Consumer Product - Residential Central Air Conditioners and Heat Pumps, prepared for DOE by staff of Arthur D Little Inc. & LBNL.
DOE (2003), National Energy Savings Spreadsheet: Commercial Unitary Air Conditioner and Heat Pumps, downloaded from the following website in June 2003. www.eere.energy.gov/buildings/appliance_standards/commercial/ac_hp.html
EES (1999), Australian Residential Building Sector Greenhouse Gas Emissions 1990-2010. Australian Greenhouse Office.
ESSA (2003), Electricity Prices in Australia: 2003/04.
EES (2005) Electrical Peak Load Analysis Victoria 1999 – 2003, for the Victorian Energy Networks Corporation and AGO, January.
EMET & Solarch (1999) Baseline Study of Greenhouse Gas Emissions from the Commercial Buildings Sector with Projections to Year 2010, Australian Greenhouse Office.
EnergyConsult (2002), International review of Minimum Energy Performance Standards for Air Conditioners, Report to the AGO.
EnergyConsult (2005), Comparison of international MEPS: Room Air Conditioners, Report to the AGO, January.
GWA (2000), Regulatory Impact Statement: Minimum Energy Performance Standards for Air conditioners and Heat Pumps, September.
GWA (2004) A National Demand Management Strategy for Small Air conditioners: the role of the National Appliance and Equipment Energy Efficiency Program, November.
LBNL (1997), Technical Support Document fro Energy Conservation Standards for Room Air Conditioners. Report to the US Department of Energy.
49

Proposal to increase MEPS for RACs and harmonise MEPS for single & three-phase units - Draft final RIS
Meyers S, J McMahon, Ml McNeil, X Liu (2002), Realized and Prospective Impacts of U.S. Energy Efficiency Standards for Residential Appliances, Environmental Energy Technologies Division, Lawrence Berkeley National Laboratory.
Murakoshi C, H Nakagami, M Tsuruda & N Edamura, (2005) New challenges of Japanese energy efficiency program by Top Runner approach, paper presented to European Council for an Energy Efficient Economy Summer Study, France, June.
NAEEEC (1999), Future Directions for Australia’s Appliance and Equipment Energy Efficiency Program, A discussion paper prepared by the National Appliance and Equipment Energy Efficiency Committee, February.
NAEEEC (2000), Administrative Guidelines for the Appliance and Equipment Energy Efficiency Program of Mandatory Labelling and Minimum Energy Performance Standards for Appliances.
NAEEEC (2001), Future Directions: 2002-04, March.
NAEEEC (2002), Profile No. 2002/11: Minimum Energy Performance Standards for Air Conditioners.
ORR (1998), A Guide to Regulation. Second edition, ACT.
Productivity Commission (1997), Submission to the ICESD on the National Greenhouse Strategy, April.
Rawlinsons (2004), Australian Construction Handbook: 22nd edition.
Syneca (2003), Minimum Energy Performance Standards for Air conditioners: Draft Regulatory Impact Statement, Report to the AGO, December.
Syneca (2005), Regulatory Impact Statement - Proposal to Increase MEPS for Room Air conditioners (Consultation draft), February.
Unisearch (1998) Proposed Energy Efficiency Program for Packaged Air Conditioners: Final Report. Unisearch Ltd and George Wilkenfeld and Associates, for Department of Primary Industries and Energy, June 1998.
50
Proposal to increase MEPS for RACs and harmonise MEPS for single & three-phase units - Draft final RIS
APPENDIX 1: TECHNICAL BACKGROUND & TABULATION OF MEPS PROPOSALS
Technical background The capacity of an air conditioner is measured as the number of kilowatts (kW) of output power in the cooling cycle, which is the rate of cooling achieved in the conditioned space under certain standard conditions. The efficiency of an air conditioner is measured as a ratio of output power to input power, which is the rate at which energy is used by the compressor and fans that drive the air conditioner. This ratio is measured in the cooling mode under certain standard conditions and is known as the energy efficiency ratio (EER). EERs are typically greater than 2; they can range up to 4 or more (EnergyConsult 2005). Air conditioners can also be configured for reverse cycle operation, which means that in cold weather they can be used as heaters, transferring heat from outside the building into the conditioned space. Such units are often referred to as heat pumps, and the ratio of power output to power input in the reverse cycle is referred to as the coefficient of performance (COP). Air conditioners are more efficient in the reverse cycle mode than in the cooling mode. Note that the power output is a multiple of the input power, which means that air conditioners and heat pumps move more energy than they use. This reflects the fact that heat pumps move energy in or out of the conditioned space, using a refrigeration cycle; they do not generate heat in the same manner as a gas or electric resistance heater. MEPS for air-cooled air conditioners Table A1.1 shows the MEPS introduced in 2001 and 2004, plus the complete schedule of changes for 2006, 2007 and 2008 that would be required if the new proposals are implemented. Only the changes scheduled for 2007 would remain if the new proposals were rejected. The schedule is fairly complex. Note the following:
• MEPS are being applied to non-ducted units <10kW in three stages, but with the following internal differences:
o The MEPS for single-phase domestic units <7.5kW are scheduled for 2004, 2006 and 2008.
o The MEPS for all other single-phase units are scheduled for 2004, 2007 and 2008.
o The MEPS for all three-phase units are scheduled for 2001, 2007 and 2008, with differences between the single-phase and three-phase units eliminated in 2007.
• MEPS are being applied to ducted units <10kW in two stages – 2004 and 2007 for the single-phase units – 2001 and 2007 for the three-phase units. Differences between the single-phase and three-phase units eliminated in 2007.
• MEPS are being applied to single-phase units >10kW in three stages – 2004, 2007 and 2008. With one exception, however, there is little practical difference between 2007 and 2008. Single-phase ducted units are the exception, most of which increase to 2.50 in 2007 and then to 2.75 in 2008. Differences between the single-phase and three-phase units eliminated in 2008.
• MEPS are being applied to three-phase units >10kW in two stages – 2001 and 2007. These arrangements are unaltered by the new proposal.
MEPS for water-cooled air conditioners The new proposals do not affect the MEPS scheduled for water-cooled air conditioners. The differences between single-phase and three-phase units will be effectively eliminated in October 2007, when all but the very largest units must have an EER of 3.50.
51

Proposal to increase MEPS for RACs and harmonise MEPS for single & three-phase units - Draft final RIS
TABLE A1.1 MEPS FOR AIR-COOLED AIR CONDITIONERS: 2001 TO 2008 Phase Type Configuration Type Capacity
range (kW) 1 Oct. 2001 1 Oct. 2004 1 Oct. 2006 1 Oct. 2007 1 Oct. 2008
Cooling only Non-ducted Split <4.0 N/A 2.45 3.05 * 3.05 3.33Cooling only Non-ducted Split 4.0 to <7.5 N/A 2.45 2.75 * 2.75 2.93 Cooling only Non-ducted Split 7.5 to <10.0 N/A 2.45 ⇐ 2.75 2.93Cooling only Non-ducted Unitary <7.5 N/A 2.45 2.75 * 2.75 2.84Cooling only Non-ducted Unitary 7.5 to <10.0 N/A 2.45 ⇐ 2.75 2.84Cooling only Non-ducted All ≥10.0 N/A 2.45 ⇐ 2.75 See 3 Phase Cooling only Ducted All <10.0 N/A 2.45 ⇐ 2.50 ⇐ Cooling only Ducted All ≥10.0 2.45 ⇐ 2.50 See 3 Phase Reverse cycle Non-ducted Split <4.0 N/A 2.30 3.05 * 3.05 3.33Reverse cycle Non-ducted Split 4.0 to <7.5 N/A 2.30 2.75 * 2.75 2.93 Reverse cycle Non-ducted Split 7.5 to <10.0 N/A 2.30 ⇐ 2.75 2.93Reverse cycle Non-ducted Unitary <7.5 N/A 2.30 2.75 * 2.75 2.84Reverse cycle Non-ducted Unitary 7.5 to <10.0 N/A 2.30 ⇐ 2.75 2.84Reverse cycle Non-ducted All ≥10.0 N/A 2.30 ⇐ 2.75 See 3 Phase Reverse cycle Ducted All <10.0 N/A 2.30 ⇐ 2.50 ⇐
1
Reverse cycle Ducted All ≥10.0 N/A 2.30 ⇐ 2.50 See 3 Phase Both # Non-ducted All <10.0 2.25 ⇐ ⇐ See 1 Phase See 1 Phase Both # Ducted All <10.0 2.25 ⇐ ⇐ 2.50 ⇐ Both # All All ≥10.0 to 12.5 2.30 ⇐ ⇐ 2.75 ⇐ Both # All All >12.5 to 15.5 2.35 ⇐ ⇐ 2.75 ⇐ Both # All All >15.5 to 18.0 2.40 ⇐ ⇐ 2.75 ⇐ Both # All All >18.0 to 18.9 2.45 ⇐ ⇐ 2.75 ⇐ Both # All All >18.9 to 25.0 2.45 ⇐ ⇐ 3.05 ⇐ Both # All All >25.0 to 30.0 2.50 ⇐ ⇐ 3.05 ⇐ Both # All All >30.0 to 37.5 2.55 ⇐ ⇐ 3.05 ⇐ Both # All All >37.5 to 39.0 2.60 ⇐ ⇐ 3.05 ⇐ Both # All All >39.0 to 45.5 2.60 ⇐ ⇐ 2.75 ⇐
3
Both # All All >45.5 to 65.0 2.65 ⇐ ⇐ 2.75 ⇐
N/A
Notes: ⇐ Denotes no change in the MEPS requirements for this product type on this date; requirements from a previous date apply. * this level applies to any product used by or marketed to residential users. Products which are purely commercial are exempt from this MEPS level in 2006 but the levels indicated apply in 2007 apply to these product types. MEPS for 2008 apply to all product types. # indicates both reverse cycle and cooling only types are covered by this requirement. See 3 Phase: means that the MEPS requirement on this date (2008) for this product type and configuration is the same as the three-phase product type and configuration in 2007. See 1 Phase: means that the MEPS requirement on this date for this product type and configuration is the same as the single-phase product type and configuration.
52

Proposal to increase MEPS for RACs and harmonise MEPS for single & three-phase units - Draft final RIS
APPENDIX 2: AVAILABILITY OF HIGH EFFICIENCY RACS IN OTHER COUNTRIES Europe – 50 Hz The European information provided here has been obtained from the website of the Eurovent Certification Company – see http://www.eurovent-certification.com. Eurovent (European Committee of Air Handling and Refrigerating Equipment Manufacturers) is an industry association representing the European air conditioning, heating, ventilation and refrigeration manufacturers with national trade associations. It deals with international and European issues on behalf of industry. Eurovent’s certification program for air conditioners applies to factory-made units up to 100 kW cooling capacity. There is exclusion for multi-split systems with more than two indoor units. Participating companies must certify all production models within the scope of the program and ratings are verified by tests conducted in Eurovent’s independent laboratory. Participating companies account for 90% of European sales. Since June 2004 all air conditioners with a cooling capacity less than 12 kW must be labelled, using the classification scheme shown in table A2.1. Otherwise Eurovent’s program is voluntary and seems to have been adopted after the failure of a EU proposal to set the efficiency standards at somewhat higher levels. The original proposal would also have required that certification be provided on the condition that manufacturers completely withdrew models falling in classes F or G. Table A2.1 shows how the various efficiency classes (A to G) are defined and how currently registered models are distributed between the various efficiency classes. Models that would fail the 2004 Australian MEPS have been excluded from the analysis, maintaining comparability with the current Australian situation. The table also reports the proportion of models that comply with the proposed 2007 MEPS. Regarding the unitary models:
• The Europeans refer to all unitary models as ‘packaged’, including window/wall types. • Very few unitary models are registered – only 58. • The proposed 2007 MEPS (EER>=2.84) fall in the range of Europe’s class B. • Overall, 33% of these models comply with the proposed 2007 MEPS. Another 30% of
the models have efficiencies that are no more than 10% lower than the proposed 2007 MEPS.
• Reverse cycle models are better represented at the higher levels of efficiency than the cooling only models. The low ratings of the smaller cooling only models are particularly notable.
• Two manufacturers – Airwell (France) and LG (Korea) – account for 16 of the 19 complying models.
• Eurovent also classifies models according to the type of mounting. Models designed for ‘High wall’ and ‘Floor’ mountings account for most of the complying product. None of the ‘Window’ models comply. Possibly, the latter are subject to constraints of size, shape or weight that make it more difficult to achieve higher efficiencies. It is something of a puzzle, however, Eurovent staff informally advise that they see no difference between Window and High wall models.
53

Proposal to increase MEPS for RACs and harmonise MEPS for single & three-phase units - Draft final RIS
TABLE A2.1 EFFICIENCY OF MODELS CERTIFIED FOR THE EUROPEAN MARKET: SINGLE-PHASE, 0-10 KW, OCTOBER 2004
00-04 kW 04-10 kW
EER range CO RC CO RC
Grand total
Unitary type (includes floor, window, wall and cassette mounts) No. registered models 22 30 6 0 58 Complies 2007 MEPS? 0% 43% 100% - 33% Class A EER>3.0 0% 30% 100% - 26% Class B >2.8 – 3.0 0% 47% 0% - 24% Class C >2.6 – 2.8 59% 13% 0% - 29% Class D >2.4 – 2.6 41% 10% 0% - 21%
Splits (includes floor, wall and cassette mounts) No. registered models 241 511 248 474 1474 Complies 2007 MEPS? 5% 11% 16% 22% 14% Class A EER>3.2 24% 41% 4% 9% 22% Class B >3.0 – 3.2 10% 15% 12% 9% 12% Class C >2.8 – 3.0 22% 12% 15% 17% 16% Class D >2.6 – 2.8 30% 16% 36% 26% 25% Class E >2.4 – 2.6 15% 12% 32% 32% 22% Class F >2.2 – 2.4 0% 3% 0% 6% 3%
Regarding the split units:
• The proposed 2007 MEPS fall in the range of class A and class C for the 0-4 kW and 4-10 kW models respectively.
• Overall, 1 in 7 models (14%) already comply with the 2007 MEPS, with the rate of compliance systematically higher for larger models and for reverse cycle models.
• Significant proportions of the smaller models (0-4 kW) have an EER that exceeds 3.0 and is within 10% of the Korean MEPS.
• Similarly for the larger models (4-10 kW), a significant proportion of the models return efficiencies that are not much less than the Korean MEPS. For example, consider the significant proportion in class D.
• There are 48 certified manufacturers on the Eurovent database. Of these, the following 7 account for 75% of the complying models – LG, Daikin, Hitachi, Mitsubishi, Toshiba, Panasonic and Fujitsu. Airwell is the next largest.
Japan – 50 Hz for Eastern Japan, 60 Hz for Western Japan The minimum energy performance of air conditioners is not directly regulated in Japan. Instead, suppliers are required to achieve a sales-weighted average efficiency across their product range. These targets are set out in table A2.2, including comparisons with the 2004 Korean MEPS. Note these further particulars about the operation of the system:
• With some exceptions that Top Runner targets must be achieved from October 2007. The exceptions are reverse cycle units of less than 4 kW, which must achieve their target from October 2004.
• The Top Runner target for reverse cycle units is defined in terms of the average of EER and COP. For the purposes of comparison with the Korean MEPS, the equivalent EER has been estimated at 90% of the combined target, which allows the targeted COP to be about 20% higher than the targeted EER.
54

Proposal to increase MEPS for RACs and harmonise MEPS for single & three-phase units - Draft final RIS
TABLE A2.2 JAPANESE ‘TOP RUNNER’ TARGETS COMPARED WITH THE 2004 KOREAN MEPS
Cooling only models Reverse cycle models
Cooling capacity range (kW)
2007 Korean MEPS (EER)
2007 Japanese targets (EER)
Japan/ Korea diff (%)
2004/7* Japanese targets
(av. EER & COP)
Estimate of
equiv. EER**
Japan/ Korea diff (%)
Difference between reverse
cycle and cooling
only EER (%)
Unitary All 2.84 2.67 -6% 2.85 2.57 -10% -4%
Splits 0-2.5 3.33 3.64 9% 5.27 4.74 42% 30% 2.5-3.2 3.33 3.64 9% 4.90 4.41 32% 21% 3.2-4.0 3.33 3.08 -8% 3.65 3.29 -1% 7% 4.0-7.1 2.93 2.91 -1% 3.17 2.85 -3% -2% 7.1-10.0 2.93 2.81 -4% 3.10 2.79 -5% -1%
Notes * With some exceptions that Top Runner targets must be achieved from October 2007. The exceptions are reverse cycle units of less than 4 kW, which must achieve the target from October 2004. ** The equivalent EER has been estimated at 90% of the combined target for reverse cycle units, which is defined as the average of the EER and the COP. This allows for COP to be about 20% higher than the EER. The main points and inferences to take from table A2.2 are as follows:
• Look first at the final column of the table, which shows the percentage difference between the Japanese targets for cooling only and reverse cycle units. This comparison suggests that the targets are very similar, but with the exception of the smaller split reverse cycle units, where the target is set 20-30% higher.
• The Japanese targets for unitary models are somewhat weaker than the Korean MEPS. However the logic of sales-weighting, which rewards sales that significantly exceed the target, suggests that at least a minority of the Japanese units would comply with the Korean MEPS.
• A similar comment applies to split units with greater than 3.2 kW cooling capacity, except that the gap is smaller and it is reasonable to suppose that a sizeable minority of the Japanese units would comply with the Korean MEPS.
• That leaves the smaller splits (<3.2 kW), where there is a significant difference between the cooling only and reverse cycle units. It seems reasonable to infer that a sizeable majority of the cooling only units must comply by October 2007 and virtually all of the reverse cycle units must comply from October 2004.The sales-weighted target seems to be 30-40% higher than the Korean MEPS. In fact, regarding the latter, it has been reported that all products currently on the market have exceeded the standard – see figure A2.1. As shown, many of the Japanese products exceed the Japanese targets by a good margin, taking the average efficiency over the heating and cooling cycles into the range 5.0-6.0.
Asian countries other than Japan – mix of 50 Hz and 60 Hz Table A2.3 presents estimates of compliance rates for models supplied to the domestic markets of a number of Asian countries. The Korean data is of high quality, generated from the register that is maintained for regulatory purposes. The other data is of lesser quality, having been extracted from a sample of product catalogues for major suppliers. Catalogues do not provide comprehensive market coverage and some of the efficiency claims seem to be overstated. (15-20 suppliers were identified in Taiwan and Thailand, and somewhat fewer in China and India, with 5 and 7 respectively.)
55
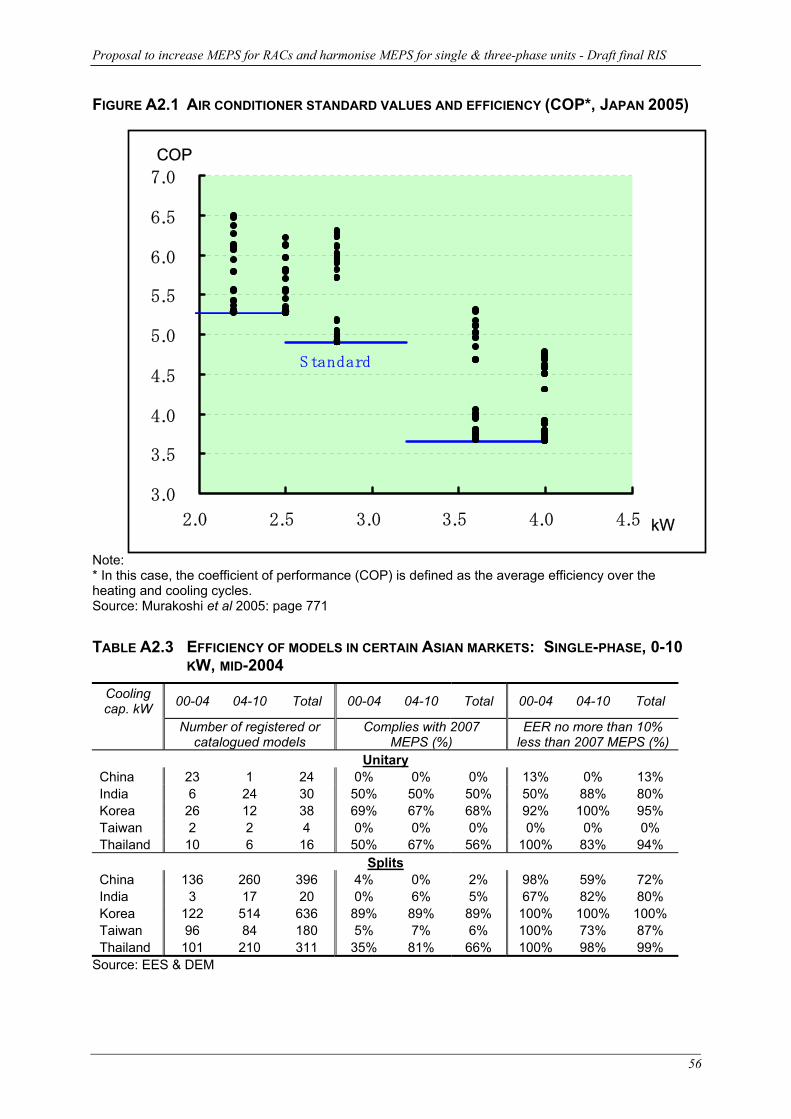
Proposal to increase MEPS for RACs and harmonise MEPS for single & three-phase units - Draft final RIS
FIGURE A2.1 AIR CONDITIONER STANDARD VALUES AND EFFICIENCY (COP*, JAPAN 2005) Note:
3.0
3.5
4.0
4.5
5.0
5.5
6.0
6.5
7.0
2.0 2.5 3.0 3.5 4.0 4.5
COP
kW
Standard
* In this case, the coefficient of performance (COP) is defined as the average efficiency over the heating and cooling cycles. Source: Murakoshi et al 2005: page 771 TABLE A2.3 EFFICIENCY OF MODELS IN CERTAIN ASIAN MARKETS: SINGLE-PHASE, 0-10
KW, MID-2004 Cooling cap. kW 00-04 04-10 Total 00-04 04-10 Total 00-04 04-10 Total
Number of registered or catalogued models
Complies with 2007 MEPS (%)
EER no more than 10% less than 2007 MEPS (%)
Unitary China 23 1 24 0% 0% 0% 13% 0% 13% India 6 24 30 50% 50% 50% 50% 88% 80% Korea 26 12 38 69% 67% 68% 92% 100% 95% Taiwan 2 2 4 0% 0% 0% 0% 0% 0% Thailand 10 6 16 50% 67% 56% 100% 83% 94%
Splits China 136 260 396 4% 0% 2% 98% 59% 72% India 3 17 20 0% 6% 5% 67% 82% 80% Korea 122 514 636 89% 89% 89% 100% 100% 100% Taiwan 96 84 180 5% 7% 6% 100% 73% 87% Thailand 101 210 311 35% 81% 66% 100% 98% 99%
Source: EES & DEM
56

Proposal to increase MEPS for RACs and harmonise MEPS for single & three-phase units - Draft final RIS
The available data does not distinguish between cooling only and reverse cycle models. To provide a degree of comparability with the Australian situation, all models with an EER less than 2.38 have been excluded. This is the mid-point between Australia’s 2004 MEPS for Cooling only and Reverse cycle models, which require EERs of 2.45 an 2.30 respectively. Korea and Taiwan are on 60 Hz. The remainder are like Australia, on 50 Hz. The main points are that:
• Generally there are relatively few unitary models, except in India, where there are more unitary than split models.
• Korea returns the highest compliance rate. • China and Taiwan return low rates of compliance, with zero compliance for all unitary
models. • Thailand returns healthy rates of compliance; all at 50% or more with the exception of
the smaller split units. Importantly, Thailand’s mains power is on 50 Hz, which suggests that the achievement of Korean levels of efficiency is not significantly impeded by the frequency difference.
• India’s unitary models also perform well. • With the exception of unitary models in China and Taiwan, large proportions of the
catalogued models are within 10% of the proposed 2007 MEPS. USA – 60 Hz High-quality data is also available for window/wall models on the US market, comprising lists of all certified brands and models provided by the US Association of Home Appliance Manufacturers. These lists returned very high rates of compliance against the proposed 2007 MEPS. Overall, 90% of the models would comply – 98% of the 0-4 kW models and 61% of the 4-10 kW models. For all but a few of 17 brands, compliance was better than 50% in all categories.
57

Proposal to increase MEPS for RACs and harmonise MEPS for single & three-phase units - Draft final RIS
APPENDIX 3: PROJECTED SALES OF REFRIGERATIVE AIR CONDITIONERS The available data indicates that the market for refrigerative air conditioners has been transformed over the last 10 years, with annual sales rising from about 0.4 million/year in the mid 1990s to 1.25 million/year in 2003. See figure A3.1 for estimates of total sales to 2003. These are based on a series published by BIS Shrapnel for 1991 to 2001, and extrapolated by Syneca to 2003 to reflect the increase in imports. Currently, imports provide at least 90% of the air conditioners sold in Australia. The immediate cause is a large fall in the real cost of air conditioners. Rawlinsons Construction Cost Guide contains a consistent series of unit prices for domestic air conditioners from 1995 to the present. This series indicates that the real cost has fallen by 42% for ducted systems, and by 48% and 57% for split and wall/window types of RACs. Residential sales There are no direct estimates for sales to residential users. However we have made rough calculations on the basis of ABS estimates of the proportion of households with air conditioners, and the number and type of air conditioners. These are shown in figure A3.1 as a back-projection or ‘backcast’ from 2003, with the gap between the residential and total sales indicating the level of non-residential sales. To explain, the most recent returns from a series of ABS surveys confirm that there has been a large increase in household ownership of air conditioners since the mid 1990s. These estimates are shown in figure A3.2, for surveys conducted in 1980, 1983, 1986, 1994, 1999 and 2002. The broad impression is that there was steady growth in ownership through to the mid-1980s but reached a ceiling at that point. According to the survey estimates, the industry broke through that ceiling in the late 1990s, delivering a large increase in the ownership ratio between 1999 and 2002 – from 0.318 to 0.459 appliances per households. This is somewhat at odds with the sales data, which dates the upsurge from the mid-1990s. Accordingly, we have plotted a path for ownership that passes above the survey data for 1999 and 2002. Certainly it seems clear that ownership was increasing before 1999 and that the ABS figure for 1999 is an underestimate. However a number of other elements may also have contributed to the increased sales, for example, increasing sales to non-residential users or accelerated replacement of the existing stock, as existing users take advantage of lower prices to upgrade their air conditioning arrangements. To estimate sales beyond 2003 it is necessary to consider the likely size and timing of further increases in the ownership ratio, and also allow for the future flow of replacement purchases, as the additional appliances purchased since the mid-1990s reach the end of their lives. Our projection for residential ownership is shown in figure A3.2 and the implied sales are shown in figure A3.1 as a forward projection from 2003. Look first at projected ownership beyond 2003. It is shown as growing strongly till 2005 then at a progressively slower rate to approach 0.8 by 2008 and 0.9 by 2020. An ownership ratio of 0.8 is consistent with 60% of households using refrigerative air conditioners, with an average of 1.33 appliances each. However the slower rate of increase in the ownership ration implies that the annual sales will actually fall, at least until the rate of replacement purchases starts to rise. This happens with a lag of 10 years after the mid 1990s, since an average service life of 10 years has been assumed. (Historically, it seems difficult to account for the level of sales if the service life is set significantly above 10 years.) These dynamics are shown in figure A3.1, with a temporary cooling of sales in the period to 2007 followed by a resumption of the upward trend in sales.
58

Proposal to increase MEPS for RACs and harmonise MEPS for single & three-phase units - Draft final RIS
FIGURE A3.1: SALES OF REFRIGERATIVE AIR CONDITIONERS
0
400,000
800,000
1,200,000
1,600,000
2,000,000
1980 1985 1990 1995 2000 2005 2010 2015 2020
Residential sales - modeled
Non-residential sales - modeled
Total sales - historical
Total sales - forecast
2003
Sources: Historical sales have been derived from estimates published by BIS Shrapnel (The Household Appliances Market in Australia, 2002-2004: Vol 3) and with reference to import data for 1990-2003. The residential and non-residential modelling is by Syneca and assumes future growth in the number of Australian households according to the Series II projection published by the ABS in the 2004 edition of Household and Family Projections, Australia (cat. 3236.0)
FIGURE A3.2: FORECASTS AND BACKCASTS OF THE RESIDENTIAL OWNERSHIP RATIO (AIR CONDITIONERS PER HOUSEHOLD*)
0.0
0.2
0.4
0.6
0.8
1.0
1980 1985 1990 1995 2000 2005 2010 2015 2020
Projected ownership ratioABS survey estimates
2003
Note: * Note that, because a significant minority of households have 2 or more air conditioners, the proportion of households with air conditioners is somewhat less than the ownership ratio. For example, ABS returns indicate that 48.7% of households owned either an air conditioner or an evaporative cooler in 2002, with an average of 1.23 appliances each. The corresponding ownership ratio is 0.6 (= .487 * 1.23). This is the ratio of the total number of appliances to the total number of households. Non-residential sales It is reasonable to assume that the use of air conditioners by the commercial and industrial (non-residential) sector is undergoing a process of stock adjustment that mimics the process in the residential sector. For example, many schools are being fitted out with air conditioners, and packaged units are displacing cental air conditioning systems in some office buildings. Again, there would be a surge of sales as the stock of air conditioners is adjusted upwards, followed by some moderation of sales as the stock approaches a new equilibrium level and the
59

Proposal to increase MEPS for RACs and harmonise MEPS for single & three-phase units - Draft final RIS
continuing requirement is to accommodate further commercial and industrial growth and replacement needs. There is no non-residential equivalent of the ABS residential survey. It has therefore been assumed that the non-residential sector maintains a proportional relationship with the residential sector but that its adjustment process lags a few years behind the residential sector. This generates the forecasts of the non- residential sector that is shown in figure A3.1. Trend growth of total sales For the purposes of this RIS a trend has been plotted through the projection for total sales that is shown in figure A3.1. The elements have been brought together in figure A3.3. The key features of the projected sales are as follows:
• Total annual sales are shown as increasing 3-fold from about 0.4 million/year in the mid 1990s to 1.2 million/year in 2006.
• The projected trend growth in sales is 3.1%/year. Sales reach 1.3 million in 2010 and 1.8 million in 2020.
• Projected sales are divided 70:30 between the residential and non-residential sectors.
FIGURE A3.3: PROJECTED TREND FOR TOTAL SALES
0
400,000
800,000
1,200,000
1,600,000
2,000,000
1980 1985 1990 1995 2000 2005 2010 2015 2020
Total sales - historical
Total sales - forecast
Total sales - projected trend
2003
60

Proposal to increase MEPS for RACs and harmonise MEPS for single & three-phase units - Draft final RIS
APPENDIX 4: BASELINE ASSUMPTIONS FOR THE BENEFIT COST ANALYSIS Sample frame and sample weights The modelling of costs and benefits has been undertaken for 10 categories of RAC, listed in the first column of table A4.1. The categories differ by size (cooling capacity), type of air conditioner (split or unitary, ducted or non-ducted), and configuration (cooling only or reverse cycle). The breakdown accommodates the various MEPS categories and the available data. However two categories that fall within scope of the regulation have been excluded. These are unitary air conditioners of 7.5-10 kW, both cooling only and reverse cycle, for which no models are recorded on the AGO register and/or few sales are recorded. Estimates of the aggregate impact are obtained by weighting each of the 10 categories according to projected sales over the life of the regulation. Appendix 3 provides a sales projection for all refrigerative air conditioners – see figure A3.3. It has been assumed that sales of RACs maintain a proportional relationship with total sales, with the proportion set at the level observed in 2002. Specifically, RACs are set at 89% of the total number of units sold, and at 70% of the total cooling capacity that is sold. (It is convenient to conduct the aggregate analysis in terms of the total cooling and heating capacity of each category of air conditioner, rather than in terms of the actual number of units in each group. For example, 100 units with an average cooling capacity of 2 kW are treated as a group of air conditioners with a total cooling capacity of 200 kW.) Table A4.1 reports the resulting estimate of sales of RACs in 2010, with a breakdown by category of air conditioner. The breakdown is based on industry sales data for 2002 and is assumed constant over the life of the regulation. TABLE A4.1 ON-TREND ESTIMATE OF SALES OF RACS - 2010
Total cooling capacity
(MW)
Heating capacity
(MW)
Output energy
(GWh/year)
Input energy
(GWh/year)
Total installed cost ($M)
Single-phase, non-ducted split Cooling only, 0-4kW 194 130 46 66
4-7.5 kW 284 231 86 66 7.5-10 kW 119 97 36 39 Reverse cycle, 0-4kW 663 759 476 168 283 4-7.5 kW 2,223 2,435 1,899 708 678
7.5-10 kW 596 653 509 199 251 Single-phase, non-ducted unitary
Cooling only, 0-4kW 449 300 113 99 4-7.5 kW 263 214 83 46
Reverse cycle, 0-4kW 269 278 183 69 64 4-7.5 kW 309 303 249 95 62
Total 5,370 4,429 4,289 1,603 1,654 Average characteristics affecting energy use The average characteristics of the 10 categories of air conditioners are reported in table A4.2. Size and efficiency Each group of air conditioners has been assigned the average size and efficiency characteristics of the AGO-registered models within that group. It would be preferable to assign sales-weighted characteristics but sales data are not available at that level of detail. This would not be a significant source of error, given the reasonable expectation that, within each group, the number of models is correlated with the volume of sales.
61

Proposal to increase MEPS for RACs and harmonise MEPS for single & three-phase units - Draft final RIS
Household share and average annual operating hours The estimates of operating hours in table A4.2 have been obtained by putting residential and commercial use at 500 hours/year and 1,500 hours/year respectively, and assigning a household share in the range of 65-85% depending on the size of the air conditioner11. For commercial use, the assumption of 1,500 hours per year is conservative relative to US estimates. It is a minimum estimate of the annual average operating hours observed across all regions in the US – see table A4.3. For residential use, the estimate of 500 hours/year is also borrowed from the US DoE. It is somewhat higher than the average of 400 hours/year that is implicit in an earlier Australian study (EES 1999). However it is a considerable discount on the 750 hours/year used by the industry body in the US, ASHRAE. Cooling share The mix of cooling and heating cycles affects energy use, since reverse cycle units have different capacity and efficiency characteristics in the two cycles. The heating cycle is usually more efficient than the cooling cycle. In the absence of any better data, the split has been put at 50:50. TABLE A4.2 AVERAGE MARKET CHARACTERISTICS - 2004
Average cooling capacity
(kW)
EER COP Resident-
ial share%
Annual operating
hours
Share cooling hours
Single-phase, non-ducted split Cooling only, 0-4kW 3.0 2.82 83% 669 100%
4-7.5 kW 6.0 2.69 68% 815 100% 7.5-10 kW 8.3 2.67 68% 815 100% Reverse cycle, 0-4kW 3.0 2.70 2.97 83% 669 50% 4-7.5 kW 5.9 2.59 2.76 68% 815 50%
7.5-10 kW 8.3 2.55 2.58 68% 815 50% Single-phase, non-ducted unitary
Cooling only, 0-4kW 2.5 2.65 83% 669 100% 4-7.5 kW 5.2 2.59 68% 815 100%
Reverse cycle, 0-4kW 2.8 2.54 2.77 83% 669 50% 4-7.5 kW 5.3 2.53 2.76 68% 815 50%
TABLE A4.3 US REGIONAL ESTIMATES OF COMMERCIAL OPERATING HOURS
Building type Regional minimum Regional maximum Weighted average Small office 1,411 2,588 1,836 Large office 1,679 2,449 1,973 Small retail 1,120 2,005 1,540 Large retail 1,338 2,264 1,770 Warehouse 1,269 3,535 2,106 Sit down restaurant 1,289 2,882 1,922 Fast food restaurant 1,177 2,240 1,777 Hospital 1,382 2,494 2,025 School 1,110 2,072 1,602 All buildings 1,515 2,201 1,801
Source: Extracted from DoE (2003)
11 Sales data can only be reconciled with estimates of household ownership by assigning a significant minority of sales to commercial use. Following industry advice, larger shares of the bigger units have been assigned to commercial use.
62

Proposal to increase MEPS for RACs and harmonise MEPS for single & three-phase units - Draft final RIS
Energy savings due to the proposed regulation The benefit cost model deals separately with the energy savings in the cooling and heating cycles. Only the efficiency of the cooling cycle (EER) is directly regulated. Cooling energy It has been assumed that the efficiency of non-complying units will increase to the point where they achieve borderline compliance with the proposed regulation. In effect it is assumed that two opposing forces cancel out. On the one hand, many of the newly-complying models will deliver higher efficiencies than the required minimum. On the other hand, the monitoring scheme will be less than perfect, allowing the sale of some non-complying units. Heating energy It is apparent from examination of the AGO register that the relationship between the EER and the COP is much less than perfect; increases in the EER are not associated with equivalent or proportional increases in COP. It has been assumed that the COP increases by 75% of the increase in EER12. Emissions intensity Estimates of greenhouse emissions are based on projections reported by the Interdepartmental Greenhouse Projections Group (AGO 2003a). The emissions intensity of electricity used is put at 0.97 tonnes CO2e per MWh in 2000, and projected to decline at 1.2% per year in the period to 2020. This the average of a number of modelling exercises reported by the Projections Group. Lifecycle cost of energy The ‘lifecycle cost’ of energy is the discounted value of the energy that is used over the life of the air conditioner. Asset lives Consistent with the analysis of air conditioner sales and stocks, presented in appendix 3, the average service life of RACs has been set at 10 years. Cost of electricity Marginal electricity tariffs have been put at 10cents/kWh in the commercial sector and 12cents/kWh in the residential sector, based on analysis of prices reported by the Electricity Supply Association of Australia (ESSA 2003). The average electricity charge then reflects the mix of household and residential use that has been assumed for each type and size of air conditioner. Discount rate The discount rate has been set at 10% and defined as a real pre-tax discount rate. This is the rate adopted by the Australian Building Codes Board for its analysis of energy efficiency measures, based on a report by the Australian Building Codes Board13. This is a relatively low rate, reflecting a judgement that investments in the energy efficiency of buildings will be somewhat insulated from cyclical fluctuations in economic activity, and are therefore relatively low risk. Installed cost of air conditioners Modelling framework The impact on the cost of air conditioners has been presented as an increase in their installed cost. The installed cost is the cost of manufacture plus the mark-ups applied by wholesalers and by the home builders or other contractors who do the installation. Installation includes the 12 Professor E Leonardi has provided informal advised that redesign to increase EER should also increase the COP by at least 50% of the increase in EER. The intermediate figure of 75% has been adopted, with testing on the downside at 50%. 13 Atech (2003), A Financial Analysis Procedure for Energy Efficiency in Buildings, Report to the Australian Building Codes Board
63
Proposal to increase MEPS for RACs and harmonise MEPS for single & three-phase units - Draft final RIS
costs of installing the air conditioning units themselves, but excludes the cost of ducts, refrigerant pipe-work and the like. Obviously, the installed cost is the price paid by consumers. The increase in the installed cost has been calculated in four steps: 1. For each of the 10 categories of RAC, a BAU estimate of the installed cost has been
extracted from the 22nd edition of Rawlinsons Australian Construction Handbook (Rawlinsons 2004).
2. The percentage increase in energy efficiency has been determined for the non-complying models in each of the 10 categories.
3. It has been assumed that there is a relationship between the percentage increase in the installed cost and the percentage increase in energy efficiency, expressed as a ratio of the percentage increase in the installed cost to the percentage increase in energy efficiency. Given an estimate of this ratio, which is discussed further below, the percentage increase in the installed cost is readily calculated. For example, a ratio of 0.25 indicates that a10% increase in efficiency is accompanied by a 2.5% increase in the installed cost.
4. The dollar increase in the installed cost has been calculated by applying the percentage increase in installed cost to the BAU estimate of installed cost.
Ratio of percentage increase in installed cost to percentage increase in efficiency The relationship between the percentage increases in installed cost and efficiency is obviously critical. Based on a review of the very limited evidence, the following two broad cases have been distinguished:
• In some cases the ratio has been put at 0.25. That is, a 10% increase in efficiency is accompanied by a 2.5% increase in installed cost. This applies to any increase in efficiency required to achieve either the existing 2007 MEPS or the European benchmarks that are ‘next best’ relative to the proposed 2007 MEPS.
• For any further increase from the European benchmarks to the proposed 2007 MEPS, the ratio has been put at 0.33. That is, a 10% increase in efficiency is accompanied by a 3.3% increase in installed cost. This makes an allowance for increasing marginal costs of delivering further increases in efficiency.
Empirical evidence – manufacturing cost of unitary (window/wall) units It is necessary to separately consider the impacts of increased energy efficiency on manufacturing costs and on mark-ups; most of the on-going costs associated with wholesaler and contractor mark-ups would not be affected by increased efficiency. There are, of course, one-off costs associated with the implementation of MEPS. These are considered separately in sections 4.3 and 5.3 of the report. The major source of evidence is a series of engineering studies commissioned by the US Department of Energy (DoE) and reported in the following documents.
DoE (1997), Technical Support Document for Energy Conservation Standards for Room Air Conditioners, prepared for DoE by LBNL.
DoE (2002), Technical Support Document: Energy Efficiency Standards for Consumer Product - Residential Central Air Conditioners and Heat Pumps, prepared for DoE by staff of Arthur D Little Inc. & LBNL.
DoE (2003), National Energy Savings Spreadsheet: Commercial Unitary Air Conditioner and Heat Pumps, downloaded from the following website in June 2003. www.eere.energy.gov/buildings/appliance_standards/commercial/ac_hp.html
64

Proposal to increase MEPS for RACs and harmonise MEPS for single & three-phase units - Draft final RIS
The first of these is concerned solely with RACs, but only for the unitary (window/wall) types. These are the dominant form of room air conditioning in the US but have a relatively small market share in Australia. Estimates of the relationship between efficiency and manufacturing costs have been extracted from this study and are summarised in figures A4.1 and A4.2. Note that the estimates have been normalised to express costs relative to a cost of units with an EER of 2.75. The broad patterns are as follows:
• Significant improvements in energy efficiency can be achieved at relatively low cost, but subsequent improvements are achieved at progressively higher marginal cost.
• The maximum EER of interest in the present context is 2.84, which is the MEPS level now proposed for October 2007. Leading up to that maximum, a 10% increase in efficiency is accompanied by a 4-6% increase in the cost of manufacture.
FIGURE A4.1: MANUFACTURING COST OF UNITARY RACS, COOLING ONLY
0.50
1.00
1.50
2.00
2.50
2.00 2.25 2.50 2.75 3.00 3.25 3.50 3.75 4.00
1.7 kW 2.2 kW 3.6 kW 5.3 kW 7.1 kWEER
Rel
ativ
e co
st (E
ER 2
.75
= 1.
00)
FIGURE A4.2: MANUFACTURING COST OF UNITARY RACS, REVERSE CYCLE
0.50
1.00
1.50
2.00
2.00 2.25 2.50 2.75 3.00 3.25 3.50
3.7kW
EER
Rel
ativ
e co
st (E
ER 2
.75
= 1.
00)
65

Proposal to increase MEPS for RACs and harmonise MEPS for single & three-phase units - Draft final RIS
• In addition to the increase in efficiency, the DoE’s assessment process usually involved re-designing14 the sample units in such a way that their output power15 was increased. That is, for a given input power, the re-designed units had greater cooling capacities. To properly compare like with like it would be necessary to also know what cost savings could be achieved by reducing the input power and restoring the capacity of the sample units to their original level; these were not calculated. It follows that the cost increases reported in figures A4.1 and A4.2 are overestimates of the additional cost of manufacturing a unit of ‘equivalent output capacity’.
There are two main exceptions to these broad findings. Firstly, the cost increases are much sharper for units without side louvres. Louvres are stamped on the outdoor section of the cabinet and enhance the movement of air over the outdoor condensing coil, thereby improving efficiency. They are of no use, and can be dispensed with, when the unit is largely embedded in a thick wall. However we understand that louvered units are the norm in Australia and their operation is not impeded when placed through a normal brick veneer wall. There is also a significant difference between the cooling only and reverse cycle units, with sharper cost increases for the latter. Across the relevant EER range, a 10% increase in efficiency of the reverse cycle unit is accompanied by a 20% increase in manufacturing costs. Again, however, the re-designed units have higher capacity, which means that the potential savings from reducing input power have been ignored. There is also a suggestion in the data that larger cost increases are observed when the increment extends beyond the maximum EER (2.84) of interest to this RIS. The additional increment is small, to an EER of 2.88, but the cost increases are noticeably sharper in the two cases where this occurs – for the reverse cycle units and the largest cooling only units (7.1 kW). Residential air conditioners of the ‘central’ or ‘ducted’ type were addressed in a subsequent DoE report (DoE 2002). These do not fall within the scope of the new Australian proposals, but the findings may be regarded as indicative – see figure A4.3. These estimates indicate that, across the relevant range (up to a maximum EER of 2.84), a 10% increase in efficiency is accompanied by a 7-9% increase in manufacturing costs. The lower figure applies to reverse cycle units in this case. DoE (2003) also commissioned engineering studies of commercial units (26-53 kW), which are very much larger than the residential units considered here. Efficiency increases over the relevant range appear to have no significant impact on manufacturing costs. Both of these studies include appropriate adjustments for the impacts of design changes on output capacity. Empirical evidence – manufacturing cost of split units DoE has not reported any analysis of split units that fall within the range of the new Australian proposals; splits have only a small share of the US market for RACs. The closest comparison is for the ‘central’ or ‘ducted’ type of split unit (DoE 2002) – see figure A4.4. The maximum EER of interest in this case is 2.93, which falls in the second interval of the estimates shown in figure A4.4. Over this range, a 10% increase in efficiency is associated with an 8.5% increase in the manufacturing cost of two of the sampled units – cooling only units with a fan coil, and the reverse cycle unit. In the remaining case the increase in manufacturing cost is 15%. Again, appropriate adjustments have been made for the impact of design changes on output capacity.
14 The estimates for room air conditioners were generated by reverse engineering a sample of low efficiency air conditioners, thereby identifying the most cost-effective design changes that will achieve the desired improvements in energy efficiency. 15 ‘Energy’ and ‘power’ are related but different concepts. Energy refers to the total amount of electricity used to complete a particular task such as cooling a given area to a specified temperature. The power of the unit is the rate at which energy can be used.
66

Proposal to increase MEPS for RACs and harmonise MEPS for single & three-phase units - Draft final RIS
FIGURE A4.3: MANUFACTURING COST OF UNITARY CENTRAL AIR CONDITIONERS
0.50
1.00
1.50
2.00
2.00 2.25 2.50 2.75 3.00 3.25 3.50 3.75 4.00
10.6kW - RC 10.6kW - CO
EER
Rel
ativ
e co
st (E
ER 2
.75
= 1.
00)
FIGURE A4.4: MANUFACTURING COST OF SPLIT CENTRAL AIR CONDITIONERS
0.50
1.00
1.50
2.00
2.00 2.25 2.50 2.75 3.00 3.25 3.50 3.75 4.00
10.6kW, CO, cased coil 10.6kW, CO, fan coil 10.6, kW, RC
EER
Rel
ativ
e co
st (E
ER 2
.75
= 1.
00)
Summary of US evidence on manufacturing costs Overall, the US estimates indicate that a 10% increase in efficiency is usually accompanied by a 5-10% increase in manufacturing costs. Some of the case studies have returned larger cost increases, up to 20%. On the other hand, the costs estimates are smaller for the only units that fall within the scope of the new Australian proposal. Allowing for capacity adjustments to the smaller units, the cost increases would generally be less than 5%. The obvious gap in the US estimates is the absence of any analysis of RACs of the split type, particularly the smaller (<7.5 kW) reverse cycle units that dominate the Australian market. Empirical evidence - impact of additional wholesale and contractor costs In the US studies listed above (DoE, 1997, 2002 & 2003), mark-ups have been applied to the increase in manufacturing costs in a mechanical fashion. That is, it was assumed that the percentage increase in manufacturing costs flows through each of the intermediate stages, generating an equivalent percentage increase in the installed cost. However a change in that approach has been signalled recently, with the publication of a report by LBNL (Dale et al 2004). The new report recognises that most elements of wholesaler and contractor costs are
67
Proposal to increase MEPS for RACs and harmonise MEPS for single & three-phase units - Draft final RIS
not affected by increases in the efficiency or manufacturing cost of air conditioners and the flow-through effect should be moderated accordingly. The effect is quite dramatic if wholesaler and contractor costs are unaffected by the increase in manufacturing costs. Given overall baseline mark-ups of 2.75 and 3.17 for commercial and residential products respectively, it follows that the percentage increase in installed cost is about one third of the percentage increase in manufacturing cost16. For example, a 7.5% increase in manufacturing cost would be equivalent to a 2.5% increase in installed cost. However it is unlikely that wholesaler and contractor costs will be entirely unaffected. There will be some additional transport and storage costs if the units are somewhat larger or heavier, and some additional costs associated with more expensive inventory, such as interest, insurance and losses from bad debts. Dale et al nominate certain elements of wholesaler and contractor costs that would vary with manufacturing costs, including the following:
• All wholesaler and contractor profits. • All advertising and promotional expenses • All vehicle operating expenses of contractors • All depreciation and repairs to contractor machinery • All ‘other’ expenses not elsewhere classified.
However we don’t see why these expenses should increase in proportion to the manufacturing costs. Our view is that the impact on wholesaler and contractor costs is uncertain and probably minor, to the point where they can be ignored for the purposes of the base case. The effect is small relative to the sensitivity tests that are reported in this RIS. Ex-post evidence of regulatory impact on appliance costs LBNL has also provided the DoE with a retrospective review of the regulatory impacts on the market for household appliances, including the impact on financial consumer prices (Meyers et al 2002). While the analysis is not statistically sophisticated – being limited to inspection of graphs of average prices over time – there is no evidence that US efficiency regulations have interrupted the steady downward movement in the real cost of household appliances, including for RACs. This is despite clear evidence that the regulations have resulted in step changes in energy efficiency at the time of the regulatory interventions. The authors believe that the DoE-commissioned ex-ante assessments have systematically overestimated the actual increase in costs. Previous Australian studies There is no Australian work that matches the detailed engineering work reported by the DoE. However Unisearch (1998) and GWA (2000) have reported some rough estimates for larger three-phase units used mostly in commercial applications, not overlapping in any way with the units covered by the new Australian proposals. At best, the figuring might be regarded as suggesting orders of magnitude. Unisearch and GWA put the additional ongoing costs at $50/unit and $100/unit respectively, but with those costs expressed relative to the sum of all air conditioner sales, including both complying and non-complying models. Given that about a third of the sales comprised of non-complying units, the implied estimates of the increase in costs per non-complying unit are $150 and $300 respectively. GWA reports that the $300 estimate is about 6% of the average retail price, which means that Unisearch puts the increase at 3%. The other key difference between the two estimates is that only GWA is referring to additional production costs, that is, the costs of improved materials and components. Unisearch refers to the $50/unit as the costs of administration, labelling and information activities of both industry and government. The
16 An overall markup of 3.17 indicates that a unit that cost $1 to produce will eventually be installed for a total cost of $3.17.
68
Proposal to increase MEPS for RACs and harmonise MEPS for single & three-phase units - Draft final RIS
69
published information in the two reports is not sufficient to calculate the implied ratio of percentage increase in installed cost, to percentage increase in efficiency. Conclusion There is unavoidable uncertainty about the impact of the proposed measures on the installed cost of air conditioners. However, in the light of the available evidence, it seems reasonable to define the base case as follows:
• a 10% increase in energy efficiency is associated with a 5-10% increase in manufacturing costs and the average increase can be put at 7.5%;
• manufacturing costs account for one third of the installed cost, which means that a 10% increase in energy efficiency is associated with a 2.5% increase in the installed cost, and the ratio of percentage increase in energy efficiency, to percentage increase in installed cost is 0.25.
The ratio of 0.25 has been adopted to provide an estimate of the impact on the installed cost of any increase in efficiency required to achieve either the existing 2007 MEPS or the European benchmarks that are ‘next best’ relative to the proposed 2007 MEPS. For any further increase from the European benchmarks to the proposed 2007 MEPS, the ratio has been put at 0.33. Sensitivity tests have been reported over a wide range, with a 25% reduction on the downside and a 50% increase on the upside.