Embed Size (px)
Citation preview
Keeping Older People in the Labor Force
Alicia H. Munnell and Abigail N. Walters
Center for Retirement Research at Boston College
“Improving Opportunities for Those Who Want to Work Longer”
The Brookings Institution
Washington, DC
January 24, 2019
1
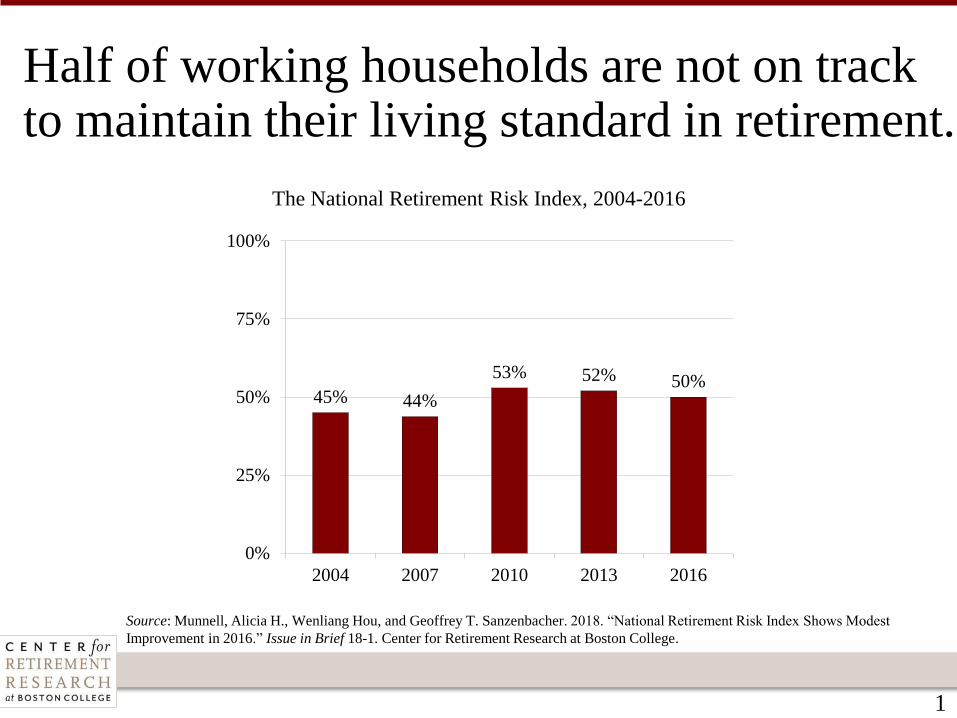
The National Retirement Risk Index, 2004-2016
Source: Munnell, Alicia H., Wenliang Hou, and Geoffrey T. Sanzenbacher. 2018. “National Retirement Risk Index Shows Modest
Improvement in 2016.” Issue in Brief 18-1. Center for Retirement Research at Boston College.
Half of working households are not on track to maintain their living standard in retirement.
45% 44%
53% 52% 50%
0%
25%
50%
75%
100%
2004 2007 2010 2013 2016
2
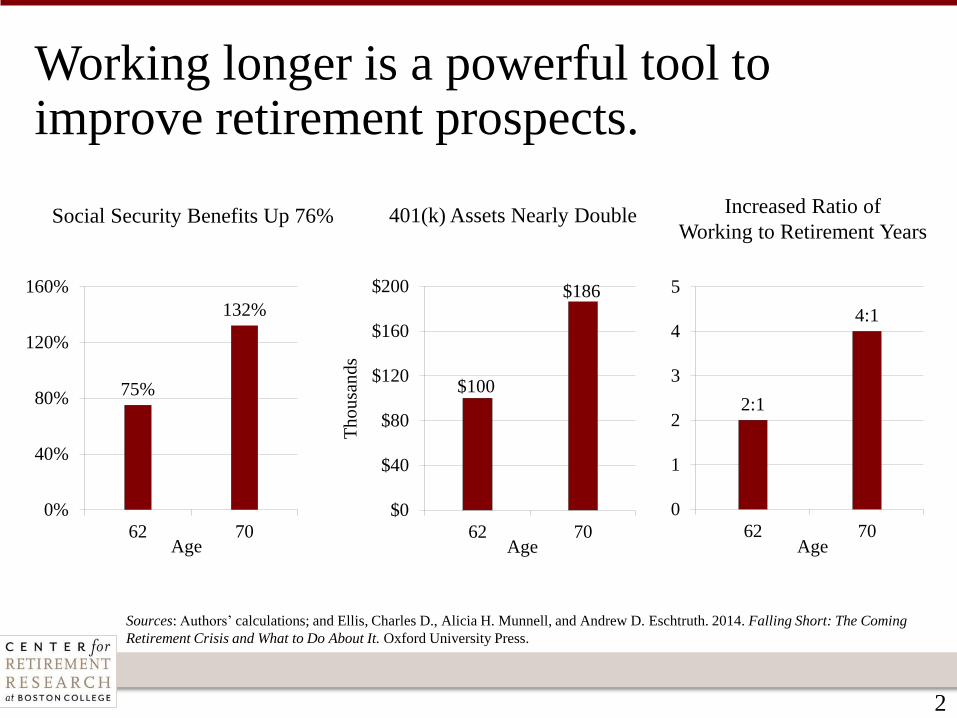
Sources: Authors’ calculations; and Ellis, Charles D., Alicia H. Munnell, and Andrew D. Eschtruth. 2014. Falling Short: The Coming
Retirement Crisis and What to Do About It. Oxford University Press.
Working longer is a powerful tool to improve retirement prospects.
Social Security Benefits Up 76%
75%
132%
0%
40%
80%
120%
160%
62 70Age
401(k) Assets Nearly Double
$100
$186
$0
$40
$80
$120
$160
$200
62 70
Th
ou
san
ds
Age
Increased Ratio of
Working to Retirement Years
2:1
4:1
0
1
2
3
4
5
62 70Age
60
65
70
75
80
85
90
95Life expectancy
Average retirement age
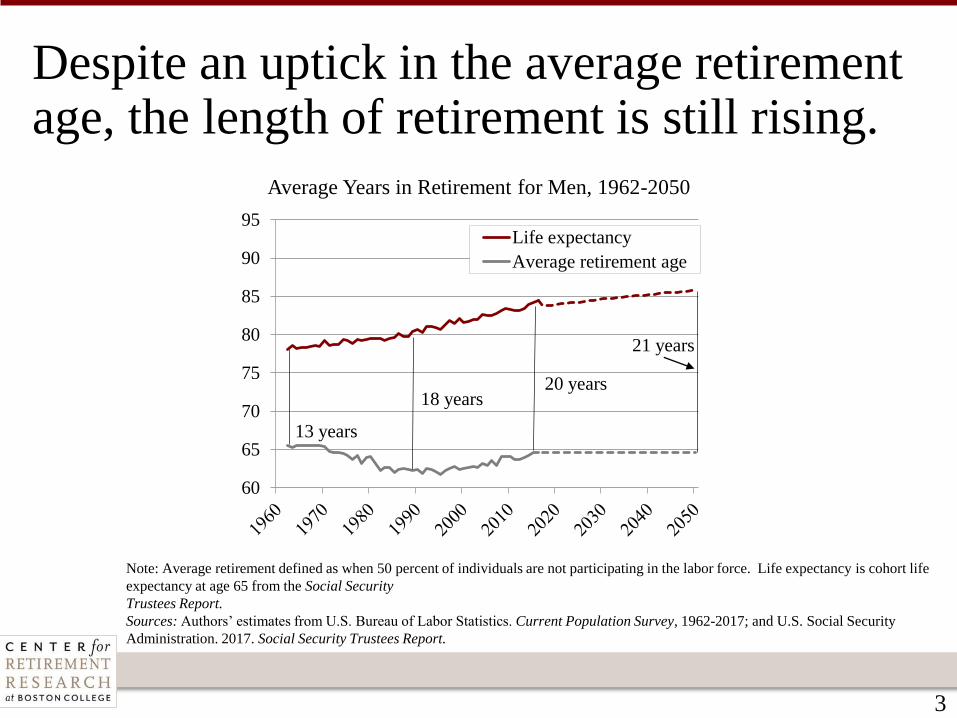
13 years
21 years
20 years18 years
3
Despite an uptick in the average retirement age, the length of retirement is still rising.
Average Years in Retirement for Men, 1962-2050
Note: Average retirement defined as when 50 percent of individuals are not participating in the labor force. Life expectancy is cohort life
expectancy at age 65 from the Social Security
Trustees Report.
Sources: Authors’ estimates from U.S. Bureau of Labor Statistics. Current Population Survey, 1962-2017; and U.S. Social Security
Administration. 2017. Social Security Trustees Report.
4
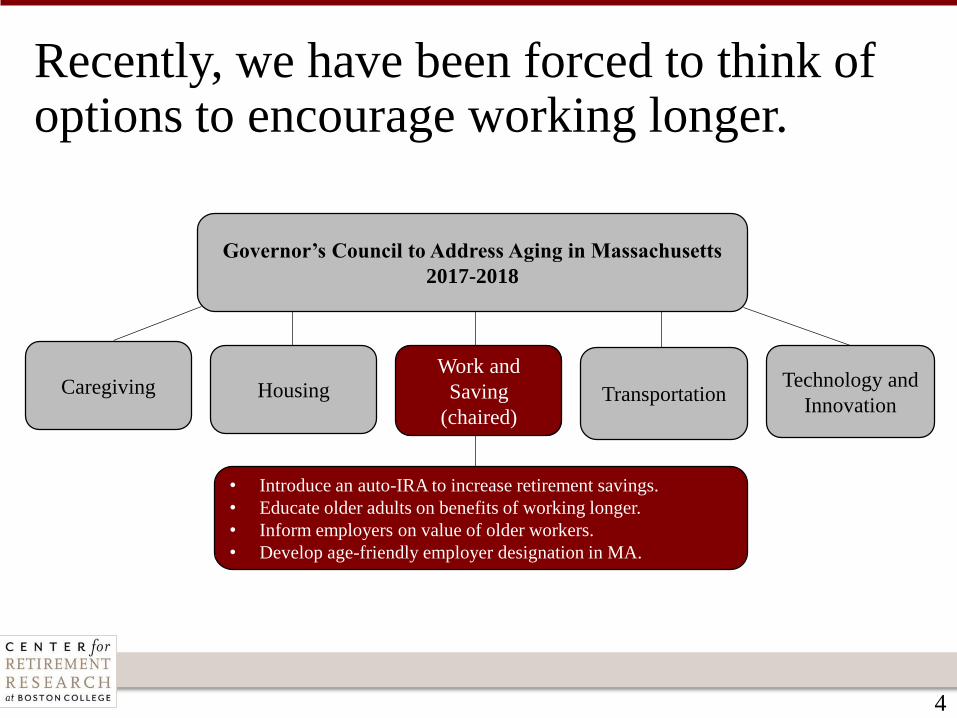
Recently, we have been forced to think of options to encourage working longer.
Governor’s Council to Address Aging in Massachusetts
2017-2018
Work and
Saving
(chaired)
Housing TransportationCaregiving Technology and
Innovation
• Introduce an auto-IRA to increase retirement savings.
• Educate older adults on benefits of working longer.
• Inform employers on value of older workers.
• Develop age-friendly employer designation in MA.
5
The key to the workgroup’s vision was the active involvement of the governor.
• On the employee side, the governor would host events on the
importance of working longer.
• On the employer side, the governor would meet with local
business leaders to share the business case for older workers.
6
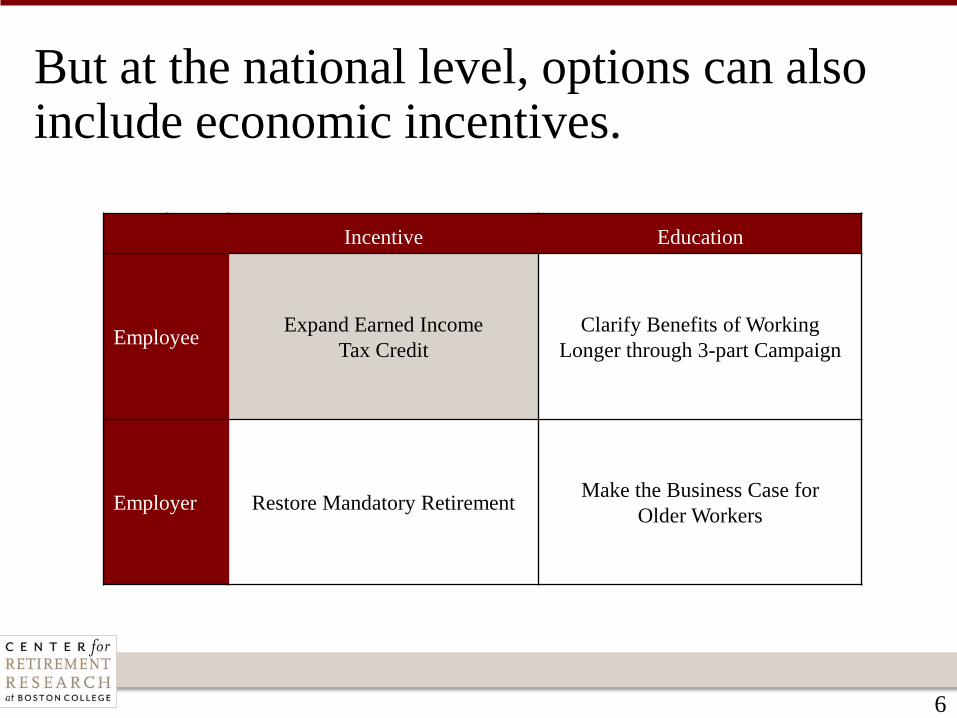
But at the national level, options can also include economic incentives.
Incentive Education
EmployeeExpand Earned Income
Tax Credit
Clarify Benefits of Working
Longer through 3-part Campaign
Employer Restore Mandatory RetirementMake the Business Case for
Older Workers
7
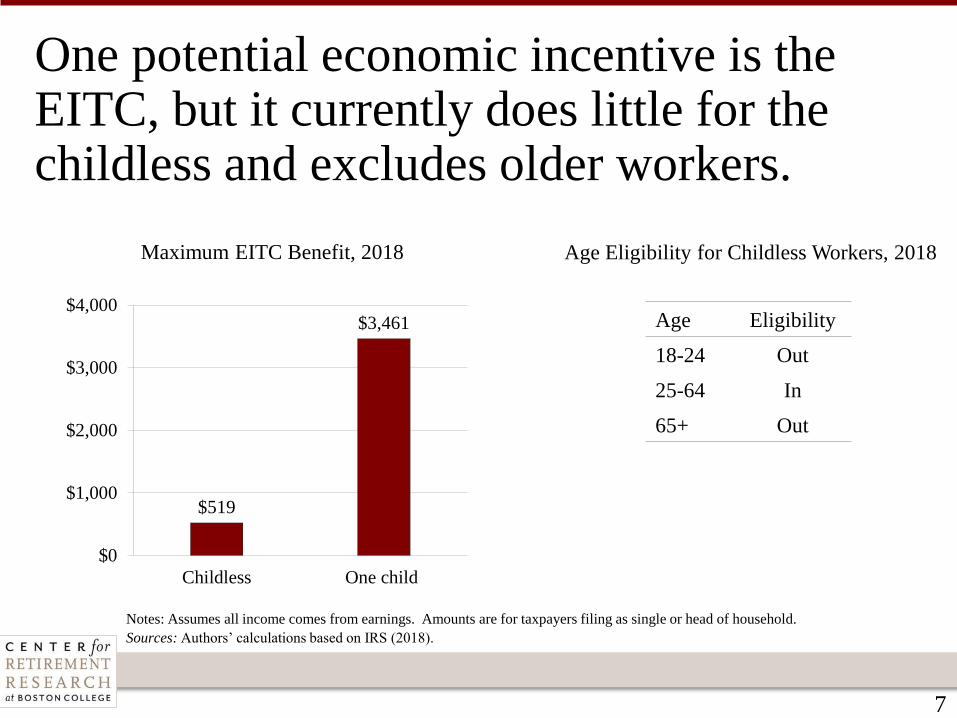
One potential economic incentive is the EITC, but it currently does little for the childless and excludes older workers.
Maximum EITC Benefit, 2018
Notes: Assumes all income comes from earnings. Amounts are for taxpayers filing as single or head of household.
Sources: Authors’ calculations based on IRS (2018).
$519
$3,461
$0
$1,000
$2,000
$3,000
$4,000
Childless One child
Age Eligibility for Childless Workers, 2018
Age Eligibility
18-24 Out
25-64 In
65+ Out
8
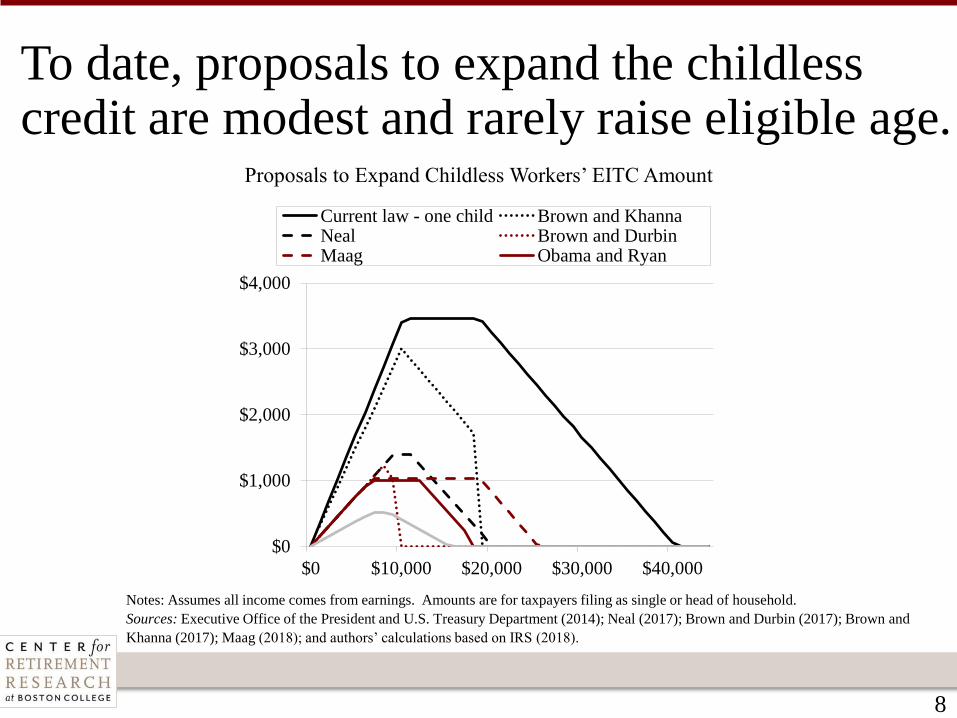
To date, proposals to expand the childless credit are modest and rarely raise eligible age.
Proposals to Expand Childless Workers’ EITC Amount
$0
$1,000
$2,000
$3,000
$4,000
$0 $10,000 $20,000 $30,000 $40,000
Current law - one child Brown and KhannaNeal Brown and DurbinMaag Obama and Ryan
Notes: Assumes all income comes from earnings. Amounts are for taxpayers filing as single or head of household.
Sources: Executive Office of the President and U.S. Treasury Department (2014); Neal (2017); Brown and Durbin (2017); Brown and
Khanna (2017); Maag (2018); and authors’ calculations based on IRS (2018).
9
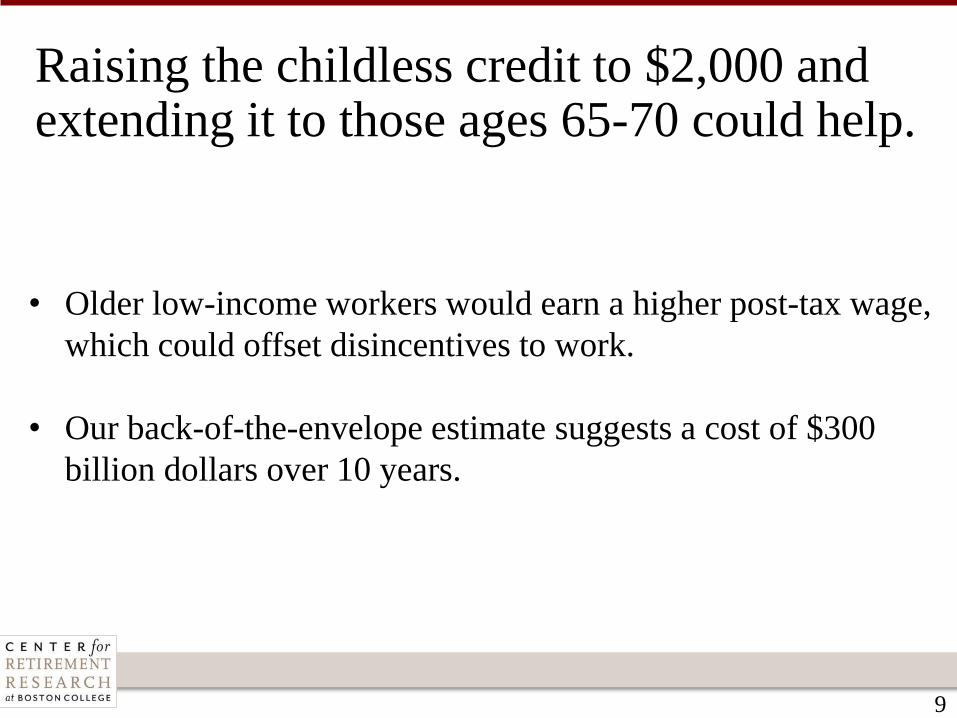
Raising the childless credit to $2,000 and extending it to those ages 65-70 could help.
• Older low-income workers would earn a higher post-tax wage,
which could offset disincentives to work.
• Our back-of-the-envelope estimate suggests a cost of $300
billion dollars over 10 years.
10
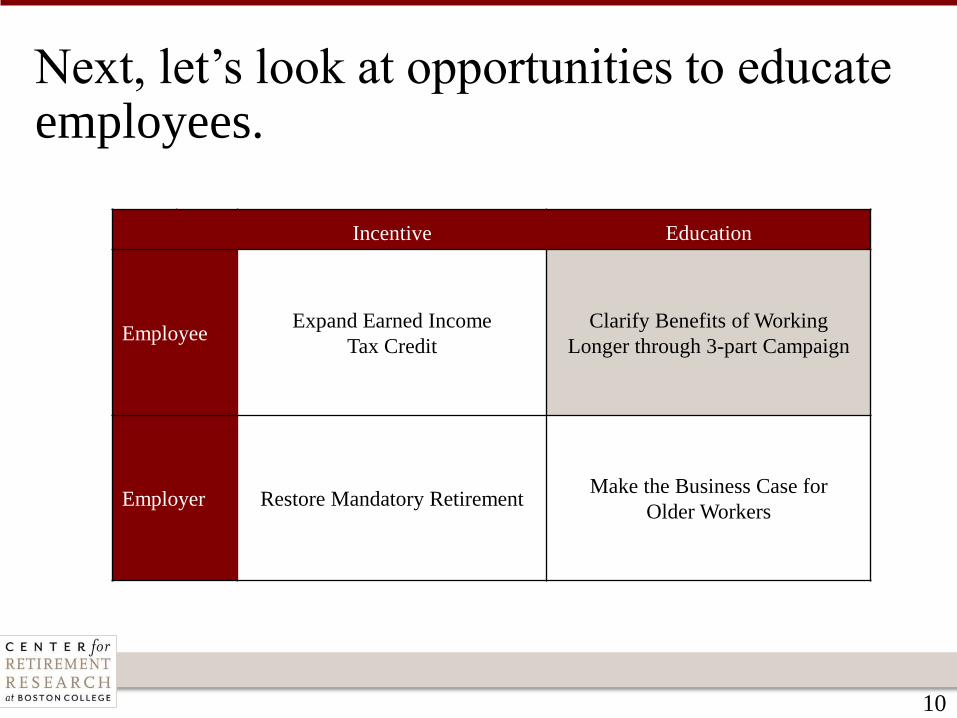
Next, let’s look at opportunities to educate employees.
Incentive Education
EmployeeExpand Earned Income
Tax Credit
Clarify Benefits of Working
Longer through 3-part Campaign
Employer Restore Mandatory RetirementMake the Business Case for
Older Workers
11
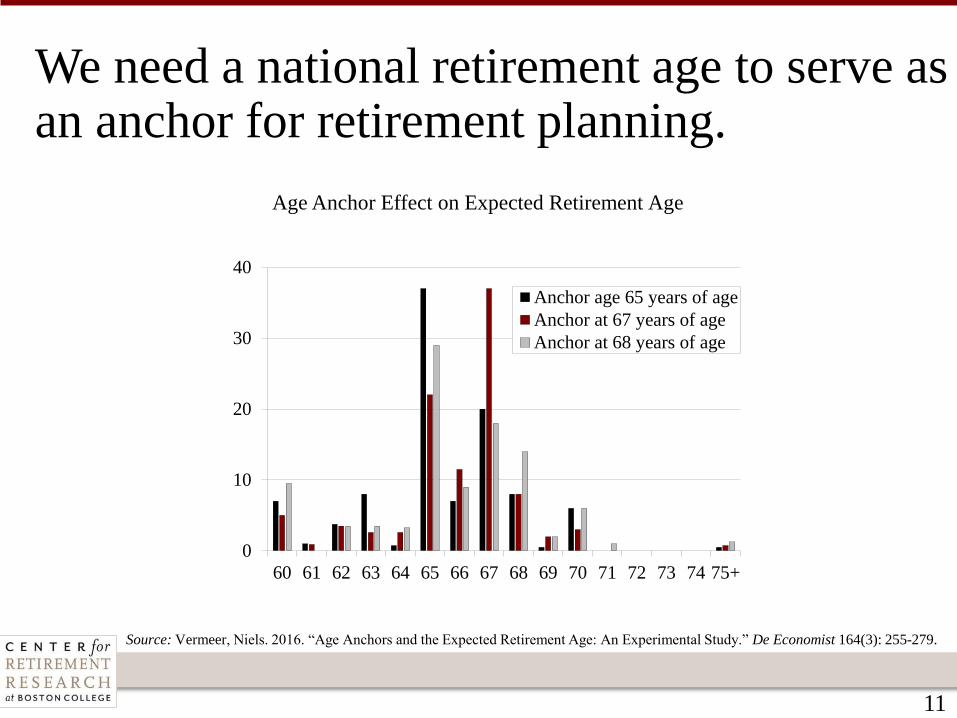
We need a national retirement age to serve as an anchor for retirement planning.
Age Anchor Effect on Expected Retirement Age
Source: Vermeer, Niels. 2016. “Age Anchors and the Expected Retirement Age: An Experimental Study.” De Economist 164(3): 255-279.
0
10
20
30
40
60 61 62 63 64 65 66 67 68 69 70 71 72 73 74 75+
Anchor age 65 years of age
Anchor at 67 years of age
Anchor at 68 years of age
12
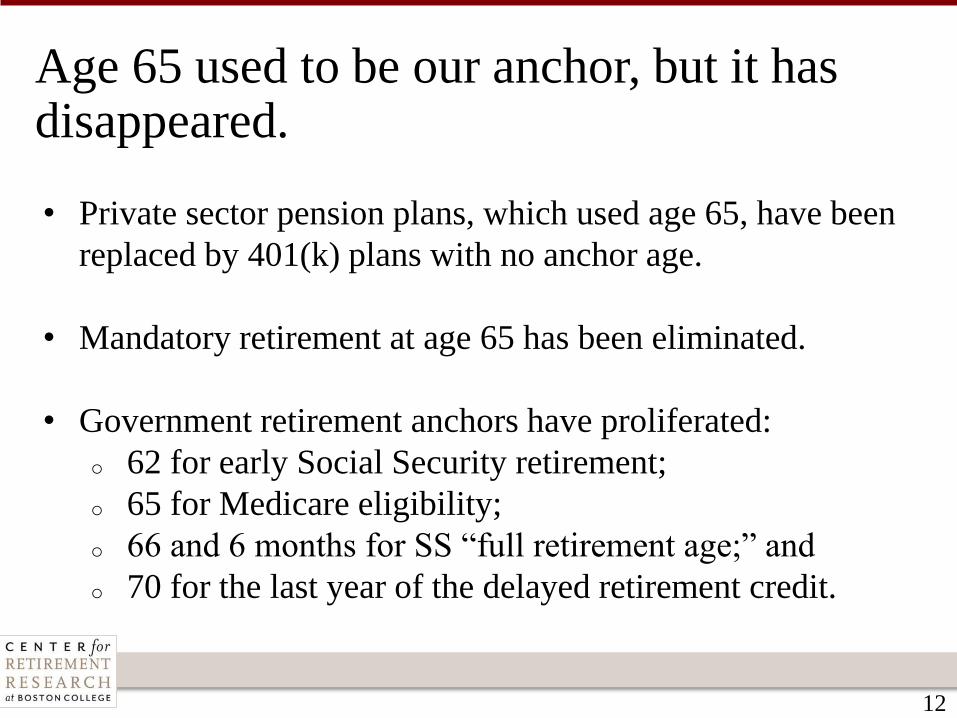
Age 65 used to be our anchor, but it has disappeared.
• Private sector pension plans, which used age 65, have been
replaced by 401(k) plans with no anchor age.
• Mandatory retirement at age 65 has been eliminated.
• Government retirement anchors have proliferated:
o 62 for early Social Security retirement;
o 65 for Medicare eligibility;
o 66 and 6 months for SS “full retirement age;” and
o 70 for the last year of the delayed retirement credit.
13
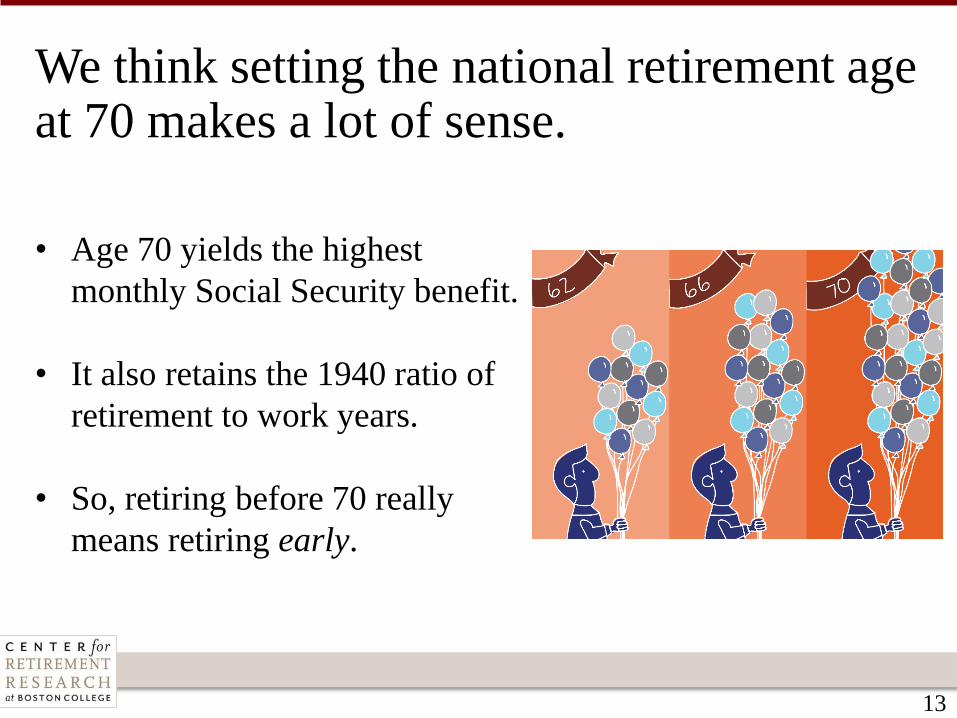
We think setting the national retirement age at 70 makes a lot of sense.
• Age 70 yields the highest
monthly Social Security benefit.
• It also retains the 1940 ratio of
retirement to work years.
• So, retiring before 70 really
means retiring early.
14
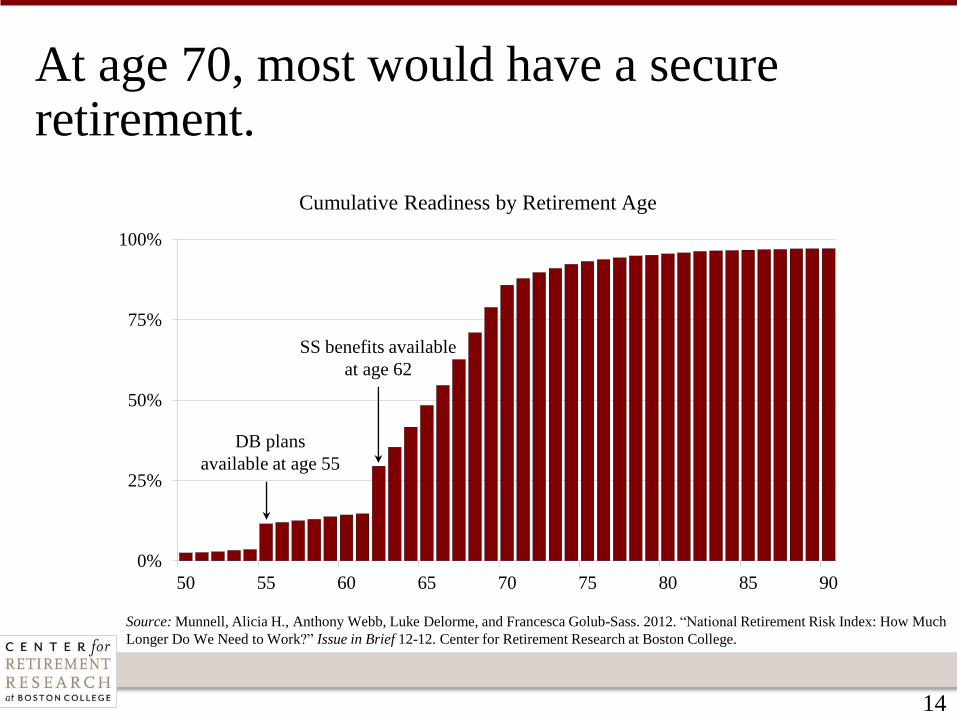
At age 70, most would have a secure retirement.
0%
25%
50%
75%
100%
50 55 60 65 70 75 80 85 90
DB plans
available at age 55
SS benefits available
at age 62
Cumulative Readiness by Retirement Age
Source: Munnell, Alicia H., Anthony Webb, Luke Delorme, and Francesca Golub-Sass. 2012. “National Retirement Risk Index: How Much
Longer Do We Need to Work?” Issue in Brief 12-12. Center for Retirement Research at Boston College.
15
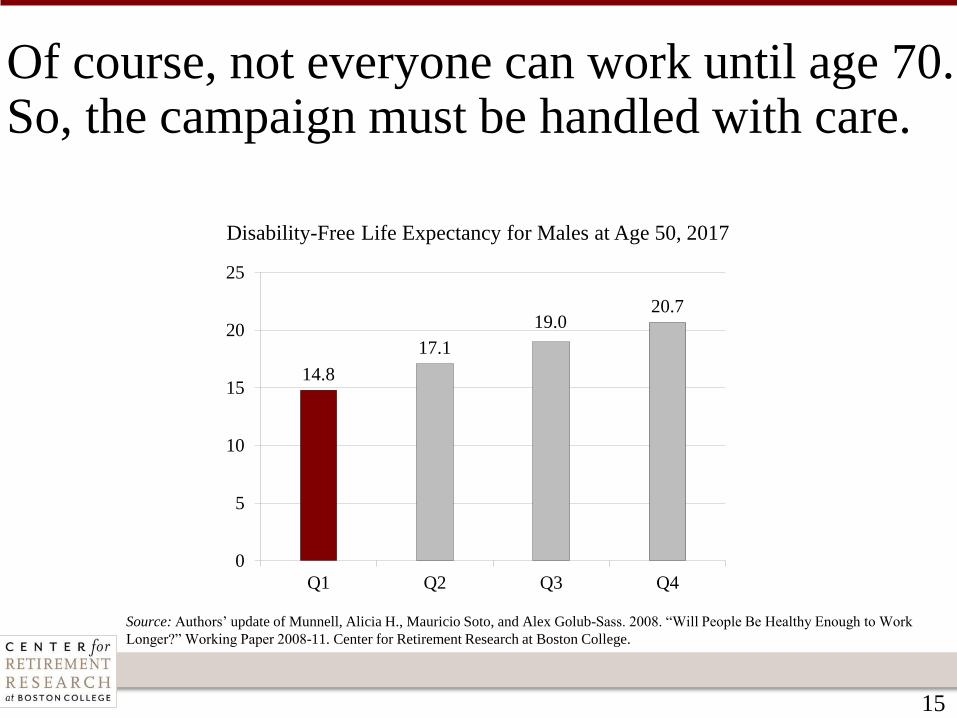
Of course, not everyone can work until age 70. So, the campaign must be handled with care.
Disability-Free Life Expectancy for Males at Age 50, 2017
Source: Authors’ update of Munnell, Alicia H., Mauricio Soto, and Alex Golub-Sass. 2008. “Will People Be Healthy Enough to Work
Longer?” Working Paper 2008-11. Center for Retirement Research at Boston College.
14.8
17.1
19.020.7
0
5
10
15
20
25
Q1 Q2 Q3 Q4
16
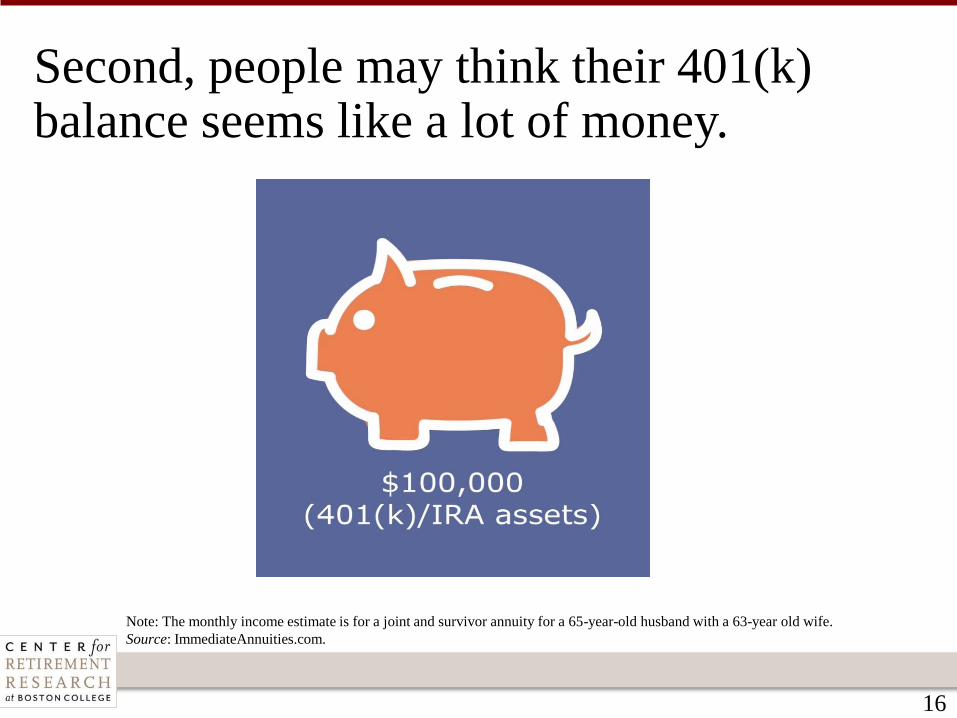
Second, people may think their 401(k) balance seems like a lot of money.
Note: The monthly income estimate is for a joint and survivor annuity for a 65-year-old husband with a 63-year old wife.
Source: ImmediateAnnuities.com.
17
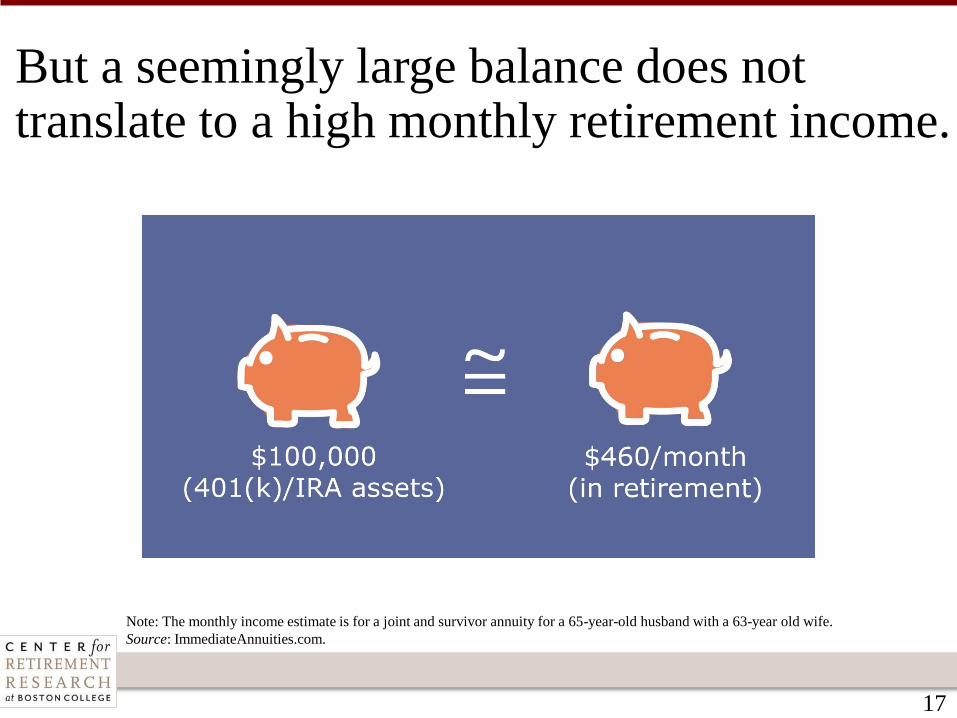
But a seemingly large balance does not translate to a high monthly retirement income.
Note: The monthly income estimate is for a joint and survivor annuity for a 65-year-old husband with a 63-year old wife.
Source: ImmediateAnnuities.com.
18
To weaken this “money illusion,” report how 401(k) assets translate to lifetime income.
• This shift would help participants have a better sense of how
much monthly income they will have in retirement.
• The hope is that it will improve saving decisions and could
signal that they need to work longer.
19
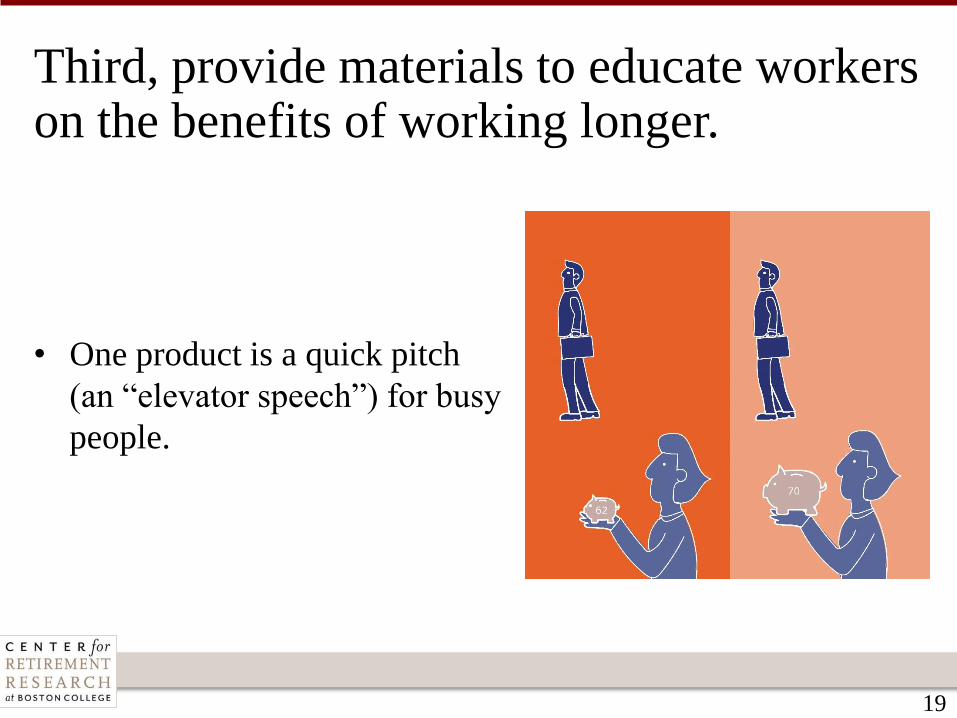
Third, provide materials to educate workers on the benefits of working longer.
• One product is a quick pitch
(an “elevator speech”) for busy
people.
20
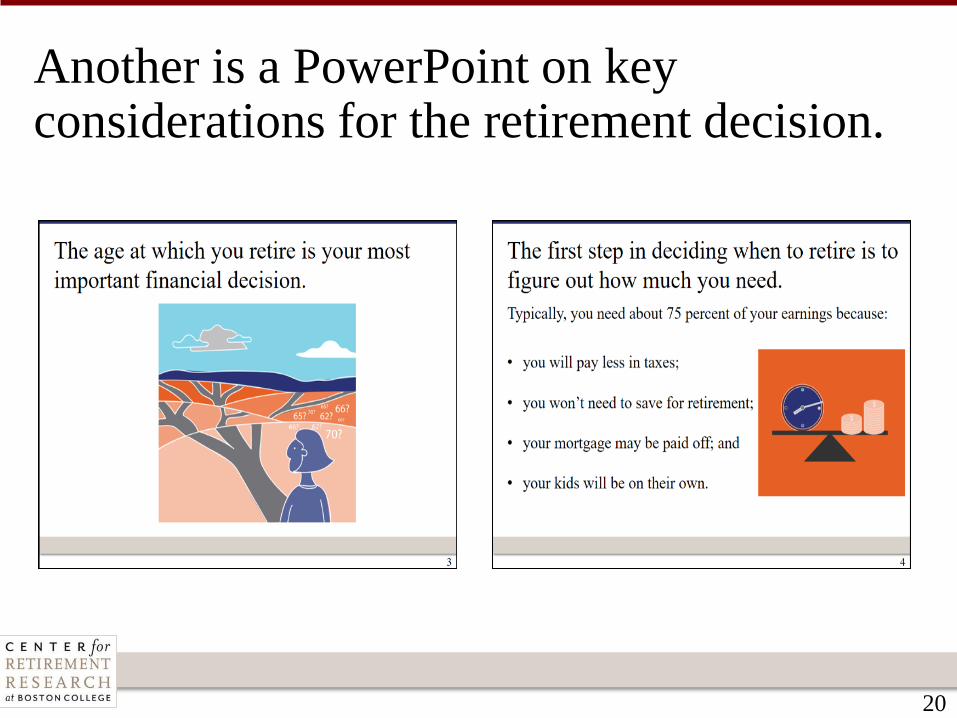
Another is a PowerPoint on key considerations for the retirement decision.
21
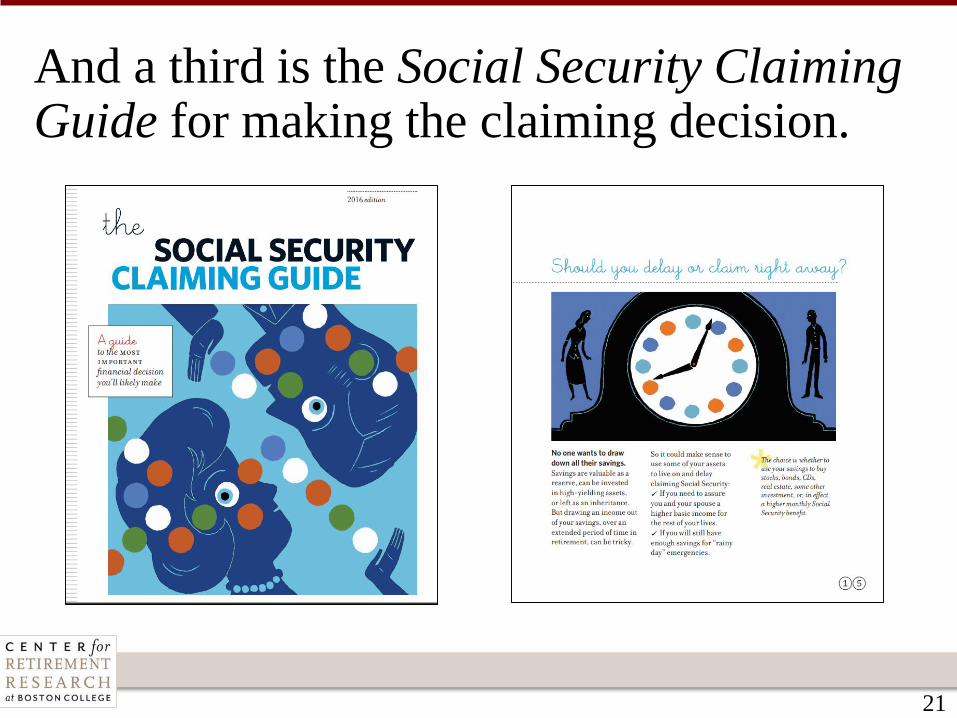
And a third is the Social Security Claiming Guide for making the claiming decision.
22
Three strategies exist to get the word out on working longer:
• request that governors host events on the importance of
working longer;
• distribute the presentations and accompanying materials
through employers and other relevant organizations; and
• publish suite of educational materials on state’s website.
23
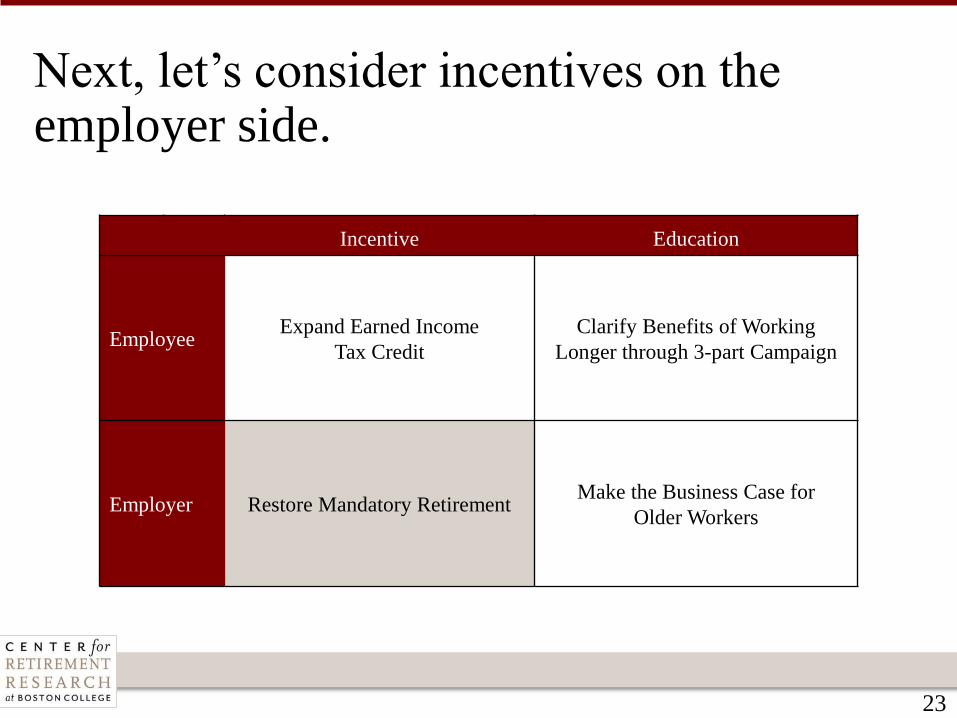
Next, let’s consider incentives on the employer side.
Incentive Education
EmployeeExpand Earned Income
Tax Credit
Clarify Benefits of Working
Longer through 3-part Campaign
Employer Restore Mandatory RetirementMake the Business Case for
Older Workers
24
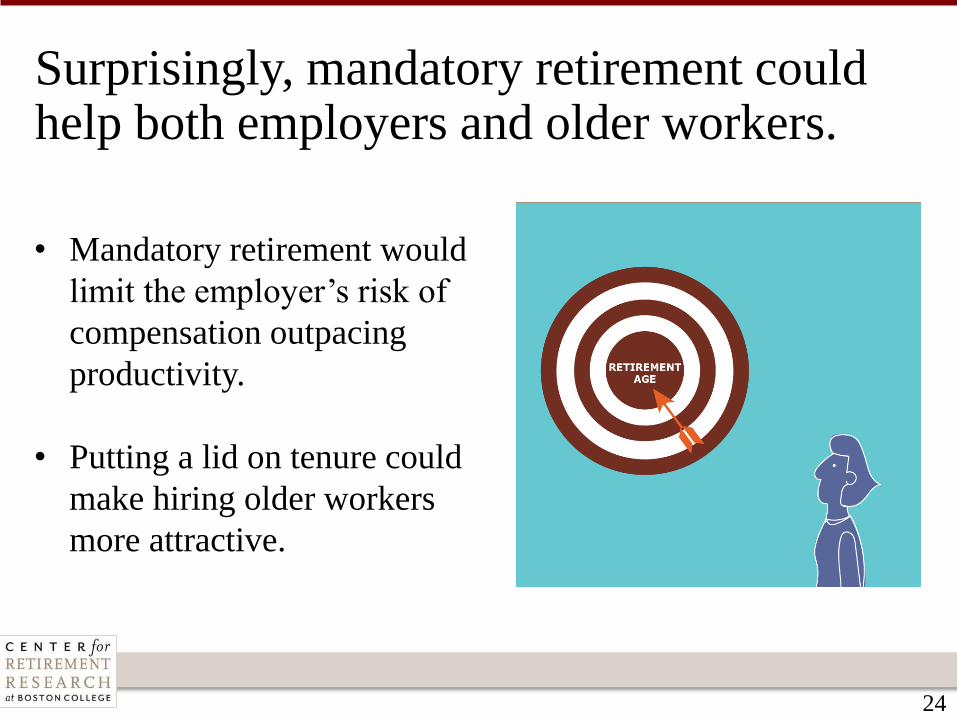
Surprisingly, mandatory retirement could help both employers and older workers.
• Mandatory retirement would
limit the employer’s risk of
compensation outpacing
productivity.
• Putting a lid on tenure could
make hiring older workers
more attractive.
25
A proposal to reinstate mandatory retirement would certainly be controversial.
• Create a default mandatory retirement age of 70 and allow
firms to opt out or set a higher age.
• Those employers that choose the default would have to notify
employees six months before the mandatory retirement age.
• Employers would be required to consider employees’ requests
to work beyond the mandatory retirement age.
26
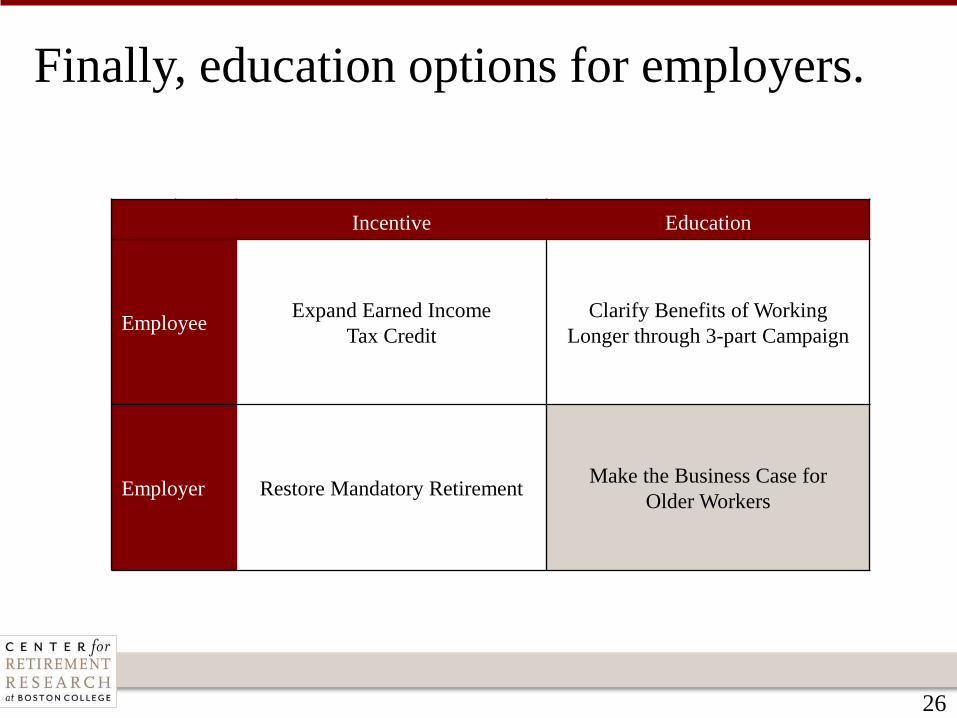
Finally, education options for employers.
Incentive Education
EmployeeExpand Earned Income
Tax Credit
Clarify Benefits of Working
Longer through 3-part Campaign
Employer Restore Mandatory RetirementMake the Business Case for
Older Workers
27
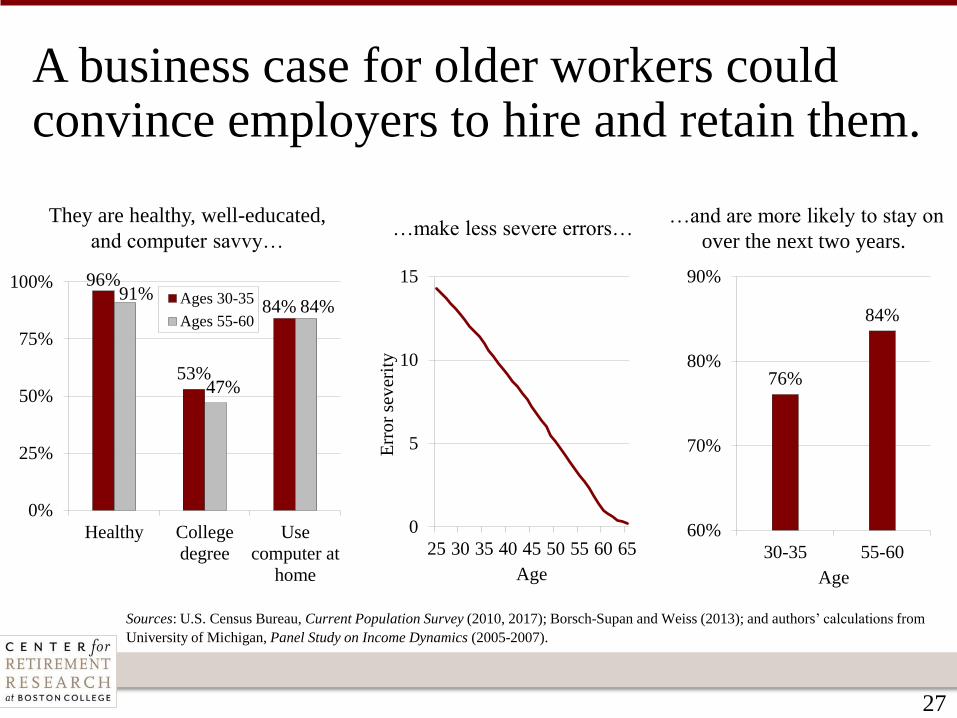
A business case for older workers could convince employers to hire and retain them.
96%
53%
84%91%
47%
84%
0%
25%
50%
75%
100%
Healthy College
degree
Use
computer at
home
Ages 30-35
Ages 55-60
They are healthy, well-educated,
and computer savvy…
0
5
10
15
25 30 35 40 45 50 55 60 65
Err
or
sev
erit
y
Age
76%
84%
60%
70%
80%
90%
30-35 55-60
Age
…make less severe errors……and are more likely to stay on
over the next two years.
Sources: U.S. Census Bureau, Current Population Survey (2010, 2017); Borsch-Supan and Weiss (2013); and authors’ calculations from
University of Michigan, Panel Study on Income Dynamics (2005-2007).
28
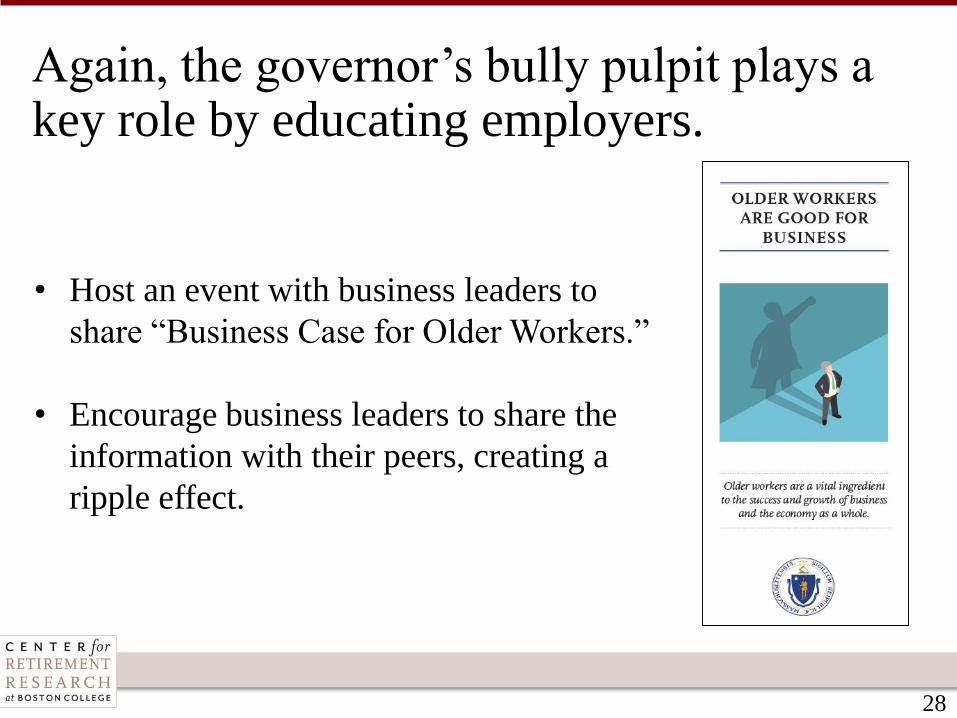
Again, the governor’s bully pulpit plays a key role by educating employers.
• Host an event with business leaders to
share “Business Case for Older Workers.”
• Encourage business leaders to share the
information with their peers, creating a
ripple effect.
29
At the national level, DOL could support such an effort by launching a pilot program.
• Interested governors would partner with DOL to distribute
information to employers.
• DOL would assess the effectiveness of these pilot programs for
potential rollout on a national scale.
30
Our proposals exclude two popular suggestions.
• Increase job training for
older workers.
• Expand opportunities for
phased retirement.
31
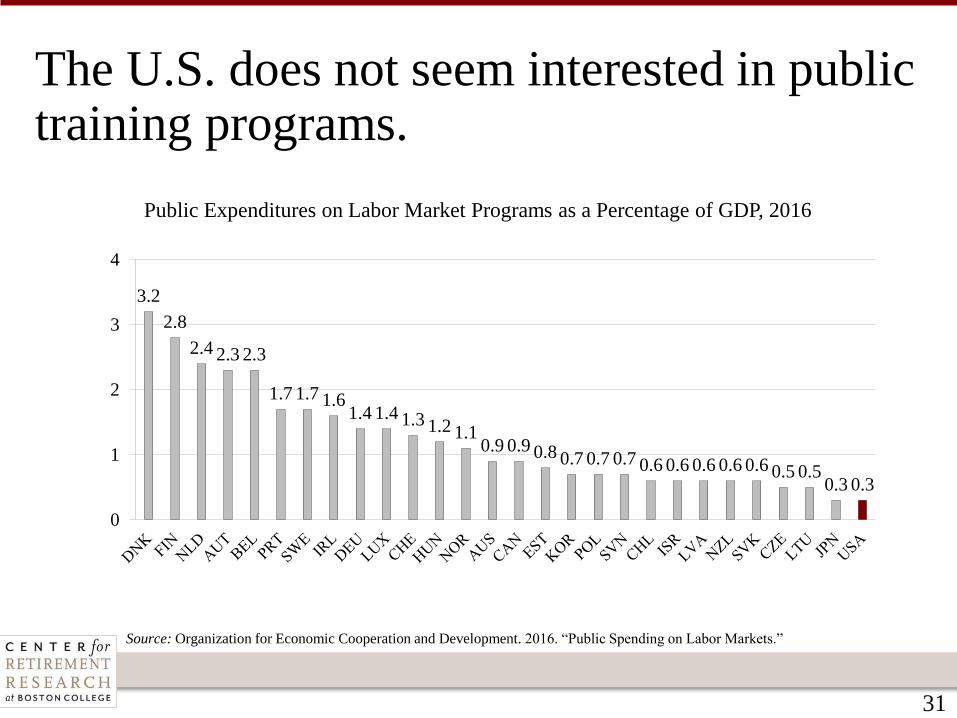
The U.S. does not seem interested in public training programs.
3.2
2.8
2.4 2.3 2.3
1.7 1.7 1.61.4 1.4 1.3 1.2 1.1
0.9 0.9 0.8 0.7 0.7 0.7 0.6 0.6 0.6 0.6 0.6 0.5 0.50.3 0.3
0
1
2
3
4
Public Expenditures on Labor Market Programs as a Percentage of GDP, 2016
Source: Organization for Economic Cooperation and Development. 2016. “Public Spending on Labor Markets.”
32
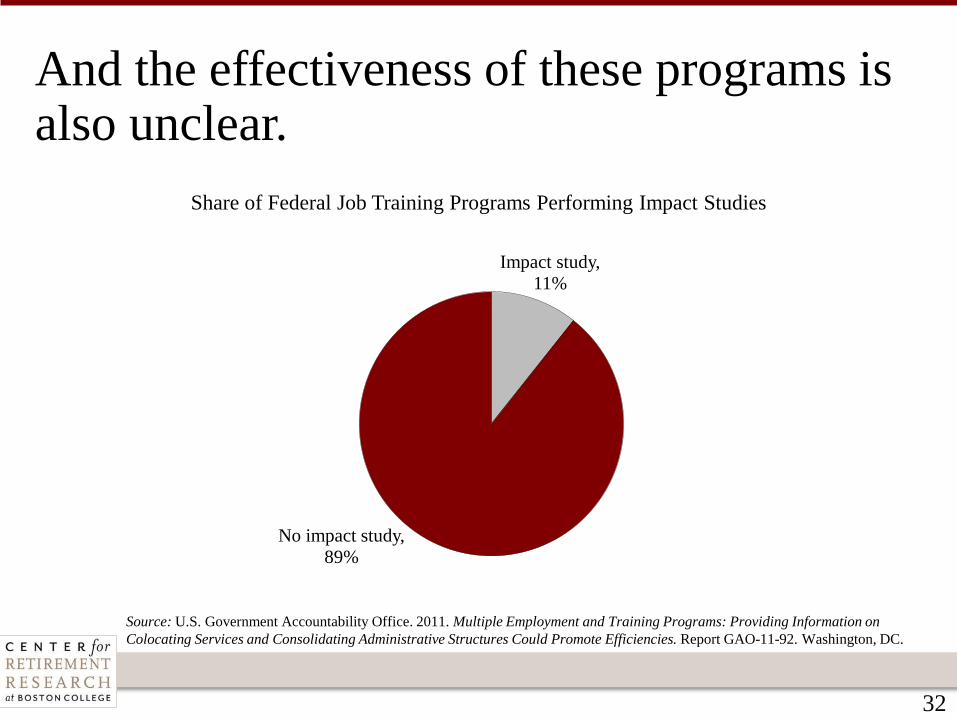
And the effectiveness of these programs is also unclear.
Impact study,
11%
No impact study,
89%
Share of Federal Job Training Programs Performing Impact Studies
Source: U.S. Government Accountability Office. 2011. Multiple Employment and Training Programs: Providing Information on
Colocating Services and Consolidating Administrative Structures Could Promote Efficiencies. Report GAO-11-92. Washington, DC.
33
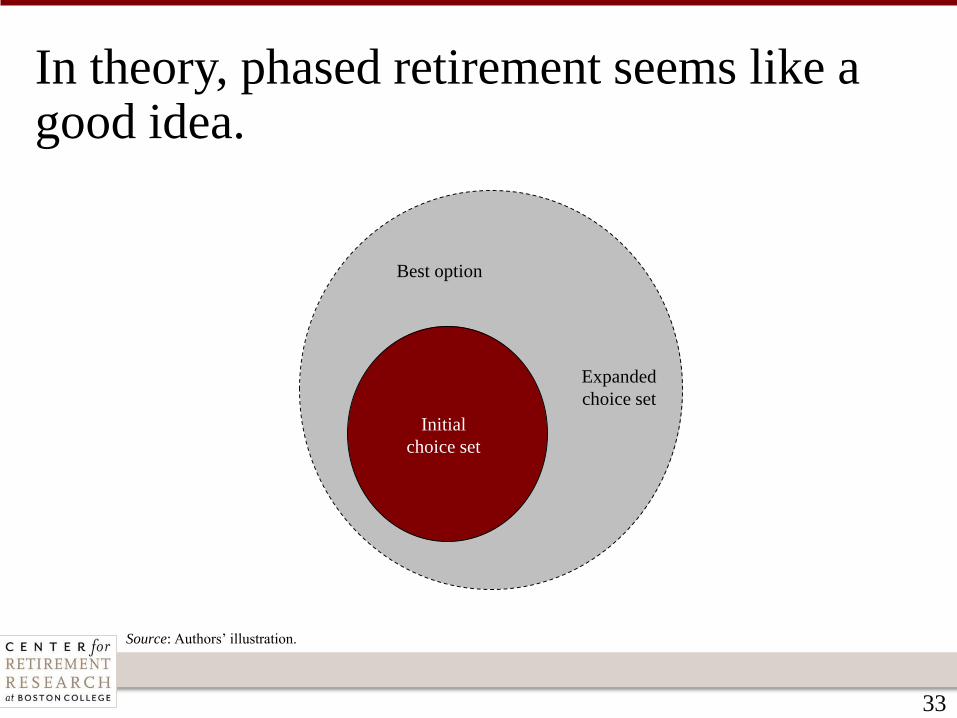
In theory, phased retirement seems like a good idea.
Best option
Expanded
choice set
Initial
choice set
Source: Authors’ illustration.
34
But, phased retirement is a diversion from the need to work longer.
• It hurts the attractiveness of older workers because they appear
to require special care;
• may not improve workers’ happiness, which appears to depend
more on their control over the nature and timing of their
retirement; and…
35
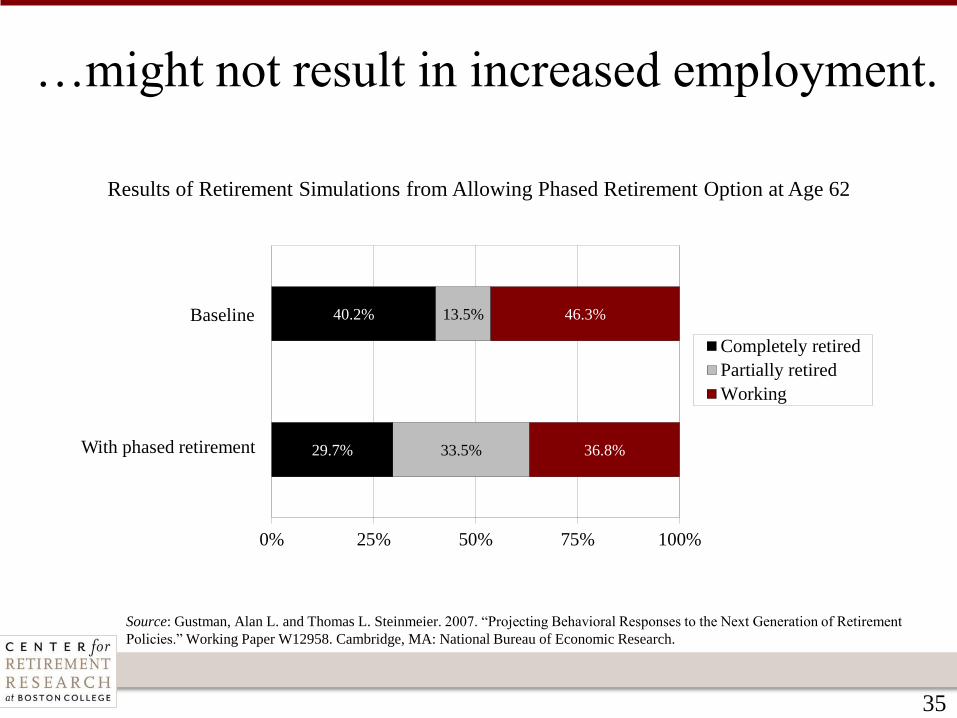
…might not result in increased employment.
29.7%
40.2%
33.5%
13.5%
36.8%
46.3%
0% 25% 50% 75% 100%
Completely retired
Partially retired
Working
Baseline
With phased retirement
Source: Gustman, Alan L. and Thomas L. Steinmeier. 2007. “Projecting Behavioral Responses to the Next Generation of Retirement
Policies.” Working Paper W12958. Cambridge, MA: National Bureau of Economic Research.
Results of Retirement Simulations from Allowing Phased Retirement Option at Age 62
36
Conclusion
• The single best way to ensure that today’s workers can enjoy a
secure retirement is:
o to encourage them to stay in the labor force longer; and
o convince employers to hire and retain them.
• The next step is to convince policymakers to actively and
energetically support these types of initiatives.