Embed Size (px)
Citation preview
1
Proposed 2021 Bond Issuance: Refunding and New DebtOverview of Proposed Transaction
Transportation Committee Item 9A | January 15, 2021
2021 Bond Financing Team
San Diego Association of Governments Hasan Ikhrata, Executive Director Andre Douzdjian, Chief Financial Officer Jose Nuncio, TransNet Department Director John Kirk, General Counsel Ray Major, Chief Economist Dawn Vettese, Strategic Capital Funding & ITOC Manager
Financial Advisors, Public Financial Management Peter Shellenberger, Managing Director
Bond Counsel, Orrick, Herrington & Sutcliffe, LLP Devin Brennan, Partner
Disclosure Counsel, Norton Rose Fulbright US, LLP Victor Hsu, Partner Russ Trice, Partner
Co-Senior Underwriter, Wells Fargo Julie Burger, Managing Director
Co-Senior Underwriter, Bank of America Bryon Rockwell, Managing Director
2
1
2
2
2021 Bond Issuance Presentation
1. Why we need to issue these bonds
- Refunding
- New Money
2. Potential size and structure
3. Credit rating
4. Calendar of events
3
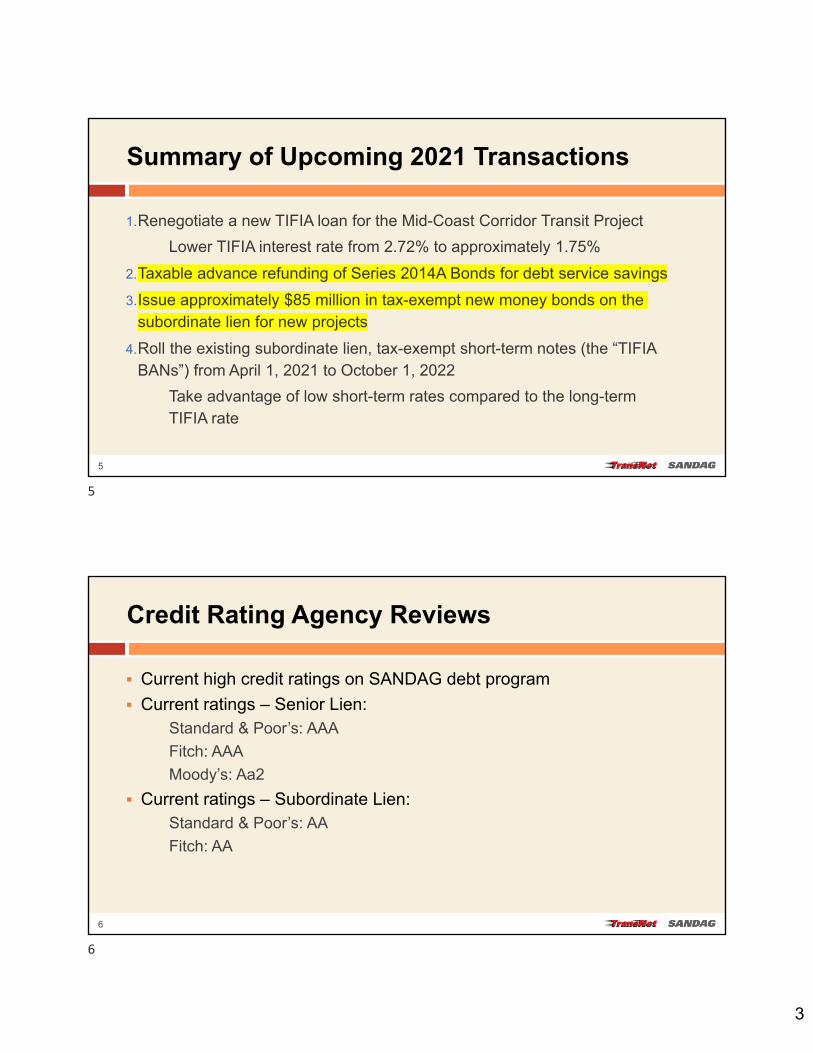
Why are we issuing these bonds?
4
3
4
3
Summary of Upcoming 2021 Transactions
1.Renegotiate a new TIFIA loan for the Mid-Coast Corridor Transit Project
� Lower TIFIA interest rate from 2.72% to approximately 1.75%
2.Taxable advance refunding of Series 2014A Bonds for debt service savings
3.Issue approximately $85 million in tax-exempt new money bonds on the subordinate lien for new projects
4.Roll the existing subordinate lien, tax-exempt short-term notes (the “TIFIA BANs”) from April 1, 2021 to October 1, 2022
� Take advantage of low short-term rates compared to the long-term TIFIA rate
5
Credit Rating Agency Reviews
Current high credit ratings on SANDAG debt program
Current ratings – Senior Lien:� Standard & Poor’s: AAA
� Fitch: AAA
� Moody’s: Aa2
Current ratings – Subordinate Lien:� Standard & Poor’s: AA
� Fitch: AA
6
5
6
4
Potential Size and Structure
2021 Series A Bonds (Refunding): Par Amount: ~$150 million Savings: ~$20 million Tax Status: Taxable Lien: Senior Tender Option: Yes
2021 Series B Bonds (New Money): Par Amount: ~$85 million Project Fund: ~$113 million Lien: Subordinate Tax Status: Tax-Exempt
Preliminary, Subject to Change
7
Next Steps
January 22: Board of Directors – review of draft bond documents
Week of February 1: Receive ratings from rating agencies
February 5: Transportation Committee – review final bond documents
February 12: Board of Directors – final review of bond documents
Week of February 15: Post Preliminary Official Statement and marketing of bonds
Week of March 8: Anticipated pricing date
Week of March 22: Anticipated closing date
8
7
8
1
Proposed 2021 Note Issuance: RefundingOverview of Proposed Transaction
Transportation Committee Item 9B | January 15, 2021
2021 Note Financing Team
San Diego Association of Governments Hasan Ikhrata, Executive Director Andre Douzdjian, Chief Financial Officer Jose Nuncio, TransNet Department Director John Kirk, General Counsel Ray Major, Chief Economist Dawn Vettese, Strategic Capital Funding & ITOC Manager
Financial Advisors, Public Financial Management Peter Shellenberger, Managing Director
Bond Counsel, Orrick, Norton Rose Fulbright US, LLP Victor Hsu, Partner
Disclosure Counsel, Norton Rose Fulbright US, LLP Russ Trice, Partner
Senior Underwriter, Citibank Ron Marino, Managing Director
2
1
2
2
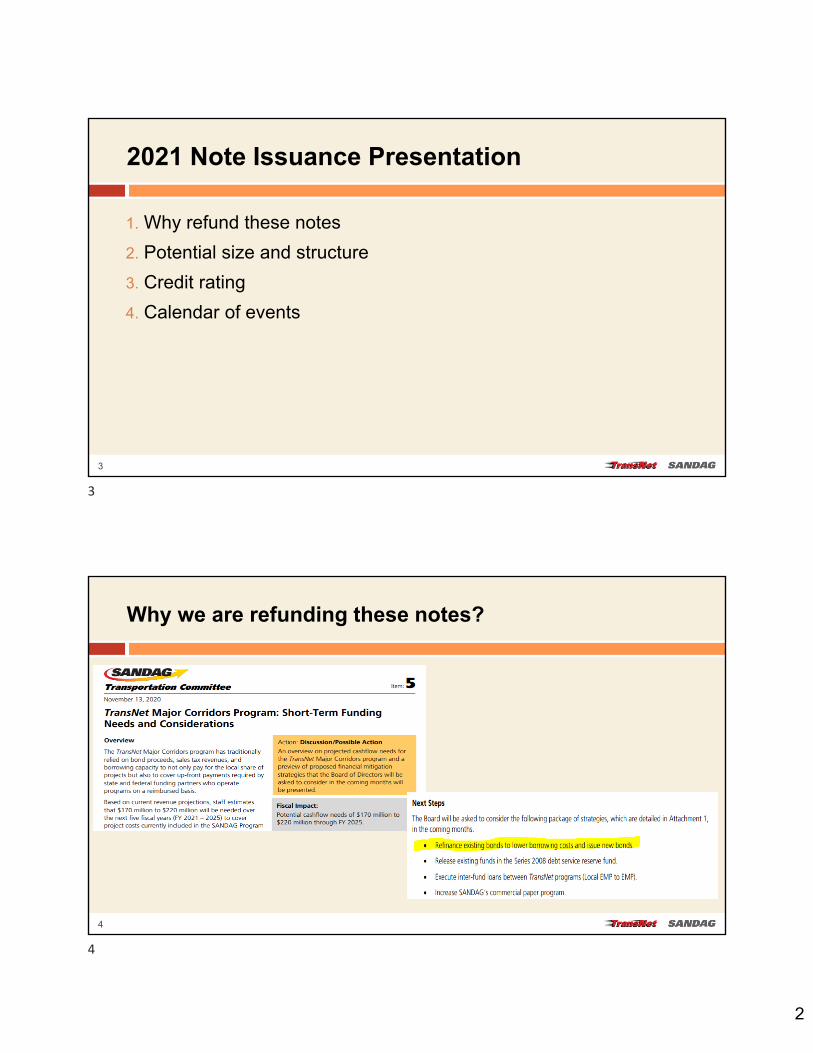
2021 Note Issuance Presentation
1. Why refund these notes
2. Potential size and structure
3. Credit rating
4. Calendar of events
3
Why we are refunding these notes?
4
3
4
3
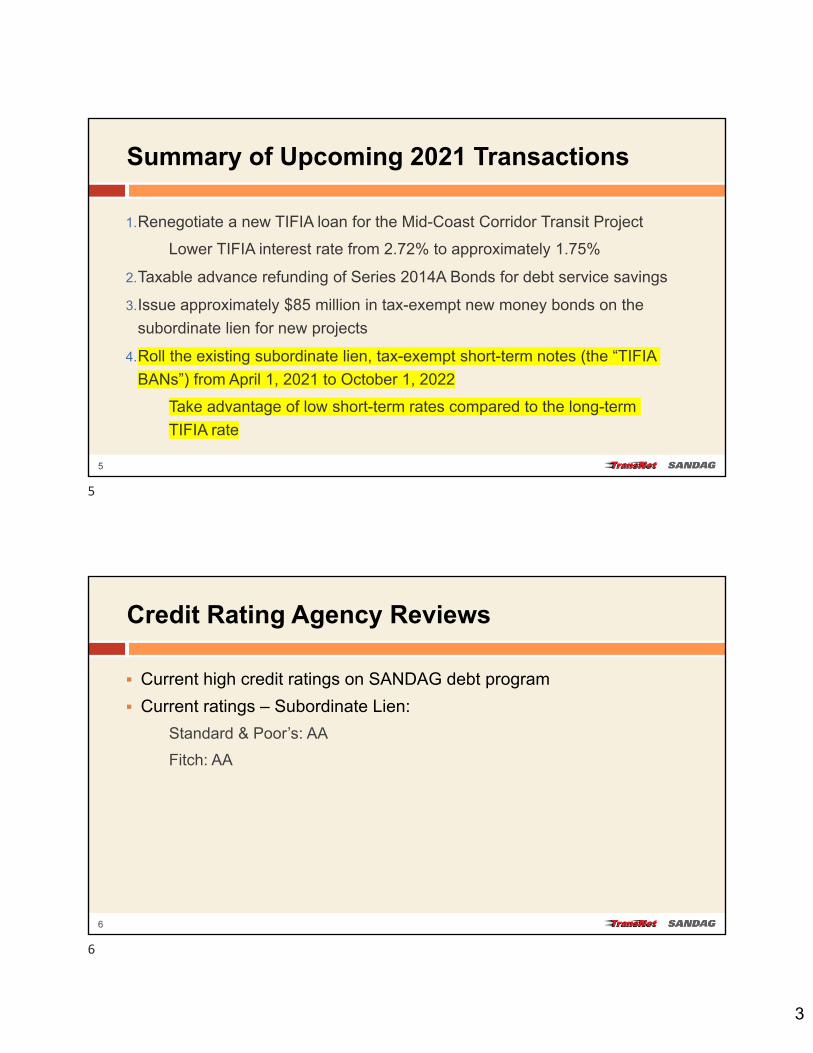
Summary of Upcoming 2021 Transactions
1.Renegotiate a new TIFIA loan for the Mid-Coast Corridor Transit Project
� Lower TIFIA interest rate from 2.72% to approximately 1.75%
2.Taxable advance refunding of Series 2014A Bonds for debt service savings
3.Issue approximately $85 million in tax-exempt new money bonds on the
subordinate lien for new projects
4.Roll the existing subordinate lien, tax-exempt short-term notes (the “TIFIA
BANs”) from April 1, 2021 to October 1, 2022
� Take advantage of low short-term rates compared to the long-term
TIFIA rate
5
Credit Rating Agency Reviews
Current high credit ratings on SANDAG debt program
Current ratings – Subordinate Lien:
� Standard & Poor’s: AA
� Fitch: AA
6
5
6
4
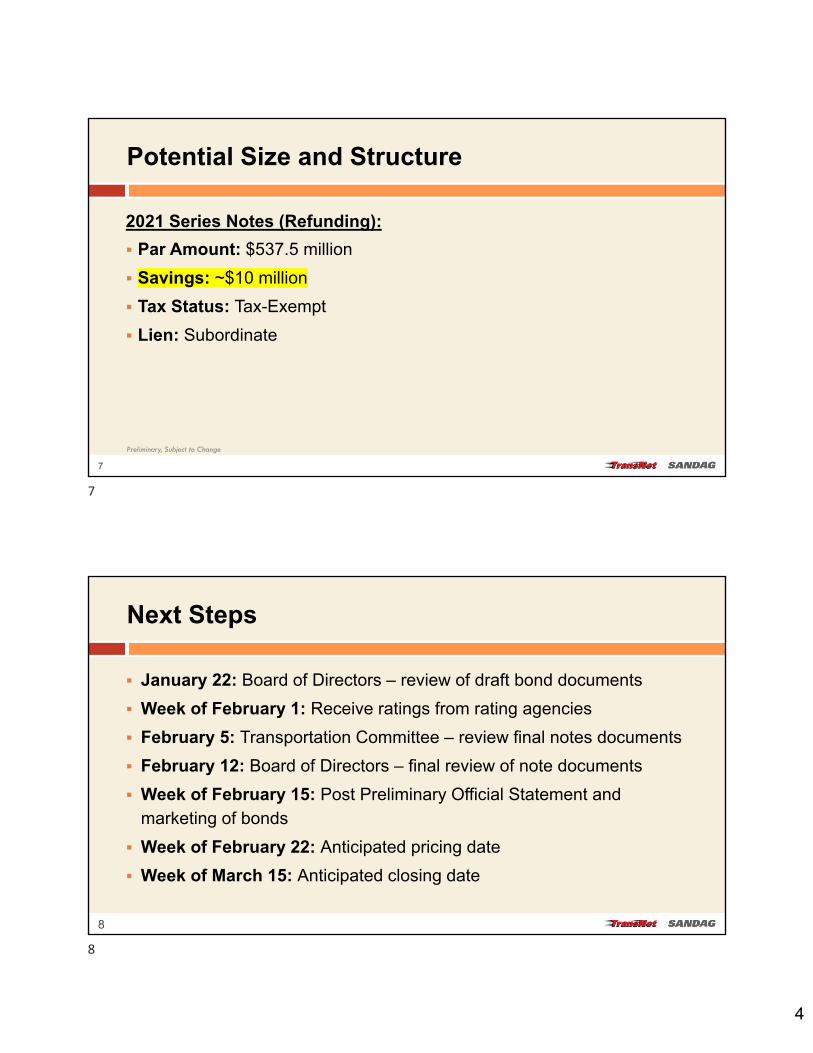
Potential Size and Structure
2021 Series Notes (Refunding):
Par Amount: $537.5 million
Savings: ~$10 million
Tax Status: Tax-Exempt
Lien: Subordinate
Preliminary, Subject to Change
7
Next Steps
January 22: Board of Directors – review of draft bond documents
Week of February 1: Receive ratings from rating agencies
February 5: Transportation Committee – review final notes documents
February 12: Board of Directors – final review of note documents
Week of February 15: Post Preliminary Official Statement and marketing of bonds
Week of February 22: Anticipated pricing date
Week of March 15: Anticipated closing date
8
7
8
1
Comprehensive Multimodal Corridor Plan UpdateTransportation Committee | Item 10January 15, 2021
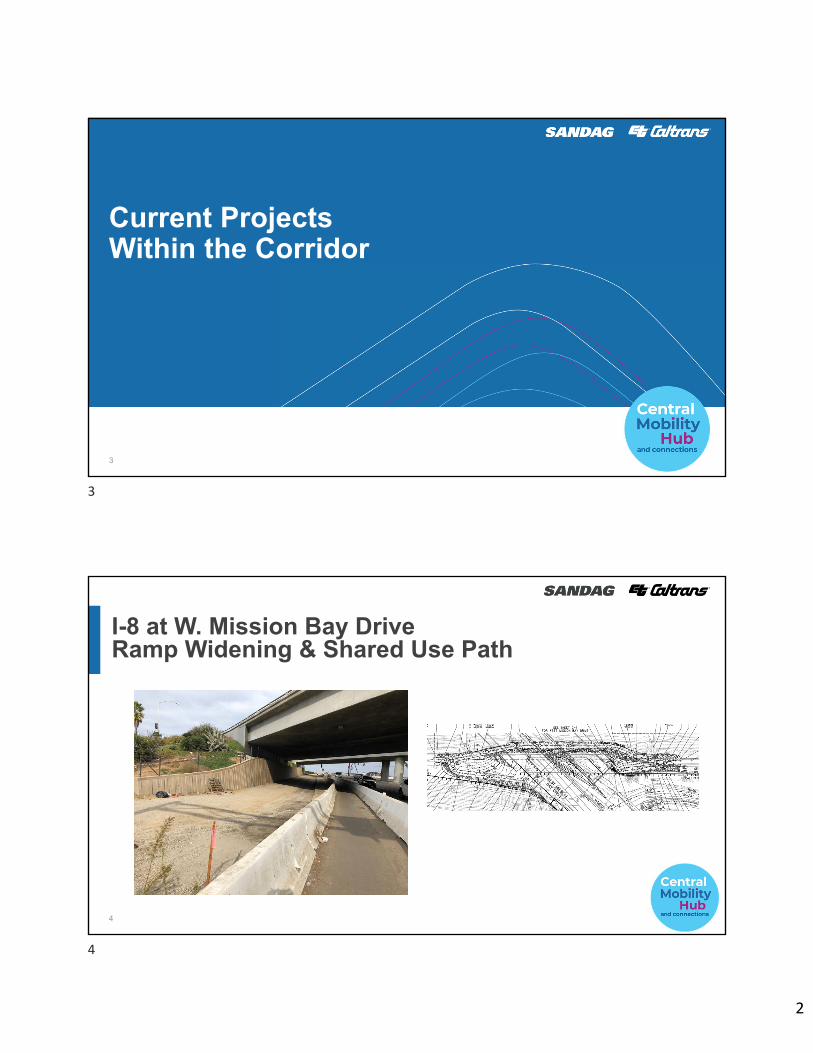
Phase I – Comprehensive Multimodal Corridor Plans
2
1
2
2
Current Projects Within the Corridor
3
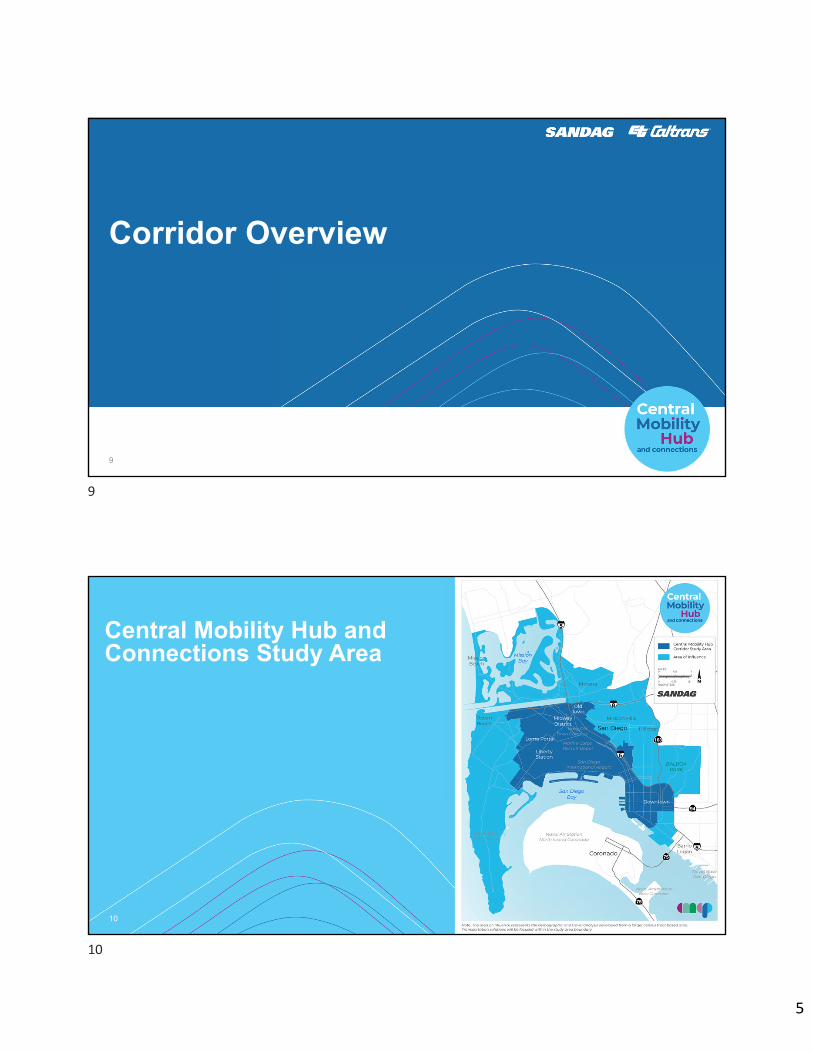
I-8 at W. Mission Bay DriveRamp Widening & Shared Use Path
4
3
4
3
TCIF Funded Projects
5
• Reduced Truck Impact to Community
• Improve Crosswalks and Intersections
• Curve Improvements
• Improved Access to 10th
Ave. Marine Terminal
Current Projects
6
• Vesta Street/Harbor/Main/SR-15• Provide connection between dry and wet side
of Naval Base San Diego
• Operational Improvements
• Pavement Rehabilitation
• Intelligent Transportation System (ITS) technologies - Harbor Drive 2.0
5
6

4
Maintenance and Operational Improvement Projects
• Bridge Rehabilitation• Striping Improvements (Mainline and
Ramps)• Rubberized Hot-Mix Asphalt Overlays
(Ramps)• Sign Panel Replacements• Drainage System Restoration• Worker Safety Improvements• Intelligent Transportation System (ITS)
Element Maintenance• ITS Element Upgrades
7
Additional Projects and Studies
8
• Fiberoptic/Border Wait Time Project
• Airport Feasibility Study
• Central Mobility Hub (CMH) Access Alternatives
• Project Study Report-Project Development Support for CMH Corridor
7
8
5
Corridor Overview
9
Central Mobility Hub and Connections Study Area
10
9
10
6
Stakeholders
11
12
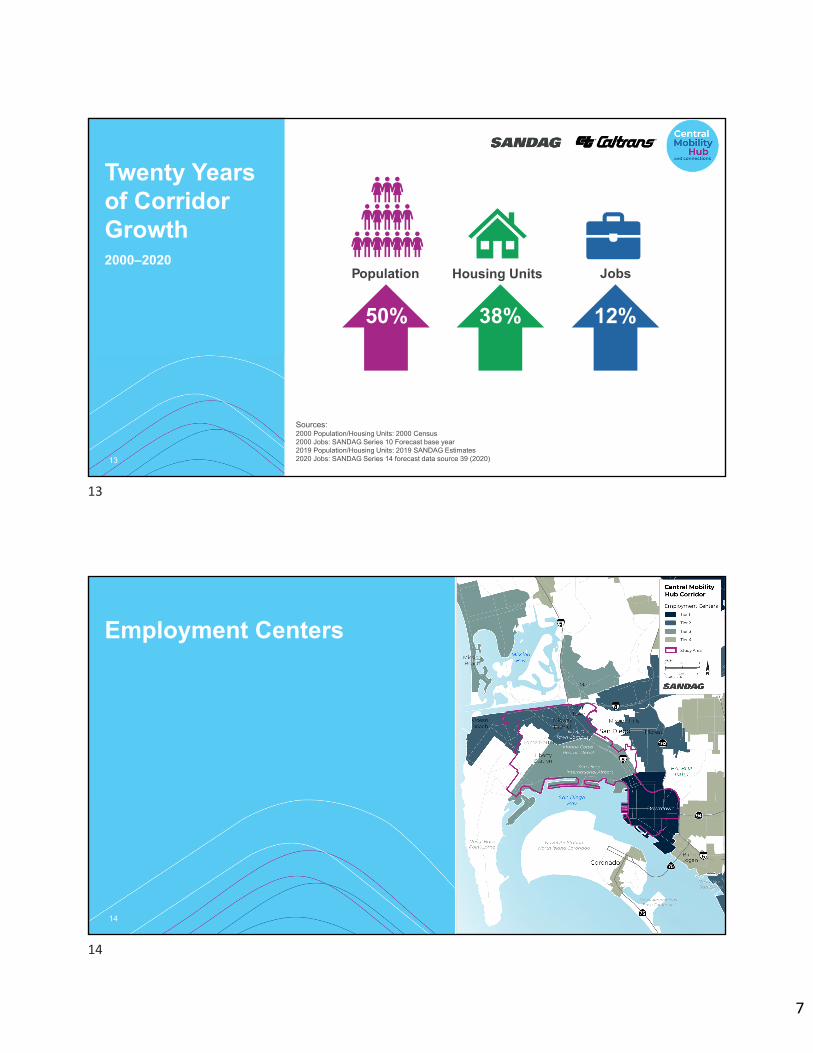
By the Numbers (Corridor as % of Region)
SANDAG 2019 estimatesJobs Source: Series 14 forecast data source 39 (2020)
Population
6%Housing
units
7%
Senior population
6%
Low-income households
7%
BIPOC1
population
4%
Corridor totals combine “Study Area” and “Area of Influence” shown on map
Jobs
12%
1BIPOC: Black, Indigenous, People of Color
11
12
7
13
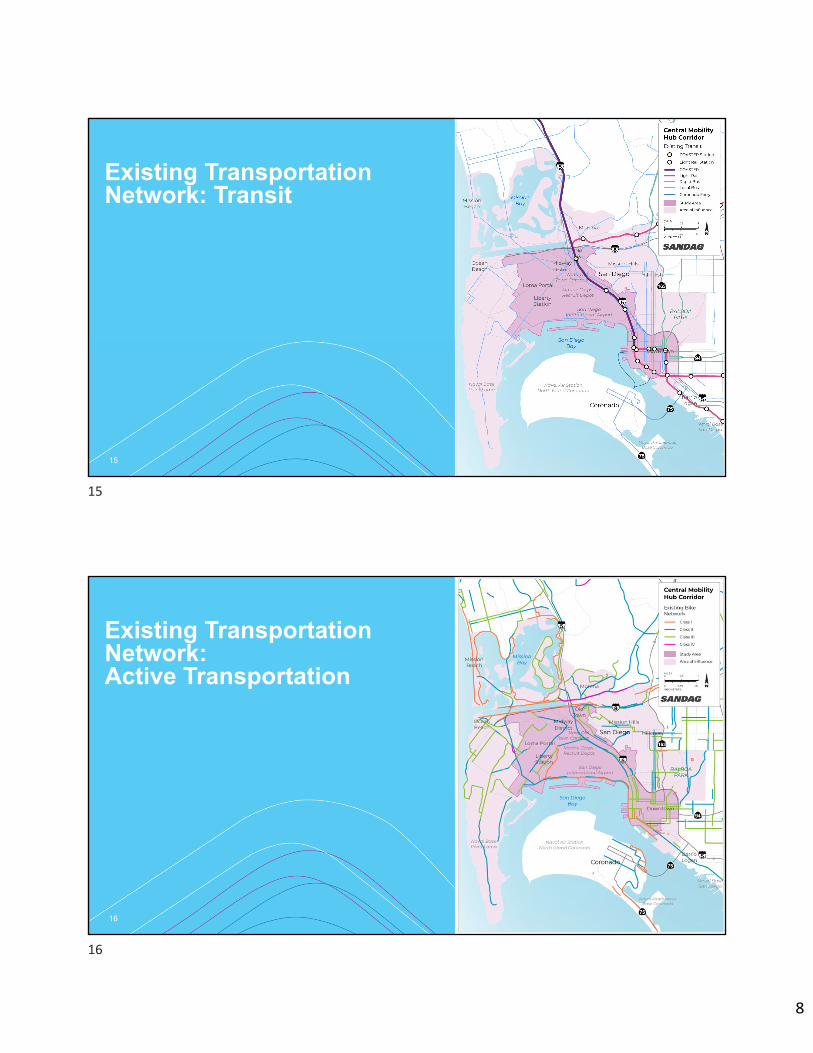
Twenty Years of Corridor Growth2000–2020
Sources: 2000 Population/Housing Units: 2000 Census2000 Jobs: SANDAG Series 10 Forecast base year2019 Population/Housing Units: 2019 SANDAG Estimates2020 Jobs: SANDAG Series 14 forecast data source 39 (2020)
50%
Population Housing Units Jobs
38% 12%
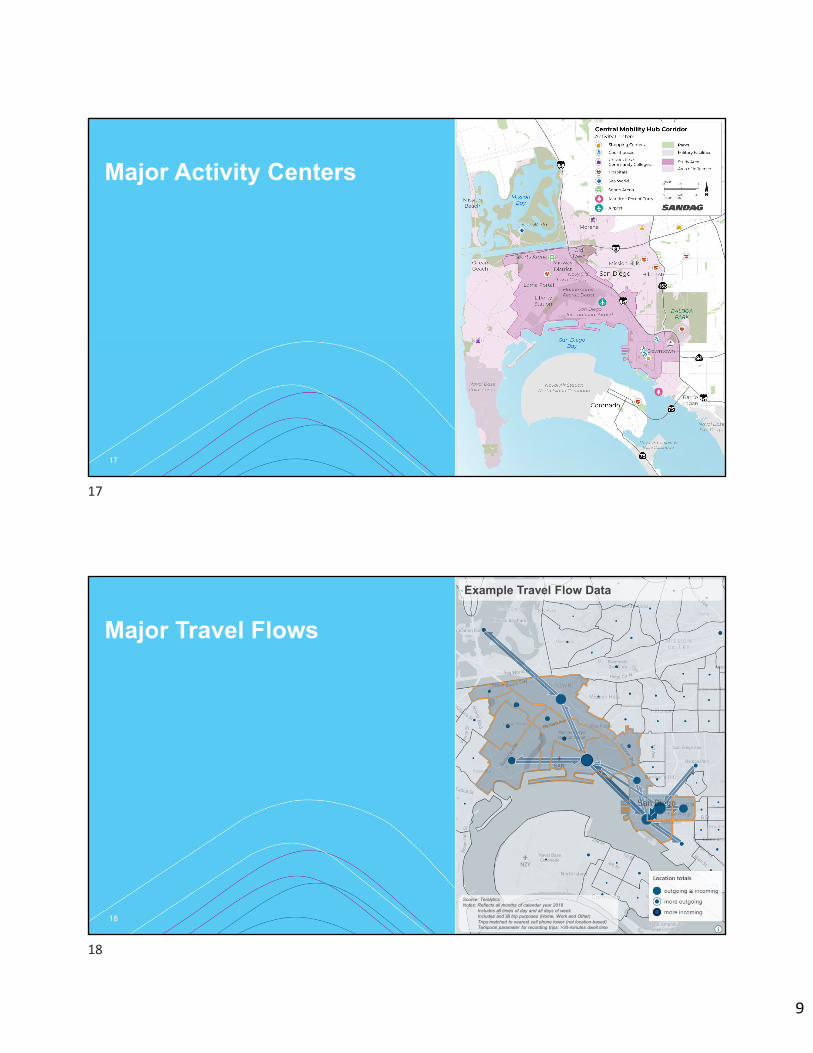
Employment Centers
14
13
14
8
Existing Transportation Network: Transit
15
Existing Transportation Network:Active Transportation
16
15
16
9
Major Activity Centers
17
Major Travel Flows
18
Example Travel Flow Data
Source: TeralyticsNotes: Reflects all months of calendar year 2018
Includes all times of day and all days of weekIncludes and all trip purposes (Home, Work and Other)Trips matched to nearest cell phone tower (not location-based)Temporal parameter for recording trips: >30-minutes dwell time
17
18
10
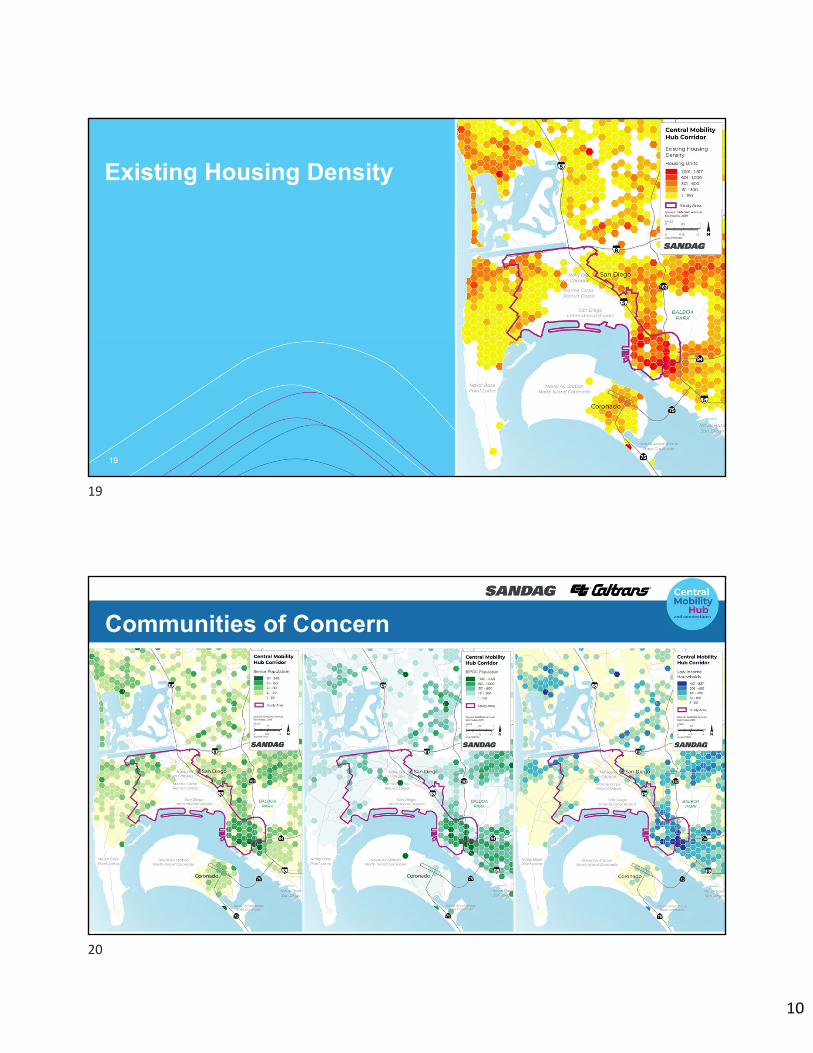
Existing Housing Density
19
20
Communities of Concern
BIPOC Population
19
20
11
21
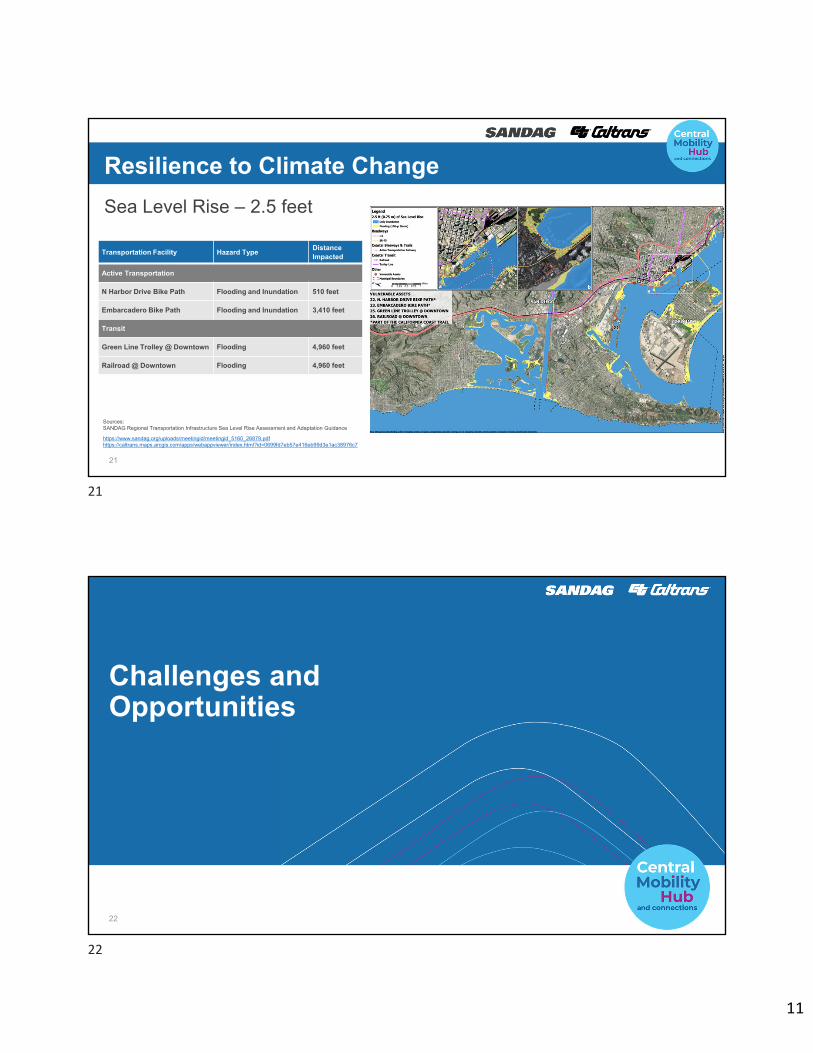
Resilience to Climate Change
Sea Level Rise – 2.5 feet
Sources:SANDAG Regional Transportation Infrastructure Sea Level Rise Assessment and Adaptation Guidance
https://www.sandag.org/uploads/meetingid/meetingid_5160_26879.pdfhttps://caltrans.maps.arcgis.com/apps/webappviewer/index.html?id=0699fd7eb57e416eb99d3e1ac38976c7
Transportation Facility Hazard TypeDistance Impacted
Active Transportation
N Harbor Drive Bike Path Flooding and Inundation 510 feet
Embarcadero Bike Path Flooding and Inundation 3,410 feet
Transit
Green Line Trolley @ Downtown Flooding 4,960 feet
Railroad @ Downtown Flooding 4,960 feet
Challenges and Opportunities
22
21
22
12
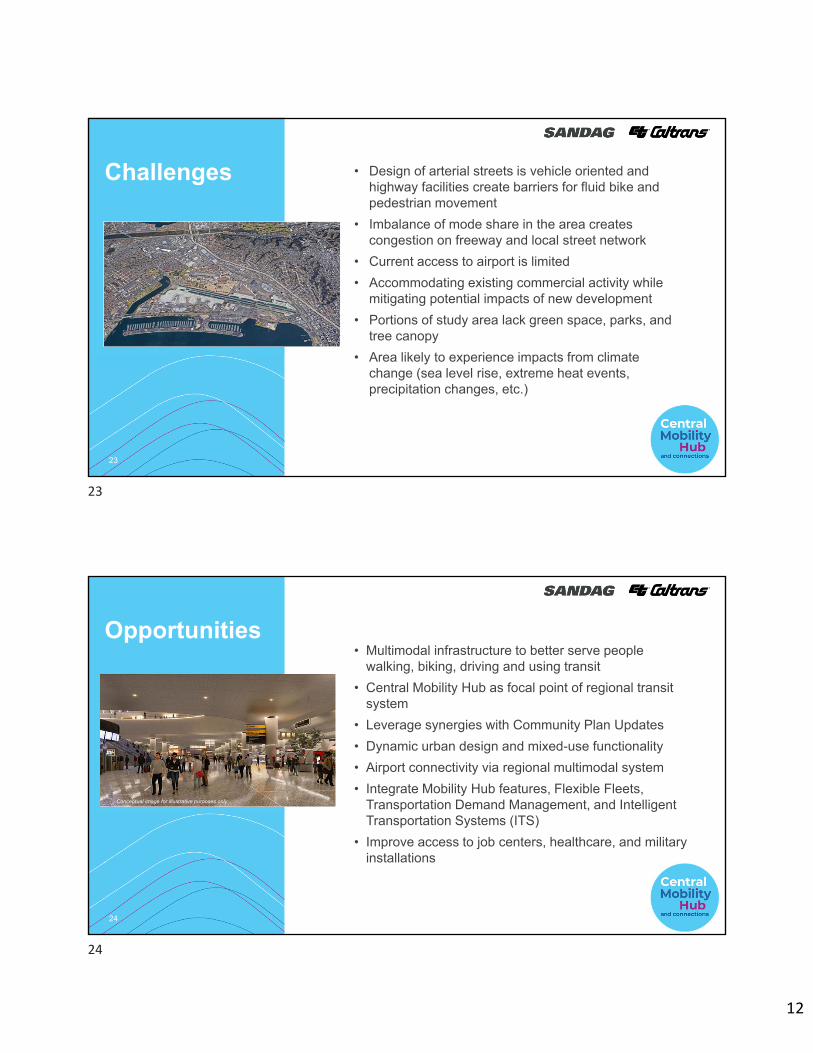
Challenges • Design of arterial streets is vehicle oriented and highway facilities create barriers for fluid bike and pedestrian movement
• Imbalance of mode share in the area creates congestion on freeway and local street network
• Current access to airport is limited
• Accommodating existing commercial activity while mitigating potential impacts of new development
• Portions of study area lack green space, parks, and tree canopy
• Area likely to experience impacts from climate change (sea level rise, extreme heat events, precipitation changes, etc.)
23
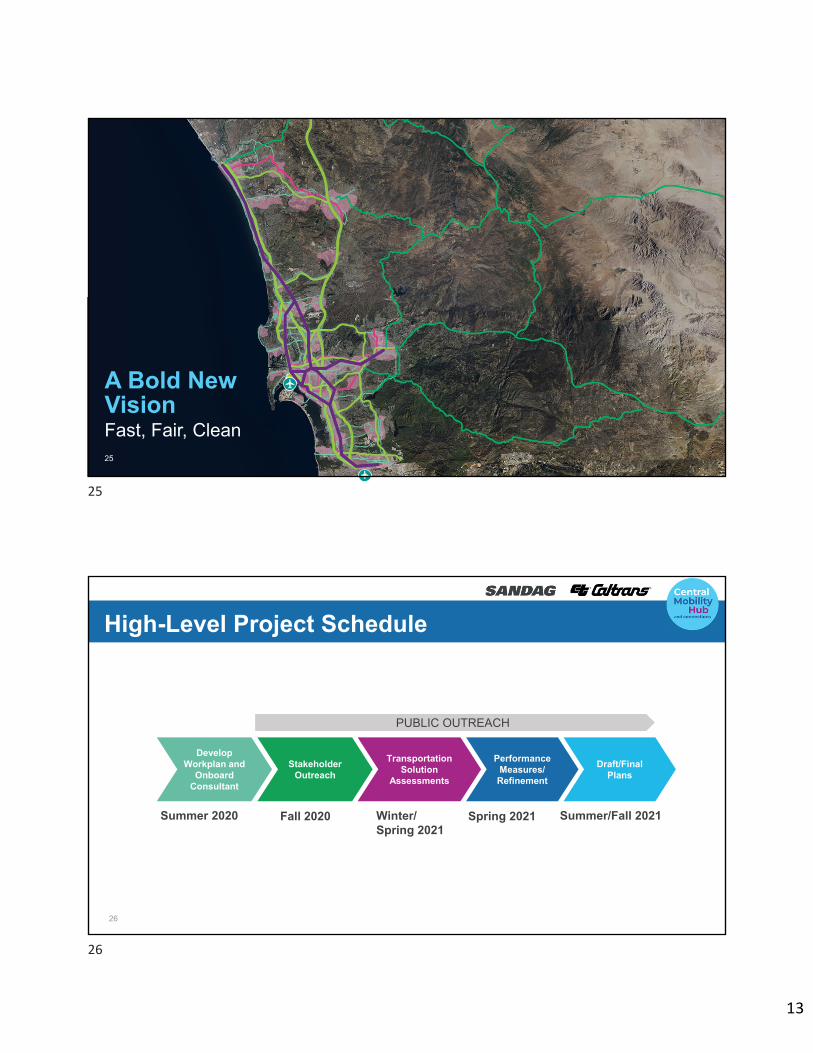
Opportunities• Multimodal infrastructure to better serve people
walking, biking, driving and using transit
• Central Mobility Hub as focal point of regional transit system
• Leverage synergies with Community Plan Updates
• Dynamic urban design and mixed-use functionality
• Airport connectivity via regional multimodal system
• Integrate Mobility Hub features, Flexible Fleets, Transportation Demand Management, and Intelligent Transportation Systems (ITS)
• Improve access to job centers, healthcare, and military installations
24
Conceptual image for illustrative purposes only
23
24
13
| 25
A Bold New VisionFast, Fair, Clean25
High-Level Project Schedule
26
PUBLIC OUTREACH
Fall 2020 Winter/Spring 2021
Spring 2021 Summer/Fall 2021Summer 2020
Stakeholder Outreach
Transportation Solution
Assessments
Performance Measures/Refinement
Draft/Final Plans
Develop Workplan and
Onboard Consultant
25
26
14
sandag.org/CMCP
SANDAGregion | CaltransDistrict11
SANDAGregion | SDCaltrans
SANDAGregion | CaltransVideo
SANDAG | SDCaltrans
SANDAG and Caltrans are committed to keeping communities informed
CMCP Project Hotline (888) 317-8976
27
Rachel Kennedy, SANDAG, Corridor Planning [email protected]
Nicola Bernard, Caltrans, Project Manager Trade [email protected]
Comprehensive Multimodal Corridor Plan UpdateTransportation Committee | Item 10January 15, 2021
27
28
1
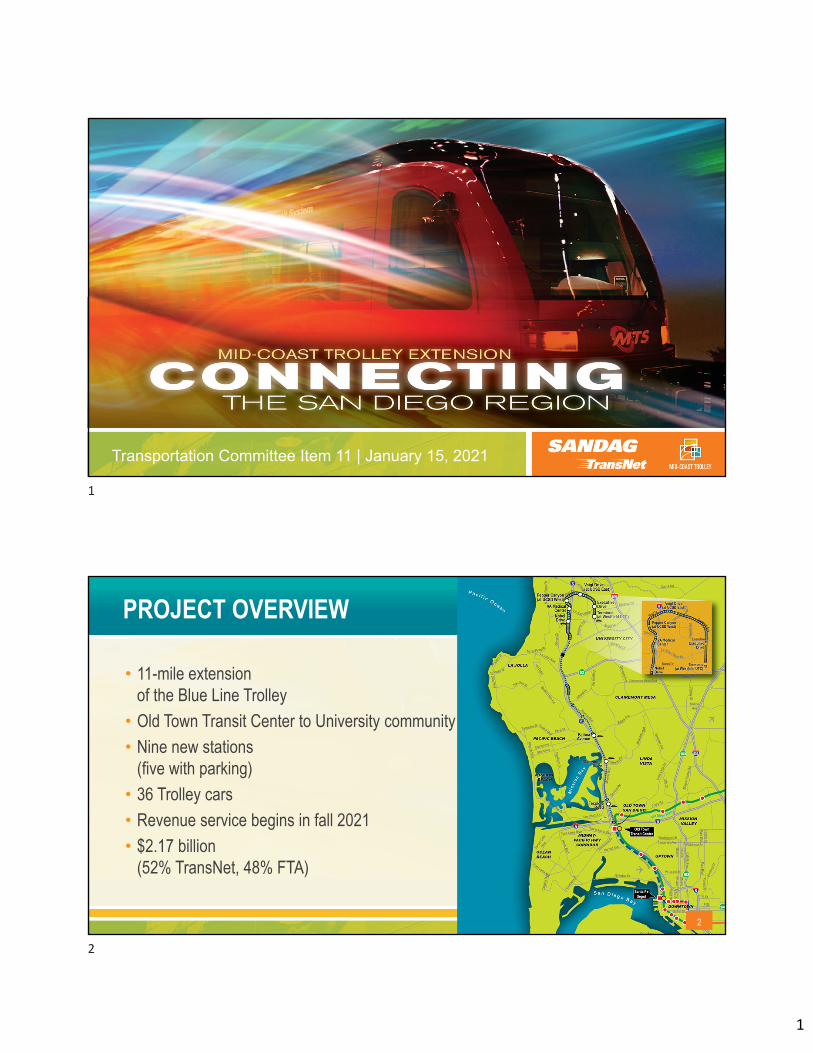
Transportation Committee Item 11 | January 15, 2021
PROJECT OVERVIEW
• 11-mile extension of the Blue Line Trolley
• Old Town Transit Center to University community
• Nine new stations (five with parking)
• 36 Trolley cars
• Revenue service begins in fall 2021
• $2.17 billion (52% TransNet, 48% FTA)
2
1
2
2
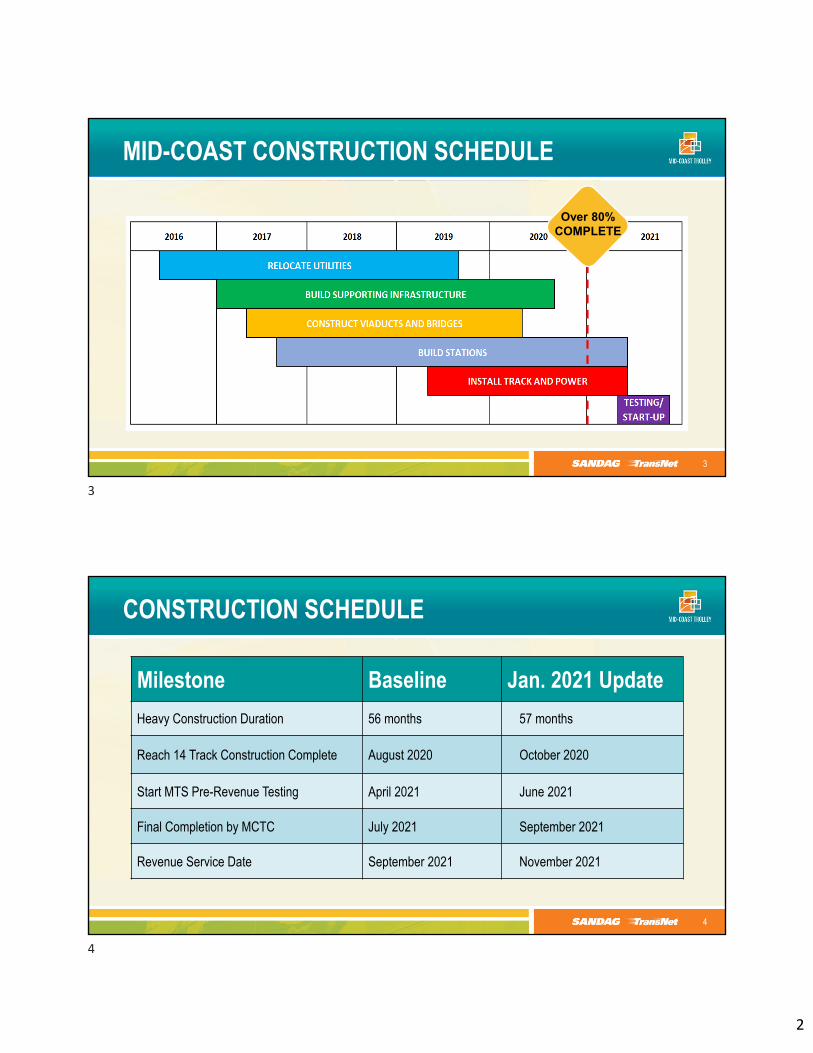
Over 80% COMPLETE
MID-COAST CONSTRUCTION SCHEDULE
3
Milestone Baseline Jan. 2021 Update
Heavy Construction Duration 56 months 57 months
Reach 14 Track Construction Complete August 2020 October 2020
Start MTS Pre-Revenue Testing April 2021 June 2021
Final Completion by MCTC July 2021 September 2021
Revenue Service Date September 2021 November 2021
CONSTRUCTION SCHEDULE
4
3
4
3
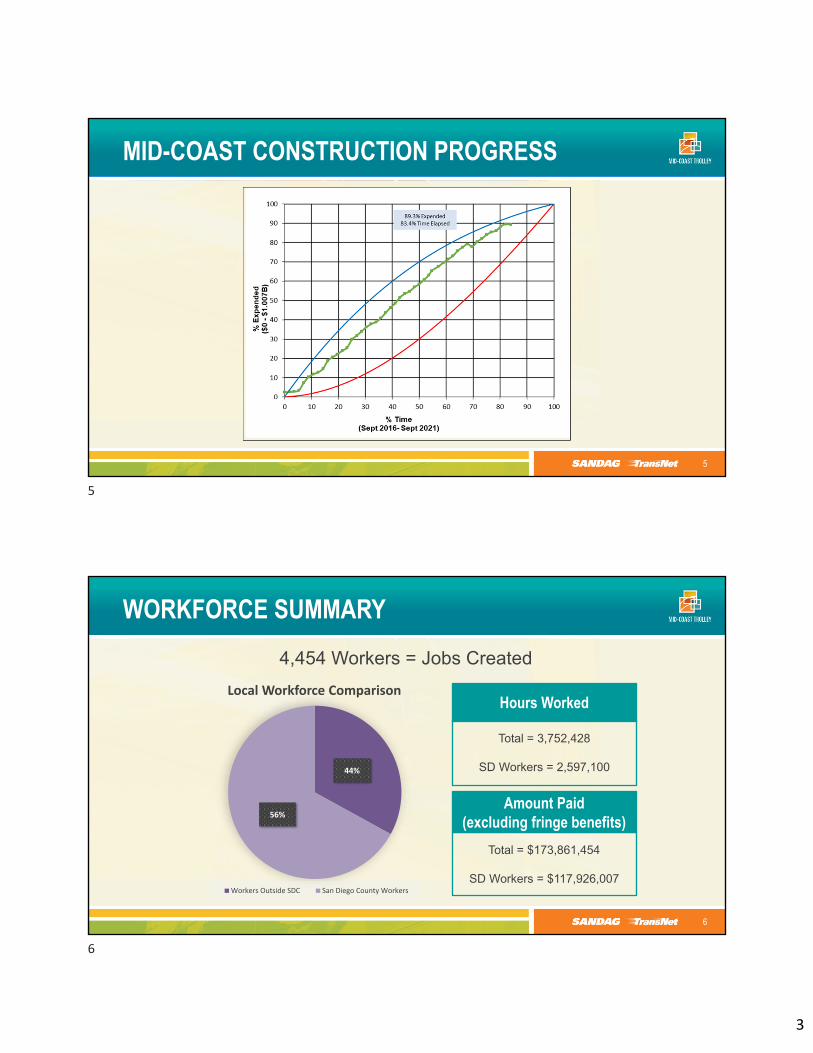
MID-COAST CONSTRUCTION PROGRESS
5
Hours Worked
Total = 3,752,428
SD Workers = 2,597,100
Amount Paid (excluding fringe benefits)
Total = $173,861,454
SD Workers = $117,926,007
4,454 Workers = Jobs Created
44%
56%
Local Workforce Comparison
Workers Outside SDC San Diego County Workers
WORKFORCE SUMMARY
6
5
6
4
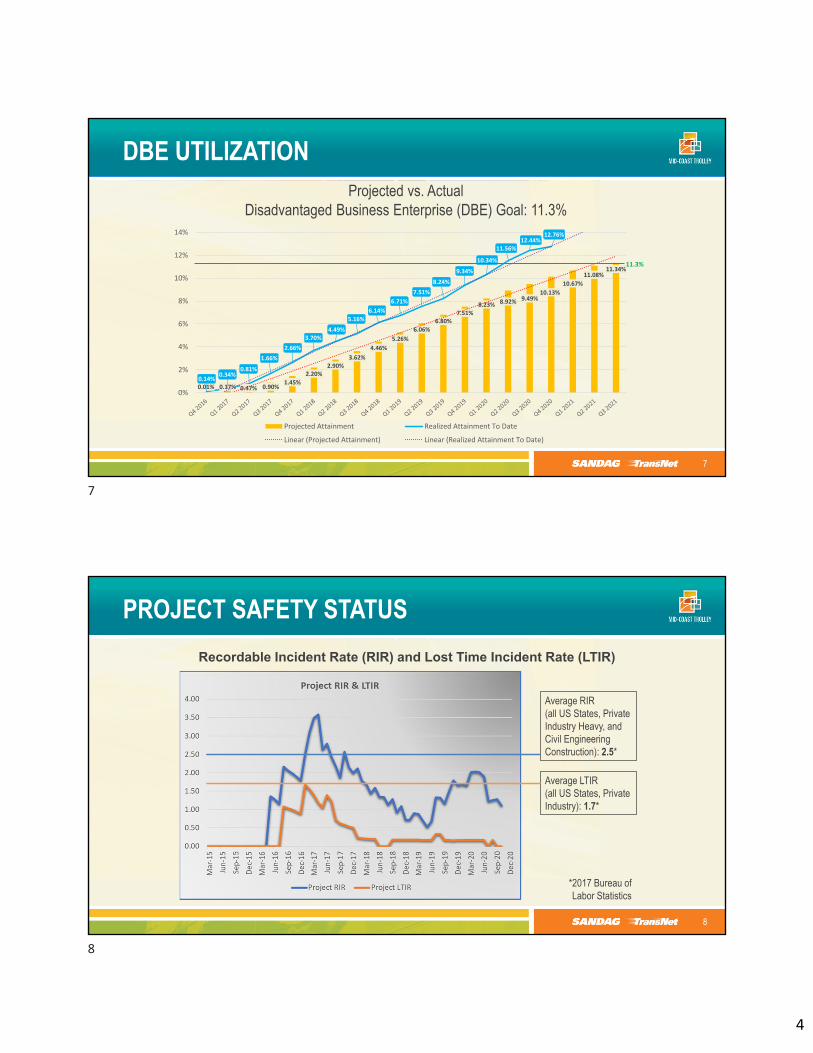
Projected vs. ActualDisadvantaged Business Enterprise (DBE) Goal: 11.3%
DBE UTILIZATION
7
0.01% 0.17% 0.47% 0.90%1.45%
2.20%2.90%
3.62%
4.46%
5.26%
6.06%
6.80%7.51%
8.23% 8.92% 9.49%10.13%
10.67%
11.08%11.34%
0.14%0.34%
0.81%
1.66%
2.66%
3.70%4.49%
5.16%
6.14%
6.71%
7.51%
8.24%
9.34%
10.34%
11.56%12.44%
12.76%
0%
2%
4%
6%
8%
10%
12%
14%
Projected Attainment Realized Attainment To Date
Linear (Projected Attainment) Linear (Realized Attainment To Date)
11.3%
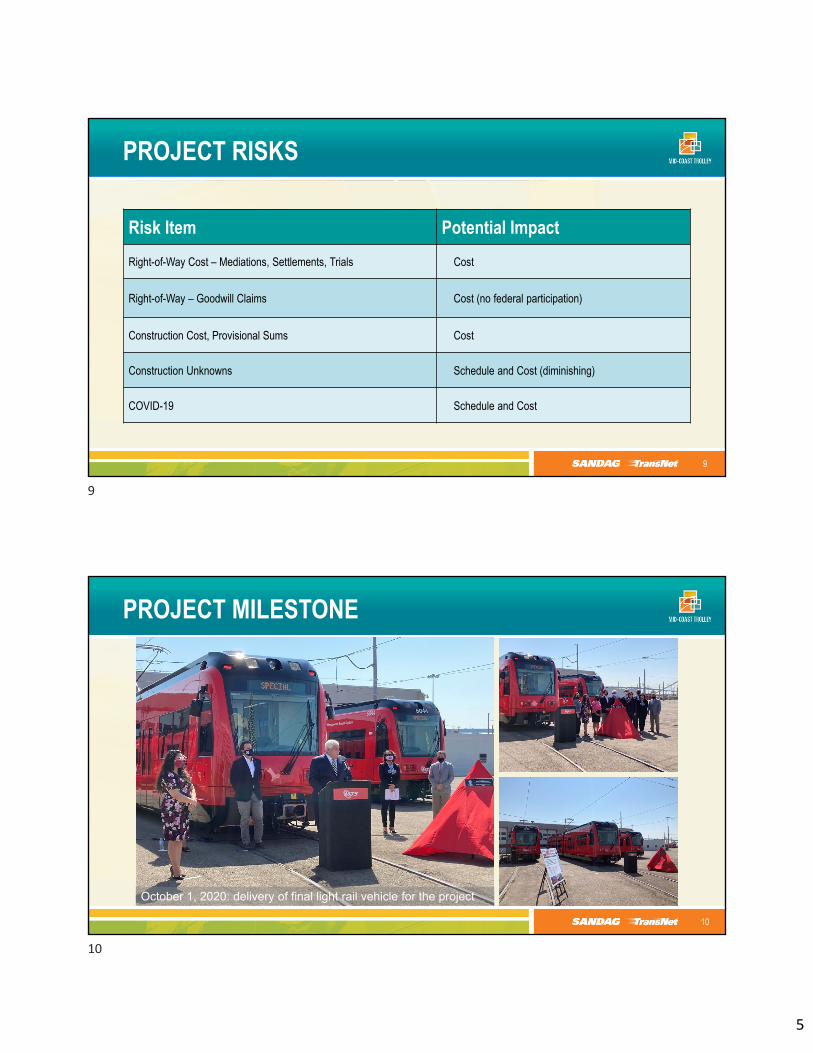
PROJECT SAFETY STATUS
8
Recordable Incident Rate (RIR) and Lost Time Incident Rate (LTIR)
Average RIR (all US States, Private Industry Heavy, and Civil Engineering Construction): 2.5*
*2017 Bureau of Labor Statistics
Average LTIR (all US States, Private Industry): 1.7*
7
8
5
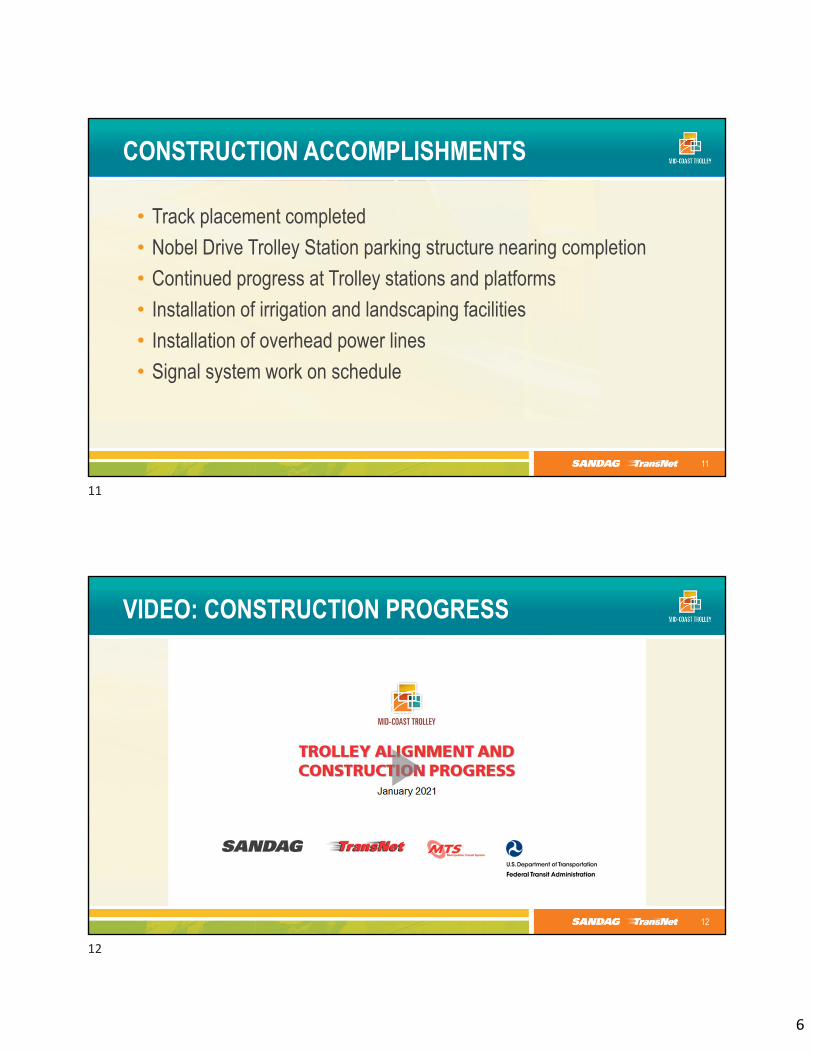
Risk Item Potential Impact
Right-of-Way Cost – Mediations, Settlements, Trials Cost
Right-of-Way – Goodwill Claims Cost (no federal participation)
Construction Cost, Provisional Sums Cost
Construction Unknowns Schedule and Cost (diminishing)
COVID-19 Schedule and Cost
PROJECT RISKS
9
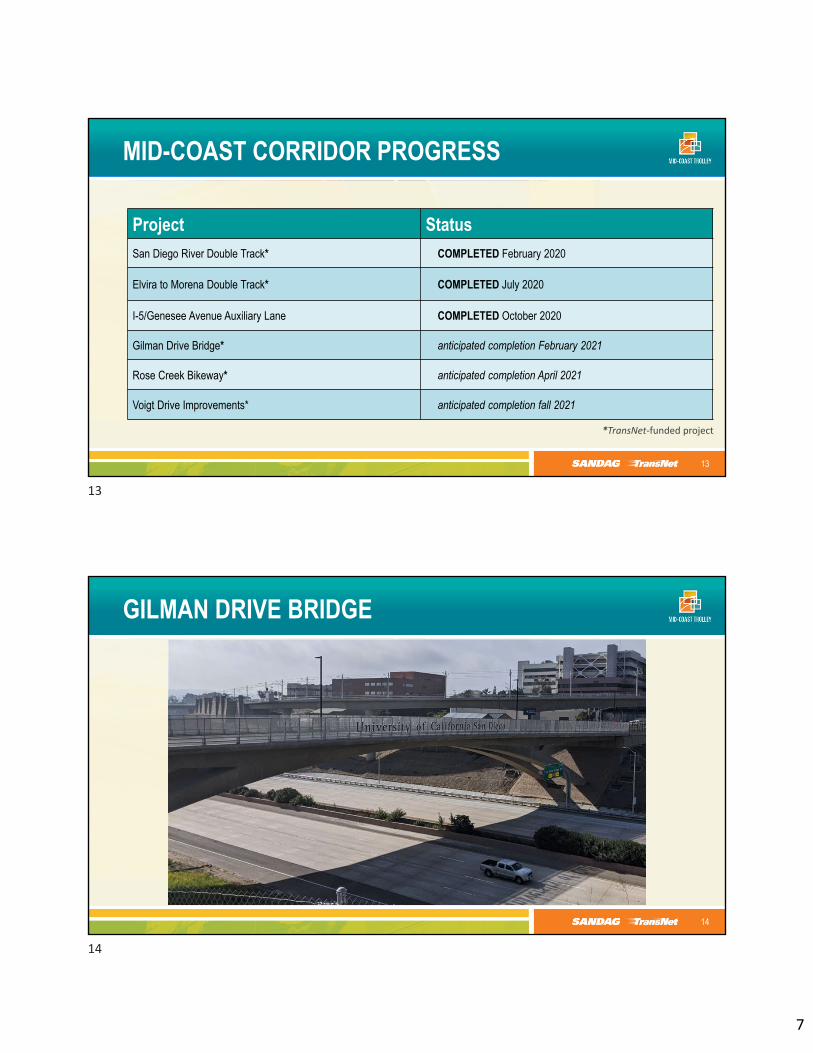
PROJECT MILESTONE
10
October 1, 2020: delivery of final light rail vehicle for the project
9
10
6
CONSTRUCTION ACCOMPLISHMENTS
• Track placement completed
• Nobel Drive Trolley Station parking structure nearing completion
• Continued progress at Trolley stations and platforms
• Installation of irrigation and landscaping facilities
• Installation of overhead power lines
• Signal system work on schedule
11
VIDEO: CONSTRUCTION PROGRESS
12
11
12
7
MID-COAST CORRIDOR PROGRESS
13
Project Status
San Diego River Double Track* COMPLETED February 2020
Elvira to Morena Double Track* COMPLETED July 2020
I-5/Genesee Avenue Auxiliary Lane COMPLETED October 2020
Gilman Drive Bridge* anticipated completion February 2021
Rose Creek Bikeway* anticipated completion April 2021
Voigt Drive Improvements* anticipated completion fall 2021
*TransNet‐funded project
GILMAN DRIVE BRIDGE
14
13
14
8
PUBLIC INVOLVEMENT
• Public outreach activities modified in accordance with government policies enacted to prevent the spread of COVID-19
• Team providing project updates through electronic media
• Ongoing attendance at virtual community planning group meetings
• Ongoing bi-monthly virtual briefings with City Council staff
• Significant construction events covered on multiple news outlets
• Opening day planning is underway
15
Contact Us
16
(877) 379-0110
KeepSanDiegoMoving.com/MidCoast
Mid-Coast Trolley @MidCoastTrolley
15
16
9
Transportation Committee | January 15, 2021
17
Questions?
17
1
Cross Border Travel Behavior Survey
Transportation Committee | Item 12January 15, 2021
What Information is Presented?
• Reasons for the Study
• Methodology Overview
• Key Findings
• Closing Thoughts
• Next Steps
2
1
2
2
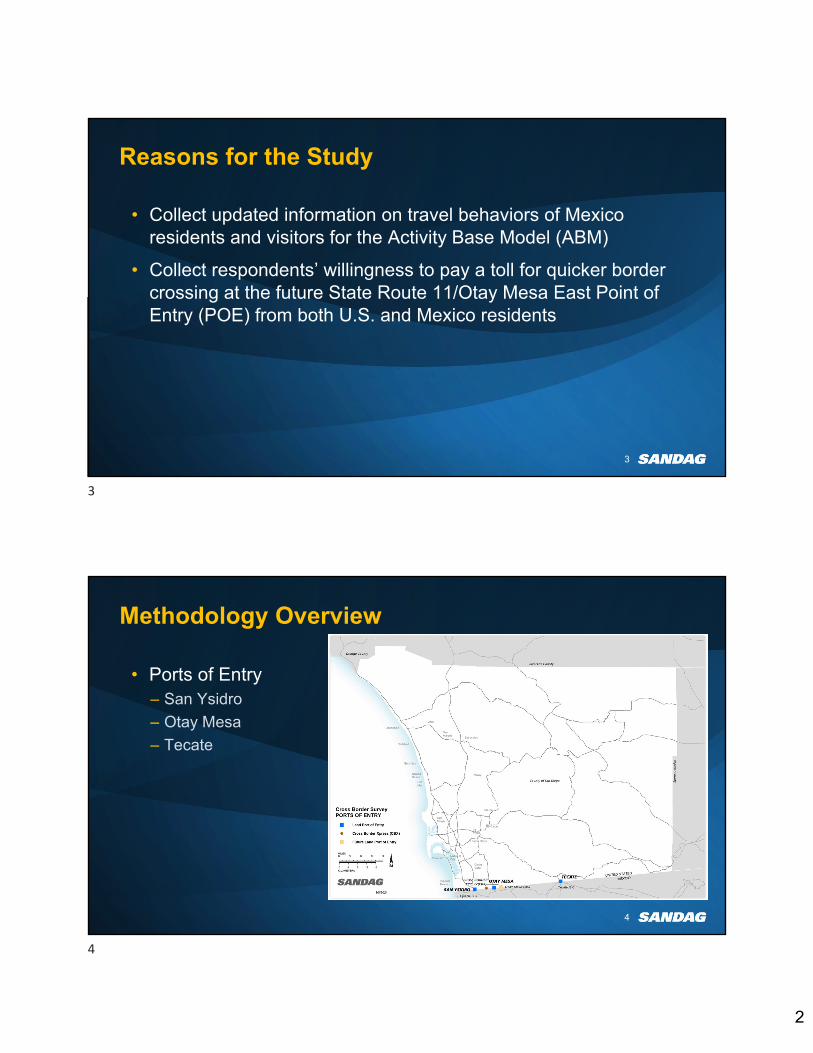
Reasons for the Study
• Collect updated information on travel behaviors of Mexico residents and visitors for the Activity Base Model (ABM)
• Collect respondents’ willingness to pay a toll for quicker border crossing at the future State Route 11/Otay Mesa East Point of Entry (POE) from both U.S. and Mexico residents
3
• Ports of Entry– San Ysidro
– Otay Mesa
– Tecate
4
Methodology Overview
3
4
3
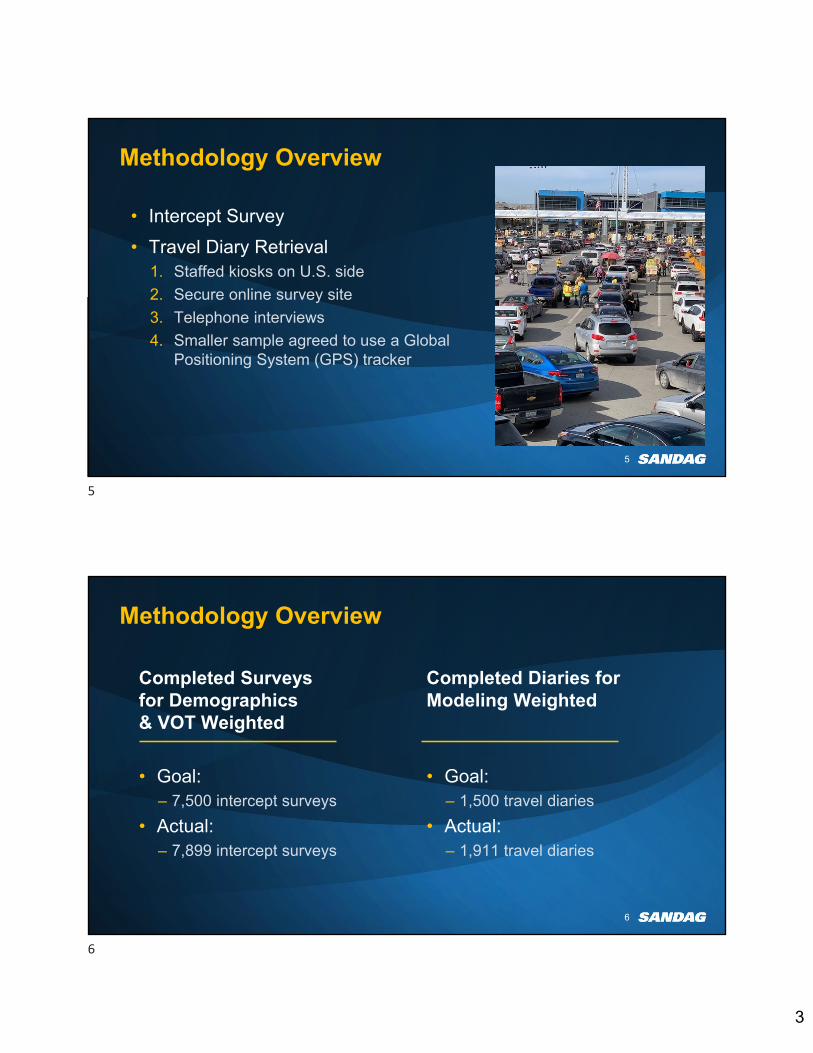
Methodology Overview
• Intercept Survey
• Travel Diary Retrieval1. Staffed kiosks on U.S. side
2. Secure online survey site
3. Telephone interviews
4. Smaller sample agreed to use a Global Positioning System (GPS) tracker
5
Methodology Overview
Completed Surveys for Demographics & VOT Weighted
• Goal:– 7,500 intercept surveys
• Actual:– 7,899 intercept surveys
Completed Diaries for Modeling Weighted
• Goal:– 1,500 travel diaries
• Actual:– 1,911 travel diaries
6
5
6
4
Key Findings
7
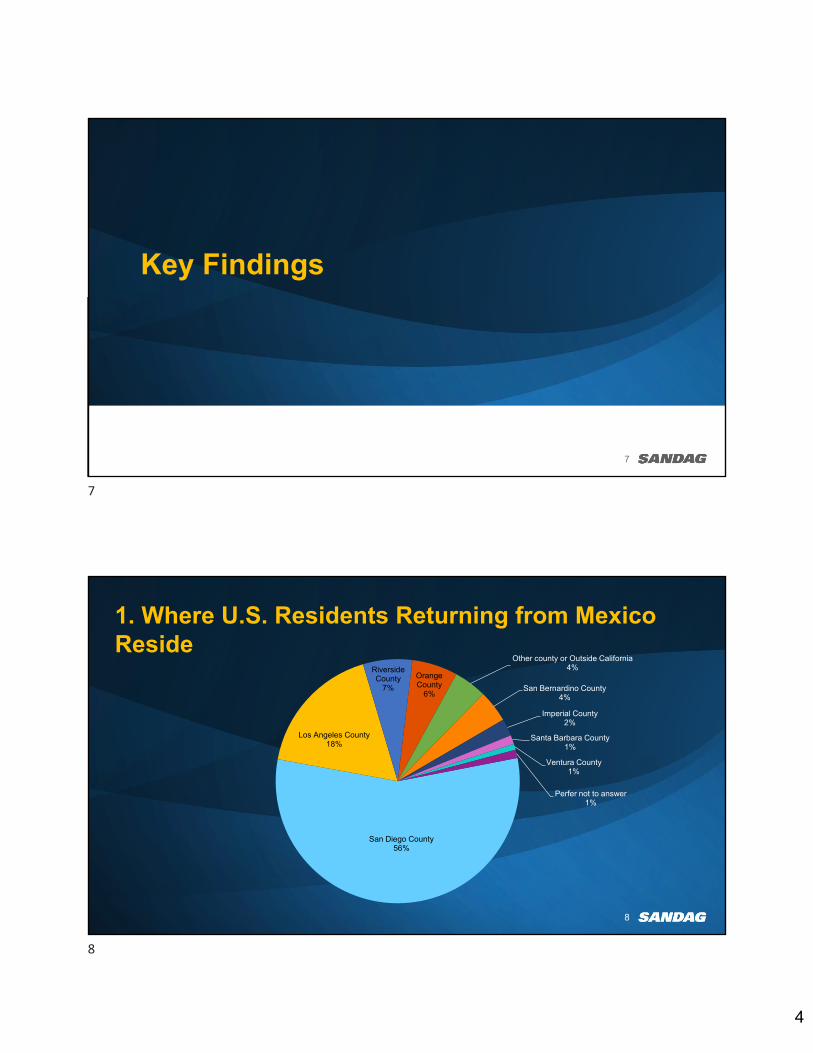
1. Where U.S. Residents Returning from Mexico Reside
San Diego County56%
Los Angeles County18%
Riverside County
7%
Orange County
6%
Other county or Outside California4%
San Bernardino County4%
Imperial County2%
Santa Barbara County1%
Ventura County1%
Perfer not to answer1%
8
7
8
5
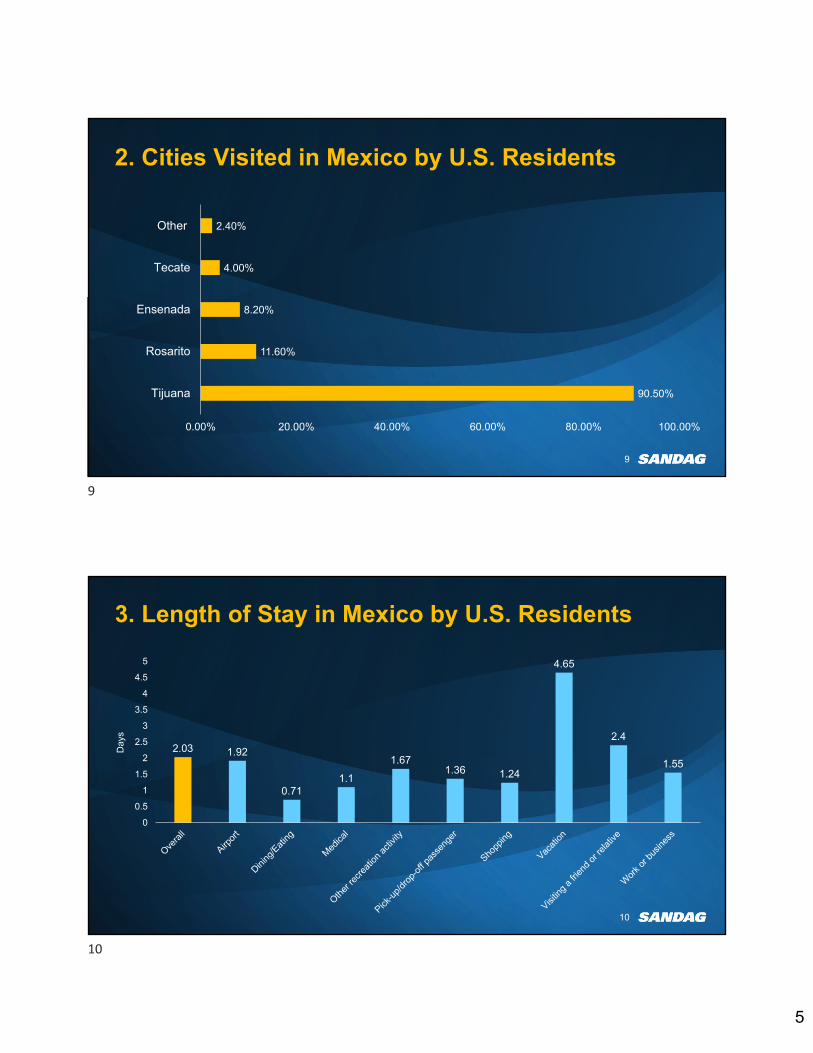
2. Cities Visited in Mexico by U.S. Residents
90.50%
11.60%
8.20%
4.00%
2.40%
0.00% 20.00% 40.00% 60.00% 80.00% 100.00%
Tijuana
Rosarito
Ensenada
Tecate
Other
9
3. Length of Stay in Mexico by U.S. Residents
2.03 1.92
0.711.1
1.671.36 1.24
4.65
2.4
1.55
0
0.5
1
1.5
2
2.5
3
3.5
4
4.5
5
Day
s
10
9
10
6
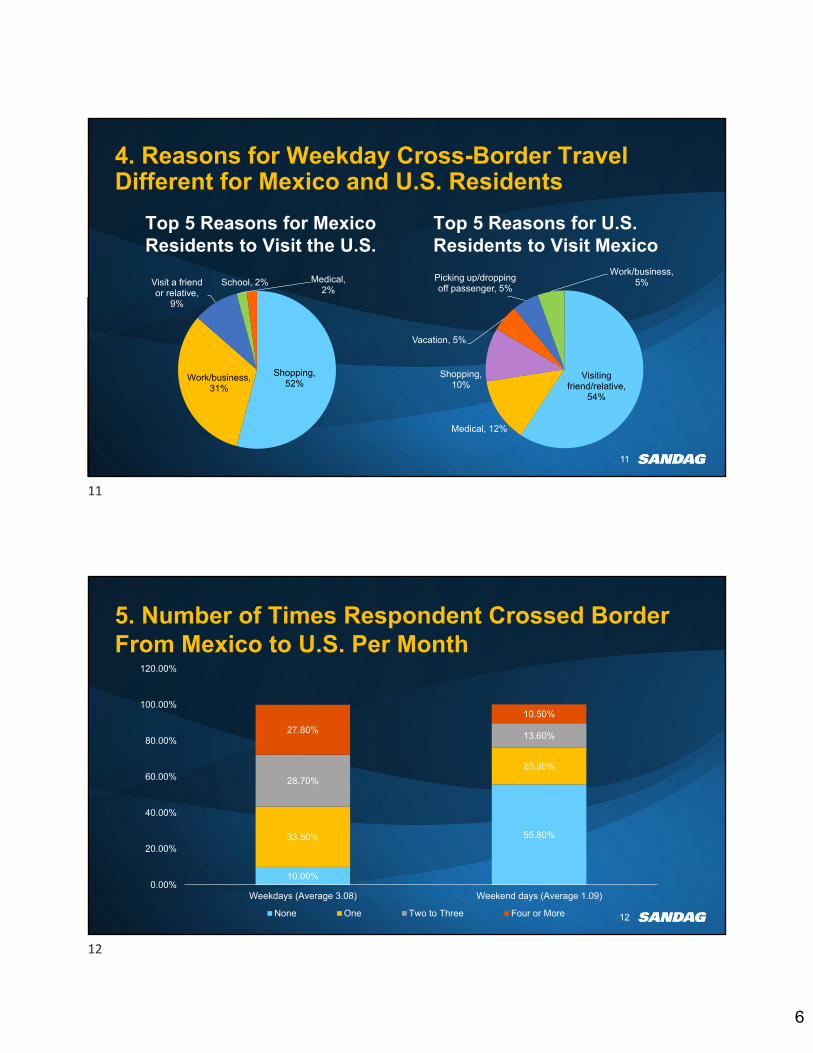
4. Reasons for Weekday Cross-Border Travel Different for Mexico and U.S. Residents
Top 5 Reasons for Mexico Residents to Visit the U.S.
Shopping, 52%
Work/business, 31%
Visit a friend or relative,
9%
Medical, 2%
School, 2%
Top 5 Reasons for U.S. Residents to Visit Mexico
Visiting friend/relative,
54%
Medical, 12%
Shopping, 10%
Vacation, 5%
Picking up/dropping off passenger, 5%
Work/business, 5%
11
5. Number of Times Respondent Crossed Border From Mexico to U.S. Per Month
10.00%
55.80%33.50%
20.30%
28.70%
13.60%27.80%
10.50%
0.00%
20.00%
40.00%
60.00%
80.00%
100.00%
120.00%
Weekdays (Average 3.08) Weekend days (Average 1.09)
None One Two to Three Four or More 12
11
12
7
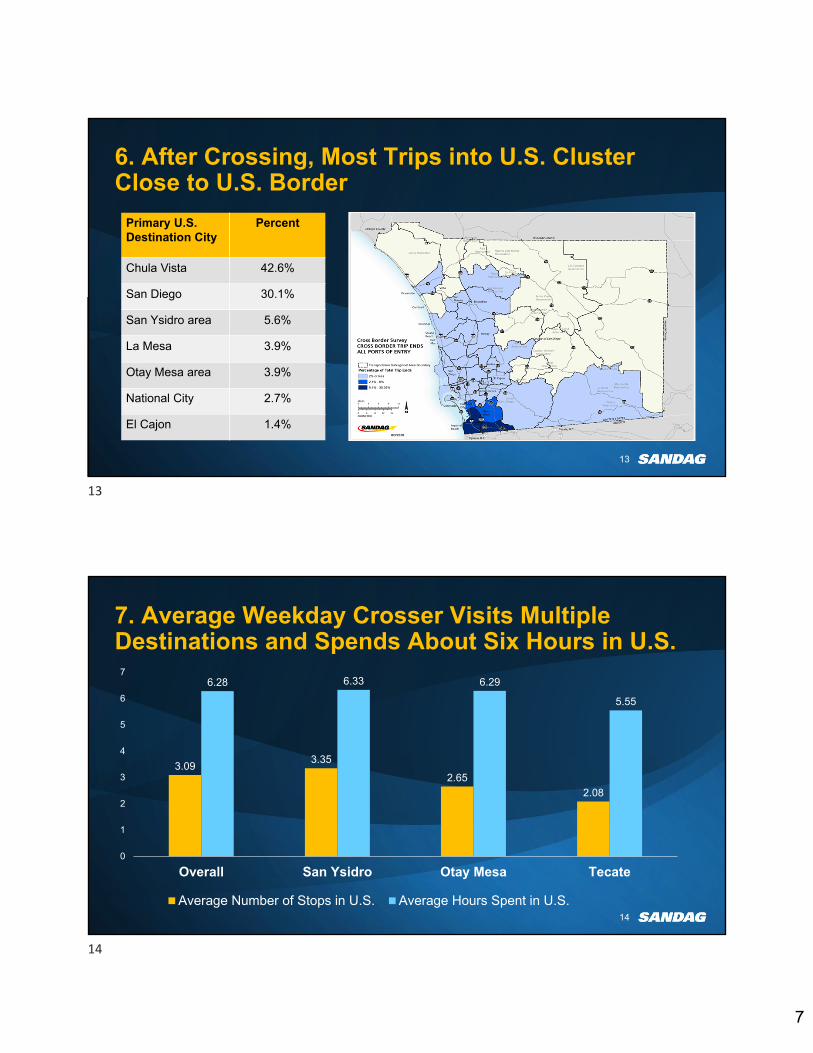
6. After Crossing, Most Trips into U.S. Cluster Close to U.S. Border
13
Primary U.S. Destination City
Percent
Chula Vista 42.6%
San Diego 30.1%
San Ysidro area 5.6%
La Mesa 3.9%
Otay Mesa area 3.9%
National City 2.7%
El Cajon 1.4%
7. Average Weekday Crosser Visits Multiple Destinations and Spends About Six Hours in U.S.
3.093.35
2.65
2.08
6.28 6.33 6.29
5.55
0
1
2
3
4
5
6
7
Overall San Ysidro Otay Mesa Tecate
Average Number of Stops in U.S. Average Hours Spent in U.S.14
13
14
8
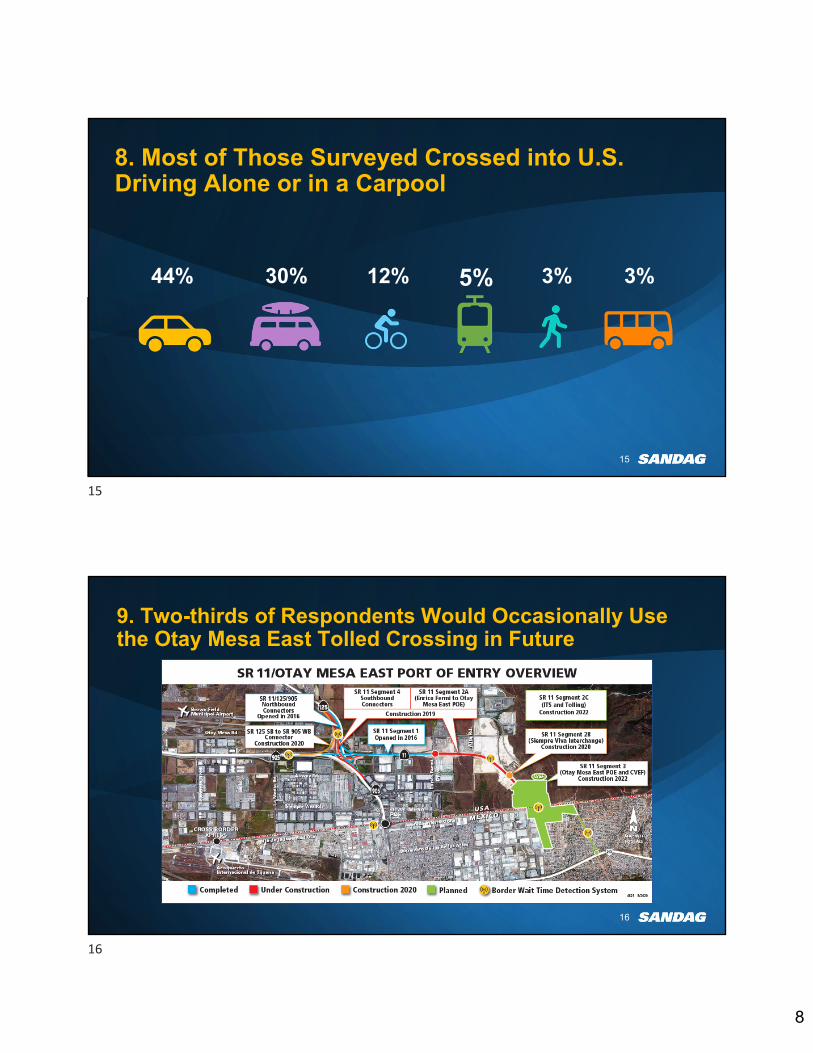
8. Most of Those Surveyed Crossed into U.S. Driving Alone or in a Carpool
15
44% 30% 12% 5% 3% 3%
9. Two-thirds of Respondents Would Occasionally Use the Otay Mesa East Tolled Crossing in Future
16
15
16

9
10. Respondents’ Willingness to Pay for an Expedited Crossing Strongly Related to Proposed Toll Amount
21.60%
46.30%
78.50%85.90%
64.50%
43.60%
16.70%11.60%13.80% 10.00%
4.70% 2.40%
0.00%
20.00%
40.00%
60.00%
80.00%
100.00%
$20 $10 $5 $3
Yes, would pay to use No, would not pay to use Not sure, depends
17
11. Comparisons of 2010 Versus 2019 Studies2010 2019
Employed full time 56% 62%
Place of employment
Employed in U.S. 21% 32%
Employed in Mexico 51% 44%
Primary reasons why Mexico residents visit U.S.
Shopping 55% 52%
Work 26% 31%
Visit friend/relative 11% 9%
Average duration of Mexico resident’s stay in U.S. 5.14 hours 6.28 hours
Average number of destinations visited by Mexico residents in the U.S.
2.75 places 3.09 places
Number of border crossings that resulted in dining/eating
23% 34%
18
17
18
10
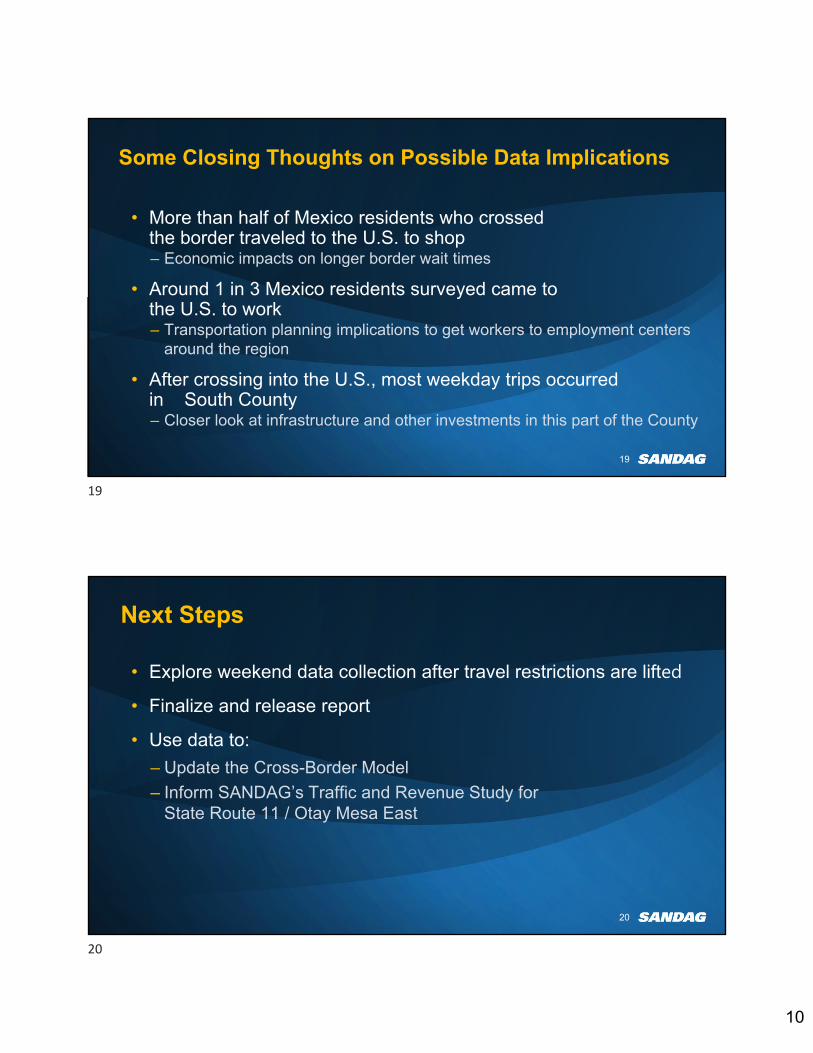
Some Closing Thoughts on Possible Data Implications
• More than half of Mexico residents who crossed the border traveled to the U.S. to shop– Economic impacts on longer border wait times
• Around 1 in 3 Mexico residents surveyed came to the U.S. to work– Transportation planning implications to get workers to employment centers
around the region
• After crossing into the U.S., most weekday trips occurred in South County– Closer look at infrastructure and other investments in this part of the County
19
Next Steps
• Explore weekend data collection after travel restrictions are lifted• Finalize and release report
• Use data to:
– Update the Cross-Border Model
– Inform SANDAG’s Traffic and Revenue Study for State Route 11 / Otay Mesa East
20
19
20

11
Questions?
Grace Miño, M.A.Senior Research Analyst
SANDAG
21
Timothy McLarney, Ph.D.President
True North Research, Inc.
21
1
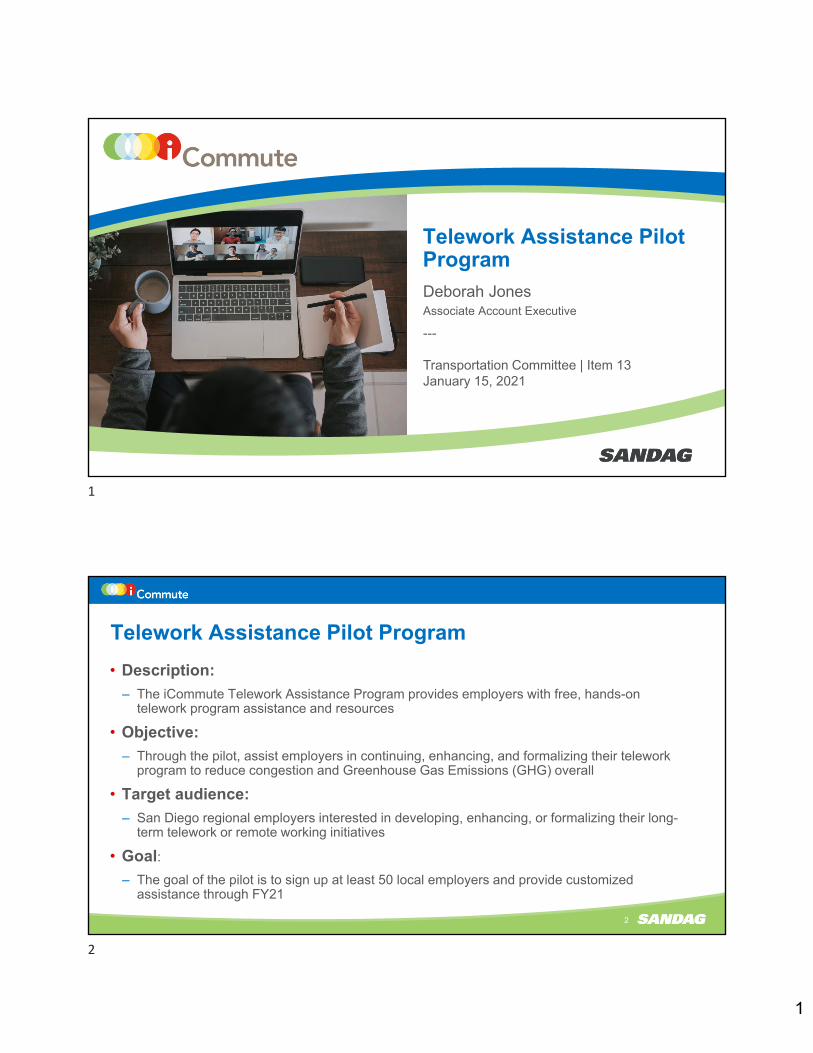
Telework Assistance Pilot Program
Deborah JonesAssociate Account Executive
---
Transportation Committee | Item 13January 15, 2021
2
• Description:
– The iCommute Telework Assistance Program provides employers with free, hands-on telework program assistance and resources
• Objective:
– Through the pilot, assist employers in continuing, enhancing, and formalizing their telework program to reduce congestion and Greenhouse Gas Emissions (GHG) overall
• Target audience:
– San Diego regional employers interested in developing, enhancing, or formalizing their long-term telework or remote working initiatives
• Goal:
– The goal of the pilot is to sign up at least 50 local employers and provide customized assistance through FY21
Telework Assistance Pilot Program
1
2
2
3
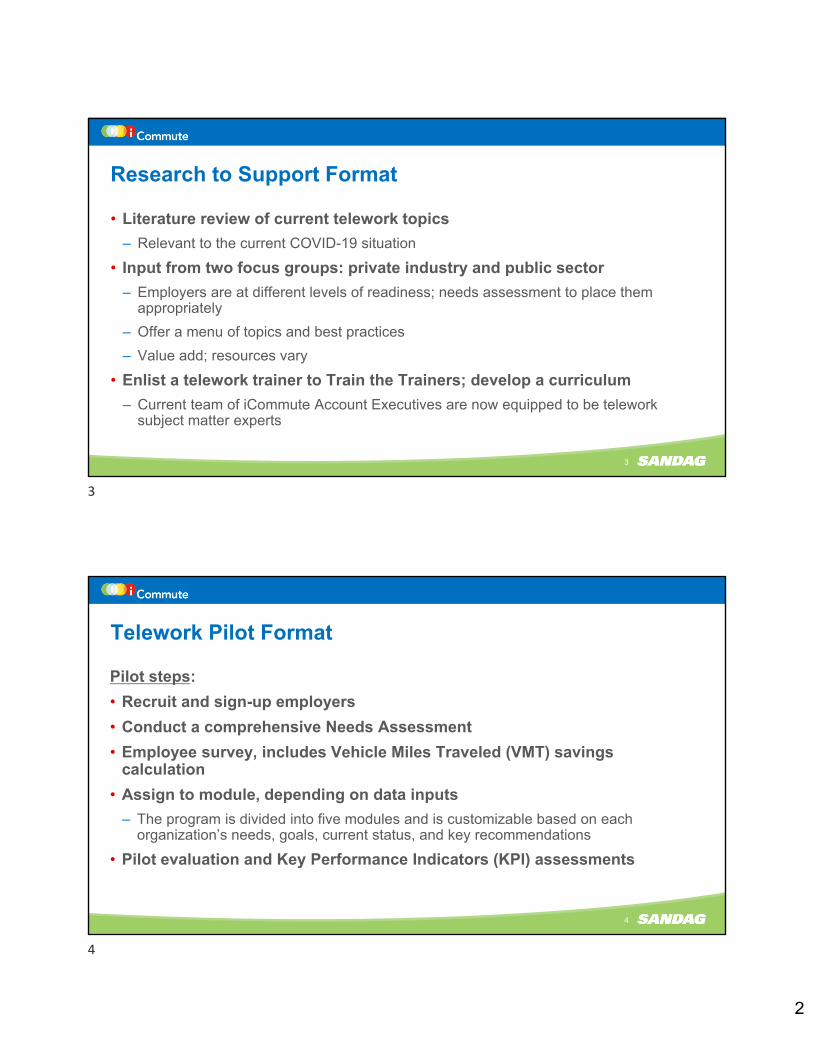
• Literature review of current telework topics
– Relevant to the current COVID-19 situation
• Input from two focus groups: private industry and public sector
– Employers are at different levels of readiness; needs assessment to place them appropriately
– Offer a menu of topics and best practices
– Value add; resources vary
• Enlist a telework trainer to Train the Trainers; develop a curriculum
– Current team of iCommute Account Executives are now equipped to be telework subject matter experts
Research to Support Format
4
Pilot steps:
• Recruit and sign-up employers
• Conduct a comprehensive Needs Assessment
• Employee survey, includes Vehicle Miles Traveled (VMT) savings calculation
• Assign to module, depending on data inputs
– The program is divided into five modules and is customizable based on each organization’s needs, goals, current status, and key recommendations
• Pilot evaluation and Key Performance Indicators (KPI) assessments
Telework Pilot Format
3
4
3
5
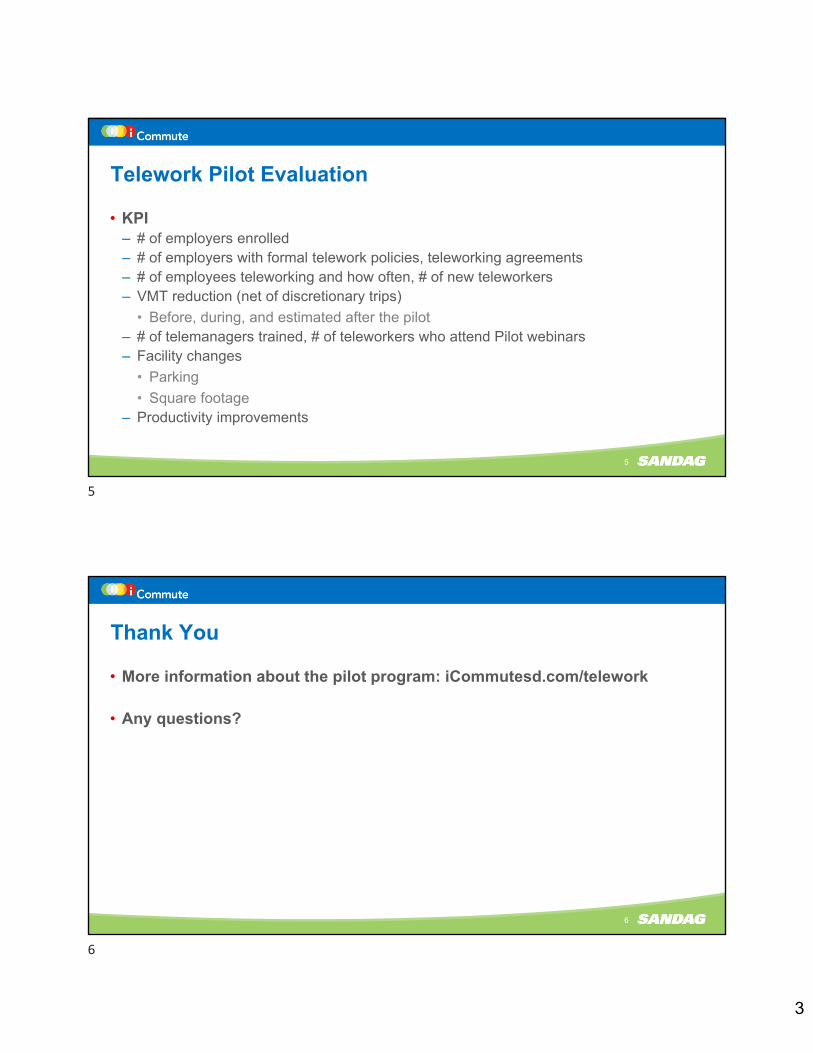
• KPI– # of employers enrolled– # of employers with formal telework policies, teleworking agreements– # of employees teleworking and how often, # of new teleworkers– VMT reduction (net of discretionary trips)
• Before, during, and estimated after the pilot– # of telemanagers trained, # of teleworkers who attend Pilot webinars– Facility changes
• Parking
• Square footage– Productivity improvements
Telework Pilot Evaluation
6
• More information about the pilot program: iCommutesd.com/telework
• Any questions?
Thank You
5
6