Embed Size (px)
Citation preview

Proposed FY 2019–20 Funding Plan: Final CVRP Supporting AnalysisOctober 2019
John Anderson – Research Analyst — Center for Sustainable Energy (CSE)
Brett Williams, PhD – Principal Advisor, EV Programs — CSE
with thanks to Jonathan Changus, Keir Havel, Amy Lastuka, Michelle Jones, and others at CSE and CARB

Outline
I. Method for the Proposed Funding Plan
II. Proposed FY 2019‒20 Funding Need (including FY 18–19 waitlist)
III. Proposed Three-Year Funding Need (SB 1275)
IV. Proposed Funding Need for 5M EVs (’18–’19 Budget Act)
‒ Context: Private-investment Estimates
‒ Trajectories Toward State Goals
V. Program-Change Methodology and Data Inputs
VI. Program-Change Estimates
VII. Next Steps
Appendix• Major models available, program design comparison, MA vs. CT income distributions, public data resources,
CVRP lease data, modeling alternatives and sensitivities considered
2

Method for the
Proposed FY 19–20 Funding Plan
3
Supplements and updates presentations from:Workgroup 4, Workgroup 3, Workgroup 2, December 2018 Workshop

Proposed Method
Extrapolate trends in EV sales volume
Calculate CVRP demand as a
percentage of the market
Extrapolate trends in Lower-income
Increased Rebate volume
Estimate funding required
4
General Funds
Lower-income Increased Rebates
“…all models are wrong; some are useful” – George Box
Add Increased Rebates for
Public Fleets in DACs

• Monthly sales data: ‒ March 2010 – December 2018: New-vehicle registrations (IHS)*‒ January 2019 – June 2019: Estimated using CVRP rebates
• Assembled into Vehicle categories:1. Plug-in hybrid electric vehicles (PHEVs)2. Range-extended battery electric vehicles (BEVx vehicles)**3. Battery electric vehicles (BEVs)
• Tesla separate category in Middle scenario• Model 3, Model S, Model X, and Bolt separate in High scenario
4. Fuel-cell electric vehicles (FCEVs)5. Zero-emission motorcycles (ZEMs)
• General funds: ‒ Low scenario: Average of most-recent 12 months (July 2018 – June 2019)‒ Middle scenario: Extrapolated from all data except: Tesla = extrapolated from April
2018 – June 2019‒ High scenario: Extrapolate from all data
General Funds: Extrapolations
5* Data may underestimate PHEVs.
** Receives a BEV rebate. See CleanVehicleRebate.org for more detail. To date = BMW i3 REx.
Extrapolate trends in EV sales volume

Percent of market rebated
6
* Limited to Apr. 2018 – Dec. 2018 to exclude months the Tesla Model 3 was not available. See slide 5 for details.** Data not available to calculate a percentage for the ZEM category;
the overall BEV percentage is assumed for the ZEM category in the projections.
Low Middle High
PHEV: 44% PHEV: 44% PHEV: 44%
BEVx: 43% BEVx: 43% BEVx: 43%
BEV: 51%
Tesla: 45%*
Tesla Model 3: 51%
Tesla Model S: 31%
Tesla Model X: 31%
Other BEV: 64%Chevrolet Bolt: 54%
Other BEV: 71%
FCEV: 89% FCEV: 89% FCEV: 89%
ZEM: 51%** ZEM: 51%** ZEM: 51%**
During “current program” (after lowering of income cap) = Nov. 2016 – Dec. 2018
Calculate CVRP demand as a
percentage of the market

Illustrative Eras: Percent of Market RebatedBefore and After the Income Cap
7Includes all PHEV, BEVx, BEV, and FCEV rebates
“Before” era = CY 2015 (excludes anomalous run-up to income cap in Q1 2016)“After” era = Nov. 2016 –Dec. 2018 (after lowering of income cap)

Increased Rebate for Public Fleets in Disadvantaged Communities
Public Fleet Pilot Project monthly avg.Jan. 2017 – Oct. 2017
PHEV ~10
BEVx 0
BEV ~21
FCEV ~1
ZEM not eligible
8
Add Increased Rebates for
Public Fleets in DACs

Proposed Scenarios: General Funds
9Historical = rebate funds only
Administration costs included in projections
Estimate funding required

Initial vs. Final Method: General Funds
10Historical = rebate funds only
Administration costs included in projections
Estimate funding required

Increased Rebates: Updated Method
• Previously projected as a percentage of standard rebates, Standard-Rebate growth is diverging from Increased-Rebate growth
• Increased Rebates are now projected separately.
11

Lower-income Increased Rebates: Extrapolations
12
• CVRP Lower-income Increased Rebates:
‒ Low scenario: Average of most-recent 12 months (July 2018 – June 2019)
‒ Middle scenario: Extrapolate all data (March 2016 – June 2019)
‒ High scenario: Extrapolate most-recent 12 months (July 2018 – June 2019)
• Vehicle categories
‒ Low and Middle:
1. Plug-in hybrid electric vehicles (PHEV)
2. Range-extended battery electric vehicles (BEVx)*
3. Battery-electric vehicles (BEV)
4. Fuel-cell electric vehicles (FCEV)
‒ High: All Lower-income Increased Rebates as a single category
Extrapolate trends in Lower-
income Increased Rebate volume

Proposed Scenarios: Lower-Income Increased Rebates
13
Estimate funding required

Initial vs. Final Method: Lower-Income Increased Rebates
14
Estimate funding required
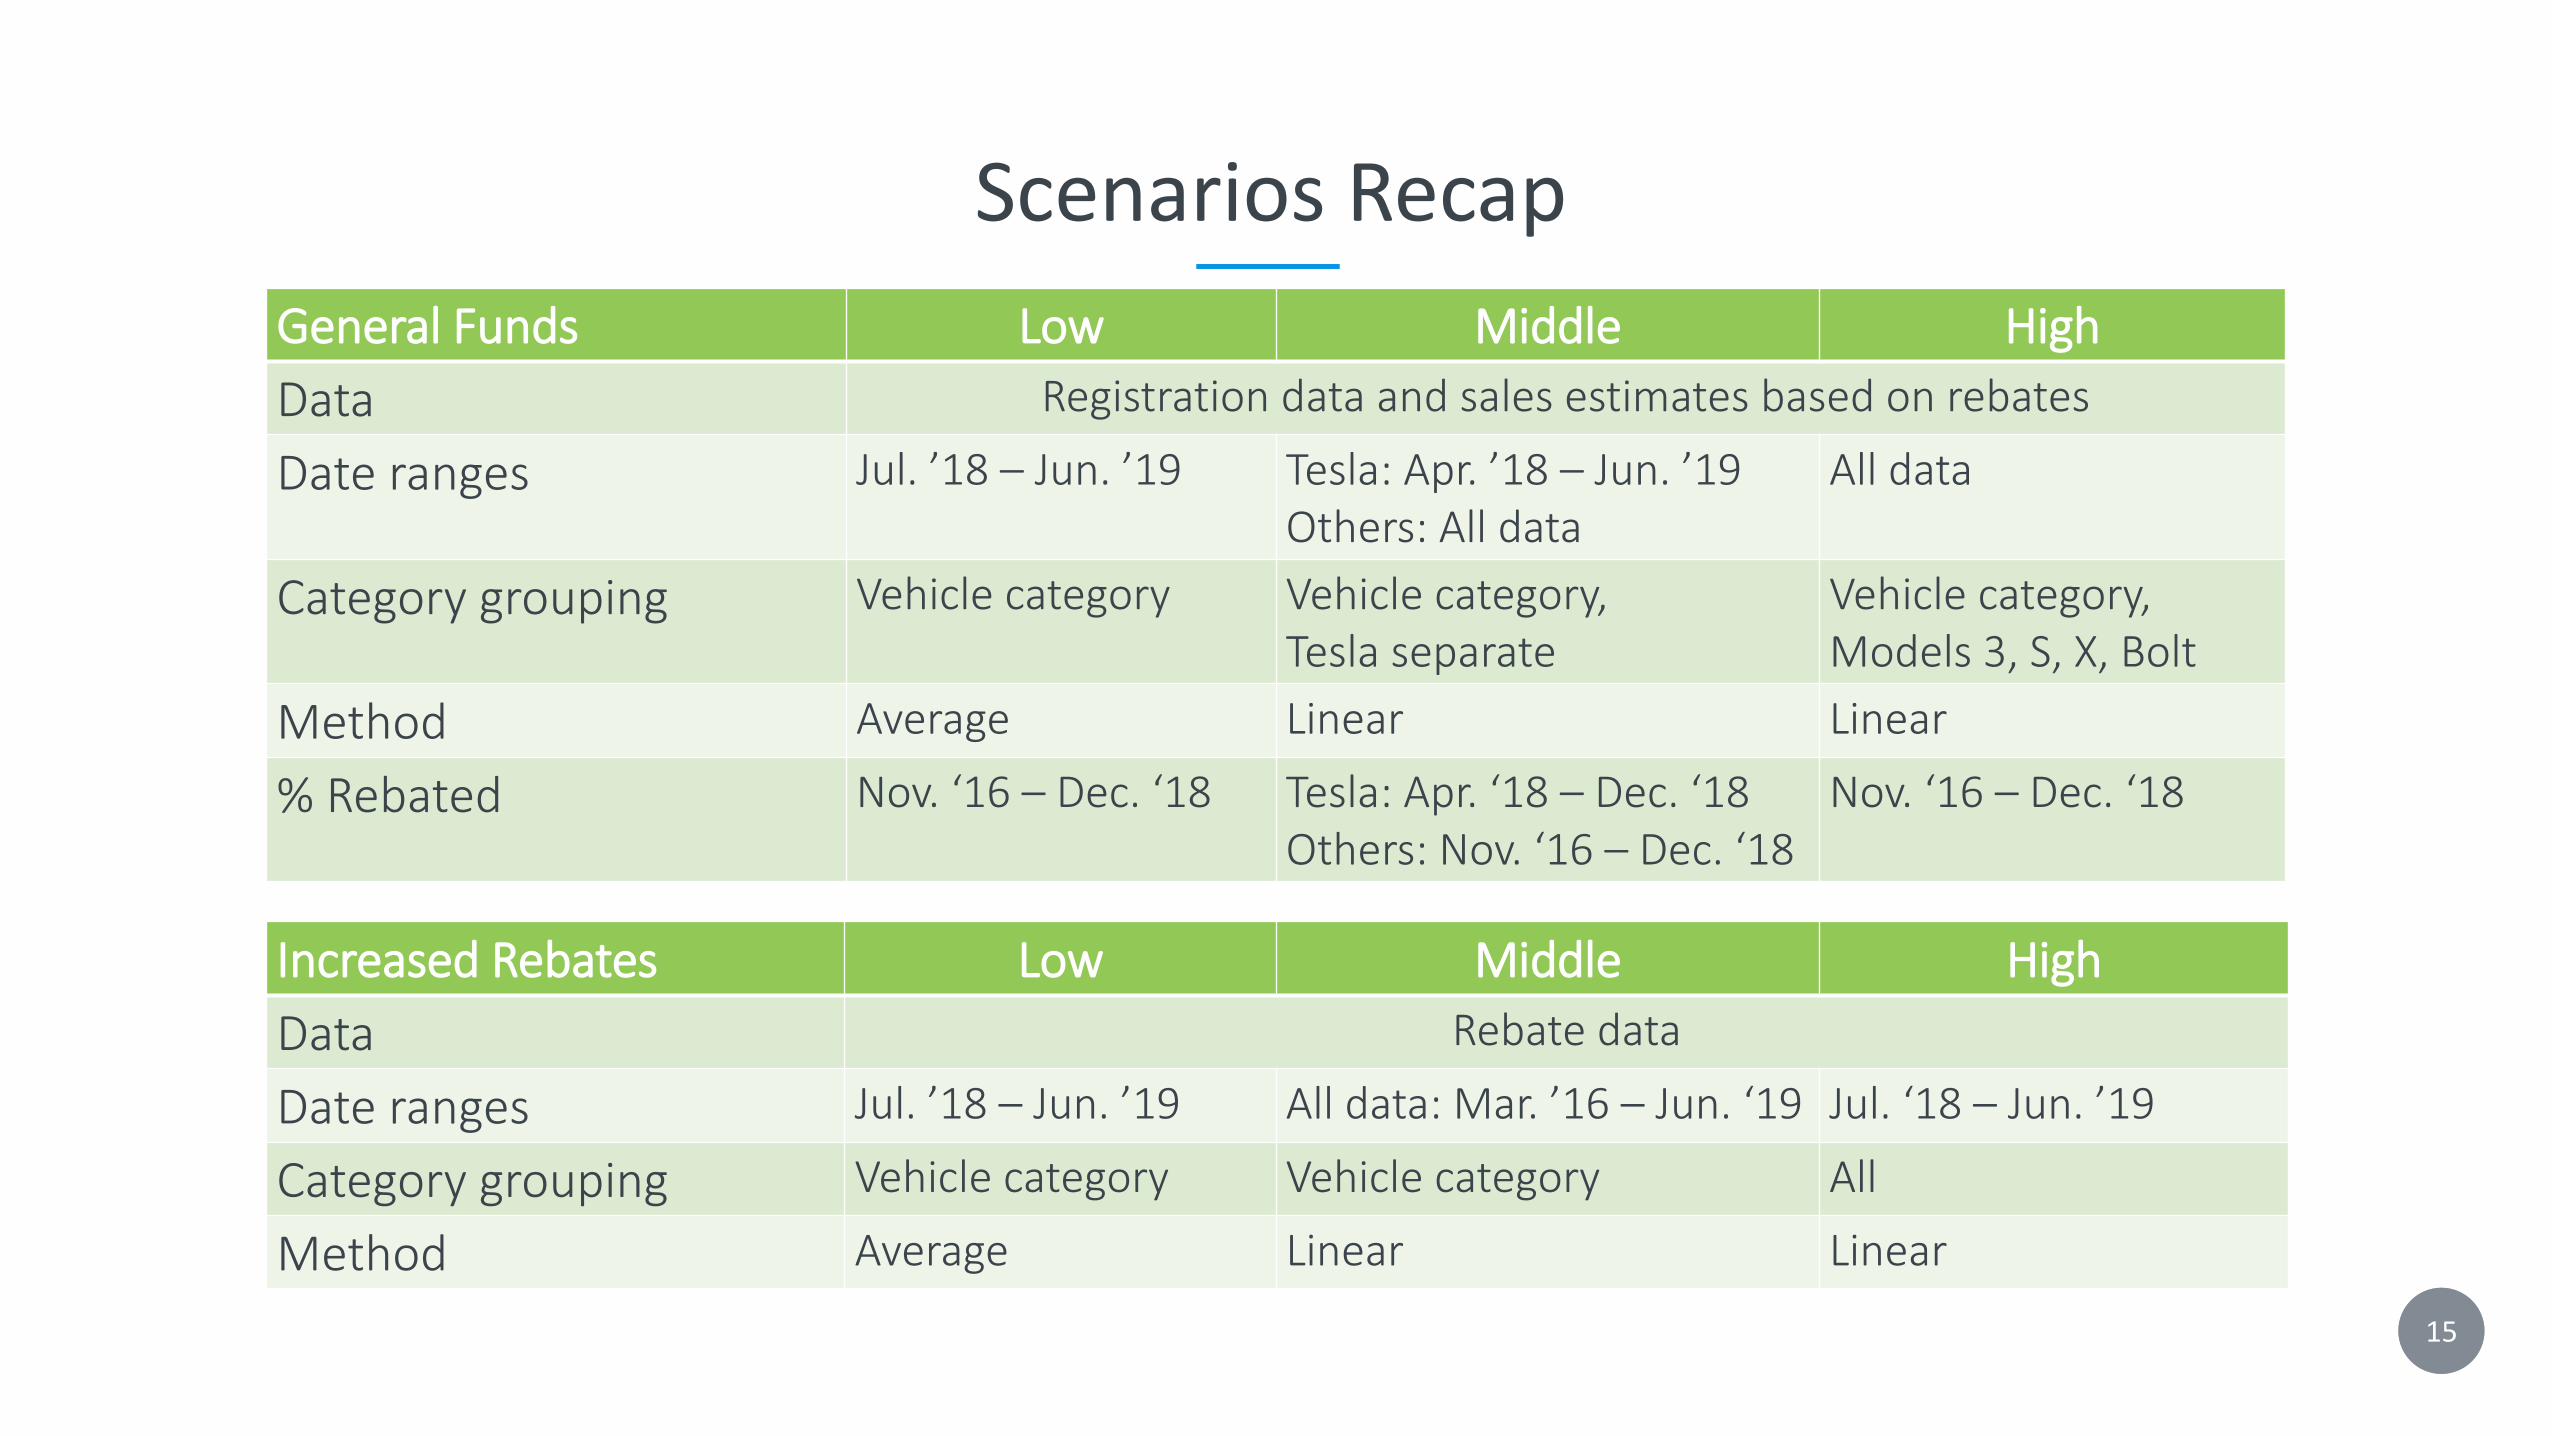
Scenarios Recap
15
General Funds Low Middle High
Data Registration data and sales estimates based on rebates
Date ranges Jul. ’18 – Jun. ’19 Tesla: Apr. ’18 – Jun. ’19Others: All data
All data
Category grouping Vehicle category Vehicle category,Tesla separate
Vehicle category,Models 3, S, X, Bolt
Method Average Linear Linear
% Rebated Nov. ‘16 – Dec. ‘18 Tesla: Apr. ‘18 – Dec. ‘18Others: Nov. ‘16 – Dec. ‘18
Nov. ‘16 – Dec. ‘18
Increased Rebates Low Middle High
Data Rebate data
Date ranges Jul. ’18 – Jun. ’19 All data: Mar. ’16 – Jun. ‘19 Jul. ‘18 – Jun. ’19
Category grouping Vehicle category Vehicle category All
Method Average Linear Linear

• Disruptive future EV releases ($35k Model 3, pickups, etc.)
• Federal Tax Credit phase out (reduced after 200,000 vehicles)‒ Tesla phased out by 2020‒ General Motors phase out by Q2 2020
• Rebate Now‒ Greater reservation funding requirements, and uncertain market
impact
• Other incentives and supportive policies‒ E.g., ZEV regulations, Low Carbon Fuel Standard Point-of-purchase
Incentive (LCFS POP), Clean Cars 4 All
• New public-fleet features‒ Access to procurement-friendly application/reservation
• Choice: HOV or rebate [AB 544 (Bloom, Stats. 2017, Ch 630)]
Factors Not Addressed
16
Estimate funding required

Proposed FY 2019–20 Funding Need
17
Including FY 2018–19 Waitlist

Funding Cycle(Sep thru Aug)
Rebate Type(All = Standard + Increased)
Funding Requirements Rebates(millions) (thousands)
Low Middle High Low Middle High
FY 2018–19(Jul thru Aug 2019)
Standard and DAC-Fleet Increased Waitlist $26 $29 $33
Lower-Income Increased Rebates Surplus (-$10) (-$10) (-$10)
FY 2019–20(Sep 2019 thru Aug 2020)
Standard and DAC-Fleet Increased $191 $235 $300 78 94 118
Lower-Income Increased Rebates $26 $30 $36 6 7 8Total Need $217 $264 $336 84 101 127
FY 2020–21(Sep 2020 thru Aug 2021)
Standard and DAC-Fleet Increased $188 $238 $395 77 96 155
Lower-Income Increased Rebates* $26 (-$1)* $34 (-$5)* $46 6 8 10Total Need $214 (-$1)* $272 (-$5)* $441 83 104 165
FY 2021–22(Sep 2021 thru Aug 2022)
Standard and DAC-Fleet Increased $188 $258 $479 77 104 186
Lower-Income Increased Rebates $26 (-$1)* $37 $55 6 8 12Total Need $214 (-$1)* $296 $534 83 113 199
3-Year Average (Middle Scenario, excl. waitlist) $272 104Grand Total Need thru Aug. 2022 $631 M – $1.3 B 248–494
FY 2019–20 Funding Need(as of 7/22/2019)
18
Grand total need thru Sep. 2020: $242 $293 $369
FY 19–20 Budget: $238

Proposed Three-Year Funding Need (SB 1275)
19

Three-Cycle* Funding Need Summary
20
* Funding Cycles = September–August

Three-Year Funding Need(as of 7/22/2019)
21
Funding Cycle(Sep thru Aug)
Rebate Type(All = Standard + Increased)
Funding Requirements Rebates(millions) (thousands)
Low Middle High Low Middle High
FY 2018–19(Jul thru Aug 2019)
Standard and DAC-Fleet Increased Waitlist $26 $29 $33
Lower-Income Increased Rebates Surplus (-$10) (-$10) (-$10)
FY 2019–20(Sep 2019 thru Aug 2020)
Standard and DAC-Fleet Increased $191 $235 $300 78 94 118
Lower-Income Increased Rebates $26 $30 $36 6 7 8Total Need $217 $264 $336 84 101 127
FY 2020–21(Sep 2020 thru Aug 2021)
Standard and DAC-Fleet Increased $191 $267 $378 78 107 148
Lower-Income Increased Rebates $26 $33 $45 6 8 10Total Need $217 $301 $423 84 115 158
FY 2021–22(Sep 2021 thru Aug 2022)
Standard and DAC-Fleet Increased $191 $300 $457 78 120 178
Lower-Income Increased Rebates $26 $37 $54 6 8 12Total Need $217 $337 $511 84 128 190
3-Year Average (Middle Scenario; excl. waitlist, surplus) $301 115Grand Total Need thru Aug. 2022 (excl. waitlist, surplus) $650 M – $1.27 B 251–475

Three-Cycle* Funding Need: Middle Scenario
22
* Funding Cycles = September–August

Proposed Funding Need for 5M EVs (’18–19 Budget Act)
& Trajectory Relative to State Goals
23

Continuing the Trajectory(caution: assumes recent trends continue “as are”)
Estimates as required by ’18–’19 Budget Act, based on current program design and
market conditions
Middle Scenario
Funding NeedAdditional Vehicles
Rebated
3-year Total $921 M 354,000
1 Million $505 M 195,000
1.5 Million $1.1 B 435,000
5 Million $5.6 B 2.1 M
Compare to: >$205 B in private investment (=sum of base MSRPs of forecasted EV sales)$5.6 B << 3% of total transition costs (vehicles only, no infra., etc.)
24

• Vehicle prices‒ Use 2018 vehicle sales proportions to create weighted average base MSRPs for each
vehicle category‒ Assume most base MSRPs stay constant
• Downward pressure on price: battery technology is getting cheaper• Upward pressure on price:
‒ Vehicles becoming more fully featured over time‒ Inflation
‒ Consider three scenarios for Tesla Model 3 base MSRP• Low: $35k• Middle: $40k• High: $45k
• Vehicle quantities‒ Use vehicle volumes by category from projections middle scenario‒ Sum vehicle base MSRP × quantity from June 2019 through August 2031 (5M vehicles)
Estimating Total Private Investment (Vehicle Price × Quantity)
25

Not accounted for:
• Changing vehicle mix, e.g. light duty trucks
• Vehicle Trim levels—base MSRP is used for all cars
• Inflation ‒ Nominal vehicle prices in CVRP Application Data (excluding Tesla vehicles) appear to be flat
since 2011
Total vehicle costs for projected vehicles added to reach 5 million ZEV goal:
Private Investment Estimates
Low Middle High
Market
value$196 B $205 B $215 B
26

Cumulative EV Sales Relative to State Goals:Actual, 3-Year Projected, and Current Trajectory
27Includes content supplied by R.L. Polk & Co, © 2018;
Projections may underestimate PHEVs.
Estimates as required by ’18–’19 Budget Act, based on current program design and market conditions:
~$5.6B for 2.1M rebated vehicles to reach 5M ZEVs

Time to Get to 15% Monthly Market Share : Recent vs. Long-Term Trends
Includes content supplied by R.L. Polk & Co, © 2018; may underestimate PHEVs
Apr 2028Sep 2019
0%
5%
10%
15%
20%
25%ZE
V M
on
thly
Mar
ket
Shar
e
Since Mar. 2010
Jan 2018–Dec 2018
28

Program-Change Estimates: Methodology and Data Inputs
29

• Percent of 2018 program that would have been excluded under new program design calculated by rebate type (standard/fleet and Lower-Income-Increased Rebates)
• Percent excluded removed from projected rebates
• Rebate essentiality calculated for excluded participants
• Rebate essential percentages used to calculate market losses based on future excluded rebates
Not addressed:
• Market-loss rebound effect due to increased resources subsequently available due to program changes for remaining, more-rebate-essential consumers
Program-Change Methodology
30

• MSRP Cap (FCEV exempt)$60k, $50k, $40k
• UDDS All-Electric Range (AER) Minimum>25, >30, >40, >50, >100
• Income Cap (FCEV exempt)Tax-filing status: $250k, $204k, $150k
• Application limitationsLimit one per person, limit three months to apply
• Rebate amounts-$500 for standard rebates, no Standard Rebates, no PHEV rebates, no Standard PHEV rebates
Program-Change Levels Explored
31

• MSRP Cap (FCEV exempt)$60k, $50k, $40k
Supporting Data
32

Electric Vehicles by Base MSRP
Base MSRP sources: Manufacturer websites, FuelEconomy.gov, Kelley Blue BookNote: ZEMs, FCEVs, and discontinued PEVs not included.
33
Vehicle Make and ModelBase
MSRPBMW 530e xDrive iPerformance 55700
Audi A3 e-tron 39500
BMW 530e iPerformance 53400
Volvo XC60 T8 55300
Volvo XC90 T8 67000
Volvo S90 T8 63900
Mitsubishi Outlander PHEV 34595
Toyota Prius Prime 27350
Ford Fusion Energi 34595
Kia Niro Plug-in Hybrid 28500
Hyundai Sonata Plug-in Hybrid 32400
Hyundai Ioniq PHEV 25350
Kia Optima Plug-in Hybrid 35390
Chrysler Pacifica 39995
Honda Clarity Plug-In Hybrid 33400
smart Electric Fortwo Cabriolet 28100
smart Electric Fortwo Coupe 23900
FIAT 500e 32995
Honda Clarity Electric 37540
BMW i3 REx 48300
Kia Soul EV 33950
Ford Focus Electric 29120
Hyundai Ioniq Electric 30315
Volkswagen e-Golf 30495
BMW i3s REx 51500
Nissan LEAF 29990
BMW i3 44450
BMW i3s 47650
Nissan LEAF Plus 36550
Jaguar I-PACE 69500
Chevrolet Bolt 36620
Tesla Model X 88000
Hyundai Kona Electric 36450
Tesla Model 3 (Medium-range) 47990
Tesla Model S 85000
Key
> $60,000
$50,000–$59,999
$40,000–$49,999

34
Rebate Essentiality Reflects Interesting Trends
CVRP Consumer Survey: 2016–17 edition, weighted, n = 8,927
64%57% 56%
46%43%
0%
20%
40%
60%
80%
100%
Less than $30,000 $30,000–$39,999 $40,000–$49,999 $60,000–$69,999 $80,000 or more
Average Base MSRP
As MSRP increases, rebate influence decreases

35
Rebate Importance by Vehicle Price
MOR-EV Survey, 2014–17: n = 2,549 total respondents weighted to represent N = 5,754 participants
Excludes one response missing price data.
41%48%
22%
27%
29%
22%
19%
16%
26%
10%5%
22%
4% 2%8%
0%
20%
40%
60%
80%
100%
Imp
ort
ance
of
Stat
e R
ebat
e in
Acq
uir
ing
EVNot at all important
Only slightly important
Moderately important
Very important
Extremely important
All >$60K<$60K

Recent Distribution of Rebates by Base MSRP level
36Approved applications received during 2018, purchase dates ≥ November 2016 (“current program”).
All Model 3 vehicles assigned $40–50k base MSRP

Average Rebated-Vehicle Purchase Price Remains Steady for non-Tesla Vehicles
As of 7/12/2019 37

• MSRP Cap (FCEV exempt)$60k, $50k, $40k
• UDDS All-Electric Range (AER) Minimum>25, >30, >40, >50, >100
Supporting Data
38

Electric Vehicle Models by Base MSRP & All-Electric Range
Sources:Base Manufacturer’s Suggested Retail Price (MSRP): • Manufacturer websites, FuelEconomy.gov, Kelley Blue Book
All-electric range (AER): • UDDS: CARB• Most recent model year
Note: ZEMs, FCEVs, and discontinued PEVs not shown in tableand may use EPA or manufacturer range estimates
39
Vehicle Make and ModelBase
MSRPAER
(UDDS)BMW 530e xDrive iPerformance 55700 21.7
Audi A3 e-tron 39500 22.9
BMW 530e iPerformance 53400 21.7
Volvo XC60 T8 55300 24.5
Volvo XC90 T8 67000 23.8
Volvo S90 T8 63900 29.7
Mitsubishi Outlander PHEV 34595 30
Toyota Prius Prime 27350 38.5
Ford Fusion Energi 34595 35.8
Kia Niro Plug-in Hybrid 28500 39.9
Hyundai Sonata Plug-in Hybrid 32400 39.6
Hyundai Ioniq PHEV 25350 43.2
Kia Optima Plug-in Hybrid 35390 40.6
Chrysler Pacifica 39995 48.2
Honda Clarity Plug-In Hybrid 33400 61
smart Electric Fortwo Cabriolet 28100 100
smart Electric Fortwo Coupe 23900 106
FIAT 500e 32995 127
Honda Clarity Electric 37540 138
BMW i3 REx 48300 146
Kia Soul EV 33950 179
Ford Focus Electric 29120 180
Hyundai Ioniq Electric 30315 197
Volkswagen e-Golf 30495 184
BMW i3s REx 51500 187
Nissan LEAF 29990 231
BMW i3 44450 238
BMW i3s 47650 238
Nissan LEAF Plus 36550 364
Jaguar I-PACE 69500 334
Chevrolet Bolt 36620 364
Tesla Model X 88000 318
Hyundai Kona Electric 36450 414
Tesla Model 3 (Medium-range) 47990 392
Tesla Model S Standard Range 85000 346
Key
Base MSRP AER (UDDS)
> $60,000
< 25 miles$50,000–$59,999
$40,000–$49,999

Recent Distribution of PHEV Rebates by UDDS Electric Range
40Approved applications received during 2018, purchase dates ≥ November 2016, PHEVs only.

• Income Cap (FCEV exempt)Tax-filing status: $250k, $204k, $150k
Supporting Data
41

Recent Income Distribution
42Approved applications received during 2018, purchase dates ≥ November 2016, individuals only (no fleets), excluding non-responses.
Includes FCEV, which are exempt from income caps

• Application limitationsLimit one per person, limit three months to apply
Supporting Data
43

Recent Number of Applications Per Applicant (Individuals Only)
44Approved applications received during 2018, purchase dates ≥ November 2016, individual applicants only (no fleets).

Recent Rebate Essentiality for Recent Repeat Participants
Approved applications received during 2018, purchase dates ≥ November 2016, individual applicants only (no fleets), non-responses to rebate essentiality question removed.
Would have purchased without state rebate
One Application(n = 69,008)
More than One Application(n = 805)
No 67% 71%
Yes 33% 29%
Differences significant (p = 0.0000)
45

Recent Time from Purchase to Application
46Approved applications received during 2018, purchase dates ≥ November 2016,
excluding public fleets and days from purchase to application < 0.
44%
28%12% 5% 10%

Program-Change Estimates
47

• MSRP Cap (FCEV exempt)$60k, $50k, $40k
• UDDS All-Electric Range (AER) Minimum>25, >30, >40, >50, >100
• Income Cap (FCEV exempt)Tax-filing status: $250k, $204k, $150k
• Application limitationsLimit one per person, limit three months to apply
• Rebate amounts-$500 for standard rebates, no Standard Rebates, no PHEV rebates, no Standard PHEV rebates
Program-Change Levels Explored
48

# ScenarioSavings, % of
MiddleFirst-cycle cost(excl. waitlist)
% of first-cycle vehicles lost
$ saved per vehicle lost ↑
1 Middle (baseline) 0% (baseline) $264 M 0% (baseline) (baseline)2 < $60k MSRP -6% $246 M 2% -$4,4533 < $50k MSRP -7% $244 M 2% -$4,2194 Limit one per person (not retroactive) 0% $263 M 0% -$4,0855 < $40k MSRP -37% $156 M 13% -$3,9736 Income cap—single filers: ≤ $150k, other filers: ≤ $250k -6% $248 M 2% -$3,7127 Income cap—single filers: ≤ $150k, other filers: ≤ $204k -13% $227 M 5% -$3,6168 Reduce standard rebate $500 ($150 for ZEM) -13% $226 M 5% -$3,5389 > 40-mi UDDS all-electric range -6% $246 M 3% -$3,147
10 PHEV/BEVx: > 50-mi BEV/FCEV/ZEM: > 100 UDDS all-electric range -7% $242 M 3% -$3,13611 > 50-mi UDDS all-electric range -7% $243 M 3% -$3,11912 PHEV/BEVx: > 25-mi BEV/FCEV/ZEM: > 100 UDDS all-electric range -1% $260 M 1% -$3,00413 PHEV/BEVx: > 30-mi BEV/FCEV/ZEM: > 100 UDDS all-electric range -2% $260 M 1% -$2,99414 > 30-mi UDDS all-electric range -1% $260 M 1% -$2,89415 > 25-mi UDDS all-electric range -1% $261 M 1% -$2,88616 Limit 3 months between purchase and application*
Assessment of Individual MeasuresRanked from most cost-effective to least cost-effective [$ saved/vehicles lost]
Assumes changes effective 1 December 2019. Note, first-cycle costs do not include an estimated $29 M waitlist.
* 3-month time limit assumed to produce no long-term savings or market losses (based on implementation of similar time limits in other states)49
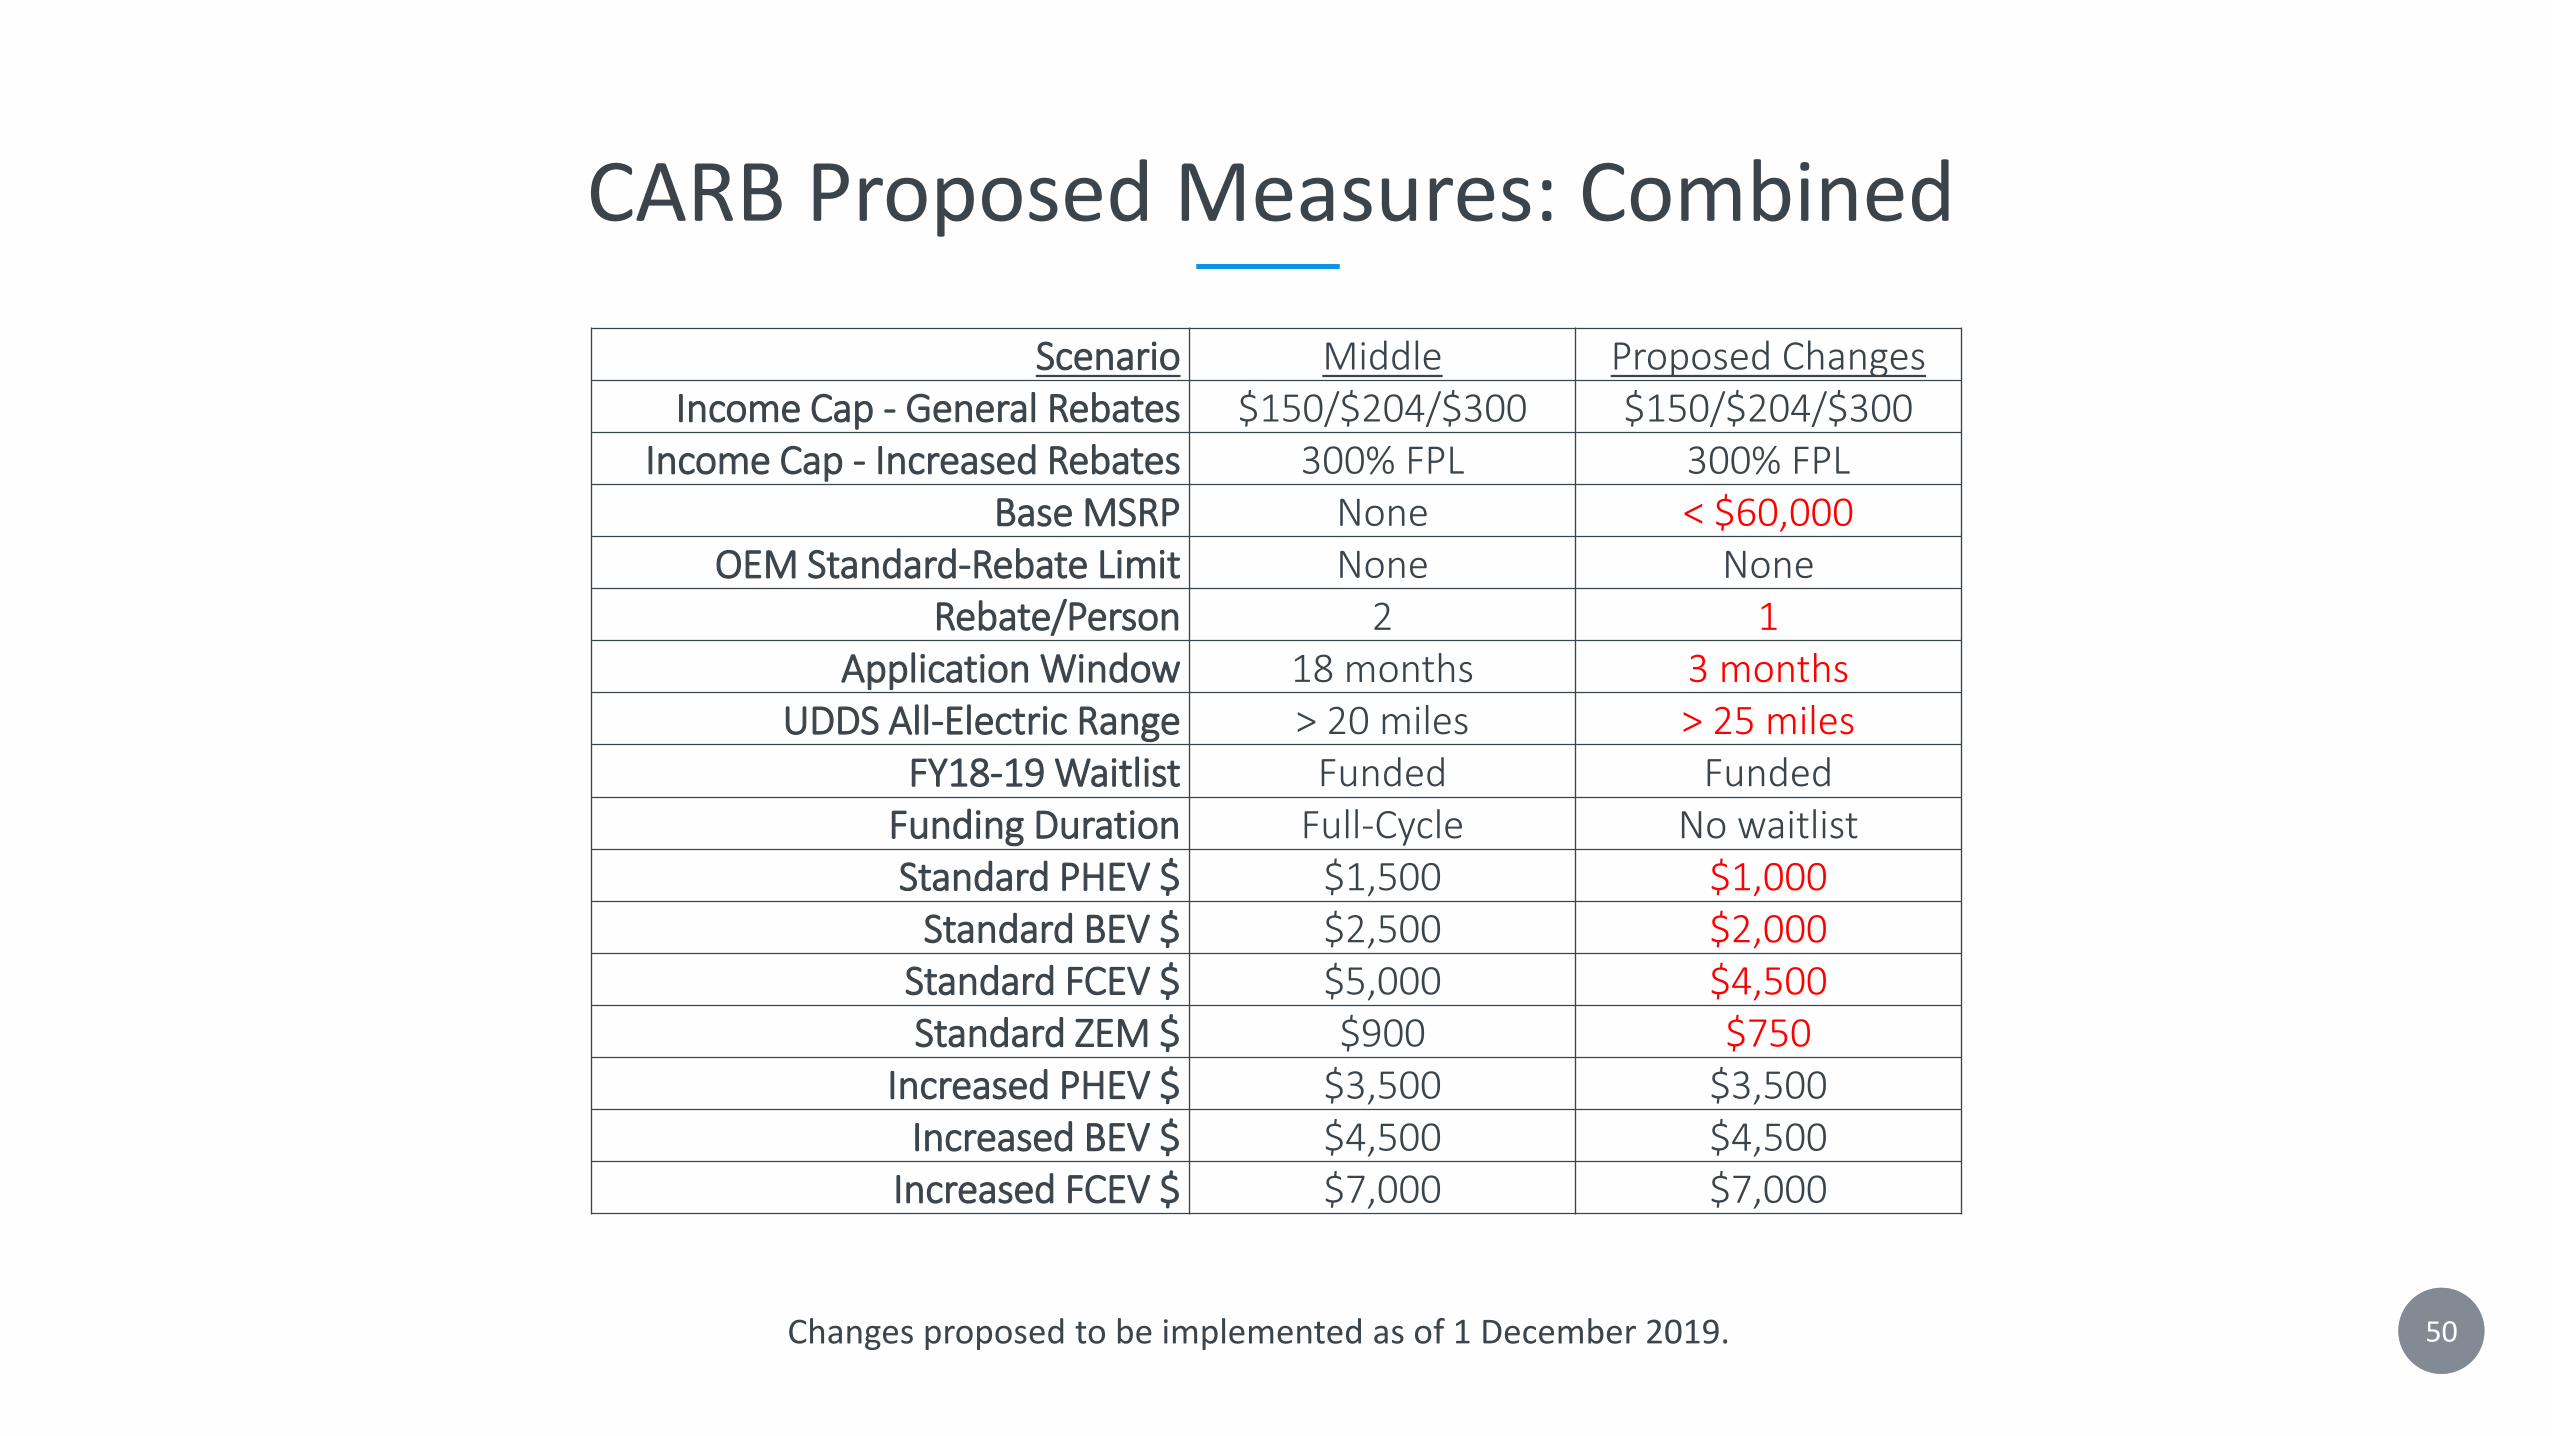
CARB Proposed Measures: Combined
Changes proposed to be implemented as of 1 December 2019. 50
Scenario Middle Proposed ChangesIncome Cap - General Rebates $150/$204/$300 $150/$204/$300
Income Cap - Increased Rebates 300% FPL 300% FPLBase MSRP None < $60,000
OEM Standard-Rebate Limit None NoneRebate/Person 2 1
Application Window 18 months 3 monthsUDDS All-Electric Range > 20 miles > 25 miles
FY18-19 Waitlist Funded FundedFunding Duration Full-Cycle No waitlistStandard PHEV $ $1,500 $1,000
Standard BEV $ $2,500 $2,000 Standard FCEV $ $5,000 $4,500 Standard ZEM $ $900 $750
Increased PHEV $ $3,500 $3,500 Increased BEV $ $4,500 $4,500
Increased FCEV $ $7,000 $7,000

Program-Change Funding Estimates
51* 3-month time limit modeled as having no effect (based on implementation of the same or shorter time limits in other states)
ScenarioWaitlist
First-cycle cost
SavingsTotal first-cycle need
Cycle 2 need
Cycle 3 need
Three-cycle average need
Middle (baseline) $29 M $264 M $0 M $293 M $301 M $337 M $301 MReduced standard rebate, limit 1, 3 months to apply*> 25-mi UDDS range for PHEV, < $60k base MSRP
$29 M $208 M -$56 M $237 M $217 M $243 M $223 M
Funding-Cycle Details
Assumes program changes implemented 1 December 2019, no waitlist, and 58% of potential rebates during waitlist are deferred to the first month of the next funding cycle (based on program percentages of participants reporting the rebate as essential to their purchase/lease).
52
Scenario
Cycle 0 Cycle 1 Cycle 2 Cycle 3
Estimated Cost
Estimated BudgetEnd of $238M
Estimated BudgetEnd of $200M
Estimated BudgetEnd of $200M
WaitlistLMI
IncreasedGeneral
LMI Increased
GeneralLMI
IncreasedGeneral
Middle $29 M $25 M $213 M 06/17/20 $33 M $167 M 03/16/21 $37 M $163 M 12/25/21
w/ Changes $29 M $25 M $208 M 08/31/20 $32 M $168 M 08/10/21 $36 M $164 M 06/19/22

Timelines
Assumes program changes implemented 1 December 2019.
Cycle 1
SCENARIO Jun'19 Jul'19 Aug'19 Sep'19 Oct'19 Nov'19 Dec'19 Jan'20 Feb'20 Mar'20 Apr'20 May'20 Jun'20 Jul'20 Aug'20
Middle
w/ Changes
Cycle 2
SCENARIO Sep'20 Oct'20 Nov'20 Dec'20 Jan'21 Feb'21 Mar'21 Apr'21 May'21 Jun'21 Jul'21 Aug'21
Middle
w/ Changes
Cycle 3
SCENARIO Sep'21 Oct'21 Nov'21 Dec'21 Jan'22 Feb'22 Mar'22 Apr'22 May'22 Jun'22 Jul'22 Aug'22
Middle
w/ Changes
Cycle 3
Cycle 3
Waitlist ($29M) Cycle 1
Waitlist ($29M) Cycle 1
Cycle 2
Cycle 2
53

Next Steps

Is this the calm after the storm, or before the $35k Model 3 and other disruptions?
Waitlist?
55

• How best to treat?:‒ Tesla Model 3 / future disruptions
• Near term ok?• Long-term maturation/limits of production?
‒ Lower-price long-range BEVs generally?‒ New releases?
• Additions (evolutionary) vs. cannibalization ?• Market saturation?
‒ Phase-out of federal tax credit?‒ Other policies/programs?‒ Other “not addressed” items of policy priority?
Discussion Questions: Projections Modeling
56

Appendix

• Data include ‒ Lease-only vehicles
• Honda Clarity Fuel Cell• Honda Clarity Electric
‒ Fleet-only vehicles• Bolloré Blue Car
‒ Out-of-production vehicle models• Chevrolet Volt• Ford C-MAX Energi• Hyundai Tucson Fuel Cell (also lease only)• Mercedes-Benz B250e
• Market-loss estimates utilize rebate essentiality data from the time of application and excludes non-responses, which may overestimate market impacts
Caveats
58

Electric Vehicle Choices: Major 2019 Models
Fuel-cell EVs
Plug-in hybrid EVs All-battery EVs
Hydrogen Fuel-Cell EVs
59

Major 2019 Models with Multiple Drive Train Technologies
Fuel-cell EVs
Plug-in hybrid EVs All-battery EVs
Hydrogen Fuel-Cell EVs
60

State EV Rebate Programs Administered by CSE(as of Jan. 2019; Oregon pending)
61
e-miles
≥ 120 $2,000
≥ 40 $1,700
≥ 20 $1,100
< 20 $500
$5,000
• BEVs & PHEVs ≤ $50k base MSRP, FCEVs ≤ $60k
• Point-of-sale option• $150 dealer
incentive
$1,500
BEVx only: $1,500
$450
$1,500
• Base MSRP ≤ $50k • No fleet rebates
• Base MSRP > $60k = $500 max.;
• Point-of-sale
$2,500
$2,500 (i3 REx)
$1,500
$900
$5,000
• ≥ 20 e-miles only• Income cap• Increased rebates
for lower-income households
≥ 45 $1,000
< 45 $500
e-miles≥ 200 $2,000
≥ 120 $1,500
< 120 $500
Zero-EmissionMotorcycles
All-Battery EVs
Plug-in Hybrid EVs
Fuel-Cell EVs
Program ended 9/30/19

EV Incentive Programs: Previous Rebate Designs
e-miles
≥ 120 $2,000
≥ 40 $1,700
≥ 20 $1,100
< 20 $500
$2,500
$2,500 (i3 REx)
$1,500
$900
$5,000 $5,000
• MSRP ≤ $60k only • Dealer assignment• $150 dealer
incentive ($300 previous)
$2,500
≥10 kWh $2,500
<10 kWh $1,500
$750
$2,500
• MSRP ≥ $60k = $1,000 max.
• No fleet rebates
• MSRP > $60k = $500 max.
• Point-of-sale via dealer
• ≥ 20 e-miles only• Income cap • Increased rebates
for lower-income households
≥ 40 $2,000
< 40 $500
e-miles≥ 175 $3,000
≥ 100 $2,000
< 100 $500
Zero-EmissionMotorcycles
All-Battery EVs
Plug-in Hybrid EVs
Fuel-Cell EVs
62

5%
26%
30%
15%
10%
4%2% 2% 2%
1%3%
4%
16%
23%
18%
12%
7%
4%3%
2% 2%
9%
0%
5%
10%
15%
20%
25%
30%
35%
CHEAPR
MOR-EV
CHEAPR and MOR-EV Respondents by Household Income
CHEAPR Survey (2015–17): n=819 total respondents, weighted to represent N=1,583 participants
MOR-EV Survey (2014–17): n=2,549 total respondents, weighted to represent N=5,75463

nyserda.ny.gov
• > 320,000 EVs and consumers have received > $720 M in rebates• > 45,000 survey responses being analyzed so far, statistically represent > 200,000 consumers
• Reports, presentations, and analysis growing
Public dashboards and data facilitate informed action
64mor-ev.org
cleanvehiclerebate.org ct.gov/deep

CVRP Lease Percentage by Rebate Type and Time
Applications from individuals: 11/1/2016 – 10/31/2018 65

CVRP Lease Rates by Rebate Type
Applications from individuals: 11/1/2016 – 10/31/2018
Standard Rebate LMI Increased Rebate
Lease 48% 67%Purchase 52% 33%
Differences significant (p = 0.000)
Lease Rates by Rebate Type
66

Middle Scenario: Alternative Methods Explored
67

Alternative Tesla Model 3 Extrapolations Considered
Data frame (months)
3 6 9 12 15 23
Average ↑ ↑ ↑ ↑ ↓
Linear ↓ ↑ ↓ ↑ ↑ ↑
2nd order ↑ ↓ ↑ ↓ ↓ ↓
3rd order n.a. ↓ ↓ ↑ ↑ ↓
• Data date ranges• All data• 3 months • 6 months • 9 months • 12 months • 15 months
• Projection methods• Constant• Average• Linear extrapolation• Second-order polynomial• Third-order polynomial
68
Compared with 15-month average ( )

69
Sensitivity Testing (version: February 2018)
% of Middle Scenario Name Scenario
First-cycle total need
138% Curve fit All categories: polynomial growth, 2nd order $734 M
123% Main-streaming Percent of market rebated +10 points $655 M
120% Increased accessLMI increased rebates = 25% of total for each eligible vehicle type $636 M
103% High Tesla Model 3 extrapolated from rebate data $548 M
100% Middle Middle (baseline) $531 M
95% Recent trends All categories: linear growth based on latest 12 months $506 M
89% Not-as-recent trends All categories: linear growth based on latest 36 months $473 M
77% Left behind Percent of market rebated -10 points $407 M
74% Low Tesla Model 3 based on high sales month $391 M

• Numeric optimization of cost-effectiveness metrics associated with potential changes
• GHG metrics
• LMI vs. standard lease metrics for
• One-per-person every ~three years
• Incorporating federal tax phase down
Stakeholder Preferences & Analytical Wish List
70

CleanVehicleRebate.org
71
This presentation supplements/updates the following linked resources, which contain additional content:
• April 23rd CVRP Workgroup #4
• April 4th CVRP Workgroup #3
• March 22nd CVRP Workgroup #2
• December 4th CVRP Workshop
• FY 2018–19 Funding Plan Appendix C
• August 2016 Income Cap Analysis
[email protected]@energycenter.org