Embed Size (px)
Citation preview

Author:
B.J.S. Vlaming BSc
Master Student Industrial Engineering and Management
University of Twente
Proposing a method to
reduce technical downtime
at Quaker Oats
April 2019
Supervisors:
University of Twente:
Dr. M.C. van der Heijden
Dr. A.J.J. Braaksma
Quaker Oats Rotterdam B.V.:
Dhr. J. Bruil

I
Author information:
Name: B.J.S. Vlaming
Study: Industrial Engineering and Management
Specialization: Production, Logistics and Management
Supervisory committee:
External supervisor: Dhr. J. Bruil
Company: Quaker Oats B.V. Rotterdam
Internal supervisor 1: dr. M.C. van der Heijden
Internal supervisor 2: dr. A.J.J. Braaksma
Company: University of Twente
Quaker Oats Rotterdam
Brielselaan 7
3081 AA Rotterdam
Nederland
University of Twente
Drienerlolaan 5
7522 NB Enschede
Nederland

II
Management summary This research project is conducted at Quaker Oats as a master thesis for the study named Industrial
Engineering and Management. The research project is written in the technical department (TD). The
task of the TD is to maintain the machines at Quaker Oats. The TD has to cope with machines that fail,
due to technical problems, more frequent than wanted. Machines breakdown for 3,5% of the time
instead of 2,2%. This technical downtime results in an interruption of the production process of Quaker
Oats. This frustrates personnel and management and limits the output of the product. The general
thought is that, due to the efficiency of the machines of 50-80%, the output can be increased by 20%
once maintenance is optimal. The goal of the research is therefore to reduce the technical downtime
by improving maintenance. We focus on downtime resulting from technical causes such as damaged
bearings, this means not human or material related downtime errors.
We therefore determined various ways to reduce the technical downtime, i.e. transition towards
preventive maintenance. It was soon discovered that the TD is stuck in a vicious circle; there is a lack
of preventive maintenance (PM), 98% of the work orders are corrective and there are no resources for
PM such as data which makes it difficult to start a PM plan. We proposed a way to determine the
maintenance needs of machines and create a maintenance concept for maintenance of a machine and
therefore increase the resources for PM. A maintenance concept (concept for short) is defined as
information, policies and procedures for the optimal maintenance of a machine. We create a
maintenance concept as a pilot such that we can test it and create awareness for determining
maintenance needs and execution maintenance tasks. We do not focus on the planning of
maintenance tasks and argue that to plan tasks, the TD first needs to have a plan and expected results
of the plan. This is necessary to convince people of the need for maintenance. To reach the goal, an
extensive analysis of the current situation is conducted. We based the analysis of the current situation
on interviews, analysis of maintenance tasks in the SAP and Excel database and working with operators
and engineers. We concluded that, in order of importance:
- The TD lacks functioning concepts for its machines, as can be seen by the lack of a concept for
most machines and the missing detail like argumentation and durations of tasks;
- The TD execution of reactive maintenance, solving breakdowns without further analysis;
- 40% of the breakdowns could have been prevented by performing preventive maintenance,
the rest by improving material quality, operator skills and machine use;
- The maintenance database is of limited use for maintenance analysis, missing information like
causes, effect, damage, accurate duration, etc.;
- The TD has limited influence on the planning of maintenance tasks, preventive tasks are
unknown and the TD announces maintenance tasks too late to incorporate in the planning;
- Maintenance opportunities such as changeovers, stops and cleaning moments are left unused.
With the literature study, we searched for a way to improve maintenance and create a concept. The
more preventive maintenance tasks are executed, the less unplanned corrective tasks occur. However,
reducing unplanned corrective tasks becomes extremely expensive after some point. We would like to
create a basis for Quaker Oats which they can improve when necessary and once the basis is accepted.
For the concept, we use the framework of Waeyenbergh and Pintelon, also called CIBOCOF. This
concept is suitable for using qualitative knowledge and includes techniques based on and is an
improvement over RCM and TPM. To quickly show the impact of the concept and because of the
limited time the TD has, we analysed the five components that fail the most. To get the most out of
the available data, we filled the gaps in quantitative data with qualitative data from interviews with
multiple departments and we extend the concept with the maintenance feedback analysis (MFA). The
MFA helps to identify opportunities to reduce assumptions and uncertainty.

III
We expect that the concept will reduce the technical downtime by 10% (two hours per month) for the
pilot machines. We created the concept as a pilot on a packing machine, the machine which has the
most technical downtime. The concept consists of five tasks with a maintenance policy, strategy and
MFA for every failure mode, see Table 1.
Table 1: Maintenance tasks with MFA
Machine Vento Equipment # 50463380
Date 26-2-2019 Location Packaging
Subsystem Failure mode Maintenance policy
Replacement strategy
MFA actions
Rotary feeder
Worn suction cups
UBM, cartons processed
Block-based, replace every cup at the same time
Track lifetime and research other parts.
Carton track
Worn suction cups
UBM, cartons processed
Block-based, replace every cup at the same time
Track lifetime and research other parts.
Gluing system
No to little glue on master carton
UBM, cartons processed
Block-based Determine lifetime per nozzle, does it differ?
General
Zero points of machine or programs deviate
DBM, check after a crash
Determine the effect of failures and cleaning on the deviation. Create visual inspection point.
Vacuum system
No vacuum FBM
Track state of the filter when it is cleaned. Note production hours upon failure
The initial concept should be further extended on the packing machine and created for other machines.
Due to timing reasons, we created a general concept for one machine that includes tasks and when to
execute those tasks, but not a detailed task description. For the created tasks, an inspection list and
documentation on how to replace the parts must be created. We created an implementation plan to
determine the steps to create a concept for other machines. It also considers the evaluation and
improvement of a created concept.
We also propose a plan to improve the data registration of Quaker Oats. This way, the concept can be
supported by quantitative data in the future which further optimise the concept. Not only the concept
will see the benefits of better data registration, other analysis performed at Quaker Oats will also
benefit. Breakdowns and its causes can be better analysed as well as costs and time distribution. The
plan consists of:
- Structuring Quaker Oats its machines in SAP by rebuilding the machine and submachine
functional locations to ensure data can be stored and is stored in the right place;
- Speeding up the order process and removing the barrier for engineers to register data by
creating time for registration and removing certain steps of the process like redundant SAP
transactions;
- Improving the order quality by among others registering the cause, effect, solution and
duration of the breakdown;

IV
- Motivate and train people to use SAP such that data is registered by showing users the effect
of the concept and the improvement potential determined during the MFA.
Based on this research, Quaker Oats plans to implement the proposed maintenance concept, extend
it and create maintenance concepts for other machines. We recommend further research in:
- The planning of maintenance actions. This is a process in which both Maintenance and
Production should be involved. There are opportunities such as changeovers, but they are
unused amongst others due to a lack of communication.
- The variation in input materials to keep the loads and machine settings, such as speeds and
positions of parts, at standard. This will increase the predictability of maintenance. This should
be done in cooperation with Maintenance, Quality and Production. Constant loads make is
easier to predict the maintenance needs and therefore reduce maintenance costs, while
standard settings help engineers to quickly identify the problem.

V
Preface This report is the result of my graduation project to acquire my master’s degree in Industrial
Engineering and Management, with the specialization Production, Logistics and Management.
I would like to thank Jacob for the opportunity to do my thesis at Quaker Oats in the Technical
Department. I would also like to thank all my colleagues from Quaker Oats for supplying me with
information and the nice working sphere. Special thanks go out to Frank Zeeman for his limitless
support, readiness to start a discussion and sharing of information. During my time I have learned a
lot, for which I am grateful.
Furthermore, I would like to thank my first supervisor Matthieu for his critical view on the project and
useful feedback and support. The monthly meetings and feedback helped me progress during the
project and gave me new motivation to go further. I would also like to thank my second supervisor,
Jan Braaksma, for his critical view on the subject and useful feedback.
I would also like to thank the co-interns at Quaker Oats for the nice time we had together. Finally, I
would like to thank my friends and family for the support and discussions during my complete study
and my girlfriend for believing in me and the project.
Bryan Vlaming
Rotterdam, April 2019

VI
List of used figures Figure 1: Quaker its machines (simplified) ............................................................................................ 13
Figure 2: Problem cluster ...................................................................................................................... 14
Figure 3: Structure of the maintenance department ............................................................................ 21
Figure 4: Vicious circle of Quaker Oats' maintenance ........................................................................... 22
Figure 5: Maintenance policy decision tree .......................................................................................... 36
Figure 6: Downtime distribution 2018 .................................................................................................. 43
Figure 7: Example cost justification from PepsiCo (PepsiCo, 2011) ...................................................... 49
Figure 8: Maintenance policy decision tree for Quaker Oats ............................................................... 52
Figure 9: 'License plate' of the CMK9 .................................................................................................... 60
Figure 10: Part of the SAP layout of Verpakkingslijn 2 .......................................................................... 61
Figure 11: Part of the new layout .......................................................................................................... 61
Figure 12: Identifying machines with your phone................................................................................. 63
Figure 13: An average hand-made notification ..................................................................................... 66
Figure 14: Roadmap of the maintenance concept and data improvement plan .................................. 71
Figure 15: Problem cluster .................................................................................................................... 75

VII
List of used tables Table 1: Maintenance tasks with MFA ................................................................................................... III
Table 2: Division of completed orders .................................................................................................. 29
Table 3: Causes of breakdowns ............................................................................................................. 30
Table 4: Performance measures............................................................................................................ 43
Table 5: Systems of the machines ......................................................................................................... 44
Table 6: Rating scales ............................................................................................................................ 47
Table 7: FMECA with failure mode on which we focus ......................................................................... 48
Table 8: Chosen actions for the failure modes ...................................................................................... 53
Table 9: FMECA with MFA steps............................................................................................................ 56
Table 10: Proposed maintenance concept with MFA ........................................................................... 74
Table 11: Failure modes with maintenance actions .............................................................................. 85

VIII
Abbreviations AM Autonomous maintenance BCM Business-centred maintenance CBM Condition-based maintenance CM Corrective maintenance D Detection DOM Design out maintenance OEE Overall equipment effectiveness FBM Failure based maintenance FLM Front line manager FMEA Failure mode and effect analysis FMECA Failure mode, effect and criticality analysis LBM Load-based maintenance LCC Life cycle cost MCC Most critical components MIS Most important systems MFA Maintenance feedback analysis MTBF Mean time between failure MTTR Mean time to repair NASA National Aeronautics and Space Administration PM Preventive maintenance O Occurrence OEM Original equipment manufacturer RBM Risk-based maintenance RCM Reliability centred maintenance RPN Risk priority number S Severity SET Site expert trainer TBM Time-based maintenance TD Technical Department TPM Total productive maintenance UBM Usage-based maintenance USBM Usage severity-based maintenance

IX
Table of Contents Management summary ........................................................................................................................... II
Preface ..................................................................................................................................................... V
List of used figures .................................................................................................................................. VI
List of used tables .................................................................................................................................. VII
Abbreviations ....................................................................................................................................... VIII
1. Introduction ....................................................................................................................................... 13
1.1 Quaker Oats ................................................................................................................................. 13
1.2 Context of the problem ............................................................................................................... 14
1.2.1 Planning and executing maintenance .................................................................................. 15
1.2.2 What does Quaker Oats want? ............................................................................................ 15
1.2.3 Why is reducing the downtime important? .......................................................................... 16
1.3 Availability of data ....................................................................................................................... 16
1.4 Research objectives and questions ............................................................................................. 17
1.4.1 Research questions and research activities .......................................................................... 17
1.5 Scope of the research .................................................................................................................. 19
1.6 Planning and report structure ..................................................................................................... 19
2. Current Situation ............................................................................................................................... 21
2.1 Involved people and their roles ................................................................................................... 21
2.1.1 The maintenance department .............................................................................................. 21
2.1.2 OEMs (external parties) ........................................................................................................ 23
2.1.3 Execution of production ........................................................................................................ 24
2.1.4 Production planning ............................................................................................................. 25
2.1.5 Quality .................................................................................................................................. 25
2.2 Machines involved ....................................................................................................................... 26
2.3 Input of the planning ................................................................................................................... 26
2.3.1 Reactive ................................................................................................................................ 27
2.3.2 Preventive ............................................................................................................................. 27
2.4 Maintenance planning process ................................................................................................... 28
2.5 Conclusion ................................................................................................................................... 30
3. Theoretical framework ...................................................................................................................... 32
3.1 Planned maintenance and downtime ......................................................................................... 32
3.2 What types of maintenance are there? ...................................................................................... 33
3.2.1 Repair ................................................................................................................................... 33
3.2.2 Prevent/retain ...................................................................................................................... 34
3.2.3 Improve ................................................................................................................................ 35

X
3.3 How to choose between the types of maintenance? ................................................................. 35
3.4 Replacement strategies ............................................................................................................... 36
3.5 Maintenance concepts ................................................................................................................ 37
3.5.1 Developing a maintenance concept ..................................................................................... 37
3.6 The framework ............................................................................................................................ 39
3.7 Conclusion ................................................................................................................................... 40
4. Model construction ........................................................................................................................... 42
4.1 Identification of objectives and resources .................................................................................. 42
4.2 Technical analysis ........................................................................................................................ 43
4.2.1 Systems of the machines ...................................................................................................... 43
4.2.2 FMECA .................................................................................................................................. 44
4.3 Maintenance policy decision and parameter optimisation ........................................................ 49
4.4 Performance measurement ........................................................................................................ 54
4.5 Continuous improvement ........................................................................................................... 55
4.6 Verification and validation .......................................................................................................... 57
4.6.1 Verification of the maintenance concept ............................................................................. 57
4.6.2 Validation of the maintenance concept ............................................................................... 57
4.7 Difference from the current concept .......................................................................................... 57
4.8 Conclusion ................................................................................................................................... 58
5. Improving the data ............................................................................................................................ 60
5.1 Machine structure ....................................................................................................................... 60
5.2 Order registration ........................................................................................................................ 62
5.2.1 The order process ................................................................................................................. 62
5.2.2 Order quality ........................................................................................................................ 64
5.3 SAP usage .................................................................................................................................... 67
5.3.1 Operators ............................................................................................................................. 67
5.3.2 Engineers .............................................................................................................................. 67
5.4 Conclusion ................................................................................................................................... 67
6. Implementing the maintenance concept .......................................................................................... 69
6.1 Conclusion ................................................................................................................................... 70
7. Conclusions and recommendations .................................................................................................. 72
7.1 Conclusions ............................................................................................................................ 72
7.1.1 How is maintenance currently done for the machines at Quaker Oats? ............................. 72
7.1.2 What are the requirements for the design of a maintenance concept based on literature
research? ....................................................................................................................................... 72

XI
7.1.3 What improvements are needed to close the gaps between the current situation and the
literature? ...................................................................................................................................... 73
7.1.4 How can we verify and validate the maintenance concept? ............................................... 74
7.1.5 What are the necessary steps to come to a maintenance concept? ................................... 74
7.2 Further research .......................................................................................................................... 75
7.3 Discussion .................................................................................................................................... 75
Bibliography ........................................................................................................................................... 77
Appendix A ............................................................................................................................................ 81
Appendix B ............................................................................................................................................ 82
Appendix C ............................................................................................................................................ 83
TPM ................................................................................................................................................... 83
RCM ................................................................................................................................................... 83
Appendix D ............................................................................................................................................ 85

12
Intentionally left blank

13
1. Introduction In this thesis, a framework is suggested to determine the maintenance needs for machines and set out
corresponding actions for a machine in the factory of Quaker Oats. This Chapter discusses the
background of the research. It describes Quaker Oats and its problem. Section 1.1 gives a description
of the company, which helps to bring the problem in context. Section 1.2 describes the context of the
problem which will be studied. Section 1.3 describes what data is available for the research. Section
1.4 explains the objective of the research, states relevant questions, how the questions are going to
be answered and what the deliverables are. Section 1.5 outlines the scope of the research. In Section
1.6 the steps are set out how to answer the research questions. Section 1.6 also states how the thesis
is structured.
1.1 Quaker Oats Quaker Oats is a production company which makes breakfast cereals and is situated in Rotterdam.
Quaker Oats is established in 1888 by the seven big oat producers in America (Quaker Oats, 2018).
Since 1896 a sales office is opened in Rotterdam and a manufacturing facility has opened in Rotterdam
since 1935 (Quaker Oats, 2018). Breakfast cereals are still produced nowadays in the facility built in
1935. There are three production lines consisting of multiple machines like an oven, dosing machine
and packaging machine, as shown in Figure 1. The factory is divided into sections, orange blocks are
part of the process section and from there it is called packaging. The green block indicates the scope
of the research. Two lines (line one and two) produce the standard sack-in-box product, while the third
line (line three) produces sacks. The sacks do not go into a consumer box, which is why the packing
machine is skipped. For line 3 to
function, line 1 must be stopped
since they use the same
bagmaker. Resources enter the
facility as oats, wheat, barley,
spelled, rye and additives like
sugar, honey, chocolate, etc. Part
of these resources are crushed,
mixed and cooked. Ingredients
like chocolate, raisin or other
fruits are later added to the mix.
The mix is placed in sacks and
boxes for line 1 and 2, placed in a
transport box, set on a pallet and
sent to shops. Quaker Oats has
eight different basic product
mixes and 31 additives (nuts, fruit,
chocolate, etc.). Besides the
mixes, there are ten different
package sizes.
In 2001 Quaker Oats was taken over by PepsiCo, where it is a part of the industry Juices and Grains.
PepsiCo has two other manufacturing facilities in the Netherlands besides Quaker Oats, namely Lay’s
Chips & Smiths Snack in Broek op Langedijk and Duyvis in Zaandam. The headquarters of PepsiCo is
situated in Utrecht. From the 630 people working at PepsiCo Nederland roughly 70 people are working
at Quaker Oats. Quaker Oats in Rotterdam delivers to nine different countries but has insufficient
Figure 1: Quaker its machines (simplified)

14
capacity to fulfil all demand because of its size. That is why there is also a co-packer of Quaker active
in Poland, which supplies surrounding countries.
1.2 Context of the problem Quaker Oats has the problem that machines fail too often during production, 3,5% of the time instead
of 2,2%. The machines are planned for production and cleaning, while the time for maintenance can
be requested. Engineers complain that seldom time is made free for maintaining the machines, which
is according to them the main cause that maintenance cannot be executed and as a result, machines
break down during production. The main causes of the technical downtime are shown in Figure 2 and
will be worked out in Chapter 2 of the thesis. The percentages are an indication of how much
downtime, expressed in a percentage of the total downtime, is related to certain causes and are based
on the 60 most recent breakdowns. The main contributor to downtime seems to be material issues,
with a close second being machine error. Material issues are being solved by other parties. Operator
errors are not further analysed such that we can narrow the scope of the research. When we look at
the amount, instead of time, of orders related to production interruptions, see Table 3 in Section 2.4,
machine downtime is the main contributor. There are multiple reasons for this of which the focus lies
on the absence of a maintenance concept1 in which the tasks and frequencies are described. A many
heard complaint from engineers about why maintenance is postponed is that they cannot work when
machines are running. But maintenance is also not executed due to the priorities of the TD. During the
shifts, machines are running or standing still during cleaning or a changeover. The TD does not prioritize
tasks on the than waiting machines. The tasks are too general to specify a time for, which makes it
difficult to plan and execute the tasks. Per week roughly a full shift is used on downtime caused by the
machines.
The machines are producing 24 hours a day for five days a week, there is no production in the weekend.
Engineers and Quaker Oats prefer that no maintenance is done in the weekends since Quaker Oats
must pay 200% for the salary of the engineers and engineers enjoy their weekend. Maintenance in the
weekend is however budgeted for a couple of days and as an emergency solution, maintenance in the
weekends is possible. Daily production is done in three shifts of 8 hours; a morning, day and night shift.
On 10% of the days during the
day shift, two engineers are
present, while for the rest only
one engineer is present. The
engineers are called
breakdown engineers by
Quaker Oats, coming from the
early days when engineers
were to repair machines
instead of keeping them
running. There is a minimum
amount of kilogram that needs
to be produced per week for
the factory to be profitable.
Due to planning at a low
efficiency of machines, it
happens that the planning is
1 A maintenance concept is defined as information, policies and procedures for the optimal maintenance of a machine
Figure 2: Problem cluster

15
finished before the planned end. In this case, the remaining time will be used for cleaning, maintenance
or other non-production tasks. Most of the time the factory is planned to produce its maximum
capacity and there is no time for preventive maintenance because of the high level of corrective
maintenance. The position of the Maintenance department is not strong enough to convince other
departments of the need for maintenance because they lack an argued maintenance plan and cannot
estimate the impact of maintenance due to missing data.
1.2.1 Planning and executing maintenance The maintenance activities are planned by the work planner. He plans the maintenance in accordance
with the maintenance plan made by the maintenance specialist. For most machines, there is no
maintenance plan. The engineers of the Technical Department (TD, from the Dutch words Technische
Dienst) or an external party executes the maintenance. Quaker Oats has service contracts with original
equipment manufacturers (OEMs). These contracts include a yearly check, the OEM has a checklist and
Quaker Oats can point out extra checks, and service of the machines. Quaker Oats has engineers that
have the expertise to partly service the machines. Maintenance tasks that cannot be executed by the
engineers, because of for instance the skill level required, are done by the OEMs once a year per
production line. To inspect and execute (preventive) maintenance on the machines, Quaker Oats has
two weeks per year in which no production is planned, only maintenance. It seems that outside these
two weeks not much preventive maintenance is executed on the machines because of the lack of a
clear plan and time. Maintenance is mostly planned based on experience and adjusted (by Quaker
Oats) with information from the manufacturer (based on calendar time/operating hours), while
breakdowns are reported by people working with the machines (operators) and solved directly or
planned if they can wait, since not all breakdowns directly influence the production process.
Around 22% of the maintenance on the packing machines is planned, this can be viewed quite broadly.
Planning can also mean that a task is planned to happen the next day or week and the part is already
defective, but the production can continue without the part. Planned maintenance does not result in
technical downtime since only breakdowns cause technical downtime. Technical downtime is the time
that a machine is not producing during production which is caused by mechanical errors. The
maintenance that is executed by external parties is difficult to plan since they work with their own
time schedule. Quaker Oats needs to plan up front when the revision weeks take place. Other
challenges when planning maintenance are the diversity of machines, the time pressure created by
the production planning, the availability of people, lack of reliable data to estimate durations and poor
communication. This makes it important to know what to service and when such that a clear plan can
be communicated and people and materials can be planned accordingly. Quaker Oats wants to use a
condition monitoring program to keep track of the state of machines, but Quaker Oats is a long way
from actively using condition monitoring to improve the uptime of the machines. Inspections are not
executed as planned or skipped and when faults are seen, they are seldom communicated. When they
are communicated, tasks are set out to replace the soon to fail parts. Machine stops, like changeovers,
cleaning and early stops caused by overproduction, may be moments for maintenance. This is not used
yet because of the unavailability of people, parts, lack of knowledge about maintenance tasks and lack
of communication.
1.2.2 What does Quaker Oats want? Quaker Oats has set several goals that must be met. One of the goals is that Quaker Oats strives for a
maximum technical downtime of 2,20%. Errors caused by quality issues of the product, like bad master
carton, do not cause technical downtime, but ‘regular’ downtime. Machines that run slower than
planned, no matter the reason, do not contribute to technical downtime. The process, the making of
the Cruesli from the raw products, has a maximum technical downtime of 0,70%, while the packaging

16
has a maximum downtime of 1,50%. This means that 1,50% of the total production time, the packaging
machines are allowed to stand still due to technical faults. On average in 2018 the technical downtime
for the process is 0,86% and for the packaging 2,64%. Calculated to Euros, this costs roughly €100.000,-
per year. Most of the technical downtime is caused by the packing machines, which will therefore be
the focus of the thesis. A breakdown of a packing machine usually results in an hour of technical
downtime, while it takes the engineer on average half an hour more to solve the issue. Solving the
hour usually takes longer because of cleaning, testing and registering data. Sometimes breakdowns
can easily be fixed, although the core problem is not solved. Quaker Oats aims to reduce the technical
downtime to its target values and transition to a sustainable environment where breakdowns are
prevented.
1.2.3 Why is reducing the downtime important? The factory in Rotterdam is the biggest factory that supplies Cruesli in Europe and therefore it is
important that the machines are reliable. Besides the fact that technical downtime reduces the
availability and reliability of the machines, it also results in lost sales or overtime, idling labour, material
waste and unplanned maintenance costs. It is estimated that corrective maintenance (CM) is three
times as expensive as preventive maintenance (PM) (Mobley, An Introduction to Predictive
Maintenance, 1990). The technical downtime is a problem because of the costs resulting from this and
the production being interrupted.
1.3 Availability of data Data about machine specifications are gathered from OEMs and data about maintenance tasks and
plans are stored in SAP. SAP is introduced in 2009 but used and filled with data only since 2017. Data
includes what is serviced and when (not for all machines), unstructured sections of the machine,
functional locations do not correspond with the factory layout, where engineers can assign their
maintenance activities on and work orders and notifications, where working time, breakdown
duration, activities, what type of damage there is and its cause, etc. are partially recorded. Operating
hours until the failure is not, while operating hours are tracked by the machine. We see that (frequent)
breakdowns are seldom analysed and the data to do so, like causes and damage, lacks in SAP. The
information in SAP about a breakdown (or maintenance task) is limited. This is mainly because of the
lack of a detailed description of the cause, what happened before the failure and the steps that are
done to solve the issue. SAP is used as an hour justification tool rather than a maintenance tool and
engineers are judged on the hours that they justify. Engineers also write what they did in an Excel file,
the TD log. This is labour-intensive and redundant. This Excel file has the same function as SAP, but
dates back from the period before SAP is used (pre-2017). It is still in use because of the fear that
engineers do not fill in SAP completely. This fear has valid reasons. It is visible that SAP and the TD log
do not match. The duration and technical downtimes differ between the two and it is unclear which
one is correct, sometimes SAP and sometimes the log. The quality of the data is not optimal in both
systems, which causes problems with the analysis in this thesis. For example, the duration of technical
downtime, starts, stops and actual work hours are not correctly filled in, orders are double or set as
complete when they are cancelled. The main reasons for these points are that operators and engineers
do not see why it is necessary to correctly fill register maintenance orders and breakdowns, engineers
fill it in at the end of their shift, there is an overall limited amount of knowledge about SAP and the
machine structure is SAP is not user-friendly nor correct. The causes of the breakdown and the damage
are mostly correctly noted, if noted, in SAP in predefined categories, but not how the breakdown is
tackled and not linked to components or section of the machine. In the TD log engineers do not note
the cause of the breakdown in predefined categories but in plain text where they describe what
happened and how they solved it, this usually matches SAP. During the thesis, we tried to improve the
registration by stating what information we needed to create a maintenance concept, like the

17
frequency of failures, type of failures and duration. We also made a distinction between failures caused
by humans, protocol, material and the machine. More and more attention was paid to correctly fill in
SAP. Unfortunately, the data quality is still far from optimal. To cope with missing data or incorrect
data, meetings with the engineers and work planner are carried out and a proposal to correctly fill in
SAP is submitted to the engineers. After the proposal, an increase in data quality is visible, although
not as much as wanted, which is why in Chapter 5 more research is done to improve the data. It was
not possible to further increase the quality of data during the thesis due to other priorities of engineers
and management.
Both datasets are not perfectly reliable but in this thesis SAP is mainly used because it has all the
maintenance orders, while the TD log focusses on corrective orders, SAP is better to perform analysis
with since the TD log only has information about how long something takes and what the cause was
and the log is more a notepad than administrative tool. So, SAP has more details about the work activity
and the data in SAP is linked to maintenance requests made by the operators. Sometimes data is
missing in SAP, like how problems are tackled, this is then gathered from the TD log if available. Roughly
95% of the orders in the TD log are also in SAP.
1.4 Research objectives and questions The machines of Quaker Oats cause too much downtime during production. This downtime negatively
influences the execution of the planning and costs money. The goal of this research is to decrease the
technical downtime by creating a maintenance concept and therefore determining the maintenance
needs of machines. We expect that this will result in an increase in production time and benefit the
execution of the planning since the maintenance concepts are set up to prevent failures. Quaker Oats
wants to have a maintenance concept that indicates when and what maintenance to do. This concept
should be a pilot and later Quaker Oats should be able to make the same steps to create a maintenance
concept for other machines and continuously improve the maintenance concept(s). The concept
should minimize technical downtime and makes sure that Quaker Oats efficiently and effectively
makes use of its resources, this is done by doing maintenance tasks preventive instead of reactive. It
should consider that maintenance can be done when machines are (unexpectedly) not operating and
therefore tasks need to be listed with the expected amount of work. It is therefore important to know
what maintenance should be done and when maintenance should be executed to reduce the
interruptions of the production process. For that reason, the maintenance activities and planning
should be well fit for the machines. This research will focus on the maintenance concept. This means
determining maintenance needs and making choices between maintenance policies and strategies.
This can be achieved by answering certain research questions, which are listed below. The planning
when the questions will be answered and the steps to answer the question are discussed in Section
1.6.
1.4.1 Research questions and research activities The first step is a thorough analysis of the current maintenance concept and the causes of technical
downtime. It serves as input for question two, so we know what to look for in the literature. The goal
of this step is creating insight in what tasks exist, how they are performed, planned, what the result of
the tasks is in terms of technical downtime and what the causes are of the downtime. All to determine
where the potential for improvement lies. The first question is therefore:
1. How is maintenance currently done for the machines at Quaker Oats?
To answer this question, the maintenance specialist, engineers and people from the TD are observed
and interviewed as well as people from production. We analyse work instructions about making the
planning and the TD log and SAP data are analysed to find out what causes the downtime and what

18
engineers do. The same question will be asked to different people to validate the answers and not bias
the research. A complete background analysis is performed where for instance information about the
distribution between planned and unplanned maintenance, the different causes of downtime are
gathered and what is done in terms of PM.
The second step is to find out what the literature says about methods to perform and plan
maintenance and creation of a maintenance concept. The goal of this step is to find improvements for
the current situation of Quaker Oats and choose the right method to improve the current situation.
The question matching this is:
2. What are the requirements for the design of a maintenance concept based on literature
research?
To answer this question, literature research is performed where it will be researched how to plan
maintenance in the situation that Quaker Oats is in. Different techniques, methods and information
about maintenance are collected and compared to come up with the best method. This is necessary
to improve the current way maintenance is done. Academic articles, theses and books about
maintenance approaches will be used to research methods to improve the situation.
In the third step, the gap between the situation according to literature and the current situation is
analysed and a method that reduces the technical downtime is developed for Quaker Oats. From
question one the cause of the technical downtime is known, question two proposes a method to
reduce the downtime. The method following from question two needs to be developed for Quaker
Oats. The goal of step three is to develop a method that reduces the technical downtime. This leads to
the following question:
3. What improvements are needed to close the gaps between the current situation and the
literature?
To answer this question, both qualitative and quantitative data about technical downtime and the
production schedule of past years are used. This data will be used for the methods to reduce the
breakdowns which cause the technical downtime. From question two data of methods to reduce the
technical downtime is gathered, from question one information about the maintenance on the
machines, their downtime, the planning and realization of the production planning is gathered. The
maintenance concept will be made based on the literature and should consider the production and
maintenance stakeholders. This concept also needs to be verified and validated by discussing it with
multiple engineers.
The next step is thus to verify and validate the maintenance concept from question three. The goal of
this step to make sure that the proposed approach has the desired result and can indeed be used to
improve the situation. The question that belongs to this step is:
4. How can we verify and validate the maintenance concept?
To answer this question experts are consulted about the proposed maintenance activities. This
involves multiple departments.
The last step is to start the implementation of the maintenance concept for all the machines. The goal
of this step is to implement the concept and create a concept for more machines. Otherwise, the
concept would have no effect. This is where question five comes into place:
5. What are the necessary steps to come to a maintenance concept and improve a
maintenance concept?

19
To answer this question, we analyse case studies and use our own experience and involve the TD.
Question five helps Quaker Oats to implement the maintenance concept and give Quaker Oats a
guideline to implement the maintenance concept.
1.5 Scope of the research The scope is limited to two packing machines that account for the most technical downtime. It is
advised to first develop a maintenance concept as a pilot to educate involved persons (Waeyenbergh
& Pintelon, 2009), which is what we will do. The machines are the CMK9, which is part of line two, and
the Vento, which is stationed at line one. The two machines account for one-third of all the downtime
and Quaker Oats finds the need to improve the reliability of the machines important. These machines
serve as an example to show what is possible with an improved maintenance method and for validation
of the maintenance concept. These machines are described in Appendix A. We assume that the failure
behaviour of machines in the future will be the same as in the past although this is not true (Pham &
Wang, 1996; Tinga, 2010). However, even with this assumption, great improvements can be made.
Due to timing constrictions, we analyse two machines, but create a basic maintenance concept for one
machine. We will not focus on the planning of people, materials and tasks, but on what is necessary
for the machines to work. Part of the focus will also lie on getting the rest of the company, like the
management and production team, on board for the maintenance concept so it does not stay with a
plan, but it is also possible to execute the plan. This means that insight into the effect of maintenance
needs to be created. It is assumed that when a machine runs, it has the technical capability to run at
maximum performance, this means that a machine is either working perfectly or is not working at all.
A result of this is that the state of the machine, and therefore the TD, only influences its ability to
operate or not. We also assume that work orders registered in SAP that do not have actual work hours
are cancelled instead of completed.
1.6 Planning and report structure The five research questions are answered during the graduation assignment. In Section 1.4 it is stated
what should be done. A global planning with the necessary steps is discussed in this section. At the end
of every chapter, a conclusion of the chapter can be found in which the most important points of the
chapter are listed and explained.
Question one describes the current situation and is handled in Chapter 2 Information from interviews
is gathered, as well as data from the TD log and from SAP. Most interviews take half an hour to an
hour. The task is then to process and check the information and gather missing data. The questions
that arise when processing the interviews, can be answered with a follow-up interview and/or with
data analysis. Engineers are followed on their working shift and the operating team, people that
operate and oversee the production, to check certain findings and gather more information from
different angles. The data from SAP and the TD log is used to determine the seriousness of the problem
and where and when the problem occurs. Steps needed to answer this question are:
- Interview preparation;
- Interview TD;
- Interview people from Finance, Production and Quality;
- Interview the process, maintenance and packaging specialist;
- Interview operators;
- Process interviews;
- Work with operators and engineers;
- Investigate the changeovers;
- Investigate the cleaning process;

20
- Analyse data from TD log and SAP;
Question two is answered after that and is discussed in Chapter 3. It consists of literature research
where sources like PhD theses, academic articles and books are analysed. The literature is (made) fit
for Quaker Oats’ situation. Literature is used to find methods to improve the current situation. Multiple
methods are found while a method needs to be chosen to continue with. Steps needed to answer are:
- Determine what to look for;
- Find appropriate literature;
- Study the found literature;
- Find improvement methods;
- Choose an improvement method.
Question three and four are answered in Chapter 4, while question three is answered from a different
perspective in Chapter 5. The framework from the literature research is worked out in Chapter 4 and
steps on how to validate the maintenance concept following from the framework is given. The steps
to answer these questions are:
- Determine the goals of the framework;
- Create a decomposition of the machines;
- Analyse one machine using a failure mode, effect and criticality analysis;
- Determine the maintenance tasks, policies and strategies;
- Verify and validate the maintenance concept;
- Advice how to measure the performance of the maintenance concept;
- Determine what is necessary to improve the maintenance concept;
Once the maintenance concept is finished, a plan to implement the maintenance concept needs to be
made. This is done by answering question five. To implement the maintenance concept, tasks in SAP
must be created. The plan can be tested on the machine to check the effect of good maintenance, this
plan should later be created for multiple machines in Quaker Oats. Steps needed to answer this
question are:
- Creating a plan to implement the maintenance concept;
- Implement the maintenance concept on the machines;
- Write a plan to create and implement a maintenance concept on other machines.

21
2. Current Situation In this chapter, the current situation of Quaker Oats will be described and we introduce the two
machines which will be analysed. The goal is to know how maintenance on these two machines is
performed and why. In Section 2.1 the departments who are involved with maintenance are discussed.
Section 2.2 describes the machines that the research will focus on and gives and some information
about technical downtime. In Section 2.3 the input of the planning for OEMs and Quaker Oats’
engineers is given and it is described how maintenance activities end up in the task list of engineers.
Section 2.4 describes the process of planning maintenance. Section 2.5 concludes Chapter 2 with
conclusions from all the sections and answers research question one.
2.1 Involved people and their roles Multiple departments and people are involved in the planning and execution of maintenance. To give
an idea of how the processes in Quaker Oats are executed and planned, the departments will be
introduced. The departments have maintenance related issues, which we state here. The TD obviously
has a crucial role, but also OEMs, the Production and Quality department have an influence on the
maintenance that is planned and executed. They will all be discussed in this section, starting with the
Maintenance department of which the TD is a part.
2.1.1 The maintenance department There is a distinction between the Maintenance department and the TD. When mentioning the TD, the
maintenance supervisor and maintenance specialist are not included. The hierarchy of the department
is pictured in Figure 3 and will be explained in this part of the section. The department consists of nine
employees. The head of the Maintenance department is the maintenance supervisor. All employees
of the department (in)directly report to him. His task is to manage the department and make sure that
the plant is in an acceptable condition (Christer & Whitelaw, 1983). He focusses on the strategic part
of the department but is present in operational briefings and involved in tactic decisions made by the
maintenance specialist. KPI’s include the amount of technical downtime, utilization of engineers, a
division of preventive and corrective maintenance, produced amount of product (kg) and more. The
maintenance specialist creates the maintenance concept and works on a tactical level. There are
maintenance concepts for some machines, while most do without. It seems that newer machines have
received a maintenance concept. The reason is that the Maintenance department wants to have a
good start when introducing the machines to the factory. Some maintenance concepts are created to
fill the system to meet PepsiCo requirements and do not contribute or match the maintenance needs
of the machine. The purchaser buys the
necessary parts to execute maintenance and
makes sure that the inventory of spare-parts
is managed. Quaker Oats’ operational
maintenance activities are managed by the
work planner. In consultation with the OEM’s
the maintenance of the factory is planned.
The engineers and electrician execute the
maintenance, react to breakdowns and help
operators by setting up the machines.
Maintenance done by Quaker Oats’
engineers ranges from hanging up signs to revising machines. Depending on the required skill, some
maintenance is performed by the OEM. Maintenance is done on machines, electrical equipment, water
pipes, air and other building related activities. This means that engineers need and have a wide variety
of knowledge. We see that not every engineer has the capabilities to do all the tasks and some tasks
Figure 3: Structure of the maintenance department

22
need to be done by certain engineers. The engineers and electrician take care that the planned work
is executed and they respond to breakdowns. According to total productive maintenance techniques
(TPM) (Chan, Lau, Ip, Chan, & Kong, 2005) engineers should:
- restore deterioration thoroughly and accurately, using inspections, condition monitoring and
overhaul;
- clarify operating standards by tracing design weaknesses and making appropriate
improvements;
- enhance maintenance skills for check-ups, condition monitoring, inspections, and overhaul.
Unfortunately, most of these tasks are not performed due to lack of resources, like a maintenance
concept that fits the needs of the machine and time, not executing preventive maintenance and the
focus on corrective maintenance. Engineers react to breakdowns and there is no research performed
on faults or inspections on machines if they are close to failure.
During the day there is one engineer that is part of the working shift, this engineer needs to respond
to breakdowns and perform maintenance. On roughly 10% of the working days, the fourth engineer
works as a second engineer on one of the shifts. His task is to do maintenance instead of reacting to
breakdowns. Due to sickness and off days, the fourth engineer usually replaces the sick or off engineer
instead of being a second engineer in the shift. This creates the wish of the TD for another engineer,
so he can solely focus on condition monitoring and preventive maintenance. We see two things: the
first being that moments for preventive maintenance, like changeovers and early finishes, are
uncommunicated between Production and Maintenance and therefore unused. The second engineer
could be more effectively utilized if those moments were used and priorities were set to maintain
machines that usually operate, we will later elaborate this. The second thing we see is that engineers
spend ±75% of their time fixing breakdowns and ±4% on preventive maintenance and the rest is not
registered. Their time could be more efficiently used if they did not have to spend so much time on
CM and helping operators and spend more time on PM. It would help engineers if they knew their
tasks and used the opportunities to execute the tasks. It is difficult to work on some machines, since
they operate non-stop and engineers can be interrupted by a breakdown when they perform PM. The
last reason is the main reason according to the engineers that maintenance is not executed during
production.
The TD is stuck in a vicious and reactive circle, see
Figure 4. They do not execute PM because they do
not have the time, knowing what to do and people,
this is because they need to react to breakdowns
and have a poor administration of maintenance
orders. They must react to breakdowns because
they cannot predict breakdowns, which in turn is
the result of the missing data necessary to predict
breakdowns. As explained in Section 1.3, the
database of the TD misses the cause, damage,
duration, frequencies and a clear description of
breakdowns. This is one of the reasons which they
cannot create a preventive maintenance plan, this
can be tackled by using qualitative knowledge.
Breakdowns are almost never analysed, problems
are frequently solved by resetting the machine.
The registration afterwards does not include why Figure 4: Vicious circle of Quaker Oats' maintenance

23
the machine needed a reset and what happened close before the reset. In other words, the TD fights
the symptoms, not the cause(s).
During a breakdown, when the complete line behind the machine is usually waiting for products, and
when there is a second engineer available, no other maintenance is executed. There is no priority for
maintenance on machines that normally cannot be serviced when they are running. Tasks that can be
done when machines are running are equally important as tasks that can only be done when machines
stand still. This while standstill is a perfect opportunity for maintenance. Another point why these
opportunities are not used is because engineers do not take the initiative and the work planner is not
informed.
The maintenance department is briefed about the past 24 hours at the start of the day. The engineers
brief each other during a change of shift. Two times a week during the briefing it happens that an
engineer did not know what the previous engineer did. The explanation of tasks in the TD log and in
SAP is insufficient, see Section 1.3. The data that is filled in, is filled in at the end of the shift. This
creates error, which can be minimized by recording the information during or shortly after the time of
the breakdown (Christer & Whitelaw, 1983). Another issue is that people never had correct training
with SAP and lack the motivation to train themselves since they do not see the added benefit of a
maintenance database. A result of this is that SAP is not correctly set up and filled in correctly by the
engineers and operators. During the briefing, the focus lies on solving breakdowns and discussing them
instead of preventing breakdowns, partly because the information about failures is not as complete as
it needs to be. During the briefings it became clear that of all the orders engineers execute, 25% of
them are operator tasks, changing machine settings like speeds and positions of parts. This is mainly
due to the inferior quality of materials, for instance, due to deviations in the height of the master
carton. Because of this, the machine needs to deviate from standard settings.
2.1.2 OEMs (external parties) When the engineers and/or electrician of Quaker Oats cannot perform the required maintenance due
to skills, it is more efficient to involve an external party or when design changes are necessary, an
external party is involved. This is supposed to be two times a year during a so-called revision week; At
the beginning of the year line one goes out of production for a week and at the end of the year line
two goes offline for a week. Another week for line three is not necessary since most of the time line
three is not used. Line three can only make a certain product that does not have enough demand to
keep the line producing for a prolonged time. See Section 1.1 and/or Appendix B for a description of
the lines. The period after maintenance is done by the OEM is followed by a period of increased failures
due to not testing the machine with products. During the revision period, there is no production and
it is often decided not to test with real products because of the related costs. Not testing the new parts
and software updates with real products, result in breakdowns. It is required that the machines are
calibrated and tested. When production starts, the OEM is on site to perform the final adjustments,
but this obviously slows down production. For the CMK9 all the revisions are done by Quaker Oats’
engineers throughout the year. A former employee of the manufacturer of the CMK9 works at Quaker
Oats and can perform the maintenance. For the OEMs to know what maintenance to execute in the
revision week, checks are executed.
Quaker Oats has a service contract with the OEM of the Vento. This means that they have on-site
support and can call the OEM whenever necessary. The support is used could be used when operating
hours are reached earlier than at the revision weeks, but they are not checked because of the
corrective focus of the TD. The OEM is usually informed when breakdowns are so severe that they
cannot be solved by the TD. The OEM of the Vento comes to fix breakdowns in roughly 4% of all
breakdowns. Quaker Oats does not have a strong position towards the OEM since they cannot define

24
the cause of problems. As the OEM points out, the machine might not be at fault, but the material is
out of its specifications, see Section 2.1.5. Things the OEM notices are that the machine is not cleaned
and regular maintenance from the user manual of the machine is not performed. A difficulty when
planning the OEM maintenance is that they need to be planned roughly three weeks in advance, this
is however only necessary for problems that do not directly have to be solved or revision related
maintenance. The OEM could further improve the machine such that there is less stand still, but there
is a lot of variation in the input of the machines, see Section 2.1.5.
2.1.3 Execution of production The production team works in the same shifts (teams) as the engineers. The team consists of operators,
site expert trainers (SETs), an engineer and a frontline manager (FLM). The operators operate, set up
and clean the machine. They, especially the temporary workers, have received technical training of
machines neither is technical knowledge a requirement to work with the machines. This is a choice to
keep costs of operators low. This results in limited knowledge about the machines. Operators also do
not seem to feel responsible for the correct state of the machine as can be seen by the lack of will to
learn from engineers and rough handling. Opportunities for operators to learn about the machine,
when an engineer is repairing the machine, are seen as coffee breaks. These two things make it difficult
for them to deviate from standard settings to cope with variation in materials and determine if the
settings or the functioning of the machine is the problem. Because of this, engineers are called quite
often to fix problems that operators have caused or could have solved by adjusting machine settings.
Besides their knowledge, the TD prefers that operators do not touch the machine when it breaks down.
The TD wants to see for themselves what went wrong so they can solve the problem more easily. This
seems contrary to the earlier statement that engineers do not note down why the machine breaks
down and what happened before the breakdown, but there is a distinction between solving the
problem and the administrative task.
Cleaning by operators is done insufficiently, since there is little time and procedures are impossible to
fulfil in the given time, but also because the focus lies on producing as quickly as possible instead of
cleaning as good as possible. Following the standard operating procedure takes way more time than
available. Every time an (external) engineer comes to fix the machines, the first complaint is that the
machines are dirty. To limit the scope of the research, we did not further investigate this. In 2019 the
plan is that operators should be able to do first line maintenance; clean, lubricate, inspect and tighten.
According to total productive maintenance techniques, operators should (Chan, Lau, Ip, Chan, & Kong,
2005):
- maintain basic equipment conditions (cleaning, lubrication, bolting);
- maintain operating conditions (proper operation and visual inspection);
- discover deterioration, through visual inspection and early identification of signs of
abnormalities during operation;
- enhance skills such as equipment operation, set-up, and adjustment, as well as visual
inspection.
None of these requirements are met now. This shows that there is a lot to gain by improving the way
the operators work. A TPM idea is that operators should participate in the maintenance function to
prevent degradation of equipment (Yamashina, 1995). For this, the role of operators in equipment
operation, condition monitoring and maintenance must be acknowledged. When operators perform
maintenance tasks, this allows engineers to focus their energy on tasks requiring their technical
expertise and to learn about and use more sophisticated techniques for advanced manufacturing and
maintenance. Operators and maintenance personnel must reach mutual understanding and share

25
responsibility for equipment (Jostes & Helms, 1994; Ben-Daya & Duffuaa, 1995; Lawrence, 1999; Chan,
Lau, Ip, Chan, & Kong, 2005).
A SET supervises and helps the operators, is an expert in the processes that take place and can train
people. He also makes sure that standards are followed and communicates the way of work with the
FLM. In the future SETs should be able to solve basic breakdowns and maintenance tasks and repairs,
however the SETs also lack technical knowledge. The reason for this is that people are not trained for
it and have never done it. SETs or operators should call the TD in case of a (soon to happen) defect on
a machine, too often operators do not notify the TD about these defects or do not notify the coming
defects at all. The FLM is the team leader of the shift and has the responsibility that the production
planning is met. A FLM aids when making the production planning, manages the team and has contact
with the management. While SETs are busy with daily tasks, the FLM focusses on the longer term.
2.1.4 Production planning The long and medium-term production planning is made in England at PepsiCo. The short-term
schedule of the lines is made at Quaker Oats in Rotterdam. The line scheduler in Rotterdam is given a
number of kgs that needs to be produced in the coming eight weeks. The planning from England is
based on the capacity the line scheduler passes on to England. The capacity is predefined but can be
adjusted. The capacity is influenced by the quality and amount of the product (raw product to Cruesli
with additions) and the quality of materials. Capacity reductions, like planning a line for maintenance,
need to be announced eight weeks in advance so the external planner can incorporate it in the
medium-term production planning. The execution of the planning is solely the responsibility of the
FLM. It happens that lines are not producing. This can either be planned or unplanned. Opportunities
to do maintenance, like changeovers, are not known by the TD.
The line scheduler schedules the lines in such a way that changeover and cleaning times are minimized
while still planning the requested amount. The line scheduler discusses with the FLM and work planner
of the TD how the production schedule looks like. The line scheduler creates the schedule without
buffers, although line 3 usually stands still and when line 3 is running, line 1 is not running (since they
share the bagmakers). This happens a couple of days per month. Once a week the planning for the
next week is discussed with the TD. Time for maintenance activities can be requested and discussed at
this meeting. During the meetings, there are few maintenance requests from the work planner,
because of the lack of clear and correct maintenance tasks. The line scheduler then denies or approves
the request and passes it on for further approval. Sometimes “unplanned” maintenance opportunities
are announced during the meeting, this is however too late for the TD to react. They do not have a
clear plan of what to do in what time in terms of machine maintenance and planning one week ahead
is usually too late to involve external parties in maintenance activities. One of the reasons why there
is no clear plan is that almost no inspections are performed and the maintenance concept, if any, lacks
(details). It lacks tasks (descriptions), estimated time and documentation of how the maintenance
concept was created. Planning maintenance during changeovers based on the production schedule is
difficult since there is much deviation from the planning, this means that the moment when a new
batch starts, and thus when changeovers occur, cannot be planned at a certain time. Sometimes the
production is seven hours behind or ahead on the planning. During certain changeovers, the two
packing machines can stand still for more than an hour. Due to the poor communication between the
TD, operations, FLM and planning, opportunities are known late.
2.1.5 Quality Quality is responsible for cleaning and the quality of the product. Cleaning is a form of PM. To preserve
machines and guarantee their lifetime, they need to be cleaned. The quality department has the

26
responsibility that cleaning is correctly executed by the cleaning service and the operators. The
department makes standard operating procedures which need to be followed. Machines do not
operate during cleaning. This might be a good moment to do maintenance (since not all machines are
cleaned at the same time but all stand still). However, it needs to be considered that machines cannot
be cleaned and maintained at the same time. Cleaning happens at changeovers and at the end of the
week when production stops.
As said in Section 2.1.4 the quality of materials is also a point. Cartons must acclimatize after transport
depending on the temperature difference and should be stored at a certain humidity (Canon
Nederland N.V.). Cartons are not stored at a certain temperature or humidity at Quaker Oats. There
are a lot of problems with the carton and as a result, machines need to be adjusted to the cartons.
Machine OEMs sometimes will not help Quaker Oats with the argument that it is not their machine at
fault but the input materials.
2.2 Machines involved The Quaker Oats factory in Rotterdam is a small plant, as stated in Section 1.1. There are two machines
in the scope of this thesis. Figure 1 in Section 1.1 shows the simplified version of all the machines that
are operating at Quaker Oats and in Appendix B the function of the machines is described. The thesis
focusses on the two packing machines.
The factory is divided into two sections, process and packaging, see Section 1.1. Most of the technical
downtime comes from the section packaging. The percentage of technical downtime for packaging is
2,62% and 2,27% for 2017 and 2018 respectively. The machines in our scope are accountable for 1,5%
of the total technical downtime. The machines account for the most technical downtime of all
machines. The percentage of technical downtime is calculated using Equation 1.
Equation 1: Calculating technical downtime
𝑇𝑒𝑐ℎ𝑛𝑖𝑐𝑎𝑙 𝑑𝑜𝑤𝑛𝑡𝑖𝑚𝑒 (ℎ𝑜𝑢𝑟𝑠)
𝐴𝑣𝑎𝑖𝑙𝑎𝑏𝑙𝑒 ℎ𝑜𝑢𝑟𝑠∗ 100%
The average duration of the technical downtime for the packing machines is an hour. There are two
packing machines, called the CMK9 and Vento which cause the most downtime. There is a slight
difference of 10 minutes in the average downtime between 2017 and 2018, the average downtime is
lower in 2018. Between 2017 and 2018 no major changes in terms of maintenance have taken place,
but in 2018 the registration of maintenance tasks is improved. The overall downtime is much higher
than the 2,27% because the TD does not integrate downtime created by quality issues or operator
aspects in the calculation of the technical downtime. The materials the machine must process and how
the machine is set-up and used determines its maintenance needs and therefore indirectly contribute
to technical downtime. The machines are subject to a variable use and loads due to the input quality.
The speed ranges from 100 cartons per minute to 150 cartons per minute all with different cartons in
terms of quality and weight. This variable use makes it more difficult to predict the maintenance needs
than on a constant load.
2.3 Input of the planning The planning is made based on the incomplete and unclear maintenance concept and notifications
about defects. This maintenance concept is created through experience. Usually, factories of PepsiCo
receive a maintenance concept from the maintenance department of PepsiCo, Quaker Oats does not
receive this due to its size. Quaker Oats needs to create maintenance concepts by itself. There are two
types of maintenance schedules; the schedule of external parties (during revision weeks) and the
planning of Quaker Oats’ engineers. Planning of OEMs is explained in Section 2.1.2 and the planning of

27
the engineers from Quaker Oats is discussed here. The planning is divided into two parts, reactive and
preventive.
2.3.1 Reactive When machines break down, the procedure is that operators should reset the machine to standard
settings, try to solve the issues themselves and otherwise call the engineer for help. The operator then
makes a notification of the breakdown in SAP. This is not correctly done, sometimes orders are not or
later created and the description of the breakdown is to brief to use for analysis. This is partly because
SAP is not correctly set up and because operators (and partly engineers and management) do not care
about the registration, only about a working machine. This seems strange, since with good registration,
for instance when noting the cause and what the machine was doing, a breakdown can be prevented
next time. Registration in SAP needs to be improved by operators and by engineers.
Machines deviate from standard settings due to wear and input variabilities. In the past operators had
to follow a procedure to try and fix the machine. This was done by changing its settings, but this did
not work out because the problems kept occurring and engineers blamed operators for the faults. This
resulted in lost time and frustrations. Some of the breakdowns should not be a breakdown but become
one because the TD is not informed about the run-up to a fault. This has two reasons. One is that the
operators do not communicate with the TD when they notice something different or do not notice it.
As said in Section 2.1.3, operators do not receive technical training and are not selected on their
technical knowledge. Effective communication between the operator and engineer is key to solve
certain issues efficiently and guarantee a good production performance. The second reason is that
engineers and operators do not spend their time to carry out checks on the machines. The fact that
checks are not carried out is also a reason a breakdown occurs. Due to postponed maintenance and
no knowledge about the state of the machines, the machines require CM instead of PM.
2.3.2 Preventive Input for the offline planning of engineers consists of automatically generated work orders based on
the maintenance concept and work orders originating from notifications coming from work orders that
do not require immediate action.
The maintenance concept is created based on experience, the argument behind this is that not
everything is measurable and therefore maintenance tasks cannot be created based on data. The plan
lacks details, like what, when and how to do tasks, how long these tasks take and a reason why tasks
need to be executed. For some machines, a slightly detailed plan of what part to inspect is available,
not for the CMK9. However, this is seldom looked because of the lack of meaning at and it is available
for too few machines. This needs to be improved such that the engineers know what to do and perform
good and consistent maintenance. Due to reasons like the planning, communication, no faith in the
plan and the number of breakdowns, the plan is not fully executed. Not executed orders are cancelled
or marked as finished. Marking orders as finished takes less time than cancelling. However, it is
assumed that completed maintenance orders that do not have a work time, are not completed. In
September 2018 there were 60 planned work orders from the maintenance concept of which 47 are
not completed, 7 are estimated to be complete and 6 are cancelled. We cannot precisely determine
the completed orders since completed and cancelled are both marked as complete. Maintenance
orders are cancelled because a new version of that maintenance order is generated, which makes the
old one redundant. For example, on day 14 a weekly check needs to be executed, but this is not done
yet on day 21 when the new weekly check must be executed, therefore the check of day 14 is cancelled,
or marked as finished. Maintenance needs that are noticed and communicated during the day that
require maintenance, but not direct like with breakdowns are called repair orders. Repair orders are

28
not incorporated in the maintenance concept and differ from breakdowns. Repair orders can relate to
preventive maintenance, but also corrective maintenance. For instance, when a part of the machine is
bent but the machine is still functioning, this is planned, but the machine is already damaged. Repair
orders can also be a result of a PM inspection, so before the part is damaged. The notification for the
repair order is checked and planned by the work scheduler in SAP. In September 52 work orders were
created based on these notifications, only with four of the orders no action is taken.
2.4 Maintenance planning process The maintenance planning heavily relies on the production planning (Cassady & Kutanogly, 2005). For
the plant to have a right to exist, it needs to be cheap, otherwise, the plant has a risk to be closed. The
plant's price is among others expressed in Euro per kg of Cruesli. For Quaker Oats, this means
producing as much as possible with the materials and labour they have, reduces the kilo price. The
long and medium-term (16 weeks and longer) planning is made in England. England has contact with
the markets and creates the planning based on the capacity of Quaker Oats. Capacity is based on the
speeds of the machines and planned availability. Process machines operate on their max while
packaging machines are planned at 85% of their capacity. The packaging machines do not have to
operate at 100% of their capacity since they are quicker than the process machines. Another factor is
the reduced wear on the machines when they run slower than their maximum capacity and that leaves
some room for breakdowns. The 85% is based on experience and is a rough estimate. In certain weeks
the estimate is far from the real value and we see the machines finishing the play 3-6 hours too early
or late. Quaker Oats determines the production capacity and can therefore lower it temporarily.
Lowering can happen by removing a shift, planning a line for maintenance or an improvement process.
This needs to be announced eight weeks in advance, which seems difficult to plan due to the lack of a
maintenance concept. Reducing capacity for maintenance usually results in temporarily reducing the
capacity by roughly 50% since one of the two lines must be shut down. Consequently, reducing capacity
should carefully be done, especially since the plant must produce as much as possible to be
competitive.
The TD plans the maintenance per week based on received maintenance requests, the rest comes from
the maintenance concept and are automatically generated. In a very generic way it is specified what
to do, but not when and how long it takes. The tasks are added to a to-do list, but this is not looked at
because there is the feeling that there are no opportunities for maintenance. As said before, these
opportunities are there, but they remain unused because of the lack of communication and planning.
Generic tasks and no hourly planning result in nescience among engineers since they themselves must
find opportunities. Because the duration is unspecified and nothing is planned in terms of at what time
to perform the maintenance, the breaks between production are not (effectively) used. There is no
estimated duration because engineers do not reliably fill in their work hours and no time has been
spent on determining estimated durations. Even if there is an estimated duration, it is based on
experience and feeling instead of data. A pitfall when using experience is that you tend to remember
the most current events instead of the complete picture. For engineers, it is not clear what to do since
they do not check their planning in SAP. The week planning of maintenance ignores the production
planning and vice versa. It might be that there is no time for some maintenance activities, this is
however not measurable because of the lack of an estimated duration. Sometimes maintenance is
executed in the weekends to remove the difficulty of planning and executing maintenance during
production days.
Table 2 shows the divisions of the types of maintenance in 2017 and 2018 for the two packing machines
based on the completed orders. There are three work order types used in Quaker Oats; breakdowns
(corrective and require immediate attention), repair (corrective and no immediate action required),
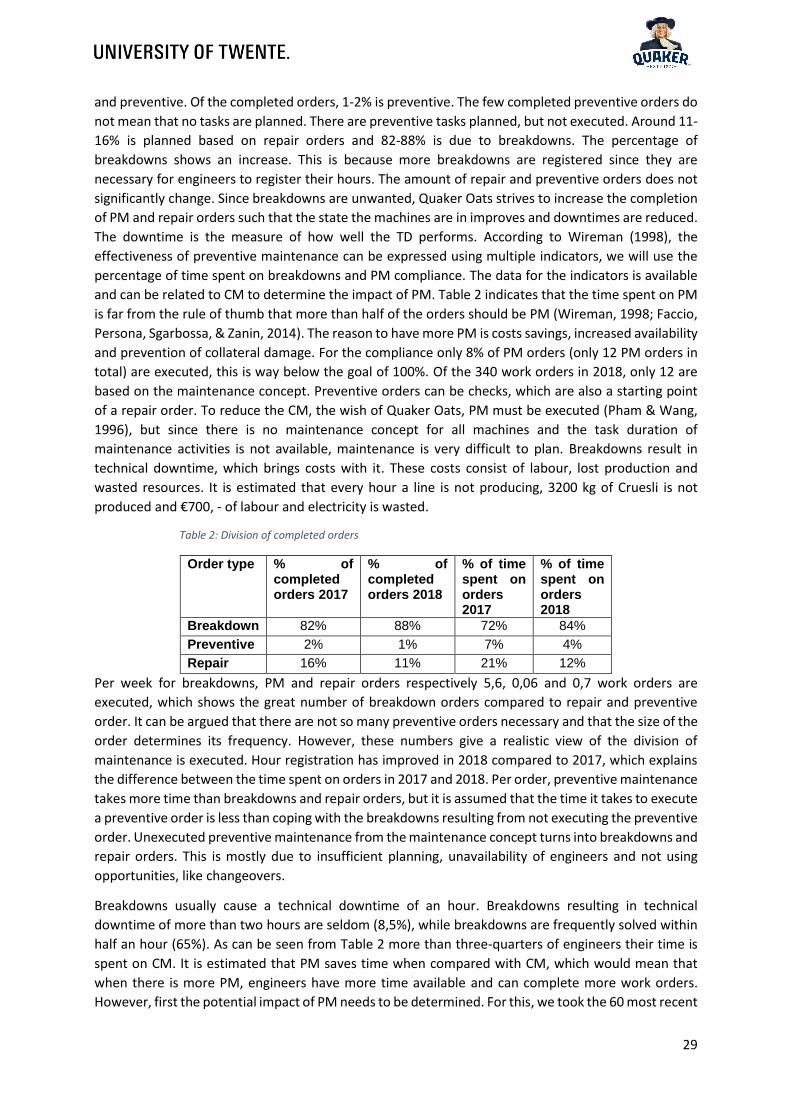
29
and preventive. Of the completed orders, 1-2% is preventive. The few completed preventive orders do
not mean that no tasks are planned. There are preventive tasks planned, but not executed. Around 11-
16% is planned based on repair orders and 82-88% is due to breakdowns. The percentage of
breakdowns shows an increase. This is because more breakdowns are registered since they are
necessary for engineers to register their hours. The amount of repair and preventive orders does not
significantly change. Since breakdowns are unwanted, Quaker Oats strives to increase the completion
of PM and repair orders such that the state the machines are in improves and downtimes are reduced.
The downtime is the measure of how well the TD performs. According to Wireman (1998), the
effectiveness of preventive maintenance can be expressed using multiple indicators, we will use the
percentage of time spent on breakdowns and PM compliance. The data for the indicators is available
and can be related to CM to determine the impact of PM. Table 2 indicates that the time spent on PM
is far from the rule of thumb that more than half of the orders should be PM (Wireman, 1998; Faccio,
Persona, Sgarbossa, & Zanin, 2014). The reason to have more PM is costs savings, increased availability
and prevention of collateral damage. For the compliance only 8% of PM orders (only 12 PM orders in
total) are executed, this is way below the goal of 100%. Of the 340 work orders in 2018, only 12 are
based on the maintenance concept. Preventive orders can be checks, which are also a starting point
of a repair order. To reduce the CM, the wish of Quaker Oats, PM must be executed (Pham & Wang,
1996), but since there is no maintenance concept for all machines and the task duration of
maintenance activities is not available, maintenance is very difficult to plan. Breakdowns result in
technical downtime, which brings costs with it. These costs consist of labour, lost production and
wasted resources. It is estimated that every hour a line is not producing, 3200 kg of Cruesli is not
produced and €700, - of labour and electricity is wasted.
Table 2: Division of completed orders
Order type % of completed orders 2017
% of completed orders 2018
% of time spent on orders 2017
% of time spent on orders 2018
Breakdown 82% 88% 72% 84%
Preventive 2% 1% 7% 4%
Repair 16% 11% 21% 12%
Per week for breakdowns, PM and repair orders respectively 5,6, 0,06 and 0,7 work orders are
executed, which shows the great number of breakdown orders compared to repair and preventive
order. It can be argued that there are not so many preventive orders necessary and that the size of the
order determines its frequency. However, these numbers give a realistic view of the division of
maintenance is executed. Hour registration has improved in 2018 compared to 2017, which explains
the difference between the time spent on orders in 2017 and 2018. Per order, preventive maintenance
takes more time than breakdowns and repair orders, but it is assumed that the time it takes to execute
a preventive order is less than coping with the breakdowns resulting from not executing the preventive
order. Unexecuted preventive maintenance from the maintenance concept turns into breakdowns and
repair orders. This is mostly due to insufficient planning, unavailability of engineers and not using
opportunities, like changeovers.
Breakdowns usually cause a technical downtime of an hour. Breakdowns resulting in technical
downtime of more than two hours are seldom (8,5%), while breakdowns are frequently solved within
half an hour (65%). As can be seen from Table 2 more than three-quarters of engineers their time is
spent on CM. It is estimated that PM saves time when compared with CM, which would mean that
when there is more PM, engineers have more time available and can complete more work orders.
However, first the potential impact of PM needs to be determined. For this, we took the 60 most recent

30
breakdowns and discussed within the TD how these breakdowns could be prevented and what caused
the breakdowns. Table 3 shows the causes of breakdowns. As can be seen in Table 3, PM could prevent
roughly 40% of the breakdown orders, but there is also a lot of improvement possible by training the
operators and improving the quality of materials, on which we will not focus because no amount of
maintenance will provide a reduction for these two causes (Christer & Whitelaw, 1983).
Table 3: Causes of breakdowns
Causes of breakdowns Percent of orders CMK9
Percent of orders Vento
No preventive maintenance 40% 41%
Master carton quality 25% 24%
Operator fault 25% 21%
Unknown 10% 9%
Software error 0% 6%
In SAP Quaker Oats’ engineers place the type of failure in predefined categories like mechanical failures
due to wear. For roughly 65% of the orders, this is registered. Most failures are due to a lack of
maintenance actions.
2.5 Conclusion This Chapter described the current situation of maintenance at Quaker Oats. All involved parties are
analysed and the process of executing and planning maintenance is described. The first research
question can be answered.
How is maintenance currently done for the machines at Quaker Oats?
Maintenance is executed on a corrective basis. Most orders are corrective (±98%) and can be divided
into critical orders (breakdowns, ±85%) and non-critical orders (repair orders, ±13%). The biggest
reduction in corrective maintenance can be achieved by preventive maintenance. This way 40% of the
orders could have been prevented. PM takes time but creates less hindrance than corrective
maintenance and is quicker than CM due to the preparation. The division of orders has multiple
reasons:
- Quaker Oats does not have a maintenance concept for its machines;
- Quaker Oats does not have the resources to plan and perform preventive maintenance;
- The Maintenance department has little authority towards other departments.
A maintenance concept forms the basis of maintenance. It states the maintenance needs of the
machines and maintenance tasks follow from the concept. The current maintenance concept does not
prevent orders because the maintenance tasks are vague and not argued. Without a concept, no tasks
are argued and planned. This is the main reason for the focus on and execution of CM, the department
does not know what maintenance the machines need. Hence, a maintenance concept needs to be
created. Only 8% of the maintenance orders originating from the maintenance concept are executed,
3,5% of the orders come from a maintenance concept. Maintenance concepts are incomplete, not well
set-up and lack detail, like task description and estimated time which makes it difficult to execute and
plan the orders. Some maintenance concepts are created to fill the system to fulfil the demands of
PepsiCo. This creates an incorrect maintenance concept. Maintenance concepts help to reduce the
technical downtime and costs by determining the maintenance actions on forehand.
For a maintenance concept to be created, the appropriate resources need to be available. Time must
be made free, knowledge about how to set up a maintenance concept needs to be available and data
must be available. There is a big gap between the effort to reduce the breakdowns and the

31
requirements of the uptime of machines. The technical downtime must not exceed 1,5% of the
production time, but little effort is given to improving the uptime of machines. Quaker Oats should
increase the available time and knowledge by giving training and hiring the right people to create a
maintenance concept and reconsider the priorities of work such that the maintenance concept is
created as quickly as possible. We conclude that data in maintenance systems is scarce since it lacks
crucial aspects to determine the frequency, cause and damage of breakdowns. To gather the right
amount of data for a maintenance concept, we will have to extend the available data with qualitative
knowledge from people from the Maintenance and Production department. To improve the
maintenance concept, the order registration must be improved such that the previously mentioned
aspects are included. We wrote a plan for this in Chapter 5.
The resources to perform preventive maintenance, like people, time, tasks, parts etc. also need to be
available. The training of operators could also help to make time free for the engineers since engineers
do not need to assist operators in their tasks anymore. This also requires a cultural change within
Quaker Oats. People need to focus on the machine and feel accountable for the working of the
machine as if it is their own machine. It is overall difficult to plan orders, there is almost no
communication between the TD and planning and production and maintenance opportunities like
changeovers and early stops and uncommunicated and unused. Maintenance opportunities are
(un)planned stops (including changeovers). To use (un)planned stops, we first need to know what tasks
are necessary to improve the uptime of the machines, how long these tasks take and when they should
be executed. In short, the maintenance concept needs to be created to form the basis such that follow
up steps can be executed.
The lack of a maintenance concept and data weakens the position of the department in Quaker Oats.
The Maintenance department could have more impact on the production planning if they knew what
maintenance tasks they would execute and what the impact of these tasks is. This is necessary to
persuade the planner and Production department. It does not work with other departments enough
and needs to build a strong basis for maintenance to persuade planning and production to create time
for the maintenance tasks. The Maintenance department needs to determine the impact of the
variable loads on machines. Ideally, it needs to do a long-term test on the impact of different speeds,
weight and settings on the machine condition. This is not possible since Quaker Oats does not have
the spare time to offer up valuable production time for long-term testing purposes. The Maintenance
department can however involve the OEM in the creation of maintenance concept to get an indication
of the maintenance needs and stress that speeds need to be as constant as possible or maintenance
needs are harder to predict and therefore maintenance will rise.
To better predict the maintenance needs of machines, Quaker Oats should supply the machines with
a constant quality of input materials. The variation in quality causes the machine to breakdown and
wear more due to the abrupt stops and breakdowns. This will also increase the lifespan of machines
and their efficiency.
In the next chapter, we will discuss literature that assists in creating a maintenance concept based on
qualitative knowledge. In Chapter 5 we will propose a plan to improve and ensure the data registration.
To limit our scope, we do not focus on the other mentioned issues.

32
3. Theoretical framework In this chapter literature about maintenance concepts is discussed. According to Section 1.4, the goal
of the research is to reduce the technical downtime created by failing machines. Chapter two
concludes that this is possible by reducing the amount of corrective maintenance and having a
maintenance concept that focusses on preventive maintenance. This results in the search for
maintenance concepts and how to develop a maintenance concept for Quaker Oats. Section 3.1
explains the relationship between planned maintenance and downtime. Section 3.2 describes what
types of maintenance are generally spoken of in literature. Section 3.3 describes a method to choose
between the maintenance types. In Section 3.4 replacement strategies are discussed while in section
3.5 maintenance concepts are discussed. Section 3.6 introduces the chosen framework and Section 3.7
concludes Chapter 3.
Literature is found by searching Google Scholar and the library of the University of Twente. Keywords
in this search were: maintenance concept, maintenance improvement, maintenance techniques,
reliability-centred maintenance (RCM), total productive maintenance (TPM), business-centred
maintenance (BCM), maintenance policy, framework, reliability, availability and preventive
maintenance and so forth. Within the articles found, their references were analysed to find more
relevant literature.
3.1 Planned maintenance and downtime For Quaker Oats to exist, machines must be reliable and available to produce the desired product at
the desired cost. Quaker Oats determines the technical downtime of the systems by Equation 1 in
Section 2.2. Equation 1 can be rewritten to the formal definition, as stated in Equation 2. The mean
time between failure2 (MTBF) and the mean time to repair3 (MTTR) determine the availability (Tinga,
Maintenance Concepts, 2013).
Equation 2: Calculating the availability
𝐴𝑣𝑎𝑖𝑙𝑎𝑏𝑖𝑙𝑖𝑡𝑦 =𝑀𝑇𝐵𝐹
𝑀𝑇𝐵𝐹 + 𝑀𝑇𝑇𝑅
In the early days, and currently at Quaker Oats, the task of the Maintenance department was to repair
broken (failed) parts. This means that the department reacts to breakdowns. A failure of a part/system
is defined as “… reaching a state such that the intended function of the part or system can no longer
be fulfilled” (Tinga, 2013, p. 3). A failure can be described in four terms:
- its failure mode;
- its cause;
- effect of the failure;
- failure mechanism.
A failure mode is a way a component fails, like something that is torn. The failure mechanism is the
process that leads to failures, like ageing or deformation. Gits (1992) defined a recent view in which
the Maintenance department also has the task to keep the machine in a certain state in which it can
function, which requires preventive maintenance (PM) tasks. The view of Gits required the
Maintenance department to plan, purchase and control its resources. Quaker Oats is stuck in the
situation where the maintenance department has the task to repair broken parts but wants to go to
the view defined by Gits. Quaker Oats want this because maintenance helps to keep the machines
reliable and available (Tinga, 2013) but also helps to keep the life cycle cost down and it also
2 The average lengths of the operational periods 3 The average time required to restore the system to its operating condition

33
contributes positively to the overall performance of the company (Waeyenbergh & Pintelon, 2002).
Equation 2 shows that while planned maintenance increases availability, availability only increases
when the time spent on scheduled maintenance is less than the time spent on breakdowns or when
the MTBF increases more than the MTTR.
Downtime caused by failures can be reduced in two ways; preventing failures and increasing the
availability of resources, such as people, knowledge, time and tools such that failures are more quickly
resolved. Failures can be prevented by PM, monitoring of equipment, improving equipment design
and reducing stress on the machine (National Aeronautics and Space Administration, 2008). Delaying
or cancelling PM for production, which happens at Quaker Oats, may increase the probability of
machine failure (Tinga, Maintenance Concepts, 2013; Cassady & Kutanogly, 2005) and increase costs
in the long term (Waeyenbergh & Pintelon, 2009). The availability of resources can be increased by
making sure spare-parts, tools and personnel are available and making repairs easy to execute, for
instance by changing a module instead of part. We do not focus on the availability of resources because
of the limited time we have and the fact that creating the maintenance concept with the data at hand
requires a lot of time and effort.
Breakdowns, the probability of machine failure and PM affect the available production time (Cassady
& Kutanogly, 2005; Aghezzaf, Jamali, & Ait-Kadi, 2007) and should therefore be accounted for in the
production planning. As stated in Chapter 2, the two machines are planned at a reduced capacity, at
85%, so there is some room for play. This room is not because of the planning of PM, it is necessary to
cope with the breakdowns and quality issues. Any unplanned maintenance action disturbs the
production plan that is made. It is therefore crucial that both production and maintenance aspects are
simultaneously considered during the planning of production and maintenance concepts (Aghezzaf,
Jamali, & Ait-Kadi, 2007). It is assumed that executing PM decreases machine failures and costs
(Wireman, 1998) and therefore reduces disruptions in the process.
3.2 What types of maintenance are there? Literature speaks of two (Lie & Chun, 1986; Ahmad R, 2012; Faccio, Persona, Sgarbossa, & Zanin, 2014)
or three (Ding & Kamaruddin, 2015) categories of maintenance: repair, prevent/retain and the more
recent improve. Within these categories are five maintenance policies (Waeyenbergh & Pintelon,
2004): failure-based maintenance (FBM), design out maintenance (DOM), detective-based
maintenance (DBM), condition-based maintenance (CBM) and usage-based maintenance (UBM). It is
generally assumed that maintenance should not only be executed by engineers. We assume that all
the types of maintenance result in a system with a reduced failure rate and maintenance is thus
performed correctly, although this is not necessarily true, sometimes the failure rate increases after a
wrongful repair.
3.2.1 Repair Repair is also called corrective maintenance (CM), CM is any maintenance that occurs when the system
has failed and is used to restore an item to a working condition without affecting its failure rate (Pham
& Wang, 1996; Barlow & Proschan, 1996; Levitin & Lisnianski, 2000; Cassady & Kutanogly, 2005). CM
is useful when a component has a constant or decreasing failure rate, when the failure rate increases
but costs are the restriction or when the component is not critical for the system to function (Swanson,
2001). Mobley (1990) found that CM cost is about three times higher than the same repair made in a
preventative mode, this only holds for component were CM is not useful. Currently, CM is the major
(98%) form of maintenance that is executed at Quaker Oats. Swanson (2001) states that the
disadvantage of CM is that breakdowns result in unpredictable and fluctuating production capacity,
higher levels of out-of-tolerance and scrap output and increased overall maintenance costs to repair

34
catastrophic failures. The maintenance policy for repair is FBM, in which repairs are executed when a
part fails. A way to do FBM is the recent view of autonomous maintenance (AM), where operators are
responsible for machine adjustments and minor maintenance (Nakajima, 1988; Yamashina, 1995). AM
requires cooperation between the production and maintenance department, which now is difficult
due to poor communication and low operator skills.
3.2.2 Prevent/retain According to military standards (U.S. Department of Defense, 1980), PM is any maintenance that
occurs when the system is in operating condition. According to the standard, PM means all actions
performed in an attempt to retain an item/part in a specified condition by providing systematic
inspection, detection, cleaning and prevention of soon to happen failures (Pham & Wang, 1996;
Swanson, 2001). In general, it is assumed that PM is justified when the failure rate of the system or
component is increasing (Rao & Bhadury, 2000). PM actions such as the replacement of a part by a
new one, cleaning, adjustment, etc. either return the part to its initial condition (the part becomes “as
good as new”) or reduce the age of the part. In some cases, the PM activity (CBM) does not affect the
state of the part but checks whether the machine is in operating condition, this is used as an input to
improve the condition of the system. A simple version of CBM is DBM. The difference between DBM
and CBM is that DBM requires simple senses and tools (look, feel, listen, smell) and CBM requires high-
tech monitoring equipment such as machines to analyse the vibration frequency (Waeyenbergh &
Pintelon, 2002). Although many failures seem to happen at random, there is some sort of indication
that a failure is about to happen in the near future. This indication can be found by CBM and DBM.
To estimate when PM should take place, there are five methods (Tinga, Application of physical failure
model to enable usage and load based maintenance, 2010): time-based maintenance (TBM), usage-
based maintenance (UBM), usage severity-based maintenance (USBM), load-based maintenance
(LBM) and condition-based maintenance (CBM/DBM). CBM/DBM inspection methods are subject to
imperfect maintenance caused by randomness in the actual time of inspection despite the schedule
(Pham & Wang, 1996). This is heavily visible for the CBM at Quaker Oats, where orders are not
executed on the planned time. The simplest form of determining when PM should take place is TBM
since it does not consider the loads on the machine. Under the assumption that you have the right
resources, data and tools, to analyse the equipment, TBM is the least accurate of the five. UBM gives
a more precise indication of when the part will fail since it considers how the machine is used. It
assumes for instance that the machine will more quickly degrade at higher speeds than on lower
speeds. USBM and LBM are more advanced techniques in which the effect of the usage and the loads
on components are determined such that the impact on the part can be more precisely determined.
Because of the resources available at Quaker Oats, UBM, USBM and LBM cannot be used.
Swanson (2001) states that the advantage of PM is that it reduces the probability of failure and extends
equipment life. The disadvantage is that the production must be interrupted at certain intervals. This
is not really a disadvantage in our point of view, because breakdowns result in more and unexpected
interruptions. CBM tries to prevent failures by using advanced technology and sensors to measure the
state of the system. Quaker Oats sometimes performs CBM on air, steam, bearings and electricity, but
not on production machines and the information is badly guaranteed because of the lack of a
maintenance system and communication of the information. The gathered data is not put in SAP but
in a different system. Performing CBM on component level is a time-consuming task since you must
hold a record of all the checks and components. Quaker Oats does not have the manpower and
structured way of working for this. The advantage of CBM over other methods is that machines are
only stopped when they need maintenance. The effect of PM can vary and is difficult to quantify, but
good PM planning can have cost-savings ranging from 2-20% (Cassady & Kutanogly, 2005). However,

35
when PM is not sufficiently planned, it can result in high costs and unnecessary waste of good
components and manpower (Ke & Yao, 2015; Vilarinho, Lopes, & Oliveira, 2017).
3.2.3 Improve The last policy is DOM which focusses on the improvement of the system in terms of reducing
maintenance needs instead of performing maintenance. DOM requires a great amount of knowledge
from operators and communication between departments. DOM requires machines modifications,
which are performed at Quaker oats, mostly to increase performance instead of reducing maintenance
needs. DOM is done by both the Maintenance department and the OEM.
3.3 How to choose between the types of maintenance? There are multiple methods available in the literature to choose between the types of maintenance.
Horenbeek, Pintelon and Muchiri (2000), Waeyenbergh and Pintelon (2009), Ding and Kamaruddin
(2015) and the RCM decision tree can be used to determine an optimal maintenance policy. We do not
like to use a mathematical optimization model to determine the optimal maintenance policy, since a
lot of (reliable) data is necessary, which is unfortunately not available. Although experts have
knowledge about failure data and performance, it is difficult to translate this in data useful for the
models (Dekker & Scarf, 1998). Prabhakar and Dharmaraj (2018) also state that mathematical models
in literature remain one-off works with limited follow-on works or adaptations, while non-
mathematical models find greater applications in the industry. Therefore, the need arises for an easy-
to-use decision support method which does not consume much time (‘Quick & Dirty’). In practice, a
‘Quick & Dirty’ (Q&D) decision diagram provides valuable decision support while it seems rough
(Waeyenbergh, 2005). Besides its valuable decision support, Q&D decision diagrams are not time-
consuming. A disadvantage is that it does not provide information about how to configure the
suggested policy (Waeyenbergh, 2005). It seems that RCM, BCM and the policy selecting framework
of Waeyenbergh and Pintelon (CIBOCOF) fit this requirement. BCM however focusses mainly on
economic criteria, which is a focus of Quaker Oats, but not the primary focus. Although Quaker Oats
wants to invest in improving maintenance, cost should not rise higher than the costs of downtime. In
RCM four policies are considered, FBM, DOM, CBM and UBM. In CIBOCOF DBM is added, which is a
form of CBM, see Section 3.2.2. CIBOCOF contains a simple decision scheme to choose the
maintenance type, see Figure 5. CIBOCOF includes economic aspects which RCM does not. We
therefore use the CIBOCOF decision tree. The choice of a maintenance policy is based on the criteria
and objectives set for maintenance in module one of their framework. The choice depends on whether
the policy is technically and economically feasible. To determine if FBM is technically feasible, one
should consider if there is collateral damage, how easy it is to repair and if the component can be
bypassed. It should then be determined if the policy is economically feasible. What are the expected
costs of PM and FBM? In Q&D decision diagrams, this could be a rough estimate. One could argue if
the first step, determining if the part is critical, could even lead to FBM. We argue that this is possible
when there is no further risk than downtime.
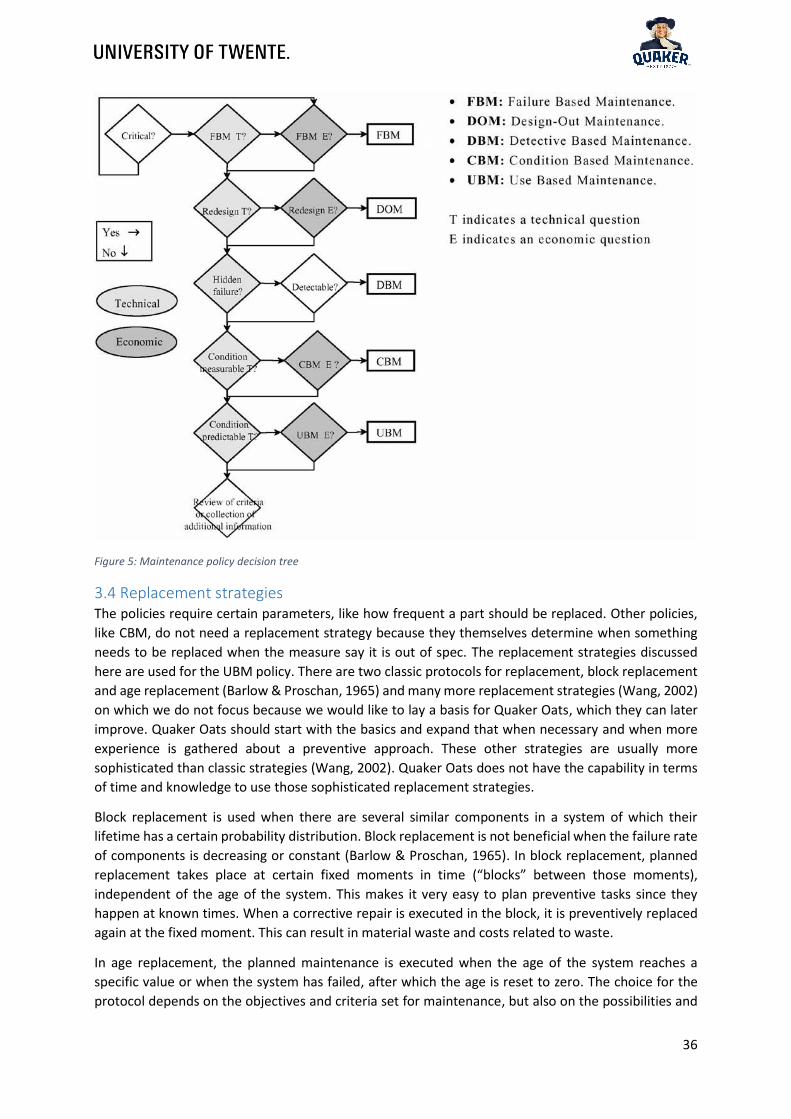
36
Figure 5: Maintenance policy decision tree
3.4 Replacement strategies The policies require certain parameters, like how frequent a part should be replaced. Other policies,
like CBM, do not need a replacement strategy because they themselves determine when something
needs to be replaced when the measure say it is out of spec. The replacement strategies discussed
here are used for the UBM policy. There are two classic protocols for replacement, block replacement
and age replacement (Barlow & Proschan, 1965) and many more replacement strategies (Wang, 2002)
on which we do not focus because we would like to lay a basis for Quaker Oats, which they can later
improve. Quaker Oats should start with the basics and expand that when necessary and when more
experience is gathered about a preventive approach. These other strategies are usually more
sophisticated than classic strategies (Wang, 2002). Quaker Oats does not have the capability in terms
of time and knowledge to use those sophisticated replacement strategies.
Block replacement is used when there are several similar components in a system of which their
lifetime has a certain probability distribution. Block replacement is not beneficial when the failure rate
of components is decreasing or constant (Barlow & Proschan, 1965). In block replacement, planned
replacement takes place at certain fixed moments in time (“blocks” between those moments),
independent of the age of the system. This makes it very easy to plan preventive tasks since they
happen at known times. When a corrective repair is executed in the block, it is preventively replaced
again at the fixed moment. This can result in material waste and costs related to waste.
In age replacement, the planned maintenance is executed when the age of the system reaches a
specific value or when the system has failed, after which the age is reset to zero. The choice for the
protocol depends on the objectives and criteria set for maintenance, but also on the possibilities and

37
capabilities of the administration. Age replacement asks more from the administration and planning
since the maintenance intervals are not constant.
3.5 Maintenance concepts We determined that Quaker Oats lacks maintenance concepts. We will therefore search for ways to
create a maintenance concept. Márquez (2007) states that establishing a good maintenance concept
is an interdisciplinary task that requires expertise from management and the ‘floor’ and a quantitative
analysis that utilizes mathematical models. Prabhakar and Dharmaraj (2018) state however that non-
mathematical models find more support in the industry because of the lack of reliable data to work
with. Setting up a good maintenance concept is necessary to reduce failures and technical downtime.
To prevent failures, the decision on the required maintenance concept and a thorough and easily
accessible technical knowledge are crucial (Waeyenbergh & Pintelon, 2002). Gits (1992, p. 217) defines
a maintenance concept as “… the set of rules prescribing what maintenance is required and how
demand for it is activated.”. In other words, a maintenance concept can be defined as the set of various
maintenance interventions (corrective, preventive, condition-based, etc.) and the general structure in
which these interventions are foreseen (Waeyenbergh & Pintelon, 2002). There are numerous
maintenance studies on which concept to choose, see Gits (1992), Wireman (1998), Waeyenbergh and
Pintelon (2002; 2009), Kobaccy and Murthy (2008), Faccio et al (2014) and Prabhakar and Dharmaraj
(2018) for instance. Many of the studies discuss maintenance concepts like Risk-Based Maintenance
(RBM), Reliability Centred Maintenance (RCM), Total Productive Maintenance (TPM), Business Centred
Maintenance (BCM) and Life Cycle Cost (LCC) approaches. Prabhakar and Dharmaraj (2018) state that
there are over 50 different methods and that TPM and RCM remain as preferred strategies due to
them being widely known and proven track record. TPM and RCM are briefly described in Appendix C.
Because of the good reputation of TPM and RCM, we will search for strategies that are based on TPM
and RCM. RCM and TPM are the first generation of ways to define a maintenance concept (Pintelon &
Parodi-Herz, 2008). There are multiple concepts based on TPM and RCM which are seen as an
improvement and will be discussed in Section 3.5.1. There are not many quantitative data available at
Quaker Oats, which results in a search for a qualitative maintenance approach.
3.5.1 Developing a maintenance concept To determine the maintenance concept, a comparison between maintenance costs and plant
performance, reliability and availability must be made. This, in turn, means determining the
relationship between maintenance actions and the expected behaviour of the plant in cost and
engineering terms (Christer & Whitelaw, 1983). Due to the difficulty of this, this is not thought of in
most literature (Waeyenbergh & Pintelon, 2002). It is also necessary to set goals. Quaker Oats claims
that their focus is on reliability and availability rather than on costs, which favours RCM. The study of
Christer and Whitelaw brings up a point relevant for Quaker Oats in terms of why maintenance at
Quaker is not effectively determined. Christer & Whitelaw (1983) state that the information, see
Section 1.3, currently gathered by Quaker is not suited for the task of predicting the consequences of
implementing some change or changes to existing maintenance procedures if procedures would be
available at all. To change the existing procedures, one must know the cause of the fault, the
consequence of the fault and the means of prevention (Christer & Whitelaw, 1983).
All the maintenance concepts mentioned in the literature (Section 3.5) start with the formulation of
the objective and requirements of maintenance. Most concepts continue with a system analysis to
determine the most important systems/critical components. From thereon it differs, but most
literature then continues to select a maintenance policy, further optimize the policy and execute the
concept (Gits, 1992; Waeyenbergh & Pintelon, 2002; Pintelon & Parodi-Herz, 2008; Goossens, 2015;

38
Prabhakar & Dharmaraj, 2018). A recent view is that the concept its performance is tracked and
adjustments to the concept are made when necessary.
An overview of maintenance concepts and models is created by numerous researches and will only be
briefly discussed here. For more information see for instance Waeyenbergh and Pintelon (2002), Faccio
et al (2014), Kobaccy and Murthy (2008) and Prabhakar and Dharmaraj (2018). In Section 3.3 we
concluded that we use the decisions tree of CIBOCOF. For the other steps, RCM has a couple of benefits
over CIBOCOF; RCM is widely accepted, proven to work (Pintelon & Parodi-Herz, 2008; Fore &
Mudavanhu, 2011) and it is structured compared to CIBOCOF (Pintelon & Parodi-Herz, 2008;
Waeyenbergh & Pintelon, 2009). RCM also has a disadvantage compared to the method of
Waeyenbergh and Pintelon, which is that RCM is complex, expensive, time-consuming, requires a lot
of data and there is no economic evaluation (Waeyenbergh & Pintelon, 2002; Pintelon & Parodi-Herz,
2008). Waeyenbergh and Pintelon further claim “… that concepts described in the literature are often
very time-consuming to implement or only valid for a special class of equipment or a specific industry.”
(Waeyenbergh & Pintelon, 2002, p. 302). CIBOCOF includes ideas from multiple concepts, like RCM
and TPM, to create a better, more complete concept4 and easy to use an approach that uses both
quantitative and qualitative knowledge. Pintelon and Parodi-Herz (2008) state that CIBOCOF is an
evolved and improved form of RCM. Multiple studies highlight the advantages and disadvantages of
the concepts and some create a framework in which a combination of concepts is used to create a new
concept. For more information see for instance Waeyenbergh and Pintelon (2002), (Pintelon & Parodi-
Herz, 2008), Faccio et al (2014) and Prabhakar and Dharmaraj (2018).
Braaksma et al (2013) and Prabhakar and Dharmaraj (2018) states that literature argues whether
historical data is useful or not to develop a maintenance concept with and state that usually the focus
is laid on tacit knowledge. This is because the quality of data is often insufficient due to; incomplete
records, not describing the cause, not describing the failure that occurred and not describing failure
modes which are the effect of a failure. We would like to use a framework that can work with limited
and mostly qualitative data. This results in our choice of CIBOCOF.
What CIBOCOF lacks, is the harmonization and clustering of maintenance activities. This however is
only of use when multiple activities are known and reducing set-up costs are a point of interest. When
multiple machines have a maintenance concept or the maintenance concept extended for the
researched machines, the framework of Gits (1992) can be used to cluster and harmonize maintenance
activities. It is not beneficial to harmonize and cluster activities when a maintenance concept has few
activities. The step of harmonizing and clustering activities can easily be added to CIBOCOF since it is
built up in a modular way. For clustering and harmonizing data about frequencies, duration and set-
up times must be known. Quaker Oats should first gather this data before harmonizing and clustering
can take place, see Chapter 5.
The book of Wireman (1990) explains the development of a maintenance concept and gives
information about setting up a preventive maintenance program and possible pitfalls, which is why
this book will also be used to create a framework. The framework of Waeyenbergh and Pintelon
(Waeyenbergh & Pintelon, 2004; Waeyenbergh & Pintelon, 2009; Hogan, Hardiman, & Naughton,
2011; Faccio, Persona, Sgarbossa, & Zanin, 2014; Dhingra & Velmurugan, 2015; Ahmad R, 2012;
Tiddens, Braaksma, & Tinga, Selecting Suitable Candidates for Predictive Maintenance, 2018) and Gits
(Maas, 1986; Lambooy, 1987; Graag, 1988) are proven for industrial use, easy-to-use and commended
4 Compared to concepts like RCM and TPM

39
in literature. Quaker Oats can further use it on the other machines in need of a maintenance concept
to reduce downtime.
3.6 The framework The chosen framework to determine the maintenance concept is the framework of Waeyenbergh and
Pintelon (2002; 2004; 2009), from now on called ‘the framework’. Waeyenbergh and Pintelon (2002)
state that only an integrated approach allows the development of an effective maintenance concept.
Other frameworks are often difficult to use, are case specific and/or lack an economic evaluation. The
framework consists of five modules which are worked out in Chapter 4.
The first (Section 4.1) being the start-up module in which the identification of the objectives and
resources take place. In the first module, the objectives and the requirements to meet the objectives
are set. The users of the framework should ask themselves ‘What do we really want?’. The
maintenance manager and specialist determine what the objectives, requirements to meet those
objectives and resources are.
In the second module (Section 4.2) the systems and the components will be identified. Here the
systems will be determined in which the two packing machines can be classified. This is done by a
questionnaire filled in by twelve people, nine from Maintenance and three from Production. The
division is chosen because people from Maintenance use the classification the most and should
therefore have the most impact. The critical components will also be determined in the second module
to determine where the focus should be on. This is done with the help of a qualitative failure mode
effect and criticality analysis (FMECA) based on expert knowledge and complemented with
quantitative data. Quaker Oats its data alone wouldn’t be enough for the FMECA due to reasons
mentioned before. We therefore use qualitative data and complement it with quantitative data. We
use the maintenance specialist, the work planner and incidentally, due to their time, engineers. The
FMECA uses a risk priority number (RPN) to indicate what failure mode gets priority in terms of
analysing, the higher the RPN, the higher the priority. The short-term uses of the FMECA are to identify
the critical or hazardous conditions, potential failure modes, need for failure detection and identifying
the effects of the failures. The long-term uses are to help create a maintenance concept and for
reliability analysis as well as records of this analysis. In the rest of the criticality analysis of CIBOCOF,
multiple factors are used to indicate if the part is critical or not. We do not have enough information
to perform such a criticality analysis, so we will only calculate the RPN and based on the RPN determine
what actions to take. The RPN can be determined by multiple ways and we will create our own way,
see Section 4.2.2. In general, the RPN is a component of scores from severity (S), occurrence (O) and
detection (D). The scores per component usually range between 1-10 or anything in between.
In the third module (Section 4.3) the maintenance policy will be chosen, as described in Section 3.3,
and parameters for the maintenance tasks are determined, like maintenance intervals. Expert opinion
will be used to determine maintenance intervals based on the average failure interval. The framework
of Gits (1992) goes further and uses a technique to limit the number of maintenance intervals and
cluster maintenance tasks to reduce set-up cost, but as said in 3.5.1, this is not yet possible for Quaker
Oats.
In the fourth module (Section 4.4) the performance is measured, due to timing constraints, the
maintenance concept is not fully implemented during the thesis, this is not executed during the thesis.
A plan is proposed to track performance.
The fifth module (Section 4.5), about continuous improvement, will act on the first three modules
depending on the output of the fourth module. This is necessary because over time more information

40
becomes available about the machine, like its maintenance needs and performance (Braaksma J. ,
2012).
Unfortunately, the framework does not give detailed information on how module four and five should
be executed. This needs to be done by own interpretation. A method to continuously improve the
maintenance concept is to use the maintenance feedback analysis (MFA) method proposed by
Braaksma (2012). The MFA consists of four steps to conclude what data is missing and how and if to
gather this data to improve the FME(C)A. Braaksma (2012) states that information management is
identified as a root cause for not updating the FME(C)A and that there is no follow-up procedure to
collect the right data. The MFA is developed as an approach to improve the asset information
management. The MFA consists of four steps (Braaksma J. , 2012); the first is the determination of the
need for more information and the expected result of the added information about failure modes. This
is done by describing the most important assumptions and uncertainties in the information used for
the FMECA and determining if these aspects can be reduced and if that is worthwhile. The second step
is to determine what analysis should be done together with the requirements for the analysis and if it
is worthwhile to do the analysis. The third step is to organize the data collection by determining what
is already collected, what actions are needed to gather the missing data and the cost-benefit
perspective of this. The fourth and last step is to make sure that steps 1 to 3 are executed and
documented. It is advised that the fourth step is a planned maintenance action such that it cannot be
forgotten.
3.7 Conclusion In this chapter, it is made clear what requirements are needed to form a maintenance concept and
what framework we will use to create a maintenance concept. The second research question can be
answered.
(2) What are the requirements for the design of a maintenance concept based on literature research?
There are three types of maintenance, repair (corrective), retain (preventive) and improve. Preventive
maintenance has serious benefits over corrective maintenance while the maintenance type improve
could help reduce maintenance needs and quicken repairs. To choose what to do with the machines
in terms of maintenance, maintenance concepts are discussed. Maintenance concepts are necessary
to document and plan the way of maintenance for machines. A lot of literature is written about
maintenance concepts and most concepts are based on RCM and/or TPM and use the FME(C)A
technique. To develop a maintenance concept CIBOCOF is chosen. Due to timing and data reasons, we
do not extend it by clustering and harmonising maintenance actions proposed by Gits (1992), which
we do advise Quaker Oats in the future. Due to the mentioned state Quaker Oats is in, first a basis
needs to be formed, see Chapter 2. The framework uses the FMECA technique and proposes a method
to determine a maintenance policy. The frameworks design and steps make it modifiable and easy to
use and the framework contains aspects of the well-known RCM and TPM methods which are generally
thought of as necessary when determining the maintenance concept. CIBOCOF is an evolution of RCM
and TPM (Pintelon & Parodi-Herz, 2008). Using the best of the two frameworks will hopefully result in
a complete maintenance concept for Quaker Oats. To further extend the maintenance concept and
close the gap between the current and wanted situation, the data registration needs to be improved
which is why we will propose a plan to improve data registration in Chapter 5.
The Maintenance is not the only department responsible for the state of the machines, as is in the
current situation. For maintenance to be effective, Production must cooperate with Maintenance,
operator skills must include basic maintenance tasks and communication is vital. Maintenance
however needs to strengthen its position within Quaker Oats such they have more impact on the

41
decisions made. One way to do this is to perform good and argued maintenance and show the effect
of good maintenance, and thus having useful data.
In the next chapter, the framework is elaborated. The framework is built up mainly based on qualitative
data. Quantitative data is missing, see Section 1.3.

42
4. Model construction In this chapter, we create a maintenance concept to close the gap between the current situation and
the desired situation. We concluded in Chapter 2 that to reduce the technical downtime, Quaker Oats
needs a maintenance concept for its machines. Other gaps like a constant quality of materials or
operator involvement are discussed in previous sections and will not further be discussed in detail such
that we can focus on the most important thing. The framework from Waeyenbergh and Pintelon will
be worked out. As explained by Waeyenbergh and Pintelon (2002), the framework consists of five
modules; the first (Section 4.1) being the start-up module in which the identification of the objectives
and resources take place. In the second module (Section 4.2) the systems and the components are
identified and an FMECA is executed. In the third module (Section 4.3) the maintenance policy will be
chosen and fine-tuned. In the fourth module (Section 4.4) the performance is measured. The fifth
module (Section 4.5), about continuous improvement, will act on the first three modules depending
on the output of the fourth module. Afterwards, we discuss the verification and validation of the
maintenance concept in Section 4.6 and give a conclusion in Section 4.7. We will focus on the failures
where we can quickly show improvement. We therefore analyse frequent failures. This serves as the
basis of the maintenance concept and as a pilot after which Quaker Oats and the TD should extend the
concept for the packing machine and create a maintenance concept for other machines.
4.1 Identification of objectives and resources In this step, the objectives and the requirements to meet these objectives are set. The objectives that
Maintenance has set are to increase the availability and reliability while meeting safety and
environmental laws. Besides this, we need to start with preventive maintenance and therefore reach
the goal of the 1,5% technical downtime. This must be done in such a way that the production of Cruesli
undergoes minimal hinder and tasks are small so they can easily fit in the production schedule.
In general, the objective of maintenance can be described as follows (Waeyenbergh & Pintelon, 2004):
(1) It must ensure the inherent safety and reliability of the equipment. (2) It must keep the equipment
in accordance with the environmental standards. (3) It must keep capacity, availability and quality at
the desired level. (4) It must be able to restore safety and reliability when components deteriorate. (5)
It must be able to collect information to maintain reliability and availability. (6) It must keep all cost
(including operations, maintenance, inventory, etc.) within the budgetary limitations. Other than these
objectives there are no custom objectives set by Quaker Oats.
As stated in Section 2.2, the chosen machines have the most technical downtime of all the machines.
Technical downtime only includes machine failures and therefore disregards material and operation
related failures. The downtime caused by the machines must be reduced to a level such that the line
is not hindered because of a breakdown of the CMK9 or the Vento. Certain specifications of the
machines are shown in Table 4, where we make a distinction between the number in brackets () and
numbers not in brackets. A number between brackets is the maximum or estimated value. It is unclear
by management what these numbers should be since the speed is also impacted by the quality of the
master carton and the impact of the master carton cannot be measured. The impact cannot be
measured since there is no good quality master carton to test with. It is also unclear what the current
state of the machine is since inspections are barely run. However, we assume that the maximum speed,
as shown in Table 4, of the machine is with master cartons of decent quality and a good machine. Since
the machines run at a reduced speed, this also creates a sort of downtime. To determine the machine
to create a maintenance concept for, we performed an analysis. We do not have the time to create
two maintenance concepts, because we must build the maintenance concept from the ground up. We
saw that the Vento accounted for the most downtime when we look at single machines. See Figure 6
for the distribution for the machines at Quaker Oats.
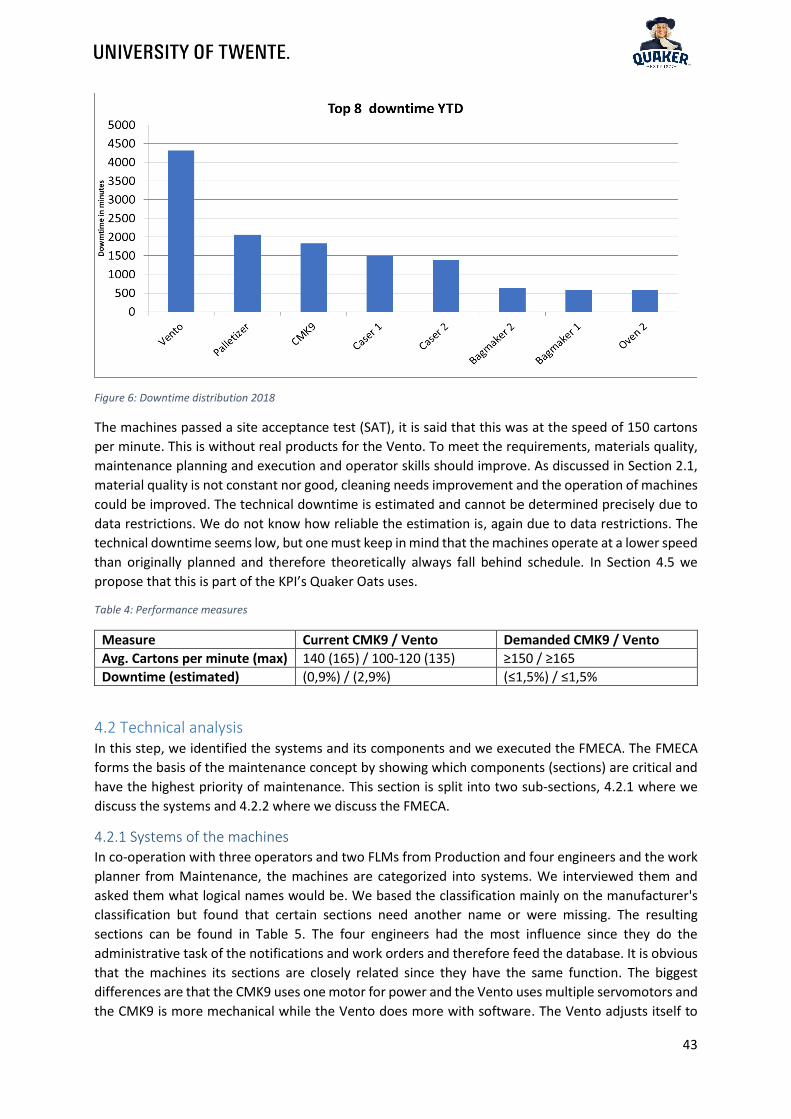
43
Figure 6: Downtime distribution 2018
The machines passed a site acceptance test (SAT), it is said that this was at the speed of 150 cartons
per minute. This is without real products for the Vento. To meet the requirements, materials quality,
maintenance planning and execution and operator skills should improve. As discussed in Section 2.1,
material quality is not constant nor good, cleaning needs improvement and the operation of machines
could be improved. The technical downtime is estimated and cannot be determined precisely due to
data restrictions. We do not know how reliable the estimation is, again due to data restrictions. The
technical downtime seems low, but one must keep in mind that the machines operate at a lower speed
than originally planned and therefore theoretically always fall behind schedule. In Section 4.5 we
propose that this is part of the KPI’s Quaker Oats uses.
Table 4: Performance measures
Measure Current CMK9 / Vento Demanded CMK9 / Vento
Avg. Cartons per minute (max) 140 (165) / 100-120 (135) ≥150 / ≥165
Downtime (estimated) (0,9%) / (2,9%) (≤1,5%) / ≤1,5%
4.2 Technical analysis In this step, we identified the systems and its components and we executed the FMECA. The FMECA
forms the basis of the maintenance concept by showing which components (sections) are critical and
have the highest priority of maintenance. This section is split into two sub-sections, 4.2.1 where we
discuss the systems and 4.2.2 where we discuss the FMECA.
4.2.1 Systems of the machines In co-operation with three operators and two FLMs from Production and four engineers and the work
planner from Maintenance, the machines are categorized into systems. We interviewed them and
asked them what logical names would be. We based the classification mainly on the manufacturer's
classification but found that certain sections need another name or were missing. The resulting
sections can be found in Table 5. The four engineers had the most influence since they do the
administrative task of the notifications and work orders and therefore feed the database. It is obvious
that the machines its sections are closely related since they have the same function. The biggest
differences are that the CMK9 uses one motor for power and the Vento uses multiple servomotors and
the CMK9 is more mechanical while the Vento does more with software. The Vento adjusts itself to

44
settings inserted in the Human Media Interface (HMI) while the CMK9 uses an adjustment nut.
Engineers were difficult to involve in the project, especially later in the process, considering their time
and priorities (solving breakdowns). With much effort and persuasion of management, some sessions
were held with engineers. The operators and FLMs are necessary because they operate the machines
and know every fault that happens with the machine while the engineers and the work planner have
more technical knowledge about the machines and its faults. Combining the two will result in more
complete information. The systems are created by creating a functional decomposition of the machine
and extended with support systems (like the casing).
Table 5: Systems of the machines
Systems of CMK9 Systems of Vento
Triple station Bomb bay (1 en 2)
Bekerband Bucketbaan
Bovenbouw Autoload
Confiner
Magazijn Magazijn
Hulzenoprichter Rotary feeder
Kartoneerbaan Kartoneerbaan
Lijmsysteem Lijmsysteem
Laserprinter Laserprinter
Doosuitvoer Doosuitvoer
Aandrijving
Elektrisch systeem Elektrisch systeem
Persluchtsysteem Persluchtsysteem
Sensoren Sensoren
Schakelkast Vacuümsysteem
Behuizing Behuizing
Algemeen
4.2.2 FMECA The next step is to identify the components within the systems which are responsible for the most
critical failures, that is, failures that could influence the system, downtime and efficiency. In the
framework, this is called determining the most critical components (MCC). The framework advices to
use a quick and dirty form of the Failure Mode, Effect and Criticality Analysis (FMECA) to determine
the MCC. Due to timing reasons, we executed the FMECA for the Vento and restricted us to analysing
five failure modes in detail. We have chosen to analyse the five most frequently occurring failure
modes in detail and only state the rest, the failure modes can be seen in Table 7. This way we could
quickly show the impact of the maintenance concept by preventing the five failure modes. The Vento
was chosen because it is responsible for the most technical downtime (Section 4.1). One machine was
also chosen to get some experience with creating an FMECA and seeing the maintenance concept in

45
action before applying to multiple machines. An FMECA is based on five questions (Tinga, Failure
Analysis, 2013):
1. What is the function and expectation of the system?
2. How does the system fail to perform its function?
3. What causes the failure?
4. Wat is the result of the failure?
5. In what way does the failure matter?
To answer the questions, a modified FMECA form is created and a group of people is selected to
perform the analysis with from Maintenance personnel while Production personnel could give input
when asked and were asked about the failures that the Maintenance department named. The group
of people consist of one of the four engineers, when they had the time, the work planner (previously
was an engineer) and the maintenance specialist. As can be derived from the group of people,
Maintenance had the biggest impact and this was visible in the focus on improvements at Production
instead of at the Maintenance department itself. We steered towards a more objective FMECA, but
this proved to be difficult. We, and literature, advice to use people from different backgrounds
(Waeyenbergh & Pintelon, 2002; Braaksma J. , 2012; Tinga, Failure Analysis, 2013), like Quality,
Production, Maintenance and Finance. It was not possible to involve the OEM (design) due to
restrictions set by Quaker Oats and Quality underwent a lot of changes during the thesis, which made
them unavailable. The work planner is closely related to the financial situation of the TD and therefore
used as the finance person and for maintenance purposes. For the next version, we advise involving a
SET or two and someone from Quality in the creation of the FMECA. The FMECA is created with weekly
sessions with maintenance personnel and random meetings with production personnel. The FMECA is
used as a basis to form a maintenance concept. The execution of the FMECA starts by analysing the
system; determining the failure modes (1), criticality and effects of components not working are
analysed (2), the risks are evaluated (3) and the results are interpreted (4).
Data from SAP or the Excel log do not provide frequencies, causes or other failure-related information
which is the reason we do not use those data as much as we wanted to. We will base the FMECA on
functional failures based on explicit and tacit knowledge and (mostly) qualitative data to determine
which component(s) needs maintenance actions. A functional failure can best be described as a failure
that impairs the function of the machine.
An example of a functional failure and MCC; the function of your bike is to transport
you from A to B with a maximum effort C. A functional failure is for instance when the
bike is unable to transport you anymore from A to B or when you must do more than C
effort. The MCC is this case can be the tire because it is punctured or soft.
Failure modes can be described as the way in which a part fails to perform its function. The part can
be the whole machine, a section, a component, etc. Examples of failure modes are; when capacity is
lower than wanted, when the desired performance is more than the capability or when the part does
function anymore. Per subsystem, we determined 2-5 failure modes and 2 causes of the failure mode
to gather the basics of the failure modes and to get a quick overview of the most important failure
modes. After the first couple of sessions, we found out that it is difficult to determine at what level to
determine the failure mode, is this at the component level or the subsystem level? We decided to
focus on the subsystem level because we did not want to go in too deep, but still give a precise enough
failure mode. This took some effort to guide the FMECA in the right direction.

46
In the second step, the effect, cause and method of detection of failure modes are determined for
every failure mode in the subsystems determined in step 1. We did this by asking the maintenance
specialist and work planner what the effect, cause and method of detection of failure modes are.
In step three a criticality analysis is performed based on several factors. These factors each result in a
score. The scores are used to determine the risk priority number (RPN). The RPN is by default a product
of the severity (S), occurrence (O) and detection (D) of the failure and usually ranges between 1-5 or
1-10 (Tinga, 2013). Severity indicates how much effect the failure mode has, occurrence on the
frequency the failure mode happens and detection on how easy the failure mode is to detect. We
modified the calculation of the RPN to fit the needs of Quaker Oats. We split the severity indicator in
two; one being Si, the internal severity, and the other being Se, the external severity. The internal
severity indicates what the type of damages does to the machine and the external severity is an
indicator for the resulting downtime. Table 6 defines how to give scores to a certain failure mode.
Equation 3 displays the calculation of the RPN.
Equation 3: Calculating the RPN
𝑅𝑃𝑁𝑖 =(𝑆𝑖𝑖 + 𝑆𝑒𝑖)
2∗ 𝑂𝑖 ∗ 𝐷𝑖
Tinga (Failure Analysis, 2013) states that the scores for the RPN should be determined by multiple
people from different backgrounds to reduce the subjectivity. We used the work planner, maintenance
specialist, an engineer and a SET. Each factor has a score (see Table 6). The score is given to failure
modes based on the opinions of people from Maintenance and Production. Since not everyone had
the same amount of knowledge, we asked the participants to fill it in individually after which the scores
were discussed with the work planner and maintenance specialist. We then came to a final score which
everyone agreed to. The scores were mostly the same although some were on the other side of the
spectrum. We saw this by failure modes that were vaguely defined. We therefore redefined those
failure modes. The first column contains the score for the row. If a failure mode has repairable damage,
it gets a score of 2 for Si. If the frequency is half-yearly, it gets an O of 3. The RPN indicates the priority
of doing something about a defect component. The higher the score, the higher the priority.
Step 4 comes then, to interpret the RPN scores. Based on the RPNs the MCCs were determined. The
MCCs are the components with failures that have the highest occurrence. As previously said, high
occurring failure modes serve as an example to quickly show the effect of the maintenance concept.
We think that this is necessary to increase the idea that maintenance can help production and increase
the motivation to do maintenance. The MCCs were the rotary feeder, carton track, gluing system and
general. It must be noted that determining the occurrence of certain faults is difficult and inaccurate
when there is no (complete) data about the fault. This is one of the reasons why we asked multiple
people, this way the inaccuracy can be reduced. As previously said, the scores were determined based
on memories, in the future data from SAP or the TD log should increase the precision of the scores.
Even when there is data, it is unclear what the state of the part/system was when it got serviced. The
top five failure modes, based on occurrence, are shown in Table 7. For the MCCs it is analysed how a
certain failure could be prevented and steps can be documented to prevent the failure. This leads to a
maintenance concept that includes tasks for the MCCs. For the MCCs, it is analysed what:
- its normal function is;
- how it failed;
- the effect is when the component fails;
- what to do about the failure;
- how long the action takes.

47
This process should be re-done after a certain while to ensure that the maintenance concept is updated
(Bloom, 2006; Waeyenbergh & Pintelon, 2009), see Section 4.5. Preferably with the help of good-
quality data about disturbances. It is not possible to create a complete maintenance concept with the
data at hand because the data is lacking in terms of quality and in amount. During the lifetime of the
equipment, more failure modes may become clear and additional information is gathered to improve
the FMECA. This results in adjustments for the maintenance concept.
The FMECA is based on data from the past and not on possible failures that did not happen before in
Quaker Oats’ case. The way a machine failure is related to its use, where high loads and fluctuating use
reduce the lifetime (Tinga, Failure mechanisms, 2013) but are accounted for since we use historical
data. There is room for improvement for other departments, see Chapter 2, that could reduce the
maintenance needs and change the FMECA. Quaker Oats should also look at these possibilities to
reduce maintenance needs. Besides reducing the maintenance needs, the machine can also be
adjusted by the OEM to work with for instance one setting for the carton, which would benefit
performance. For extending the FMECA to other machines, we do not recommend analysing new
equipment because of childhood diseases which first need to be solved (Mobley, 2004) and the lack of
data from the past. We strongly recommend planning the session of the FMECA in advance such that
people from multiple departments can be present during some of the sessions to review the FMECA.
We would have liked to include (more) people from Quality and Production and constantly involve at
least one engineer.
Table 6: Rating scales
# Severity intern Severity extern (downtime) Occurrence Detectability
1 No damage <30 min Once in a lifetime
Easily, e.g. through a routine check or loud noise
2 Repairable damage <60 min 2-5 years
3 Replacement of part needed <90 min Yearly
Average; requires high attention and/or knowledge
4 Replacement of part and other parts needed <120 min Half yearly
5 Full revision necessary ≥120 min Monthly Difficult; only through research

48
Table 7: FMECA with failure mode on which we focus
Machine Vento Equipment # 50463380
Date 26/02/2019 Location Packaging
Subsystem Failure mode Cause Effect Detection method Si Se O D RPN
Rotary feeder
Worn suction cup Wear or age A bad grip on master carton
Visual, crooked master carton, master carton not set-up properly
2 1 4 1 6
Carton track Worn suction cup Wear or age A bad grip on master carton
Visual, crooked master carton, master carton not set-up properly
2 1 4 3 18
Gluing system
No to little glue on master carton
Worn nozzle Master cartons do not close
Open flaps detection. Check: Glue pressure, glue inventory and filters
3 1 5 1 10
General Zero points of machine or programs deviate
Crash, wear, contamination of control error
Programs must be adjusted and timing is off.
Checking software with hardware settings. Indicated by
2 2 5 3 30
Vacuum system
No vacuum Filter contaminated Suction cups have no grip or only at a lower speed
Read vacuum gauge 3 1 4 1 8

49
4.3 Maintenance policy decision and parameter optimisation After deciding on what components to focus, we can select actions for the failure modes. Depending
on the preferences of Quaker Oats, we can let the part fail, design it not to fail, make use of human
senses or technological equipment to monitor the condition or create a usage-based policy. The
selection of the maintenance policy depends on certain points:
- the criticality of the component (effect of the failure);
- maintenance actions and their technical feasibility;
- economic consequences of the maintenance action.
We make use of the decision tree described in Section 3.3 but instead of asking if something is
technically or economically possible, we tried to quantify if something is economically feasible by using
a method provided by PepsiCo, see Figure 7, and we tried to explain what technical feasibility is by
giving examples, see Figure 8. The method of PepsiCo in Figure 7 is used to estimate the cost of
corrective maintenance and preventive maintenance. In the figure, the maintenance solution
(inspection) is performed each month and the belt is replaced when the inspection concludes that this
is necessary, which is on average every six years. It could happen that the belt fails before that. The
method in the figure assumes that every failure is prevented (zero downtime costs) by the inspection
and replacement of the belt. In reality, not every failure will be prevented and an estimation of the
corrective maintenance actions need to be made. We determined the mean time between failure
(MTBF) by expert knowledge since exact data is lacking. The determination of costs might therefore
differ from the real situation and therefore the optimal maintenance policy might not be the one which
is chosen. We acknowledge this risk and try to minimize it by supporting expert knowledge with data
and asking multiple experts
about the MTBF. We further
propose a plan to acquire
the right MTBF by
improving data registration,
see Chapter 5.
It was difficult to determine
the costs because of
unavailable information
such as task duration and
effect on downtime. We
asked experts if they think if
something is economically
possible based on the RPN
scores for severity. We
asked them to think about
the costs of downtime,
labour and materials. We made it clear that due to the unreliable data, the cost might be different
than expected. We would have liked to set parameters for the costs and multiplied the downtime cost
by a factor greater than one, depending on the wish to reduce corrective maintenance. A higher factor
will bias the policies towards preventive maintenance while a value equal to one will choose the cost-
effective solution. We did this to indicate the difference between one hour of planned downtime and
one hour of unscheduled downtime. In costs, they are the same. One hour of planned downtime is
better than one hour of unscheduled downtime. This creates a preference for planned downtime (PM),
which is the goal of Quaker Oats. The TD finds reliability more important than costs and therefore we
Figure 7: Example cost justification from PepsiCo (PepsiCo, 2011)

50
decided to focus more on preventing failures of the MCC than on optimising costs. This results in higher
costs for preventive maintenance than necessary for the TD, due to imperfect policy parameters, and
therefore a possible total cost increase for the TD (Braaksma J. , 2012). Braaksma (2012) further states
that it is difficult to assess the impact of the inaccuracies and that companies develop safety margins
and ‘over execute’ maintenance. However, we think this investment is needed at the start of a
preventive maintenance plan and can be decreased over time when more is known about the
machines and the plan is optimised, see Section 4.5. During the selection, the parameter settings for
the maintenance policy, like determining the frequency of replacement or monitoring must be
determined. We decided to base the frequency on the frequency determined in the FMECA.
We know that one of the pitfalls when making an FMECA is that the notes and reason why certain
options are chosen get lost overtime which makes the updating of the FMECA difficult (Wireman, 1990;
Braaksma J. , 2012; Tinga, 2013). Therefore, we state the argumentation and calculation by the
selection of maintenance policies in the Excel file with the FMECA.
As described in Section 3.4 we focus on two replacement strategies, namely block-based and age-
based maintenance. Per MCC the strategy is determined. The used strategy depends on the objectives,
cost and possibilities in terms of administration. For example, the block-based strategy involves more
material costs, but less administrative actions (in terms of adjusting the maintenance schedule and
storing information) than the age-based strategy. With the block-based policy, potential unnecessary
repairs can occur, but the maintenance is easy to plan since it is executed with a constant interval.
National Aeronautics and Space Administration (NASA) (2000) states that when a part is getting closer
to failure, the failure rate increases and therefore the monitoring intervals of DBM and CBM should be
shortened, preferably by one-third or one-quarter (NASA, 2000). This works both ways, if the readings
stabilize, the interval may increase (NASA, 2000). This means that Quaker Oats should trend the
monitoring program, which we will not discuss but only give as a recommendation. We advise Quaker
Oats to first focus on a constant time and later when the basic is learnt, expand this. The framework
includes a section about optimizing the maintenance policy parameters. We however do not optimise
the parameters in this research because of the lack of data. We do advise Quaker Oats to optimise the
set parameters, this can be done during the reassessment of the FMECA and is discussed in Section
4.5.
We will explain the policy selection method with an example based on Figure 8. We will focus on the
failure mode of the rotary feeder. The suction cups are critical for the machine to function, otherwise,
no material is inserted in the machine. We therefore ask ourselves if we can let the failure happen.
This is answered with a yes. A failure with the suction cups will not damage other parts of the system,
if damage occurs, it is on cartons, which is acceptable. We therefore come to the economic part of the
failure mode. We conclude that the costs of downtime are small (less than 30 minutes, see Table 6),
but it does not match the goals set by us, doing more tasks preventively. Besides the goals, the costs
are too high compared to preventive maintenance. Preventively replacing the suction cups will result
in 10 minutes of downtime, way less due to the possible preparation. The next step is to determine if
it is technically possible to redesign the suction cups. It is possible to change the type of suction cups
and redesign the complete machine such that suction cups are unnecessary, as is the case with the
CMK9, but this would require an immense amount of effort (and money) and we therefore conclude
that it is not possible. We then must ask if a failure is hidden, i.e. does the failure announce itself or
result in a direct decrease in the performance of the system (Waeyenbergh & Pintelon, 2002)? A failing
suction cup will directly result in a decrease in performance. It is not possible to measure the state of
suction cups by human senses since the cups fail without warning or indication. With condition
monitoring, it should be possible by measuring the vacuum pressure, but participants of the session

51
estimate that this would cost too much. The costs of such an option are estimated to be roughly 20
times higher than the price of all the suction cups. This brings us to the next question, is it possible to
predict the condition of the suction cups? This is possible, the suction cups can be used for a limited
amount of calendar hours until they degrade because of age and they can process a limited amount of
cartons after which they tend to rupture. The suction cups do not rupture due to age at Quaker Oats,
but due to the use. We see that It is economically possible to predict the condition based on production
hours, which is the policy we choose. We stated that the suction cups on average fail monthly, so we
will preventively replace all the suction cups slightly before 30 days have passed. We have chosen to
replace them with the strategy block replacement and therefore correctively replace suction cups
when they fail before the planned replacement. Block replacement is chosen because suction cups
have an increasing failure rate (they wear) and it provides administrative benefits by not keeping a
record of when items are replaced. It has however a disadvantage that there is a possibility that almost
new items are replaced at the planned time, this is not a big disadvantage since the price of suction
cups are neglectable. Another reason why we have chosen the block replacement is that there are
multiple suction cups. Keeping an individual record of all the suction cups seem expensive due to the
low costs of a suction cup and extra work in terms in setup time, planning and administration. The
failure data of suction cups that fail should be closely monitored to optimise the frequency of
replacement and discuss with the OEM if improvements can be made to reduce the frequency or if the
frequency is as expected.
Table 8 shows the actions for the other failure modes while Appendix D it is explained how we came
to the actions. The reasoning behind the answers is not included in the thesis, only in the documents
for Quaker Oats due to the size of the file.

52
Figure 8: Maintenance policy decision tree for Quaker Oats

53
Table 8: Chosen actions for the failure modes
Machine Vento Equipment # 50463380
Date 26/02/2019 Location Packaging
Subsystem Failure mode
Techni-cally failure?
Econo-mic failure?
Techni-cal redesign?
Econo-mic redesign?
Hidden failure?
Detect-able by humans?
Techni-cal CM?
Econo-mic CM?
Technically predictable?
Economi-cally predictable?
Chosen action
Replace-ment strategy
Rotary feeder
Worn suction cups
Yes No No - No - Yes No Yes Yes UBM Block-based.
Carton track
Worn suction cups
Yes No No - No - Yes No Yes Yes UBM Block-based.
Gluing system
No to little glue on master carton
Yes No No - No - No - Yes Yes UBM Block-based for start.
General Zero point of machine or programs deviate
No - No - Yes Yes - - - - DBM
Vacuum system
No vacuum
Yes Yes - - - - - - - - FBM Correc-tive

54
4.4 Performance measurement The framework advices to measure the performance of the maintenance concept. This serves as input
for the next module, the continuous improvement (see Section 4.5). Measuring the performance and
therefore keeping track of KPIs helps to identify opportunities for improvement. For the performance
to be measured, it should be noted what the status is when the machine is checked and/or components
are replaced, see Chapter 5 for what sort of data should be in available. We assume that the
maintenance concept would prevent two hours of downtime per month. The two hours are based on
the two half-yearly failures, both resulting in 30 minutes of downtime and two monthly failures
resulting in 30 minutes of downtime and one hour of downtime, see the ‘Se’ factor in Table 6. The TD
needs to track if the reduction is realistic by tracking the downtime and maintenance on the machines.
As discussed in Section 2.1.1, the TD already keeps track of multiple KPI’s, but to improve the
maintenance concept, one must look at the failures and downtimes related to the specific machine
instead of a general view. The TD can do this by using the proposed SAP structure in Section 5.1. To
more accurately determine the performance of the maintenance concept and machines. The TD use
their KPI’s for machines instead of the whole line or plant. We recommend that the TD uses their KPI’s
and extend is with the MTBF and percentage of timely executed preventive maintenance orders. Such
that the following KPI’s are measured:
- The ratio of corrective and preventive maintenance;
- The percentage of technical downtime per machine, which already happens;
- The mean time between failure (MTBF);
- The mean time to repair (MTTR);
- The availability;
- Percentage of timely executed preventive maintenance actions;
The KPI’s give an estimate of the impact of the maintenance concept and the TD agrees that they
should measure these KPI’s. The percentage of downtime per machine can among others be used to
determine critical machines, determine the machines to create a maintenance concept for and used
for trending to see if there is an improvement. One should make a distinction between downtime
resulting from preventive maintenance tasks and corrective maintenance tasks to determine the effect
of the maintenance concept and preventive maintenance actions. The MTBF can also be used for this
as well as determining the frequency of failures which is useful to adjust the maintenance policy. The
maintenance concept should increase the MTBF. The MTTR and MTBF indicate the availability of the
machines. When the MTTR is high enough to severely hinder the production planning, four hours or
so, one could research if the MTTR can be lowered, for instance by replacing a module instead of part.
The MTTR is however dependent on the MTBF, a relatively high MTTR and low MTBF might be equally
good or bad as a relatively low MTTR and high MTBF. The maintenance concept only has effect when
the orders are executed in a timely manner. The TD should track the percentage of timely executed
orders to see if the maintenance concept should be improved or the planning of tasks.
The TD also needs to track what breakdowns cause the most downtime, document what breakdowns
there are and perform an FMECA on those breakdowns such that the TD knows how to prevent the
breakdowns. For the next FMECA session, the TD should bring the maintenance reports of the machine
such that is can analyse the failures. It is however difficult to show the performance of a maintenance
concept, among others due to the time-lag there is before the maintenance concept shows results
(Waeyenbergh & Pintelon, 2002). Beside the time-lag, we focus primarily on maintenance done by
Quaker Oats’ engineers (since there is data about in-house operations) while OEM maintenance and
operators (cleaning and using) also influence the performance and maintenance needs of machines.

55
Cleaning, a part on which we did not focus, can also significantly affect the reliability of the machine.
We have seen glue on chains and as one can imagine, this will decrease the lifetime of the chain.
Quaker Oats will implement an overall equipment effectiveness (OEE) tool in 2019 which can track
faults, uptime and reliability of the complete machine. This tool will create a reliable view of when the
machine is running and when it is not and why. In the meantime, it is especially important to improve
the data registration of operators and engineers to determine the previously mentioned KIP’s.
Therefore, we propose a plan to improve the registration, see Chapter 5.
4.5 Continuous improvement Based on the performance measurement, Quaker Oats can further improve the maintenance concept
and potentially include/exclude maintenance tasks and/or adjust the current maintenance tasks if they
underperform or are too costly. With the right data and people and when data about certain faults or
more research done, it can easily be added to the FMECA or information in the FMECA can change. It
is stated in the literature that in reality this is often not done (Braaksma J. , 2012). Improving the
maintenance concept is a continuous process and we assume that there is more and more knowledge
known about the machines over time and when the machine age, the concept might change. Braaksma
(2012) gives five main reasons for problems with information:
- The uncertainty of future maintenance information needs;
- Maintenance knowledge is insufficiently accessible;
- Information cannot be used without additional knowledge;
- Maintaining high-quality information is costly and complex;
- Heterogeneity of storage.
To focus on the improvement of the FMECA the MFA is proposed, see Section 3.6. The MFA establishes
a data collection and analysis program such that the FMECA can be improved (Braaksma J. , 2012). This
helps Quaker Oats to gather the right data to improve the maintenance policies and replacement
strategies. We started with the MFA right after the completion of the FMECA and executed it with the
people responsible for the FMECA, the work planner and maintenance specialist. With the MFA we
hope to overcome the fact that performing an FMECA is a one-off exercise and the necessary data to
improve the FMECA is gathered. As stated in Section 3.6, the MFA consists of four steps. These steps
are added to the FMECA sheet, such that all the data is in one place. The MFA for one failure mode is
shown in Table 9. We showed the first three steps; (1) determining the assumptions and stating where
and if information can reduce them. (2) Determining what sort of analysis and its requirements should
be done to reduce the uncertainties and assumptions and if it is worthwhile. (3) Determining what
data is collected and what actions should be set out to collect the rest, and again determine if it is
worthwhile. The fourth and last step is to make sure that steps 1 to 3 are executed and documented
and should be done in a separate file.
The effect of improvements can be measured in decreased downtime and/or decreased costs because
of the parameter optimisation of the maintenance policies which removes unnecessary repairs or now
prevents more failures. By making one or more persons responsible for the maintenance concept of
machines, we can ensure that the maintenance concept stays up-to-date and contributes to reducing
downtime and costs. This person should involve the right people with the next session. At least a SET,
engineer and the facilitator himself should be present but we recommend to include people from more
departments (Waeyenbergh & Pintelon, 2002; Braaksma J. , 2012; Tinga, Failure Analysis, 2013). The
SET and engineer work with the machines on a daily basis and know what happens to the machine. If
the right people and documents like reports from past failures are not involved in the update, it greatly
reduces the usefulness of the update.
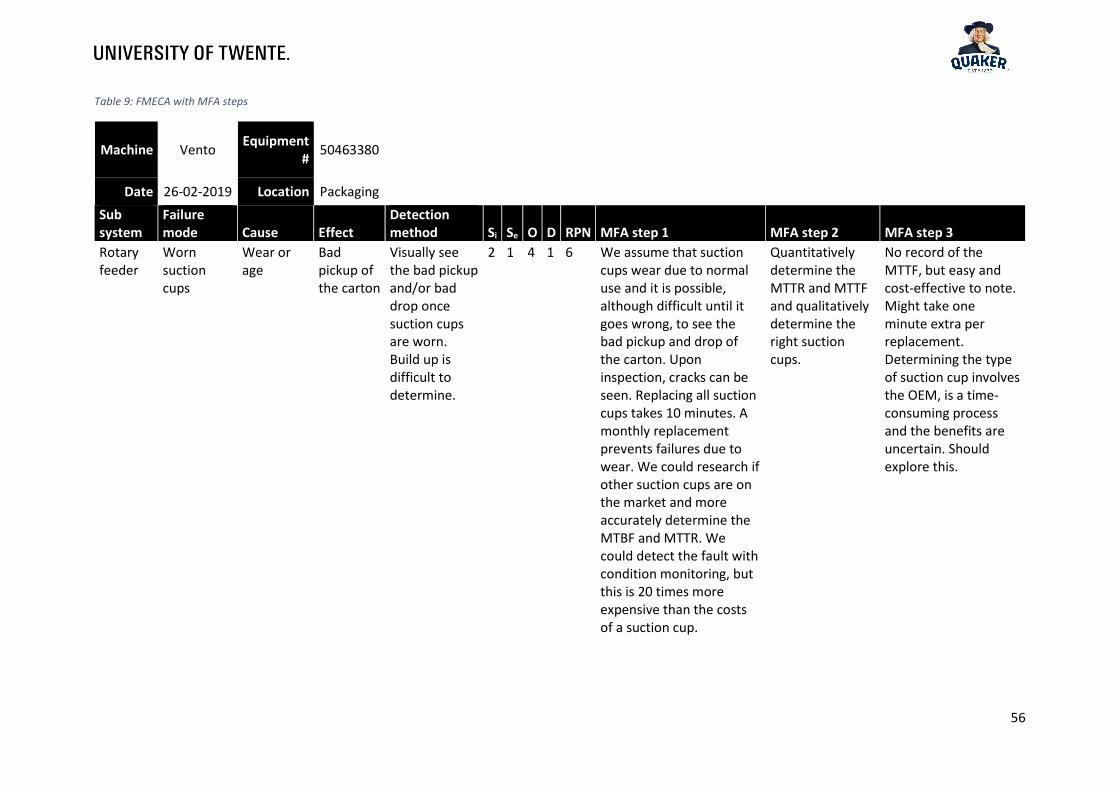
56
Table 9: FMECA with MFA steps
Machine Vento Equipment
# 50463380
Date 26-02-2019 Location Packaging
Sub system
Failure mode Cause Effect
Detection method Si Se O D RPN MFA step 1 MFA step 2 MFA step 3
Rotary feeder
Worn suction cups
Wear or age
Bad pickup of the carton
Visually see the bad pickup and/or bad drop once suction cups are worn. Build up is difficult to determine.
2 1 4 1 6 We assume that suction cups wear due to normal use and it is possible, although difficult until it goes wrong, to see the bad pickup and drop of the carton. Upon inspection, cracks can be seen. Replacing all suction cups takes 10 minutes. A monthly replacement prevents failures due to wear. We could research if other suction cups are on the market and more accurately determine the MTBF and MTTR. We could detect the fault with condition monitoring, but this is 20 times more expensive than the costs of a suction cup.
Quantitatively determine the MTTR and MTTF and qualitatively determine the right suction cups.
No record of the MTTF, but easy and cost-effective to note. Might take one minute extra per replacement. Determining the type of suction cup involves the OEM, is a time-consuming process and the benefits are uncertain. Should explore this.

57
4.6 Verification and validation For the maintenance concept to have a future in the real world, the model must be verified and
validated. In Section 4.6.1 the verification of the maintenance concept is discussed and in Section 4.6.2
the validation of the maintenance concept is discussed. The Maintenance department gave positive
feedback on the proposed maintenance concept and on the way it was created.
4.6.1 Verification of the maintenance concept Verification is used to check if something fits the requirements that were set (IEEE, 2016). Verification
is done weekly to check the changes and updates made to the FMECA and maintenance concept. The
TD was closely involved in the creation of the maintenance concept. The requirements were checked
by the work planner and maintenance specialist, who were closely involved in the creation of the
FMECA and had a say in this. They agreed to the maintenance proposed maintenance concept and will
further extend it by creating a task and inspection list for the maintenance actions and determining
more maintenance actions for the Vento.
It seemed that the creation of the maintenance concept took more time than planned. The TD can
solve this by having the right data up front and by gaining experience with the process of creating a
maintenance concept. While the work planner and maintenance specialist heard of RCM for instance,
the techniques were not known and had to be explained from the basics.
4.6.2 Validation of the maintenance concept Validation is used to check whether the maintenance concept has the expected result (IEEE, 2016).
This is difficult to do in Quaker Oats’ situation since we did not model the situation Quaker Oats is in
or have a test environment other than the real world. The concept will be validated by testing it on the
Vento, which takes place after writing this thesis. Afterwards, Quaker Oats knows if the proposed
framework also works for Quaker Oats’ situation. The TD is however enthusiastic and is planning to
extend the concept for the Vento and create maintenance concepts for other machines.
4.7 Difference from the current concept Before we started with the development of a maintenance concept for the Vento, there was a
maintenance concept available created by the maintenance specialist. This is rare since most machines
do not have a maintenance concept. As said in the introduction of Chapter 4, we have chosen the
Vento since it causes the most downtime. The available maintenance concept states that the machine
must be checked every month on all of the items in the maintenance concept. The activities are stated
as: inspect part x or check function y, where x and y are arbitrary components and functions
respectively. A detailed activity description is lacking and the time needed to complete the activities is
inaccurate. There is no priority for the activities and certain activities do not need to be performed
every month. One could argue if checking the gas springs on their function is necessary to do every
month. There is no argumentation documented of the choices in the maintenance concept and
everything is based on checks. It is also not updated in the last 2 years, since its creation. The
maintenance concept is not adjusted to the maintenance needs of the machine and the execution of
the concept will not result in the expected result. The maintenance concept is not executed. A reason
for this seems to be that the maintenance needs are not clearly implemented in the plan and no time
is made free for this concept.
The proposed plan is created with people from different backgrounds. Besides the TD we also included
production personnel when determining the failure modes of the machines and the machine sections
to create support for the concept. Ideally, we would have liked to include Quality. We did not include
the Quality department since they reorganised during the project. The proposed maintenance concept
considers the different maintenance needs of components and therefore aspects like inspection or

58
replacement frequencies. The argumentation behind the task is documented in an Excel file. The tasks
are also based on logical machine sections and are split up to make planning them easier. The tasks
are prioritized, while they still lack a detailed description of how to execute the task and therefore an
accurate duration. This is the responsibility of Quaker Oats to further extend this by performing a
maintenance task analysis. We will create tasks in the planning such that the maintenance concept is
updated when necessary. We hope that by involving multiple people we create support for the plan
and by basing the plan on the maintenance needs of the machine, that the plan is taken seriously. The
proposed concept consists of five tasks based on the failure modes. We recommend that Quaker Oats
extends the tasks with the recommendation from the manufacturer of the machine and recommend
that it will be updated as more information comes available. The manufacturer's recommendation
mainly consists of cleaning instructions.
4.8 Conclusion In this chapter, the steps to create a maintenance concept by following the CIBOCOF are described and
certain difficulties that arose when creating the maintenance concept are displayed. The third question
can partially be answered.
What improvements are needed to close the gaps between the current situation and the literature?
Quaker Oats lacks a maintenance concept for its machines. Besides other factors discussed in Chapter
2, this is the cause of the focus on reactive maintenance. A maintenance concept is created for the
Vento to gain experience and insight into what effects a maintenance concept has and create the basis
for a preventive approach. We determined the most critical components (MCC) of the Vento with the
aid of an FMECA analysis. The FMECA is created with Maintenance and Production personnel to not
bias the FMECA and get a complete view of the machine. The MCC’s are necessary because creating
tasks for every component might not be cost-effective and is very time-consuming. For the MCC’s we
determined what maintenance actions are necessary such that the failures can be prevented and
downtime can be reduced. We estimate that the proposed maintenance concept could reduce two
hours (11%) of technical downtime per month and therefore costs by €3000-€4000. We followed a
structured approach based on the framework of Waeyenbergh and Pintelon (2002). We came across
certain difficulties and multiple recommendations for Quaker Oats to improve the maintenance
concept. The most important points are:
- Update the maintenance concept when more information is available or information has
changed;
- Gather more data to better quantify the RPNs and set better parameters for the maintenance
policies;
- Involve people from multiple disciplinaries (Production, Maintenance, Quality);
- Do not underestimate the effort needed to create a maintenance concept;
- Improve input materials and reduce variability in loads on the machine.
The maintenance concept is supposed to be a living concept. It should therefore be periodically
reviewed and improved, which is one of the reasons we extended the FMECA with the MFA. The MFA
is used to determine what data is missing and how the data can be gathered. To further improve the
maintenance concept, we need more data. This is discussed in Chapter 5. It should be noted that to
succeed and create a complete maintenance concept, people from multiple disciplinaries should be
involved and that this requires a lot of time to do it right. Finally, it should be noted that the
maintenance concept is not optimized to perform at its best, the parameters of the maintenance
concept must be adjusted to display the real maintenance needs. At the moment the parameters are
estimated by experts, but not argued with quantitative data because there is a lack of quantitative

59
data. The not optimized parameters can increase costs in short-term since maintenance might be
executed too often. Besides the parameters, there are other factors that influence the concept. The
maintenance needs of a machine are strongly related to its use. Constant use will reduce maintenance
needs compared to fluctuating usage and input materials. When the parameters are optimized and
the maintenance concept is still too expensive, the use of the machines must be adjusted. The load
should be decreased and kept constant such that maintenance needs also reduce.
In this chapter we also discussed the verification and validation of the maintenance concept, thus the
fourth question can also be answered.
How can we verify and validate the maintenance concept?
The maintenance concept is verified by checking with the TD if the set requirements are met. This is
done weekly during the creation of the maintenance concept. We closely involved the TD to make sure
that the requirements were met. The requirements were that the maintenance concept should
increase availability and reliability. We estimate that the availability and reliability are increased
because of the two-hour reduction of downtime per month. The validation is another part. Since there
is no other test environment than the real world, the validation will take place on the Vento. If this is
successful, the TD will create more maintenance concepts with the framework.
Chapter 5 will elaborate on the improvement of the data such that the maintenance concept can be
improved.

60
5. Improving the data For the FMECA only expert knowledge is used. This results in an inaccurate determination of the
moment of failure and effect in terms of downtime. Christer & Whitelaw (1983) further state that the
information currently gathered by Quaker, see Section 1.3 and Chapter 2, is not suited for the task of
predicting the consequences of implementing some change or changes to existing maintenance
procedures, if procedures would be available at all. To solve this, the data registration mentioned in
Section 1.3 and Chapter 2 needs to be improved. In this chapter, we will propose ways to improve the
way the data is stored and describe what data is necessary. Improving the quality of the data is not
only needed to create a better FMECA and therefore maintenance concept, but also to create a better
maintenance planning, make choices to outsource maintenance or not (compare costs), inform the
next shift and decide which parts to keep on stock.
All the information should according to the TD be available in SAP, this is however not done in the
current situation. Reasons which will be discussed are:
- The plant is not correctly divided in functional locations and the equipment label is used for
components;
- Filling in SAP is not done as it should;
- There is not enough knowledge and motivation about why and how to work with SAP.
The next sections will be used to address the reasons mentioned. In Section 5.1 the first reason is
discussed, in Section 5.2 the second reason and in Section 5.3 the third. The conclusion will be given
in Section 5.4.
5.1 Machine structure Every machine has a ‘license plate’ according to which they can be
found in SAP, see Figure 9 for the CMK9s license plate, this license
plate has the name as a functional location, but is used as an alias for
the equipment number. For a clear overview, functional locations
must be recreated according to the real functional locations. This was
never set-up properly because of the lack of motivation and
knowledge about SAP. In packing line 1 or 2 (Dutch: ‘Verpakkingslijn 1
of 2’) there are 9-11 unique production related machines, depending
on what you count as machines; like forklifts and generators for
power. In SAP there are 123 machines and 101 machines for line 1 and 2 respectively. This high number
of machines is explained with an example, see Figure 10. In Figure 10 parts of the same machine are
circled in red, all parts of the CMK9. The parts are all entered as equipment in SAP within the functional
location packing. Not all of the machine is visible in the figure since the machine is also located in a
different functional location. We see that the classification ‘equipment’ is used for components and
we see that old and unused equipment is still in the current list, this explains the large number of
machines in SAP for the packing lines. We also see that the license plate of the machine is difficult to
find in SAP since it is only used as an alias.
Machines are thus not structured and certain sections of the machines are not mentioned, this forces
operators and engineers to assign maintenance orders to the complete machine instead of a section
or part. This makes it difficult to track the maintenance history of certain sections of the machine,
something the TD wants such that they can see which sections require more attention. This, in turn,
makes it difficult to perform analysis like cost, performance and/or maintenance related analysis per
machine. The TD would like to have a machine in the functional location ‘inpakmachine’ within the
Figure 9: 'License plate' of the CMK9

61
functional location packing line 1 (and 2) since this is advised by their SAP consultant. See Figure 11.
The machine can then be sold/moved and the new machine can be placed in the same location, which
is not possible now. This machine should be divided into sections, sections then consist of replaceable
parts. Currently, there are no subsections of a machine. We propose to clean-up and restructure SAP.
We started to create a structured view for the CMK9 and Vento, see Table 5 in Section 4.2. This was
created in cooperation with the TD, production and by consulting the manual of the machines. Other
machines also need such a structured view. To restructure SAP is the solution to the first reason why
the data is incomplete, people need the correct place to place the data in.
Restructuring SAP is however a time-consuming step. The identification of the machine sections needs
to be done in a logical way such that every operator and engineer knows what the section is. We did
this by consulting the work planner, engineer and production personnel (mainly the SETs), which took
one hour per machine. The next step is getting the machine with the sections in SAP and getting
everyone to use the new machine name. Creating the correct structure in SAP takes half an hour per
machine. The data from machines can be copied/moved to the new machine sections (functional
locations) in SAP. This is the task of the SAP specialist, who can make changes in SAP, but the operators
and engineers also require an explanation of how the machines are now structured in SAP, this is the
task of the SET. The already correct equipment numbers do not have to be changed, only moved and
new functional locations must be created. Because some numbers stay the same, the operators can
still call the machines in SAP by the names which they are used to (like “=21IM03”). They can however
now also call the subsection of the machine by their name, for instance: the section ‘bekerband’ can
Figure 10: Part of the SAP layout of Verpakkingslijn 2
Figure 11: Part of the new layout

62
be selected by typing “=Bekerband”. Operators must assign notifications to the machine sections, they
need training by the SET and the SET must be informed via the FLM or TD which is the hardest part
since SAP is different for every user. They must all be informed and trained to search for the new
functional location. Splitting the machine into sections is the wish of the TD such that they can see the
operations and costs per section.
The TD is enthusiastic about this idea and involved their SAP consultant to help implement the
proposed structure is SAP.
5.2 Order registration A many heard complaint by the engineers is that the registration of orders takes a lot of time and the
quality of the notifications they receive is not enough. A heard complain is that orders do not specify
what to do, when and what has gone wrong. The fact that the administration is done at the end of the
day strengthens the order quality problem. The administration of orders by engineers takes 5-10
minutes per order. We will discuss the order process in Section 5.2.1 and the data quality in Section
5.2.2.
5.2.1 The order process The complete order registration process of a breakdown can be summarized as follows:
(1) The operator sees the fault and calls the engineer. He briefly describes the breakdown.
(2a) The engineer walks towards the machine.
(2b) The operator creates a notification order such that engineers can register their work. He
searches for the equipment number and fills in a description of the failure. He then assigns
the order to an engineer and sets the date and time of the start of the breakdown.
(3) The engineer arrives, solves the failure and continues with other work.
(4) At the end of the day, the engineer complements the notification with information of how
the breakdown is tackled, what caused the breakdown, the duration of the breakdown and
the time of the end of the breakdown.
(5) The engineer creates a work order in hindsight from the notification and set a priority of
when the order must be finished.
(6) The engineer complements the work order with used parts, worktime5 and activities.
For a repair order or preventive order, steps 1, 2 and 3 are not executed and step 5 is done before step
4 by SAP (in case of a preventive order) or the work planner (repair order). It is possible that an
alternative version of step 1 is executed, this is when the operator can fix the problem himself, then
there is no registration.
Based on interviews we found multiple issues with the process. The first issue is the non-detailed
information supplied by the operator via the telephone and in the notification. One could argue that
the call of the operator could be improved by providing the engineer with more information, this can
speed up the solving process. However, due to the lack of technical knowledge of operators, the
information does not have much value according to the engineers. The second issue is that some
operators, and management, find it unnecessary to create a notification of a breakdown and say that
it is the task of the engineer. This is strengthened by the fact that irrelevant of the presence of a
notification, the engineer will fix the issue. Another issue is that some operators do not have the
knowledge to create a notification and their colleagues argue that they do not have to time to teach
them or completely fill it in. They do not realise the benefit of building up a database. The fourth issue
5 Worktime and duration of the breakdown are two separate things. Worktime includes the checking and cleaning up, which happens when the machine is running again.
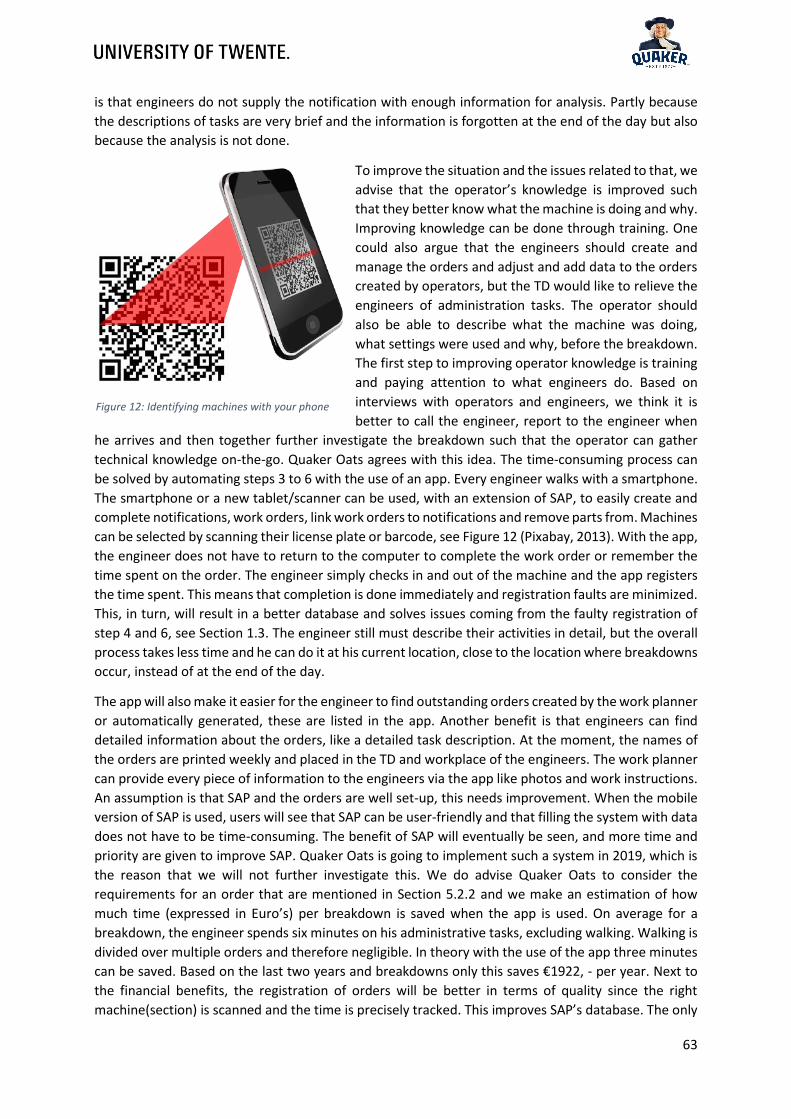
63
is that engineers do not supply the notification with enough information for analysis. Partly because
the descriptions of tasks are very brief and the information is forgotten at the end of the day but also
because the analysis is not done.
To improve the situation and the issues related to that, we
advise that the operator’s knowledge is improved such
that they better know what the machine is doing and why.
Improving knowledge can be done through training. One
could also argue that the engineers should create and
manage the orders and adjust and add data to the orders
created by operators, but the TD would like to relieve the
engineers of administration tasks. The operator should
also be able to describe what the machine was doing,
what settings were used and why, before the breakdown.
The first step to improving operator knowledge is training
and paying attention to what engineers do. Based on
interviews with operators and engineers, we think it is
better to call the engineer, report to the engineer when
he arrives and then together further investigate the breakdown such that the operator can gather
technical knowledge on-the-go. Quaker Oats agrees with this idea. The time-consuming process can
be solved by automating steps 3 to 6 with the use of an app. Every engineer walks with a smartphone.
The smartphone or a new tablet/scanner can be used, with an extension of SAP, to easily create and
complete notifications, work orders, link work orders to notifications and remove parts from. Machines
can be selected by scanning their license plate or barcode, see Figure 12 (Pixabay, 2013). With the app,
the engineer does not have to return to the computer to complete the work order or remember the
time spent on the order. The engineer simply checks in and out of the machine and the app registers
the time spent. This means that completion is done immediately and registration faults are minimized.
This, in turn, will result in a better database and solves issues coming from the faulty registration of
step 4 and 6, see Section 1.3. The engineer still must describe their activities in detail, but the overall
process takes less time and he can do it at his current location, close to the location where breakdowns
occur, instead of at the end of the day.
The app will also make it easier for the engineer to find outstanding orders created by the work planner
or automatically generated, these are listed in the app. Another benefit is that engineers can find
detailed information about the orders, like a detailed task description. At the moment, the names of
the orders are printed weekly and placed in the TD and workplace of the engineers. The work planner
can provide every piece of information to the engineers via the app like photos and work instructions.
An assumption is that SAP and the orders are well set-up, this needs improvement. When the mobile
version of SAP is used, users will see that SAP can be user-friendly and that filling the system with data
does not have to be time-consuming. The benefit of SAP will eventually be seen, and more time and
priority are given to improve SAP. Quaker Oats is going to implement such a system in 2019, which is
the reason that we will not further investigate this. We do advise Quaker Oats to consider the
requirements for an order that are mentioned in Section 5.2.2 and we make an estimation of how
much time (expressed in Euro’s) per breakdown is saved when the app is used. On average for a
breakdown, the engineer spends six minutes on his administrative tasks, excluding walking. Walking is
divided over multiple orders and therefore negligible. In theory with the use of the app three minutes
can be saved. Based on the last two years and breakdowns only this saves €1922, - per year. Next to
the financial benefits, the registration of orders will be better in terms of quality since the right
machine(section) is scanned and the time is precisely tracked. This improves SAP’s database. The only
Figure 12: Identifying machines with your phone

64
thing that then has to be created, is an SAP version of the Excel log so that SAP can be used to discuss
the previous 24 hours. At the moment Quaker Oats lack the method to show this and people prefer
the Excel log, although engineers are enthusiastic for such a system that increases the user-friendliness
of registration. The TD is looking for ways to discuss the previous 24 hours with SAP.
5.2.2 Order quality The motivation of building up a database is not present in both the operators and engineers. This
results in a lack of information and mainly comes from, as discussed in Chapter 2, from the reactive
focus of the TD, the lack of knowledge of how data can help to improve the maintenance, the extra
effort it takes to bring the data to the right quality and the knowledge and user-friendliness of SAP. By
creating the maintenance concept, we emphasize the need for data. Engineers and operators will see
that the maintenance concept will reduce downtime and the maintenance concept can only be
improved with more (reliable) data and time. The maintenance concept will reposition the reactive
focus of the TD towards a more preventive view. The extra effort to provide good quality data will soon
be worthwhile if fewer breakdowns occur and the app will reduce the amount of effort required to
provide good information and increase the user-friendliness. The knowledge about SAP can be
increased through training, which is why Quaker Oats hired SAP consultants. The reduction of
downtime will help generate motivation for engineers and operators to extend their administration.
With the help of two examples, we will discuss what information is lacking. An automatically generated
work order is discussed and a hand-made notification is discussed and shown in Figure 13.
Automatically generated orders are preventive orders that repeat every period. The notification of
such an order is mostly empty, no activities are mentioned, and the description of the notification is
empty. In the work order linked to the notification, the operations are defined hidden after a tab and
only user-friendly visible when printed, which the engineers need to do themselves. The operations
are brief and vague. They state what to do, but not how and when something is out of spec and needs
replacement. This causes confusion among engineers and results in maintenance not being executed
as it should. After all, what is meant by service part ‘x’ of 21-IM-05? What servicing is, differs among
engineers and therefore also the executed tasks differ per engineer. Another point with automatically
generated orders is that the order is often completed, while it is not, see also Section 1.3. Besides the
tasks to execute and how to execute the tasks, it is unclear when something is out-of-spec and needs
repairs since there are no specifications or measurements. When the engineer does something with
the automatically generated order, this is not registered, other than giving the work order and
notification the completed status. It is therefore unknown if engineers found more issues or what he
did to solve the problem and in what state the machine is before the service and after the service, this
is verbally communicated to ensure follow-up, but not documented.
In Figure 13 we see a completed notification order, resulting from a breakdown, this has more
information, but it is still unclear what has been done to fix it and what the cause of the error was. The
description states that there is something wrong with the template, but what; Is the template not
mounted correctly, is the wrong template used, is the template damaged? This is all unclear and is
visible in most orders and not only across the CMK9 and Vento. This is strengthened by the point that
the cause and damage codes and object parts are wrong.
An example of the wrong codes and parts is illustrated by a failure of the vacuum system
of the Vento. The object part can, for instance, be the vacuum pump. It is not possible
to enter this in the notification in the object part selection menu since the catalogue
file, where the object parts are stored, is used of a different machine. There are no
catalogue files for the machines in Quaker Oats, so a general catalogue file from another
plant, with other machines, is used. Most of the time no object part is therefore

65
selected. The same holds for the damage and cause codes, they are not fit for Quaker
Oats and therefore not used.
This makes the analysis of failures difficult and is the main reason that we only used expert knowledge
for the FMECA. Due to not being able to fill in the cause codes, it is not possible to easily make a
distinction between downtime resulting from human errors, material issues, normal wear and
operating methods. The TD would like to make this distinction and further gather information about
(frequently) failing parts and their causes to prevent parts from failing, we implemented this in the TD
log. To improve this, Quaker Oats must contact the umbrella organization which is authorized to make
changes in SAP. Quaker Oats must make sure that in the registration of orders these points are present:
- A clear and brief description of the breakdown;
- When the breakdown took place;
- What the machine was doing prior to the breakdown (SKU, settings);
- The cause of the breakdown;
- The damage;
- What the part
- The effect of the breakdown;
- The performed activities by operators and engineers;
- How long it took to solve;
- What the state of the machine is after the repair;
- The need for further actions.

66
Figure 13: An average hand-made notification

67
5.3 SAP usage As stated in previous sections, people are struggling with SAP and do not have the motivation to
completely fill in SAP. This is visible for both the operators and the engineers.
5.3.1 Operators The operators are the people who work at the line with the machines on a daily basis. They know what
sound the machines make, when the music is not too loud, how the machines smell and what they
look like. Besides their production related SAP activities, which fall out of the scope, they must create
a notification of deviations from the standard machine functioning. This is not always done or done
too late when the machine fails, see Section 2.3.1. Sometimes SETs create a (temporary) fix and this is
not registered in the maintenance log. Besides the fact that this is not always done, operators, and
certain people from higher up the hierarchy do not feel that it is the task of operators to create a
notification. The feeling they have is that operators should call the engineer who investigates the issue
and does every administrative step as well as fixing the problem. The feeling that operators are doing
someone else his work (by doing the administration) does not result in good motivation and therefore
does not result in an effort to learn how the program works. This, in combination with the time needed
to teach operators how SAP works, which is not available, results in insufficient knowledge of SAP of
some operators. Insufficient knowledge is made clear by the fact that some operators cannot create a
notification. To tackle this, the management should give clear signs whose task it is to create
notifications and stress the importance of notifications for Maintenance. Maintenance can show the
importance by demonstrating the effect of the maintenance concept and/or starting a trial on one
machine and show what it achieved with the data.
5.3.2 Engineers Engineers use SAP beside the Excel log. To complete notifications, create and complete work orders
and fill in their hours, engineers copy the data from the Excel log into SAP. This takes 3-5 minutes per
notification received and 2-5 minutes to fill in in the Excel log. Engineers prefer the Excel log because
they can easily search what is done on machines. In SAP they are not able to see the long text entered
in the notifications in an overview and therefore do not use SAP as a database to retrieve information.
This is a shortcoming of SAP which makes the Excel log a necessity for the TD until the TD uses a
reporting tool that can extract data from SAP and create a report. Engineers therefore see the Excel
log as the main logbook to work with. SAP in its current form is not fit to be used by Quaker Oats, which
is why SAP consultants are contacted and we proposed a restructuring of SAP. We hope that the TD
can easily see the maintenance history of machines, complete and fill in hours and search for certain
maintenance activities. The main goal of the improvement of SAP is to increase the awareness of SAP,
this, in turn, reduces the need for the Excel log and double administration.
5.4 Conclusion In this chapter, we discussed problems with the data registration of Quaker Oats. We can therefore
extend the answer to our third research question.
What improvements are needed to close the gaps between the current situation and the literature?
We saw multiple issues with the data administration of Quaker Oats its operators and engineers which
are stated below.
- Machines are not logically structured in SAP and miss sections;
- The order process takes more time than wanted and information exchange is not guaranteed;
- Information on breakdowns, preventive and repair orders is insufficient;
- SAP is not effectively and efficiently used.

68
In Chapter 4 we proposed a machine structure for two of the machines. Following the steps made in
Section 4.2.1, one can come to a structure of the machines which should be put in SAP to enhance the
usability of SAP and overall improve the (maintenance) database. The order process can be optimized
and shortened by making smart use of SAP its function but also using an application to do the order
registration on-site. SAP consultants can help to optimize the use of SAP. Until the application is
introduced, the TD should consider if it is worthwhile to receive training in the use of SAP and
emphasize the need for the data. It is, for instance, possible to directly link work hours to a work order
instead of first opening a new window, but the TD does not know this. The operators and engineers
also need to be given a feeling that the data they note in SAP is useful and they are not filling a useless
system. This is necessary to guarantee the information exchange between humans and the database.
To cope with the insufficient information about breakdowns, SAP should be improved. The umbrella
organization should be consulted to make changes in SAP and make SAP fit for Quaker Oats. Catalogue
files, damage causes and damage codes need to be customized for Quaker Oats its machines. The
training can also help to improve the knowledge of SAP of the people working with the data in SAP to
perform analysis other than determining the number of breakdowns.

69
6. Implementing the maintenance concept The created maintenance concept must be implemented on the machines and extended to other
machines. As is stated in Chapter 4, we focus on the quick wins, by selecting failure modes with a high
frequency. In this chapter, we will state what is necessary to create a complete concept such that
Quaker Oats has a guideline to extend it to other machines and finish implementing the proposed
concept. We also state who should be responsible for the steps and what sort of data should be
gathered and how.
Action 0 starts with the improvement of data. This is a continuous process and takes quite some time.
We discussed the ways data need to be stored in Section 5.2.2. Instruction can be given by FLMs and
the participation of the reliability engineer during the weekly meetings with the teams. There is no
reliability engineer yet. In the meantime, the maintenance specialist or work planner can pick this up.
Action 1 starts with the identification of objectives and resources. We did this by interviewing and
discussing with the maintenance manager. Ideally one should also consult Quality and Production
because they can set objectives like the wanted product quality for machines and performance. We
did not consult Quality, see Section 4.2.2, but included Production by consulting the SETs. They help
to create a complete identification of the machine. Since this takes more time, it should only be done
for critical machines (like the Cartonaters). The objectives should be set as SMART6 as possible and
documented (in SAP or Excel).
Action 2 is determining the most important systems (MIS). We did this by analysing which system
(machine) accounts for what percentage of downtime, see Section 4.1. The MIS, in this case, is the
machine which accounts for the most downtime.
Action 3 continues with placing the sections, proposed in Section 4.2.1 and Section 5.1, in SAP, done
by the maintenance specialist. Personnel should be instructed to place a new notification in the
corresponding section to ensure data collection and accurate registration.
Action 4 is to perform the FMECA to determine the failure modes and points in the machine that
require action. This is described in detail in Section 4.2.2, we recommend involving people from
maintenance, production and quality during the creation of the FMECA. This makes sure that the
FMECA is done with people from different backgrounds as it should (Waeyenbergh & Pintelon, 2002;
Braaksma J. , 2012; Tinga, Failure Analysis, 2013). This is something which could have done more in the
proposed FMECA and engineers could have been involved more, which did not happen as often as
wanted due to their time. A pitfall that can happen and happened during the creation of the FMECA,
is that the FMECA is biased towards a department. We saw that the TD is negative towards production
in terms of their knowledge and capabilities. The TD should involve people from different backgrounds
in the creation of the FMECA to reduce bias and subjectivity. It must be noted that for many people,
including most members of the maintenance department, an FMECA is new. Extra time should be
appointed such that the steps are followed and the benefit of the FMECA is clear by all participants. It
helps that the proposed maintenance concept reduced frequent failures such that a support platform
is built for a correct maintenance concept. To determine the failure modes, we recommend analysing
the past notifications in SAP and/or the TD logbook. For updating the FMECA, we also recommend
analysing past notifications. The level of the failure modes must be determined, functional failures,
component failures, sub-component failures, and so forth. We based the FMECA on functional failures
and thought of a maximum of two causes per failure mode. For next FMECAs, we recommend
determining five to ten failure modes with the two most prominent causes per machine and when
6 A well-known method of setting goals which are specific, measurable, assignable, relevant and time-based

70
updating the FMECA, extend it with five to ten failure modes or causes. This way you limit the time
spent per FMECA and only the most important problems are tackled.
Action 5 is based on the FMECA and the RPN scores. The RPN scores can be determined with the aid
of Table 6. Multiple people should be asked their expert opinion and preferably argue it with data.
Based on the RPN scores, one should also consider actions to lower the RPN, for instance, to increase
detectability or reliability by using other materials. The most important, based on the RPN and
objectives, failure modes are further analysed and decisions should be taken. These decisions include
the selection of the maintenance policy and parameter optimisation. The selection of the maintenance
policy goes with the help of the decision tree in Figure 8. This should be the task of the reliability
engineer. We saw that it was difficult to accurately determine if something is economically possible.
We therefore recommend comparing costs of certain maintenance policies based on expert opinion
and estimates. This made it easier for the policy selection. The policy its parameters should then be
set (or optimized when updating the FMECA) such that it would meet the set objectives. In the case of
the FBM policy, optimisation does not have much use. The choice between age-based and block-based
maintenance must be made, again based on the objectives and resources set, within these strategies,
the determination of the age must be chosen. This can be based on calendar hours, production hours,
loads, etc. Quaker Oats can extend the replacement strategies when they want to. This is the last step
in the thesis.
Action 6 comes after the selection of the policy and optimisation of the policy and is the
implementation phase. Tasks must be created for the selected policies, they need to be scheduled and
incorporated in a maintenance plan and given an estimated time. Besides the task, the spare parts
must be specified and inventory levels need to be determined. Training must take place such that the
actions can be executed.
Action 7 is to measure the performance of the maintenance concept such that improvement points
are thought of, see Section 4.4.
The last action is to improve the maintenance concept by scheduling yearly meetings. In the meetings
step 5 to 7 is repeated. The performance of the current concept should be evaluated with the team
that set up the concept and improvement points should be improved. This is again the responsibility
of the reliability engineer.
6.1 Conclusion In this chapter, we answer the fifth research question.
What are the necessary steps to come to a maintenance concept?
We use Figure 14 to display the roadmap for the next machine to develop a maintenance concept. The
actions proposed in Chapter 6 are set out in a timeline. Based on the steps we executed to come to a
maintenance concept, we concluded that we handled certain things right and certain points could be
improved. For instance, multiple departments should be more involved in the creation of the
maintenance concept and especially engineers should be involved, they are the one executing the
concept. Due to the limited time of engineers they were not involved as much as wanted. We created
steps such that the implementation and updating of the maintenance concept can take place and
Quaker Oats can further create maintenance concepts.

71
Figure 14: Roadmap of the maintenance concept and data improvement plan

72
7. Conclusions and recommendations In this chapter, we conclude the research by giving an answer on how to reach the research goal and
recommendations for further research. In Section 7.1 we give the conclusions to the research
questions. In Section 7.2 we propose opportunities for further research and in Section 7.3 we end the
research with a discussion.
7.1 Conclusions In this section, every research question and the research goal will be discussed. The goal was to
decrease technical downtime by improving maintenance. The technical downtime is an issue for
Quaker Oats because of three things;
- An estimated €100.000 yearly amount of unwanted costs (idling and overtime);
- It interrupts the production process resulting in stress and demotivation;
- Quaker Oats could produce more and be more cost-efficient. Now co-packers receive the
orders.
We created five research questions which we will answer in this section.
7.1.1 How is maintenance currently done for the machines at Quaker Oats? We focus on the two packing machines, the machine group with the most downtime. We can conclude
the following points:
- There is no to little preventive maintenance;
- Maintenance is performed on a corrective basis;
- Quaker Oats does not have the resources to plan and perform preventive maintenance;
The overall downtime for packaging is 2,27% instead of 1,5%. We analysed that we could prevent 40%
of the breakdowns by timely executing the right preventive maintenance. The TD is stuck in a vicious
circle where almost no preventive maintenance is executed. Two percent of the orders are preventive.
This results in machine breakdowns and a corrective form of maintenance. Due to a lack in time,
knowing what to do, data and people the TD does not have the resources for setting up a basis for
preventive maintenance. We focus on creating the basis for the TD by setting up a pilot maintenance
concept while keeping in mind the resources the TD has. We also see that there is a lot to improve in
the data registration part and therefore also create a plan to improve the data registration.
The creation of the maintenance concept is not the only way to reduce downtime. Management should
realize that the use of the machines affects its maintenance needs and that demanding more and
variation in demand of the machines increases its maintenance needs and makes it difficult to predict
the needs. Operators should feel responsible for machines, have enough technical knowledge to
operate the machine and perform basic maintenance tasks. Once these factors are minimized, the
maintenance concept can be better adjusted to the needs of the machines and become less costly.
7.1.2 What are the requirements for the design of a maintenance concept based on literature
research? To determine the requirements of a maintenance concept, we performed literature research. From
the literature review, it followed that the framework of Waeyenbergh and Pintelon (2002) (CIBOCOF)
which is based on techniques like TPM, RCM, BCM, LCC and almost gives a complete procedure to form
a maintenance concept. By combining the techniques an evolution of these techniques is created
(Pintelon & Parodi-Herz, 2008). We also found a technique to help Quaker Oats cope with the missing
data and extended the framework with the MFA technique develop by Braaksma (2012). We advise
Quaker Oats to cluster and harmonise the maintenance tasks as proposed by Gits (1992). This can be

73
done after creating sufficient preventive maintenance tasks for a machine such that setup times start
to play a role and minimizing them becomes a priority. This is not useful in the current phase.
CIBOCOF, see Section 3.6, consists of multiple modules that are necessary to execute to form a
maintenance concept. It starts with the identification of objectives and requirements. It then continues
with the identification of the most important systems and its components. Most important can be the
crucial systems for production or the systems that cause the most downtime. The systems are then
further analysed to determine the most critical components. This is done with the aid of an FMECA.
For the most critical components its failure mode(s), maintenance actions are determined and a
maintenance policy is determined to prevent the failure from happening. The policy is then further
optimized to meet the objectives and requirements. After the creation of the maintenance concept,
the performance is measured and evaluated based on the performance.
7.1.3 What improvements are needed to close the gaps between the current situation and the
literature? The maintenance concept is formed for one machine as a pilot. It is based on failure modes that
frequently occur to quickly show the effect of a maintenance concept. With the help of interviews, we
filled the gaps in the data. We incorporated the MFA method to gather more data. CIBOCOF is
explained in Section 3.6 and worked out in Chapter 4. By performing an FMECA, we determine the
most critical sections and the failure modes corresponding with the failure modes. We determined 2-
5 failure modes per section and 2 causes per failure mode. This is necessary to save time but still gather
the most important failure modes. For the critical failures, the most frequently occurring failure modes,
we determined the maintenance policy and replacement strategy. We executed the MFA such that the
assumptions that we made because of the lack of data are further investigated. The result of the
maintenance concept and the MFA are shown in Table 10. Quaker Oats should further implement the
maintenance concept and perform a maintenance task analysis for the maintenance policies. The
concept is a living one. We recommend that Quaker Oats holds sessions to analyse failures and the
performance of the maintenance concept. We estimate that the proposed maintenance concept, see
Table 10, reduces a maximum of two hours of technical downtime (10%) per month on one machine.
The maximum technical downtime that can be reduced on this machine is 40% of its downtime since
other failures are random or not technically related. For other machines, we expect a greater result of
up to 65%, since they are not affected by the variety of input quality as much as the packing machines.
It also creates the feeling that something is done with the data fed into the database. This creates
awareness for data registration at Quaker Oats.
It is important that Quaker Oats improves its order registration to develop a database with useful data
to create a maintenance concept. This increases the potential of the maintenance concept and helps
to more accurately determine actions and expected results. Therefore, ways to improve data
registration are given in Chapter 5. To improve the data quality Quaker Oats should take certain steps:
- The SAP structure must be improved such that machines are structured and placed in the
correct functional locations. For this, an SAP consultant is hired.
- The time to process a maintenance order should be reduced while the user-friendliness of the
system should be improved. This can be done by using an app and using the SAP consultant to
improve the SAP workflow.
The information such as breakdown duration, effect, damage and cause should be noted with each
order to create a possibility to analyse the data. This can be done by stressing the fact that it helps to
create a maintenance concept which in turn reduces corrective maintenance.

74
Table 10: Proposed maintenance concept with MFA
Machine Vento Equipment # 50463380
Date 26-2-2019 Location Packaging
Subsystem Failure mode Maintenance policy
Replacement strategy
MFA actions
Rotary feeder
Worn suction cups
UBM, cartons processed
Block-based, replace every cup at the same time
Track lifetime and research other parts.
Carton track
Worn suction cups
UBM, cartons processed
Block-based, replace every cup at the same time
Track lifetime and research other parts.
Gluing system
No to little glue on master carton
UBM, cartons processed
Block-based. Replace nozzles at the same time
Determine lifetime per nozzle, does it differ?
General
Zero points of machine or programs deviate
DBM, check after a crash
Determine the effect of failures and cleaning on the deviation. Create visual inspection point.
Vacuum system
No vacuum FBM
Track state of the filter when it is cleaned. Note production hours upon failure
7.1.4 How can we verify and validate the maintenance concept? The verification of the maintenance concept is done during the meetings to check if the requirements
set for the concept are still met. The proposed concept meets the requirements set by the TD. The
validation is done in the real world by testing the maintenance concept on the machine and checking
whether the machines still fail as often as they did before the maintenance concept.
7.1.5 What are the necessary steps to come to a maintenance concept? Quaker Oats should appoint a person responsible for the creation of maintenance concepts on critical
machines. We recommend that this person is the reliability engineer, while in the meantime the
maintenance specialist can take responsibility. To make full use of the framework and maintenance
concept, multiple machines should receive a maintenance concept based on the framework and their
maintenance needs. The proposed maintenance concept should also be extended to increase the
effect of the concept and further reduce downtime on the machine. We described the necessary steps
in Chapter 6. Quaker Oats should keep in mind that the maintenance concept is a living concept and
should be updated when needed. We recommend checking the FMECA files every year to ensure that
they stay up to date.

75
7.2 Further research We saw that there are more problems with Quaker Oats. In this section, we discuss the opportunities
for further research to minimize the problems. We focus on the biggest point for improvement.
Another point such as
material quality, see Section
2.1.5, machine loads, see
Section 2.2, and operator
errors, see Section 2.1.3, are
discussed in the
corresponding sections.
Figure 15 shows that we
focussed on the lack of a
maintenance concept which
makes planning PM difficult.
We recommend appointing a
dedicated person for creating
a maintenance concept. The
TD creates time by creating
the position of a reliability
engineer. The data also needs
to be improved, this means
that Quaker Oats should
implement the data
improvement plan in Chapter 5. We see that the lack of data also causes a problem for planning.
Besides researching the phone/tablet approach mentioned in Section 5.2.1. We recommend that
Quaker Oats creates data awareness with the help of a maintenance concept by showing that the data
is actually used. Quaker Oats should further start research about maintenance opportunities. We
stated that changeover and during cleaning there might be possibilities for maintenance, but we
recommend that research is put into this. This can best be done by an intern for a bachelor or master
thesis. Another point to improve the execution of maintenance is according to the TD the number of
engineers. We think that it is first necessary to create a maintenance concept such that it is known
what should be done and when, and then decide if the number of engineers and their skills fit the
requirements to maintain the machines. We also think that to improve the situation of the
maintenance department, their way of work needs to be changed and tasks should be clearly divided
and given to the right person. We recommend that Quaker Oats uses a clear division in responsibilities
where people can focus on their main responsibility instead of needing to focus on side-tasks.
7.3 Discussion In this section, we discuss points based on our research. The first point is the quality of the materials.
The proposed maintenance concept is based on the current situation. We assume that it is less
accurate when the quality of materials is improved. We also assume that the machine crashes less
frequent due to material issues and therefore the maintenance needs change.
To improve the proposed maintenance concept, and maintenance in general, one should involve
multiple departments. We involved the Production and Maintenance departments, but for the FMECA
we mainly used knowledge from the TD. This creates a biased FMECA, in this case with a negative bias
towards Production. We later minimized the bias by discussing the concept with Production. We
executed the FMECA based on functional failures, one could argue on what failure level the FMECA
Figure 15: Problem cluster

76
should be executed. A functional failure level seems to be the best since it is understandable for the
whole TD and production. We decided not to do a detailed root cause analysis or fault tree analysis
since there is simply not enough data to perform the analysis. We would again like to stress the fact
that Quaker Oats should improve its data registration of breakdowns and other maintenance orders.
Because of the lack of data, we had to use the knowledge of people working with the machines. The
assumptions and predictions can therefore be incorrect. These assumptions create uncertainty. The
implementation of an overall equipment effectiveness tool, which Quaker Oats is planning to do, can
help to create a useful database, but only when it is correctly used. We recommend checking the
machine before start-up, this can be done by operators and a SET (and an engineer). Deviations should
be communicated with the TD such that actions can be timely executed before a breakdown occurs.
For this, there needs to be an inspection list to determine what to check for before the start-up.
We saw that by ‘diving in the deep’ with information results in the information not being used
correctly. This happened with SAP and with CBM. The basis was lacking which resulted in sub-optimal
use of the products. We therefore wanted to first lay a basis for maintenance concepts. We could have
chosen to extend the framework with a better argued and more sophisticated decision tree to choose
the maintenance policy. There are models available which can help in choosing the right maintenance
policy. We however wanted to start with a simple and fast decision tree to quickly create a
maintenance concept which can then later be optimized. The same can be said for the replacement
strategies. We believe that a solid basis is a good foundation for creating maintenance concepts.

77
Bibliography Aghezzaf, E., Jamali, M., & Ait-Kadi, D. (2007). An integrated production and preventive maintenance.
European Journal of Operational Research 181, 679-685.
Ahmad R, K. (2012). An overview of time-based and condition-based maintenance in industrial
application. Comput Ind Eng.
Barlow, R., & Proschan, F. (1965). Mathemetical Theory of Reliability. New York: John Wiley.
Barlow, R., & Proschan, F. (1996). Mathematical theory of reliability. Society for Industrial and Applied
Mathematics SIAM.
Ben-Daya, M., & Duffuaa, S. (1995). Maintenance and quality: The missing link. Journal of Quality in
Maintenance Engineering 1 (1), 20-26.
Bloom, N. (2006). Reliability centered maintenance – implementation made simple. New York:
McGraw-Hill.
Braaksma, A., Klingenberg, W., & Veldman, J. (2013). Failure mode and effect analysis in asset
maintenance: a multiple case study in the process industry. International Journal of Production
Research Vol. 51 (4), 1055-1071.
Braaksma, J. (2012). Asset information for FMEA-based maintenance PhD. Thesis. Groningen:
University of Groningen.
Canon Nederland N.V. (sd). Tips & tricks voor het gebruiksklaarbewaren van uw papiervoorraad.
Opgehaald van Canon: https://www.canon.nl/Images/Papieropslag_V02_w2_tcm16-
1444263.pdf
Cassady, C. R., & Kutanogly, E. (2005). Integrating Preventive Maintenance Planning and Production
Scheduling for a Single Machine. IEEE Transactions on reliability Vol. 54, No. 2, 304-309.
Chan, F., Lau, H., Ip, R., Chan, H., & Kong, S. (2005). Implementation of total productive maintenance:
A case study. Int. J. Production Economics 95, 71-94.
Christer, A. H., & Whitelaw, J. (1983). An Operational Research Approach to Breakdown Maintenance:
Problem Recognition. The Journal of the Oprational Research Society, Vol. 34, No. 11, 1041-
1052.
Dekker, R., & Scarf, P. (1998). On the impact of optimisation models in maintenance decision makin:
the state of the art. Reliability Enginnering & System Safety vol 60, 111-119.
Dhingra, T., & Velmurugan, R. S. (2015). Maintenance Strategy Selection and its Impact on
Maintenance Function - A Conceptual Framework. International Journal of Operations &
Production Management.
Ding, S.-H., & Kamaruddin, S. (2015). Maintenance policy optimization—literature. The International
Journal of Advanced Manufacturing Technology vol. 76, 1263-1283.
Faccio, M., Persona, A., Sgarbossa, F., & Zanin, G. (2014). Industrial maintenance policy development:
A quantitative. International Journal of Production Economics vol. 147, 85-93.
Fore, S., & Mudavanhu, T. (2011). Application of rcm for a chipping and sawing mill. Journal of
Engineering, Design and Technology, 204-226.

78
Gits, C. (1992). Design of maintenance concepts. International Journal of Production Economics, Vol.
24, 217-226.
Goossens, A. (2015). Maintenance Policy Selection for Ships: An investigation using the Analytic
Hierarchy Process. PhD thesis. University of Twente.
Graag, M. V. (1988). Introducing the maintenance concept at Mora Snacks. M.Sc. thesis. Eindhoven:
Eindhoven University of Technology.
Hoerenbeek, A. V., Pintelon, L., & Muchiri, P. (2000). Maintenance optimization models and criteria.
International Journal of System Assurance Engineering and Management, 189-200.
Hogan, J., Hardiman, F., & Naughton, M. D. (2011). Asset Management: A Review of Contemporary &
Individualised Strategies. Proceedings of the World Congress on Engineering 2011 Vol 1.
IEEE. (2016). IEEE 1012-2016 - IEEE Standard for System, Software, and Hardware Verification and
Validation. IEEE.
Jostes, R., & Helms, M. (1994). Total productive maintenance and its link to total quality management.
Work Study 43 (7), 18-20.
Ke, H., & Yao, K. (2015). Block replacement policy with uncertain lifetimes. Reliability Engineering and
System Safery vol. 148, 119-124.
Lambooy, M. (1987). Designing maintenance concepts at DMV Campina M.Sc. thesis. Eindhoven:
Eindhoven University of Technology.
Lawrence, J. (1999). Use mathematical modeling to give your TPM implementation effort an extra
boost. Journal of Quality in Maintenance Engineering 5 (1), 62–69.
Levitin, G., & Lisnianski, A. (2000). Optimization of imperfect preventive maintenance for multi-state
systems. Reliability Engineering and System Safety 67 , 193-203.
Lie, C. H., & Chun, Y. (1986). An Algorithm for Preventive Maintenance Policy. IEEE Trans Reliab, 32-71.
Lipol, L. S., & Haq, J. (2011). Risk Analysis Method: FMEA/FMECA in the Organizations. International
Journal of Basic & Applied Sciences Vol. 11 No. 5, 49-57.
Maas, J. (1986). On systematically designing of a maintenance concept. M.Sc thesis. Eindhoven:
Eindhoven University of Technology.
Márquez, A. C. (2007). The Maintenance Management Framework. Londen: Springer-Verlag Londen
Limited.
Mobley, R. (1990). An Introduction to Predictive Maintenance. New York: Van Nostrand Reinhold.
Mobley, R. (2004). Maintenance Fundamentals. Oxford: Elsevier-Butterworth-Heinemann.
Nakajima, S. (1988). Introduction to Total Productive Maintenance. Cambridge: Productivity Press.
NASA. (2000). Reliability Centered Maintenance Guide for Facilities and Collateral Equipment.
National Aeronautics and Space Administration. (2008). NASA Reliability-centered maintenance guide.
NASA.
PepsiCo. (2011). RCM PowerPoint.

79
Pham, H., & Wang, H. (1996). Imperfect maintenance. European Journal of Operational Research 94,
425-438.
Pintelon, L., & Parodi-Herz, A. (2008). Maintenance: An Evolutionary Perspective . In K. A. Kobbacy, &
D. P. Murthy, Complex System Maintenance Handbook (pp. 21-49). London: Springer-Verlag
London.
Pixabay. (2013, October 22). QR-code scanner bar code. Opgehaald van https://pixabay.com/en/qr-
code-scanner-bar-code-156717/
Prabhakar, P., & Dharmaraj, A. (2018). Modern Plant Maintenance and Reliability Management
Methods - A Review. Internatuional Journal of Mechanical and Production Engineering
Research and Development, 791-802.
Quaker Oats. (2018, 9 3). Geschiedenis van Quaker. Opgehaald van Quaker: http://quaker.nl/over-
quaker
Quaker Oats. (2018, 9 3). History of Quaker Oats. Opgehaald van Quaker Oats:
https://www.quakeroats.com/about-quaker-oats/content/quaker-history.aspx
Rao, A. N., & Bhadury, B. (2000). OPPORTUNISTIC MAINTENANCE OF MULTI-EQUIPMENT. Quality and
Reliability Engineering International, 487-500.
Schippers, W. (2001). An integrated approach to process. International Journal of Production
Economics 69, 93-105.
Swanson, L. (2001). Linking maintenance strategies to performance. International Journal of
Production Economics 70, 237-244.
Tiddens, W., Braaksma, J., & Tinga, T. (2017). Towards Informed Maintenance Decision Making:
Guiding the Application of Advanced Maintenance Analyses. IGI Global.
Tiddens, W., Braaksma, J., & Tinga, T. (2018). Selecting Suitable Candidates for Predictive Maintenance.
International Journal of Prognostics and Health Management 9(1).
Tinga, T. (2010). Application of physical failure model to enable usage and load based maintenance.
Reliability Engineering & system Safety, 1061-1075.
Tinga, T. (2013). Failure Analysis. In T. Tinga, Principles of Loads and Failure Mechanisms (pp. 255-285).
London: Sringer-Verlag London.
Tinga, T. (2013). Failure mechanisms. In T. Tinga, Principles of Loads and Failure Mechanisms (pp. 85-
160). London: Springer-Verlag London.
Tinga, T. (2013). Introduction: The Basics of Failure. In T. Tinga, Principles of Loads and Failure
Mechanisms: Applications in Maintenance, (p. 3). London: Springer-Verlag .
Tinga, T. (2013). Maintenance Concepts. In T. Tinga, Principles of Loads and Failure Mechanisms (pp.
161-183). Londen: Springer.
U.S. Department of Defense. (1980). Procedures for performing a failure mode, effects and criticality
analysis. Washington, D.C.: Department of Defense USA.
Vilarinho, S., Lopes, I., & Oliveira, J. A. (2017). Preventive maintenance decisions through maintenance.
Procedia Manufacturing 11, 1170-1177.

80
Waeyenbergh, G. (2005). CIBOCOF - A FRAMEWORK FOR INDUSTRIAL MAINTENANCE CONCEPT
DEVELOPMENT. Leuven: Katholieke Universiteit Leuven.
Waeyenbergh, G., & Pintelon, L. (2002). A framework for maintenance concept development. Int. J.
Production Economics 77, 299-313.
Waeyenbergh, G., & Pintelon, L. (2004). Maintenance concept development: A case study. Internation
Journal of Production Economics, Vol. 89, 395-405.
Waeyenbergh, G., & Pintelon, L. (2009). CIBOCOF: A framework for industrial maintenance concept
development. Int. J. Production Economics 121, 633-640.
Wang, H. (2002). A survey of maintenance policies of deteriorating systems. Europoean Journal of
Operational Research vol. 139, 469-489.
Wireman, T. (1990). World Class Maintenance Management. New York: Industrial Press.
Wireman, T. (1998). Developing Performance Indicators for Managing Maintenance. Industrial Press.
Yamashina, H. (1995). Japanese manufacturing strategy and the role of total productive maintenance.
Journal of Quality in Maintenance Engineering 1 (1), 27-38.

81
Appendix A This thesis will not focus on every machine in the factory, but only on the machines that are responsible
for most of the downtime. The two machines that cause the most technical downtime are the CMK9,
also called the 21-IM-03, and the Vento, also called the 21-IM-05 or the Cartonater, as is the name that
operators give it.
Both machines receive sacks with Cruesli. The sacks need to be placed in a master carton. The machines
differ, the CMK9 is an ‘old’ machine which requires the operators to manually adjust the machine to
standard settings while the Vento machine is a ‘new’ machine that automatically adjusts the machine
based on the selected program with servomotors. Besides that, the CMK9 has one motor that drives
the machine while the Vento has multiple servomotors that each drive a system of the machine, the
functioning of the machines is the same. Both machines have an inventory area for the master carton,
a transport band to transfer sacks, a section to insert the sacks in the master carton, gluing section to
close the box and sensors to check if everything went well. If it fails, it is automatically pushed out of
the machine.
The master cartons are stored outside of the machine on a transport band. The machines move the
band when master cartons are needed. Master carton then enters the machine where it is opened and
the bottom is bent. Operators need to fill the inventory of master carton. The bomb bay supplies the
band with the Cruesli sacks. The sacks are aligned with the master carton and are pushed into the
master carton after which the master carton its bottom is glued. The box is also glued at the top and
transported past several sensors which check the gluing of the box. The boxes are then transported to
other machines, as described in Appendix B.

82
Appendix B In this Appendix, a brief description of the process of making the final product of Quaker Oats’ Cruesli
is described. The difference between the lines is briefly made clear and every machine its function is
stated. Machines at the beginning of the process have a low capacity while the capacity increases when
going through the process. This comes in handy since most problems with machines occur at a later
stage of the production. In theory, the ovens are the bottleneck since they have the lowest capacity.
There are projects to increase the output of the oven so the complete process of making Cruesli can
speed up. However, the ovens are sometimes unused because of breakdowns in the packaging or
addition lines or when the buffer is full, which makes machines the bottleneck. Not because of capacity
but because of reliability.
The first machine that the raw product goes through, is the roller. The roller rolls the raw product to
make it fit as input for the oven and ready to be mixed with other basic ingredients like sugar and
honey. Before the rolled products enter the oven, they are mixed with the other basic ingredients that
create the basic product mix. The mix is then baked in the oven. After the product is baked, it is broken
down in eatable sized Cruesli and filtered on size, too large Cruesli is broken again and too small Cruesli
is baked again in the hope that it forms a bigger part. All the perfectly sized Cruesli parts go to the silo
where they are stored for a while until the addition lines require the product. In the addition line, the
basic product is mixed with side ingredients like dried fruit, chocolate and nuts. After the addition line,
the final version of the Cruesli is complete. Cruesli is then transported via a conveyor belt to the dosing
machine which distributes the right amount of product to the bagmaker. The bagmaker fills the bags
with product and it seals the bag. This bag is then checked for its weight by the checkweigher and, in
case of line one and two transported to the merger or pushed out of the line if the weight is incorrect.
Every line has two bagmakers, whose output need to be merged to fit in the packing machine. The
merger merges the two lines coming from the bagmakers sacks. The sacks need to be distributed
evenly for the packing machine to handle the bags. The sacks with the Cruesli then reach the packing
machines, which places the sacks in a master carton (boxes). This box is checked for irregularities by
the X-ray machine, when there are no irregularities, the boxes are sent to the next packing machines
(the caser) which puts multiple boxes in a bigger box for transport. These big boxes are transported
through the storage hall, an area where the empty master cartons are stored, to the palletiser which
places the big boxes on a pallet. The last machines, the wrapper, wraps the pallets with foil and set
them ready for the forklift to place them in the inventory ready for shipment. For line three this is
slightly different, products from the checkweigher first have to be transported to the storage hall,
where line three is located, and then go to line three’s X-ray, caser and then continue with the
palletiser and wrapper of line one. The machines for line one and two are comparable while line three
uses different machines because of the product format.

83
Appendix C In this appendix Total Productive Maintenance (TPM) and Reliability Centred Maintenance (RCM) will
briefly be described.
TPM TPM aims to increase the availability/effectiveness of existing equipment in a given situation, through
the effort of minimising input (improving and maintaining equipment at the optimal level to reduce its
life cycle cost) and the investment in human resources which results in better hardware utilisation.
TPM originated from the KAIZEN philosophy, which means: continuously improve (Waeyenbergh,
2005). Another goal of TPM as stated by (Schippers, 2001) is to reduce and to control the variation in
a process. TPM originates from Japan and Nakajima (1988) defined it as a maintenance system. It
covers the entire life of equipment and involves all departments. It focusses on the relation between
production and maintenance in particular, but also continuous improvement of product quality,
operational efficiency, capacity assurance and safety (Chan, Lau, Ip, Chan, & Kong, 2005). TPM is an
aggressive strategy that shows a strong positive relationship with performance and focuses on
improving the function and design of the production equipment (Swanson, 2001). According to the
Nakajima (1988), the word ‘total’ in TPM has three meanings; (1) Total effectiveness indicates TPM’s
pursuit of economic efficiency and profitability. (2) Total maintenance system includes Maintenance
Prevention (MP) and Maintainability Improvement (MI), as well as PM. Basically, this refers to
‘‘maintenance-free’’ design through the incorporation of reliability, maintainability, and supportability
characteristics into the equipment design. (3) Total participation of all employees includes AM by
operators through small group activities. Essentially, maintenance is accomplished through a ‘team’
effort, with the operator being held responsible for the ultimate care of his/her equipment. Moreover,
the concept of TPM includes the following elements:
- maximise equipment effectiveness (overall efficiency).
- establishes a thorough system of PM for the equipment’s entire life span.
- implemented by various departments in a company.
- involve every single employee, from top management to workers on the shop floor.
- is based on the promotion of PM through ‘‘motivation management’’ involving small group
activities (Chan, Lau, Ip, Chan, & Kong, 2005).
Some state that TPM is more a management method instead of a maintenance concept, this is the
reason that some people talk about Total Productive Management instead of Maintenance
(Waeyenbergh, 2005).
RCM RCM is used to improve the overall equipment effectiveness while controlling the life-cycle costs. It
originates from the aeroplane industry which can be seen by the focus on maximum reliability. RCM
consists of six steps (Waeyenbergh, 2005):
- Decompose the system in items;
- Identify critical items;
- Evaluate failure effects and select maintenance tasks;
- Recommend modifications and identify corrective maintenance tasks;
- Select interval and group maintenance tasks;
- Gather information for feedback on the previously made decisions.
An evolution of RCM is RCM II, where for a large extent RCM is based on failure mode and effect
analysis (FMEA). RCM has four main goals (NASA, 2000):

84
- Realize inherent safety
- Restore equipment to these inherent levels
- Obtain information for design improvement
- Accomplish these goals at minimum cost
There are a couple of disadvantages of RCM:
- The complexity and required knowledge
- The need for data
- No feedback loop
- Can be very time-consuming
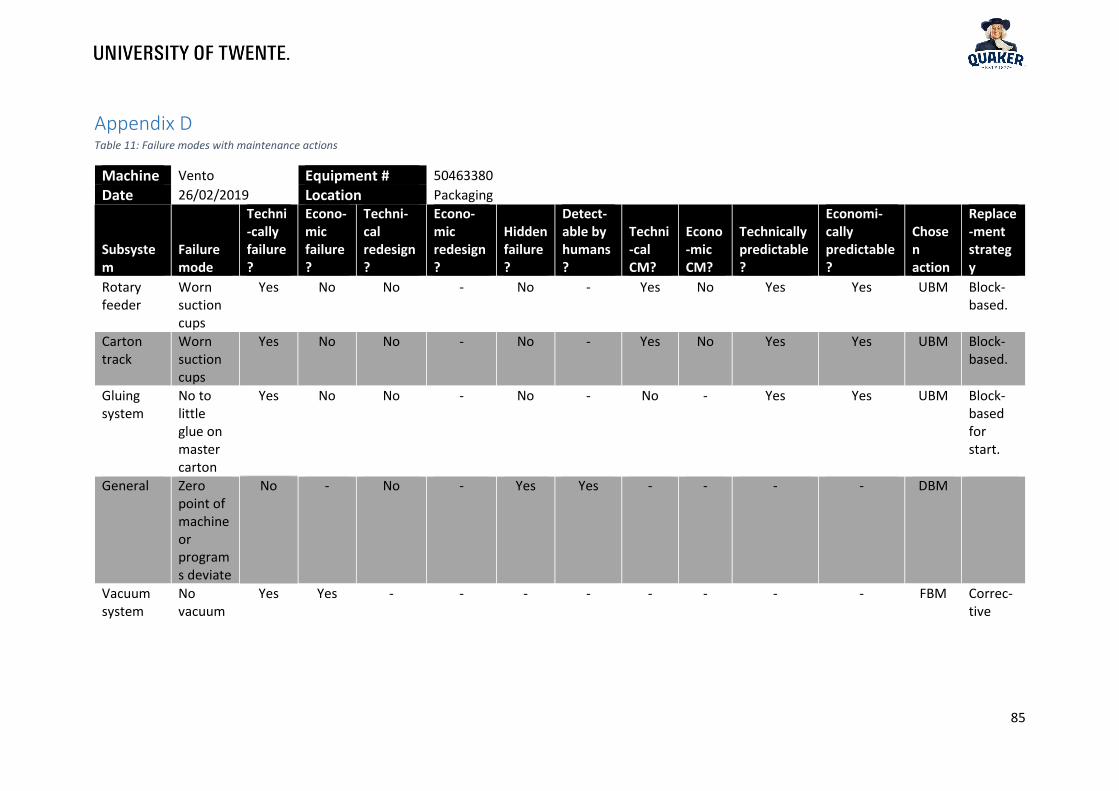
85
Appendix D Table 11: Failure modes with maintenance actions
Machine Vento Equipment # 50463380
Date 26/02/2019 Location Packaging
Subsystem
Failure mode
Techni-cally failure?
Econo-mic failure?
Techni-cal redesign?
Econo-mic redesign?
Hidden failure?
Detect-able by humans?
Techni-cal CM?
Econo-mic CM?
Technically predictable?
Economi-cally predictable?
Chosen action
Replace-ment strategy
Rotary feeder
Worn suction cups
Yes No No - No - Yes No Yes Yes UBM Block-based.
Carton track
Worn suction cups
Yes No No - No - Yes No Yes Yes UBM Block-based.
Gluing system
No to little glue on master carton
Yes No No - No - No - Yes Yes UBM Block-based for start.
General Zero point of machine or programs deviate
No - No - Yes Yes - - - - DBM
Vacuum system
No vacuum
Yes Yes - - - - - - - - FBM Correc-tive

86
In Table 11 the maintenance actions are shown. We will discuss every failure mode and explain how
we came to the corresponding maintenance actions. The Rotary feeder (and therefore Carton track) is
discussed in Section 4.3 and will therefore not be explained here. We will give our explanation based
on Figure 8. For more information on the failure modes, their cause and effect, see Table 8 and Section
4.2.2.
We start with the gluing system. Here the failure mode is that no to little glue comes on the master
carton. It is a critical part, so we must first ask if it is technically possible to let it fail. This is answered
with a yes, since no other parts are damaged. Participants of the FMECA session estimate that it is
economically not possible to let it fail since repairing and researching what went wrong takes too much
time and costs too much. It conflicts with the goal. It is not possible to redesign the nozzle (through
which the glue comes) and the failure is also not hidden, it is directly visible on the performance.
Participants of the FMECA sessions argue that the nozzle its condition cannot be monitored using
advanced techniques. One could measure the flow of glue, but they think that this wouldn’t fit in the
machine. It is possible to predict the error based on the usage, for instance the cartons that are glued
and the temperature of the glue. Since replacing the nozzle is relatively cheap (€69,-) compared to
downtime (€2000,-/hour) we choose to replace the nozzles based on cartons processed. As a strategy
we choose block-based. This has multiple reasons; the first is that this makes the planning easier and
the second is that both nozzles can then always be replaced at the same time, which reduces set-up
times.
The next system is general and the failure mode it that the zero points of the machines or its programs
deviate from the standard. It is a critical part since the machine crashes when points deviate too much.
It is therefore not possible to let it deviate since then the machine crashes and collateral damage
occurs. We cannot redesign the machine such that certain points do not deviate, because the machine
is subject to mechanical wear. We can however redesign the machine in such a way that deviations
are spotted earlier. The deviation is hidden since it does not directly impact performance, only when
it is severe enough. We can therefore inspect the machine on certain points to check what the state
of the deviation is. Quaker Oats should apply marks on the machine such that deviations can be easily
seen, also by the untrained eye.
The final system is the vacuum system with the corresponding failure mode: no vacuum. The cause of
this is a dirty filter. The vacuum system is a crucial part since the machine won’t work without a
vacuum. No vacuum due to a dirty filter does not result in much downtime or damage, the filter is
easily accessible and one of the first points of the problem-solving method. The filter is relatively cheap
and installing it does not take much time. Sometimes the filter only has to be cleaned. It can therefore
be correctively replaced.
Suctions cups and nozzle we have chosen block replacement as the strategy. This is because it is easier
to plan and Quaker Oats has problems with planning maintenance. It should therefore be as easy as
possible to plan the maintenance. We also see that the components are identical and therefore fail
around the same time. It is therefore not necessary to track the age of the individual components.