Embed Size (px)
Citation preview

Propriedades da Entropia
Paulo Sérgio RodriguesPEL205

Entropia Não-Extensiva
q
p
S
W
k
qi
1
11
Constantino Tsallis
Entropia Não-Extensiva
w
ikii
w
ikii
qi
q
w
iki
w
ik
qii
q
w
ik
qii
w
ik
qii
W
iki
W
k
qi
pp
ppq
pp
q
pp
q
pp
q
ppp
q
p
S
ln
ln1
1lim
1
1
lim
1
1
11
1
1
1
1
1
11
1

Additive property of Shannon Entropy
Tsallis Entropy formula
Pseudo-Additive property of Tsallis Entropy

Background and Foreground distribution
Background and Foreground Tsallis Entropy

Pseudo-Additivity for Background and Foreground distribution
Here, topt is ideal partition (that maximizes) the pseudo additivity of Tsallis Entropy

A new partition of Background and Foreground for new application of Tsallis entropy

Respectivelly news Tsallis entropy for the new background and foregrounds

General Equation of Pseudo-additivity for one recurssion

Here, topt is ideal partition (that maximizes) the pseudo additivity of Tsallis Entropy for the new partition
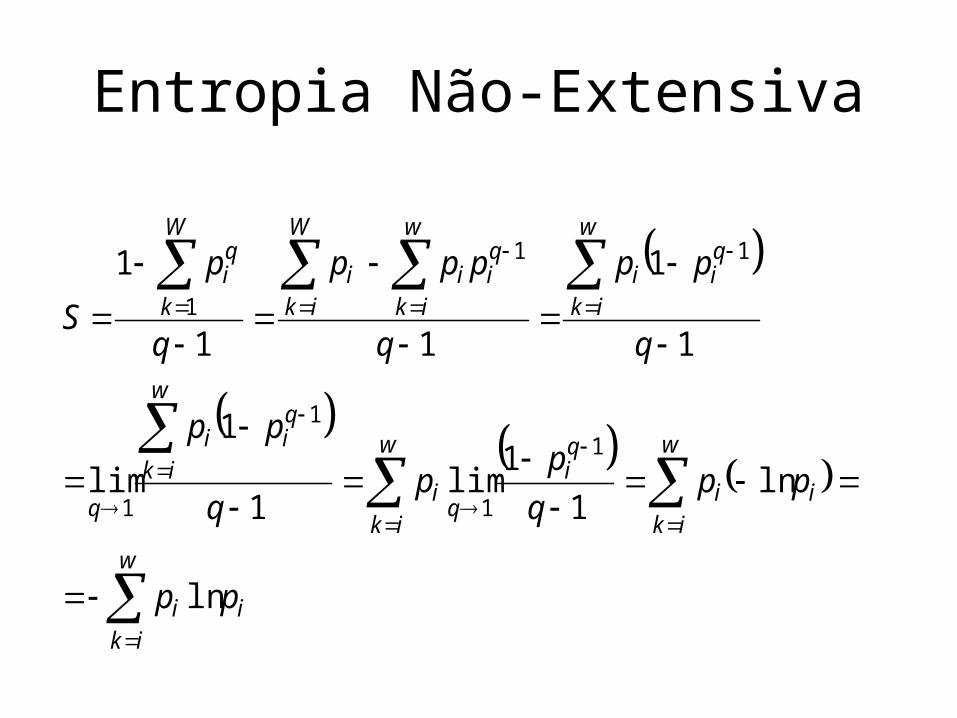
Ultrasound original Benign Tumor
Left Column: 1 recurssion; Right column: 3 recurssions row 1: q = 0.00001; row 2: q = 1.0 (Shannon) ; row 3: q = 4
Visual Segmentation Results

Left Column: 1 recurssion; Right column: 3 recurssions row 1: q = 0.00001; row 2: q = 1.0 (Shannon) ; row 3: q = 4
Ultrasound original Malignant Tumor
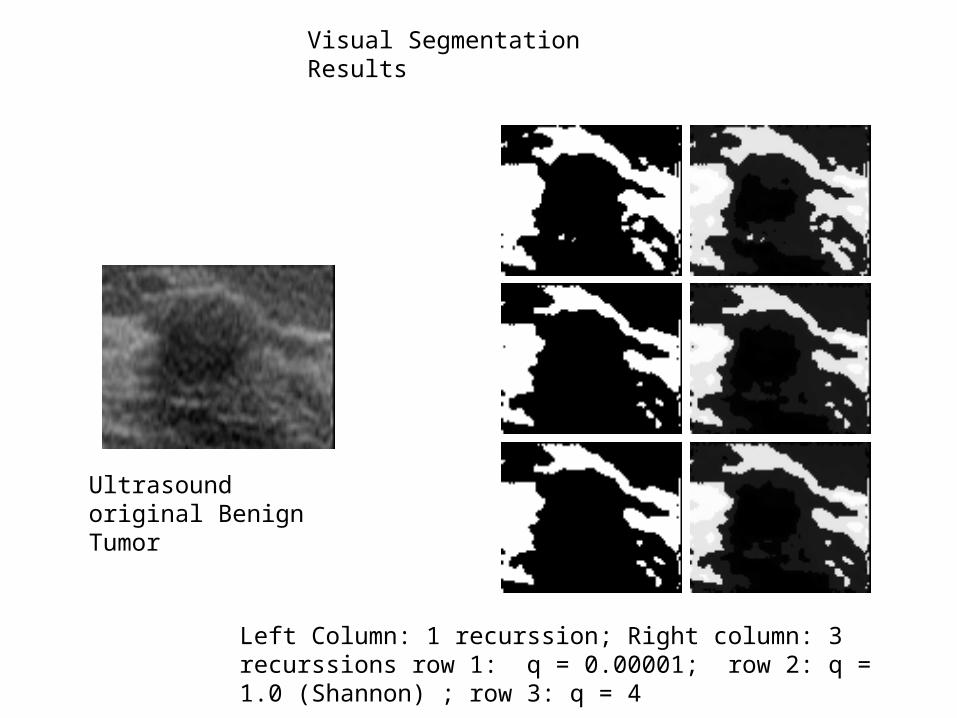
Visual Segmentation Results

Left upper: NESRA with 16 clusters (3 recurssions); right upper: fuzzy c-means with 16 clusters
Left bellow: k-means with 8 clusters; right bellow: SOM with 16 neurons
Visual Segmentation Results
Benign Tumor
Left upper: NESRA with 16 clusters (3 recurssions); right upper: fuzzy c-means with 16 clusters
Left bellow: k-means with 8 clusters; right bellow: SOM with 16 neurons
Visual Segmentation Results
Malignant Tumor

Results of application of three approaches for imagesegmentation: column 1: proposed (NESRA) method; column 2: bootstrap; column 3: fuzzy c-means
Some Natural Image Results
NESRA Bootstrap Fuzzy C-means

Results of application of three approaches for imagesegmentation: column 1: proposed (NESRA) method; column 2: bootstrap; column 3: fuzzy c-means
Some Natural Image Results
NESRA Bootstrap Fuzzy C-means

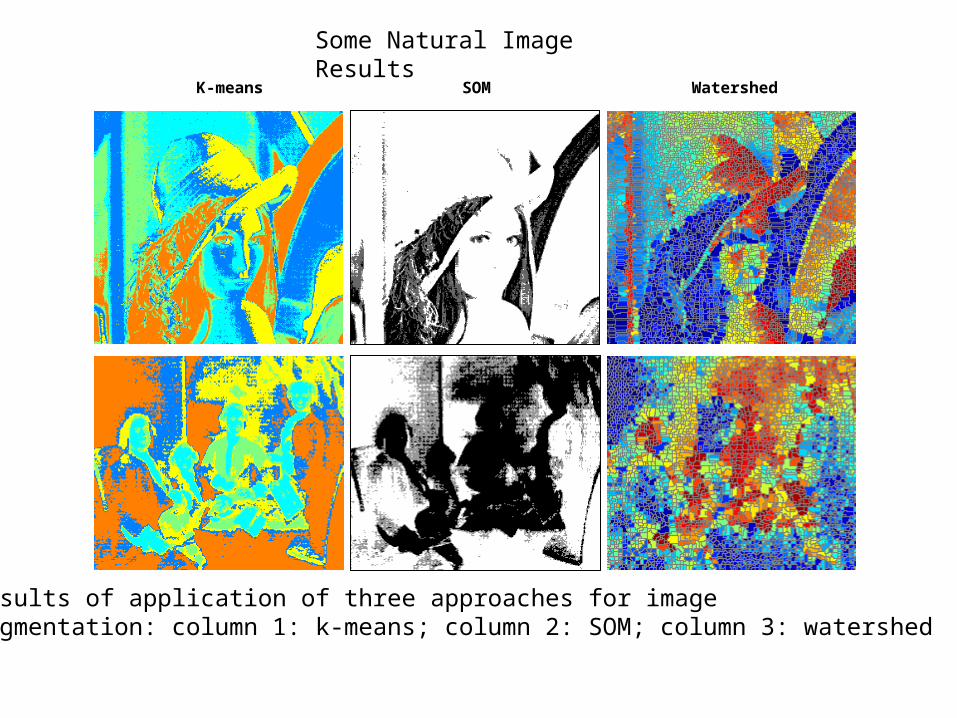
Results of application of three approaches for imagesegmentation: column 1: k-means; column 2: SOM; column 3: watershed
Some Natural Image Results
K-means SOM Watershed
Results of application of three approaches for imagesegmentation: column 1: k-means; column 2: SOM; column 3: watershed
Some Natural Image Results
K-means SOM Watershed

The synthetic image used to compare the robustness of the methods and increasing application of gaussian noise. The two concentric circles have radius 100 and 50, and the intensities for the background, outer and inner circles are 150, 100 and 50 respectively. The letfmost image is the original image; the three others, from left to right, have μ =0 and σ2 = 0.01,0.05 and 0.1 gaussian noise respectively.
Synthetic Image Results

The result segmentation of the six considered algorithms in this paper.In this illustration, for all the original image we have applied a gaussian noise with zero μ and σ2 = 0.1 which is the highest noise used, and after, a 9 x 9 2D adaptive filter was used for smoothing the noise. In the specific case of NESRA algorithm we use the parameter q = 0.001 since it generates the best visual result with more homogeneous and noiseless regions.
Synthetic Image Results
NESRA
Bootstrap
Fuzzy C-means K-means
SOM Watershed

The estimated (black ones) and original (white ones) curves superimposed over the original image corresponding to the segmentations of synthetic image. Only the watershed was traced manually since we do not have good precision of the boundary in this case.
NESRA
Bootstrap
Fuzzy C-means K-means
SOM Watershed
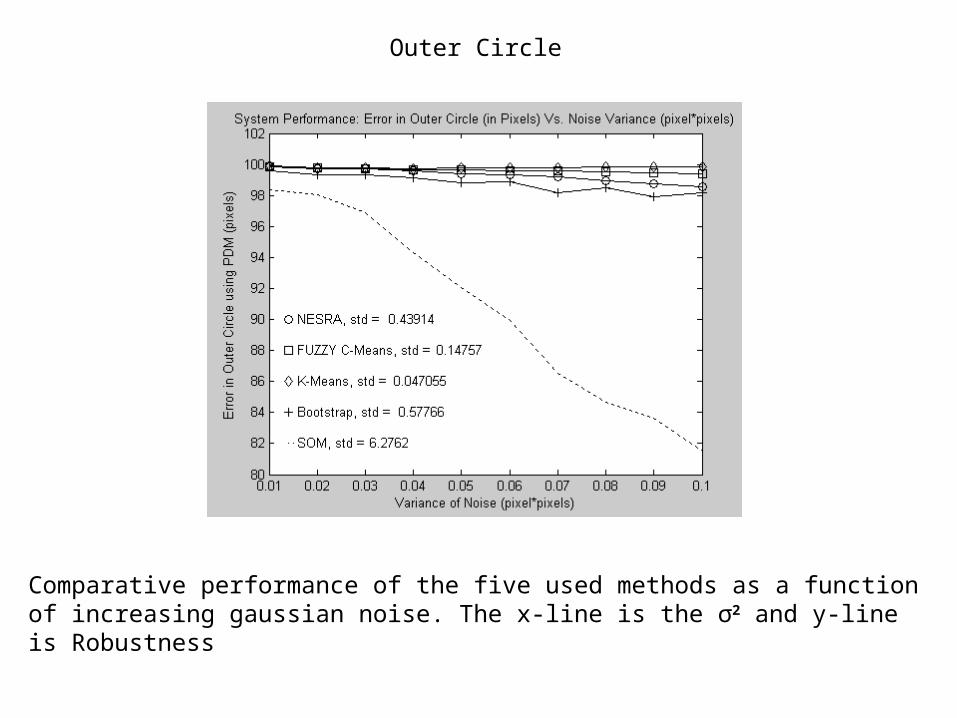
Comparative performance of the five used methods as a function of increasing gaussian noise. The x-line is the σ2 and y-line is Robustness
Outer Circle

Comparative performance of the five used methods as a function of increasing gaussian noise. The x-line is the σ2 and y-line is Robustness
Inner Circle

Comparative performance for the five used methods according to the estimated area inside inner, outer and background regions. The performance percentage is an average of the estimated area of the three regions. The x-line is the σ2 and y-line is the average of estimated area (for the three regions) divided by real area.
Performance in Achieving Homogeneous Regions