Embed Size (px)
Citation preview
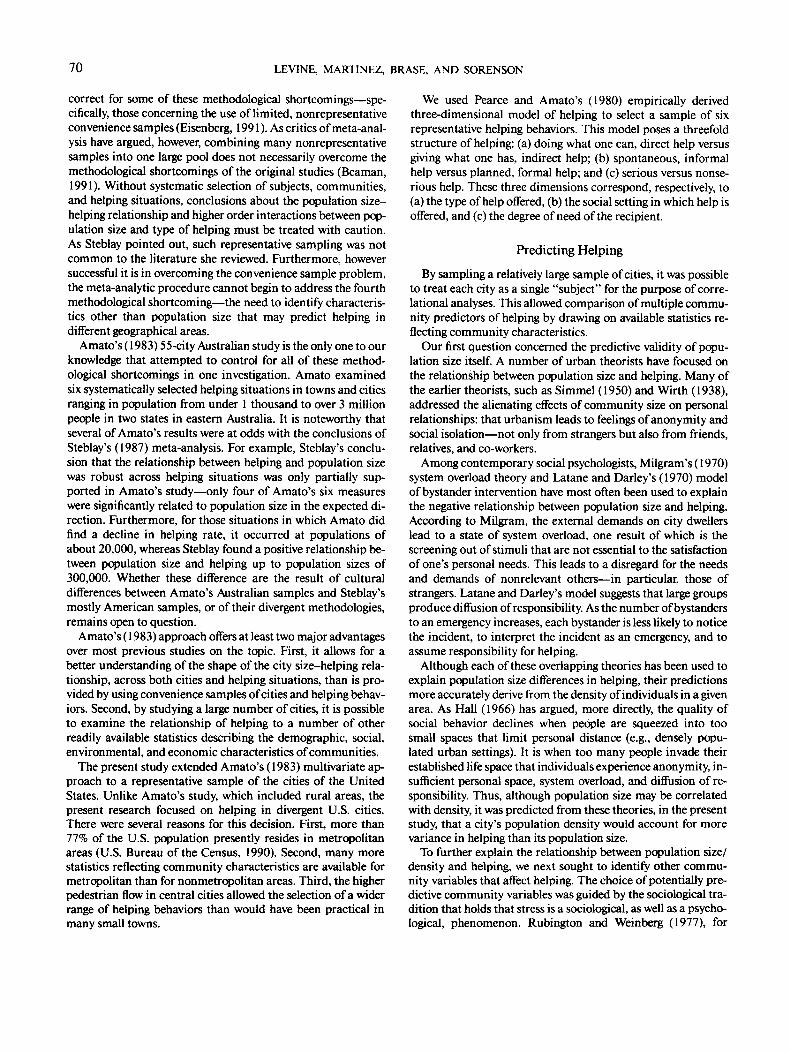
Journal of Personality and Social Psychology1994, Vol. 67, No. 1,69-82
Copyright 1994 by the American Psychological Association, Inc.0022-3514/94/S3.00
Helping in 36 U.S. Cities
Robert V. Levine, Todd Simon Martinez, Gary Brase, and Kerry Sorenson
A series of experiments examined the relationship of urbanism to helping. Six types of helpingbehaviors were studied in a cross-sample of 36 small, medium, and large cities across the UnitedStates. The relationship of helping to a series of statistics reflecting the demographic, social, environ-mental, and economic characteristics of these communities was then examined. The strongest andmost consistent predictor of overall helping was population density. There were significant corre-lations between economic indicators and helping in three situations. Helping in some situations alsotended to be negatively related to violent crime rates and to environmental problems.
Thomas Wolfe (1940) wrote that city people "have no man-ners, no courtesy, no consideration for the rights of others, andno humanity." Several studies offer evidence that this urban ste-reotype is widely shared in the United States. Krupat and Guild(1980), for example, reported that a sample of university stu-dents perceived cities as anonymous, impersonal, and unsafeand the "typical urbanite" as untrusting and uninvolved withothers. Schneider and Mockus (1974) reported that 79% of asample of university students believed that help from a strangerwas more likely to be received in a small town than in a largecity.
Many urban theorists have offered similarly unflattering de-scriptions of the "urban personality." Theorists ranging fromWirth (1938) and Simmel (1950) to Milgram (1970) have de-scribed the urban dweller as alienated, unresponsive, and un-helpful. Each hypothesized that the size of a community is neg-atively related to the likelihood of receiving help from a stranger.
This hypothesis has generated a large number of studies inthe helping literature. In a review of that research, Steblay(1987) found qualified support for the hypothesis of greater ru-ral helpfulness. In a total of 65 studies, 46 reported greater help-fulness in smaller areas, 9 found greater helpfulness in largerareas, and the remaining 10 reported no significant differences.A subsequent meta-analysis indicated a modest negative rela-tionship between population size and helping. The effect wasstronger for studies that defined population size as a contextvariable (i.e., whether helping occurred in a city or rural area)than for studies that defined population as a subject variable(i.e., the population of the city where the subject was raised).
Robert V. Levine, Todd Simon Martinez, Gary Brase, and Kerry Sor-enson, Department of Psychology, California State University, Fresno.
This research was partially supported by a grant from California StateUniversity, Fresno. We thank Philip Kimble and the Fresno FriendshipCenter for the Blind for generously providing white canes, training, andhelping us to understand the difficulties faced by blind people; Tony deCristafaro of United Way of America for generously providing statisticsfrom his organization; and Robert Cialdini, Harry Reis, and sevenanonymous reviewers for their comments on a draft of this article.
Correspondence concerning this article should be addressed to Rob-ert V. Levine, Department of Psychology, California State University,Fresno, California 93740-0011.
For the context-defined studies, a meta-analysis produced a sig-nificant (.29) effect size in support of the inverse helping-popu-lation size hypothesis, with the decline in helping rate beginningat population sizes of 300,000. Steblay reported that this rela-tionship was robust across variations in types of helping re-quests, as well as across subject and experimenter variables.
Methodological Criticisms
As Amato (1983) has pointed out, however, there have been anumber of methodological problems with these studies. First,the studies have relied almost exclusively on convenience sam-ples of a few readily testable large and small communities, mak-ing it difficult to generalize results to other communities. It alsomakes it difficult to determine the shape of the population size-helping relationship.
Second, issues concerning the sampling of helping behaviorshave been virtually ignored. Most studies have used conve-nience samples of one or two helping behaviors, from which itis difficult to generalize to a wider range of helping behaviors.This problem in generalization is further complicated by a lackof attention to systematic taxonomies of helping behaviors.Without such a classification scheme, it is difficult to gaugewhere on the spectrum any arbitrarily selected helping behaviorresides and, consequently, to determine which other helping be-haviors it might be related to.
Fourth, most studies have relied on the single indicator ofpopulation size to define urbanism. As many urban scholarshave pointed out, however, the "essence of cityness" comprisesa considerably more complex group of characteristics (e.g., Cut-ter, 1985; Fischer, 1976; Krupat & Guild, 1980; Levine, Mi-yake, & Lee, 1989). For one thing, other population size factors,such as population density, must also be considered. Other char-acteristics of the population, such as heterogeneity and stabilityof the population, may also be important. Finally, various be-havioral characteristics of geographically defined areas, such aseconomic vitality, the pace of life, and crime rates, may distin-guish cities from noncities and from each other. Previous re-search has made little attempt to identify the relevant commu-nity characteristics of urbanism that best predict helping behav-ior (see House & Wolf, 1978, for a notable exception).
The meta-analytic procedure Steblay (1987) used attempts to
69
70 LEVINE, MARTINEZ, BRASE, AND SORENSON
correct for some of these methodological shortcomings—spe-cifically, those concerning the use of limited, nonrepresentativeconvenience samples (Eisenberg, 1991). As critics of meta-anal-ysis have argued, however, combining many nonrepresentativesamples into one large pool does not necessarily overcome themethodological shortcomings of the original studies (Beaman,1991). Without systematic selection of subjects, communities,and helping situations, conclusions about the population size-helping relationship and higher order interactions between pop-ulation size and type of helping must be treated with caution.As Steblay pointed out, such representative sampling was notcommon to the literature she reviewed. Furthermore, howeversuccessful it is in overcoming the convenience sample problem,the meta-analytic procedure cannot begin to address the fourthmethodological shortcoming—the need to identify characteris-tics other than population size that may predict helping indifferent geographical areas.
Amato's (1983) 55-city Australian study is the only one to ourknowledge that attempted to control for all of these method-ological shortcomings in one investigation. Amato examinedsix systematically selected helping situations in towns and citiesranging in population from under 1 thousand to over 3 millionpeople in two states in eastern Australia. It is noteworthy thatseveral of Amato's results were at odds with the conclusions ofSteblay's (1987) meta-analysis. For example, Steblay's conclu-sion that the relationship between helping and population sizewas robust across helping situations was only partially sup-ported in Amato's study—only four of Amato's six measureswere significantly related to population size in the expected di-rection. Furthermore, for those situations in which Amato didfind a decline in helping rate, it occurred at populations ofabout 20,000, whereas Steblay found a positive relationship be-tween population size and helping up to population sizes of300,000. Whether these difference are the result of culturaldifferences between Amato's Australian samples and Steblay'smostly American samples, or of their divergent methodologies,remains open to question.
Amato's (1983) approach offers at least two major advantagesover most previous studies on the topic. First, it allows for abetter understanding of the shape of the city size-helping rela-tionship, across both cities and helping situations, than is pro-vided by using convenience samples of cities and helping behav-iors. Second, by studying a large number of cities, it is possibleto examine the relationship of helping to a number of otherreadily available statistics describing the demographic, social,environmental, and economic characteristics of communities.
The present study extended Amato's (1983) multivariate ap-proach to a representative sample of the cities of the UnitedStates. Unlike Amato's study, which included rural areas, thepresent research focused on helping in divergent U.S. cities.There were several reasons for this decision. First, more than77% of the U.S. population presently resides in metropolitanareas (U.S. Bureau of the Census, 1990). Second, many morestatistics reflecting community characteristics are available formetropolitan than for nonmetropolitan areas. Third, the higherpedestrian flow in central cities allowed the selection of a widerrange of helping behaviors than would have been practical inmany small towns.
We used Pearce and Amato's (1980) empirically derivedthree-dimensional model of helping to select a sample of sixrepresentative helping behaviors. This model poses a threefoldstructure of helping: (a) doing what one can, direct help versusgiving what one has, indirect help; (b) spontaneous, informalhelp versus planned, formal help; and (c) serious versus nonse-rious help. These three dimensions correspond, respectively, to(a) the type of help offered, (b) the social setting in which help isoffered, and (c) the degree of need of the recipient.
Predicting Helping
By sampling a relatively large sample of cities, it was possibleto treat each city as a single "subject" for the purpose of corre-lational analyses. This allowed comparison of multiple commu-nity predictors of helping by drawing on available statistics re-flecting community characteristics.
Our first question concerned the predictive validity of popu-lation size itself. A number of urban theorists have focused onthe relationship between population size and helping. Many ofthe earlier theorists, such as Simmel (1950) and Wirth (1938),addressed the alienating effects of community size on personalrelationships: that urbanism leads to feelings of anonymity andsocial isolation—not only from strangers but also from friends,relatives, and co-workers.
Among contemporary social psychologists, Milgram's (1970)system overload theory and Latane and Darley's (1970) modelof bystander intervention have most often been used to explainthe negative relationship between population size and helping.According to Milgram, the external demands on city dwellerslead to a state of system overload, one result of which is thescreening out of stimuli that are not essential to the satisfactionof one's personal needs. This leads to a disregard for the needsand demands of nonrelevant others—in particular, those ofstrangers. Latane and Darley's model suggests that large groupsproduce diffusion of responsibility. As the number of bystandersto an emergency increases, each bystander is less likely to noticethe incident, to interpret the incident as an emergency, and toassume responsibility for helping.
Although each of these overlapping theories has been used toexplain population size differences in helping, their predictionsmore accurately derive from the density of individuals in a givenarea. As Hall (1966) has argued, more directly, the quality ofsocial behavior declines when people are squeezed into toosmall spaces that limit personal distance (e.g., densely popu-lated urban settings). It is when too many people invade theirestablished life space that individuals experience anonymity, in-sufficient personal space, system overload, and diffusion of re-sponsibility. Thus, although population size may be correlatedwith density, it was predicted from these theories, in the presentstudy, that a city's population density would account for morevariance in helping than its population size.
To further explain the relationship between population size/density and helping, we next sought to identify other commu-nity variables that affect helping. The choice of potentially pre-dictive community variables was guided by the sociological tra-dition that holds that stress is a sociological, as well as a psycho-logical, phenomenon. Rubington and Weinberg (1977), for
HELPING IN 36 CITIES 71
example, have argued that urbanization may produce socialconditions that are disruptive to the functioning of the commu-nity. Linsky and Straus (1986) hypothesized that stressful socialconditions are associated with maladaptive individual behav-iors. They developed a state stress index for each of the 50 U.S.states by adding statistics reflecting the rate of occurrence of 15socioeconomic stressor events (e.g., unemployment rate, fre-quency of business failures, and rate of population change). Aspredicted, higher social stress levels were associated with a num-ber of pathologies, including high rates of crime and healthproblems.
Taking a similar approach, we hypothesized in the presentstudy that social stressors should also inhibit positive social be-haviors, particularly those between strangers. High populationsize/density may be associated with a number of stressful so-cial-environmental conditions that in turn produce the psycho-logical responses (e.g., alienation, system overload, and diffu-sion of responsibility) that inhibit helping behavior. Our goalwas to identify some of these social-environmental conditionsthat intervene between population size/density and the psycho-logical responses affecting helping.
Specifically, a review of the literature indicated six categoriesof social stressors associated with urbanism that may be disrup-tive to the community: (a) rate of population change (e.g., Ru-bington & Weinberg, 1977), (b) competition for resources andother economic pressures (e.g., Linsky & Straus, 1986), (c) arapid pace of life (e.g., Milgram, 1970), (d) stress on the envi-ronment (e.g., Zero Population Growth, 1991), and (e) deterio-ration in other more general conditions of a community's "qual-ity of life" (e.g., Levine et al., 1989). Each of these conditions, ithas been proposed, wears on the social order, resulting in anincrease in antisocial behaviors (in particular, [f] violent crime),which in themselves act as additional stressors on the commu-nity. According to the predictions, each of these social stressorsshould lead to psychological responses that are detrimental tothe social functioning of the community, including an inhibi-tion of helping behavior toward strangers. To test these predic-tions, the present study empirically examined the relationshipof each of these six categories of community stressors tohelping.
In summary, the main goals of the present research were,first, to investigate differences in helping behaviors across thecities and regions of the country; second, to investigate whetherpopulation density is a stronger predictor of helping behaviorthan population size; and, third, to identify other social-envi-ronmental community variables that intervene between popu-lation size/density and the psychological responses affectinghelping.
Method
Overview
Cities Used in the Study
Thirty-six U.S. cities and their surrounding metropolitan areas were"subjects" in the present study. In an attempt to achieve a cross-sampleof U.S. cities, three large (populations above 2,000,000), three medium-sized (populations between 950,000-1,450,000), and three smaller(populations between 350,000-600,000) cities were sampled in each ofthe four census-defined regions of the United States: the northeast,north central, south, and west. City size was based on population esti-mates for the greater metropolitan statistical area (MSA) or, when avail-able, the primary metropolitan statistical area (PMSA).1
In a previous study on the pace of life in U.S. cities, 36 small, me-dium, and large cities were sampled in each of the four regions of theUnited States (Levine, Lynch, Miyake, & Lucia, 1989). To be able toexamine the correlation between helping in the present study and thepace of life from the earlier study, we chose to use the same cities in thepresent study, so long as they continued to meet our criteria for citysize limits (with adjustments for population growth). Thirty-five of theoriginal 36 cities met these criteria. As a result, the final sample of citiesin the present study, with one exception, was identical to that from theearlier pace of life study.
It should be noted that, because of funding limitations, selection ofcities was not completely random in all cases. Within each of the 12categories (Population Size [3] X Region [4]), travel distance was a fac-tor in selection of locales. As a result, it might be noted, no cities fromthe Pacific Northwest, upper New England, Florida, or southern Texaswere sampled. Thus, although the four regions and three size categoriesdo represent the population of U.S. cities, sampling within each regionmay be somewhat biased. (For a more complete description of the pro-cedure for selecting cities in the original pace of life study, see Levine etal., 1989.) The final sample is presented in Table 1.
Selection of Helping Behaviors
We attempted to select helping behaviors that represented a widerange of points on the three dimensions in Pearce and Amato's (1980)taxonomy of helping (described earlier). Specifically, our list of six help-ing behaviors was aimed at two criteria: First, the situations should sam-ple a wide range on the spectrum of each dimension, and, second, thebehaviors should differ significantly from each other on at least one ofthe three dimensions.
To check that these criteria were met, the six helping situations weredescribed in detail to a sample of 78 undergraduate students, who werethen asked to rate each situation from 0 to 100 on each of the threedimensions. The respective mean ratings and corresponding standarddeviations for doing versus giving, spontaneous versus planned, and se-rious versus nonserious were as follows: (a) helping a blind person (M =15.5, SD = 22.3; M = 21.1, SD = 21.2; M = 42.3, SD = 31.6), (b) hurtleg(A/= 17.3, SD = 25.5; M= 13.3, SD = 22.0; M =42.4, SD = 30.8),(c) making change (M = 42.6, SD = 35.4; M = 25.7, SD = 28.3; M =
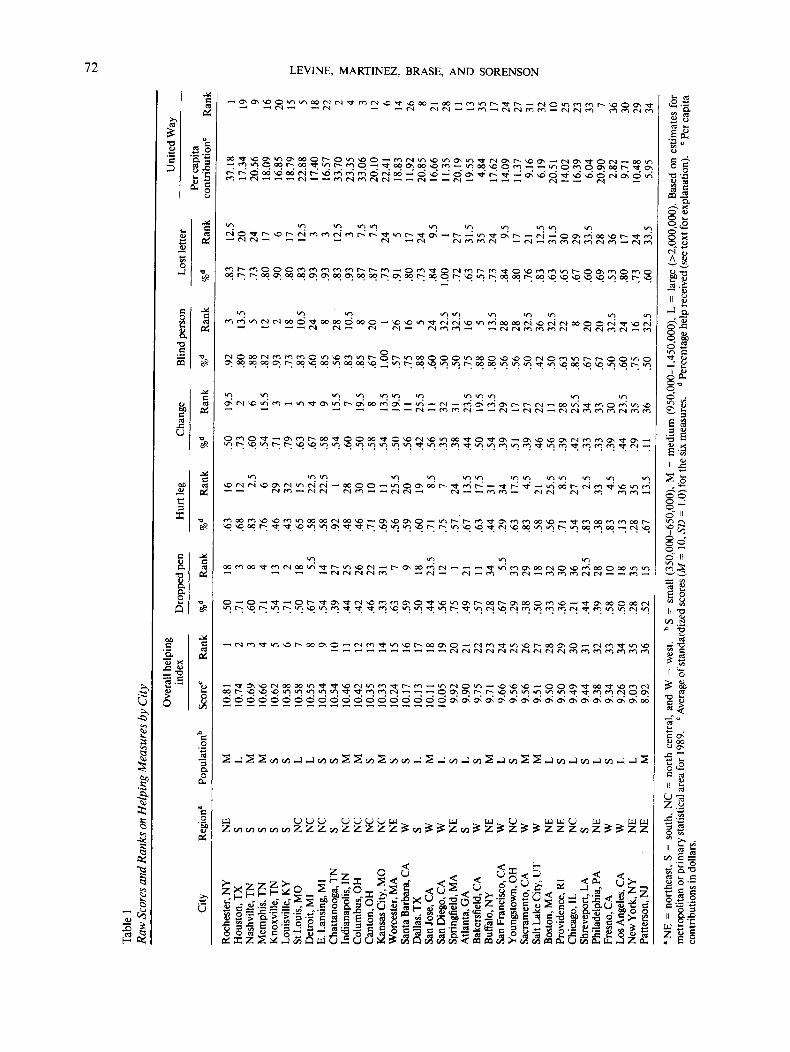
Six measures of helping were sampled in 36 metropolitan areas acrossthe United States. These measures were then related to available statis-tics reflecting the demographic, social, environmental, and economiccharacteristics of these communities.
1 According to the Office of Management and Budget, an area has tomeet one of two criteria to qualify as an MSA: It must include one citywith a minimum population of 50,000 or an urbanized area (embracingone or more towns) of at least 50,000 people located in one or morecounties with at least 100,000 people (75,000 in New England, wherePMSAs are the defining units). In both cases, the boundaries of theMSA include the surrounding county or counties (except in New En-gland, where designations are based on towns and cities; U.S. Bureau ofthe Census, 1990. For a further discussion of the distinction betweenMSAs, PMSAs, and cities and the sensibility of using MSA and PMSAboundaries rather than city limits to define metropolitan area demo-graphics, see Boyer & Savageau, 1989.)
72 LEVINE, MARTINEZ, BRASE, AND SORENSON
1B
S §
H*1
5
c73
i nO fN fN v
—* —• fN e*1
v~i iniy-j fsg fs,— fN fN
IaSQ
OSc"a13 ><
6
3
I5,
o"5b
1c§
aaiOO«in»«M»m(siotM)— — (N — — <N — — (N
»ri v^ \r> in in in »n
»n in ^ ^ " n i n i n i n i n i n <n
i (N (N — M - - r ^ m - (N(N (N c* r*"i r*1 —<
n ( N M n T r h ) o n-^ —" — (S (N (N (N
Z Z Z Z Z Z Z Z
?<s o°.u >;»? BS< ^
i&dsll
6>t i t Cop o O
HELPING IN 36 CITIES
United Way
73
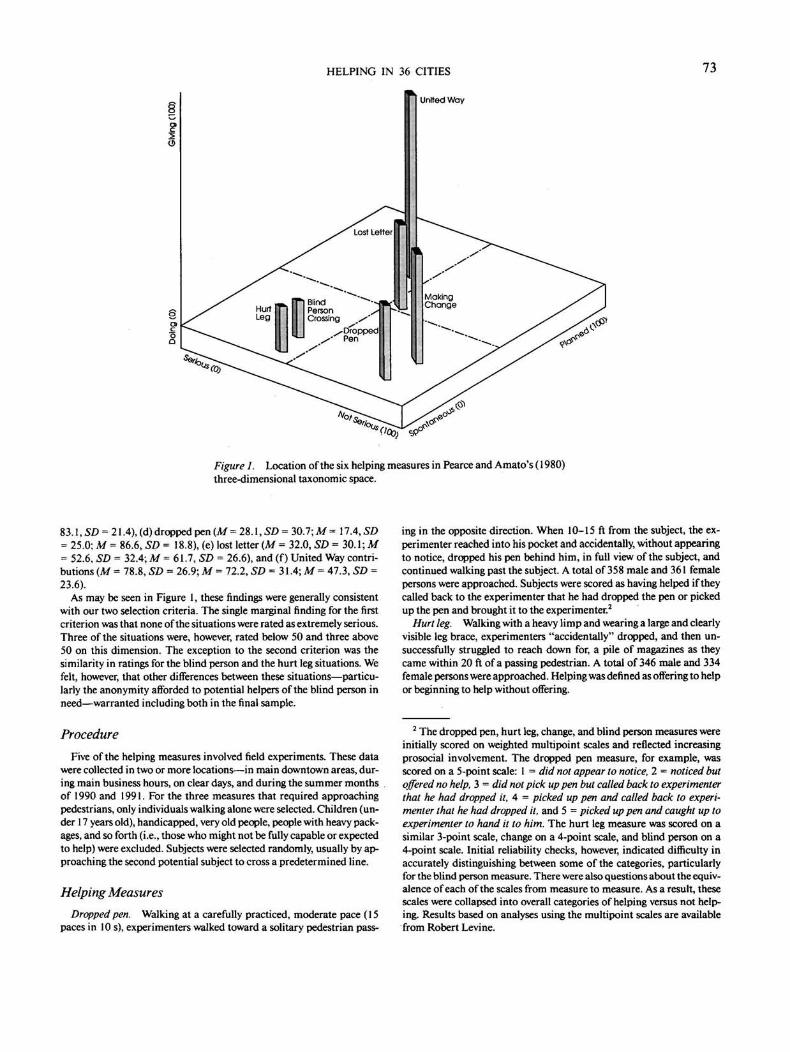
Figure 1. Location of the six helping measures in Pearce and Amato's (1980)three-dimensional taxonomic space.
83.1, SD = 21.4), (d) dropped pen (M = 28.1,50 = 30.7; M= MA, SD= 25.0; Af = 86.6, SD = 18.8), (e) lost letter (M = 32.0, SD = 30.1;Af= 52.6, SD = 32.4; M = 61.7, SD = 26.6), and (f) United Way contri-butions (M = 78.8, SD = 26.9; M = 72.2, SD = 31.4; M = 47.3, SD =23.6).
As may be seen in Figure 1, these findings were generally consistentwith our two selection criteria. The single marginal finding for the firstcriterion was that none of the situations were rated as extremely serious.Three of the situations were, however, rated below 50 and three above50 on this dimension. The exception to the second criterion was thesimilarity in ratings for the blind person and the hurt leg situations. Wefelt, however, that other differences between these situations—particu-larly the anonymity afforded to potential helpers of the blind person inneed—warranted including both in the final sample.
Procedure
Five of the helping measures involved field experiments. These datawere collected in two or more locations—in main downtown areas, dur-ing main business hours, on clear days, and during the summer monthsof 1990 and 1991. For the three measures that required approachingpedestrians, only individuals walking alone were selected. Children (un-der 17 years old), handicapped, very old people, people with heavy pack-ages, and so forth (i.e., those who might not be fully capable or expectedto help) were excluded. Subjects were selected randomly, usually by ap-proaching the second potential subject to cross a predetermined line.
Helping Measures
Dropped pen. Walking at a carefully practiced, moderate pace (15paces in 10 s), experimenters walked toward a solitary pedestrian pass-
ing in the opposite direction. When 10-15 ft from the subject, the ex-perimenter reached into his pocket and accidentally, without appearingto notice, dropped his pen behind him, in full view of the subject, andcontinued walking past the subject. A total of 358 male and 361 femalepersons were approached. Subjects were scored as having helped if theycalled back to the experimenter that he had dropped the pen or pickedup the pen and brought it to the experimenter.2
Hurt leg. Walking with a heavy limp and wearing a large and clearlyvisible leg brace, experimenters "accidentally" dropped, and then un-successfully struggled to reach down for, a pile of magazines as theycame within 20 ft of a passing pedestrian. A total of 346 male and 334female persons were approached. Helping was defined as offering to helpor beginning to help without offering.
2 The dropped pen, hurt leg, change, and blind person measures wereinitially scored on weighted multipoint scales and reflected increasingprosocial involvement. The dropped pen measure, for example, wasscored on a 5-point scale: 1 = did not appear to notice, 2 = noticed butoffered no help, 3 = did not pick up pen but called back to experimenterthat he had dropped it, 4 = picked up pen and called back to experi-menter that he had dropped it, and 5 = picked up pen and caught up toexperimenter to hand it to him. The hurt leg measure was scored on asimilar 3-point scale, change on a 4-point scale, and blind person on a4-point scale. Initial reliability checks, however, indicated difficulty inaccurately distinguishing between some of the categories, particularlyfor the blind person measure. There were also questions about the equiv-alence of each of the scales from measure to measure. As a result, thesescales were collapsed into overall categories of helping versus not help-ing. Results based on analyses using the multipoint scales are availablefrom Robert Levine.
74 LEVINE, MARTINEZ, BRASE, AND SORENSON
Change for a quarter. With a quarter in full view, experimenterswalked up to a pedestrian passing in the opposite direction and askedpolitely if the pedestrian could make change for a quarter. A total of 354male and 348 female persons were approached. Subjects were scored ashaving helped if they checked their pockets for change.
Helping a blind person cross the street. Experimenters, dressed indark glasses and carrying white canes, acted the role of a blind personneeding help crossing a street. (The canes, and training for the role, wereprovided by the Fresno Friendship Center for the Blind.)
Experimenters attempted to locate downtown corners with cross-walks, traffic signals, and moderate, steady pedestrian flow. Theystepped up to the corner just before the light turned green, held out theircane, and waited until someone offered help. A trial was terminatedafter the lesser of either 60 s or when the light turned red, after whichthe experimenter walked away from the corner. A total of 379 trials wereconducted. Helping was scored if subjects, at the minimum, informedthe experimenter that the light was green.
Lost letter. This experiment used Bihm, Gaudet, and Sale's (1979)variation of the classic lost letter technique. A neat hand-written note,"I found this next to your car," was placed on a stamped, addressedenvelope that was then left on the windshield of a randomly selected carparked at a meter in a main shopping area. (In one city, where no meterswere used in downtown areas, letters were left on cars in 1-hr parkingzones.) Letters were placed on autos parked far enough from each otherso that it was unlikely their drivers would have seen a similar letter/noteon other cars. Obviously wrecked cars were excluded. A total of 1,032letters were left. The percentage returned from each city served as thedependent variable.
United Way contributions. Per capita contributions to United Waycampaigns for each metropolitan area for the year 1990 were calculatedfrom the organization's records (United Way of America, 1991). (Themetropolitan areas denned by United Way, it should be noted, did notexactly correspond to the U.S. Census Bureau-defined MSAs in allcases.)
Experimenters
Four of the six helping behaviors required direct contact with sub-jects. Three experimenters were responsible for virtually all of this datacollection (in one city, a fourth experimenter assisted). In all but twocities, one experimenter collected all data. All experimenters were col-lege age and dressed neatly and casually. To control for experimentergender effects, all experimenters were male.
Again because of funding limitations, assignment of experimentersto cities was sometimes dictated by travel distances rather than randomselection. However, at least two experimenters were assigned locales ineach of the four regions and to cities in the different population sizecategories within each region. (Regional differences in helping wereminimal; see below.)
Several steps were taken to ensure standardization in scoring and tominimize experimenter effects. First, all experimenters received both adetailed instruction sheet and on-site field training for acting their roles,procedures for subject selection, and scoring of subjects. Second, theexperimenters practiced together and observed each other collectingdata in at least one city. Third, in all but one experiment, no verbalcommunication was required of experimenters.
Reliability checks were taken during training sessions to assess stan-dardization between experimenters in scoring subjects' responses. In-terexperimenter agreement was perfect on these trials (see Footnote 3).To further check for experimenter effects, experimenter differences inelicited helping were examined. A multivariate analysis of variance(MANOV\) indicated that there were significant differences betweenthe three experimenters on the four relevant helping measures (dropped
pen, hurt leg, asking for change, and blind person crossing street;Wilks's X = .27), approximate F(8, 56) = 4.61, p < .001. Univariateanalyses of variance (ANOVAs) indicated significant main effects forthree of these situations: hurt leg, F\2, 31) = 4.76, p < .02; asking forchange, F(2, 31)= 11.07, p < .01; and blind person crossing the street,F(2, 31) = 10.46, p< .001. No significant main effect was found for thedropped pen situation, F(2, 31) = 0.19, ns (the two cities where morethan one experimenter collected data were not used in these analyses).
Tukey post hoc comparisons indicated that all significant differenceswere accounted for by the lower helping rates elicited by one of the ex-perimenters. These lower rates, it was speculated, might be explainedby the fact that he was assigned more large cities (46%, or 6 of 13) thaneither of the other experimenters (26%, or 4 of 15, for the experimenterwith the highest helping rates and 33%, or 2 of 6, for the experimenterwith the second highest rates). To test this hypothesis, we conducted amultivariate analysis of covariance (ANCOVA) comparing the experi-menter with the lowest helping rates with those with the two highest andpartialing out for the effects of population size. The analysis partiallysupported the hypothesis. The resulting Wilks's lambda remained sig-nificant (.45), approximate F(8, 56) = 8.63, p < .001. However, univar-iate ANOVAs indicated significant main effects for only two of the ex-perimenter-sensitive situations: asking for change, F\2, 31)= 12.98, p <.001, and blind person crossing the street, F(2, 31) = 21.08, p < .001.The univariate main effects were not significant for the hurt leg, F(2,31 ) = 0.29, or dropped pen, F(2, 31) = 0.19, situations. The argumentthat the single experimenter's lower helping rates reflect factors otherthan experimenter effects was also supported by the fact that the citieshe measured were also significantly lower in helping on the two mea-sures that did not involve personal encounters: lost letters, F{2, 31) =3.09, p< .06, and United Way contributions, F(2, 31) = 3.67, p < .04.Still, the possibility that there were experimenter effects in the blindperson and asking for change situations cannot be completely ruled out.
Community Variables
Because the present study focused on city-level differences, our accessto statistics reflecting social-environmental stress was more limitedthan that for the Linsky and Straus (1986) study. Unlike the plethoraof relevant statistics that are available for state-level analyses, there isconsiderably less information available for U.S. cities and metropolitanareas. Statistics were found, however, for 11 potential social stressors.
Population demographics. Three indicators of the population char-acteristics of each MSA or PMSA were taken from U.S. Bureau of theCensus (1991) statistics for the year 1990: (a) population size, (b) popu-lation density (population per square mile), and (c) the percentage ofchange in population size from 1980 to 1990.
Although MSAs and PMSAs seemed the most valid units of measure-ment for these indicators, we also examined the relationship of helpingto the population size, population density, and population change ofeach "city" (from U.S. Bureau of the Census, 1990). The resulting cor-relations did not significantly differ from those obtained from MSA orPMSA statistics. These city data are not reported but are available fromRobert Levine.
Economic indicators. Two indicators of the economic status of eachMSA or PMSA were taken from U.S. Bureau of the Census (1990, 1991)statistics: (d) per capita personal income for the year 1988 and (e) un-employment rates for the year 1989. Also, (f) the average cost of livingwas estimated with Boyer and Savageau's (1989) combined cost of livingindex. This index draws on multiple government sources (see Boyer &Savageau, 1989) reflecting the cost of living in five areas: housing, food,transportation, health care, and taxes. Each of these figures is thenweighted according to its average proportion of expenditure and com-bined. (Unfortunately, Boyer and Savageau did not clearly present the

HELPING IN 36 CITIES 75
Table 2Intercorrelations of Helping Measures
Measure
1. Dropped pen2. Hurt leg3. Change4. Blind person5. Lost letter6. United Way7. Overall index
1
.06
.27-.07
.22-.06
.43"
2
.00-.10-.18
.00
.24
3
.42**
.45"
.38"
.78"
4
.05
.42"
. 5 3 "
5 6 7
.38*
.59** .66"
Note. All correlations are Pearson product-moment analyses; nin all cases.*p<.05. **p<.01.
36
formula they used to combine primary statistics into the cost of livingindex.) This cost of living index, in other words, is intended as an esti-mate of average effective buying income.
Quality of life measures. We also examined the relationship of help-ing to several aspects of the quality of life of each area: (g) Boyer andSavageau's (1989) index of the overall quality of life of each area, takenfrom their most recent Places Rated Almanac. This index is derivedfrom multiple indicators, mostly drawn from government statistics, innine domains: cost of living, jobs, climate, health care and environment,crime, transportation, education, the arts, and recreation (see Boyer &Savageau, 1989, for information about their primary sources). Theoverall quality of life score is then derived for each metropolitan area byadding, unweighted, its rank in each domain. (There is considerablecontroversy about the optimal formula for combining individual lifedomain scores into an overall index [see Cutter, 1985]. The Boyer andSavageau index was selected over other available places-rated indexesbecause it uses the most extensive list of primary sources. It is also prob-ably the most well-known. The selection was somewhat arbitrary, how-ever, as little validity or reliability data are available for any of theseindexes), (h) Violent and (i) property crime rates for 1990 (Federal Bu-reau of Investigation, 1990, were also included as part of the overallindex [g]). (j) Zero Population Growth's (1991) Environmental StressIndex was used as an indicator of enviornmental stress. This index ratesU.S. cities on five environmental stressors: air quality, water quality,sewage quality, toxic releases, and rate of population change, (k) Levineet al.'s (1989) index of the overall pace of life, based on field data re-flecting average walking speed, work speed, talking speed, and concernwith clock time, was used. These data were available for 35 of the 36cities used in the present study.
Results
Overall Helping Index
Although multiple measurements were taken for each helpingsituation in each city, it should be noted that, for purposes ofanalysis, each of the 36 cities was treated as one subject. Foreach city, the six measures of helping were converted to stan-dard scores (with M = 10, SD = 1.0), which were then averagedto produce an overall index. As shown in Table 2, this overallhelping index was significantly correlated with 5 of 6 of its com-ponents (p < .001, df= 35 in all cases) and positively correlatedin all six cases. The alpha for the six-item helping index was.51. The measure that, if deleted, would have raised the alphasignificantly was hurt leg (alpha if removed = .62). The resulting
alpha if any other measure were deleted would have been .27(change), .47 (blind person), .53 (dropped pen), .43 (lost letter),and .38 (United Way). Because the purpose of includingmultiple measures of helping was to achieve a representativesample of helping situations, rather than to necessarily identifya correlated group of measures, all six measures were retainedin the final index.
Table 2 also presents the intercorrelations among the helpingmeasures. In general, it may be seen, these intercorrelationswere low to moderate. Five of the 15 intercorrelations were sig-nificant, all in a positive direction. Asking for change correlatedmost significantly with four of the five other measures, whereasthe fewest significant correlations were found for the hurt legmeasure (zero).
Measures of skewness and kurtosis, gl and g2, were calcu-lated for dropped pen (gl = -.04, g2 = -.71), hurt leg (gl =- .58, g2 = -.71), asking for change (gl = -.25, g2 = .62), blindperson (gl = .01, g2 = - 1.2), lost letter (gl = -.22, g2 = -.59),United Way (gl = .52, g2 = .52), and overall helping index (gl= —.20, g2 = —1.21). A positive value for skewness indicates along right tail, and a negative value indicates a long left tail. Forkurtosis, a negative value indicates a shorter tailed distributionthan normal and a positive value indicates a longer tailed distri-bution than normal. It may be seen with the skewness statistics,then, that the proportion of help showed less deviation on thehigh end on the hurt leg and asking for change measures and onthe low end for the United Way measure. The kurtosis statisticsindicate that scores on the dropped pen, lost letter, and blindperson measures all showed lower than normal deviations at thetails of their distributions, whereas the opposite was true for thehurt leg, asking for change, and United Way measures.
Effects of Population Size and Region
A MANOVA examined regional differences on the six helpingindicators. Region (northeast, north central, south, and west)served as the independent variable, and the six helping indica-tors were used as dependent variables. Regional differences onthe overall helping index were tested by a one-way factorialANOV\. (Because the overall helping index was a linear combi-nation of the six separate indicators, it was not included in theabove MANOVA.)
There were significant differences for region of the countryon the overall helping measure and two of its components. Onthe MANOVA for the helping measures, Wilks's lambda was.246, approximate F(18, 76) = 2.74, p < .01. UnivariateANOVAs indicated significant main effects for the overall help-ing index, F(3, 32) = 5.59 p < .01; asking for change, F(3,32) =4.31, p<. 01; blind person, F(3,32) = 4.32,/x.Ol; and UnitedWay contributions, F(3, 32) = 4.73, p < .01. The main effectsfor the dropped pen, F(3, 32) = 2.28, p < .09); hurt leg, F(3,32) = 1.28; and lost letter, F(3, 32) = 1.85, measures were notsignificant.
As seen in Table 3, post hoc analyses indicated few consistenttrends for these regional differences. Overall, helping was great-est in the south and north central cities and least in the north-eastern and western cities. The significant main effects for theblind person and United Way measures were largely accounted

76 LEVINE, MARTINEZ, BRASE, AND SORENSON
Table 3Ranks and Scores on Helping Measures by Region of Country
Region
SouthNorth centralNortheastWest
Overall helping
Rank
1234
M
10.37a
10.25,,b
9.7 W9.67e
Dropped pen
Rank
1423
M
0.570.430.530.45
Hurt leg
Rank
1324
M
0.690.590.600.53
Change
Rank
1243
M
O.57a
0.56a
0.450.40b
Blind person
Rank
1.51.543
M
O.78b
0.78b0.59a
0.65
Lost letter
Rank
2134
M
0.760.840.750.72
United Way
Rank
2134
M
19.09b20.39b19.08b18.41,
Note. Lower ranks and higher means indicate greater helping; regional means with different subscripts are significantly different at the .05 level byTukey post hoc comparisons. Means represent T score with M = 10 and SD = 1.0 for overall helping, per capita contributions for United Way, andaverage percentage of helping for all other measures, n = 9 for each region.
for by the low helping scores in the west. The ranks and scoreson each measure for the 36 cities, taken separately, are pre-sented in Table 1.
Gender Differences
Although gender differences in helping were not a major focusof the present study, we did compare the proportion of menversus women who helped in the four applicable situations. Forthe three experiments where subjects were targeted by the ex-perimenter (hurt leg, dropped pen, and asking for change), itwas possible to observe gender differences in the proportion ofindividuals offering help. In the fourth direct contact experi-ment, the blind person situation, experimenters found that theywere unable to accurately count the number of men and women(the potential helping pool) who were waiting at each stoplight.Thus, it was not possible to measure the proportion of men andwomen who offered help. We did calculate the actual number ofmen versus women who helped, but it should be noted that thesedifferences may not reflect the proportion of helpers.
Gender differences were analyzed by a series of two-wayM ANOVAs, using gender and city size as independent measuresand the four experimenter-sensitive helping measures as depen-dent measures. City size was included in these analyses to testfor possible Gender X Size interactions. (Main effects for sizeare discussed earlier in this section.) Wilks's lambda (.963), ap-proximate F(8, 128) = 0.30, for this interaction was not signifi-cant, however, nor were the interactions on any single measure.Wilks's overall lambda for gender main effects was significant(.765), approximate ^(4, 63) = 4.83, p < .01. UnivariateANOV\s indicated significant main effects for gender for threesituations. Men were significantly more likely to offer help inthe dropped pen (M = .54 for men and M = .44 for women),F(l, 66) = 5.37, p < .05; asking for change (M = .58 for menand M = .40 for women), F( 1, 66) = 16.10, p < .001; and blindperson (M = 4.33 for men and M = 3.13 for women), F{\, 66)= 7.37, p < .01, situations. The difference between men andwomen on helping in the hurt leg situation was not significant(M = .57 for men and M = .63 for women), F(l, 66) = 1.45.The significant gender differences for the first three situationsare, of course, consistent with previous literature on helping(e.g., Dovidio, Piliavin, Gaertner, Schroeder, & Clark, 1991).They are easily explainable by the added fears that women bring
to situations requiring interaction with strangers, particularlywhen the strangers are men. The lack of significant differencesfor the hurt leg situation is more difficult to understand. Thedata may reflect the fact that the hurt leg situation presented animmobile stranger, who may have been seen as less threateningthan the strangers in the dropped pen and asking for changesituations. This argument should, however, also apply to theblind person situation. It would be interesting, of course, to sys-tematically study the interaction between experimenter andhelper gender in a future study of this sort.3
Most important, the goal of the present study was to averageacross genders in each city rather than to focus on genderdifferences. Thus, for purposes of all city-level analyses pre-sented, total city scores on the dropped pen, asking for change,and hurt leg situations were derived by averaging the proportionof male and female helpers in each city. This corrected for anygender effects resulting from differences in the total number ofmen versus women sampled in each city.
Relationship of Community Variables to Helping
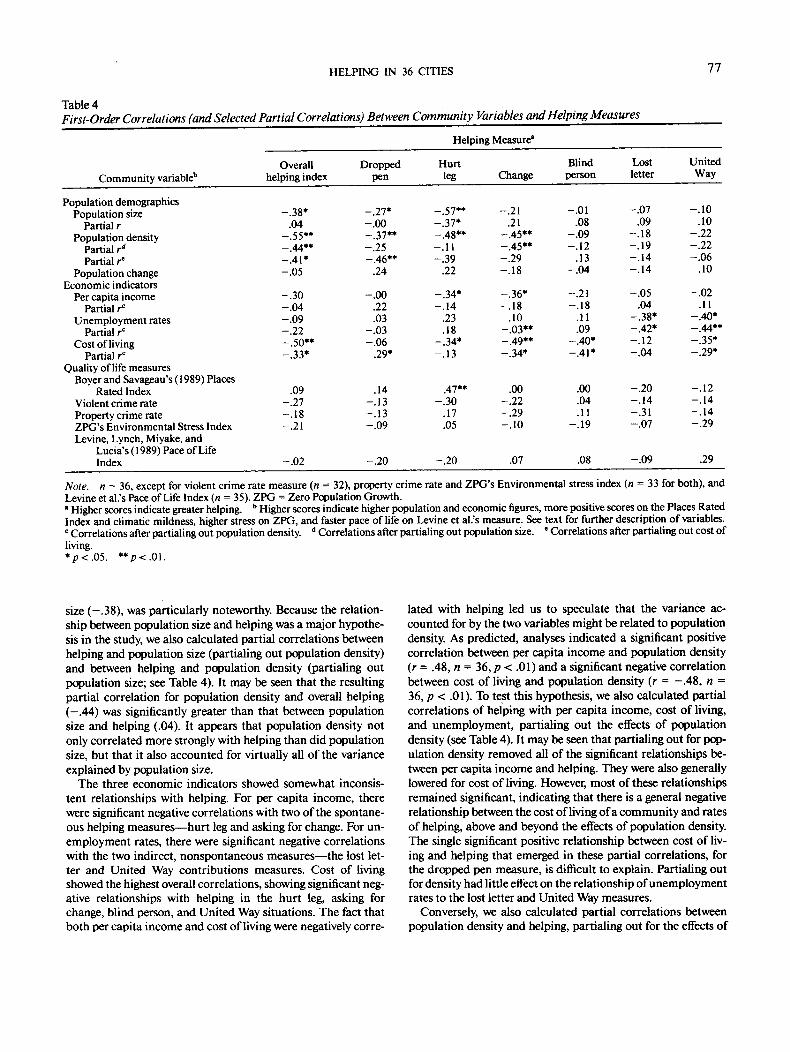
First-order correlations. Table 4 presents first-order corre-lations among the 11 community variables and each of the help-ing measures. Note, again, that these correlation analyses treateach of the 36 cities as a single subject. Given the large numberof predictor variables for a sample of 36 cities, then, these re-sults must be treated cautiously.
For the population demographics variables, helping showedsignificant negative correlations with population density on twoof the four helping situations that involved "spontaneous" re-sponses (dropped pen, hurt leg, and asking for change) and withpopulation size on two of these measures (dropped pen and hurtleg). Both also showed significant negative correlations with theoverall helping index. Change in population size over the lastdecade was not significantly related to any of the helping mea-sures.
The strong negative relationship (r = -.55) between overallhelping and population density, and the fact that this correlationwas higher than that between overall helping and population
3 Gender differences for all other analyses are available from RobertLevine.
HELPING IN 36 CITIES 77
Table 4First-Order Correlations (and Selected Partial Correlations) Between Community Variables and Helping Measures
Helping Measure*
Community variable1"Overall
helping indexDropped
penHurtleg Change
Blindperson
Lostletter
UnitedWay
Population demographicsPopulation size —.38*
Partial r .04Population density - .55**
Partial r" - . 4 4 "Partial r' - . 4 1 *
Population change - .05Economic indicators
Per capita income - .30Partial rc - .04
Unemployment rates - .09Partial rc - . 22
Cost of living -.50**Partial rc - . 3 3 *
Quality of life measuresBoyer and Savageau's (1989) Places
Rated Index .09Violent crime rate - .27Property crime rate - .18ZPG's Environmental Stress Index - .21Levine, Lynch, Miyake, and
Lucia's (1989) Pace of LifeIndex - .02
.27*
.00
.37**
.25
.46**
.24
.00
.22
.03
.03
.06
.29*
.14
.13
.13
.09
-.57**- .37*-.48**- .11- .39
.22
- .34*- .14
.23
.18- .34*- .13
.47**- .30
.17
.05
- .21.21
- .45**- .45**- .29- .18
- .36*- .18
.10- .03**-.49**- .34*
.00- .22- .29- .10
- .01.08
- .09- .12
.13- .04
- .21- .18
.11
.09- .40*- . 4 1 *
.00
.04
.11- .19
- .07.09
- .18- .19- .14- .14
- .05.04
- .38*- .42*- .12- .04
- .20- .14- .31- .07
- .10.10
- .22- .22- .06
.10
- .02.11
- .40*- .44*- . 35*- .29*
- .12- .14- .14- .29
-.20 -.20 .07 .08 - .09 .29
Note, n = 36, except for violent crime rate measure (n = 32), property crime rate and ZPG's Environmental stress index (n = 33 for both), andLevine et al.'s Pace of Life Index (n = 35). ZPG = Zero Population Growth.* Higher scores indicate greater helping. b Higher scores indicate higher population and economic figures, more positive scores on the Places RatedIndex and climatic mildness, higher stress on ZPG, and faster pace of life on Levine et al.'s measure. See text for further description of variables.c Correlations after partialing out population density. d Correlations after partialing out population size. e Correlations after partialing out cost ofliving.*/><.05. **/><.01.
size (-.38), was particularly noteworthy. Because the relation-ship between population size and helping was a major hypothe-sis in the study, we also calculated partial correlations betweenhelping and population size (partialing out population density)and between helping and population density (partialing outpopulation size; see Table 4). It may be seen that the resultingpartial correlation for population density and overall helping(—.44) was significantly greater than that between populationsize and helping (.04). It appears that population density notonly correlated more strongly with helping than did populationsize, but that it also accounted for virtually all of the varianceexplained by population size.
The three economic indicators showed somewhat inconsis-tent relationships with helping. For per capita income, therewere significant negative correlations with two of the spontane-ous helping measures—hurt leg and asking for change. For un-employment rates, there were significant negative correlationswith the two indirect, nonspontaneous measures—the lost let-ter and United Way contributions measures. Cost of livingshowed the highest overall correlations, showing significant neg-ative relationships with helping in the hurt leg, asking forchange, blind person, and United Way situations. The fact thatboth per capita income and cost of living were negatively corre-
lated with helping led us to speculate that the variance ac-counted for by the two variables might be related to populationdensity. As predicted, analyses indicated a significant positivecorrelation between per capita income and population density(r = .48, n = 36, p < .01) and a significant negative correlationbetween cost of living and population density (r = -.48, n =36, p < .01). To test this hypothesis, we also calculated partialcorrelations of helping with per capita income, cost of living,and unemployment, partialing out the effects of populationdensity (see Table 4). It may be seen that partialing out for pop-ulation density removed all of the significant relationships be-tween per capita income and helping. They were also generallylowered for cost of living. However, most of these relationshipsremained significant, indicating that there is a general negativerelationship between the cost of living of a community and ratesof helping, above and beyond the effects of population density.The single significant positive relationship between cost of liv-ing and helping that emerged in these partial correlations, forthe dropped pen measure, is difficult to explain. Partialing outfor density had little effect on the relationship of unemploymentrates to the lost letter and United Way measures.
Conversely, we also calculated partial correlations betweenpopulation density and helping, partialing out for the effects of
78 LEVINE, MARTINEZ, BRASE, AND SORENSON
the three economic indicators. The overall cost of living indexhad the strongest effect on these population density-helping cor-relations and are presented in Table 4. It may be seen that par-tialing out cost of living reduces the negative correlations ofdensity mostly with every measure other than in the blind per-son situation. All of these reductions, however, were moderate.These relationships are underscored by the multiple regressionanalyses presented below.
Two of the quality of life measures showed moderate, border-line significant, relationships with overall helping. Greater help-ing tended to occur in areas rated "healthier" on Zero Popula-tion Growth's Environmental Stress Index (r = -.30, n = 33, p< .09). Greater helping also tended to occur in areas with lowerrates of violent crime (r = -.32, n = 32, p < .06), particularly,once again, for three of the four spontaneous situations(dropped pen, hurt leg, and asking for change).
Boyer and Savageau's (1989) Places Rated Index showed littlerelationship with helping, with the exception that "better"places to live offered significantly more help in the hurt leg situ-ation. Although Levine et al.'s (1989) measure of the pace of lifedid not correlate significantly with overall helping, there was atendency for faster paced cities to give more to United Way (r =.29, n = 35, ns) and to help less in the hurt leg situation (r =—.20, n = 35, ns). Although these correlations were not signifi-cant, it is noteworthy that faster paced cities helped more inthe situation requiring giving and less in the situation requiringstopping one's activities and spontaneously doing.
Given the small sample (« = 36), it might be argued that thepresent findings be reported as significant at the. 10 level. This isparticularly relevant for findings in the hypothesized direction,which might be more appropriately evaluated using a one-tailedtest. Using these criteria, the borderline trends reported abovewould be statistically significant.
Multiple regression analyses. Seven of the community vari-ables were then simultaneously entered as predictors in a seriesof multiple regression analyses in which one of the seven helpingvariables served as the criterion variable. Given the large num-ber of predictor variables for the sample size, four communityvariables were excluded. (Note that N = 32 cities for these anal-yses because of unavailable data for 4 cities on some predictorvariables.) Because population density appeared to be the criti-cal variable in predicting helping, the other variables selectedfor these analyses were those with the lowest correlations (seeTable 5) and, assumably, the least overlap with population den-sity: population change, unemployment rates, property crime,environmental stress, and pace of life. After initial multiple re-gression analyses indicated generally modest multiple corre-lations with this combination of predictors,4 we also added costof living scores, which had shown high bivariate correlationswith helping.4
As can be seen in Table 6, when the seven community vari-ables were optimally combined, the resulting uncorrectedmultiple correlations were generally high: R — .48 for droppedpen, .55 for hurt leg, .63 for asking for change, .55 for blindperson, .62 for lost letter, .70 for United Way, and .72 for overallhelping (dfs = 7 and 24 in all cases, reflecting missing data forfour cities). The adjusted multiple correlation values, whichtake into account the sample size and number of predictors,
were smaller but also highly significant for four of the situationsand for the overall index: R = .07 for dropped pen, .32 for hurtleg, .47 for asking for change, .32 for blind person, .45 for lostletter, .59 for United Way, and .61 for overall helping. It appears,then, that this heterogeneous set of community variables, whenoptimally combined in multiple regression formulas, success-fully predicted helping in most of the helping situations.
Although population density was again the most consistentlystrong predictor of helping in these multiple regression analyses,these results indicate the importance of economic variables inpredicting helping. Either unemployment or cost of living wasthe strongest predictor in four situations (asking for change,blind person, letter, and United Way) and in overall helping.These findings are consistent with the partial correlations in Ta-ble 4 that indicate that partialing out for cost of living resultedin somewhat lowered correlations of density with most of thehelping measures. In many helping situations, it appears, eco-nomic factors explain at least some of the variance in helpingbehaviors accounted for by population density. Given the corre-lational nature of these findings, of course, the data do not sup-port inferences of cause and effect.
In general, these analyses did not strongly support the valueof multiple indicators of urbanism in predicting helping, at leastfor the indicators included in this study. First, no more thanone variable accounted for significant variance in any of themultiple regression formulas. Second, the multiple correlationswere significantly higher than the bivariate correlations for thehighest single predictor in each situation. For four dependentmeasures (overall helping, pen, leg, and change), the multiplecorrelations were not significantly higher than the simple corre-lations between population density and helping. For example,population density correlated —.55 with overall helping,whereas the multiple correlation was .72 and the adjustedmultiple correlation was .61. Similarly, the multiple corre-lations were not significantly higher than the bivariate corre-lations with cost of living for the blind person and United Waymeasures or with the bivariate correlations for unemploymentrates for the lost letter measure. The significance of the differ-ences between the highest single predictor and the multiple cor-relation (uncorrected) in each situation was calculated with ther-to-z transformation formula (Hays, 1973). The resulting stan-dard scores were all nonsignificant: z = .528 for dropped pen,.374 for hurt leg, .805 for asking for change, .764 for blind per-son, 1.27 for lost letter, 1.74 for United Way, and .255 for overallhelping.
Discussion
Importance of Population Density
Perhaps the strongest finding in the present study was the highnegative correlation between population density and helping. Aspredicted, population size also showed a significant negative corre-lation with helping. The correlation for population density, however,was both larger than that for population size and accounted for vir-tually all of the variance explained by population size.
1 These data are available from Robert Levine.
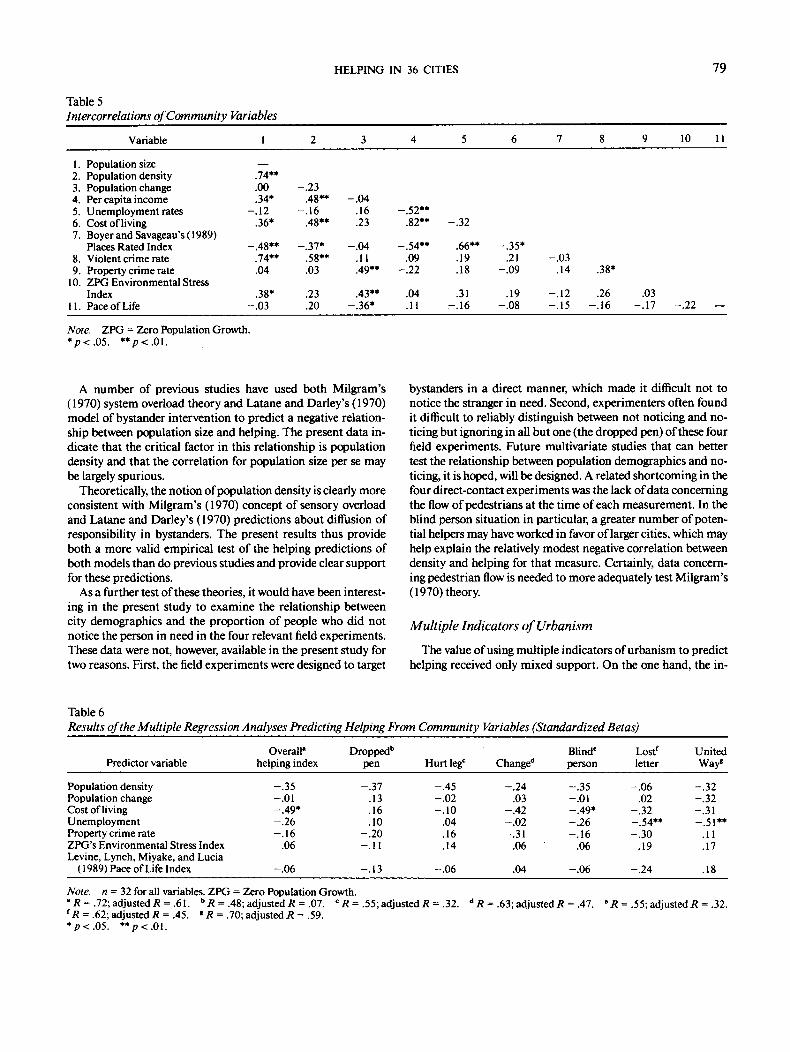
HELPING IN 36 CITIES 79
Table 5Intercorrelations of Community Variables
Variable
1. Population size2. Population density3. Population change4. Per capita income5. Unemployment rates6. Cost of living7. Boyer and Savageau's( 1989)
Places Rated Index8. Violent crime rate9. Property crime rate
10. ZPG Environmental StressIndex
11. Pace of Life
1
.74**
.00
.34*-.12
.36*
-.48**.74**.04
.38*-.03
2
-.23.48**
-.16.48**
-.37*.58**.03
.23
.20
3
-.04.16.23
-.04.11.49**
.43**-.36*
4
-.52**.82**
-.54**.09
-.22
.04
.11
5
-.32
.66**
.19
.18
.31-.16
6
-.35*.21
-.09
.19-.08
7
-.03.14
-.12-.15
8
.38*
.26-.16
9
.03-.17
10
-.22
11
—
Note. ZPG = Zero Population Growth.*p<.05. **p<.01.
A number of previous studies have used both Milgram's(1970) system overload theory and Latane and Darley's (1970)model of bystander intervention to predict a negative relation-ship between population size and helping. The present data in-dicate that the critical factor in this relationship is populationdensity and that the correlation for population size per se maybe largely spurious.
Theoretically, the notion of population density is clearly moreconsistent with Milgram's (1970) concept of sensory overloadand Latane and Darley's (1970) predictions about diffusion ofresponsibility in bystanders. The present results thus provideboth a more valid empirical test of the helping predictions ofboth models than do previous studies and provide clear supportfor these predictions.
As a further test of these theories, it would have been interest-ing in the present study to examine the relationship betweencity demographics and the proportion of people who did notnotice the person in need in the four relevant field experiments.These data were not, however, available in the present study fortwo reasons. First, the field experiments were designed to target
bystanders in a direct manner, which made it difficult not tonotice the stranger in need. Second, experimenters often foundit difficult to reliably distinguish between not noticing and no-ticing but ignoring in all but one (the dropped pen) of these fourfield experiments. Future multivariate studies that can bettertest the relationship between population demographics and no-ticing, it is hoped, will be designed. A related shortcoming in thefour direct-contact experiments was the lack of data concerningthe flow of pedestrians at the time of each measurement. In theblind person situation in particular, a greater number of poten-tial helpers may have worked in favor of larger cities, which mayhelp explain the relatively modest negative correlation betweendensity and helping for that measure. Certainly, data concern-ing pedestrian flow is needed to more adequately test Milgram's(1970) theory.
Multiple Indicators ofUrbanism
The value of using multiple indicators of urbanism to predicthelping received only mixed support. On the one hand, the in-
Table 6Results of the Multiple Regression Analyses Predicting Helping From Community Variables (Standardized Betas)
Predictor variable
Population densityPopulation changeCost of livingUnemploymentProperty crime rateZPG's Environmental Stress IndexLevine, Lynch, Miyake, and Lucia
(1989) Pace of Life Index
Overall*helping index
-.35-.01-.49*-.26-.16
.06
-.06
Dropped1"pen
-.37.13.16.10
-.20-.11
-.13
Hurt legc
-.45-.02-.10
.04
.16
.14
-.06
Change"
-.24.03
-.42-.02-.31
.06
.04
Blind'person
-.35-.01-.49*-.26-.16
.06
-.06
Lostf
letter
-.06.02
-.32-.54**-.30
.19
-.24
UnitedWay*
-.32-.32-.31-.51**
.11
.17
.18
Note. n = yi for all variables. ZPG = Zero Population Growth.1 R = .72; adjusted R = .61. b R = .48; adjusted R = .07. c R = .55; adjusted R = .32. " R = .63; adjusted R = .47. ' R ••{R = .62; adjusted R = .45. « R = .70; adjusted R = .59.*/><.05. **p<.01.
.55; adjusted R = . 32.
80 LEVINE, MARTINEZ, BRASE, AND SORENSON
crease in the predictive power of optimally combined multipleindicators of urbanism, above and beyond the effects of individ-ual predictors (population density for the overall helping, pen,leg, and change measures; cost of living for the blind person andUnited Way measures; and unemployment rates for the lost let-ter measure), was less than expected.
On the other hand, the differences in the variance accountedfor by individual predictors across situations, both in themultiple regression analyses and simple correlations, demon-strate the value of multiple predictors. It is significant, for ex-ample, that helping was best predicted by different communityvariables in different helping situations. Population densitytended to have the highest correlations in situations requiringspontaneous action (see below). This may, perhaps, indicatethat the sensory overload associated with population density isless salient when individuals are allowed to respond withouttime pressure. Cost of living, on the other hand, may be thecritical issue in charitable situations, such as that of UnitedWay, that require giving. The high negative correlation betweenunemployment rates and returning lost letters is particularlyinteresting. This may be a case where the availability of highconcentrations of individuals without significant restraints ontheir time results in increased help. Whereas cost of living maybe critical in situations requiring giving, high concentrationsof potential helpers (i.e., unemployed) appear to be critical inconditions requiring doing.
There were also borderline significant correlations of violentcrime rates with the two most direct face-to-face situations(hurt leg and change). This may be explained by Fischer's(1976) theory, which would predict that the prevalence of vio-lent crime leads to insecurity about social contact in direct con-frontations with strangers. Interestingly, property crime rateshad the highest negative correlations in the lost letter situation.Perhaps environments with high property crime rates developnorms that inhibit people from touching property that is nottheir own. The pace of life was not significantly correlated withhelping. However, it is interesting that fast pace was most nega-tively associated with helping in situations requiring doing(dropped pen and hurt leg), whereas it was positively related tohelp requiring giving (United Way). Although these correlationswere not significant, they point to the possibility that Milgram's(1970) assertion that the fast pace of cities may apply more tohelp requiring doing than to that requiring giving.
Given the correlational nature of the present study, of course,each of these interpretations is clearly speculative. All of thesecommunity variables, however, are defining characteristics ofurbanism and, at least to a limited degree, appear to predictdifferences in the likelihood that a stranger will be offered helpin some situations.
These findings lend at least modest support to sociologicaltheories that hold that urbanization may produce social-eco-nomic conditions that are disruptive to the functioning of thecommunity (e.g., Rubington & Weinberg, 1977). Although thedata do not provide strong support for any single moderatingvariable intervening between population density and helping,there was some support for theories that link the deleterioussocial effects of urbanism to economic pressures (e.g., Linsky &Straus, 1986). There was also weak support for theories linking
the deleterious effects of urbanism to increases in antisocial ac-tivity, particularly for the two measures that directly confrontedsubjects (hurt leg and change; e.g., Fischer, 1976; Linsky &Straus, 1986), and stress on the environment, particularly forthe least spontaneous measure (United Way contributions; e.g.,Zero Population Growth). Theories predicting decreases inhelping as a function of more general conditions of a communi-ty's quality of life (e.g., Cutter, 1985) were not supported by thepresent data.
Taxonomic Categories
The main intent of sampling helping from different taxo-nomic categories was to achieve a cross-sample of helping situ-ations rather than to explore the effects of these taxonomicdifferences on helping. It is interesting, however, to note trendsthat did emerge. The discussion above indicates, for example,that the category of giving versus doing may to some extent dis-tinguish between those helping situations that are affected bythe cost of living, unemployment, crime rates, and the pace oflife.
The strong relationship between population density also var-ied across situations. The taxonomic category of spontaneousversus planned was the best predictor of these differences, withone exception. The three measures (hurt leg, change, anddropped pen) that correlated significantly with population den-sity showed little uniformity on the doing versus giving and se-rious versus nonserious dimensions. All three measures were,however, rated high on spontaneity, and two of the three mea-sures (lost letters and United Way contributions) that did notsignificantly correlate with population density were rated lowon spontaneity. The exception to this trend was the blind personmeasure, which was rated high on spontaneity but did not sig-nificantly correlate with population density. It appears that, ingeneral, the inhibition against helping observed in urban areasmay be more common to situations that require spontaneousaction toward strangers.
Perhaps other taxonomic categories need to be developed todistinguish the blind person situation from the other three spon-taneous situations. One possibility concerns the degree of stig-matization of the victim, which was highest for the blind person.It may be that permanently handicapped individuals are ex-empted from fears about offering spontaneous help to strangersin large cities. Another possibility, which derives from the theo-ries of Simmel (1950), Wirth (1938), and Zimbardo (1970), isthe perceived anonymity with which helping can be offered.Helping can be offered to a blind person without compromisingone's anonymity. In areas of high population density, fear ofcrossing this norm of anonymity may be a critical deterrent tourban helping in spontaneous situations.
It would be helpful in future studies to systematically developand explore some of these other taxonomic dimensions of help-ing. One possibility would be to conduct postexperimental in-terviews with potential helpers. Another approach would be tohave people rate situations used in previous urbanism-helpingstudies on potentially useful dimensions and see which factorsbest discriminate between situations that did and did not pre-dict urban differences in helping. Steblay's (1987) meta-analytic

HELPING IN 36 CITIES 81
review of these previous studies might provide a starting pointfor that task.
It might be noted that a lack of attention to taxonomy is com-mon to research in most of the broader field prosocial behavior.In the recent Review of Personality and Social Psychology vol-ume on prosocial behavior, both Clark (1991) in her introduc-tion and Darley (1991) in his concluding chapter single out theneed to taxonomize and to address differences between types ofhelping behaviors as one of the most glaring in the prosocialliterature.
A Social Psychology of Places
Krupat and Guild (1980) have argued that the quality of lifein cities is a multidimensional concept, and reducing it to a sin-gle variable or score will inevitably prove inaccurate and mis-leading. The present study underscores the importance ofdesigning studies that allow a multivariate approach to thestudy of helping in cities. For one thing, multiple predictors ofhelping were available for analyses because we used a largeenough sample of cities to allow each city to be treated as asingle subject in correlational analyses. Differences in the pre-dictive validities of population density versus population size,for example, would not have been possible had we comparedonly two or three cities. Similarly, the relationship of economicvariables to helping in some situations, but not in others,emerged. Even the fact that the study was less successful thanwe hoped in using multiple indicators of urbanism to predicthelping underscores the importance of sampling cities. Withouta sufficient sample of cities, it would not have been possible toassess the relationship between multiple community indicatorsto helping.
The study also demonstrates the importance of usingmultiple measures of helping. There were generally modest in-tercorrelations among the six helping measures. On the onehand, this signals caution against generalizing about a city's"overall" tendency to help strangers. The overall rankings thatwere derived in the present study were clearly dependent on themeasures sampled and undoubtedly would have differed hadother helping behaviors been used or had some of the presentmeasures not been included. On the other hand, the sampling ofmultiple helping measures allows for more valid generalizationsabout the relationship of helping to other variables—such aspopulation density and size. It also allows comparison of therelationship of helping behaviors to each other. Most important,the results indicate a need to strive for a representative sampleof helping situations on the basis of a systematic taxonomy ofhelping situations.
The present study also, it is hoped, demonstrates the value ofa psychology of places—the systematic characterization of theattributes of environments and situations, as opposed to indi-viduals. Psychology has mostly ignored the stimulus side of thestimulus-response relationship, certainly when it comes tocharacterizing the urban environment. As Strauss (1976) hasargued, however, "the entire complex of urban life can bethought of as a person rather than a distinctive place, and thecity can be endowed with a personality of its own" (Krupat &Guild, 1980, p. 21).
In the present study, we have attempted to characterize onesalient dimension of cities' "personalities." In the process, wehave discovered relationships in the psychology of helping thatmight not be easily visible at the individual level of analysis.These findings may now be further explored at the individuallevel, resulting in a more complete understanding of the socialpsychology of helping.
Finally, our rankings of places may serve two practicalpurposes. First, they provide tangible information for self-studyof the quality of the helping environment in individual cities.Second, as social indicators, they may be compared over timewith marked trends in American urban life.
ReferencesAmato, P. R. (1983). Helping behavior in urban and rural environ-
ments: Field studies based on a taxonomic organization of helpingepisodes. Journal of Personality and Social Psychology, 45, 571-586.
Beaman, A. (1991). An empirical comparison of meta-analytic and tra-ditional reviews. Personality and Social Psychology Bulletin, 17,252-257.
Bihm, E., Gaudet, I., & Sale, O. (1979). Altruistic responses under con-ditions of anonymity. Journal of Social Psychology, 109, 25-30.
Boyer, R., & Savageau, D. (1989). Places rated almanac. New York:Prentice Hall.
Clark, M. (1991). Editor's introduction. In M. S. Clark (Ed.). Prosocialbehavior (pp. 7-8). Newbury Park, CA: Sage.
Cutter, S. L. (1985). Ratings places: A geographic view on the quality oflife. Washington, DC: Association of American Geographers.
Darley, J. (1991). Altruism and prosocial behavior research: Reflectionsand prospects. In M. S. Clark (Ed.), Prosocial behavior (pp. 312-327).Newbury Park, CA: Sage.
Dovidio, J., Piliavin, J., Gaertner, S., Schroeder, D., & Clark III, R.(1991). The arousal:cost-reward model and the process of interven-tion: A review of the evidence. In M. S. Clark (Ed.), Prosocial behav-ior (pp. 86-118). Newbury Park, CA: Sage.
Eisenberg, N. (1991). Meta-analytic contributions to the literature onprosocial behavior. Personality and Social Psychology Bulletin, 17,273-282.
Federal Bureau of Investigation. (1990, August 11). Uniform crime re-ports 1990: Crime in the United States. Washington, DC: U.S. Gov-ernment Printing Office.
Fischer, C. (1976). The urban experience. New York: Harcourt BraceJovanovich.
Hall, E. T. (1966). The hidden dimension. Garden City, NY: Doubleday.Hays, W. M. (1973). Statistics for the social sciences (2nd ed.). New
York: Holt.House, J. S., & Wolf, S. (1978). Effects of urban residence on interper-
sonal trust and helping behavior. Journal of Personality and SocialPsychology, 36, 1029-1043.
Krupat, E., & Guild, W. (1980). Denning the city: The use of objectiveand subjective measures for community description. Journal of So-cial Issues, 36(3), 9-28.
Latane, B., & Darley, J. M. (1970). The unresponsive bystander: Whydoesn't he help?New \brk: Appleton-Century-Crofts.
Levine, R., Lynch, K., Miyake, K., & Lucia, M. (1989). The Type Acity: Coronary heart disease and the pace of life. Journal of Behav-ioral Medicine, 12, 509-524.
Levine, R., Miyake, K.., & Lee M. (1989). Places rated revisited: Psycho-social pathology in metropolitan areas. Environment & Behavior, 21,531-553.
Linsky, A., & Straus, M. (1986). Social stress in the United States. Do-ver, MA: Auburn House.
82 LEVINE, MARTINEZ, BRASE, AND SORENSON
Milgram, S. (1970). The experience of living in cities. Science, 167,1461-1468.
Pearce, P. L., & Amato, P. R. (1980). A taxonomy of helping: A multi-dimensional scaling analysis. Social Psychology Quarterly, 43(4)363-371.
Rubington, E., & Weinberg, M. (1977). The study of social problems:Five perspectives. New York: Oxford University Press.
Schneider, F. W., & Mockus, Z. (1974). Failure to find a rural-urbandifference in incidence of altruistic behavior. Psychological Reports,35(1, Pt. 1), 294.
Simmel, G. (1950). The metropolis and mental life. In K. H. Wolff(Ed.),The sociology ofGeorg Simmel. New York: Free Press.
Steblay, N. M. (1987). Helping behavior in rural and urban environ-ments: A meta-analysis. Psychological Bulletin, 102, 346-356.
Strauss, A. L. (1976). Images of the American city. New Brunswick, NJ:Transaction Books.
U.S. Bureau of the Census. (1990). Statistical abstracts of the UnitedStates: 1990. Washington, DC: U.S. Government Printing Office.
U.S. Bureau of the Census. (1991). State and Metropolitan area DataBook, 1991. Washington, DC: U.S. Government Printing Office.
United Way. (1991). International Directory 1991. Alexandria, VA:United Way of America.
Wirth, I. (1938). Urbanism as a way of life. American Journal of Sociol-ogy, 44, 1-24.
Wolfe, T. (1940). The web and the rock. Garden City, NJ: Sundial Press.Zero Population Growth. (1991, April). Environmental stress index
[unnumbered insert]. The ZPG Reporter, p. 23.Zimbardo, P. (1970). The human choice: Individuation, reason, and or-
der versus deindividuation, impulse and chaos. Nebraska Symposiumon Motivation. Lincoln: University of Nebraska Press.
Received July 23, 1992Revision received September 20, 1993
Accepted February 10, 1994
AMERICAN PSYCHOLOGICAL ASSOCIATION
SUBSCRIPTION CLAIMS INFORMATION Today's Date:.
We provide this form to assist members, institutions, and nonmember individuals with any subscription problems. With theappropriate information we can begin a resolution. If you use the services of an agent, please do NOT duplicate claims throughthem and directly to us. PLEASE PRINT CLEARLY AND IN INK IF POSSIBLE.
PRINT FULL NAME OR KEY NAME OF INSTITUTION MEMBER OR CUSTOMER NUMBER (MAYBEFOUND ON ANYPAST ISSUE LABEL)
DATE YOUR ORDER WAS MAILED (OR PHONED)
PREPAID CHECK CHARGECHECK/CARD CLEARED DATE:_
CITY STATE/COUNTRY ZIP
YOUR NAME AND PHONE NUMBER
TITLE
(If possible, send a copy, front and back, of your cancelled check to help us in our researchof your claim.)
ISSUES: MISSING DAMAGED
VOLUME OR YEAR NUMBER OR MONTH
Thank you. Once a claim is received and resolved, delivery of replacement issues routinely takes 4-6 weeks.
— — — — ^ ^ ^ ^ (TO BE FILLED OUT BY APA STAFF) ^ — — — — —
DATE RECEIVED:.ACTION TAKEN: _STAFF NAME:
DATE OF ACTION: _INV. NO. & DATE:LABEL NO. & DATE:
Send this form to APA Subscription Claims, 750 First Street, NE, Washington, DC 20002-4242
PLEASE DO NOT REMOVE. A PHOTOCOPY MAY BE USED.