Embed Size (px)
Citation preview
Characterization of Suswa Geothermal Prospect, Kenya, from Fumarole Gas
Geochemistry
By: Kipngok, J.K., Jill R.H., Malimo S.J., Ochieng L.A., Igunza G.M., Mwanyasi F., Bett E.K., Kangogo S.C. and Kanda I.K.
Date: 4th Nov., 2016 Venue: Addis Ababa
Outline
• Background Exploration Geochemistry of Suswa • Objectives for the 2015 work • Sampling and Analysis • Results: QA/QC • Non Condensible Gases • 3He/4He • Stable Isotopes of Water • Conclusion
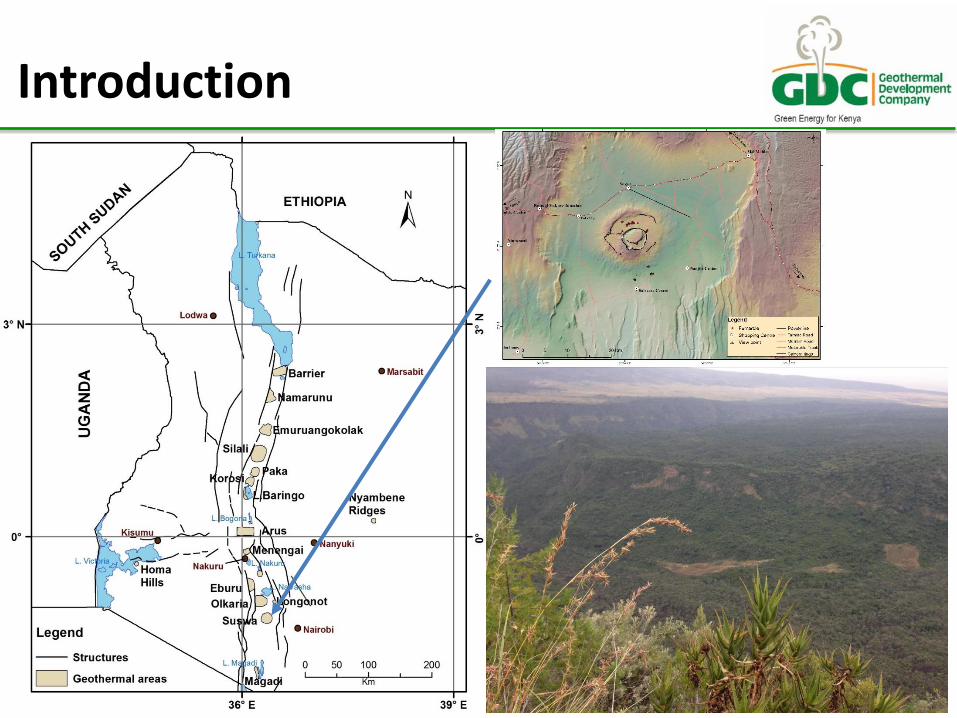
Introduction
Geological Setting
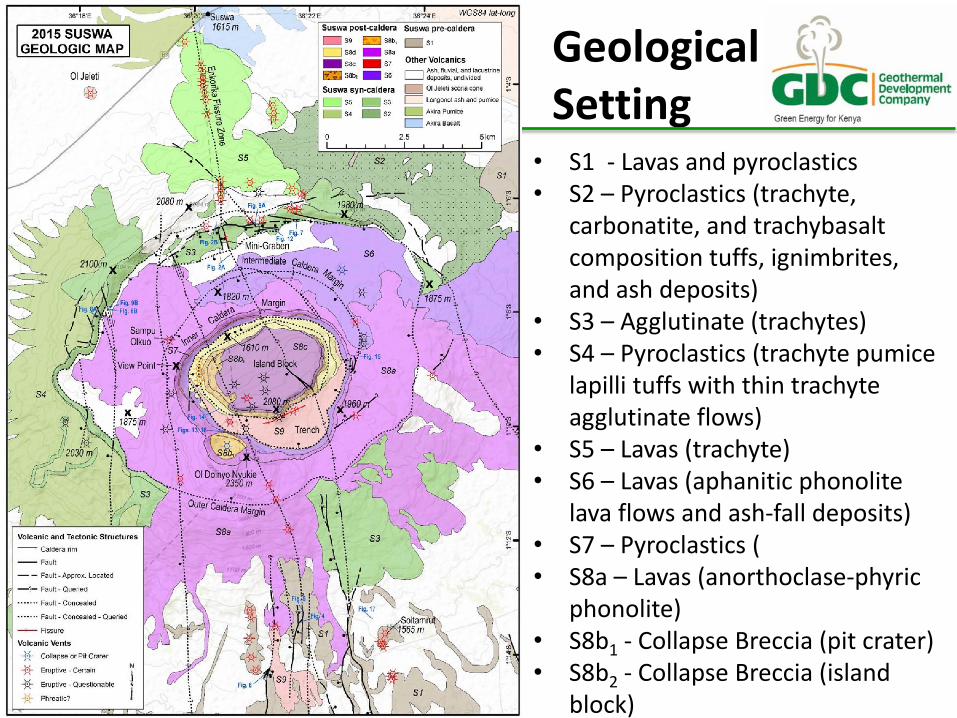
• S1 - Lavas and pyroclastics • S2 – Pyroclastics (trachyte,
carbonatite, and trachybasalt composition tuffs, ignimbrites, and ash deposits)
• S3 – Agglutinate (trachytes) • S4 – Pyroclastics (trachyte pumice
lapilli tuffs with thin trachyte agglutinate flows)
• S5 – Lavas (trachyte) • S6 – Lavas (aphanitic phonolite
lava flows and ash‐fall deposits) • S7 – Pyroclastics ( • S8a – Lavas (anorthoclase‐phyric
phonolite) • S8b1 - Collapse Breccia (pit crater) • S8b2 - Collapse Breccia (island
block)
Geological Setting
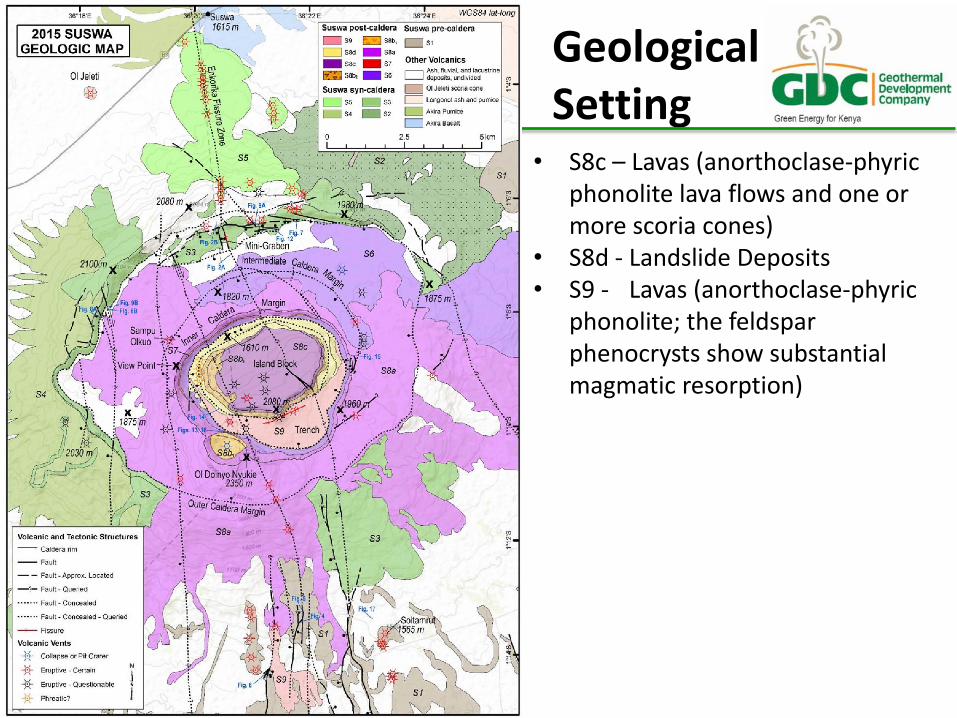
• S8c – Lavas (anorthoclase‐phyric phonolite lava flows and one or more scoria cones)
• S8d - Landslide Deposits • S9 - Lavas (anorthoclase‐phyric
phonolite; the feldspar phenocrysts show substantial magmatic resorption)
• 1986-1987-UNDP and GOK by Ármannsson (ISOR) • KPLC 1993 • GDC 2012/2013 • Regional Exploration provided local meteoric water
lines
Background Geochemical Exploration
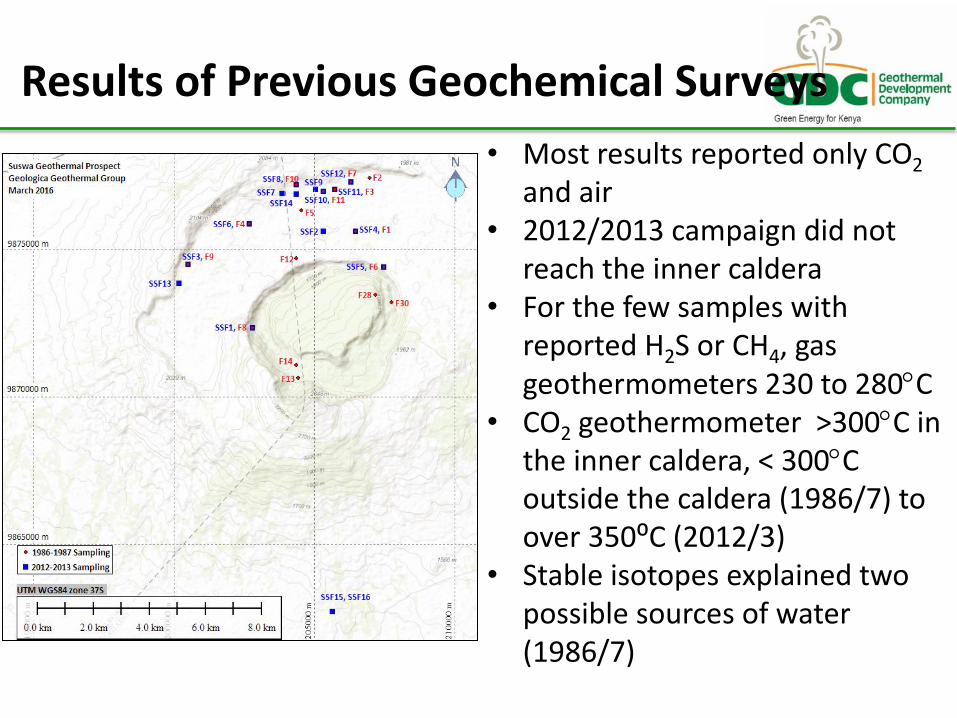
• Most results reported only CO2 and air
• 2012/2013 campaign did not reach the inner caldera
• For the few samples with reported H2S or CH4, gas geothermometers 230 to 280C
• CO2 geothermometer >300C in the inner caldera, < 300C outside the caldera (1986/7) to over 350⁰C (2012/3)
• Stable isotopes explained two possible sources of water (1986/7)
Results of Previous Geochemical Surveys
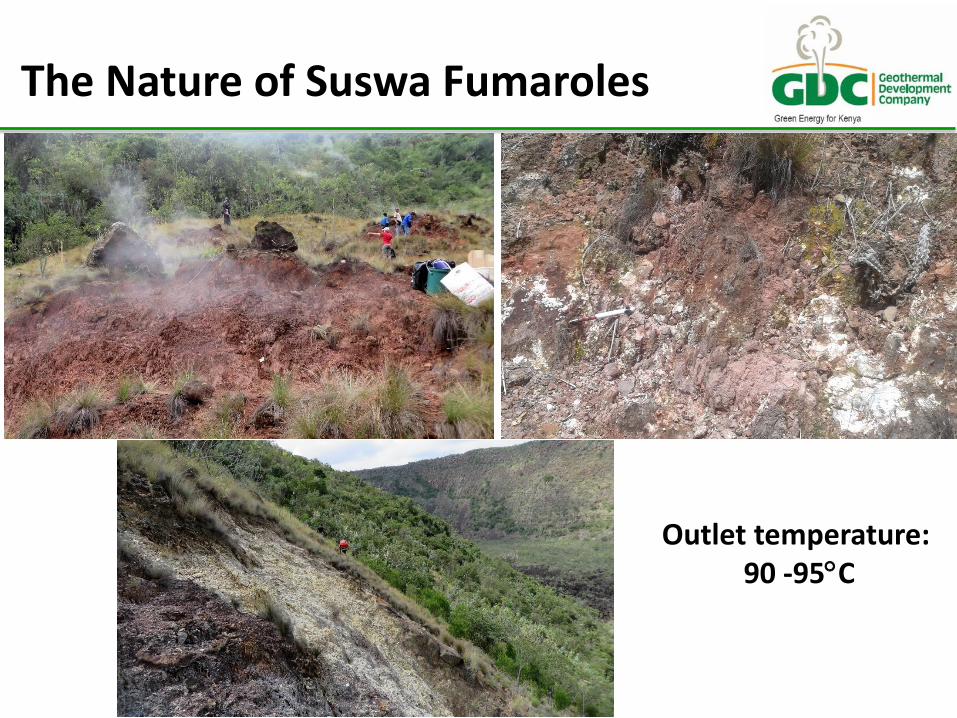
The Nature of Suswa Fumaroles
Outlet temperature: 90 -95C
• Resample the fumaroles (and additional new ones) in such a manner as to obtain gas chemistry and gas/steam measurements while minimizing the effect of air contamination.
• Sample available local groundwater • Evaluate the source of the Suswa Geothermal
Reservoir fluids • Evaluate the reservoir conditions indicated by fluid
chemistry • Provide geochemical contributions to the conceptual
model of Suswa
Objectives of 2015 Geochemical Work
• Sampled 20 fumaroles + 4 cold waters • Many low pressure and difficult to seal • Noncondensible gas in evacuated Giggenbach bottles
with NaOH and Zn acetate + CO and hydrocarbons (no NaOH)
• Analyzed 8 duplicate gas samples • Steam condensate for stable isotopes of water and
selected elements in bottles • Helium isotopes in copper tubes • 4 cold waters for stable isotopes and 3 for water
chemistry
Sample Collection
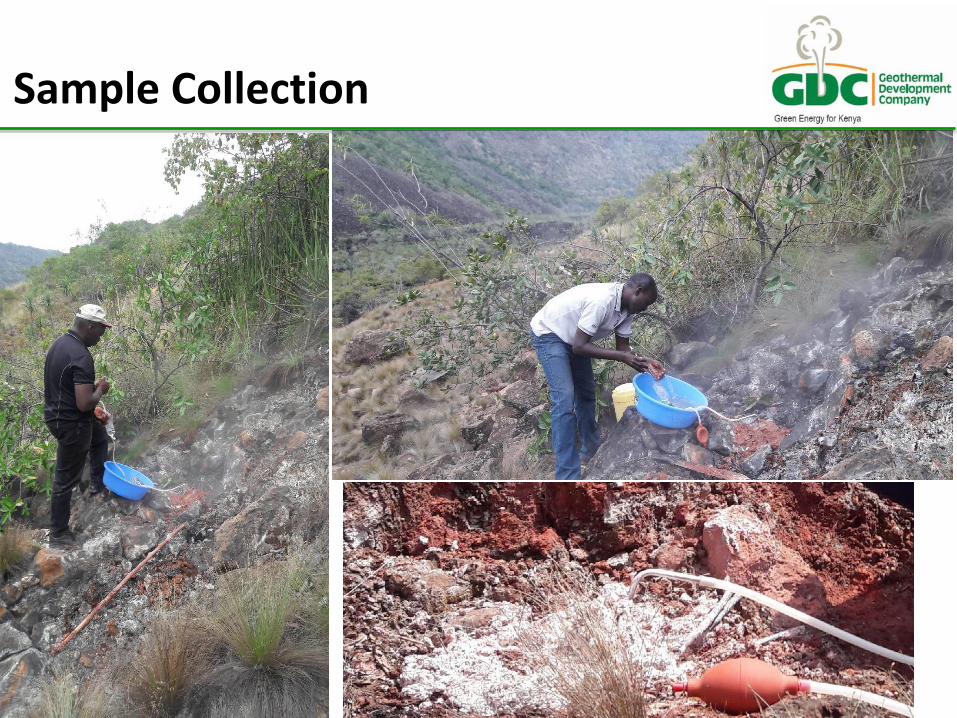
Sample Collection
Results: QA/QC
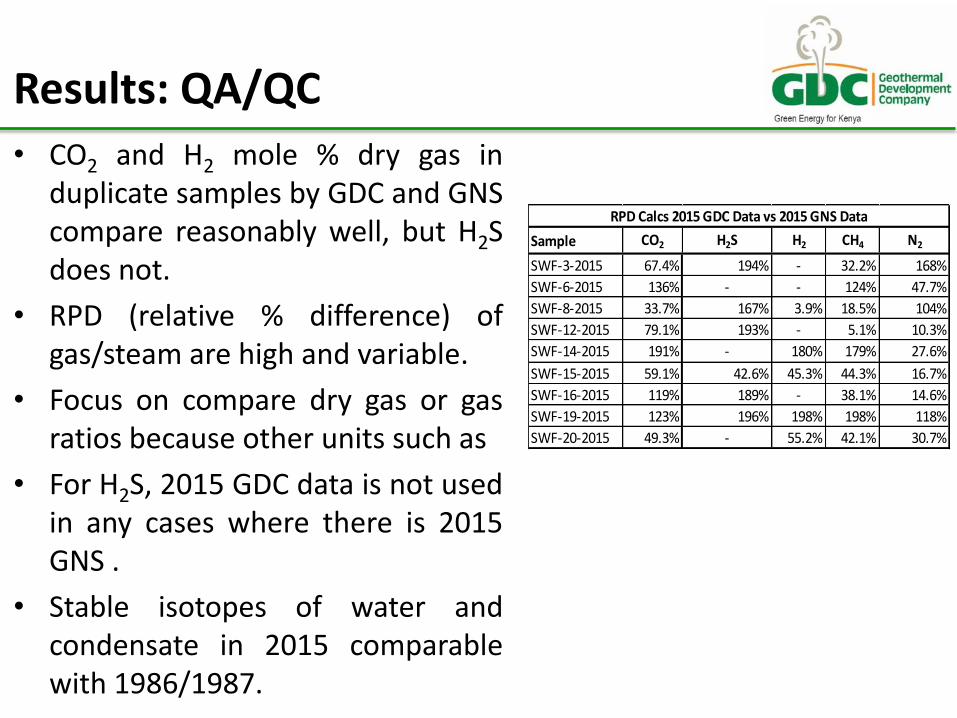
• CO2 and H2 mole % dry gas in duplicate samples by GDC and GNS compare reasonably well, but H2S does not.
• RPD (relative % difference) of gas/steam are high and variable.
• Focus on compare dry gas or gas ratios because other units such as
• For H2S, 2015 GDC data is not used in any cases where there is 2015 GNS .
• Stable isotopes of water and condensate in 2015 comparable with 1986/1987.
Sample CO2 H2S H2 CH4 N2
SWF-3-2015 67.4% 194% - 32.2% 168%
SWF-6-2015 136% - - 124% 47.7%
SWF-8-2015 33.7% 167% 3.9% 18.5% 104%
SWF-12-2015 79.1% 193% - 5.1% 10.3%
SWF-14-2015 191% - 180% 179% 27.6%
SWF-15-2015 59.1% 42.6% 45.3% 44.3% 16.7%
SWF-16-2015 119% 189% - 38.1% 14.6%
SWF-19-2015 123% 196% 198% 198% 118%
SWF-20-2015 49.3% - 55.2% 42.1% 30.7%
RPD Calcs 2015 GDC Data vs 2015 GNS Data
Results: QA/QC
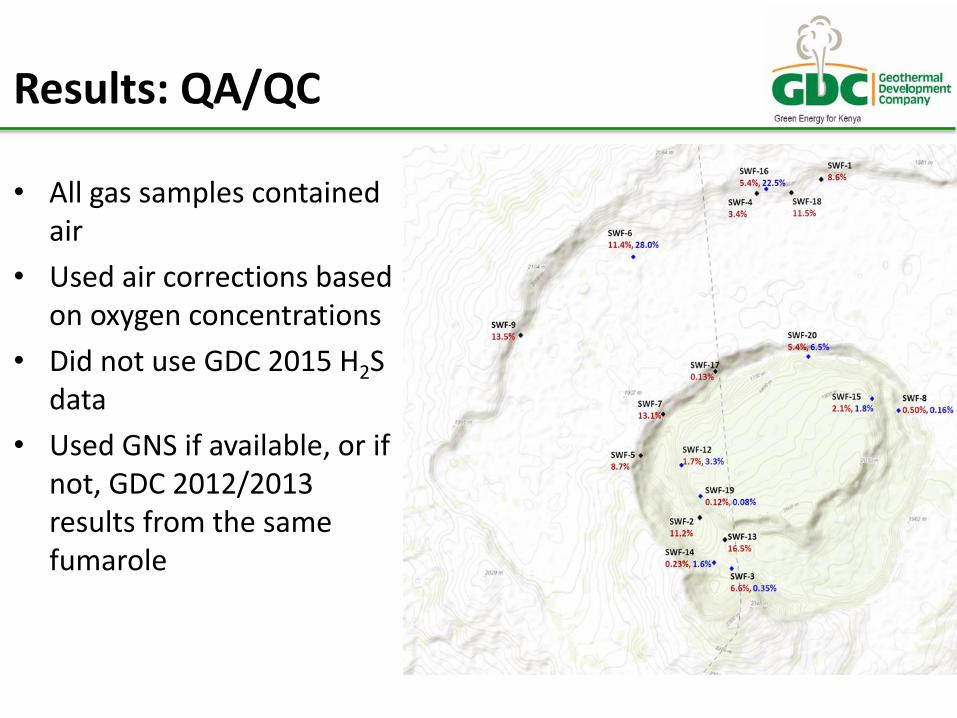
• All gas samples contained air
• Used air corrections based on oxygen concentrations
• Did not use GDC 2015 H2S data
• Used GNS if available, or if not, GDC 2012/2013 results from the same fumarole
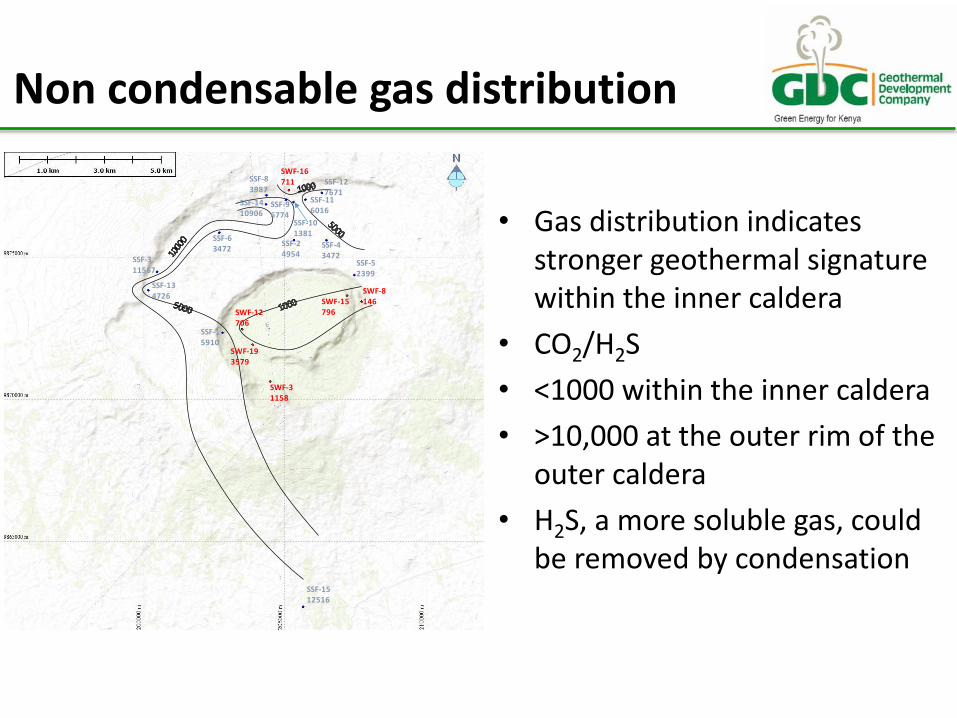
• Gas distribution indicates stronger geothermal signature within the inner caldera
• CO2/H2S
• <1000 within the inner caldera
• >10,000 at the outer rim of the outer caldera
• H2S, a more soluble gas, could be removed by condensation
Non condensable gas distribution
SWF-31158
SWF-8146
SWF-12706
SWF-15796
SWF-193579
SWF-16711
SSF-15910
SSF-24954
SSF-311567
SSF-43472
SSF-52399
SSF-63472
SSF-83987
SSF-96774
SSF-101381
SSF-116016
SSF-127671
SSF-134726
SSF-1410906
SSF-1512516
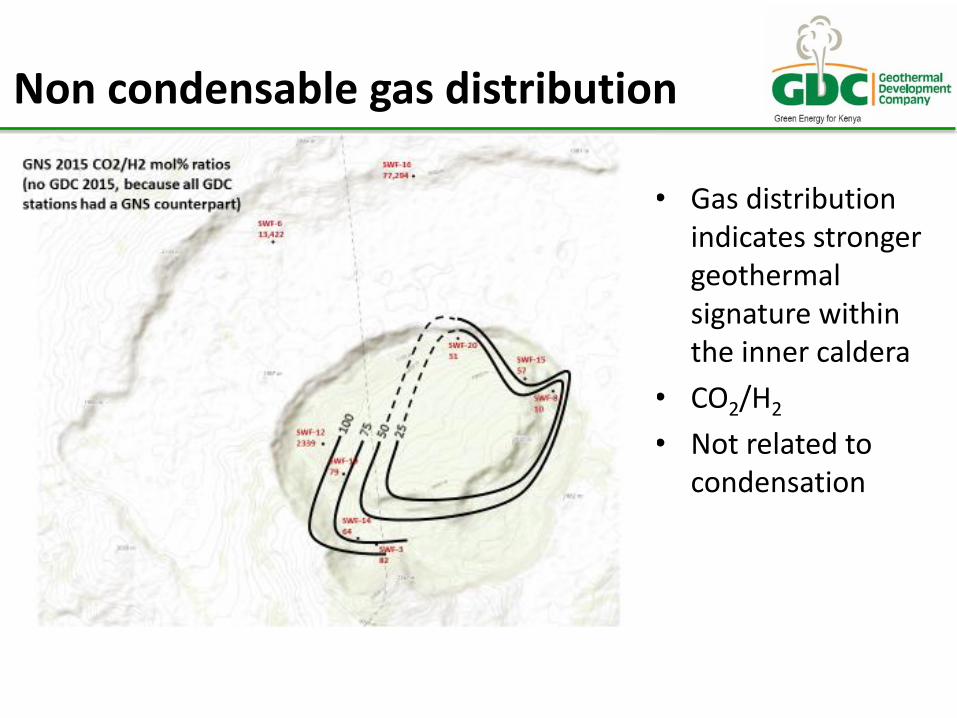
• Gas distribution indicates stronger geothermal signature within the inner caldera
• CO2/H2
• Not related to condensation
Non condensable gas distribution
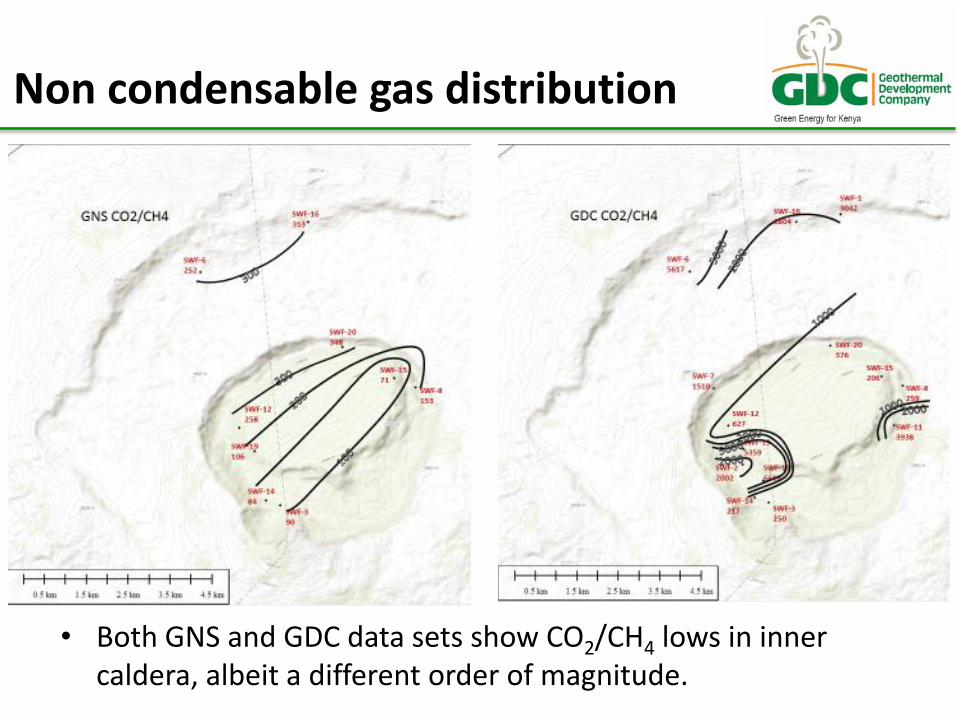
• Both GNS and GDC data sets show CO2/CH4 lows in inner caldera, albeit a different order of magnitude.
Non condensable gas distribution
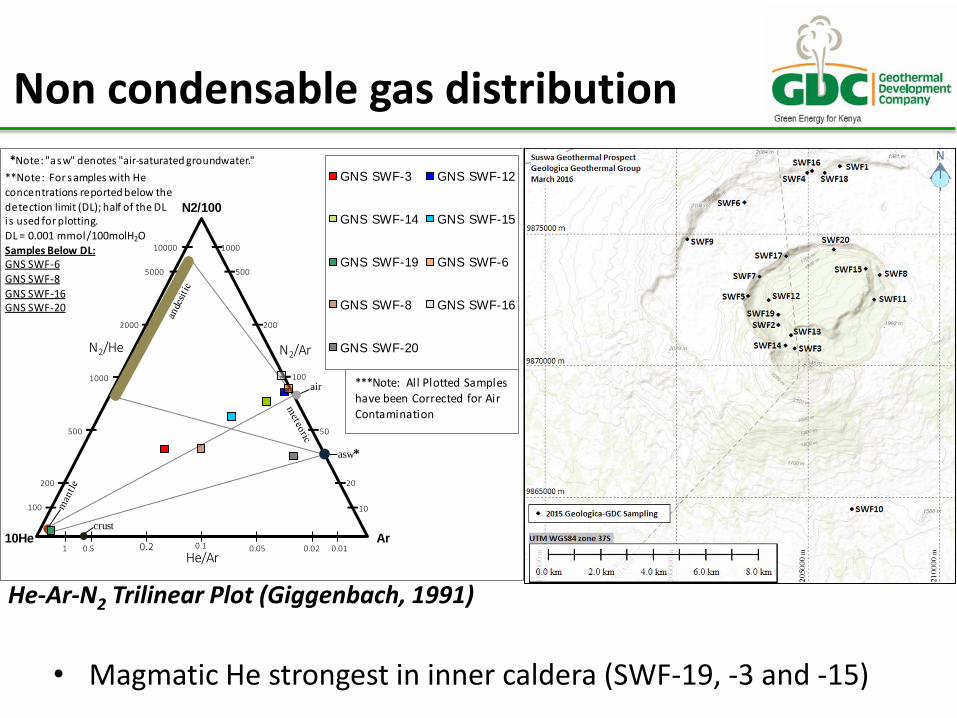
• Magmatic He strongest in inner caldera (SWF-19, -3 and -15)
Non condensable gas distribution
Ar
N2/100
10He
100
200
500
1000
2000
5000
10000
10
20
50
100
200
500
1000
1 0.2 0.1 0.05 0.02 0.010.5
GNS SWF-3 GNS SWF-12
GNS SWF-14 GNS SWF-15
GNS SWF-19 GNS SWF-6
GNS SWF-8 GNS SWF-16
GNS SWF-20N2/He N2/Ar
He/Ar
air
asw*
crust
*Note: "asw" denotes "air-saturated groundwater."
**Note: For samples with He concentrations reported below the detection limit (DL); half of the DL i s used for plotting. DL = 0.001 mmol/100molH2OSamples Below DL:GNS SWF-6GNS SWF-8GNS SWF-16GNS SWF-20
***Note: All Plotted Samples have been Corrected for Air Contamination
He-Ar-N2 Trilinear Plot (Giggenbach, 1991)
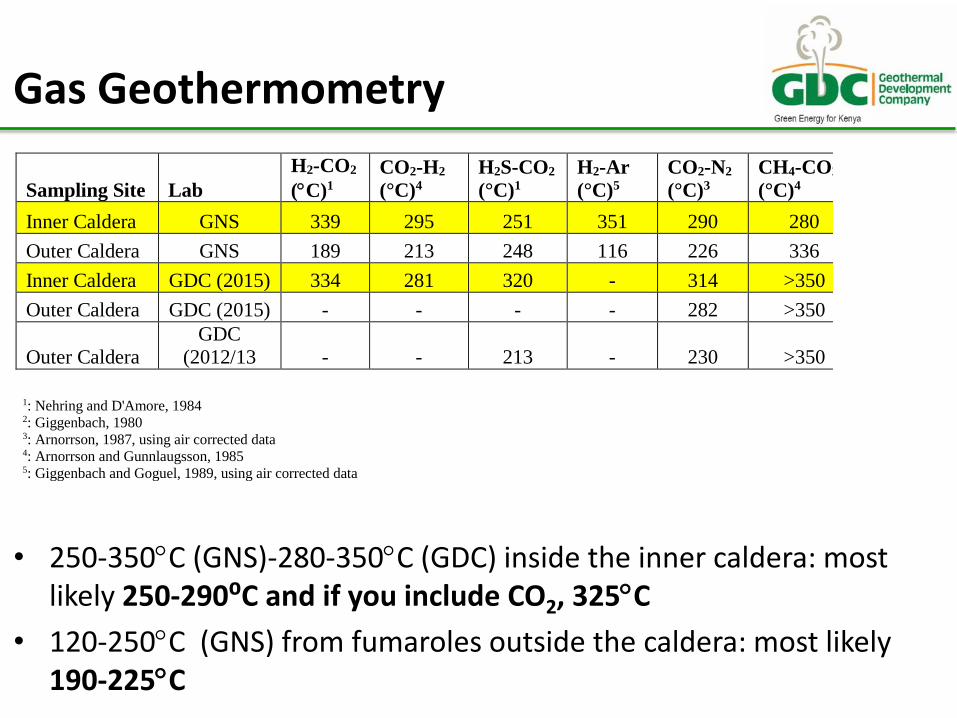
• 250-350C (GNS)-280-350C (GDC) inside the inner caldera: most likely 250-290⁰C and if you include CO2, 325C
• 120-250C (GNS) from fumaroles outside the caldera: most likely 190-225C
Gas Geothermometry
Sampling Site Lab
H2-CO2
(C)1
CO2-H2
(°C)4
H2S-CO2
(°C)1
H2-Ar
(°C)5
CO2-N2
(°C)3
CH4-CO2
(°C)4
Inner Caldera GNS 339 295 251 351 290 280
Outer Caldera GNS 189 213 248 116 226 336
Inner Caldera GDC (2015) 334 281 320 - 314 >350
Outer Caldera GDC (2015) - - - - 282 >350
Outer Caldera
GDC
(2012/13 - - 213 - 230 >350
1: Nehring and D'Amore, 1984 2: Giggenbach, 1980 3: Arnorrson, 1987, using air corrected data 4: Arnorrson and Gunnlaugsson, 1985 5: Giggenbach and Goguel, 1989, using air corrected data
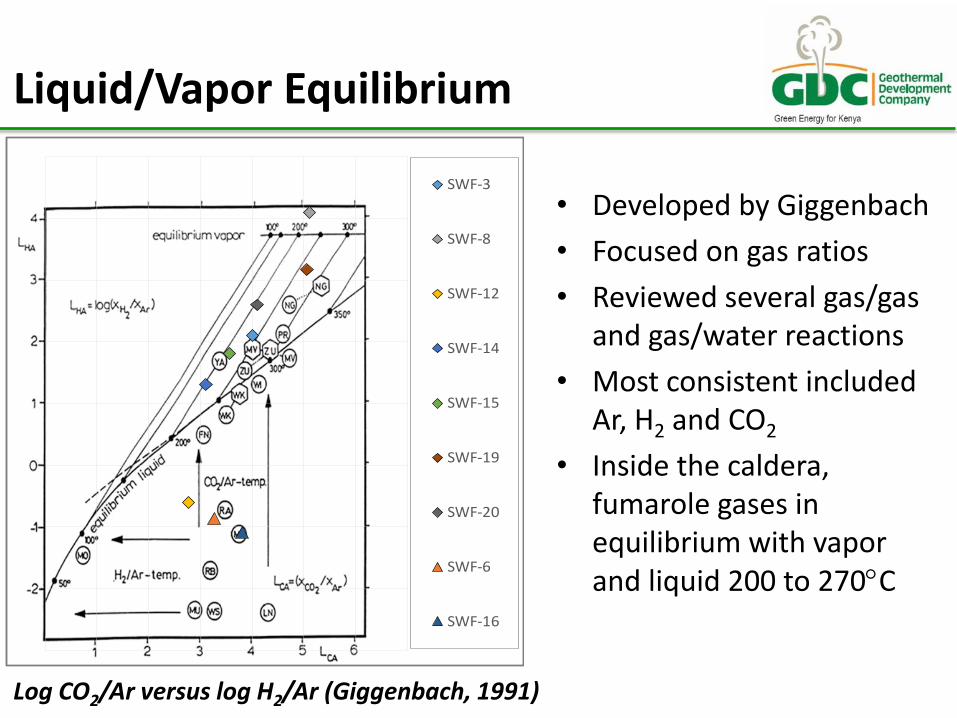
Liquid/Vapor Equilibrium
SWF-3
SWF-8
SWF-12
SWF-14
SWF-15
SWF-19
SWF-20
SWF-6
SWF-16
• Developed by Giggenbach
• Focused on gas ratios
• Reviewed several gas/gas and gas/water reactions
• Most consistent included Ar, H2 and CO2
• Inside the caldera, fumarole gases in equilibrium with vapor and liquid 200 to 270C
Log CO2/Ar versus log H2/Ar (Giggenbach, 1991)
Liquid/Vapor Equilibrium
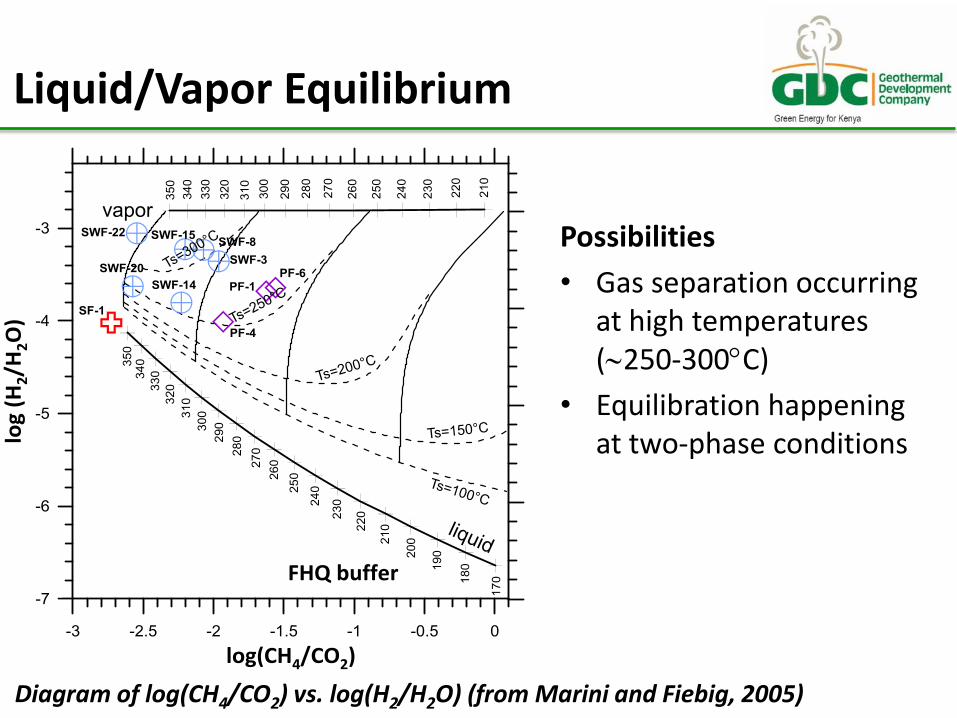
Possibilities
• Gas separation occurring at high temperatures (250-300C)
• Equilibration happening at two-phase conditions
Diagram of log(CH4/CO2) vs. log(H2/H2O) (from Marini and Fiebig, 2005)
Inferences from NCG Distribution
• Gases related to high temperature interaction with rock or gas-gas reactions CO2, H2S, H2, CH4 are present inside the moat area but only (predominantly) CO2 in the outer caldera
• Gases both more and less soluble than CO2, so condensation not only mechanism
• Upflow is in the eastern and western moat areas in the vicinity of SWF-8 and -15, and SWF-3 and -14
• Temperatures of the hydrothermal fluid source of fumarole discharges are most likely 250-290⁰C in the inner caldera and 190-225⁰C
• Gas ratios suggest that both vapor and liquid may be present in the hydrothermal system
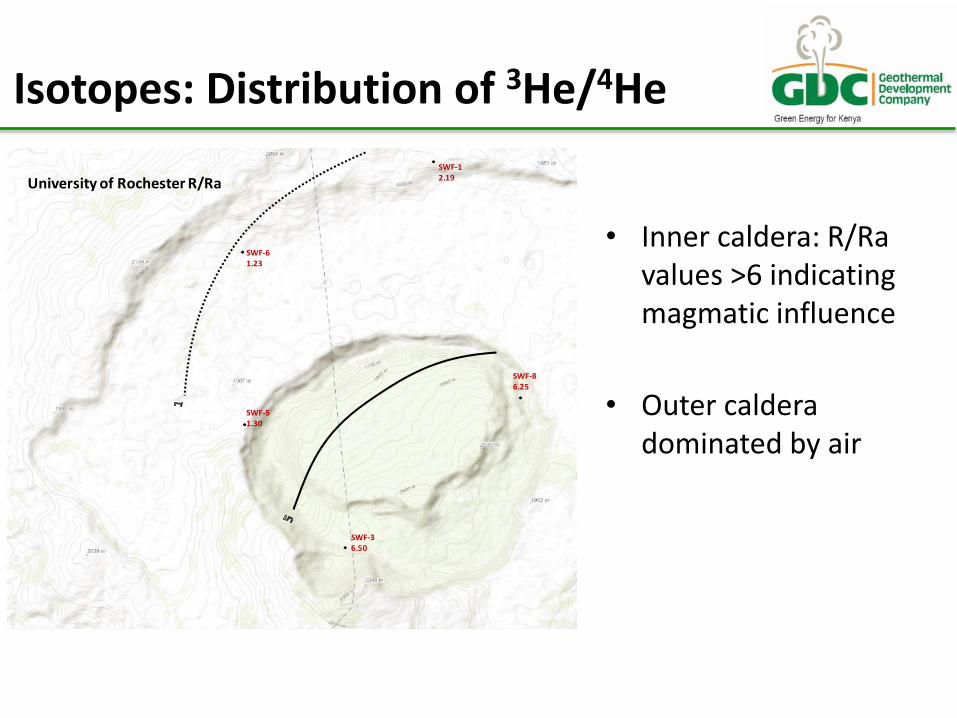
Isotopes: Distribution of 3He/4He
• Inner caldera: R/Ra values >6 indicating magmatic influence
• Outer caldera dominated by air
SWF-61.23
SWF-36.50
SWF-86.25
SWF-12.19
SWF-51.30
University of Rochester R/Ra
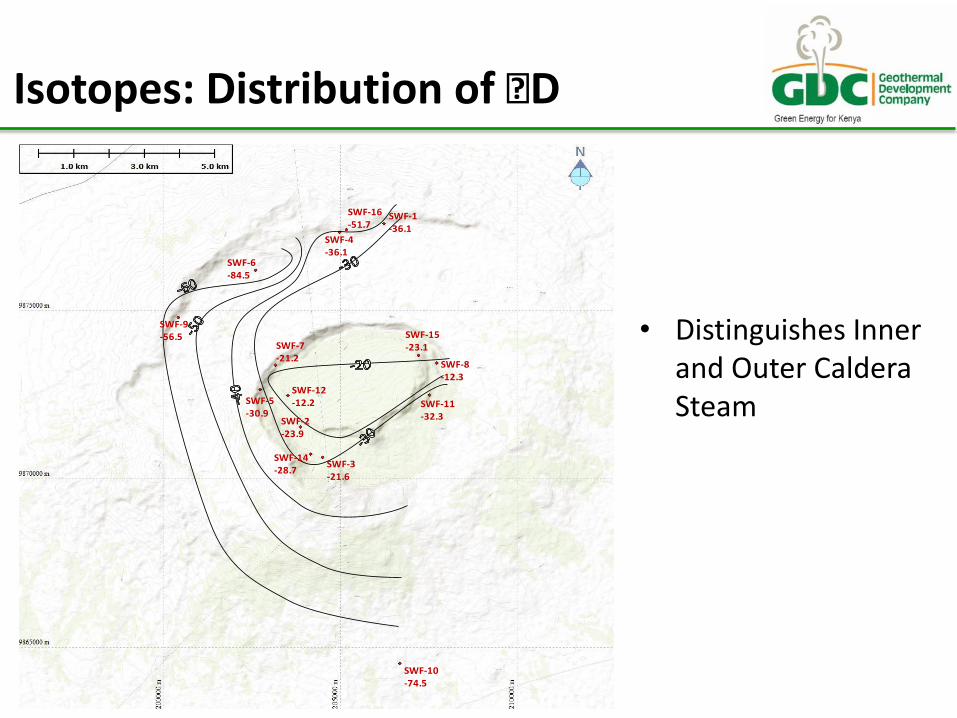
Isotopes: Distribution of ẟD
• Distinguishes Inner and Outer Caldera Steam SWF-5
-30.9
SWF-1-36.1
SWF-2-23.9
SWF-3-21.6
SWF-6-84.5
SWF-7-21.2
SWF-8-12.3
SWF-11-32.3
SWF-12-12.2
SWF-14-28.7
SWF-15-23.1
SWF-16-51.7
SWF-4-36.1
SWF-9-56.5
SWF-10-74.5
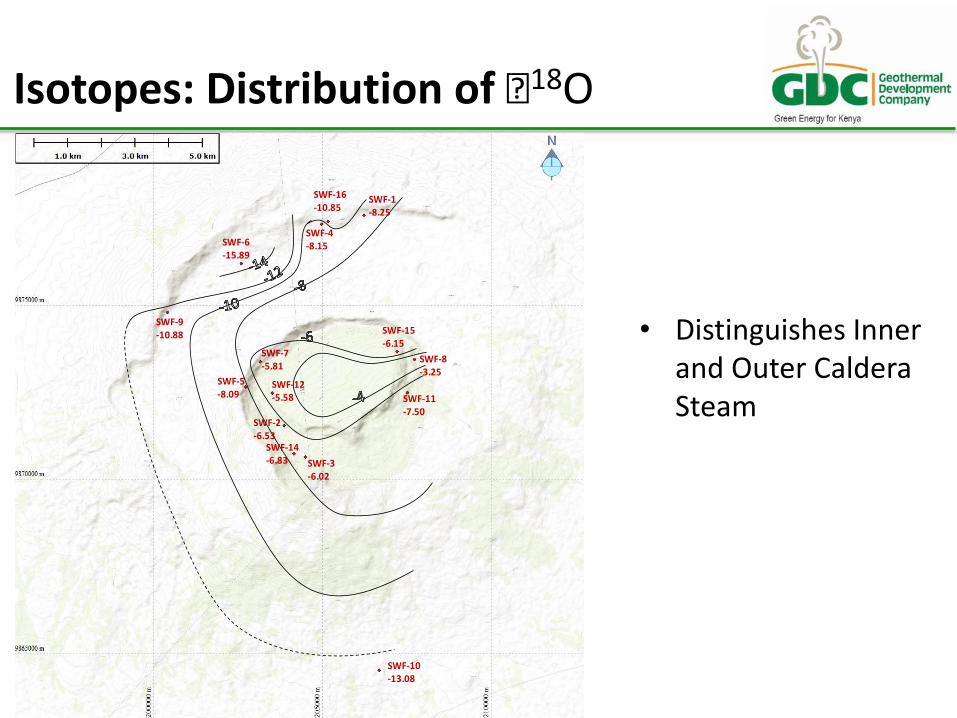
Isotopes: Distribution of ẟ18O
• Distinguishes Inner and Outer Caldera Steam
SWF-5-8.09
SWF-1-8.25
SWF-2-6.53
SWF-3-6.02
SWF-6-15.89
SWF-7-5.81
SWF-8-3.25
SWF-11-7.50
SWF-12-5.58
SWF-14-6.83
SWF-15-6.15
SWF-16-10.85
SWF-4-8.15
SWF-9-10.88
SWF-10-13.08
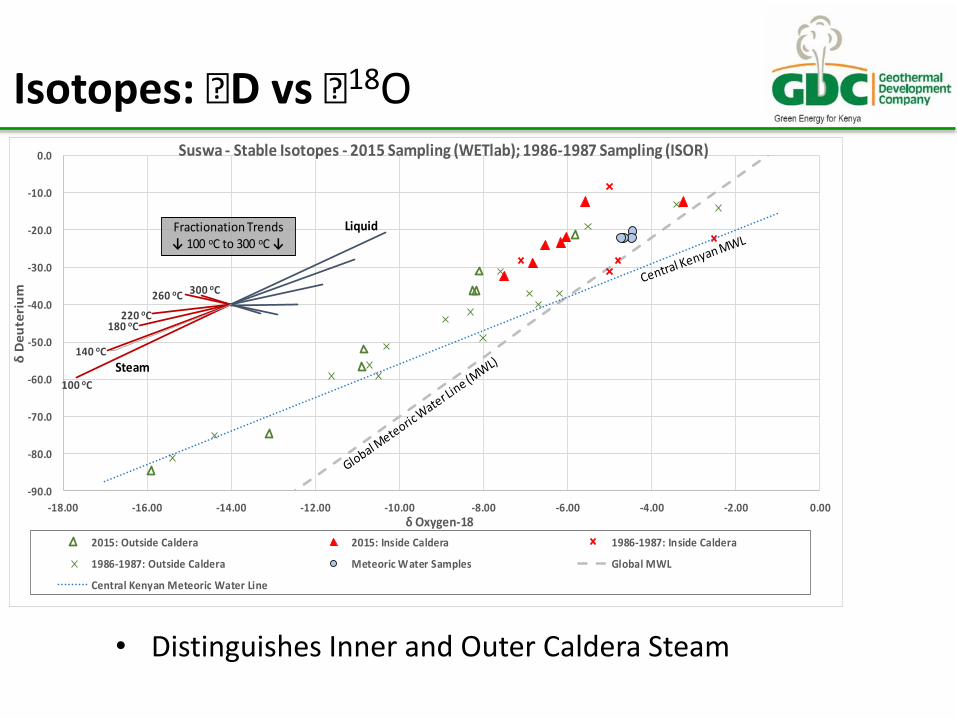
Isotopes: ẟD vs ẟ18O
• Distinguishes Inner and Outer Caldera Steam
100 oC
140 oC
180 oC 220 oC
260 oC 300 oC
-90.0
-80.0
-70.0
-60.0
-50.0
-40.0
-30.0
-20.0
-10.0
0.0
-18.00 -16.00 -14.00 -12.00 -10.00 -8.00 -6.00 -4.00 -2.00 0.00
δD
eu
teri
um
δ Oxygen-18
Suswa - Stable Isotopes - 2015 Sampling (WETlab); 1986-1987 Sampling (ISOR)
2015: Outside Caldera 2015: Inside Caldera 1986-1987: Inside Caldera
1986-1987: Outside Caldera Meteoric Water Samples Global MWL
Central Kenyan Meteoric Water Line
Fractionation Trends↓ 100 oC to 300 oC ↓
Steam
Liquid
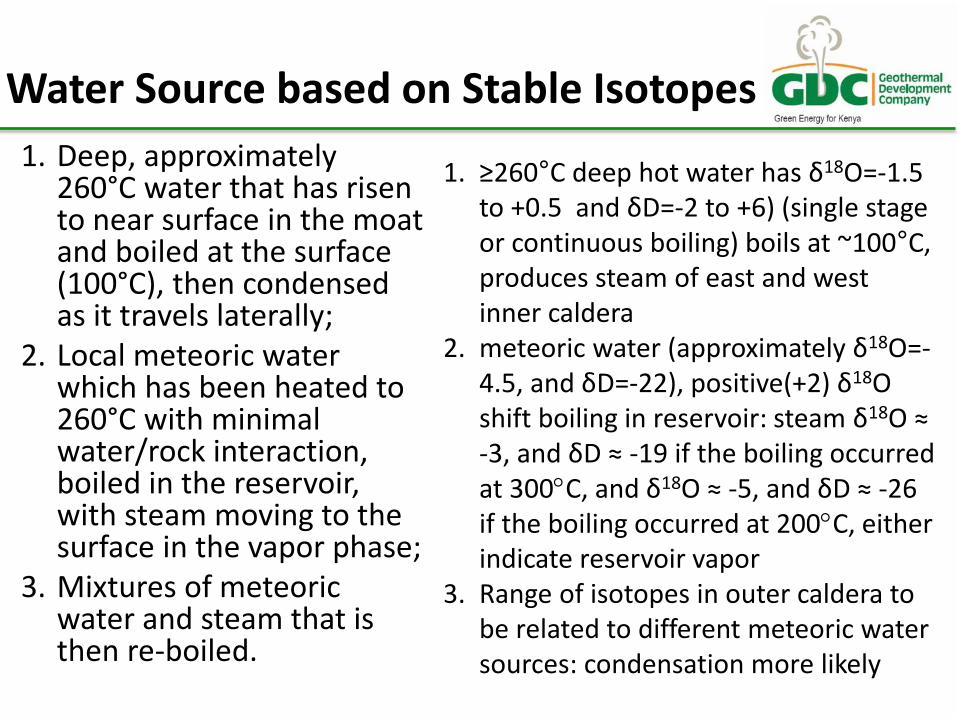
Water Source based on Stable Isotopes
1. Deep, approximately 260°C water that has risen to near surface in the moat and boiled at the surface (100°C), then condensed as it travels laterally;
2. Local meteoric water which has been heated to 260°C with minimal water/rock interaction, boiled in the reservoir, with steam moving to the surface in the vapor phase;
3. Mixtures of meteoric water and steam that is then re-boiled.
1. ≥260°C deep hot water has δ18O=-1.5 to +0.5 and δD=-2 to +6) (single stage or continuous boiling) boils at ~100°C, produces steam of east and west inner caldera
2. meteoric water (approximately δ18O=-4.5, and δD=-22), positive(+2) δ18O shift boiling in reservoir: steam δ18O ≈ -3, and δD ≈ -19 if the boiling occurred at 300C, and δ18O ≈ -5, and δD ≈ -26 if the boiling occurred at 200C, either indicate reservoir vapor
3. Range of isotopes in outer caldera to be related to different meteoric water sources: condensation more likely
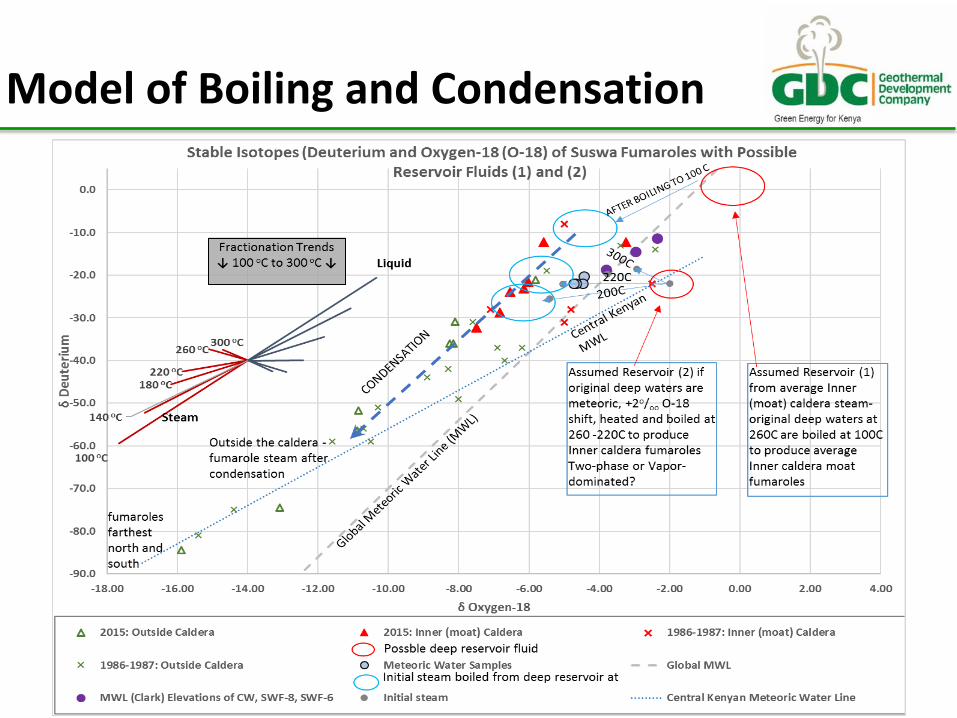
Model of Boiling and Condensation
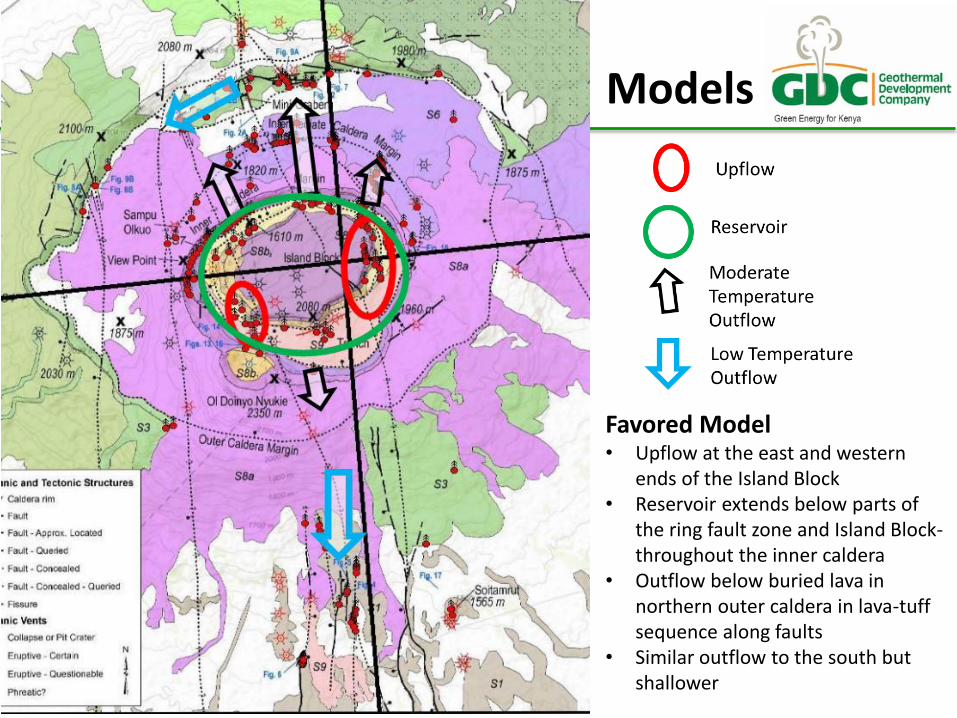
Favored Model • Upflow at the east and western
ends of the Island Block • Reservoir extends below parts of
the ring fault zone and Island Block-throughout the inner caldera
• Outflow below buried lava in northern outer caldera in lava-tuff sequence along faults
• Similar outflow to the south but shallower
Models
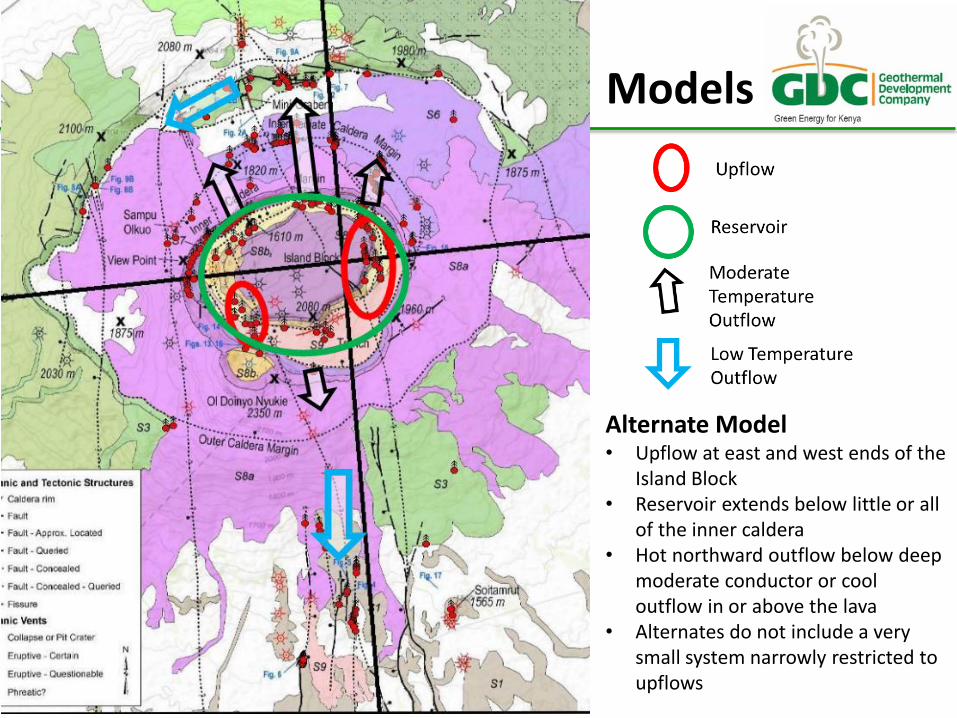
Alternate Model • Upflow at east and west ends of the
Island Block • Reservoir extends below little or all
of the inner caldera • Hot northward outflow below deep
moderate conductor or cool outflow in or above the lava
• Alternates do not include a very small system narrowly restricted to upflows
Models
Conclusion
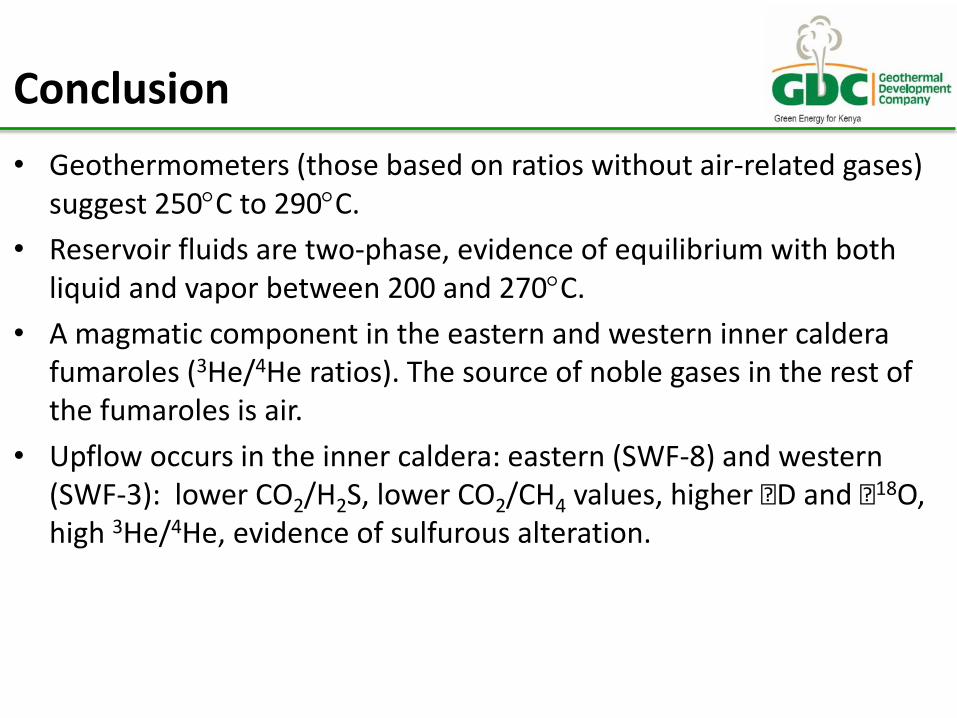
• Geothermometers (those based on ratios without air-related gases) suggest 250C to 290C.
• Reservoir fluids are two-phase, evidence of equilibrium with both liquid and vapor between 200 and 270C.
• A magmatic component in the eastern and western inner caldera fumaroles (3He/4He ratios). The source of noble gases in the rest of the fumaroles is air.
• Upflow occurs in the inner caldera: eastern (SWF-8) and western (SWF-3): lower CO2/H2S, lower CO2/CH4 values, higher ẟD and ẟ18O, high 3He/4He, evidence of sulfurous alteration.
Conclusion
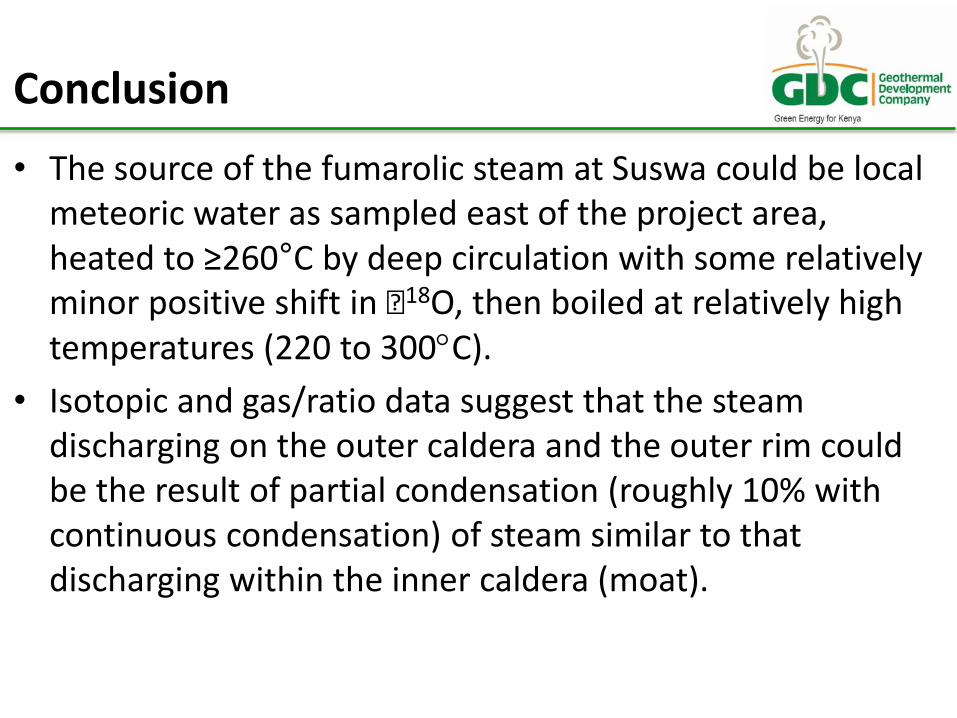
• The source of the fumarolic steam at Suswa could be local meteoric water as sampled east of the project area, heated to ≥260°C by deep circulation with some relatively minor positive shift in ẟ18O, then boiled at relatively high temperatures (220 to 300C).
• Isotopic and gas/ratio data suggest that the steam discharging on the outer caldera and the outer rim could be the result of partial condensation (roughly 10% with continuous condensation) of steam similar to that discharging within the inner caldera (moat).
Introduction
THANK YOU FOR YOUR ATTENTION