Embed Size (px)
Citation preview
Prospects and challenges for high-pressure reverse osmosis in minimizing concentrated
waste streams
A Benjamin Schantz1, Boya Xiong2, Elizabeth Dees3, David R. Moore3, Xuejing Yang4,5, Manish
Kumar1,2*
1Department of Chemical Engineering, 2Department of Civil and Environmental Engineering, The
Pennsylvania State University, University Park, Pennsylvania 16802
3GE Global Research Center, 1 Research Circle, Niskayuna, NY 12309
4 Department of Civil and Environmental Engineering, University of California at Berkeley,
Berkeley, CA 94720-1716, USA
5 National Engineering Laboratory for Industrial Wastewater Treatment, East China University of
Science and Technology, Shanghai, 200237, China
*Corresponding Author
Table of Contents Entry (a 8cm*4cm figure with a caption of up to 30 words)
Abstract (50-250 words)
Reverse osmosis (RO) has become the most common process for extracting pure water
from saline water, outcompeting thermal processes such as multi-effect distillation (MED) and
multi-stage flash (MSF) due to its lower energy consumption and cost. RO is currently limited to
treating streams with total dissolved solids (TDS) values of less than 50,000 ppm. Zero-liquid
discharge (ZLD) processes using pretreatment, RO, and thermal steps can concentrate and dispose
of high salinity waste brines with greater thermodynamic efficiency than a purely thermal process
but such a process is not yet widely practiced. Waste streams requiring ZLD typically have total
dissolved solids (TDS) as high as 300,000 ppm, and include seawater RO (SWRO) brines,
flowback and produced water from unconventional shale gas development, formation water from
CO2 sequestration, and Flue Gas Desulfurization (FGD) wastewater. The TDS levels of these
streams can exceed those of seawater by nearly an order of magnitude, and even to concentrate a
stream with similar TDS levels to seawater, a high-pressure RO process is needed to achieve a
high water recovery. In this review we consider a high-pressure RO (HPRO) process with applied
pressures of 2400 – 5000 psi (compared to 800-1000 psi for SWRO) to reduce the volume of high
salinity brine wastes. We discuss the challenges amplified by elevated pressure requirements and
feed salinities, such as ion precipitation and scaling, biofouling, and RO module mechanical
stability. We also propose solutions to address these limitations of HPRO.
Environmental Science: Water Research & Technology

Water Impact Statement
High-salinity brines from energy and water production (such as RO retentate, FGD
wastewater, fracking flowback water, and formation waters from CO2 storage aquifers) are
unsuitable for surface water discharge. Limited disposal options have led researchers to study the
concentration and dewatering of these brines despite the high cost and energy requirements for
ZLD disposal. High-pressure RO (HPRO) could allow more energy-efficient wastewater
concentration compared to existing thermal processes, and we review the challenges and possible
solutions for HPRO process design, as well as options for disposing of or obtaining valuable salts
and chemicals from the remaining concentrates.
1. Introduction – Opportunities for high-pressure RO (HPRO)
The management of high-salinity brines with total dissolved solids up to 350,000 ppm is a
substantial challenge for industries across the Global Industrials Classification Standard (GICS)
taxonomy, including energy, chemicals, healthcare, consumer products, and water utilities
industries. Brines from the energy industry include oil and gas produced water1, crude oil desalter
wastewater2, the spent caustic from refinery plants3, gasification or formatted wastewater from
coal and consumable fuel suppliers4, and flue gas desulfurization processes5. Chemical/healthcare
industry brines include waste from the processing and synthesis of chemicals, munitions6, drugs7,
and some hospital wastewater8. Consumer product industry wastes include dairy and olive mill
wastewater9, filature10, drying or tannery wastewater11, and pulp and paper wastewater12. Water
utility brines include retentates from RO13-14, nanofiltration15, and membrane bioreactor
processes16, and landfill leachates17-18. Several review articles have discussed high salinity waste
management with a focus on common treatment techniques19, value-added mineral recovery
processes20, cost effective strategies21, and emerging contamination issues22. Here, we aim to
discuss the feasibility of high-pressure reverse osmosis (HPRO) for minimizing high salinity waste
streams from four representative sources that generate waste in large volumes.
These streams are SWRO brine23, FGD wastewater5, and hydraulic fracturing flowback and
produced waters24 that are produced on a scale of millions of m3/day (Table 1). SWRO brines are
currently discharged to the ocean, possibly disrupting the salinity and temperature of the marine
environment and polluting the water with RO pretreatment chemicals25. The salinity of seawater
varies geographically, being relatively constant in the open ocean but higher in some regions such
as the Red Sea26. Similar brines are created at inland locations by desalination of brackish ground
water, and these brines cannot be conveniently discharged to the ocean, so that a disposal process
would be even more beneficial in these situations than for SWRO25, 27. The concentrate fraction
for SWRO is generally about 50-70% of the feed due to the pressure and fouling limits of a
conventional SWRO process28-30, The TDS in flowback and produced water from oil and shale gas
development varies greatly with the geology of the source formation, as shown in Table 1. The
direct reuse of oil and shale gas wastewater for subsequent extraction is a common practice but is
declining as the industry matures and less water is needed for developing new wells31. Deep well
injection is another waste management method, but raises concerns about leakage and increased
Page 1 of 25 Environmental Science: Water Research & Technology

seismic activity31. A waste brine similar to shale gas produced waters could be produced in even
greater quantities if the sequestration of supercritical carbon dioxide in saline aquifers is
implemented as a way to reduce global warming32. The flue gas desulfurization (FGD) process
used in coal-fired power plants utilizes limestone wet scrubbing to control SOx emissions,
generating a CaSO4-rich wastewater5 whose composition varies depending on the composition of
the coal and limestone. FGD wastewater is treated by chemical precipitation, filtration, and solids
dewatering before release, so that heavy metal (Se) removal is incomplete5. Because of these
environmental risks associated with waste brine disposal, alternative disposal methods have
become a growing field of research.
ZLD processes have been proposed as a way to better dispose of such brines, and to produce
valuable salts and chemicals from the remaining solids to help offset the disposal costs20, 25, 27, 33-
36. However, ZLD can come with unintended consequences: a review of the expenses and
environmental impacts of FGD wastewater disposal by a ZLD process using chemical treatment,
membrane vapor compression (MVC), and thermal crystallization showed that ZLD would cause
more environmental damage than the current disposal process37. This environmental damage
comprises the air pollution and climate change that result from using the current mix of power
plants to meet the high energy demands of MVC and crystallization37. Consequently, reducing the
energy usage in brine concentration would make ZLD much more environmentally friendly28, 35.
A part of the thermal ZLD processes with substantial room for energy efficiency improvement is
the MVC step: its thermodynamic efficiency is only 5-10%38-39, with the lost thermal energy
deriving from the temperature difference between the feed and heating fluid40. Reverse osmosis
and Forward Osmosis (FO) are two more energy-efficient separation processes that might be used
to replace MVC. In RO, the feed solution is hydraulically pressurized and then separated into
fresh water and concentrated brine using a water-permeable and salt-rejecting membrane29-30,
where as in FO, a concentrated draw solution and a water-permeable, salt-rejecting membrane are
used to remove water from the feed and the draw solution is re-concentrated (regenerated) using
RO or a thermal process41. Of these two methods, RO is more efficient because the draw solute
regeneration step in FO requires a greater change in osmotic pressure and thus a greater minimum
energy input than the alternative RO process31, 41-42. In absolute (thermodynamic) terms, SWRO
processes can achieve at least 50% energy efficiency at the optimum operating condition of 50%
recovery, and continue to increase in energy efficiency; they already closely approach the
thermodynamic limit due to improvements in membrane technology30. However, RO membranes
and processes have not been designed for these high-salinity conditions (challenges include
mechanical stability at high pressure, and minimizing RO membrane fouling, which is less
reversible than FO membrane fouling due to compaction under pressure), so that MVC and FO are
currently the methods used to separate these brines37, 41.
Concentrated waste brines have a higher osmotic pressure than seawater, and thus require a
higher applied pressure to concentrate, although the energy efficiency of HPRO and SWRO
processes should be similar if RO modules capable of withstanding these pressures are designed.
Figure 1A shows the osmotic pressure as a function of feed concentration, and the typical
concentration ranges of the four concentrated waste streams discussed in this review are presented.
Typical SWRO operates at 800-1000 psi29, where as for HPRO we consider pressures up to 5000
Page 2 of 25Environmental Science: Water Research & Technology

psi, making the assumption that this does not exceed the burst pressure of the membrane. The
minimum energy needed to remove pure water from a salt solution (independent of the process
used) can be calculated by integrating the osmotic pressure with respect to the volume of water
removed using equation S843, and the results are summarized in Figure 1B. This minimum energy
is known as the thermodynamic limit30. SWRO has a thermodynamic limit of 1-1.5 kWh/m3, where
as an HPRO process would require a minimum of 3-9 kWh/m3 for a 100-200 g/L feed. The
thermodynamic efficiency is the quotient of this minimum energy and the energy actually used for
the separation30, 40. In addition to the minimum energy, a realistic RO process requires an applied
pressure higher than osmotic pressure to separate pure water from brine on a finite time scale (the
difference between the applied and osmotic pressures is called the overpressure) 30. Also, the
applied pressure in a real RO module is less than or equal to the inlet pressure rather than
continuously increasing with the increasing feed-side osmotic pressure (as it would in a reversible
process)44. Thus, the energy efficiency of a single-stage (or multi-stage) RO process would be less
than 100% even without an energy cost due to pressure drop within the module or pre/post-
treatment. Figure 1C shows that for an idealized single-stage RO process with these assumptions,
the energy efficiency is between 60 and 80% for a range of concentrations and water recoveries
pertinent to SWRO and HPRO. Table 1 summarizes the optimum separation performance (energy
use and recovery) of an ideal HPRO process (2500-5000 psi) to reduce the volume of four common
brines generated during energy and water production. The calculations used to produce these data
are discussed in more detail in Supporting Information. These brines can be significantly
concentrated by HPRO at 5,000 psi, and some of the less concentrated brines (with lower osmotic
pressure) can also be concentrated with an applied pressure of 2,500 psi. For each concentrated
waste brine, the thermodynamic limit is calculated for these two applied pressures. Thus, HPRO
could theoretically achieve an energy efficiency of about 60-80% compared to 5-10% for a MVC
process, providing a more energy-efficient alternative for high salinity brine disposal.
Page 3 of 25 Environmental Science: Water Research & Technology

Figure 1. (A) Osmotic pressure and salt concentration range of the four different types of feed brines discussed in this
review. (B) Theoretical minimum energy for desalination as a function of percent recovery for three different feed
salinities. Each curve ends at a recovery corresponding to a retentate saturated with NaCl; at higher recoveries,
detrimental salt precipitation would occur. (C) Maximum energy efficiency of a single stage RO process as a function
of recovery is similar among feeds with different concentrations. Energy efficiency is calculated as the ratio of the
thermodynamic minimum to the single-stage minimum energy. The maximum recovery for a feed concentration of
200 g/L is 44% because the retentate is a saturated NaCl solution at this recovery.
Page 4 of 25Environmental Science: Water Research & Technology

Table 1: Properties of high-pressure RO feed waters. These ideal values are calculated assuming a lack of fouling
and concentration polarization, and that all divalent cations (which cause scaling29) are removed during pretreatment.
In addition, the osmotic pressure is calculated using a simple empirical model for NaCl-water solutions45.
SWRO brine23
(50% recovery)
Flowback water24 Formation
water32
FGD wastewater5
TDS [mg/L] ~72,000 – 82,000 ~30,000 – 130,000 ~5,000 – 300,000 ~5,000 – 50,000
Volume Produced*
[millions of
m3/day]
60 worldwide 9 in the U.S. Potential for 130 -
150 worldwide
2.2 (worldwide)
0.14 (U.S.)
Δπ total [psi] ~1900 – 2200 ~750 – 3100 ~50 – 5600 ~90 - 1000
Δπ from
monovalent salts
[psi]
~1700 – 2000 ~640 – 2800 ~50 – 4900 ~35 - 700
Major ions
[symbol, mg/L]
Cl- (40,000), Na+
(22,000), Mg2+
(2600), K+ (800)
Na+ (13,000), Cl-
(12,000), Ca2+ (3600),
HCO3- (1200), Sr2+
(1100), CO32- (800), Br-
(300), K+ (300), CO2
(300), Ba2+ (200), Mg2+
(200), SO42- (200)
Cl-, Na+ (~10,000
each), Ca2+, Br-,
HCO3-, SO4
2-,
NO3-, Mg2+, K+
(100-1000 each)
Cl- (1000-28,000),
SO42- (1500-8000),
Mg2+ (1100-5000),
Na+ (700-5000),
Ca2+ (750-4000),
SiO2 (70)
Max recovery**
(2500 psi)
16 to 26% 0 to 67% 0 to 97% 65 to 98%
Min ΔGseparation at
2500 psi [kWh/m3
permeate]
3.9 to 4.3 2.3 to 4.8 0.4 to 4.8 0.3 to 2.4
Max recovery**
(5000 psi)
49 to 55% 35 to 80% 2 to 98% 79 to 99%
Min ΔGseparation at
5000 psi [kWh/m3
permeate]
5.4 to 5.9 3.0 to 7.0 0.4 to 9.4 0.4 to 3.1
*Methods for calculating the volume produced are given in Supporting Information.
**The minimum retentate fraction corresponds to an ideal separation process, in which multivalent ions are removed
during pretreatment; water permeation proceeds to equilibrium; and concentration polarization, feed-side pressure
drop, and membrane fouling are absent.
Despite operating closer to the minimum energy requirements than a thermal process, RO
is mechanically limited by the range of applied pressures. Conventional SWRO is limited to
pressures of approximately 1,200 psi due to the strength limits of membrane materials and spiral-
wound module44. Treatment of high salinity waste brines would benefit from a higher applied
pressure (we consider 2,500-5000 psi, although we calculate that a pressure as high as 7,300 psi
could be used to bring these brines to the saturation point43, 46). Following concentration by HPRO,
the remaining water would be removed by a thermal process such as MVC or a crystallizer (Figure
2). RO processes with applied pressure as high as 3,000 psi have been conducted since the 1980’s
to concentrate landfill leachates using disc-tube RO modules made from stainless steel and high-
performance plastics28, 47-49. Such modules can produce similar permeate flow rates and require
costs similar as those of spiral-wound modules, presenting an attractive option for brine
concentration. This review will discuss the pretreatment requirements for such a process, the
concentration polarization and fouling challenges that would reduce module performance, and how
we might design efficient RO modules for high-pressure operation.
Page 5 of 25 Environmental Science: Water Research & Technology

Figure 2: Process-flow diagram for a ZLD process using (a) thermal methods, (b) FO, and (c) HPRO. Note that in
cases b and c, a thermal process is still required to remove the remaining water from the feed following the membrane
process. Thermal processes (less efficient) are shown in yellow, while membrane processes (more efficient) are shown
in green. By removing some water from the feed with a membrane process, we can increase the overall ZLD
efficiency.
2. Challenges for high-pressure RO
2.1 Concentration polarization
Concentration polarization (CP) is a familiar phenomenon in reverse osmosis, in which the
selective permeation of water through the membrane leaves a layer of high salt concentration near
the membrane surface. The thickness and salt concentration profile of this layer depend on the
balance between convection towards the membrane and back-diffusion of salt50. Numerous
models have been proposed to quantify CP. Because the Film Theory model is simple, analytically
solvable, and predicts experimental results as well as the more rigorous numerical methods51-52, it
is preferred by many process engineers52, and we use it to better understand how concentration
polarization might be different at higher recoveries and salt concentrations. This model can be
derived by solving the salt mass balance in the high-salt boundary layer near the membrane surface
to obtain the ratio of bulk and surface salt concentrations Cm/Cb. This ratio is also known as the
concentration polarization (CP) modulus β, and is given by:
Page 6 of 25Environmental Science: Water Research & Technology
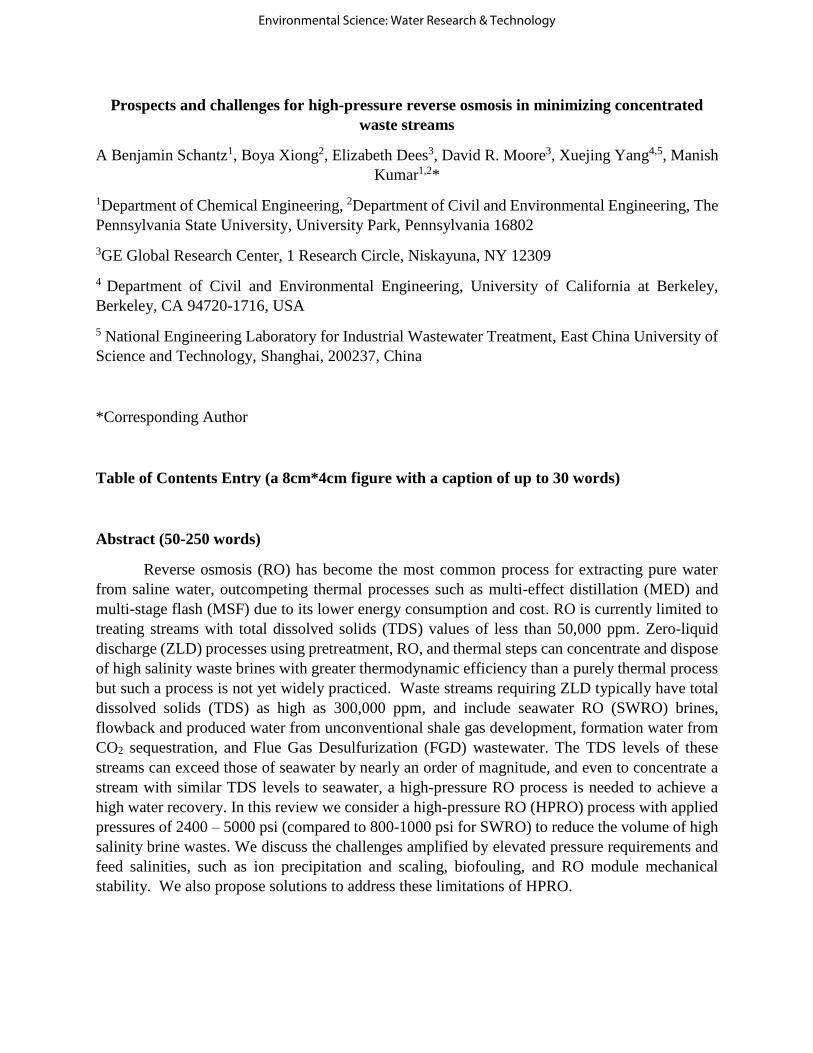
𝛽 = 𝑒𝐽𝑤 𝑘⁄ (1)
Where Jw is the permeate water flux [m/s] and k is the mass transfer coefficient describing salt
diffusion [m/s]. The mass transfer coefficient can be calculated as the ratio of the boundary layer
thickness δ [m] to the salt diffusion coefficient D [m2/s]52, and related to the Reynolds and Schmidt
numbers Re and Sc via an empirical correlation51:
𝑘 =𝐷
𝛿= 0.023
𝐷
𝑑𝐻𝑅𝑒0.83𝑆𝑐0.33 = 0.023
𝐷
2ℎ𝑅𝑒0.83𝑆𝑐0.33 (2)
Where dH is the hydraulic diameter and h is the feed channel height [m]. The relationship dH = 2h
is true for a spiral-wound module because the channel cross-section is a narrow slit (width w >>
h), leading to a hydraulic diameter of:
𝑑𝐻 = 4(𝑓𝑙𝑜𝑤 𝑐𝑟𝑜𝑠𝑠 𝑠𝑒𝑐𝑡𝑖𝑜𝑛)
𝑤𝑒𝑡𝑡𝑒𝑑 𝑝𝑒𝑟𝑖𝑚𝑒𝑡𝑒𝑟=
4𝑤ℎ
2𝑤+2ℎ≈ 2ℎ (3)
Using the definition of recovery in terms of the permeate and feed flow rates, as well as module
geometry, we can re-write the permeate flux in terms of recovery and geometric parameters:
𝑟 = 𝑄𝑃
𝑄𝑓=
𝐿𝑤𝐽𝑤
𝑤ℎ𝑣= 𝐽𝑤
𝐿
𝑣ℎ (4)
𝛽 = 𝑒𝐽𝑤 𝑘⁄ = 𝑒𝑟𝑣ℎ 𝐿𝑘⁄ (5)
Where r is the water recovery in the permeate, v is the feed velocity, L is the length of the
membrane, and QP and Qf are the permeate and feed flow rates. For a fixed module design, v, Jw,
and r are the adjustable parameters. For a constant value of Jw, increasing v will increase the
Reynolds Number and thus increase the mass transfer coefficient and decrease concentration
polarization. This requires operating at a lower recovery ratio, using a longer train of membrane
modules (higher L), or recycling some of the retentate, the second two solutions being common in
SWRO. In addition, the use of feed spacers to promote mixing will reduce concentration
polarization at constant v and Jw44. For a typical RO design, concentration polarization will
increase only moderately (β < 2) at the high recoveries used in a ZLD process, as shown in Figure
3.
It is also worth mentioning that although the Film Theory model for the CP modulus has
no explicit dependence on pressure or salt concentration, high salt concentrations will influence
CP through changes in salt activity and diffusivity. At sufficiently high salt concentrations, the
chemical potential of the salt in solution increases quadratically rather than linearly with salt
concentration, so that the salt back-diffusion (which is proportional to the activity gradient) should
increase compared to the Film Theory Model’s prediction29, 53-54. The result will be lower
concentration polarization than predicted by the Film Theory model, occurring at salt
concentrations ≥ about 120-180 g/L53-54. Our assumption of constant salt diffusivity is also not
precisely correct but is a common design approximation. NaCl diffusivity remains approximately
constant (1.47 to 1.60 x10⁻⁹ m2/s, with a slight increase as NaCl concentration increases from
approximately 29 g/L to 230 g/L)46. These small changes in diffusivity modify the CP modulus
by 0.1 or less under the conditions studied, and the increased diffusivity slightly reduces
Page 7 of 25 Environmental Science: Water Research & Technology

concentration polarization (Figure 3). However, if the salt concentration exceeds about 320 g/L,
the diffusivity declines rapidly and would eventually reach zero at the spinodal limit of 360 g/L46,
leading to a significant increase in concentration polarization.
Finally, the film thickness δ will increase in the feed flow direction rather than being
constant (as is commonly assumed), causing a decrease in the CP mass transfer coefficient k, but
the equation for this increase will depend on the flow profile52. Thus, concentration polarization
will be the most severe in the last module of the RO train, and care should be taken to prevent
concentrations exceeding 320g/L NaCl in any part of the process. We also note that at the higher
recoveries used for HPRO (r > 50%), the CP modulus will be noticeably higher than for SWRO:
1.07- 1.14 at 50% recovery (commonly used for SWRO), 1.1-1.2 at 70% recovery, and 1.15-1.3
at 99% recovery.
Figure 3: Concentration polarization modulus increases with crossflow velocity and recovery (r), provided that NaCl
concentration remains below about 320 g/L. (A) D= 1.35 m2/s, (B) D= 1.6 m2/s. The following values were used in
the film theory model: ρ = 1000 kg/m3, μ = 0.001 kg/m.s, h = 0.00025 m, and L = 10 m. These results are approximately
independent of salt concentration assuming that salt activity is linearly proportional to salt concentration (thus, the CP
modulus may be lower than predicted at salt concentrations ≥ 120-180 g/L).
2.2 Scaling
Scaling due to salt precipitation is a frequently-occurring issue in conventional RO, and
will be increased for high-pressure systems with highly concentrated retentates and a diverse mix
of salts in the feed. To prevent scaling, about 99% of the divalent cations must be removed during
pretreatment27, and quicklime (CaO) and soda ash (Na2CO3) are the compounds used to remove
carbonate and noncarbonate hardness respectively51, 55. CaO precipitates CO2, HCO3-, Mg2+, and
Ca2+ as carbonates and hydroxides at pH 9.3-10.551 (shown in equations S9-S12). Soda ash
(Na2CO3) removes the remaining divalent cations51 (equation S13). Next, we compare the CaCO3-
equivalent concentrations of Ca2+, Mg2+, and HCO3- (calculated using equation S14) to determine
the amount of calcium and magnesium hardness that will precipitate via reactions involving
bicarbonate salts. The calcium precipitates preferentially, followed by magnesium and other
cations if sufficient bicarbonate is present. We then calculate the quicklime required to precipitate
Page 8 of 25Environmental Science: Water Research & Technology

the carbonate hardness (CO2 + bicarbonate salt reactions) and the soda ash required to precipitate
the noncarbonate hardness (the remaining salts) using equations S15 and S16. Chemical reactions
for this process are described further in supporting information.
Barium, magnesium, and calcium can also be removed by a fluidized weak cation exchange
process27, although softening by chemical addition is more common for Ca2+, Sr2+, and Mg2+.
BaCO3 and Ba(OH)2 are both relatively water-soluble, so that Ba2+ cannot be removed with soda
ash or quicklime. Fortunately, however, BaSO4 has a relatively low solubility limit (2-3mg/L)56,
so that the ~200mg/L Ba2+ and ~200mg/L SO42- in flowback water should precipitate. If the
flowback water from a well is rich in Ba2+ but not SO42-, Na2SO4 can be used as a precipitant56.
For feeds with high silica content, additional pretreatment will be needed to prevent irreversible
silica deposition on the membrane, which occurs at ~120 mg/L29. Methods for silica removal
include electrocoagulation with aluminum anodes (removes ~80% of the silica57) and
coprecipitation with lime and soda ash (68% removed58). These processes are necessary to prevent
formation of impermeable silica layers.
Based on current quicklime and soda ash prices, we calculate the costs for chemical
softening for HPRO feeds (shown in Table 2). These costs (between $0.84 and $4.22/m3) are
substantial compared to that of SWRO desalination 0.58/m3 for a modern plant59), although they
are comparable to costs for small-scale (250-1000 m3/day) SWRO installations ($1.25-$4/m3)60.
Pretreatment chemical costs are also only a fraction of the roughly $25/m3 cost of oil and gas
produced water disposal by well injection (which includes transportation, capital costs, and
O&M)61. Thus, depending on the other separation costs, high-pressure RO may be an economical
method for treating fracking flowback water and formation water, or at minimum a more
environmentally friendly method that could also provide irrigation-quality water61.
Table 2: Pretreatment requirements for HPRO feeds. Typical feed compositions and softening chemical costs of
$65/ton for quicklime and $210/ton for soda ash were used in these calculations.
SWRO brine
(50% recovery)
Fracking flowback
water
Formation water FGD water
Ions removed
[name, mg/L]
Mg2+ (1300) Ca2+ (3600), HCO3-
(1200), Sr2+ (1100),
CO2 (300), Mg2+ (200),
Ba2+ (200), SO42- (200)
Ca2+, HCO3-, Mg2+
(assume a high
concentration of 1000
each)
Ca2+ (3000),
Mg2+ (2400)
(using average
concentrations)
Carbonate
hardness [mg/L as
CaCO3]
0 ~1970 from Ca2+ and
HCO3-, ~1820 from
CO2
~1640 from Ca2+ and
HCO3-
0
Non-carbonate
hardness [mg/L as
CaCO3]
~3250 ~820 from Mg2+, ~7030
from remaining Ca2+
~4090 from Mg2+,
~860 from remaining
Ca2+
~17,000
CaO required
[mg/L]
~1820 ~3280 ~3210 5510
Na2CO3 required
[mg/L]
~3450 ~8320 ~5250 ~18,000
Treatment cost
[$/m3]
~0.84 ~2.24 ~1.31 ~4.22
2.3 Biofouling
Page 9 of 25 Environmental Science: Water Research & Technology

Biofouling is also likely to be a substantial challenge for high-pressure RO. Biofilms form on
both membranes and spacers62-63 and the cells and extracellular polymeric substances (EPS) form
cakes that enhance concentration polarization and reduce flux62. Pressures of 220,000-2,200,000
psi are needed to kill most bacteria via protein denaturation and/or lipid membrane phase changes
upon compression, with the required pressure varying between bacterial species64. The pressure
required to kill bacterial also increases with the salt concentration of the solution that the bacteria
grow in64. However, lower pressures than this can kill or slow the growth of some bacterial
species. ZoBell et al found that most terrestrial bacteria grow more slowly at 4500 psi and are not
viable at 9000 psi65. In comparison, marine bacteria are more variable, and some can grow as
quickly at 9000 psi as at atmospheric pressure65. In addition, while biofilm formation is known to
depend on hydrophobic and electrostatic interactions with the membrane surface, adsorption of
macromolecules to membrane surfaces, membrane surface roughness, hydrodynamics, pH,
nutrients, divalent cations concentration, and bacterial flagellar mobility62, there is no previous
discussion of the effect of pressure on biofilm growth on membrane surfaces. Two types of bacteria
known to form biofilms in RO modules are E. coli and Mycobacterium strain BT2-462. E. coli in
suspension grows as quickly at 4500 psi as at atmospheric pressure and more slowly at up to 7500
psi. Although Mycobacterium strain BT2-4 has not been studied at high pressure, two
Mycobacterium species (phlei and smegmatis) are known to grow at a reduced rate at 4500-6000
psi65. To the best of our knowledge, the highest pressure at which biofilm formation has been
studied is 1300 psi (such a biofilm is shown in Figure 4)66. These dense biofilms were as effective
as those grew under ambient conditions at clogging a porous substrate. Likely, biofilm formation
will persist at the pressures of HPRO (2500-5000 psi).
Page 10 of 25Environmental Science: Water Research & Technology

Figure 4: (A) A clean sandstone substrate and (B) the surface after one month of biofilm growth at 1300 psi.
Reproduced with permission from Mitchell, et al. 66
Once formed, biofilms are extremely resilient and cannot be removed through chemical
cleaning (including with supercritical CO266), lack of nutrients66, or quorum quenching agents such
as vanillin67. Thus the focus of research is to prevent biofilm formation. Incorporation of colloidal
silver particles with antimicrobial effects into the membrane or spacers has been shown to delay
biofouling68. Re-design of feed spacers to eliminate biofilm nucleation sites such as crossed
support beams63 also reduces biofilm formation, and biofilm nucleation at such sites is shown in
Figure 5. The feed spacer is necessary in current module designs to create local vorticity and
reduce concentration polarization44. However, one patent describes a method for adding ridges and
baffles to a spiral-wound membrane to create local vorticity without a feed spacer69. Finally,
quorum quenching agents have been shown to suppress biofilm formation, and include furanones
(effective and widely studied but toxic), vanillin (nontoxic and reduced biofilm coverage by 97%
after 1 week), salicylic acid, urosolic acid, cinnamaldehyde, garlic extract, and cranberry extract67.
Periodic cleaning, including sterilization with formaldehyde, peroxide, or peracetic acid solution
and bacteria removal using alkalis and surfactants can increase the membrane lifetime but also
degrades the membrane over time29, so that proper biofilm prevention is essential.
Figure 5: The intersections of the feed spacer supports in spiral-wound RO modules serve as nucleation sites for
biofilm formation. Thus, improved feed spacers (or modules that can function without them) are one method for
reducing biofilm growth. Reproduced with permission from Vrouwenvelder, et al. 63.
2.4 Mechanical Stability at high pressure
One final challenge for high-pressure RO is the mechanical stability of RO modules at high
pressure. Current spiral-wound and hollow-fiber modules are limited to about 1200 psi44 due to
the materials used in their construction. However, designing high-pressure modules is certainly
possible; the disc-tube modules commonly used for concentrating landfill leachates prior to drying
Page 11 of 25 Environmental Science: Water Research & Technology
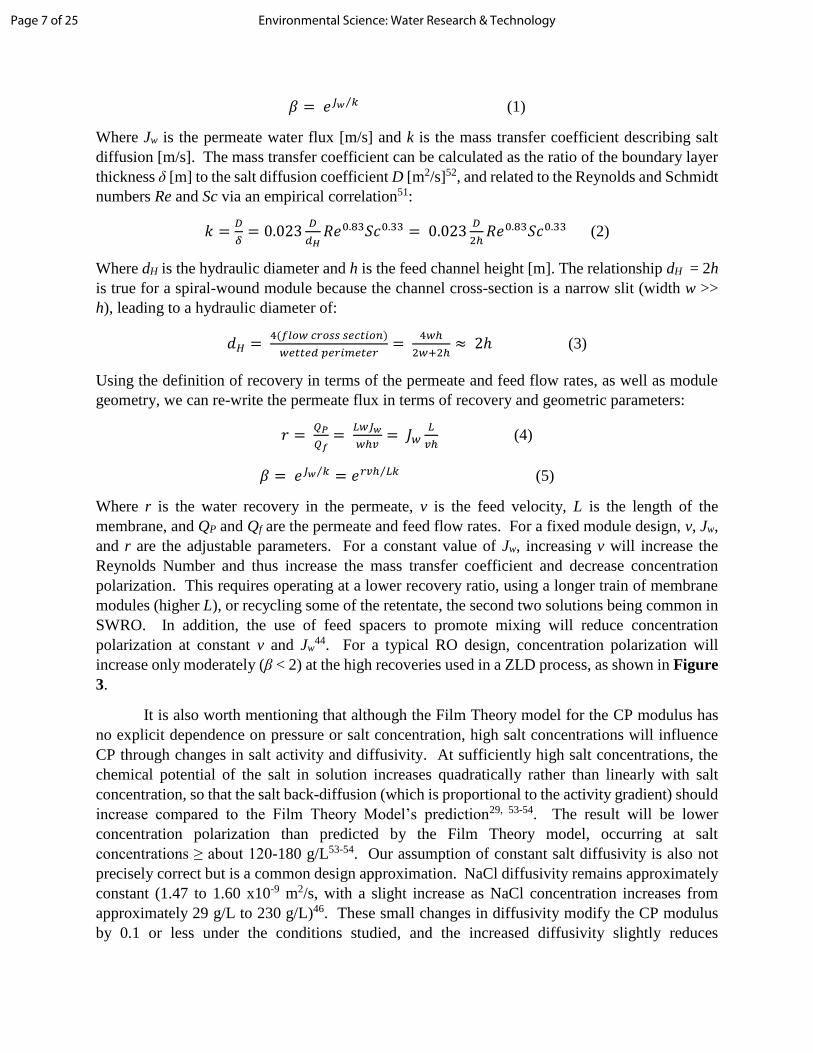
via a thermal process operate around 1800-3000 psi28, 47, 70. Such a module is shown schematically
in Figure 6; in this design the feed flows around a series of membrane-coated hydraulic discs, and
the permeate enters these discs before flowing to a central connecting tube. One example of a
disc-tube module design is the Pall Corporation’s DTGE-HHP, which operates at a pressure of
2350 psi and feed flow rate of 29 m3/day with permeate fraction 0.9-0.95, and has a 0.2 m internal
diameter and 1.4 m length49, making it similar in size and throughput to spiral-wound RO modules
(typically 34-38 m3/day29). Materials used include a fiber-reinforced plastic pressure tube, a
polyoxymethylene water-tight flange, a stainless steel pressure flange, and an acrylonitrile
butadiene styrene spacing disc49. Benefits of disc-tube modules also include easy cleaning and
turbulent flow49, both important to operation under high-fouling conditions, although they are also
more expensive than spiral-wound modules (the DTGE-HHP module costs about $1400-$1600,
and Pall’s other disc-tube modules cost about the same compared to a typical cost of about $700
for a GE Water spiral-wound module). Pressure limits for a broader variety of disc-tube RO
modules are given in Table 3, which shows that values of almost 3000 psi have been achieved on
the pilot scale.
Figure 6: Schematic of a disc-tube RO module, courtesy of Pall Corporation. Copyright Pall Corporation 201849.
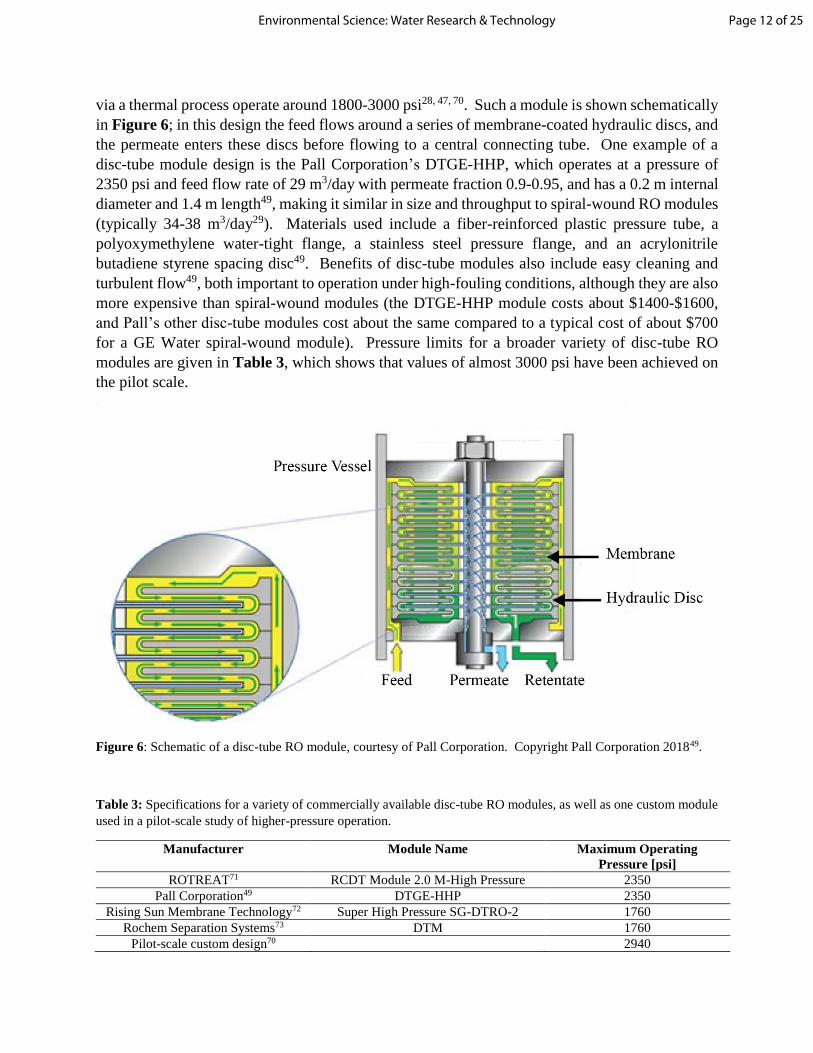
Table 3: Specifications for a variety of commercially available disc-tube RO modules, as well as one custom module
used in a pilot-scale study of higher-pressure operation.
Manufacturer Module Name Maximum Operating
Pressure [psi]
ROTREAT71 RCDT Module 2.0 M-High Pressure 2350
Pall Corporation49 DTGE-HHP 2350
Rising Sun Membrane Technology72 Super High Pressure SG-DTRO-2 1760
Rochem Separation Systems73 DTM 1760
Pilot-scale custom design70 2940
Page 12 of 25Environmental Science: Water Research & Technology

However, most RO modules are spiral-wound, and high-pressure modules of this type
might be designed given improved materials and a proper understanding of the failure mechanisms
at high pressures. Figure 7 shows such a module schematically; water enters the feed flow channel
(which contains a spacer), and then permeates across the membranes and into the space within
each membrane leaf. From there, the permeate flows towards a central collection tube from which
it exits the module. To the best of our knowledge, the failure mechanisms of spiral-wound modules
are not discussed in detail in the publically available literature. However, collapse of the permeate
collection tube and failure of the membrane leaves at the collection tube junction are two common
failure mechanisms known in industry (David Moore, personal communication). Two other failure
mechanisms discussed in literature are telescoping (mitigated using an anti-telescoping end-cap44)
and module rupture due to pressure gradients during startup (eliminated by adding vents to the
anti-telescoping device (ATD) to allow water to fill the module quickly and uniformly74). Better
understanding of these failure mechanisms and the design improvements needed to counteract
them would be a good direction for future research.
Figure 7: Schematic of a spiral-wound RO module, modified with permission from Buecker 75. A single permeate
carrier and the membranes separating it from the feed solution constitute one membrane leaf.
Regardless of module design, one problem that will be more important to mitigate at high pressure
is membrane compaction. When a pressure difference is applied across a membrane, voids within
the membrane shrink or collapse, and this compaction reduces the membrane permeability76-78.
The extent of compaction reaches a steady state after initially increasing with time79, and is greater
for a higher applied pressure difference78, 80. To mitigate this problem, a number of groups have
created composite membranes that incorporate mechanically strong nanoparticles79, 81-82, which
minimize the measured decrease in membrane thickness and loss of water flux, particularly if they
are incorporated into the membrane’s thin selective surface layer, which plays a key role in
Page 13 of 25 Environmental Science: Water Research & Technology

determining water permeability and the effects of compaction80-81. Another method for reducing
membrane compaction would be to use a mechanically stronger membrane material. The limited
literature available suggests that the burst pressure of a polyamide tube is about 2,500-4,600 psi at
room temperature83 although the burst pressure for specific aromatic polyamide composite
membranes is not reported. The modulus for the selective surface layer of current polyamide RO
membranes is about 1 GPa84, so materials for HPRO membrane surface layers should have a
modulus no less than this value.
3. Enabling Technologies for high-pressure RO
3.1 Module design improvements
Most current RO facilities use a standard module configuration with 0.2 m width and 1 m
length that is well-studied and well-supported, researchers continue to optimize spiral-wound RO
module designs. To maximize the water recovery in the permeate, it is important to minimize the
feed-side pressure drop per unit length (and thus maintain the driving force for water permeation
across the membrane)29, 44. Otherwise, the water flux in the later part of the module will be
reduced, reducing the module efficiency overall, a particularly important concern for brine
disposal applications, in which our goal is to remove as much water as possible from a feed with
high osmotic pressure. Feed spacer design is an important consideration in minimizing feed-side
pressure drop: pressure drop per unit length increases with increasing feed spacer support
density44. A dense feed spacer network also creates more available nucleation sites for
biofouling63. On the other hand, the benefit of a dense feed-spacer network is that the spacer can
prevent feed channel compaction during module manufacturing, and reduce concentration
polarization (which is also a more serious problem at high recoveries) by creating local vorticity44.
Membranes with built-in baffles on their surfaces to create local vorticity without a feed spacer
may provide a way to avoid this trade-off69. Another method for reducing feed-side pressure drop
is to reduce the length of the RO train by using wider modules with greater membrane area and
permeate production per 44, 85. Based on these considerations, a consortium of manufacturers
decided to produce modules with a diameter of 0.4 m as a second standard size. These modules
have been installed in 24 RO facilities worldwide, and their benefits include reduced floor space
and piping required compared to 0.2 m modules, thereby reducing capital costs44, 59.
A number of additional changes have been suggested for improving spiral-wound module
design. In a spiral-wound module, the permeate is collected in membrane leaves and flows towards
a central permeate tube, from which it exits the module (Figure 5). Spiral-wound leaves have a
permeate-side pressure drop per unit length that depends on leaf width w, permeate spacer friction
coefficient k, and local flow rate q44:
𝑑𝑃
𝑑𝑥= −𝑘
𝑞
𝑤
Here, x is the permeate flow direction (towards the central permeate tube). The permeate flow
within the leaf increases and pressure decreases moving towards the central permeate tube, so that
Page 14 of 25Environmental Science: Water Research & Technology

more water passes through the membrane closer to the permeate tube. This uneven use of the
membrane area leads to premature fouling of the over-used area while the membrane far from the
collection tube is underused44. This problem of uneven transmembrane flux is mitigated by
reducing leaf length: shorter leaves minimize the flux difference along the length of the leaflet and
thus improve membrane efficiency, as shown in Figure 8. Consequently, we recommend using a
larger number of leaves (rather than an equal number of longer leaves) when module diameter
increases44.
Another concern for high-pressure applications is the need for thicker pressure vessels to
accommodate higher operating pressures and wider RO modules. The specific module
improvements required for high-pressure operation at 2500-5000 psi have not been previously
discussed and the additional capital cost cannot be quantified at present. However, this additional
capital cost could be counteracted by a wider diameter module design that reduces piping and the
number of RO trains. The Sorek plant (completed near Tel Aviv in 2013) was the first large-scale
conventional SWRO facility to use 0.4 m wide modules. The use of these modules in combination
with high-efficiency pumps and energy recovery devices results in a lower water production cost
than at any previous SWRO facility59.
Figure 8: Membrane efficiency decreases monotonically with leaf length due to uneven flux along the length of the
leaf. A membrane permeability of 12.3 L/m2*s*MPa and a friction coefficient of 35 MPa*s/m3 were used in this
calculation, and were typical of RO module performance at the time of publication. Modified with permission
fromJohnson and Busch 44.
3.2 Pretreatment and salt recovery methods
After concentration by RO, additional treatments may be used to further minimize or eliminate
brine discharge, as summarized below.
External reuse: Saline brines with various compositions can be used to irrigate salt-tolerant
crops and trees, as water for aquaculture (fish, algae, seaweed, and brine shrimp farming), or
stored in solar ponds whose thermal energy can be used to produce heat and electricity;
although composition limits and concerns about heavy metal accumulation from brines limit
these options33. A comprehensive list of applications can be found in the Options for
Productive Use of Salinity (OPUS) database86.
Page 15 of 25 Environmental Science: Water Research & Technology
Solar evaporation: Evaporation using shallow (25-45 cm depth) pond is a conventional
method for elimination of SWRO brines due to the ease of construction and operation.
However, the land areas required can be substantial, (i.e. 13.6-34.3 ha for desalination plants
in central Saudi Arabia), limiting this method to areas with high solar flux, low humidity, and
low property prices25. Capillaries or wet surfaces can be used to improve evaporation rates,
such as in the Wind-Aided Intensified eVaporation (WAIV) process, in which brine is
recirculated as a thin falling film to maximize water-air contact and thus maximize
evaporation25. Lab-scale tests suggest that this process can reduce the required land area by
an order of magnitude25.
Thermal processes: A multi-stage flash or other thermal process can be used, although such
methods require a great deal of energy and expense28, 34., For example, when a thermal process
was used to remove the remaining 10% of the water from landfill leachates after RO treatment,
the thermal process accounted for 35-38% of the overall costs28.
Zero Liquid Discharge (ZLD) salt recovery processes: ZLD processes use a series of
concentration and precipitation steps to recover pure water and valuable salts from saline
brines, realizing zero waste disposal25. For example, the SAL-PROC method uses a series of
steps: concentration by RO or solar evaporation, crystallization using a cooling vessel or
crystallizer pond, and precipitation using a reaction vessel with added lime or soda ash33-34.
This process produces separate gypsum, calcium carbonate, magnesium hydroxide, sodium
chloride, and sodium sulfate products33-34. The ROSP process uses evaporative crystallization
to produce NaCl and evaporative cooling to produce Na2SO434. Revenue from salt products
could cover about 2/3 of the separation cost for brackish water purification, although the
economics would change for HPRO due to changes in feed composition and applied pressure.
We note that NaCl is commercially produced from seawater, and Mg(OH)2 has been in the
past20. This suggests the potential economic benefits of recovering byproducts from brine to
compensate for some of the cost of desalination.
Bipolar Membrane Electrodialysis (BMED): BMED provides an alternative method for
recovering useful chemical from RO brines – acids and bases rather than salts. An electrical
potential gradient drives the preferential diffusion of anions and cations through selective
membranes, and into compartments in which they combine with hydrogen and hydroxide ions
respectively. These H+ and OH- ions are generated from the disassociation of water at bipolar
membranes. The acids and bases (primarily NaOH and HCl) can be recovered at
concentrations up to 0.2 M36.
Chlor-Alkali Process: Similarly to BMED, this process uses an electrochemical cell to oxidize
chloride ions to chlorine gas and convert sodium ions and water to sodium hydroxide20, 87.
Hydrogen gas is produced at the cathode, and can be either collected as a commodity, used on
site, or directly released to the atmosphere87. A membrane cell process outcompetes other
configurations such as the diaphragm cell process and the mercury cell process because it
produces high-purity NaOH and avoids the environmental problems stemming from heavy
metal use87.
Page 16 of 25Environmental Science: Water Research & Technology

Electrochlorination (EC): Electrochlorination is a redox process that uses an electrolytic cell
to convert NaCl and water to sodium hypochlorite and hydrogen. Although this process and
BMED have only been tested at the laboratory scale, a preliminary economic analysis shows
that BMED has lower capital and operating costs ($0.79/m3) than evaporation ponds or ZLD
($2.04 and $1.30/m3 respectively). This analysis also showed that although EC had higher
costs than the other three processes ($2.35/m3), sale of hypochlorite could result in a net profit
of $0.85/m3, whereas the other processes would operate at a loss36.
Because this economic analysis was conducted for a brackish water feed, we have redone the
calculation of potential revenues for recovered salts and chemicals for SWRO brine, formation
water, produced water, and FGD water. Table 4 shows the amount of salts and other chemicals
that could be recovered from each feed, as well as their sale value at current prices of $42/ton for
NaCl, $60/ton for Cl2, $100/ton for Na2SO4, $350/ton for NaOH, $400/ton for NaOCl, $200/wet
ton (35% acid) for HCl, $300/ton for H2SO4, $1500/ton for HBr, $350/ton for HNO3, and about
$1000/ton for KOH. This analysis shows the most potential revenue from BMED. Given that this
process had lower capital and operating costs than the others when brackish water was used as a
feed36, BMED will probably be the best option for chemical recovery from the concentrates
studied. However, further pilot-scale study of capital and operating costs for acid, base, and salt
recovery, as well as an analysis of the price-demand curve for the salts and chemicals produced,
would be required to confirm this.
Table 4: Revenues from salt or chemical recovery after concentration using the SAL-PROC, BMED, chlor-alkali, and
EC methods. These costs don’t include the capital and operating expenses for the recovery, revenues from CaCO3
and Mg(OH)2 precipitated during pretreatment, or the effect of salt production from RO on worldwide salt and
chemical prices.
SWRO brine
(50%
recovery)
Fracking
flowback water
Formation water FGD water
Major ions after
pretreatment
[symbol, mg/L]
Cl- (20,000),
Na+ (11,000),
K+ (400)
Na+ (13,000), Cl-
(12,000), Br- (300),
K+ (300)
Cl-, Na+ (~10,000 each),
Br-, SO42-, NO3
-, K+ (100-
1000 each)
Cl- (1000-
28,000), SO42-
(1500-8000), Na+
(700-5000)
Salts produced by
SAL-PROC [symbol,
mg/L]
NaCl (28,000) NaCl (19,700) NaCl (16,800) Na2SO4 (2100-
11,800) + NaCl
(900-8100)
Acids and bases
produced by BMED
[symbol, mg/L]
HCl (20,500),
NaOH
(19,200), KOH
(560)
NaOH (22,800),
HCl (12,200), HBr
(300), KOH (450)
NaOH (17,200), HCl
(10,400), HBr (100-1000),
H2SO4 (100-1000), HNO3
(100-1000), KOH (120-
1200)
HCl (1100-
28,800), H2SO4
(1500-8100),
NaOH (1200-
8800)
Chemicals produced
by the chlor-alkali
process [symbol,
mg/L]
NaOH
(19,200), Cl2
(20,000)
NaOH (22,800),
Cl2 (12,000)
NaOH (17,200), Cl2
(10,000)
NaOH (1200-
8800), Cl2 (1000-
28,000)
Amount of
hypochlorite from
EC [mg/L]
35,500 25,200 21,500 2200 to 16,300
Revenue from SAL-
PROC [$/m3 feed]
1.2 0.83 0.71 0.25-1.52
Page 17 of 25 Environmental Science: Water Research & Technology

Revenue from
BMED [$/m3 feed]
19.0 15.9 12.9-15.9 1.5-22.0
Revenue from the
chlor-alkali process
[$/m3 feed]
7.9 8.7 7.2 0.48-4.76
Revenue from EC
[$/m3 feed]
14.2 10.1 8.6 0.88-6.52
3.3 Recovery of trace metals
Recovering trace metals from seawater has been proposed due to the vast amounts of these
species present in sea water compared to those on land88, and as a way to defray the costs of brine
disposal20. High salinity brine is likely to contain more concentrated metals compared to seawater,
allowing a more efficient recovery. Lithium is a minor component in most brines, which can be
recovered by proposed processes including adsorption, bioaccumulation, ion-exchange, and
membrane processes20. Lithium recovery from seawater is not cost effective compared to
extraction from salt beds and ores, and can also be more environmentally destructive than
mining20. However, these salt beds and ores are available in only a few countries, and full-scale
SWRO facilities to extract Lithium are under construction in Japan and Korea20. Uranium is
present in seawater at even lower concentrations (about 3 ppb). A half-wave rectified alternating
current electrochemical method (HW-ACE) has been proposed to extract uranium more efficiently
than existing physicochemical adsorption methods88. This method uses and amidoxime-
functionalized electrode surface to adsorb UO2+ (along with other cations) and selectively reduce
it to UO2 before releasing the non-reduced cations88. Uranium concentrations up to 1.9 g/g can be
deposited on the electrode over a 10-20 hour period, although the adsorbed concentration increases
with the solution concentration88; thus RO brines are a better uranium source for this process than
seawater. This method could potentially be applied to the recovery of other trace metals, although
different chelating agents and a modified electrical cycle would be needed.
4. Future work and implications
High-pressure reverse osmosis (2500-5000 psi) would allow for the concentration of high-
salinity waste streams including SWRO brines, formation waters associated with carbon
sequestration, fracking flowback water, and flue gas desulfurization wastewater. The feeds
generated from these applications contain a variety of minerals, with typical osmotic pressure
ranging widely from ~100 to ~3000 psi. The process provides a potentially more energy-efficient
brine concentration method than thermal processes, but a number of challenges remain to be
addressed. The divalent cations in these brines are potential scalants that can be removed by the
lime and soda ash softening processes commonly used for municipal water treatment. Biofouling
will likely present another important challenge to separation, as multiple bacteria species known
to cause biofouling grow at the pressures of interest. This problem can be mitigated by strategies
such as incorporation of biocidal silver particles into the membrane and feed spacer, advanced feed
spacer design, and membrane cleaning, although no method is known to eliminate it.
Concentration polarization will require a higher applied pressure especially at high recoveries, but
Page 18 of 25Environmental Science: Water Research & Technology

a slight increase in NaCl diffusivity at increased concentrations will reduce this problem to a
certain degree (at salt concentration < 320 g/L).
Disc-tube modules are commonly operated at 1800-3000 psi, while spiral-wound modules
have a pressure limit of about 1200 psi. Currently available literature provides little information
on the failure mechanisms for spiral-wound modules. The materials and design of the disc-tube
modules can serve as a good reference for the improvement of spiral-wound designs. The
efficiency of spiral-wound modules can also be improved by increasing the module diameter and
number of membrane leaves, and by minimizing the feed-side pressure drop. The high applied
pressure still require the module to have a thicker pressure vessel, although the cost of this vessel
could be offset because larger RO modules require less piping and fewer RO trains . Finally,
because RO cannot reduce the retentate fraction to zero regardless of the applied pressure, a brine
disposal method will be necessary. Possible processes for ZLD include salt recovery, the chlor-
alkali process, solar evaporation, BMED, and electrochlorination, which all eliminate the liquid
waste and recovering salts or other chemicals as valuable byproducts. The BMED process appears
to provide the highest high revenue because it converts the salts present into acids and bases with
higher value. Overall, HPRO holds promise as a method for disposing of brines from several
energy and water-related processes, and improvements in high-pressure module design would be
a good first step, as it would allow a more detailed investigation of the module mechanical
requirements and RO facility operational and capital costs
Acknowledgment
This material is based on work supported by the Department of Energy under Award Number DE-
FE0026308.
Disclaimer
This report was prepared as an account of work sponsored by an agency of the United States
Government. Neither the United States Government nor any agency thereof, nor any of their
employees, makes any warranty, express or implied, or assumes any legal liability or responsibility
for the accuracy, completeness, or usefulness of any information, apparatus, product, or process
disclosed, or represents that its use would not infringe privately owned rights. Reference herein
to any specific commercial product, process, or service by trade name, trademark, manufacturer,
or otherwise does not necessarily constitute its endorsement, recommendation, or favoring by the
United States Government or any agency thereof. The views and opinions of authors expressed
herein do not necessarily state or reflect those of the United States Government or any agency.
Page 19 of 25 Environmental Science: Water Research & Technology
REFERENCES
1. Jiménez, S.; Micó, M.; Arnaldos, M.; Medina, F.; Contreras, S., State of the art of produced water treatment. Chemosphere 2018, 192, 186-208. 2. Dadari, S.; Rahimi, M.; Zinadini, S., Crude oil desalter effluent treatment using high flux synthetic nanocomposite NF membrane-optimization by response surface methodology. Desalination 2016, 377, 34-46. 3. Ellis, C. E., Wet air oxidation of refinery spent caustic. Environ. Prog. 1998, 17 (1), 28-30. 4. Tarutis Jr, W. J.; Stark, L. R.; Williams, F. M., Sizing and performance estimation of coal mine drainage wetlands. Ecol. Eng. 1999, 12 (3-4), 353-372. 5. Higgins, T. E.; Sandy, A. T.; Givens, S. W., Flue gas desulfurization wastewater treatment primer. Power (New York) 2009, 153 (3). 6. Wilkinson, J.; Watt, D.; Headquarters, N., Review of demilitarisation and disposal techniques for munitions and related materials. MSIAC/NATO/PfP Editor, Report L-118 2006. 7. Shi, X.; Lefebvre, O.; Ng, K. K.; Ng, H. Y., Sequential anaerobic–aerobic treatment of pharmaceutical wastewater with high salinity. Bioresour. Technol. 2014, 153, 79-86. 8. Liu, Y.; Ma, L.; Liu, Y.; Kong, G., Investigation of novel incineration technology for hospital waste. Environmental science & technology 2006, 40 (20), 6411-6417. 9. Chatzisymeon, E.; Xekoukoulotakis, N. P.; Diamadopoulos, E.; Katsaounis, A.; Mantzavinos, D., Boron-doped diamond anodic treatment of olive mill wastewaters: statistical analysis, kinetic modeling and biodegradability. Water Res. 2009, 43 (16), 3999-4009. 10. Zhang, H.; Fang, S.; Ye, C.; Wang, M.; Cheng, H.; Wen, H.; Meng, X., Treatment of waste filature oil/water emulsion by combined demulsification and reverse osmosis. Sep. Purif. Technol. 2008, 63 (2), 264-268. 11. Durai, G.; Rajasimman, M., Biological Treatment of Tannery Wastewater- A Review. Journal of Environmental science and Technology 2011, 4 (1), 1-17. 12. Källqvist, T.; Carlberg, G.; Kringstad, A., Ecotoxicological characterization of industrial wastewater—sulfite pulp mill with bleaching. Ecotoxicol. Environ. Saf. 1989, 18 (3), 321-336. 13. Zhou, M.; Tan, Q.; Wang, Q.; Jiao, Y.; Oturan, N.; Oturan, M. A., Degradation of organics in reverse osmosis concentrate by electro-Fenton process. J. Hazard. Mater. 2012, 215, 287-293. 14. Zhou, M.; Liu, L.; Jiao, Y.; Wang, Q.; Tan, Q., Treatment of high-salinity reverse osmosis concentrate by electrochemical oxidation on BDD and DSA electrodes. Desalination 2011, 277 (1-3), 201-206. 15. Drioli, E.; Curcio, E.; Criscuoli, A.; Di Profio, G., Integrated system for recovery of CaCO3, NaCl and MgSO4· 7H2O from nanofiltration retentate. J. Membr. Sci. 2004, 239 (1), 27-38. 16. Ivanovic, I.; Leiknes, T.; Ødegaard, H., Influence of loading rates on production and characteristics of retentate from a biofilm membrane bioreactor (BF-MBR). Desalination 2006, 199 (1), 490-492. 17. Chiang, L.-C.; Chang, J.-E.; Wen, T.-C., Indirect oxidation effect in electrochemical oxidation treatment of landfill leachate. Water Res. 1995, 29 (2), 671-678. 18. Renou, S.; Givaudan, J.; Poulain, S.; Dirassouyan, F.; Moulin, P., Landfill leachate treatment: review and opportunity. J. Hazard. Mater. 2008, 150 (3), 468-493. 19. Kim, D. H., A review of desalting process techniques and economic analysis of the recovery of salts from retentates. Desalination 2011, 270 (1-3), 1-8.
Page 20 of 25Environmental Science: Water Research & Technology

20. Shahmansouri, A.; Min, J.; Jin, L.; Bellona, C., Feasibility of extracting valuable minerals from desalination concentrate: a comprehensive literature review. Journal of Cleaner Production 2015, 100, 4-16. 21. Fakhru’l-Razi, A.; Pendashteh, A.; Abdullah, L. C.; Biak, D. R. A.; Madaeni, S. S.; Abidin, Z. Z., Review of technologies for oil and gas produced water treatment. J. Hazard. Mater. 2009, 170 (2-3), 530-551. 22. Joo, S. H.; Tansel, B., Novel technologies for reverse osmosis concentrate treatment: A review. J. Environ. Manage. 2015, 150, 322-335. 23. Dickson, A. G.; Goyet, C., Handbook of methods for the analysis of the various parameters of the carbon dioxide system in sea water. publisher not identified: 1994. 24. Madalyn Blondes, K. G., Elisabeth Rowan, James Thordsen, Mark Reidy, Mark Engle, Yousif Kharaka, Burt Thomas, U.S. Geological Survey National Produced Waters Geochemical Database version 2.2. 2016. 25. Pérez-González, A.; Urtiaga, A.; Ibáñez, R.; Ortiz, I., State of the art and review on the treatment technologies of water reverse osmosis concentrates. Water Res. 2012, 46 (2), 267-283. 26. Duxbury, A.; Byrne, R. H.; Mackenzie, F. T., Chemical and physical properties of seawater. In Encyclopedia Britannica, 1998 ed.; 2017. 27. Heijman, S.; Guo, H.; Li, S.; Van Dijk, J.; Wessels, L., Zero liquid discharge: Heading for 99% recovery in nanofiltration and reverse osmosis. Desalination 2009, 236 (1), 357-362. 28. Rautenbach, R.; Linn, T., High-pressure reverse osmosis and nanofiltration, a “zero discharge” process combination for the treatment of waste water with severe fouling/scaling potential. Desalination 1996, 105 (1), 63-70. 29. Baker, R., Membrane Technology and Applications. 2nd ed.; Wiley: West Sussex, 2008. 30. Elimelech, M.; Phillip, W. A., The future of seawater desalination: energy, technology, and the environment. science 2011, 333 (6043), 712-717. 31. Shaffer, D. L.; Arias Chavez, L. H.; Ben-Sasson, M.; Romero-Vargas Castrillon, S.; Yip, N. Y.; Elimelech, M., Desalination and reuse of high-salinity shale gas produced water: drivers, technologies, and future directions. Environmental science & technology 2013, 47 (17), 9569-9583. 32. Harto, C.; Veil, J. Management of water extracted from carbon sequestration projects; Argonne National Laboratory (ANL): 2011. 33. Ahmed, M.; Arakel, A.; Hoey, D.; Thumarukudy, M. R.; Goosen, M. F.; Al-Haddabi, M.; Al-Belushi, A., Feasibility of salt production from inland RO desalination plant reject brine: a case study. Desalination 2003, 158 (1-3), 109-117. 34. Neilly, A.; Jegatheesan, V.; Shu, L., Evaluating the potential for zero discharge from reverse osmosis desalination using integrated processes–A review. Desalination and water treatment 2009, 11 (1-3), 58-65. 35. Tong, T.; Elimelech, M., The global rise of zero liquid discharge for wastewater management: drivers, technologies, and future directions. Environmental science & technology 2016, 50 (13), 6846-6855. 36. Badruzzaman, M.; Oppenheimer, J.; Adham, S.; Kumar, M., Innovative beneficial reuse of reverse osmosis concentrate using bipolar membrane electrodialysis and electrochlorination processes. J. Membr. Sci. 2009, 326 (2), 392-399. 37. Gingerich, D. B.; Sun, X.; Behrer, A. P.; Azevedo, I. L.; Mauter, M. S., Spatially resolved air-water emissions tradeoffs improve regulatory impact analyses for electricity generation. Proc. Natl. Acad. Sci. 2017, 114 (8), 1862-1867. 38. Al-Karaghouli, A.; Kazmerski, L. L., Energy consumption and water production cost of conventional and renewable-energy-powered desalination processes. Renewable and Sustainable Energy Reviews 2013, 24, 343-356.
Page 21 of 25 Environmental Science: Water Research & Technology

39. Arena, J. T.; Jain, J. C.; Lopano, C. L.; Hakala, J. A.; Bartholomew, T. V.; Mauter, M. S.; Siefert, N. S., Management and dewatering of brines extracted from geologic carbon storage sites. International Journal of Greenhouse Gas Control 2017, 63, 194-214. 40. Hamed, O.; Zamamiri, A.; Aly, S.; Lior, N., Thermal performance and exergy analysis of a thermal vapor compression desalination system. Energy Convers. Manage. 1996, 37 (4), 379-387. 41. Shaffer, D. L.; Werber, J. R.; Jaramillo, H.; Lin, S.; Elimelech, M., Forward osmosis: where are we now? Desalination 2015, 356, 271-284. 42. McGinnis, R. L.; Hancock, N. T.; Nowosielski-Slepowron, M. S.; McGurgan, G. D., Pilot demonstration of the NH3/CO2 forward osmosis desalination process on high salinity brines. Desalination 2013, 312, 67-74. 43. McGovern, R. K., On the potential of forward osmosis to energetically outperform reverse osmosis desalination. J. Membr. Sci. 2014, 469, 245-250. 44. Johnson, J.; Busch, M., Engineering aspects of reverse osmosis module design. Desalination and Water Treatment 2010, 15 (1-3), 236-248. 45. Miyawaki, O.; Saito, A.; Matsuo, T.; Nakamura, K., Activity and activity coefficient of water in aqueous solutions and their relationships with solution structure parameters. Biosci., Biotechnol., Biochem. 1997, 61 (3), 466-469. 46. Chang, Y.; Myerson, A., The diffusivity of potassium chloride and sodium chloride in concentrated, saturated, and supersaturated aqueous solutions. AlChE J. 1985, 31 (6), 890-894. 47. Peters, T. A., Purification of landfill leachate with reverse osmosis and nanofiltration. Desalination 1998, 119 (1), 289-293. 48. Chengda, H. Membrane Pressure Vessels Department. http://www.chengda-winder.com/en/showproducts.asp?id=5. 49. Corporation, P. Pall Disc Tube Module System. https://shop.pall.com/us/en/oil-gas/midstream/midstream-process-water-/pall-disc-tube-module-system-zidgri78l7k. 50. Sablani, S.; Goosen, M.; Al-Belushi, R.; Wilf, M., Concentration polarization in ultrafiltration and reverse osmosis: a critical review. Desalination 2001, 141 (3), 269-289. 51. Water Treatment Principles and Design. 2 ed.; John Wiley and Sons: Hoboken, 2005. 52. Kim, S.; Hoek, E. M., Modeling concentration polarization in reverse osmosis processes. Desalination 2005, 186 (1-3), 111-128. 53. Tan, C. H.; Ng, H. Y., Modified models to predict flux behavior in forward osmosis in consideration of external and internal concentration polarizations. J. Membr. Sci. 2008, 324 (1), 209-219. 54. Wilson, A. D.; Stewart, F. F., Deriving osmotic pressures of draw solutes used in osmotically driven membrane processes. J. Membr. Sci. 2013, 431, 205-211. 55. Lime and Soda Ash Softening. 56. Feng, D.; Aldrich, C.; Tan, H., Treatment of acid mine water by use of heavy metal precipitation and ion exchange. Miner. Eng. 2000, 13 (6), 623-642. 57. Den, W.; Wang, C.-J., Removal of silica from brackish water by electrocoagulation pretreatment to prevent fouling of reverse osmosis membranes. Sep. Purif. Technol. 2008, 59 (3), 318-325. 58. Sheikholeslami, R.; Bright, J., Silica and metals removal by pretreatment to prevent fouling of reverse osmosis membranes. Desalination 2002, 143 (3), 255-267. 59. Talbot, D., Megascale Desalination. TECHNOLOGY REVIEW 2015, 118 (2), 48-49. 60. Karagiannis, I. C.; Soldatos, P. G., Water desalination cost literature: review and assessment. Desalination 2008, 223 (1-3), 448-456. 61. Duraisamy, R. T.; Beni, A. H.; Henni, A., State of the art treatment of produced water. INTECH Open Access Publisher: 2013. 62. Herzberg, M.; Elimelech, M., Biofouling of reverse osmosis membranes: role of biofilm-enhanced osmotic pressure. J. Membr. Sci. 2007, 295 (1), 11-20.
Page 22 of 25Environmental Science: Water Research & Technology

63. Vrouwenvelder, J.; Von Der Schulenburg, D. G.; Kruithof, J.; Johns, M.; Van Loosdrecht, M., Biofouling of spiral-wound nanofiltration and reverse osmosis membranes: a feed spacer problem. Water Res. 2009, 43 (3), 583-594. 64. Cheftel, J. C., Review: High-pressure, microbial inactivation and food preservation. Revista de Agaroquimica y Tecnologia de Alimentos 1995, 1 (2-3), 75-90. 65. ZoBell, C. E.; Johnson, F. H., The influence of hydrostatic pressure on the growth and viability of terrestrial and marine bacteria. J. Bacteriol. 1949, 57 (2), 179. 66. Mitchell, A. C.; Phillips, A. J.; Hiebert, R.; Gerlach, R.; Spangler, L. H.; Cunningham, A. B., Biofilm enhanced geologic sequestration of supercritical CO 2. International Journal of Greenhouse Gas Control 2009, 3 (1), 90-99. 67. Kappachery, S.; Paul, D.; Yoon, J.; Kweon, J. H., Vanillin, a potential agent to prevent biofouling of reverse osmosis membrane. Biofouling 2010, 26 (6), 667-672. 68. Yang, H.-L.; Chun-Te Lin, J.; Huang, C., Application of nanosilver surface modification to RO membrane and spacer for mitigating biofouling in seawater desalination. Water Res. 2009, 43 (15), 3777-3786. 69. Bradford, W. L.; Herrington, R. E.; Clement, A. D., Filtration membrane and method of making same. Google Patents: 2007. 70. Günther, R.; Perschall, B.; Reese, D.; Hapke, J., Engineering for high pressure reverse osmosis. J. Membr. Sci. 1996, 121 (1), 95-107. 71. ROTREAT Radial Channel Disc Tube Module Sizes. http://rcdt-module.com/ (accessed January 19 2017). 72. Technology, R. S. M. Disc Tube RO Membrane Module for Landfill Leachate. http://www.risingsunmembranes.com/wastewater-treatment-membranes/disc-tube-ro-nf-membrane/disc-tube-ro-dtro-membrane-module-for.html (accessed January 19 2017). 73. Grosse, D.; LaMonica, D. Site Technology Capsule: Rochem Separation Systems, INC., Disc Tube Module Technology; Cincinatti, Ohio, 1998. 74. Bartels, C.; Hirose, M.; Fujioka, H., Performance advancement in the spiral wound RO/NF element design. Desalination 2008, 221 (1-3), 207-214. 75. Buecker, B., Reverse Osmosis Pre-Treatment: Techniques and Technology. Engineering 360 2016. 76. Peterson, R.; Greenberg, A.; Bond, L.; Krantz, W., Use of ultrasonic TDR for real-time noninvasive measurement of compressive strain during membrane compaction. Desalination 1998, 116 (2-3), 115-122. 77. Ochoa, N.; Masuelli, M.; Marchese, J., Effect of hydrophilicity on fouling of an emulsified oil wastewater with PVDF/PMMA membranes. J. Membr. Sci. 2003, 226 (1), 203-211. 78. Persson, K. M.; Gekas, V.; Trägårdh, G., Study of membrane compaction and its influence on ultrafiltration water permeability. J. Membr. Sci. 1995, 100 (2), 155-162. 79. Pendergast, M. T. M.; Nygaard, J. M.; Ghosh, A. K.; Hoek, E. M., Using nanocomposite materials technology to understand and control reverse osmosis membrane compaction. Desalination 2010, 261 (3), 255-263. 80. Hussain, Y. A.; Al-Saleh, M. H., A viscoelastic-based model for TFC membranes flux reduction during compaction. Desalination 2014, 344, 362-370. 81. Pendergast, M. M.; Ghosh, A. K.; Hoek, E., Separation performance and interfacial properties of nanocomposite reverse osmosis membranes. Desalination 2013, 308, 180-185. 82. Baum, B.; Margosiak, S.; Holley Jr, W., Reverse osmosis membranes with improved compaction resistance. Industrial & Engineering Chemistry Product Research and Development 1972, 11 (2), 195-199. 83. Germain, Y., Burst pressure prediction of polyamide pipes. Polymer Engineering & Science 1998, 38 (4), 657-661.
Page 23 of 25 Environmental Science: Water Research & Technology

84. Lee, J.-H.; Chung, J. Y.; Chan, E. P.; Stafford, C. M., Correlating chlorine-induced changes in mechanical properties to performance in polyamide-based thin film composite membranes. J. Membr. Sci. 2013, 433, 72-79. 85. Maskan, F.; Wiley, D. E.; Johnston, L. P.; Clements, D. J., Optimal design of reverse osmosis module networks. AlChE J. 2000, 46 (5), 946-954. 86. Program, N. D. S. Options for the Productive Use of Salinity. http://s3.amazonaws.com/zanran_storage/australian-aquacultureportal.com/ContentPages/48337214.pdf. 87. Khursheed, A. F.; Mansfield, C. A.; Depro, B. M.; Perry, V. A., The Chlorine Industry: A Profile. 2000. 88. Liu, C.; Hsu, P.-C.; Xie, J.; Zhao, J.; Wu, T.; Wang, H.; Liu, W.; Zhang, J.; Chu, S.; Cui, Y., A half-wave rectified alternating current electrochemical method for uranium extraction from seawater. Nature Energy 2017, 2, 17007.
Page 24 of 25Environmental Science: Water Research & Technology