Embed Size (px)
Citation preview
1
Prospects for Global Trade
Prepared by the IMF and World Bank1
May 2015
After recovery from the global financial crisis, international trade growth has been sluggish. This
note looks at the salient characteristics of the global trade slowdown, examining its cyclical and
structural determinants. Current projections indicate that world trade may continue to be sluggish in
the medium term. However, trade growth could be revived if G20 countries cooperate to implement
deeper and wider trade reforms.
A. Introduction: The global trade slowdown
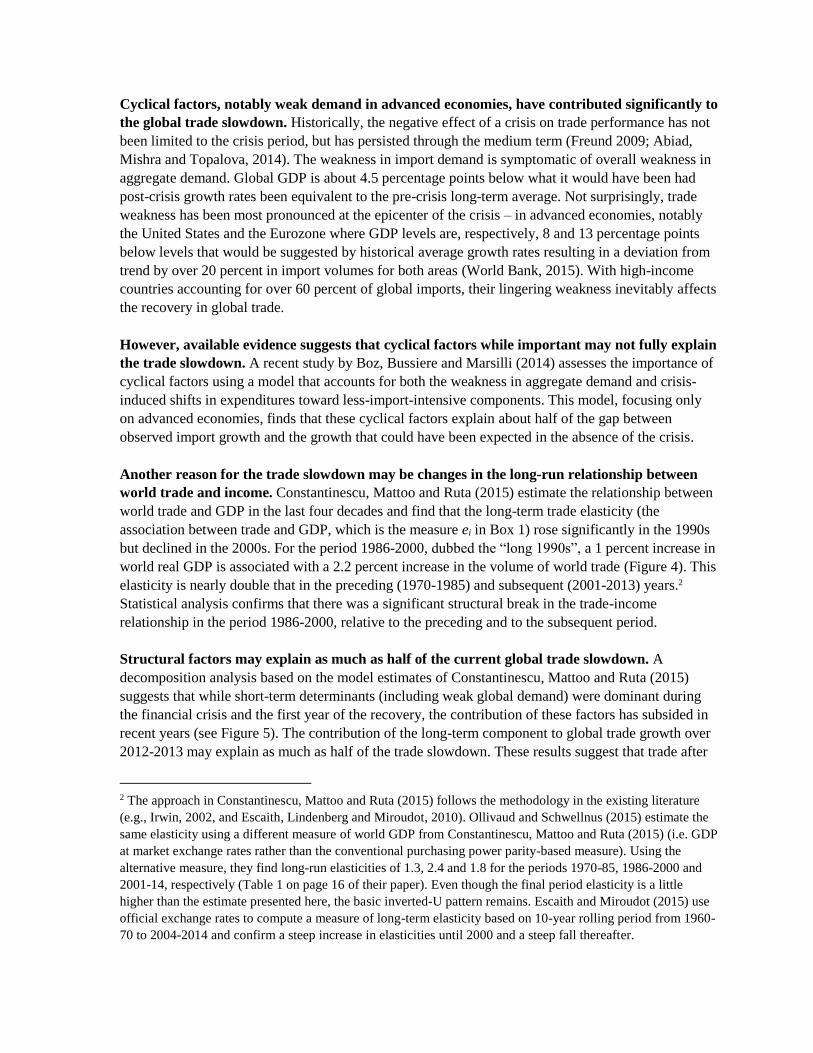
After the recovery from the global financial crisis, trade growth has so far been sluggish. The
rate of growth of world trade (total trade volumes) slowed to 2.8 percent in 2012 and 3.4 percent in
2013 from 6.8 percent in 2011. These growth rates of world trade are well below the pre-crisis
average of 7 percent (1987-2007) and are slightly below the growth rate of world GDP in real terms,
which has hovered around 3 percent in recent years (Figure 1).
Latest estimates and preliminary data indicate that the global trade slowdown persisted in
2014. Latest WEO estimates for 2014 confirm this trend, with world output growth at 3.3 percent and
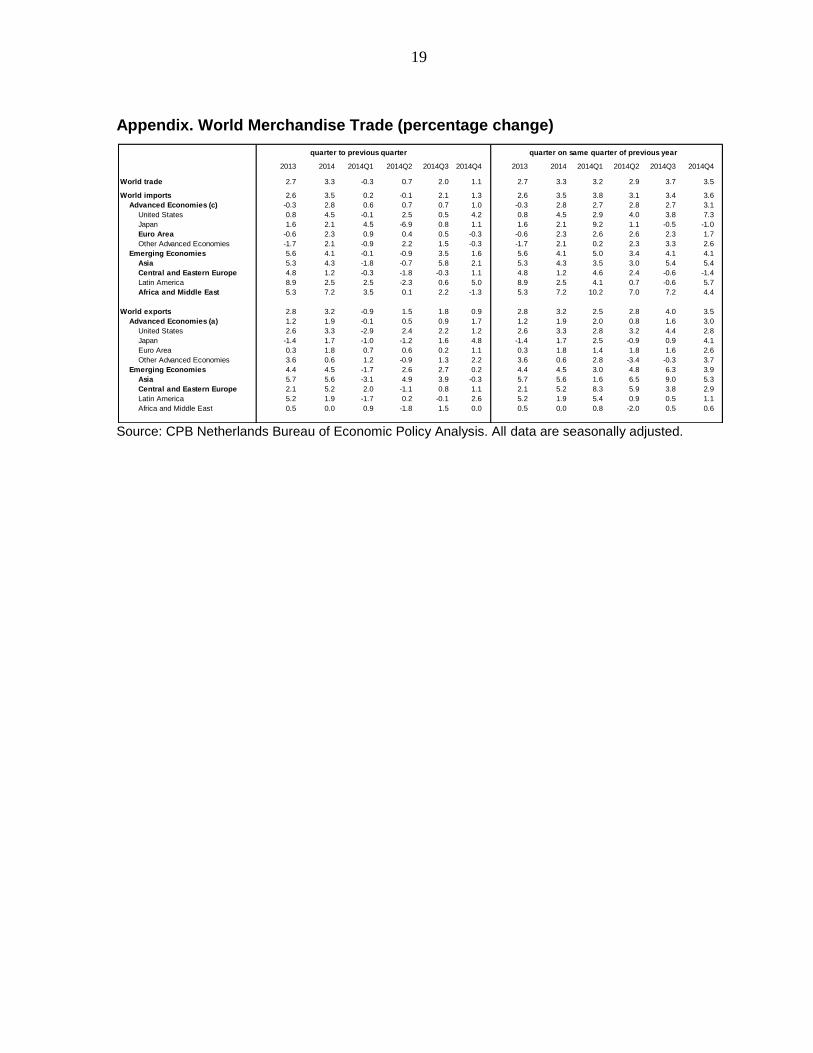
trade volumes growing at 3.1 percent. That trade growth in 2014 remains subdued is also
corroborated by preliminary data for merchandise trade, compiled monthly by CPB Netherlands
Bureau of Economic Policy Analysis. Based on this source, the growth rate of world merchandise
trade was 3.3 percent in 2014 (Appendix); WTO estimates for 2014 are even lower, at 2.8 percent in
volume and about 1 percent in value.
Trade growth in recent years has been weak in advanced economies, particularly in the Euro
Area, and moderate in emerging markets and developing economies. Imports in the Euro Area
declined by 1.4 percent in 2012 and increased by 0.9 percent in 2013, with improvements towards the
later quarters of 2013 (Figure 2). Imports of emerging economies increased by 5.5 percent in 2013,
with higher growth concentrated in Asia and Africa. Export growth varied more across regions, but
follows the pattern of stronger growth in emerging and developing economies relative to advanced
economies (Figure 3). As for 2014, both WEO estimates and CPB preliminary data indicate a slight
pick-up in advanced economies and continued moderation in emerging markets and developing
economies.
B. The causes of the global trade slowdown
1. Cyclical versus structural determinants
1 This paper has benefited from comments and inputs from staff of the OECD and the WTO. Special thanks are
due to the WTO for providing, and verifying accuracy of, data.
Cyclical factors, notably weak demand in advanced economies, have contributed significantly to
the global trade slowdown. Historically, the negative effect of a crisis on trade performance has not
been limited to the crisis period, but has persisted through the medium term (Freund 2009; Abiad,
Mishra and Topalova, 2014). The weakness in import demand is symptomatic of overall weakness in
aggregate demand. Global GDP is about 4.5 percentage points below what it would have been had
post-crisis growth rates been equivalent to the pre-crisis long-term average. Not surprisingly, trade
weakness has been most pronounced at the epicenter of the crisis – in advanced economies, notably
the United States and the Eurozone where GDP levels are, respectively, 8 and 13 percentage points
below levels that would be suggested by historical average growth rates resulting in a deviation from
trend by over 20 percent in import volumes for both areas (World Bank, 2015). With high-income
countries accounting for over 60 percent of global imports, their lingering weakness inevitably affects
the recovery in global trade.
However, available evidence suggests that cyclical factors while important may not fully explain
the trade slowdown. A recent study by Boz, Bussiere and Marsilli (2014) assesses the importance of
cyclical factors using a model that accounts for both the weakness in aggregate demand and crisis-
induced shifts in expenditures toward less-import-intensive components. This model, focusing only
on advanced economies, finds that these cyclical factors explain about half of the gap between
observed import growth and the growth that could have been expected in the absence of the crisis.
Another reason for the trade slowdown may be changes in the long-run relationship between
world trade and income. Constantinescu, Mattoo and Ruta (2015) estimate the relationship between
world trade and GDP in the last four decades and find that the long-term trade elasticity (the
association between trade and GDP, which is the measure ei in Box 1) rose significantly in the 1990s
but declined in the 2000s. For the period 1986-2000, dubbed the “long 1990s”, a 1 percent increase in
world real GDP is associated with a 2.2 percent increase in the volume of world trade (Figure 4). This
elasticity is nearly double that in the preceding (1970-1985) and subsequent (2001-2013) years.2
Statistical analysis confirms that there was a significant structural break in the trade-income
relationship in the period 1986-2000, relative to the preceding and to the subsequent period.
Structural factors may explain as much as half of the current global trade slowdown. A
decomposition analysis based on the model estimates of Constantinescu, Mattoo and Ruta (2015)
suggests that while short-term determinants (including weak global demand) were dominant during
the financial crisis and the first year of the recovery, the contribution of these factors has subsided in
recent years (see Figure 5). The contribution of the long-term component to global trade growth over
2012-2013 may explain as much as half of the trade slowdown. These results suggest that trade after
2 The approach in Constantinescu, Mattoo and Ruta (2015) follows the methodology in the existing literature
(e.g., Irwin, 2002, and Escaith, Lindenberg and Miroudot, 2010). Ollivaud and Schwellnus (2015) estimate the
same elasticity using a different measure of world GDP from Constantinescu, Mattoo and Ruta (2015) (i.e. GDP
at market exchange rates rather than the conventional purchasing power parity-based measure). Using the
alternative measure, they find long-run elasticities of 1.3, 2.4 and 1.8 for the periods 1970-85, 1986-2000 and
2001-14, respectively (Table 1 on page 16 of their paper). Even though the final period elasticity is a little
higher than the estimate presented here, the basic inverted-U pattern remains. Escaith and Miroudot (2015) use
official exchange rates to compute a measure of long-term elasticity based on 10-year rolling period from 1960-
70 to 2004-2014 and confirm a steep increase in elasticities until 2000 and a steep fall thereafter.
the financial crisis is growing more slowly not only because global GDP growth is lower, but also
because trade itself has become less responsive to GDP.
2. The possible structural determinants of the global trade slowdown
Several factors may have contributed to the global trade slowdown, such as the changing degree
of economic convergence and the slowing pace of trade liberalization. The relationship between
trade and income changes over time; a number of factors sometimes bring them closer together and
sometimes push them farther apart. There are several possible explanations for the lower association
of trade to GDP:
Changes in the pace of income convergence across countries and the associate impact on
trade patterns and growth. Escaith and Miroudot (2015) argue that the long-term evolution of
world trade-income elasticity observed in the past 25 years can be partially explained by the
relative evolution of advanced and emerging and developing economies. In particular, the
faster income convergence observed after 2000 may explain the rapid expansion of world
trade, and the slowdown of this convergence after the 2008-2009 crisis is likely to have
deprived world trade of this structural driver. These insights are relevant to the post-crisis
slowdown but do not explain the observed lower elasticities after 2000.
Changes in the composition of world income, such as the relative importance of investment
and consumption. The changing composition of GDP can explain the lower trade growth after
the financial crisis, particularly due to the decline in investment which is the more trade-
intensive component of GDP (Boz et al. 2014), but not its historical decline since the early
2000s as the investment share in GDP surged before the crisis.
Changes in the composition of world trade. Changes in the composition of trade in terms of
the relative importance of goods and services cannot fully explain the lower trade elasticity in
the 2000s, because their measured share has been remarkably stable in recent years. Changes
in composition along other dimensions, such as between durable and non-durable goods, may
have contributed to the slowdown of trade, as discussed in Section C below.
Changes in the trade regime, including the rise of protectionism. Traditional protectionism
seems to have increased only modestly, though we have more limited data on the extent of
recourse to relatively opaque non-tariff measures. The available information suggests that
new measures are a combination of trade restrictions and trade promotion whose ultimate
effect on trade growth is ambiguous (Evenett, 2014). However, the slower pace of trade
liberalization in the 2000s relative to previous period could plausibly have contributed to the
lower trade elasticity, as discussed in Section F below.
Changes in the structure of trade associated with the expansion or contraction of global
supply chains. There is evidence that these changes are playing a role in the trade slowdown,
as we now elaborate.
The slower pace of expansion of Global Value Chains (GVCs) may be a cause of the trade
slowdown. There is evidence to suggest that changes in international vertical specialization underlie
the slowdown in world trade. The long-run trade elasticity increased during the long 1990s as
production fragmented internationally into GVCs, leading to a rapid surge in parts and components,
and decreased in the 2000s as this process matured. Figure 6 illustrates this by comparing the
elasticity of world trade in value added, i.e. exports net of imported inputs, with trade measured in
conventional gross terms. Intuitively, if the slower pace of GVCs’ expansion is a contributing factor
of the trade slowdown, one would expect the gap between the gross and value added trade elasticities
to close over time, with the first converging to the value of the latter. Figure 6 shows broadly this
pattern, with the elasticity of gross trade to GDP decreasing over time and approaching the lower and
more stable estimates of the trade elasticity in value added terms.
Box 1. The Trade Elasticity
The “elasticity” measure is widely used in this note. Economists use the elasticity as a measure of how
responsive an economic variable is to a change in another. Thus, income elasticity of demand measures
the responsiveness of the demand for a good to a change in the income of the people demanding the
good. The elasticity is quantified as the ratio of the percentage change in one variable (say, demand for a
good) to the percentage change in another variable (say, income).
Usually implicit in the use of elasticity is the notion that one variable (say, income) has a causal
influence on the other (say, demand for a good). Given the complex interactions between variables
considered in this note, the implied causality requires strong assumptions and should be viewed with
caution.
The elasticity of imports with respect to own GDP (ei) measures how imports of a country (or group of
countries) change when its (their) own GDP changes. The underlying idea is that the demand for
imported goods and services largely depends on the income of the country (or a group of countries) of
which GDP is a good measure. We compute this measure at both the global level and the national level.
C. Sectoral characteristics of the global trade slowdown
The slowdown in global trade is concentrated in the manufacturing sector. Figure 7a shows the
rapid growth in world trade in volume terms in the long 1990s and that the subsequent slowdown in
the 2000s was driven by goods rather than services. Figures 7b and 7c reveal that within goods, the
significant deceleration of trade growth was concentrated in the manufacturing sector. This slowdown
in manufacturing trade had both cyclical and structural determinants. The weakness in demand in
recent years has particularly affected import demand for durable manufactured goods. A breakdown
of the different components of world trade elasticity to world GDP suggests that structural factors
have also played a role. At the world level, the long-run elasticity of manufacturing trade to GDP was
2.6 in the 1990s and fell to 0.8 in the 2000s (Table 1). The services trade elasticity and the commodity
trade elasticity actually increased in the more recent period, possibly because of the increasing
tradability of services and the growing demand for commodities in emerging markets. This pattern
confirms that developments within the manufacturing sector are key to understanding the global trade
slowdown.
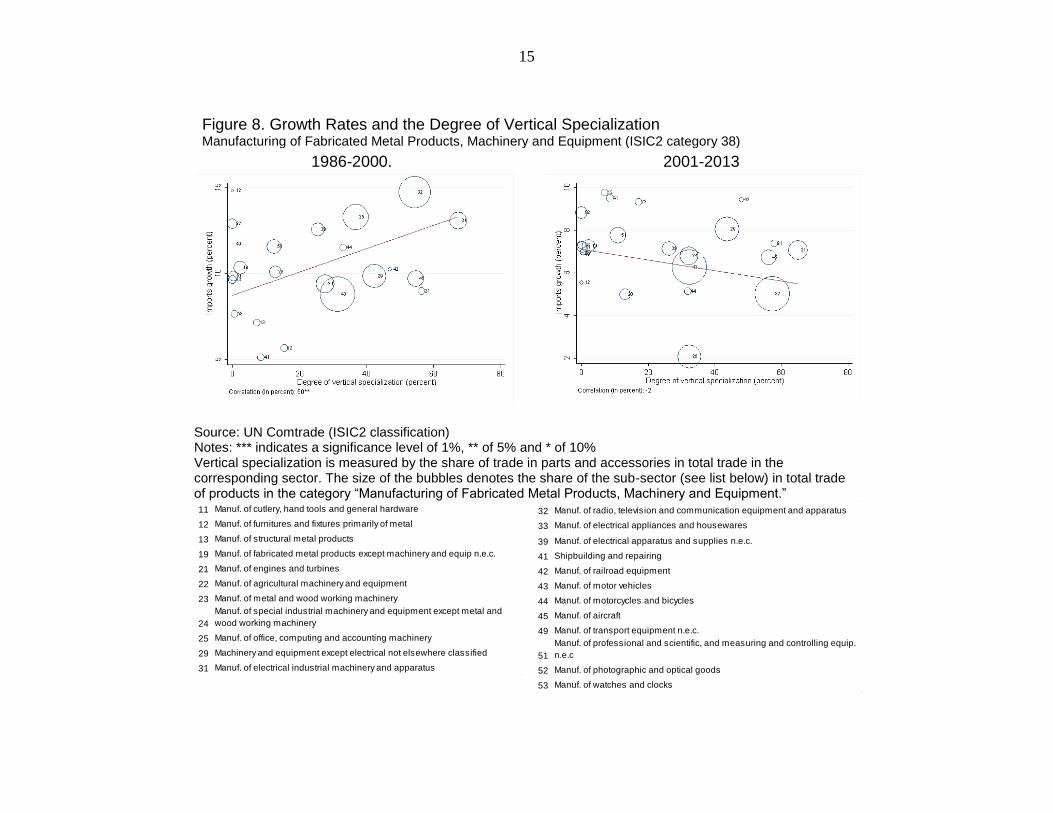
Manufacturing sub-sectors witnessing the largest declines in growth are those with greater
vertical specialization. Consistent with the evidence produced in Section B, a disaggregated analysis
of the manufacturing sector indicates that the lower pace of trade growth is likely to have been driven
by changes in GVCs. Figure 8 shows the relationship between the average growth rates of world trade
of industrial manufacturing sub-sectors and their degree of international vertical specialization
(measured by the share of parts and components in total trade of the sub-sector). In the 1990s, there is
a strongly positive relationship between the two, with trade in the most vertically specialized sub-
sectors seeing much faster rates of growth than sub-sectors where GVCs are less developed. Then in
the 2000s, while trade growth fell across the board, the largest declines were in precisely the sub-
sectors with higher degrees of vertical specialization, such as the manufacture of radio, televisions
and communication equipment (-10 percent) and manufacture of electrical industrial machinery (-6
percent). Smaller drops in world trade growth were recorded in sub-sectors where GVCs are less
developed, such as manufacture of watches and clocks (-0.7 percent).
D. Projections of global trade
In coming years, world trade is projected to grow but not at pre-crisis levels. As the global
economy continues to recover, global trade growth can be expected to pick up. However, given the
still weak recovery projected, the contribution of demand to the pick-up in global trade is not likely to
be substantial over the short- to medium-term. Moreover, structural factors may also influence trade
performance. Table 2 and Figure 9 present two separate scenarios for world trade using estimates of
world trade elasticities from a regression analysis for the periods 2000-2013 and 2008-2013,
respectively. In the first scenario, world trade will grow in the medium term at an average of less than
5 percent per year. The latter set of projections portrays a picture with world trade growing at only
about 2 percent on average per year. Formal tests indicate that there is a structural break in the pre-
and post-crisis trade-income relationship, lending support to the view that there was a further decline
in trade elasticities. However, the estimates for 2008-2013 are based on a period that may be too short
to rule out cyclical factors (albeit a long cycle) and to properly capture changes in the long-term
association between trade and income.
E. Consequences of the global trade slowdown
Since G20 economies are more open today than they were in the 1990s, trade can be expected to
continue to contribute to countries’ growth. Figure 10 shows that the ratio of imports of goods and
services to GDP, a measure of openness to trade, increased from less than 20 percent in the early
1990s to over 30 percent right before the crisis for advanced countries as well as emerging and
developing economies. In spite of a dip during the crisis, the ratio has returned to the pre-crisis level
in recent years. Thus, the level of openness is as high as it has ever been. In so far as openness per se
is associated with dynamic benefits, trade will continue to foster growth.
Nevertheless, more analysis is needed to understand the implications for growth of the
structural shifts identified in this paper. There are two main channels through which slower trade
growth may translate into slower GDP growth that merit further investigation. On the demand side,
sluggish world imports may limit opportunities for individual countries’ exports. However, as shown
in Figure 6, the elasticity of world value-added exports to world GDP has been more stable over time
than the elasticity of world trade measured in gross terms. While this finding is consistent with the
presumption that changes in global value chains (i.e. in measured rather than value-added trade)
contribute to explain the global trade slowdown, it does suggest that the contribution of world trade to
generating world income has remained fairly constant. On the supply side, slower trade diminishes in
principle the scope for productivity growth through increasing international specialization and
diffusion of technologies. In particular, a slower pace of GVC expansion may imply diminishing
scope for productivity growth through a more efficient international division of labor and knowledge
spillovers. A body of microeconometric literature links increases in productivity growth at the firm
level to various aspects of GVC participation, such as imports of parts and components (e.g., Amiti
and Konings, 2007; Goldberg et al., 2010) and knowledge spillovers through the production chain
(e.g., Atkin et al., 2014). In general, since a finer international division of labor is isomorphic to
factor-augmenting technical change (Grossman and Rossi-Hansberg, 2008), a slower pace of its
expansion could indicate that world trade is contributing less to global growth today than it did in the
long 1990s. However, three considerations suggest that a pessimistic conclusion may not be
warranted. First, as noted above, even though the trade to GDP ratio has stopped increasing, it is
historically at its highest level. As long as some countries remain far from the global technology
frontier, the high level of openness may continue to deliver benefits in terms of diffusion of
knowledge and hence productivity even when the level of openness is not increasing. Second, since
the drivers of changed patterns of international production are firms’ market-based optimizing
decisions, there is less reason to fear negative productivity consequences than if the driver were new
trade policy restrictions. Finally, continued fragmentation and specialization within countries,
spurred in some cases by increased foreign direct investment, may also sustain productivity growth
even as international fragmentation plateaus. This issue merits further investigation.
F. Trade as a key pillar of the global policy agenda
Part of the explanation for the slowdown in global trade may be that the benefits of past
reforms have matured and new reforms have languished. In the 1990s and early 2000s, reforms in
anticipation of and resulting from WTO membership allowed countries, most notably China, to
rapidly integrate into the global trading system even as supply chains were built in Asia, Europe and
North America. Applied tariffs fell from averages of nearly 30 percent to less than 15 percent in
emerging and developing countries and from 10 percent to less than 5 percent in industrial countries
(Figure 11). The liberalization led to a significant increase in the ratio of imports to GDP in all
countries, with the ratio significantly higher for developing countries through most of the 1990s and
early 2000s (Figure 10). The process of unilateral liberalization slowed down after this period and
multilateral negotiations have stalled. While some major regional trade initiatives are today in the
pipeline, few have so far had the transformative effect of, say, the North American Free Trade
Agreement in 1994 or the reforms in Eastern European countries in preparation for their accession to
the European Union.
While the engine of the long 1990s may have less energy for now, the scope for trade integration
is still strong. Reforms aimed at reducing trade costs could lead to efficiency gains by improving
access to markets and expanding GVCs, particularly to regions and countries that have missed out on
these opportunities in the past.
For most advanced countries, a key challenge will be to push the new trade policy frontiers,
opening services markets and making their regulatory systems more coherent.
Many emerging market economies, for example in South Asia and Latin America, can still
benefit greatly from integrating via traditional liberalization in goods and services and
improving their business environment to facilitate the participation of their firms in GVCs.
For developing countries, trade liberalization needs to be complemented by trade facilitation.
It is important that the Bali Trade Facilitation Agreement be swiftly implemented with
assistance where needed. Upgrading poor trade infrastructures and improving economic
institutions are also crucial.
An example of a concrete reform that G20 countries could collectively implement is the
further liberalization of trade in transport services, which are a key component of
international trade costs and where countries need to coordinate market-opening in order to
maximize global benefits, especially for poor and remote countries.
Reigniting global trade integration would require an open architecture that allows different
speeds and depths, but also ensures coherence among preferential and multilateral efforts. The
finalization of the WTO’s Bali agreement is welcome, but earlier impasses as well as the
longstanding difficulties to advance the Doha Agenda have emphasized the need to buttress the
governance of the multilateral trading system. With the fulcrum of trade policy moving to regional
and plurilateral deals, there are new opportunities and new challenges.
New liberalization arrangements should ultimately avoid fragmenting the global trading
system. Trade liberalization efforts are currently taking place mainly via preferential (e.g.,
Trans-Pacific Partnership (TPP) and Transatlantic Trade and Investment Partnership (TTIP))
and plurilateral negotiations (e.g., Trade in Services Agreement (TISA) and Information
Technology Agreement (ITA)), which can help advance liberalization in new trade areas. To
avoid fragmenting the trading system, these efforts need to be pursued openly and
transparently, adopt liberal rules of origin, and be amenable to eventual multilateralization.
Ideally, membership of these agreements would be open to all countries which are prepared
to implement comparable liberalization.
Advancing integration in vital new trade areas (e.g., on regulatory impediments to trade and
investment in goods and services) promises significant benefits but will require reforming the
global governance of trade. These initiatives could foster the integration of markets but also
intersect with legitimate national policies and regulatory concerns, making the process
different and more complex than past trade negotiations that mainly focused on lowering
tariffs. The multilateralization of these agreements poses challenges for the global
governance of the trading system which need to be addressed to achieve the goal of reviving
multilateral trade negotiations.
Heightened and coordinated vigilance will be needed to avoid both old and new forms of
protectionism and distortionary rules. The WTO has been effective in enhancing
transparency and limiting traditional protectionism through higher tariffs and other border
measures, but there is a risk that protectionism will increase through diverse non-tariff

measures such as undue regulatory barriers, for which large data gaps exist. There is also a
need for greater transparency of provisions in preferential trade agreements and an
assessment of the implications of these provisions for participating and excluded countries.
A way forward could be to ask relevant international organizations to collect and analyze
information on the implementation and effects of preferential disciplines.
This is an important juncture in the evolution of trade and trade policy. Creating greater reform
momentum for global trade integration could help the world avoid the adverse consequences of the
global trade slowdown.
References
Abiad, Abdul, Prachi Mishra and Petia Topalova, 2014, “How Does Trade Evolve in the Aftermath of
Financial Crises?” IMF Economic Review, 62.
Amiti, Mary and Jozef Konings, 2007, Trade Liberalization, Intermediate Inputs, and Productivity,
American Economic Review, 97:05, 1611-1638
Atkin, David, Amit Khandelwal and Adam Osman, 2014, “Exporting and Firm Performance:
Evidence from a Randomized Experiment,” mimeo, UCLA.
Boz, Emine, Mathieu Bussiere and Clement Marsilli, 2014, “Recent Slowdown in Global Trade:
Cyclical or Structural,” VoxEU.org.
Constantinescu, Cristina, Aaditya Mattoo and Michele Ruta, 2015, “The Global Trade Slowdown:
Cyclical or Structural?” IMF Working Paper No. 15/6.
Escaith, Hubert and Sébastien Miroudot, 2015, “World Trade and Income Remain Exposed to
Gravity”, OECD and WTO mimeo, forthcoming.
Escaith, Hubert, Nannette Lindenberg and Sébastien Miroudot, 2010, “International Supply Chains
and Trade Elasticity in Times of Global Crisis,” WTO Staff Working Paper ERSD-2010–08,
World Trade Organization, Geneva.
Evenett, Simon J., 2014, “The Global Trade Disorder,” The 16th GTA Report, CEPR, November.
Freund, Caroline, 2009, “The Trade Response to Global Downturns: Historical Evidence,” Policy
Research Working Paper Series 5015, World Bank, Washington, DC.
Goldberg, Pinelopi, Amit Khandelwal, Nina Pavcnik and Petia Topalova, 2010, “Imported
Intermediate Inputs and Domestic Product Growth: Evidence from India,” Quarterly Journal
of Economics, 125:4, 1727-67.
Gene M. Grossman and Esteban Rossi-Hansberg, 2008, “Trading Tasks: A Simple Theory of
Offshoring,” American Economic Review, 98:5, 1978-1997.
Irwin, Douglas, 2002, “Long-Run Trends in World Trade and Income,” World Trade Review 1 (1):
89–100.
Ollivaud, Patrice and Cyrille Schwellnus, 2015, “Does the Post-Crisis Weakness of Global Trade
Solely Reflect Weak Demand?” OECD Economics Department Working Papers,
forthcoming.
World Bank, 2015, “What Lies Behind the Global Trade Slowdown?” Chapter 4 in Global Economic
Prospects, World Bank, Washington, DC.
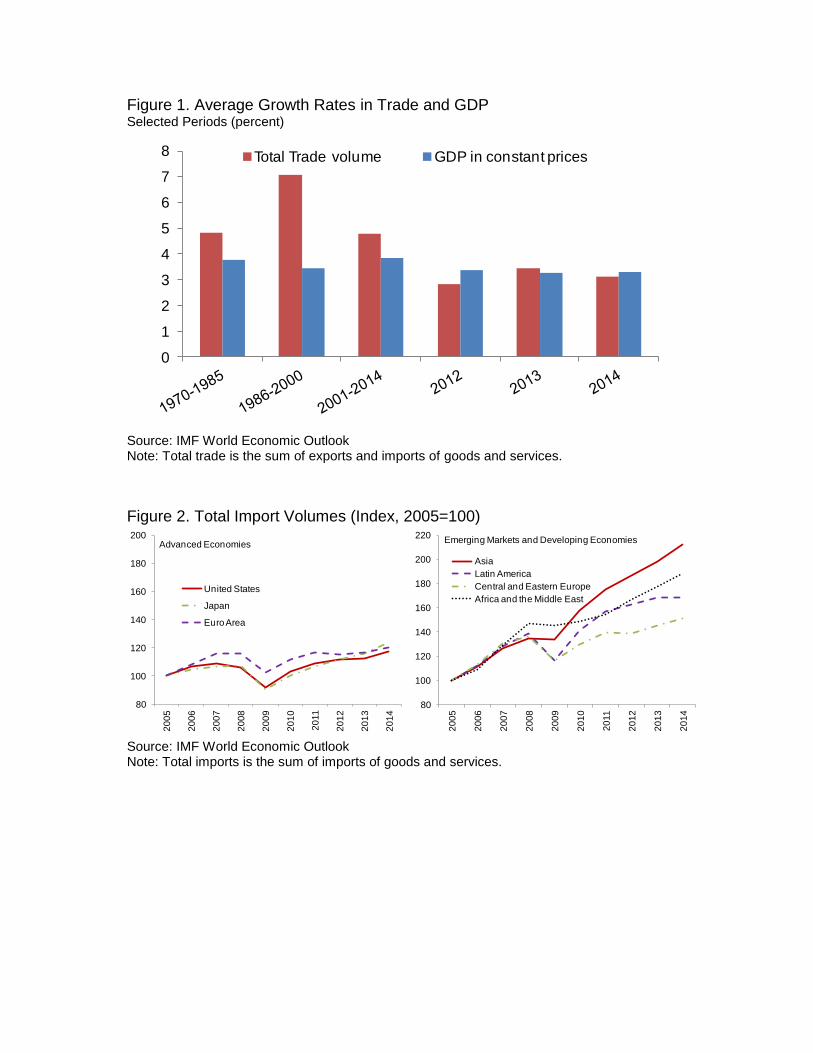
Figure 1. Average Growth Rates in Trade and GDP Selected Periods (percent)
Source: IMF World Economic Outlook Note: Total trade is the sum of exports and imports of goods and services.
Figure 2. Total Import Volumes (Index, 2005=100)
Source: IMF World Economic Outlook Note: Total imports is the sum of imports of goods and services.
0
1
2
3
4
5
6
7
8 Total Trade volume GDP in constant prices
80
100
120
140
160
180
200
20
05
20
06
20
07
20
08
20
09
20
10
20
11
20
12
20
13
20
14
United States
Japan
Euro Area
Advanced Economies
80
100
120
140
160
180
200
220
20
05
20
06
20
07
20
08
20
09
20
10
20
11
20
12
20
13
20
14
Asia
Latin America
Central and Eastern Europe
Africa and the Middle East
Emerging Markets and Developing Economies
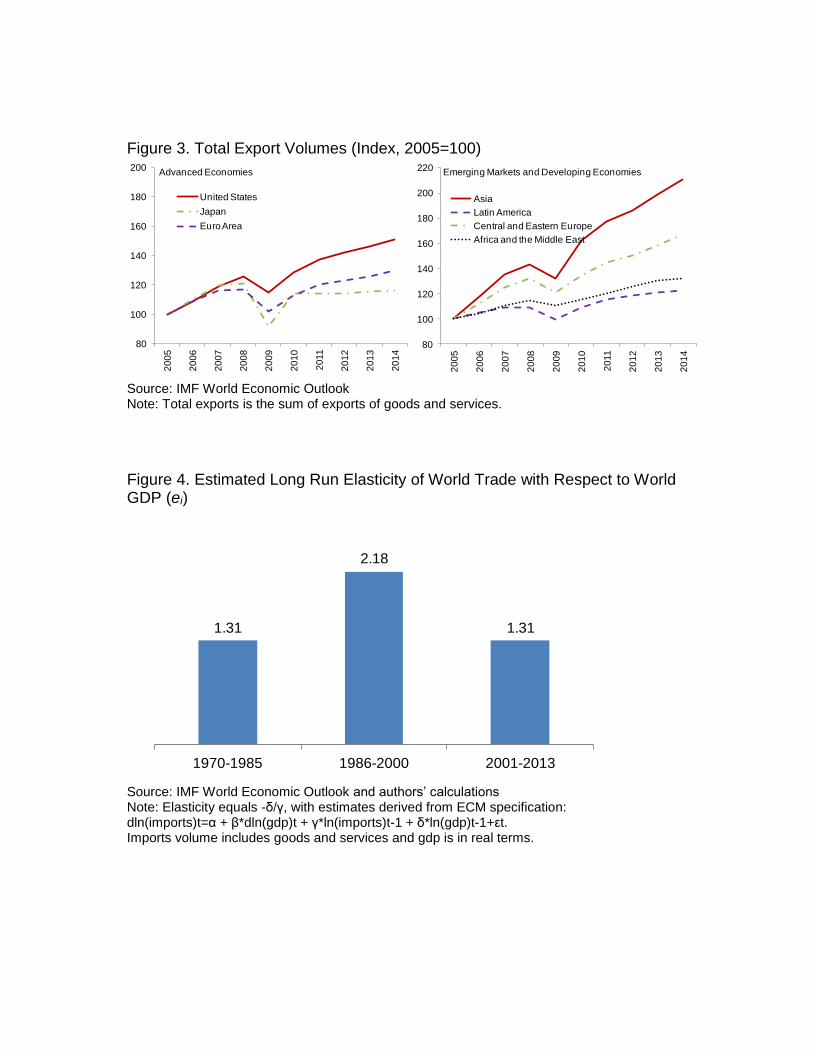
Figure 3. Total Export Volumes (Index, 2005=100)
Source: IMF World Economic Outlook Note: Total exports is the sum of exports of goods and services.
Figure 4. Estimated Long Run Elasticity of World Trade with Respect to World GDP (ei)
Source: IMF World Economic Outlook and authors’ calculations Note: Elasticity equals -δ/γ, with estimates derived from ECM specification: dln(imports)t=α + β*dln(gdp)t + γ*ln(imports)t-1 + δ*ln(gdp)t-1+εt. Imports volume includes goods and services and gdp is in real terms.
80
100
120
140
160
180
2002
00
5
20
06
20
07
20
08
20
09
20
10
20
11
20
12
20
13
20
14
United States
Japan
Euro Area
Advanced Economies
80
100
120
140
160
180
200
220
20
05
20
06
20
07
20
08
20
09
20
10
20
11
20
12
20
13
20
14
Asia
Latin America
Central and Eastern Europe
Africa and the Middle East
Emerging Markets and Developing Economies
1.31
2.18
1.31
1970-1985 1986-2000 2001-2013
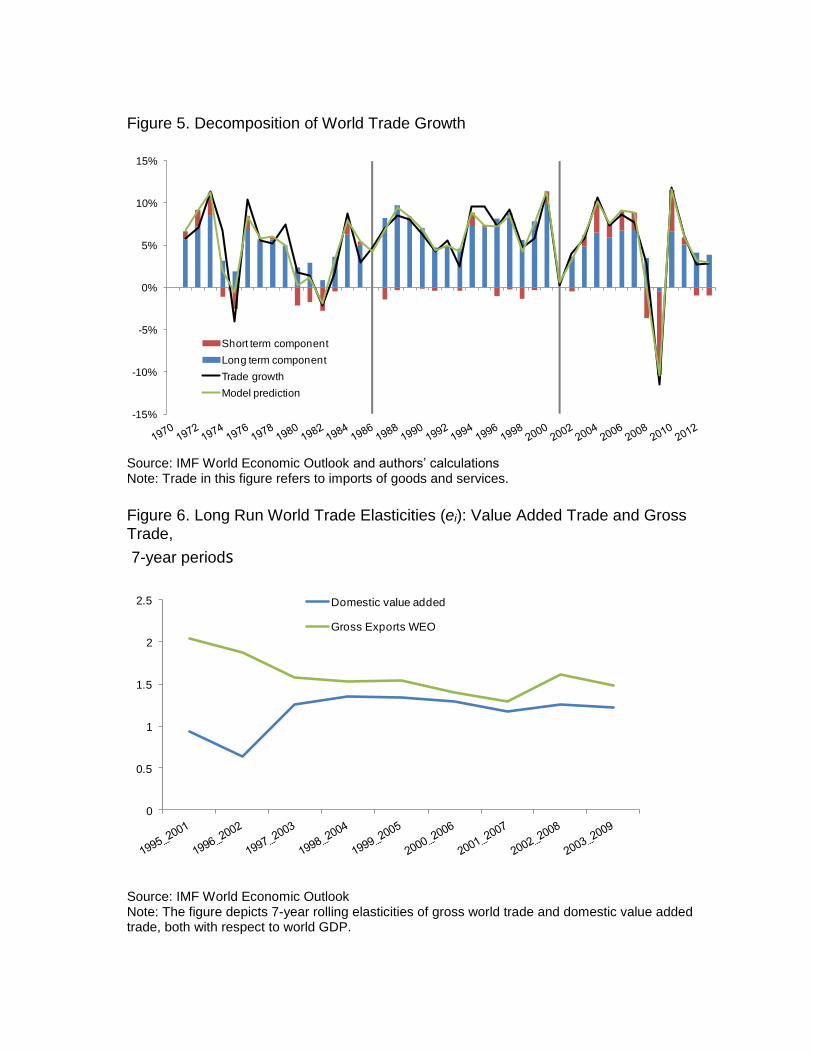
Figure 5. Decomposition of World Trade Growth
Source: IMF World Economic Outlook and authors’ calculations Note: Trade in this figure refers to imports of goods and services.
Figure 6. Long Run World Trade Elasticities (ei): Value Added Trade and Gross Trade,
7-year periods
Source: IMF World Economic Outlook Note: The figure depicts 7-year rolling elasticities of gross world trade and domestic value added trade, both with respect to world GDP.
-15%
-10%
-5%
0%
5%
10%
15%
Short term component
Long term component
Trade growth
Model prediction
0
0.5
1
1.5
2
2.5 Domestic value added
Gross Exports WEO
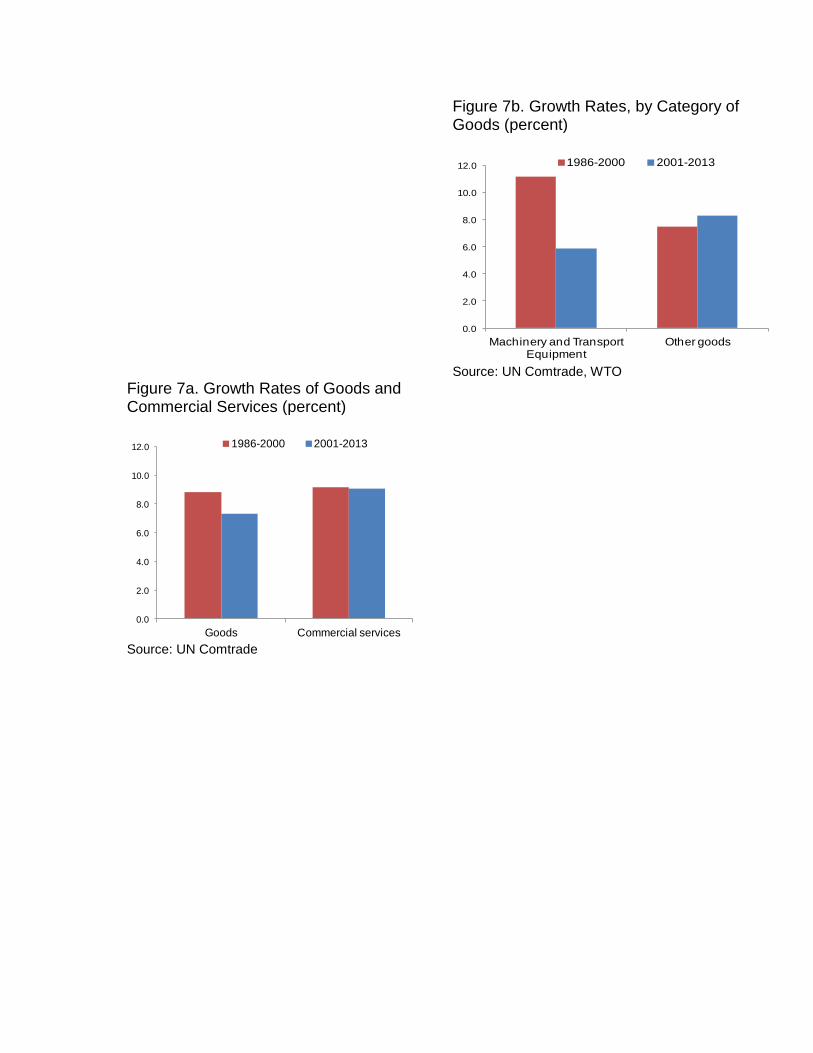
Figure 7a. Growth Rates of Goods and Commercial Services (percent)
Source: UN Comtrade
0.0
2.0
4.0
6.0
8.0
10.0
12.0
Goods Commercial services
1986-2000 2001-2013
Figure 7b. Growth Rates, by Category of Goods (percent)
Source: UN Comtrade, WTO
0.0
2.0
4.0
6.0
8.0
10.0
12.0
Machinery and Transport Equipment
Other goods
1986-2000 2001-2013
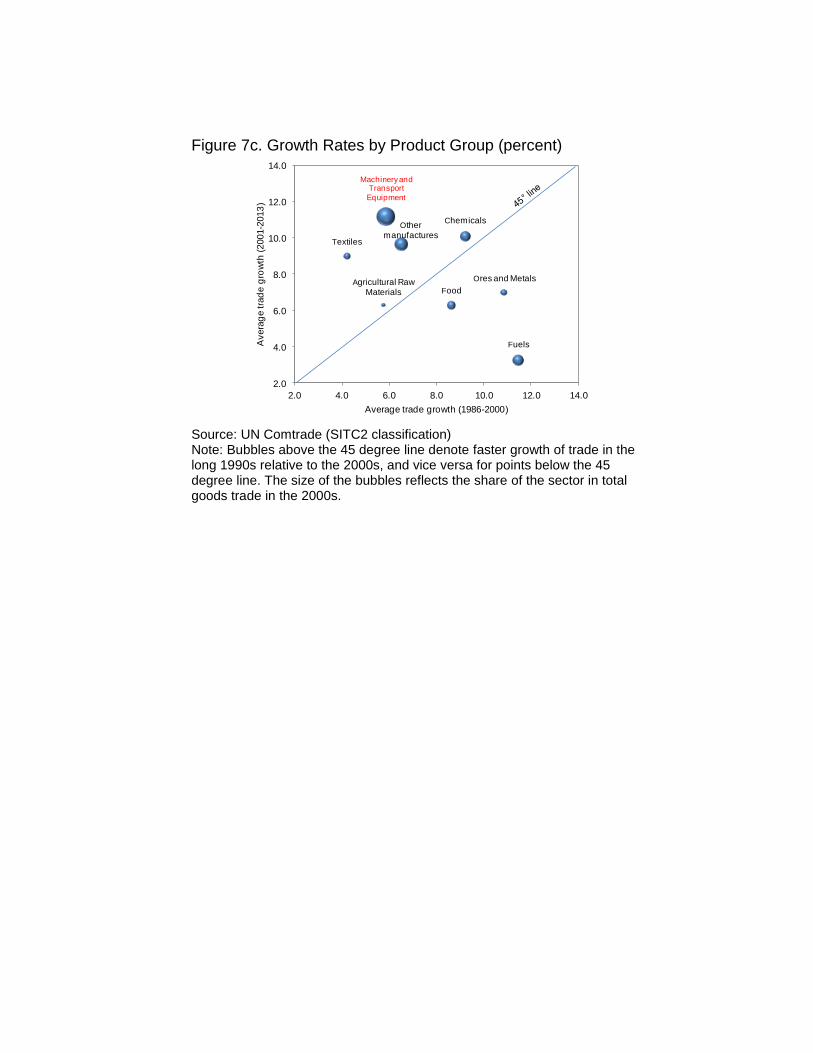
Figure 7c. Growth Rates by Product Group (percent)
Source: UN Comtrade (SITC2 classification) Note: Bubbles above the 45 degree line denote faster growth of trade in the long 1990s relative to the 2000s, and vice versa for points below the 45 degree line. The size of the bubbles reflects the share of the sector in total goods trade in the 2000s.
Agricultural Raw Materials
Chemicals
Food
Fuels
Machinery and Transport
Equipment
Ores and Metals
Other manufactures
Textiles
2.0
4.0
6.0
8.0
10.0
12.0
14.0
2.0 4.0 6.0 8.0 10.0 12.0 14.0
Avera
ge tra
de g
row
th (
2001-2
013
)
Average trade growth (1986-2000)
15
Figure 8. Growth Rates and the Degree of Vertical Specialization Manufacturing of Fabricated Metal Products, Machinery and Equipment (ISIC2 category 38)
1986-2000. 2001-2013
Source: UN Comtrade (ISIC2 classification) Notes: *** indicates a significance level of 1%, ** of 5% and * of 10% Vertical specialization is measured by the share of trade in parts and accessories in total trade in the corresponding sector. The size of the bubbles denotes the share of the sub-sector (see list below) in total trade of products in the category “Manufacturing of Fabricated Metal Products, Machinery and Equipment.”
11 Manuf. of cutlery, hand tools and general hardware
12 Manuf. of furnitures and fixtures primarily of metal
13 Manuf. of structural metal products
19 Manuf. of fabricated metal products except machinery and equip n.e.c.
21 Manuf. of engines and turbines
22 Manuf. of agricultural machinery and equipment
23 Manuf. of metal and wood working machinery
24
Manuf. of special industrial machinery and equipment except metal and
wood working machinery
25 Manuf. of office, computing and accounting machinery
29 Machinery and equipment except electrical not elsewhere classified
31 Manuf. of electrical industrial machinery and apparatus
32 Manuf. of radio, television and communication equipment and apparatus
33 Manuf. of electrical appliances and housewares
39 Manuf. of electrical apparatus and supplies n.e.c.
41 Shipbuilding and repairing
42 Manuf. of railroad equipment
43 Manuf. of motor vehicles
44 Manuf. of motorcycles and bicycles
45 Manuf. of aircraft
49 Manuf. of transport equipment n.e.c.
51
Manuf. of professional and scientific, and measuring and controlling equip.
n.e.c
52 Manuf. of photographic and optical goods
53 Manuf. of watches and clocks

16
Figure 9. Trade Predictions (Index, 2000=100)
Source: IMF WEO, IMF IFS and authors’ calculations Note: Trade figures are only for goods because the quarterly data used to make projections is only available for goods. Model projections beyond 2016 have not been made using 2008-2013 elsticities because the latter have been computed using quarterly data which is not available for IMF GDP projections beyond 2016.
50
100
150
200
2502000
2001
2002
2003
2004
2005
2006
2007
2008
2009
2010
2011
2012
2013
2014
2015
2016
Import Volume (merchandise)
Model projections (2000-2013 elasticities)
Model projections (2008-2013 elasticities)
Real GDP
WEO GDP projections
actual values Out-of-sampleforecasts
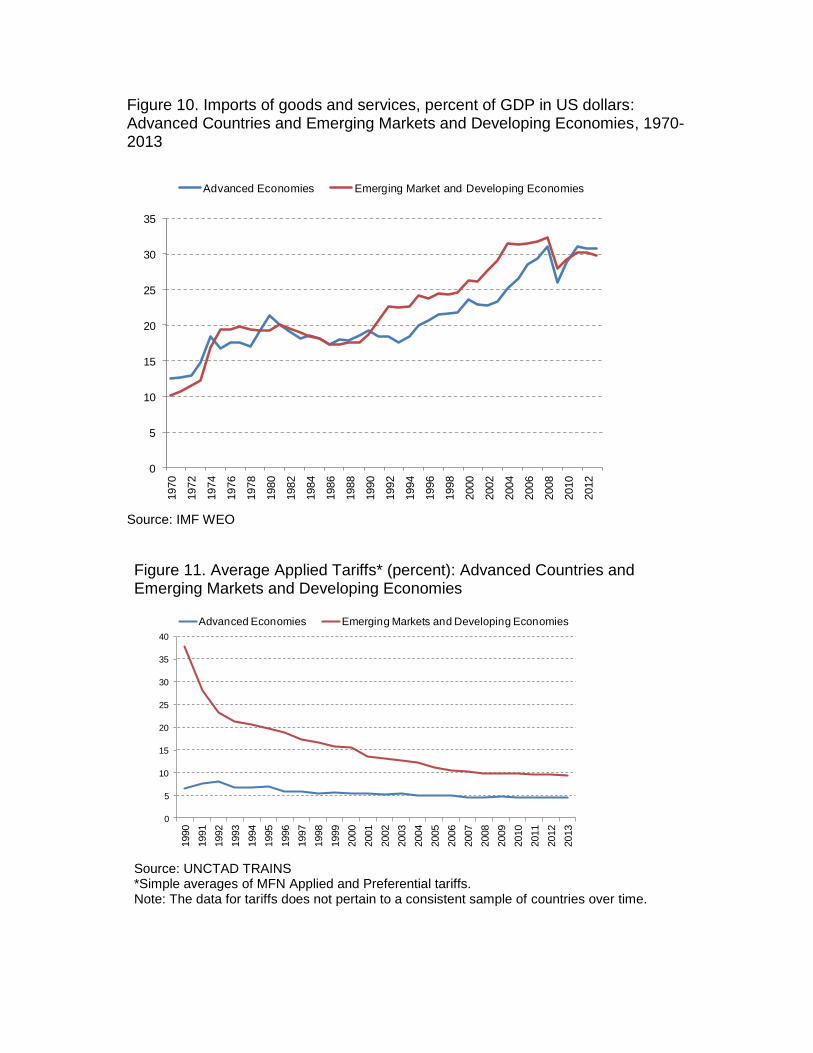
Figure 10. Imports of goods and services, percent of GDP in US dollars: Advanced Countries and Emerging Markets and Developing Economies, 1970-2013
Source: IMF WEO
Figure 11. Average Applied Tariffs* (percent): Advanced Countries and Emerging Markets and Developing Economies
Source: UNCTAD TRAINS *Simple averages of MFN Applied and Preferential tariffs. Note: The data for tariffs does not pertain to a consistent sample of countries over time.
0
5
10
15
20
25
30
35
1970
1972
1974
1976
1978
1980
1982
1984
1986
1988
1990
1992
1994
1996
1998
2000
2002
2004
2006
2008
2010
2012
Advanced Economies Emerging Market and Developing Economies
0
5
10
15
20
25
30
35
40
1990
1991
1992
1993
1994
1995
1996
1997
1998
1999
2000
2001
2002
2003
2004
2005
2006
2007
2008
2009
2010
2011
2012
2013
Advanced Economies Emerging Markets and Developing Economies
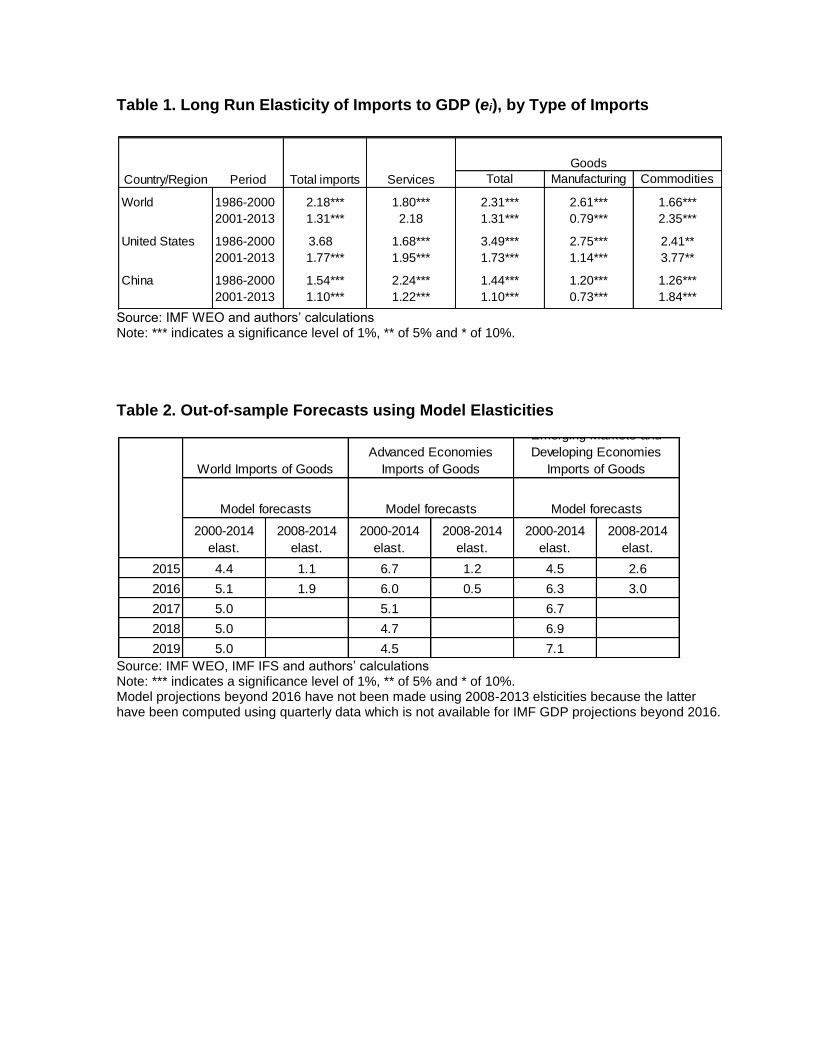
Table 1. Long Run Elasticity of Imports to GDP (ei), by Type of Imports
Source: IMF WEO and authors’ calculations Note: *** indicates a significance level of 1%, ** of 5% and * of 10%.
Table 2. Out-of-sample Forecasts using Model Elasticities
Source: IMF WEO, IMF IFS and authors’ calculations Note: *** indicates a significance level of 1%, ** of 5% and * of 10%. Model projections beyond 2016 have not been made using 2008-2013 elsticities because the latter have been computed using quarterly data which is not available for IMF GDP projections beyond 2016.
Total Manufacturing Commodities
World 1986-2000 2.18*** 1.80*** 2.31*** 2.61*** 1.66***
2001-2013 1.31*** 2.18 1.31*** 0.79*** 2.35***
United States 1986-2000 3.68 1.68*** 3.49*** 2.75*** 2.41**
2001-2013 1.77*** 1.95*** 1.73*** 1.14*** 3.77**
China 1986-2000 1.54*** 2.24*** 1.44*** 1.20*** 1.26***
2001-2013 1.10*** 1.22*** 1.10*** 0.73*** 1.84***
Country/Region Period Total imports Services
Goods
2000-2014
elast.
2008-2014
elast.
2000-2014
elast.
2008-2014
elast.
2000-2014
elast.
2008-2014
elast.
2015 4.4 1.1 6.7 1.2 4.5 2.6
2016 5.1 1.9 6.0 0.5 6.3 3.0
2017 5.0 5.1 6.7
2018 5.0 4.7 6.9
2019 5.0 4.5 7.1
Model forecasts
Emerging Markets and
Developing Economies
Imports of Goods
Advanced Economies
Imports of GoodsWorld Imports of Goods
Model forecasts Model forecasts
19
Appendix. World Merchandise Trade (percentage change)
Source: CPB Netherlands Bureau of Economic Policy Analysis. All data are seasonally adjusted.
2013 2014 2014Q1 2014Q2 2014Q3 2014Q4 2013 2014 2014Q1 2014Q2 2014Q3 2014Q4
World trade 2.7 3.3 -0.3 0.7 2.0 1.1 2.7 3.3 3.2 2.9 3.7 3.5
World imports 2.6 3.5 0.2 -0.1 2.1 1.3 2.6 3.5 3.8 3.1 3.4 3.6
Advanced Economies (c) -0.3 2.8 0.6 0.7 0.7 1.0 -0.3 2.8 2.7 2.8 2.7 3.1
United States 0.8 4.5 -0.1 2.5 0.5 4.2 0.8 4.5 2.9 4.0 3.8 7.3
Japan 1.6 2.1 4.5 -6.9 0.8 1.1 1.6 2.1 9.2 1.1 -0.5 -1.0
Euro Area -0.6 2.3 0.9 0.4 0.5 -0.3 -0.6 2.3 2.6 2.6 2.3 1.7
Other Advanced Economies -1.7 2.1 -0.9 2.2 1.5 -0.3 -1.7 2.1 0.2 2.3 3.3 2.6
Emerging Economies 5.6 4.1 -0.1 -0.9 3.5 1.6 5.6 4.1 5.0 3.4 4.1 4.1
Asia 5.3 4.3 -1.8 -0.7 5.8 2.1 5.3 4.3 3.5 3.0 5.4 5.4
Central and Eastern Europe 4.8 1.2 -0.3 -1.8 -0.3 1.1 4.8 1.2 4.6 2.4 -0.6 -1.4
Latin America 8.9 2.5 2.5 -2.3 0.6 5.0 8.9 2.5 4.1 0.7 -0.6 5.7
Africa and Middle East 5.3 7.2 3.5 0.1 2.2 -1.3 5.3 7.2 10.2 7.0 7.2 4.4
World exports 2.8 3.2 -0.9 1.5 1.8 0.9 2.8 3.2 2.5 2.8 4.0 3.5
Advanced Economies (a) 1.2 1.9 -0.1 0.5 0.9 1.7 1.2 1.9 2.0 0.8 1.6 3.0
United States 2.6 3.3 -2.9 2.4 2.2 1.2 2.6 3.3 2.8 3.2 4.4 2.8
Japan -1.4 1.7 -1.0 -1.2 1.6 4.8 -1.4 1.7 2.5 -0.9 0.9 4.1
Euro Area 0.3 1.8 0.7 0.6 0.2 1.1 0.3 1.8 1.4 1.8 1.6 2.6
Other Advanced Economies 3.6 0.6 1.2 -0.9 1.3 2.2 3.6 0.6 2.8 -3.4 -0.3 3.7
Emerging Economies 4.4 4.5 -1.7 2.6 2.7 0.2 4.4 4.5 3.0 4.8 6.3 3.9
Asia 5.7 5.6 -3.1 4.9 3.9 -0.3 5.7 5.6 1.6 6.5 9.0 5.3
Central and Eastern Europe 2.1 5.2 2.0 -1.1 0.8 1.1 2.1 5.2 8.3 5.9 3.8 2.9
Latin America 5.2 1.9 -1.7 0.2 -0.1 2.6 5.2 1.9 5.4 0.9 0.5 1.1
Africa and Middle East 0.5 0.0 0.9 -1.8 1.5 0.0 0.5 0.0 0.8 -2.0 0.5 0.6
quarter to previous quarter quarter on same quarter of previous year