Embed Size (px)
Citation preview

PROSPECTUS SUMMARY SAHAM ASSURANCE
MANDATORY TAKEOVER BID ON SAHAM ASSURANCE SHARES
INITIATED BY :
SANLAM EMERGING MARKETS IRELAND (SEMIL), SAHAM FINANCES, SAHAM SA AND SAHAM FINANCES PARTICIPATIONS
CHARACTERISTICS OF THE OFFER
Number of shares concerned 823,844 shares
Price per sharr 1,450 MAD
Maximum amount of the Offer 1,194,573,800 MAD
Offer duration From 08/01/2019 to 17/01/2019 including the first and the last day.
FINANCIAL ADVISORS ENTITY IN CHARGE OF THE
OPERATION REGISTRATION
APPROVAL OF THE MOROCCAN CAPITAL MARKET AUTHORITY (AMMC)
In accordance with the provisions of the circular of the Moroccan Capital Market Authority (AMMC), pursuant to Article 14 of the Dahir providing Law n° 1-93-212 of 21th September 1993 as amended and
supplemented, and Article 36 of Law n° 26-03 relating to public offerings on the stock market as amended and supplemented, the original copy of this prospectus was approved by the AMMC on 27/12/2018,
under reference n°VI/EM/038/2018
Prospectus Summary Page 2
DISCLAIMER
The Moroccan Capital Market Authority (AMMC) approved on 27/12/2018, under reference n° VI/EM/038/2018, a prospectus relating to the Mandatory takeover Offer for Saham Assurance shares (the Offer), initiated by Sanlam Emerging Markets Ireland (SEMIL), Saham Finances, Saham SA (Saham Insurance) and Saham Finances Participations. The prospectus approved by AMMC is available at all times at Saham Assurance’s headquarters and at its financial advisor’s office. The prospectus is available to the public at the Casablanca Stock Exchange headquarters and on its website www.casablanca-bourse.com. It is also available on AMMC’s website www.ammc.ma.

Prospectus Summary Page 3
PART I. PRESENTATION OF THE OFFER
I. Objectives of the Offer
I.1. Reasons for the operation Pursuant to the applicable legal and regulatory provisions, the Offer is intended for the acquisition of the shares of Saham Assurance not held by the Initiators, Sanam Holding and Mr Said ALJ, in accordance with the legal and regulatory provisions. Note that, Sanam Holding and Mr. Said ALJ, committed not to bring their shares to the take-over bid. I.2. Intentions of the Initiators
On the eve of this Offer, the Initiators hold directly and indirectly 58.5% of Saham Assurance share capital
and voting rights. Hence, the proposed Operation should not impact the Company’s strategy.
The Initiators do not intend to acquire, during the Offer duration, Saham Assurance shares outside of the
Offer.
I.3. Allocation of the shares brought in the offer
By common agreement between the Initiators, Saham Finances Participations is the only acquirer of all the shares brought in this offer. However, the Initiators remain jointly and severally liable for the obligations that are made to them under the Law N°26-03 relating to public offers on the stock market as amended and supplemented. I.4. Maximum share of capital held by the initiators after the takeover
Depending on the number of shares brought in the takeover by Saham Assurance shareholders, Saham
Assurance share of the capital and voting rights controlled by the Initiators at the end of the bid may vary
between 58.5% and 78.5%.
I.5. Financing arrangements
By common agreement between the Initiators, Saham Finances Participations is the only acquirer of all the
shares brought in this offer, however the Initiators remain jointly and severally liable for the obligations that
are made to them under the Law N°26-03 relating to public offers on the stock market as amended and
supplemented.
Saham Finances Participations have the necessary financial means to finance the Offer in cash for a maximal
amount of 1,194,573,800 MAD and related expenses.
I.6. Evolution of the shareholing structure of Saham Assurance in case of contribution of all targeted shares by the offer
Prospectus Summary Page 4
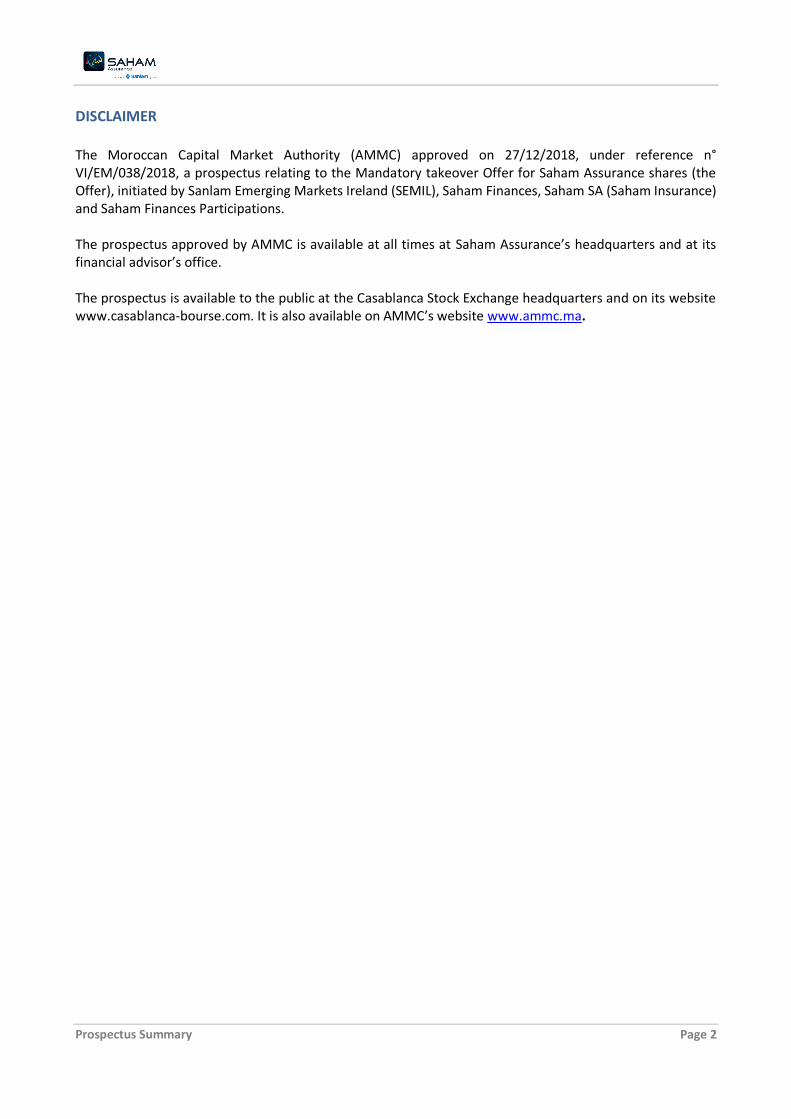
The table below shows the configuration of the capital before and after the Offer in case the Initiators purchase all the shares that they do not hold in Saham Assurance, taking into account that Sanam Holding and Mr. Said ALJ undertook not to bring the shares they hold to the Offer, i.e. 885,280 shares:
Before the Offer After the Offer
Nb. Of shares
Capital % Voting
Rights % Nb. Of shares
Capital % Voting
Rights %
Saham Finances & related parties1 2 407 750 58,48% 58,48% 2 407 750 58,48% 58,48%
Saham Finances Participations 823 844 20,01% 20,01%
Sanam Holding 793 872 19,28% 19,28% 793 872 19,28% 19,28%
Said ALJ 91 408 2,22% 2,22% 91 408 2,22% 2,22%
Other shareholders 823 844 20,01% 20,01% 0 0,00% 0,00%
Total 4 116 874 100,0% 100,0% 4 116 874 100,0% 100,0%
Source: Saham Assurance
I.7. Shares radiation The Initiators of the Mandatory Public Offer do not intend to request the delisting of Saham Assurance shares of the Casablanca Stock Exchange.
II. Links between Saham Assurances and the Initiators Saham Finances holds 58.5% of the capital and voting rights of Saham Assurance. On the date of completion of the Transaction, Saham Insurance indirectly holds 31.2% of the share capital and voting rights of Saham Assurance, through Saham Finances and Sanlam Emerging Markets Ireland indirectly holds 58.5% of the capital and voting rights of Saham Assurance, through Saham Finances and Saham Insurance. Prior to the takeover bid, Saham Finances Participations is not a shareholder of Saham Assurance.
III. Structure of the Offer
III.1. Number of the concerned shares The Offer concerns all the shares not held by the Initiators, i.e. 823,844 shares representing 20,0% of Saham Assurance share capital and voting rights, taking into account that Sanam Holding & Mr. Said ALJ committed not to bring their shares to the take-over bid, i.e. 885,280 shares. III.2. Offer price The Initiators offer to Saham Assurance shareholders the opportunity to sell their Saham Assurance shares at 1,450 MAD per share.
1 Saham Finances Participation includes 10 shares held by Saham Insurance

Prospectus Summary Page 5
III.3. Amount of the Offer The Mandatory Offer concerns Saham Assurance shares not held by the Initiators of the Offer, i.e. 823,844 shares at a price of MAD 1,450 per share. The maximum amount of the Offer is MAD 1,194,573,800. Note that Sanam Holding and Mr. Said ALJ committed not to bring their shares to the take-over bid. III.4. Entitlement to dividends of shares targeted by this offer Saham Assurance shares Cary dividends starting 1st January 2018. III.5. Opening date of the offer The Offer will begin on 08/01/2019. III.6. Closing date of the offer
The offer will be closed on 17/01/2019. III.7. Offer duration The Offer duration is between the opening date and the closing date of the Offer, according to the Offer calendar presented in the Prospectus, i.e. 7 trading days. III.8. Waiver threshold Saham Finances Participations undertakes to firmly and irrevocably acquire all the shares brought by Saham Assurance shareholders to this offer Due to the mandatory nature of the Offer, no waiver threshold is considered by the Initiators in this Offer. III.9. Date of settlement The settlement date is scheduled for 31/01/2019.
Prospectus Summary Page 6
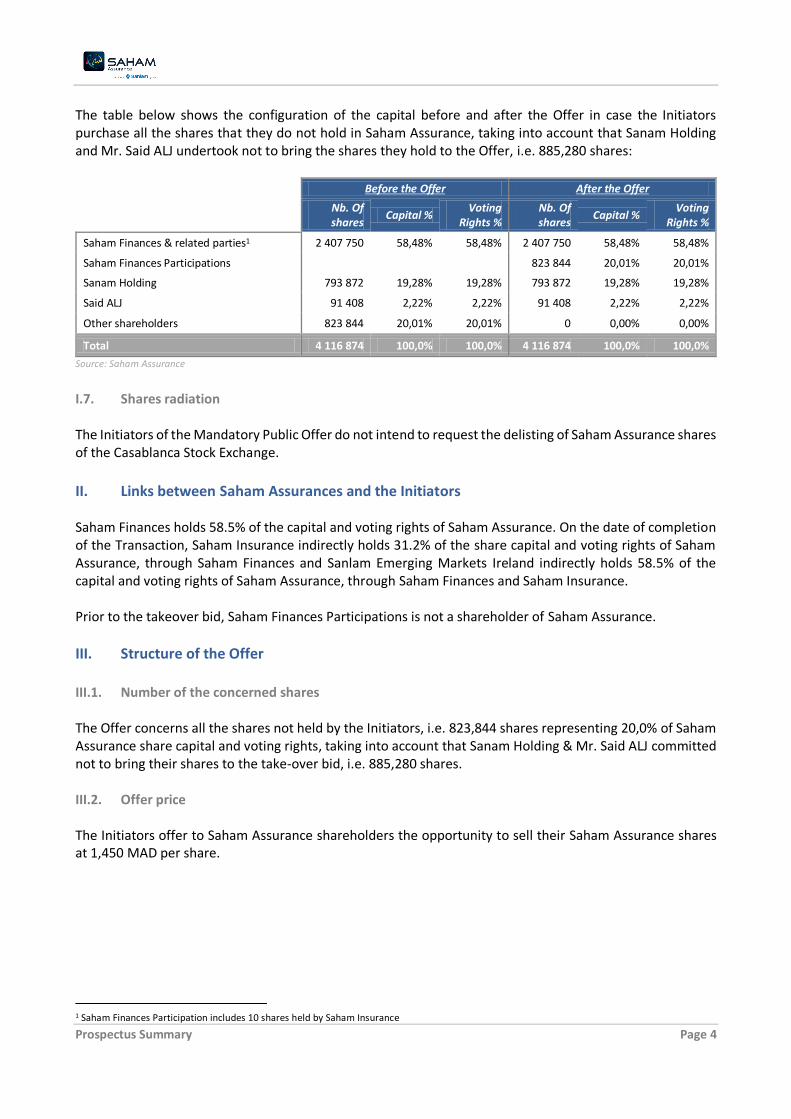
IV. Summary of valuation The table below shows the share value resulting from each of the methods selected for the valuation of
Saham Assurance share:
Method Equity value
(MMAD) Value per share (MAD / Share)
Weighting of the method
Premium/ Discount
compared to the offered price (en %)
Weighted Average Share Price 5 939 1 443 25,0% 0,5%
Trading comparable 5 875 1 427 25,0% 1,6%
Transactional reference 5 969 1 450 25,0% 0,0%
Discounted cash flows 5 884 1 429 25,0% 1,4%
Average valuation 5 917 1 437 0,9%
Price 5 969 1 450 Sources: Saham Assurance, Casablanca Stock Exchange, Bloomberg, Financial Advisors
The average value given by the selected valuation methods is 1,437 MAD/Share. The price proposed by the Initiators of the mandatory takeover bid is 1,450 MAD/Share.
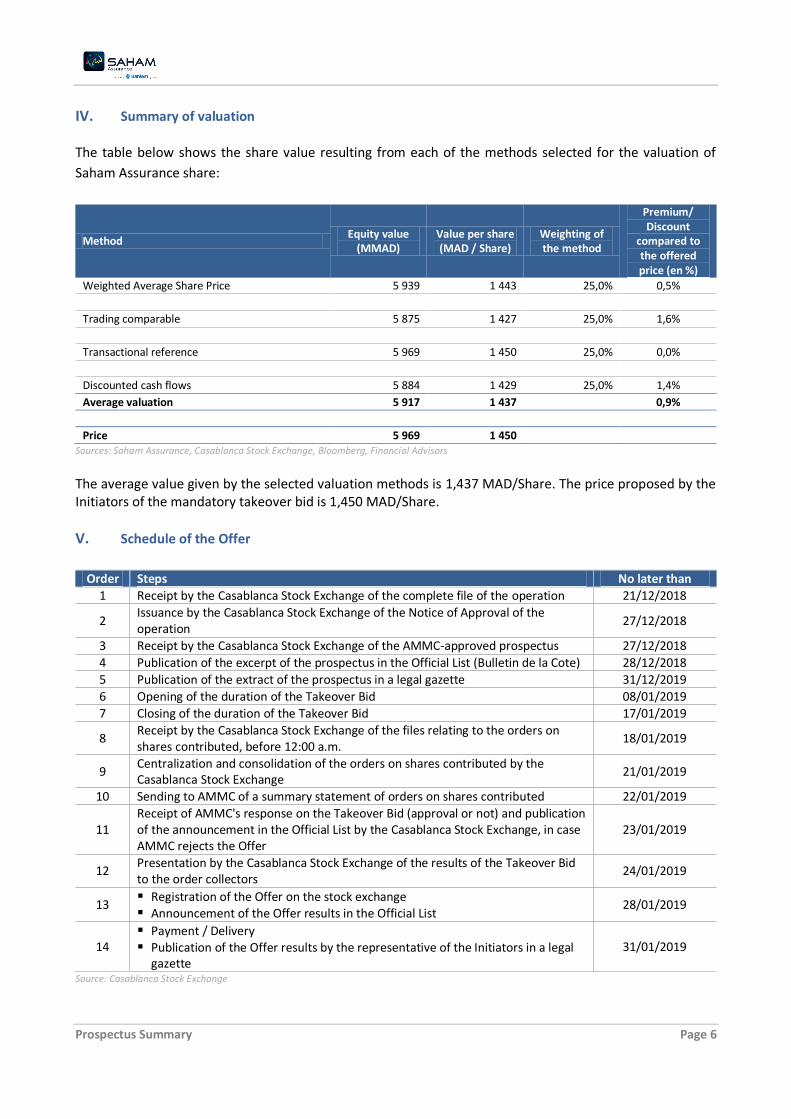
V. Schedule of the Offer
Order Steps No later than
1 Receipt by the Casablanca Stock Exchange of the complete file of the operation 21/12/2018
2 Issuance by the Casablanca Stock Exchange of the Notice of Approval of the operation
27/12/2018
3 Receipt by the Casablanca Stock Exchange of the AMMC-approved prospectus 27/12/2018
4 Publication of the excerpt of the prospectus in the Official List (Bulletin de la Cote) 28/12/2018
5 Publication of the extract of the prospectus in a legal gazette 31/12/2019
6 Opening of the duration of the Takeover Bid 08/01/2019
7 Closing of the duration of the Takeover Bid 17/01/2019
8 Receipt by the Casablanca Stock Exchange of the files relating to the orders on shares contributed, before 12:00 a.m.
18/01/2019
9 Centralization and consolidation of the orders on shares contributed by the Casablanca Stock Exchange
21/01/2019
10 Sending to AMMC of a summary statement of orders on shares contributed 22/01/2019
11 Receipt of AMMC's response on the Takeover Bid (approval or not) and publication of the announcement in the Official List by the Casablanca Stock Exchange, in case AMMC rejects the Offer
23/01/2019
12 Presentation by the Casablanca Stock Exchange of the results of the Takeover Bid to the order collectors
24/01/2019
13 Registration of the Offer on the stock exchange Announcement of the Offer results in the Official List
28/01/2019
14 Payment / Delivery Publication of the Offer results by the representative of the Initiators in a legal
gazette
31/01/2019
Source: Casablanca Stock Exchange

Prospectus Summary Page 7
PART II. PRESENTATION OF THE INITIATORS
I. SANLAM Emerging Markets Ireland Limited (SEMIL) PRESENTATION
I.1. General presentation
SEMIL is a holding company whose main activity is holding Saham Finances and Saham Insurance shares.
SEMIL belongs to the Sanlam Group (presentation below).
Corporate name Sanlam Emerging Markets Ireland Limited (SEMIL)
Headquarters Beech House, Beech Hill Road, Dublin 4, Ireland
Legal Form Private Company Limited (Irish legislation)
Establishment Date 09/11/2015
Business Purpose Carry on investment company and investment portfolio management activities and all ancillary activities and / or that may be determined by the board of directors.
Share capital as of 31/10/2018 902 USD
Number of shares as of 31/10/2018
902 shares
Exercise duration From January 1st to December 31st
Trade Register Number n° 571473
Court of competent jurisdiction Ireland
Source: SEMIL
I.2. SEMIL shareholdering structure
The evolution of SEMIL's shareholdering structure between 2016 and on the eve of the offer period is as
follows:
31/12/2016 31/12/2017 On the eve of the Offer
Nb. Of Shares % Capital & %
of Voting rights
Nb. Of Shares % Capital & %
of Voting rights
Nb. Of Shares % Capital & %
of Voting rights
SAN JV (RF) Proprietary Limited
201 100.00% 376 100.00% 902 100.00%
Total 201 100.00% 376 100.00% 902 100.00%
Source : SEMIL
Prospectus Summary Page 8
I.3. Board of directors : SEMIL board of directors is composed of the following members:
Board of directors members Current position
Austin O’Dowd Director
Richard Aslett Director
Annari Van Niekerk Director
Source: SEMIL

Prospectus Summary Page 9
II. SANLAM Limited PRESENTATION
II.1. General information
Corporate name Sanlam Limited
Headquarters 2, Strand Road Bellville, South Africa
Legal Form Limited Company ( South African legislation)
Establishment Date 08/06/1918
Business Purpose Carry on investment company and investment portfolio management activities and all ancillary activities and / or that may be determined by the board of directors.
Share capital as of June 2018
23,1 ZAR millions
Number of shares as of June 2018
2,231,989,047 shares
Exercise duration From January 1st to December 31st
Trade Register Number Sanlam Limited register n° 1959/001562/06
Court of competent jurisdiction
South Africa
Source: Sanlam
II.2. Sanlam shareholdering structure
The evolution of Sanlam’s shareholdering structure between 2015 and October 2018 period is as follows:
31/12/2015 31/12/2016 31/12/2017 October 2018
Nb. Of Shares
% Capital & % of Voting
rights
Nb. Of Shares
% Capital & % of Voting
rights
Nb. Of Shares
% Capital & % of Voting
rights
Nb. Of Shares
% Capital & % of Voting
rights
Ubuntu-Botho Investments (Pty) Limited
292 473 694 13.5% 292 473 694 13.5% 292 473 694 13.5% 292 471 806 13.1%
Government Employees Pension Fund (PIC)
276 008 508 12.7% 265 176 149 12.2% 253 043 907 11.7% 242 074 441 10.85%
Subsidiaries 163 351 974 7.5% 165 085 152 7.6% 161 618 797 7.5% 130 528 539 5.85%
Sanlam Limited Share Incentive Trust
22 747 954 1.1% 22 314 660 1.0% 20 798 129 1.0% 21 374 995 0.96%
Other shareholders 1 411 889 676 0.3% 1 421 422 151 0.3% 1 438 537 279 0.2% 1 545 539 266 69.24%
Total 2 166 471 806 100.0% 2 166 471 806 100.0% 2 166 471 806 100.0% 2 231 989 047 100.0%
Source: Sanlam
Prospectus Summary Page 10
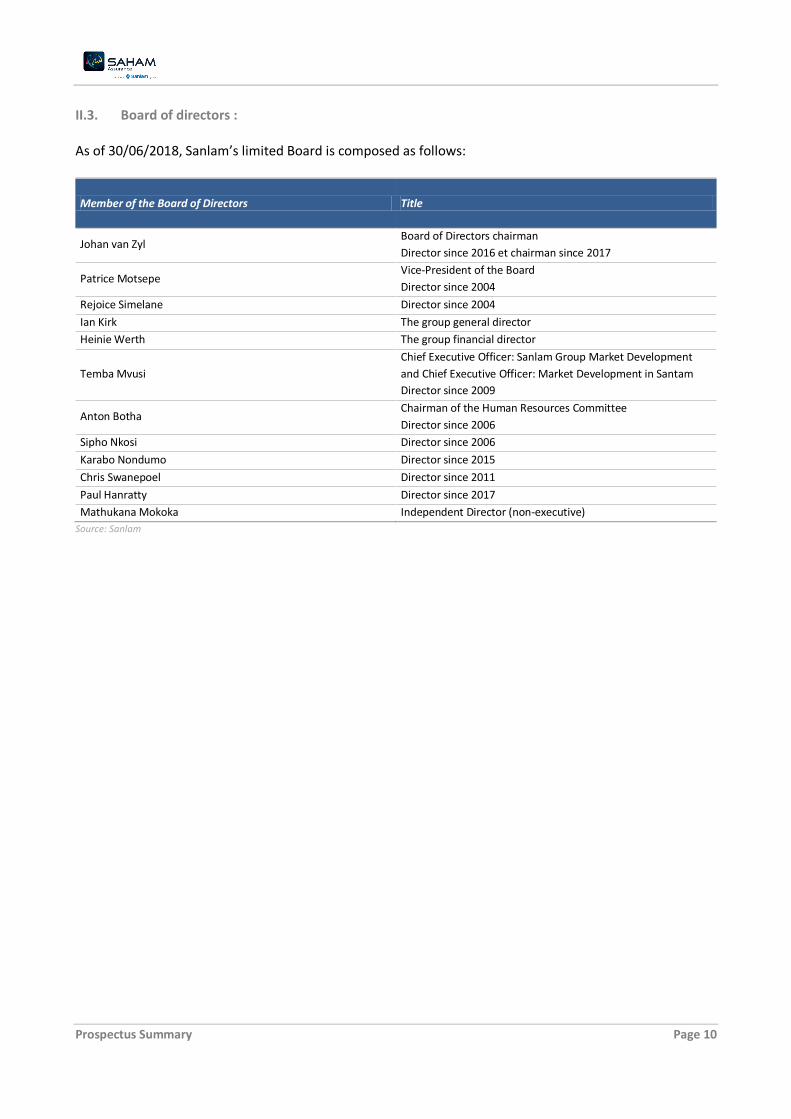
II.3. Board of directors : As of 30/06/2018, Sanlam’s limited Board is composed as follows:
Member of the Board of Directors Title
Johan van Zyl Board of Directors chairman
Director since 2016 et chairman since 2017
Patrice Motsepe Vice-President of the Board
Director since 2004
Rejoice Simelane Director since 2004
Ian Kirk The group general director
Heinie Werth The group financial director
Temba Mvusi
Chief Executive Officer: Sanlam Group Market Development
and Chief Executive Officer: Market Development in Santam
Director since 2009
Anton Botha Chairman of the Human Resources Committee
Director since 2006
Sipho Nkosi Director since 2006
Karabo Nondumo Director since 2015
Chris Swanepoel Director since 2011
Paul Hanratty Director since 2017
Mathukana Mokoka Independent Director (non-executive)
Source: Sanlam
Prospectus Summary Page 11
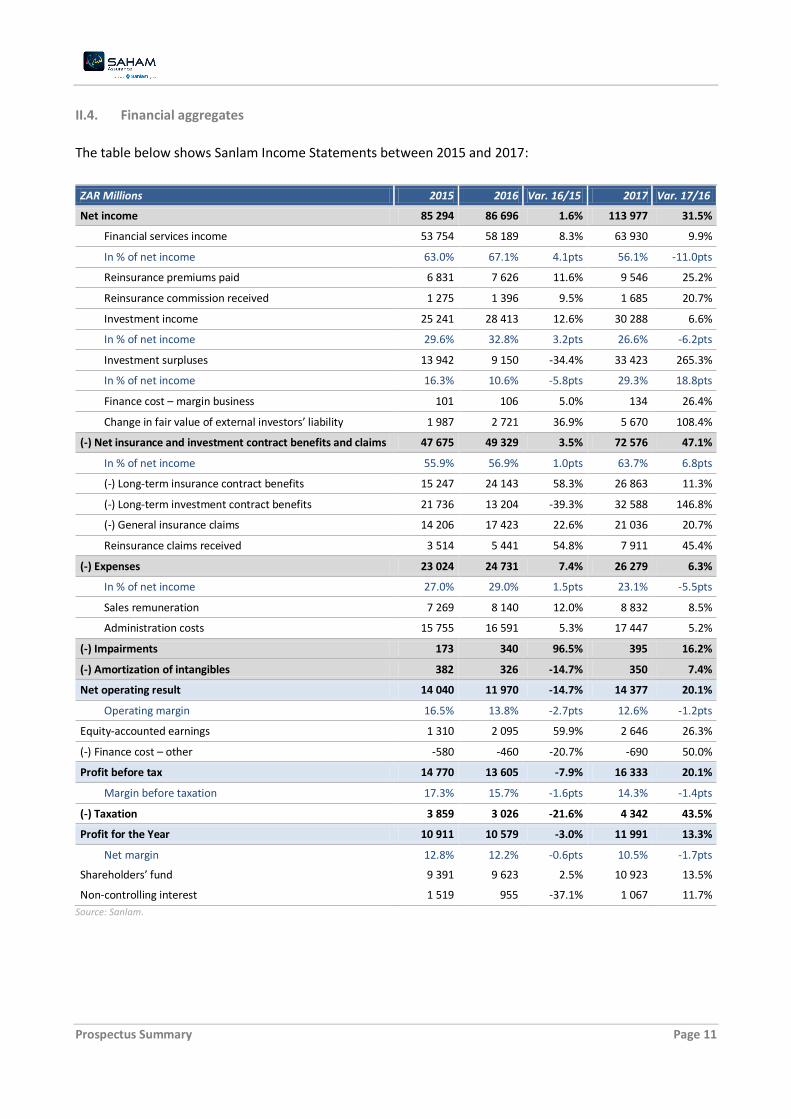
II.4. Financial aggregates
The table below shows Sanlam Income Statements between 2015 and 2017:
ZAR Millions 2015 2016 Var. 16/15 2017 Var. 17/16
Net income 85 294 86 696 1.6% 113 977 31.5%
Financial services income 53 754 58 189 8.3% 63 930 9.9%
In % of net income 63.0% 67.1% 4.1pts 56.1% -11.0pts
Reinsurance premiums paid 6 831 7 626 11.6% 9 546 25.2%
Reinsurance commission received 1 275 1 396 9.5% 1 685 20.7%
Investment income 25 241 28 413 12.6% 30 288 6.6%
In % of net income 29.6% 32.8% 3.2pts 26.6% -6.2pts
Investment surpluses 13 942 9 150 -34.4% 33 423 265.3%
In % of net income 16.3% 10.6% -5.8pts 29.3% 18.8pts
Finance cost – margin business 101 106 5.0% 134 26.4%
Change in fair value of external investors’ liability 1 987 2 721 36.9% 5 670 108.4%
(-) Net insurance and investment contract benefits and claims 47 675 49 329 3.5% 72 576 47.1%
In % of net income 55.9% 56.9% 1.0pts 63.7% 6.8pts
(-) Long-term insurance contract benefits 15 247 24 143 58.3% 26 863 11.3%
(-) Long-term investment contract benefits 21 736 13 204 -39.3% 32 588 146.8%
(-) General insurance claims 14 206 17 423 22.6% 21 036 20.7%
Reinsurance claims received 3 514 5 441 54.8% 7 911 45.4%
(-) Expenses 23 024 24 731 7.4% 26 279 6.3%
In % of net income 27.0% 29.0% 1.5pts 23.1% -5.5pts
Sales remuneration 7 269 8 140 12.0% 8 832 8.5%
Administration costs 15 755 16 591 5.3% 17 447 5.2%
(-) Impairments 173 340 96.5% 395 16.2%
(-) Amortization of intangibles 382 326 -14.7% 350 7.4%
Net operating result 14 040 11 970 -14.7% 14 377 20.1%
Operating margin 16.5% 13.8% -2.7pts 12.6% -1.2pts
Equity-accounted earnings 1 310 2 095 59.9% 2 646 26.3%
(-) Finance cost – other -580 -460 -20.7% -690 50.0%
Profit before tax 14 770 13 605 -7.9% 16 333 20.1%
Margin before taxation 17.3% 15.7% -1.6pts 14.3% -1.4pts
(-) Taxation 3 859 3 026 -21.6% 4 342 43.5%
Profit for the Year 10 911 10 579 -3.0% 11 991 13.3%
Net margin 12.8% 12.2% -0.6pts 10.5% -1.7pts
Shareholders’ fund 9 391 9 623 2.5% 10 923 13.5%
Non-controlling interest 1 519 955 -37.1% 1 067 11.7%
Source: Sanlam.
Prospectus Summary Page 12
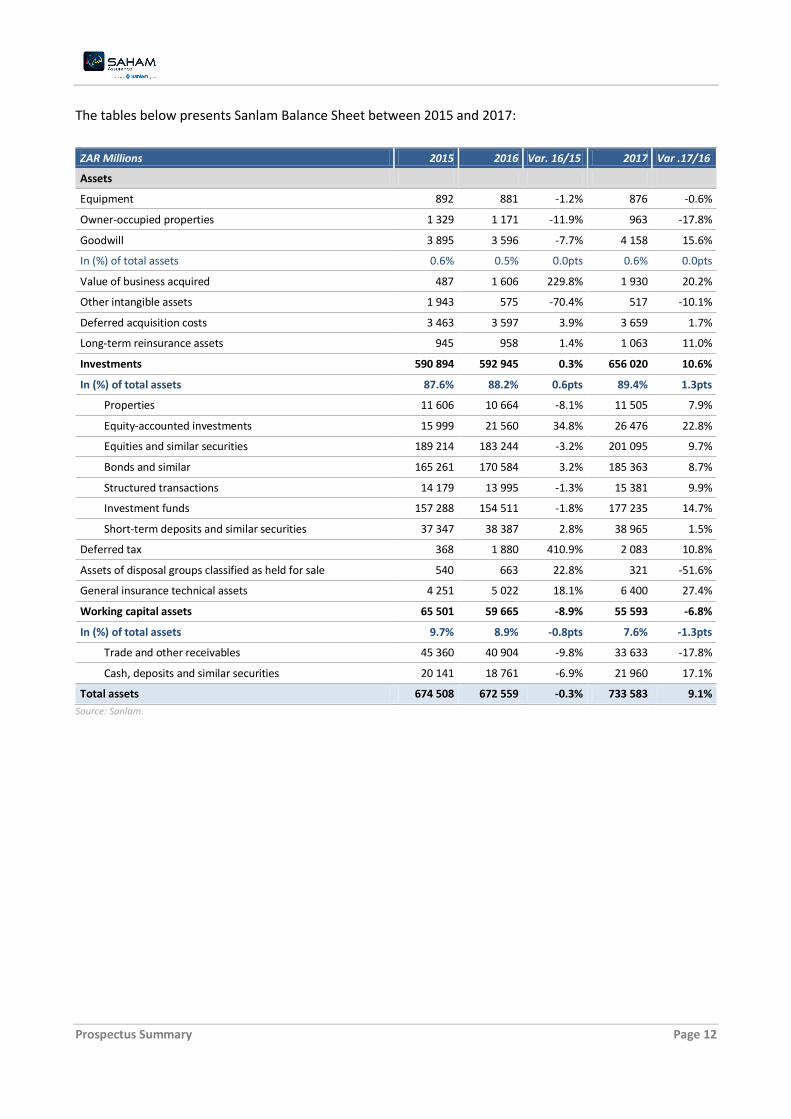
The tables below presents Sanlam Balance Sheet between 2015 and 2017:
ZAR Millions 2015 2016 Var. 16/15 2017 Var .17/16
Assets
Equipment 892 881 -1.2% 876 -0.6%
Owner-occupied properties 1 329 1 171 -11.9% 963 -17.8%
Goodwill 3 895 3 596 -7.7% 4 158 15.6%
In (%) of total assets 0.6% 0.5% 0.0pts 0.6% 0.0pts
Value of business acquired 487 1 606 229.8% 1 930 20.2%
Other intangible assets 1 943 575 -70.4% 517 -10.1%
Deferred acquisition costs 3 463 3 597 3.9% 3 659 1.7%
Long-term reinsurance assets 945 958 1.4% 1 063 11.0%
Investments 590 894 592 945 0.3% 656 020 10.6%
In (%) of total assets 87.6% 88.2% 0.6pts 89.4% 1.3pts
Properties 11 606 10 664 -8.1% 11 505 7.9%
Equity-accounted investments 15 999 21 560 34.8% 26 476 22.8%
Equities and similar securities 189 214 183 244 -3.2% 201 095 9.7%
Bonds and similar 165 261 170 584 3.2% 185 363 8.7%
Structured transactions 14 179 13 995 -1.3% 15 381 9.9%
Investment funds 157 288 154 511 -1.8% 177 235 14.7%
Short-term deposits and similar securities 37 347 38 387 2.8% 38 965 1.5%
Deferred tax 368 1 880 410.9% 2 083 10.8%
Assets of disposal groups classified as held for sale 540 663 22.8% 321 -51.6%
General insurance technical assets 4 251 5 022 18.1% 6 400 27.4%
Working capital assets 65 501 59 665 -8.9% 55 593 -6.8%
In (%) of total assets 9.7% 8.9% -0.8pts 7.6% -1.3pts
Trade and other receivables 45 360 40 904 -9.8% 33 633 -17.8%
Cash, deposits and similar securities 20 141 18 761 -6.9% 21 960 17.1%
Total assets 674 508 672 559 -0.3% 733 583 9.1%
Source: Sanlam.
Prospectus Summary Page 13
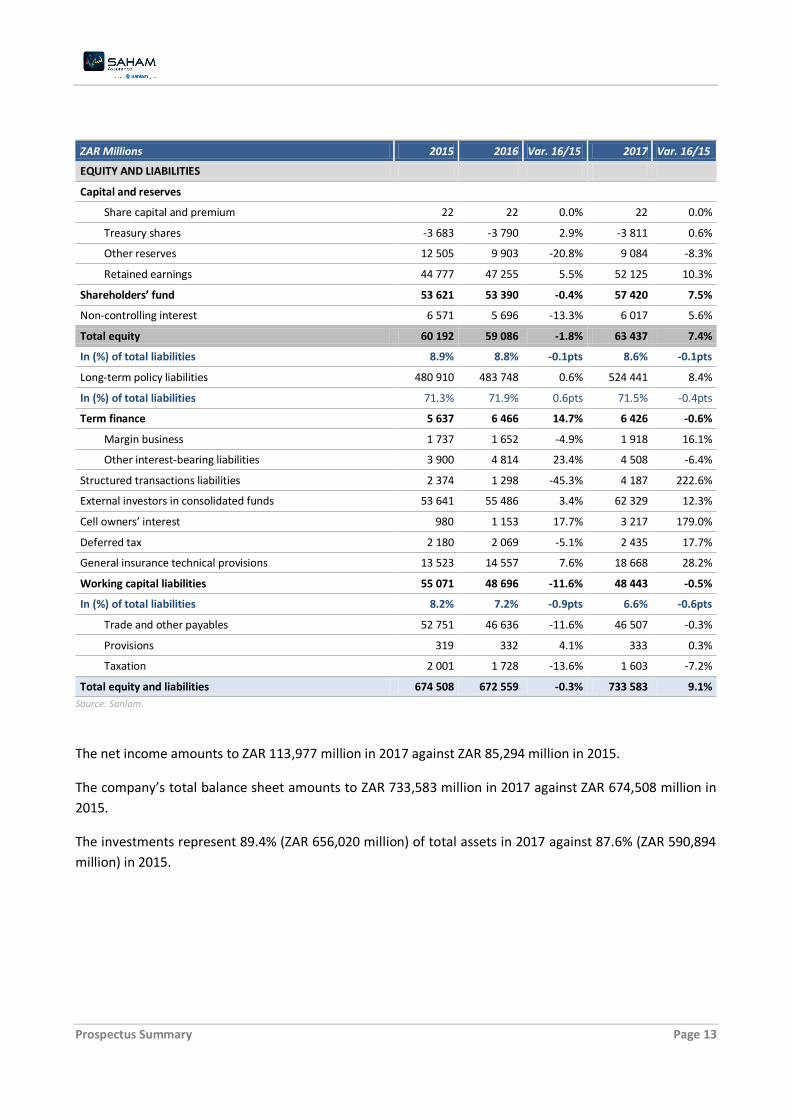
ZAR Millions 2015 2016 Var. 16/15 2017 Var. 16/15
EQUITY AND LIABILITIES
Capital and reserves
Share capital and premium 22 22 0.0% 22 0.0%
Treasury shares -3 683 -3 790 2.9% -3 811 0.6%
Other reserves 12 505 9 903 -20.8% 9 084 -8.3%
Retained earnings 44 777 47 255 5.5% 52 125 10.3%
Shareholders’ fund 53 621 53 390 -0.4% 57 420 7.5%
Non-controlling interest 6 571 5 696 -13.3% 6 017 5.6%
Total equity 60 192 59 086 -1.8% 63 437 7.4%
In (%) of total liabilities 8.9% 8.8% -0.1pts 8.6% -0.1pts
Long-term policy liabilities 480 910 483 748 0.6% 524 441 8.4%
In (%) of total liabilities 71.3% 71.9% 0.6pts 71.5% -0.4pts
Term finance 5 637 6 466 14.7% 6 426 -0.6%
Margin business 1 737 1 652 -4.9% 1 918 16.1%
Other interest-bearing liabilities 3 900 4 814 23.4% 4 508 -6.4%
Structured transactions liabilities 2 374 1 298 -45.3% 4 187 222.6%
External investors in consolidated funds 53 641 55 486 3.4% 62 329 12.3%
Cell owners’ interest 980 1 153 17.7% 3 217 179.0%
Deferred tax 2 180 2 069 -5.1% 2 435 17.7%
General insurance technical provisions 13 523 14 557 7.6% 18 668 28.2%
Working capital liabilities 55 071 48 696 -11.6% 48 443 -0.5%
In (%) of total liabilities 8.2% 7.2% -0.9pts 6.6% -0.6pts
Trade and other payables 52 751 46 636 -11.6% 46 507 -0.3%
Provisions 319 332 4.1% 333 0.3%
Taxation 2 001 1 728 -13.6% 1 603 -7.2%
Total equity and liabilities 674 508 672 559 -0.3% 733 583 9.1%
Source: Sanlam.
The net income amounts to ZAR 113,977 million in 2017 against ZAR 85,294 million in 2015.
The company’s total balance sheet amounts to ZAR 733,583 million in 2017 against ZAR 674,508 million in
2015.
The investments represent 89.4% (ZAR 656,020 million) of total assets in 2017 against 87.6% (ZAR 590,894
million) in 2015.

Prospectus Summary Page 14
III. SAHAM INSURANCE PRESENTATION
III.1. General information
Saham Insurance is a holding company whose main activity is holding Saham Finances shares. Saham
Insurance belongs to Sanlam Group.
Corporate name Saham SA (Saham Insurance)
Headquarters 216. Zerktouni – Casablanca. Morocco
Legal Form Limited Company with a board of Directors
Establishment Date 1995
Business Purpose Carry on investment company and investment portfolio management activities and all ancillary activities and / or that may be determined by the board of directors.
Share capital as of 30/09/2018
330,998,100 MAD
Number of shares as of 30/09/2018
74,650 shares
Exercise duration From January 1st to December 31st
Trade Register Number N°86033 at Casablanca
Court of competent jurisdiction
Casablanca
Source: Saham Insurance
III.2. Saham Insurance shareholders structure
As of 30/09/2018. Saham insurance share capital is 330,998 100 MAD and consists of 74,650 shares with a
par value of 4,434 MAD per share. SAHAM Insurance capital is held at 100% by Sanlam Emerging Markets
Ireland Limited (SEMIL).
The evolution of Saham Insurance shareholdering structure from 2015 to November 2018 is as follows:
31/12/2015 31/12/2016 31/12/2017 November 2018
Nb. Of Shares
% Capital & % of Voting rights
Nb. Of Shares
% Capital & % of Voting rights
Nb. Of Shares
% Capital & % of Voting rights
Nb. Of Shares
% Capital & % of Voting rights
Moulay Hafid Elalamy
94 797 82.2% 94 797 82.20% 94 798 82.2%
Globex Afriquia 15 384 13.3% 15 384 13.30% 15 384 13.3%
Ghita Lahlou 5 000 4.3% 5 000 4.30% 5 000 4.3%
Other shareholders 204 0.2% 204 0.20% 203 0.2%
SEMIL 74 650 100.00%
Total 115 385 100.00% 115 385 100.00% 115 385 100.00% 74 650 100.00%
Source: Saham Insurance

Prospectus Summary Page 15
III.3. Saham Insurance board of directors:
On the eve of the Operation, Saham Insurance board of directors is composed as follows:
Board of directors members Title
Lizé LAMBRECHTS Chairman of the board
Margaret DAWES Director
Nadia FETTAH Director and CEO
Raymond FARHAT Director Source: Saham Insurance
III.4. Financial aggregates
The table below presents Saham Insurance Income Statement between 2015 and 2017:
KMAD 2015 2016 2017 Var. 16/15 Var. 17/16
Turnover 29 076 27 777 53 913 -4.5% 94.1%
Other operating products 40 159 165 >100% 4.0%
Operating reversals: transfers of charges 805 1 560 30 93.7% -98.1%
Operating revenues 29 921 29 495 54 107 -1.4% 83.4%
Purchases consumed of materials and supplies 869 995 810 14.5% -18.5%
Other external charges 40 311 31 794 44 969 -21.1% 41.4%
Taxes 509 33 696 2 396 >100% -92.9%
Staff costs 34 652 38 434 40 088 10.9% 4.3%
Operating allocations 10 847 11 826 10 706 9.0% -9.5%
Operating costs 87 188 116 745 98 969 33.9% -15.2%
Operating income -57 267 -87 250 -44 862 52.4% -48.6%
Income from holdings and other fixed securities 9 288 21 528 861 976 131.8% >100%
Exchange gains 14 319 95 7 668 -99.3% >100%
Interest and other financial income 101 416 53 774 43 541 -47.0% -19.0%
Financial reversals: transfer of charges 8 244 8 706 471 5.6% -94.6%
Financial revenues 133 268 84 103 913 656 -36.9% 986.4%
Interest expenses 88 679 105 858 90 941 19.4% -14.1%
Exchange losses 107 18 353 125 >100% -99.3%
Other financial expenses 7 314 - - -100.0% NA
Financial allocations 1 731 22 801 266 >100% -98.8%
Financial charges 97 830 147 012 91 331 50.3% -37.9%
Financial income 35 437 -62 909 822 324 <100% <100%
Current result -21 830 -150 159 777 463 >100% <100%
Proceeds from sale of fixed assets 38 748 171 370 1 252 >100% -99.3%
Other non-current income 99 644 42 >100% -93.4%
Non-current reversals: transfers of charges - 884 - NA -100.0%
Non-current revenues 38 847 172 899 1 294 >100% -99.3%
Net value of sold fixed assets depreciation 10 323 11 569 517 12.1% -95.5%
Other non-current expenses 3 347 5 116 1 086 52.9% -78.8%
Non-current depreciation and amortization - 128 - NA -100.0%

Prospectus Summary Page 16
Non-current expenses 13 670 16 813 1 603 23.0% -90.5%
Non-current income 25 177 156 086 -309 >100.0% -100.2%
Pre-tax income 3 347 5 928 777 154 77.1% >100%
Income taxes 771 2 729 4 837 >100% 77.2%
Net profit 2 575 3 199 772 318 24.2% >100%
Source: Saham Insurance
The table below presents Saham Insurance Balance Sheet between 2015 and 2017:
ASSETS (KMAD) 2015 2016 2017 Var. 16/15 Var. 17/16
Non value assets 12 464 8 704 7 061 -30.2% -18.9%
Patent, Trademarks, rights and similar securities 12 464 8 704 7 061 -30.2% -18.9%
Intangible assets 7 046 5 053 2 888 -28.3% -42.8%
Land 1 067 100 100 -90.6% 0.0%
Constructions 20 050 21 705 20 762 8.3% -4.3%
Technical plant, machinery and equipment - - - NA NA
Transport equipment 1 849 1 238 635 -33.0% -48.7%
Office equipment, furniture and fittings 6 480 6 507 7 199 0.4% 10.6%
Other tangible assets 5 826 4 858 4 204 -16.6% -13.5%
Fixed assets 35 272 34 409 32 900 -2.4% -4.4%
Other financial receivables 94 94 12 948 0.0% >100%
Equity interests 1 509 267 2 356 910 2 456 124 56.2% 4.2%
Securities and investment values 103 103 - 0.0% -100.0%
Financial assets 1 509 463 2 357 106 2 469 072 56.2% 4.8%
Total Fixed Assets 1 564 246 2 405 272 2 511 920 53.8% 4.4%
Trade payables, advances and down payments 42 468 283 >100% -39.6%
Customers and related accounts 254 701 391 683 254 944 53.8% -34.9%
Staff 858 1 025 854 19.5% -16.7%
Taxes 71 561 84 942 87 220 18.7% 2.7%
Other debtors 1 475 982 984 037 960 275 -33.3% -2.4%
Adjustment accounts-Assets 92 - 883 -100.0% NA
Conversion deferrals - Assets 1 731 471 266 -72.8% -43.6%
Current assets 1 804 968 1 462 626 1 304 725 -19.0% -10.8%
Securities and investment values 95 037 - - -100.0% NA
Cash assets 6 687 66 644 22 430 >100.0% -66.3%
Total assets 3 470 937 3 934 542 3 839 075 13.4% -2.4%
Source: Saham Insurance

Prospectus Summary Page 17
LIABILITIES (KMAD) 2015 2016 2017 Var. 16/15 Var. 17/16
Share capital 511 617 511 617 511 617 0.0% 0.0%
Issue, merger, contribution premium 612 473 612 473 612 473 0.0% 0.0%
Legal reserve 5 759 5 887 6 047 2.2% 2.7%
Other reserves 500 500 500 0.0% 0.0%
Retained earnings 330 137 332 583 335 622 0.7% 0.9%
Net income for the financial year 2 575 3 199 772 318 24.2% >100%
Equity 1 463 061 1 466 260 2 238 577 0.2% 52.7%
Bond issues 1 000 000 1 000 000 500 000 0.0% -50.0%
Other financing debts 44 437 686 053 686 053 >100% 0.0%
Financial debts 1 044 437 1 686 053 1 186 053 61.4% -29.7%
Total permanent financing 2 507 498 3 152 313 3 424 631 25.7% 8.6%
Accounts payable 49 421 39 247 21 711 -20.6% -44.7%
Accounts payable. advances and down payments 9 NA NA
Staff 8 598 11 561 5 255 34.5% -54.5%
Social organizations 1 253 1 654 978 32.0% -40.9%
Taxes 30 369 34 793 35 420 14.6% 1.8%
Partner accounts 318 116 116 -63.6% 0.0%
Other creditors 151 062 60 225 177 982 -60.1% >100.0%
Accruals and deferred income 17 010 44 723 27 050 >100.0% -39.5%
Other provisions 2 323 598 393 -74.2% -34.3%
Conversion deferrals - Liabilities 899 788 7 980 -12.4% >100%
Current liabilities 261 254 193 706 276 894 -25.9% 42.9%
Cash – Liabilities 702 185 588 523 137 550 -16.2% -76,6%
Total liabilities 3 470 937 3 934 542 3 839 075 13.4% -2.4%
Source: Saham Insurance
The company’s turnover amounts to MAD 53.9 million in 2017 against MAD 29.1 Million in 2015.
The company’s total balance sheet amounts to MAD 3,839.1 million in 2017 against MAD 3,470.9 Million in
2015.
The company’s total financial assets amounts to MAD 2,469 million in 2017 against MAD 1,059 million in
2015.
Prospectus Summary Page 18
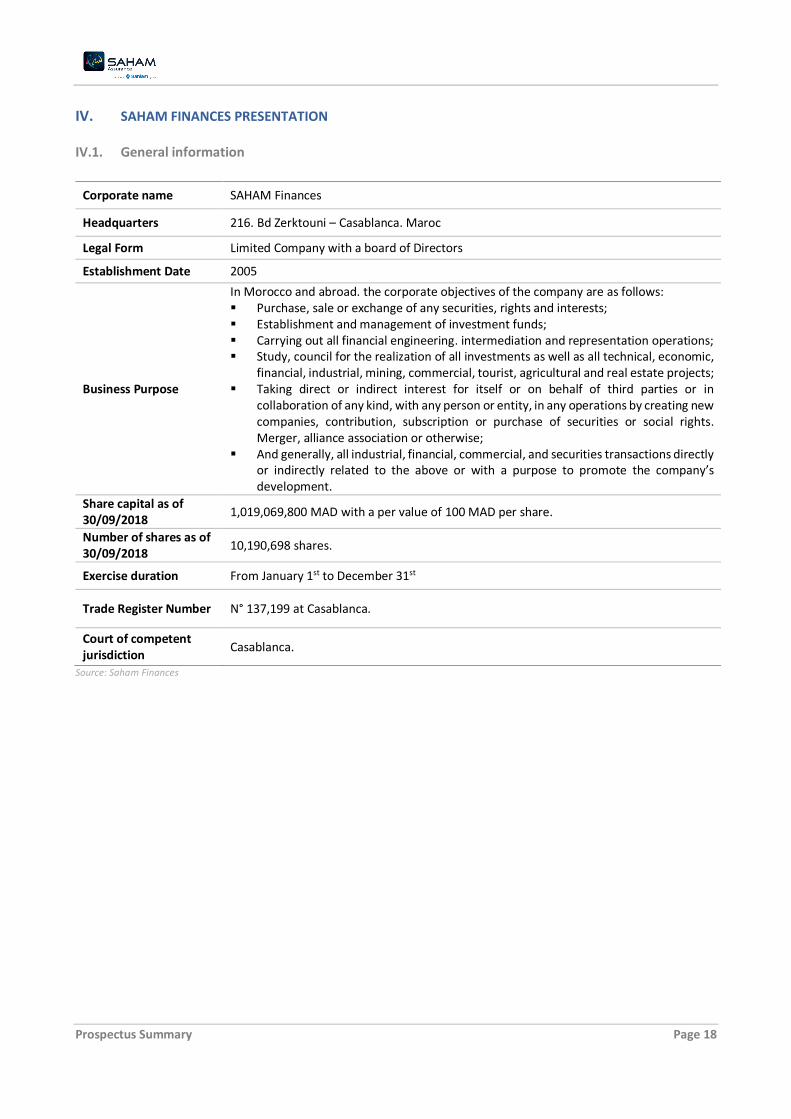
IV. SAHAM FINANCES PRESENTATION
IV.1. General information
Corporate name SAHAM Finances
Headquarters 216. Bd Zerktouni – Casablanca. Maroc
Legal Form Limited Company with a board of Directors
Establishment Date 2005
Business Purpose
In Morocco and abroad. the corporate objectives of the company are as follows: Purchase, sale or exchange of any securities, rights and interests; Establishment and management of investment funds; Carrying out all financial engineering. intermediation and representation operations; Study, council for the realization of all investments as well as all technical, economic,
financial, industrial, mining, commercial, tourist, agricultural and real estate projects; Taking direct or indirect interest for itself or on behalf of third parties or in
collaboration of any kind, with any person or entity, in any operations by creating new companies, contribution, subscription or purchase of securities or social rights. Merger, alliance association or otherwise;
And generally, all industrial, financial, commercial, and securities transactions directly or indirectly related to the above or with a purpose to promote the company’s development.
Share capital as of 30/09/2018
1,019,069,800 MAD with a per value of 100 MAD per share.
Number of shares as of 30/09/2018
10,190,698 shares.
Exercise duration From January 1st to December 31st
Trade Register Number N° 137,199 at Casablanca.
Court of competent jurisdiction
Casablanca.
Source: Saham Finances
Prospectus Summary Page 19
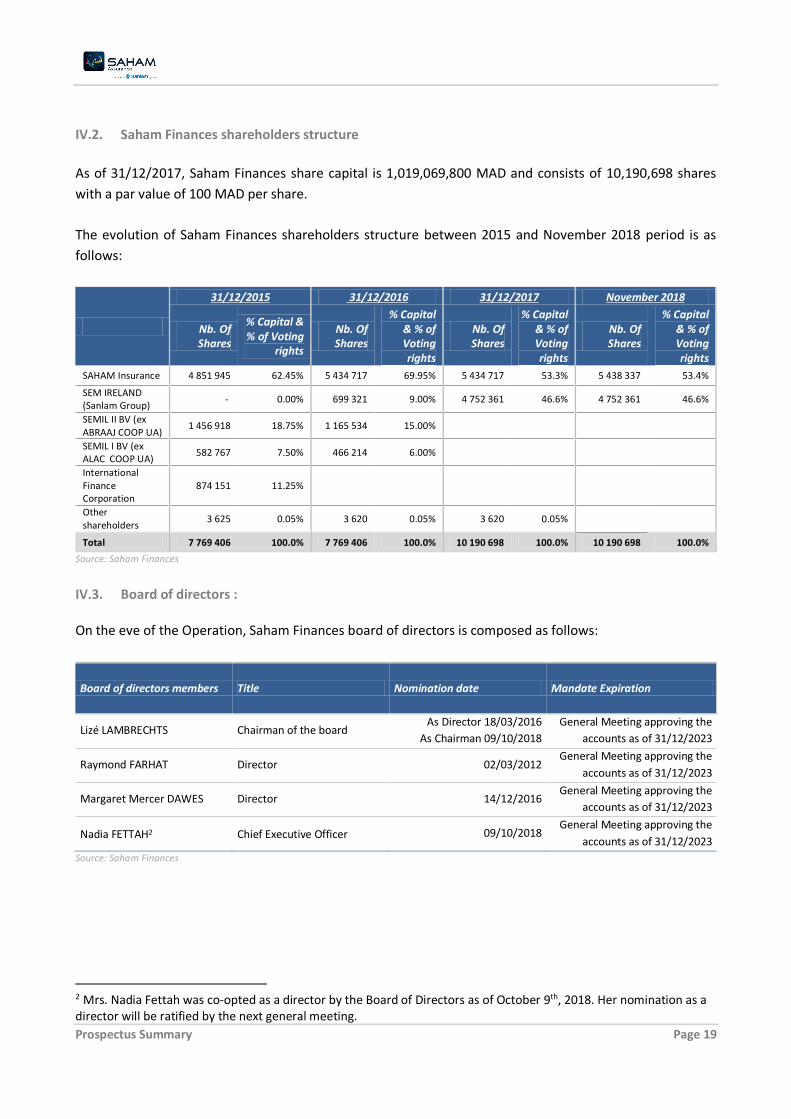
IV.2. Saham Finances shareholders structure
As of 31/12/2017, Saham Finances share capital is 1,019,069,800 MAD and consists of 10,190,698 shares
with a par value of 100 MAD per share.
The evolution of Saham Finances shareholders structure between 2015 and November 2018 period is as
follows:
31/12/2015 31/12/2016 31/12/2017 November 2018
Nb. Of Shares
% Capital & % of Voting
rights
Nb. Of Shares
% Capital & % of Voting rights
Nb. Of Shares
% Capital & % of Voting rights
Nb. Of Shares
% Capital & % of Voting rights
SAHAM Insurance 4 851 945 62.45% 5 434 717 69.95% 5 434 717 53.3% 5 438 337 53.4%
SEM IRELAND (Sanlam Group)
- 0.00% 699 321 9.00% 4 752 361 46.6% 4 752 361 46.6%
SEMIL II BV (ex ABRAAJ COOP UA)
1 456 918 18.75% 1 165 534 15.00%
SEMIL I BV (ex ALAC COOP UA)
582 767 7.50% 466 214 6.00%
International Finance Corporation
874 151 11.25%
Other shareholders
3 625 0.05% 3 620 0.05% 3 620 0.05%
Total 7 769 406 100.0% 7 769 406 100.0% 10 190 698 100.0% 10 190 698 100.0%
Source: Saham Finances
IV.3. Board of directors : On the eve of the Operation, Saham Finances board of directors is composed as follows:
Board of directors members Title Nomination date Mandate Expiration
Lizé LAMBRECHTS Chairman of the board As Director 18/03/2016
As Chairman 09/10/2018
General Meeting approving the
accounts as of 31/12/2023
Raymond FARHAT Director 02/03/2012 General Meeting approving the
accounts as of 31/12/2023
Margaret Mercer DAWES Director 14/12/2016 General Meeting approving the
accounts as of 31/12/2023
Nadia FETTAH2 Chief Executive Officer 09/10/2018 General Meeting approving the
accounts as of 31/12/2023
Source: Saham Finances
2 Mrs. Nadia Fettah was co-opted as a director by the Board of Directors as of October 9th, 2018. Her nomination as a director will be ratified by the next general meeting.

Prospectus Summary Page 20
IV.4. Consolidated financial aggregates :
The table below presents Saham Finances Consolidated Income Statement between 2015 and 2017:
(MMAD) 2015 2016 Var. 15/16
2017 Var. 16/17
Written premiums 9 716 10 358 6.6% 11 510 11.1%
Variation in unearned premiums -21 99 NA -201 NS
Earned premiums 9 695 10 458 7.9% 11 309 8.1%
Other products out of insurance activity 479 344 -28.2% 439 27.7%
Investment result 1 217 1 049 -13.9% 1 154 10.1%
Investment products 1 584 1 995 26.0% 1 665 -16.6%
Investment expenses -366 -947 NA -511 NA
Change in impairments on investments -317 27 100% -108 NS
Reversals of investment write-downs 2 164 NA 83 -49.6%
Depreciation of investments -319 -137 -57.1% -190 39.0%
Net investment result 901 1 075 19.4% 1 046 -2.7%
Technical charges of insurance activities -4 720 -6 169 30.7% -6 885 11.6%
Net result of reinsurance disposals -1 868 -1 144 -38.8% -1 093 -4.4%
Contract acquisition costs -972 -1 188 22.2% -1 243 4.7%
Amortization of portfolio value -13 -13 0.4% -13
General charges of exploitation -2 082 -2 087 0.2% -2 214 6.1%
Net operating expenses -1 260 -1 140 -9.5% -1 073 -5.9%
Wage costs -734 -868 18.4% -942 8.5%
Reversal of depreciation and impairment 171 199 16.4% 66 -66.8%
Depreciation and impairment -260 -277 6.6% -265 -4.5%
Other operating income and expenses -11 -154 NS 19 -112.6%
Operating income 1 408 1 122 -20.3% 1 365 21.6%
Net exchange result -19 162 100% 165 1.9%
Financing charges -192 -175 -9.0% -111 -36.8%
Quote share in the results of associates or joint ventures -11 8 172.7% -1 -108.0%
Impairment of acquisition gaps
Net result of discontinued operations
Link account must be zero in aggregate
Taxes on income -392 -357 -9.0% -372 4.4%
Net income of the consolidated group 795 761 -4.2% 1 047 37.6%
Interests without control -312 294 100% 323 10.0%
Net income group share 483 467 -3.3% 724 54.9%
Source: Saham Finances

Prospectus Summary Page 21
The table below presents Saham Finances Consolidated Balance Sheet between 2015 and 2017:
ASSETS (MMAD) 2015 2016 Var. 15/16 2017 Var. 16/17
Goodwill 2 977 2 971 -0.2% 3 120 5.0%
Values of contract portfolios of acquired insurance companies 82 68 -16.5% 57 -16.4%
Other intangible assets 251 226 -10.0% 270 19.3%
Intangible assets 3 310 3 265 -1.3% 3 448 5.6%
Investment real estate 1 688 1 584 -6.2% 1 921 21.3%
Financial investments 15 321 17 065 11.4% 17 915 5.0%
Investments 17 009 18 649 9.6% 19 836 6.4%
Investments in associates or co-companies 41 52 26.3% 0 -100.0%
Receivables of financing companies 1 320 1 365 3.3% 1 265 -7.3%
Shareholders and retrocessions in assets and financial insurance contracts
2 978 2 894 -2.8% 2 537 -12.3%
Real estate and other property. Plant and equipment 1 078 1 121 4.1% 1 256 12.0%
Deferred profit sharing active 367 10 -97.4% 23 139.1%
Deferred tax assets 446 463 3.8% 482 4.2%
Stocks 714 1 245 74.3% 1 709 37.3%
Receivables arising from insurance or reinsurance transactions 4 192 4 504 7.4% 3 963 -12.0%
Accounts receivable - income tax 263 191 -27.4% 253 32.4%
Other tax receivables 0 172 NA 244 41.9%
Other receivables 3 286 2 437 -25.8% 2 379 -2.4%
Other assets 10 346 10 143 -2.0% 10 309 1.6%
Cash and cash equivalents 1 959 2 337 19.3% 2 253 -3.6%
Assets 36 963 38 704 4.7% 39 647 2.4%
Source: Saham Finances
LIABILITIES (MMAD) 2015 2016 Var. 15/16 2017 Var. 16/17
Capital 777 777 0.0% 1 019 31.2%
Issuance and merger premiums 1 648 1 648 0.0% 4 619 180.3%
Consolidated reserves 1 610 2 223 38.1% 1 795 -19.3%
Conversion differences 55 -64 -215.3% -200 212.9%
Net income-group share 483 467 -3.3% 724 54.9%
SHAREHOLDERS 'EQUITY - GROUP SHARE 4 573 5 051 10.4% 7 957 57.5%
INTEREST WITHOUT CONTROL 2 580 2 805 8.7% 2 742 -2.2%
SHAREHOLDERS 'EQUITY 7 153 7 856 9.8% 10 699 36.2%
Provisions for risks and charges 222 214 -3.5% 253 18.1%
Financial debts 1 946 1 999 2.7% 1 017 -49.1%
LONG-TERM LIABILITIES 2 168 2 213 2.1% 1 270 -42.6%
Technical liabilities relating to insurance contracts 19 807 20 118 1.6% 20 324 1.0%
Technical liabilities relating to investment contracts 37 38 2.5% 35 -7.7%
Deferred Profit Sharing 329 93 -71.6% 121 30.0%
TECHNICAL LIABILITIES OF INSURANCE COMPANIES 20 173 20 250 0.4% 20 481 1.1%
Deferred tax liabilities 617 600 -2.7% 822 37.0%

Prospectus Summary Page 22
Debts arising from insurance or reinsurance transactions 2 755 3 069 11.4% 2 627 -14.4%
Current tax debts 595 232 -61.1% 273 17.9%
Other tax debts 0 430 NA 372 -13.4%
Other debts 1 964 2 178 10.8% 1 725 -20.8%
OTHER LIABILITIES 5 932 6 509 9.7% 5 820 -10.6%
DEBTS OF FINANCING COMPANIES 1 042 1 052 1.0% 1 018 -3.3%
SHORT-TERM FINANCIAL DEBTS 496 825 66.5% 360 -56.4%
TOTAL LIABILITIES 36 963 38 704 4.7% 39 647 2.4%
Source: Saham Finances
The net premiums written amounts to MAD 11,510 million in 2017 against MAD 9,716 million in 2015.
The company’s net income group share amounts to MAD 724 million in 2017 against MAD 483 million in
2015.
The company’s total balance sheet amounts to MAD 39,647 million in 2017 against MAD 36,963 million in
2015.

Prospectus Summary Page 23
V. Saham Finances Participations Presentation
V.1. General information
Corporate name Saham Finances Participations
Headquarters 216. Bd Zerktouni – Casablanca. Maroc
Legal Form Limited Liability Company
Establishment Date 2018
Business Purpose Investment company and investment portfolio management activities Share capital as of 31/10/2018
100,000 MAD
Number of shares as of 31/10/2018
1,000 shares
Exercise duration From January 1st to December 31st
Trade Register Number N°413719 at Casablanca
Court of competent jurisdiction
Casablanca
Source: Saham Finances Participations
V.2. Saham Finances Participations shareholders
Saham Finances Participations was established in October 2018. Its capital consists of 1,000 shares of MAD
100 per share.
On the eve of the takeover bid, Saham Finances Participations is 100% owned by Saham Finances.
Ms. Nadia Fettah is the Managing Partner of Saham Finances Participations.
Prospectus Summary Page 24
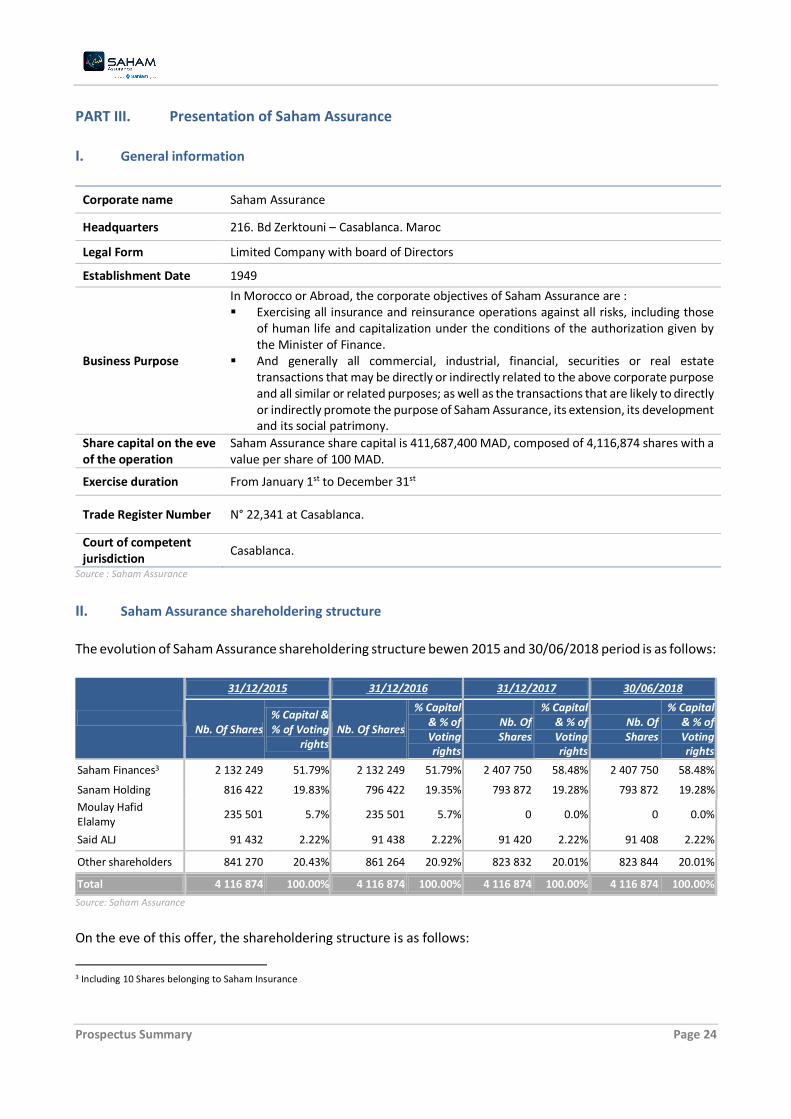
PART III. Presentation of Saham Assurance
I. General information
Corporate name Saham Assurance
Headquarters 216. Bd Zerktouni – Casablanca. Maroc
Legal Form Limited Company with board of Directors
Establishment Date 1949
Business Purpose
In Morocco or Abroad, the corporate objectives of Saham Assurance are : Exercising all insurance and reinsurance operations against all risks, including those
of human life and capitalization under the conditions of the authorization given by the Minister of Finance.
And generally all commercial, industrial, financial, securities or real estate transactions that may be directly or indirectly related to the above corporate purpose and all similar or related purposes; as well as the transactions that are likely to directly or indirectly promote the purpose of Saham Assurance, its extension, its development and its social patrimony.
Share capital on the eve of the operation
Saham Assurance share capital is 411,687,400 MAD, composed of 4,116,874 shares with a value per share of 100 MAD.
Exercise duration From January 1st to December 31st
Trade Register Number N° 22,341 at Casablanca.
Court of competent jurisdiction
Casablanca.
Source : Saham Assurance
II. Saham Assurance shareholdering structure
The evolution of Saham Assurance shareholdering structure bewen 2015 and 30/06/2018 period is as follows:
31/12/2015 31/12/2016 31/12/2017 30/06/2018
Nb. Of Shares % Capital & % of Voting
rights Nb. Of Shares
% Capital & % of Voting rights
Nb. Of Shares
% Capital & % of Voting rights
Nb. Of Shares
% Capital & % of Voting rights
Saham Finances3 2 132 249 51.79% 2 132 249 51.79% 2 407 750 58.48% 2 407 750 58.48%
Sanam Holding 816 422 19.83% 796 422 19.35% 793 872 19.28% 793 872 19.28%
Moulay Hafid Elalamy
235 501 5.7% 235 501 5.7% 0 0.0% 0 0.0%
Said ALJ 91 432 2.22% 91 438 2.22% 91 420 2.22% 91 408 2.22%
Other shareholders 841 270 20.43% 861 264 20.92% 823 832 20.01% 823 844 20.01%
Total 4 116 874 100.00% 4 116 874 100.00% 4 116 874 100.00% 4 116 874 100.00%
Source: Saham Assurance
On the eve of this offer, the shareholdering structure is as follows:
3 Including 10 Shares belonging to Saham Insurance

Prospectus Summary Page 25
Shareholders Number of Shares % of capital % of Voting Rights
Saham Finances 2 407 7504 58.5% 58.5%
Sanam Holding 793 872 19.3% 19.3%
Said ALJ 91 408 2.2% 2.2%
Other shareholders 823 844 20.0% 20.0%
Total 4 116 874 100.00% 100.00%
Source : Saham Assurance
III. Board of directors On the eve of the Operation, Saham Assurance board of directors is composed as follows:
Members Title Nomination / Renewal Date
Expiration date Links with Saham
Assurance Shares held
Said ALJ Chairman of the Board of Directors
OGM5 approving 2017 accounts
OGM approving 2020 accounts
Shareholder 91 408
Nadia FETTAH Director OGM approving 2016 accounts
OGM approving 2019 accounts
10
Jude Kofi BUCKNOR Independent Director
OGM approving
2016 accounts OGM approving 2019 accounts
10
Mohamed BERRADA
Independent Director
OGM approving
2016 accounts OGM approving
2019 accounts 10
Mohamed ELALAMY
Director OGM approving
2016 accounts OGM approving
2019 accounts 10
Raymond FARHAT Director OGM approving 2017 accounts
OGM approving 2020 accounts
10
Mercer DAWES MARGARET
Director OGM approving 2016 accounts
OGM approving 2019 accounts
10
SAHAM Insurance represented by Raymond FARHAT
Director OGM approving 2017 accounts
OGM approving 2020 accounts
Shareholder of Saham Finances
10
SAHAM Finances represented by Emmanuel BRULE
Director OGM approving 2016 accounts
OGM approving 2019 accounts
Shareholder 2 407 740
John MELVILLE Director OGM approving 2017 accounts
OGM approving 2020 accounts
10
Source: Saham Assurance
The Board of Directors of September 5th 2018 appointed Mr Said ALJ as the Chairman of the Board of
Directors of Saham Assurance.
4 Including 10 Shares belonging to Saham Insurance 5 Ordinary General Meeting

Prospectus Summary Page 26
IV. Financial aggregates
IV.1. Individual accounts aggregates The table below shows Saham Assurance life technical income statement between 2015 and 2017 as well as
for the first half of 2018 (H1 2018) compared to the first half of 2017 (H1 2017):
Life Insurance – Technical account ( MMAD) 2015 2016 Var.
16/15 2017
Var. 17/16
H1. 2017
H1. 2018
Var. H1 17 /H1
18
Premium 343,9 754,7 >100% 1 010,6 33,9% 347,5 400,8 15,3%
Premiums written 343,9 754,7 >100% 1 010,6 33,9% 347,5 400,8 15,3%
Technical Operating revenues 24,0 0,0 NS 0,0 NA 0,0 0,1 >100%
Other operating revenues 4,0 0,0 NS - NA - 0,1 NA
Operating reversals, expenses transfer 20,0 0,0 NS 0,0 NA 0,0 0,0 NS
Claims & Costs 435,7 827,1 89,8% 1 043,7 26,2% 405,2 434,0 7,1%
Claims & costs paid 470,1 469,7 -0,1% 456,1 -2,9% 214,8 224,3 4,4%
Variation of provisions for claims payable -55,0 -39,5 -28,2% -22,4 -43,4% 1,1 4,1 >100%
Variation of mathematical provisions (life) -63,0 334,0 NS 605,3 81,2% 137,1 206,8 50,8%
Variation of provisions for claims fluctuation 29,1 29,8 2,4% 29,3 -1,9% - - NS
Variation of provisions for profit sharing 54,5 33,1 -39,2% -24,5 NA 52,2 -1,1 NS
Variation of other technical provisions - - NS - NA - - NS
Technical Operating Expenses 87,6 79,5 -9,3% 104,1 30,9% 40,8 57,3 40,4%
Contract acquisition expenses 19,0 31,0 62,9% 33,3 7,3% 11,3 21,5 90,1%
Cost of supplies and consumable materials 4,3 3,0 -29,6% 7,3 >100% 2,4 3,6 50,8%
Other external expenses 16,1 11,7 -27,4% 20,3 73,8% 6,8 9,7 42,7%
Taxes 1,9 1,5 -20,4% 3,5 >100% 1,7 2,1 28,4%
Staff costs 20,2 13,6 -32,8% 26,7 96,6% 11,1 13,5 21,7%
Other operating expenses 15,2 12,6 -16,8% 3,8 -69,8% 2,1 0,9 -56,9%
Depreciation & Amortization 10,9 6,1 -44,3% 9,2 50,6% 5,5 6,0 8,7%
Investment revenues related to insurance transactions 416,9 403,6 -3,2% 236,6 -41,4% 163,8 162,3 -0,9%
Investment revenues 106,7 90,7 -15,0% 87,4 -3,7% 60,7 60,2 -0,8%
Foreign exchange gains - - - - - - - -
Revenues from the difference in reimbursement price to receive 0,2 0,0 NS 0,0 >100% 0,0 0,0 0,0%
Profits on investment realization 183,2 156,0 -14,8% 134,2 -14,0% 98,4 91,3 -7,2%
Interest and other investment income 4,5 4,1 -8,1% 6,5 59,0% 4,4 1,6 -64,5%
Reversals of investment expenses: transfer of charges 122,3 152,7 24,9% 8,5 -94,4% 0,4 9,2 >100%
Investment expenses related to insurance transactions 197,2 179,7 -8,9% 29,6 -83,5% 14,0 18,8 34,2%
Management fees on investments 8,8 13,5 54,1% 13,3 -1,8% 8,7 4,7 -46,3%
Foreign exchange loss - - - - - - - -
Amortization of differences in reimbursement price 2,5 1,6 -34,8% 0,8 -49,5% 0,5 0,3 -47,0%
Loss on investment realization 11,7 36,2 >100% 2,0 -94,4% 0,4 9,9 >100%
Other investment expenses 0,0 105,5 >100% 4,8 -95,5% 0,5 - NA
Depreciation on investment 174,2 22,9 -86,9% 8,8 -61,7% 4,0 4,0 0,8%
Technical income - Life 64,3 72,0 11,9% 69,8 -3,1% 51,3 52,9 3,1%
Source: Saham Assurance.
The total technical income-life amounts to MAD 69.8 millions in 2017 versus MAD 64.3 millions in 2015.

Prospectus Summary Page 27
The table below shows Saham Assurance non-life technical income statement between 2015 and 2017 as
well as for the first half of 2018 (H1 2018) compared to the first half of 2017 (H1 2017):
Non-Life Insurance – Technical account ( MMAD) 2015 2016 Var. 16/15 2017 Var. 17/16 H1.
2017 H1.
2018
Var. H1 17
/H1 18
Net written premiums 2 986,3 3 321,7 11,2% 3 469,4 4,4% 1 678,7 1 867,5 11,2%
Premiums written 3 018,6 3 312,7 9,7% 3 511,8 6,0% 1 935,2 2 168,4 12,0%
Provisions Variation for unearned premiums 32,3 -9,0 NS 42,4 NS 256,6 300,9 17,3%
Technical Operating revenues 142,9 226,8 58,8% 80,1 -64,7% 23,9 29,3 22,8%
Other operating expenses 24,1 36,3 50,6% 57,7 59,1% 15,1 25,0 65,1%
Operating reversals, expenses transfer 118,8 190,5 60,4% 22,4 -88,3% 8,8 4,4 -49,9%
Claims & Costs 1 957,4 2 212,0 13,0% 2 355,9 6,5% 1 134,0 1 265,5 11,6%
Claims & costs paid 1 897,9 1 962,7 3,4% 2 253,2 14,8% 1 221,0 1 327,0 8,7%
Variation of provisions for claims payable 25,3 207,8 >100% 63,1 -69,6% -91,2 -58,3 -36,1%
Variation of provisions for claims fluctuation 46,0 41,7 -9,4% 37,1 -10,9% - 0,0 NS
Variation of provisions for financial contingencies - - NS - NS - - NS
Variation of provisions for profit sharing - - NS - NS - - NS
Variation of other technical provisions -11,8 -0,2 -98,1% 2,4 NS 4,3 -3,2 NS
Technical Operating Expenses 1 021,5 1 116,4 9,3% 975,2 -12,6% 473,2 513,8 8,6%
Contract acquisition expenses 391,5 406,8 3,9% 442,7 8,8% 207,9 230,3 10,8%
Cost of supplies and consumable materials 39,4 44,2 12,2% 55,0 24,5% 21,7 28,8 32,8%
Other external expenses 148,0 171,0 15,6% 152,8 -10,6% 61,1 76,8 25,7%
Tax 17,1 21,7 26,8% 26,2 20,7% 14,9 16,9 13,1%
Staff cost 185,7 198,7 7,0% 200,8 1,0% 99,6 106,8 7,2%
Other operating expenses 139,5 184,9 32,6% 28,7 -84,5% 18,6 7,1 -62,0%
Depreciation & Amortization 100,4 89,0 -11,3% 68,9 -22,6% 49,3 47,2 -4,3%
Investment revenues related to insurance transactions 760,4 570,0 -25,0% 457,1 -19,8% 301,5 268,3 -11,0%
Investment revenues 237,2 233,5 -1,6% 274,0 17,3% 215,4 220,1 2,2%
Foreign exchange gains - - NS - NS - - NS
Revenues from the difference in reimbursement price to receive 0,5 0,0 NS 0,0 -11,0% - - NS
Profits on investment realization 134,1 195,6 45,8% 134,1 -31,4% 60,9 40,9 -32,8%
Interest and other investment income 52,0 53,5 2,8% 39,5 -26,2% 22,6 6,3 -71,9%
Reversals of investment expenses: transfer of charges 336,5 87,4 -74,0% 9,5 -89,1% 2,6 0,9 -64,4%
Investment expenses related to insurance transactions 553,3 319,0 -42,3% 139,6 -56,2% 82,6 47,0 -43,1%
Interest expenses - - NS - NS - - NS
Management fees on investments 57,3 55,4 -3,3% 38,3 -30,9% 26,3 17,7 -32,9%
Foreign exchange loss - - NS - NS - - NS
Amortization of differences in reimbursement price 0,6 2,1 >100% 3,8 80,8% 1,9 1,9 -0,1%
Loss on investment realization 76,4 108,0 41,3% 14,0 -87,0% 10,7 0,1 NS
Losses from affected investments revaluation - - NS - >100% - - NS
Other investment expenses - 65,4 NS 8,0 -87,8% 0,3 - NS
Depreciation on investment 418,9 88,1 -79,0% 75,6 -14,2% 43,4 27,4 -36,9%
Technical income – Non Life 357,4 471,2 31,9% 535,9 13,7% 314,3 338,9 7,8%
Source: Saham Assurance.
The total technical income-non life amounts to MAD 535.9 millions in 2017 versus MAD 357.4 millions in
2015.

Prospectus Summary Page 28
The table below shows Saham Assurance non-technical income statement between 2015 and 2017 as well
as for the first half of 2018 (H1 2018) compared to the first half of 2017 (H1 2017):
Non technical income statement - MMAD 2015 2016 Var.
15/16 2017
Var. 16/17
H1. 2017 H1. 2018 Var. H1 17 / H1
18
Non-technical current revenues 113,9 46,4 -59,3% 71,5 54,3% 55,7 22,6 -59,5%
Operating non-technical current revenues - - NS - NS - - NS
Interests and other non-technical current revenues 73,2 43,4 -40,7% 54,3 25,0% 30,7 21,5 -30,1%
Other non-technical curent revenues 1,2 0,7 -43,3% 0,6 -19,2% 0,5 0,3 -42,9%
Non-technical reversals, expenses transfer 39,5 2,2 -94,3% 16,7 NS 24,5 0,8 -96,7%
Non-technical current expenses 55,0 34,3 -37,6% 65,6 91,1% 51,7 2,1 -96,0%
Operating non-technical current expenses 1,7 - NS 1,3 NS 0,0 0,0 >100%
Interests and other non-technical current expenses 22,6 - NS 6,9 NS 6,9 - NS
Other non-technical current expenses 2,7 0,5 NS 13,0 NS 6,9 0,0 NS
Non-technical depreciation & amortization 28,0 33,8 20,6% 44,5 31,5% 37,8 2,1 -94,6%
Non-technical current income 58,9 12,0 -79,6% 5,9 -50,8% 4,1 20,5 >100%
Non-technical non-current revenues 0,5 46,5 NS 0,7 NS 0,1 0,3 >100%
Proceeds from assets disposals 0,5 - NS 0,0 NS 0,0 0,2 97,4%
Other non-technical non-current revenues 0,0 46,5 NS 0,6 NS - 0,2 NS
Non-technical non-current expenses 6,9 139,1 NS 1,4 NS 2,5 0,4 -83,6%
Net book value of assets sold 0,0 - NS 0,1 NS 0,1 - <100%
Other non-operating revenues 6,9 139,1 NS 1,3 NS 0,3 0,4 20,0%
Noncurrent depreciation & amortization - - NS - NS 2,1 - <100%
Non-technical non-current income -6,4 -92,6 NS -0,7 NS -2,4 -0,1 -97,1%
Non-technical income 52,6 -80,5 NS 5,2 NS 1,6 20,5 >100%
Source: Saham Assurance.
The total non-technical income amounts to MAD 5.2 millions in 2017 versus MAD 52.6 millions in 2015. The table below shows Saham Assurance net income between 2015 and 2017 as well as for the first half of
2018 (H1 2018) compared to the first half of 2017 (H1 2017):
MMAD 2015 2016 Var. 15/16 2017 Var. 16/17 H1. 2017 H1. 2018 Var. H1 17
/ H1 18
Technical income - Life 64,3 72,0 11,9% 69,8 -3,1% 51,3 52,9 3,1%
Technical income – Non Life 357,4 471,2 31,9% 535,9 13,7% 314,3 338,9 7,8%
Non-technical income 52,6 -80,5 NS 5,2 NS 1,6 20,5 NS
Income before tax 474,2 462,6 -2,4% 610,8 32,0% 367,2 412,3 12,3%
Income tax 134,2 181,0 34,9% 170,3 -5,9% 112,2 133,3 18,8%
Net income 340,0 281,6 -17,2% 440,5 56,4% 255,0 279,0 9,4%
Source: Saham Assurance.
The total technical income-non life amounts to MAD 535.9 millions in 2017 versus MAD 357.4 millions in
2015.
The total technical income-non life amounts to MAD 535.9 millions in 2017 against MAD 357.4 millions in
2015.
The Net Income amouts to MAD 440.5 millions in 2017 against MAD 340.0 millions in 2015.

Prospectus Summary Page 29
The table below shows Saham Assurance balance sheet between 2015 and the first half of 2018 (H1 2018):
Assets - MMAD 2015 2016 Var.
16/15 2017
Var. 17/16
H1. 2018 Var. H1.
18 / H1 17
Non value assets 6,8 3,5 -48,0% 15,6 >100% 15,2 -3,0%
Preliminary expenses 1,1 0,3 -69,0% - NS - NS
Deferred expenses over several years 5,7 3,2 -43,9% 15,6 >100% 15,2 -3,0%
Intangible assets 1 592,4 1 586,0 -0,4% 1 646,7 3,8% 1 676,9 1,8%
Goodwill 1 559,3 1 560,8 0,1% 1 565,3 0,3% 1 565,3 0,0%
Other intangible assets 33,1 25,2 -23,9% 81,4 >100% 111,6 37,1%
Tangible assets 198,1 187,9 -5,2% 179,1 -4,7% 175,8 -1,9%
Lands 12,4 12,4 0,0% 12,4 0,0% 12,4 0,0%
Constructions 41,0 10,2 -75,1% 13,3 30,5% 15,1 13,4%
Transport equipment 1,4 1,7 19,7% 1,1 -34,2% 0,9 -18,6%
Furniture, office equipment and various furnishings 121,2 110,7 -8,7% 94,6 -14,6% 92,5 -2,2%
Ongoing tangible assets 22,1 52,9 >100% 57,7 9,2% 54,9 -4,9%
Financial assets 59,7 1 121,0 >100% 969,5 -13,5% 992,7 2,4%
Fixed loans 0,2 0,2 -11,1% 125,3 >100% 115,5 -7,8%
Other financial receivables 16,0 1 047,4 >100% 773,5 -26,1% 793,7 2,6%
Securities 43,5 73,5 69,1% 70,7 -3,8% 83,5 18,1%
Investments allocated to insurance operations 12 031,1 12 326,4 2,5% 12 771,3 3,6% 13 179,1 3,2%
Real estate investments 2 465,2 2 428,6 -1,5% 2 830,5 16,5% 3 045,7 7,6%
Bonds and negotiable debt securities 2 154,7 2 217,0 2,9% 1 809,1 -18,4% 1 579,5 -12,7%
Shares 6 954,8 7 247,9 4,2% 7 284,1 0,5% 7 557,5 3,8%
Loans & similar 6,1 3,5 -42,9% 4,1 17,0% 4,0 -0,5%
Deposits on unavailable accounts 401,9 428,8 6,7% 842,9 96,6% 991,7 17,7%
Other investments 48,3 0,6 -98,7% 0,6 0,0% 0,6 0,0%
Share of assignees in technical provisions 1 284,6 1 187,7 -7,5% 1 088,0 -8,4% 1 074,1 -1,3%
Provisions for unearned premiums 133,0 99,1 -25,5% 61,3 -38,2% 109,4 78,5%
Provisions for claims payable 720,2 681,0 -5,4% 649,5 -4,6% 598,6 -7,8%
Mathematical Provisions 430,9 407,7 -5,4% 377,2 -7,5% 366,1 -2,9%
Current receivables 3 276,5 2 790,6 -14,8% 2 566,6 -8,0% 2 845,9 10,9%
Assignees and Accounts Receivable 153,1 225,3 47,1% 191,3 -15,1% 256,9 34,3%
Insured, intermediaries, transferors, insurers and accounts receivable
1 308,3 1 505,1 15,0% 1 266,8 -15,8% 1 556,9 22,9%
Staff receivables 5,6 8,9 59,0% 9,6 7,9% 9,8 1,7%
Tax receivables 138,7 189,3 36,5% 230,4 21,7% 169,8 -26,3%
Shareholders accounts receivables 919,2 0,0 NS 0,0 NS
Other receivables 133,6 229,3 71,6% 189,9 -17,2% 218,4 15,0%
Accruals 618,0 632,7 2,4% 678,5 7,2% 634,0 -6,5%
Short term securities (not assigned to insurance operations)
146,6 110,8 -24,4% 515,4 365,2% 499,7 -3,1%
Cash 101,5 161,1 58,7% 137,4 -14,7% 162,9 18,5%
Total assets 18 697,3 19 475,0 4,2% 19 889,7 2,1% 20 622,1 3,7%
Source: Saham Assurance.
Prospectus Summary Page 30
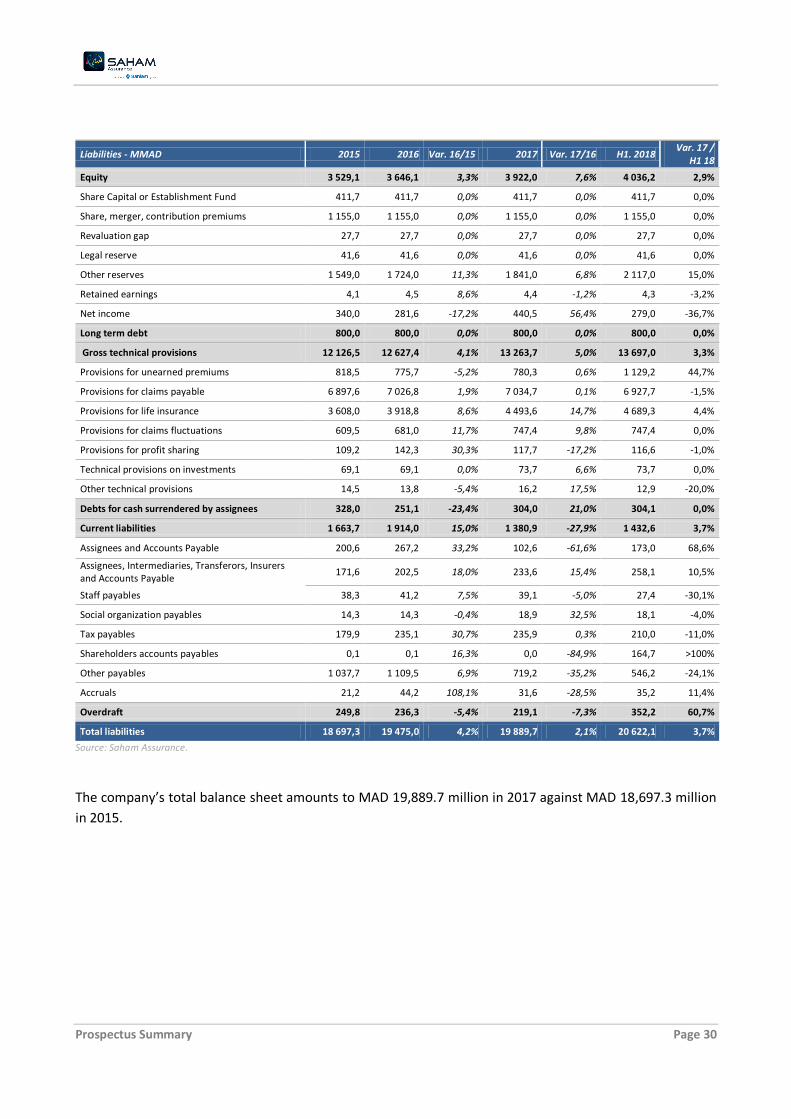
Liabilities - MMAD 2015 2016 Var. 16/15 2017 Var. 17/16 H1. 2018 Var. 17 /
H1 18
Equity 3 529,1 3 646,1 3,3% 3 922,0 7,6% 4 036,2 2,9%
Share Capital or Establishment Fund 411,7 411,7 0,0% 411,7 0,0% 411,7 0,0%
Share, merger, contribution premiums 1 155,0 1 155,0 0,0% 1 155,0 0,0% 1 155,0 0,0%
Revaluation gap 27,7 27,7 0,0% 27,7 0,0% 27,7 0,0%
Legal reserve 41,6 41,6 0,0% 41,6 0,0% 41,6 0,0%
Other reserves 1 549,0 1 724,0 11,3% 1 841,0 6,8% 2 117,0 15,0%
Retained earnings 4,1 4,5 8,6% 4,4 -1,2% 4,3 -3,2%
Net income 340,0 281,6 -17,2% 440,5 56,4% 279,0 -36,7%
Long term debt 800,0 800,0 0,0% 800,0 0,0% 800,0 0,0%
Gross technical provisions 12 126,5 12 627,4 4,1% 13 263,7 5,0% 13 697,0 3,3%
Provisions for unearned premiums 818,5 775,7 -5,2% 780,3 0,6% 1 129,2 44,7%
Provisions for claims payable 6 897,6 7 026,8 1,9% 7 034,7 0,1% 6 927,7 -1,5%
Provisions for life insurance 3 608,0 3 918,8 8,6% 4 493,6 14,7% 4 689,3 4,4%
Provisions for claims fluctuations 609,5 681,0 11,7% 747,4 9,8% 747,4 0,0%
Provisions for profit sharing 109,2 142,3 30,3% 117,7 -17,2% 116,6 -1,0%
Technical provisions on investments 69,1 69,1 0,0% 73,7 6,6% 73,7 0,0%
Other technical provisions 14,5 13,8 -5,4% 16,2 17,5% 12,9 -20,0%
Debts for cash surrendered by assignees 328,0 251,1 -23,4% 304,0 21,0% 304,1 0,0%
Current liabilities 1 663,7 1 914,0 15,0% 1 380,9 -27,9% 1 432,6 3,7%
Assignees and Accounts Payable 200,6 267,2 33,2% 102,6 -61,6% 173,0 68,6%
Assignees, Intermediaries, Transferors, Insurers and Accounts Payable
171,6 202,5 18,0% 233,6 15,4% 258,1 10,5%
Staff payables 38,3 41,2 7,5% 39,1 -5,0% 27,4 -30,1%
Social organization payables 14,3 14,3 -0,4% 18,9 32,5% 18,1 -4,0%
Tax payables 179,9 235,1 30,7% 235,9 0,3% 210,0 -11,0%
Shareholders accounts payables 0,1 0,1 16,3% 0,0 -84,9% 164,7 >100%
Other payables 1 037,7 1 109,5 6,9% 719,2 -35,2% 546,2 -24,1%
Accruals 21,2 44,2 108,1% 31,6 -28,5% 35,2 11,4%
Overdraft 249,8 236,3 -5,4% 219,1 -7,3% 352,2 60,7%
Total liabilities 18 697,3 19 475,0 4,2% 19 889,7 2,1% 20 622,1 3,7%
Source: Saham Assurance.
The company’s total balance sheet amounts to MAD 19,889.7 million in 2017 against MAD 18,697.3 million
in 2015.
Prospectus Summary Page 31
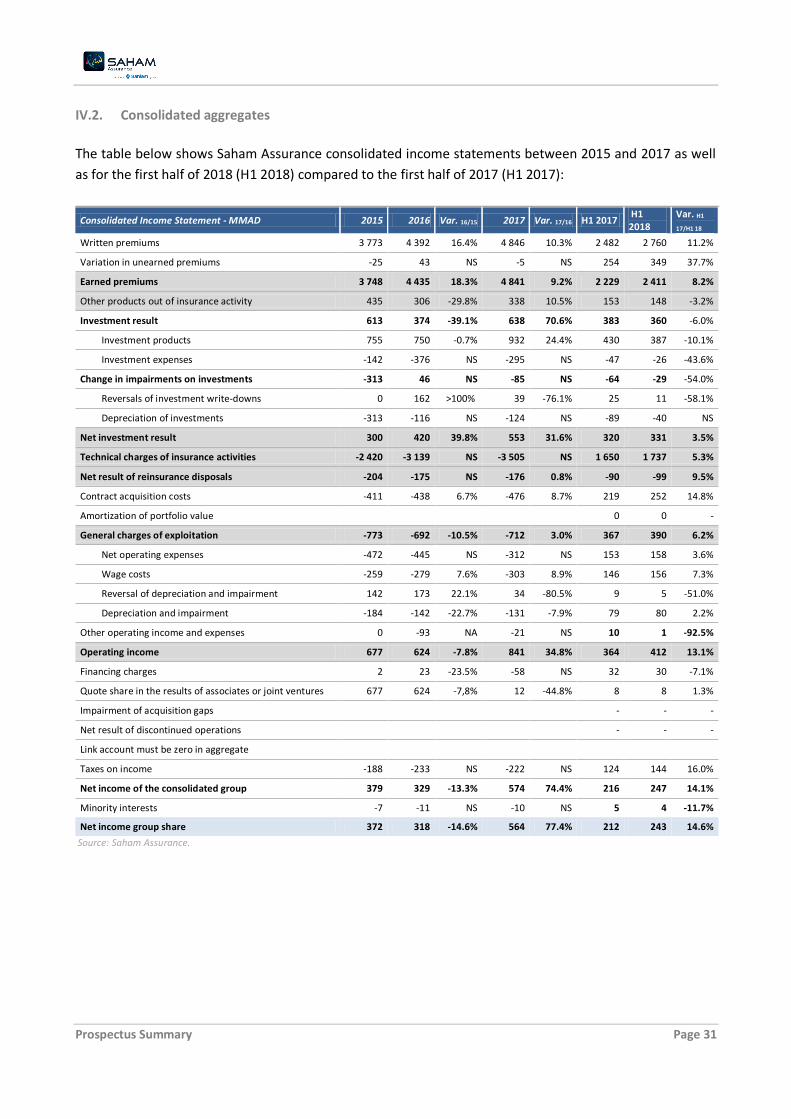
IV.2. Consolidated aggregates
The table below shows Saham Assurance consolidated income statements between 2015 and 2017 as well
as for the first half of 2018 (H1 2018) compared to the first half of 2017 (H1 2017):
Consolidated Income Statement - MMAD 2015 2016 Var. 16/15 2017 Var. 17/16 H1 2017 H1 2018
Var. H1
17/H1 18
Written premiums 3 773 4 392 16.4% 4 846 10.3% 2 482 2 760 11.2%
Variation in unearned premiums -25 43 NS -5 NS 254 349 37.7%
Earned premiums 3 748 4 435 18.3% 4 841 9.2% 2 229 2 411 8.2%
Other products out of insurance activity 435 306 -29.8% 338 10.5% 153 148 -3.2%
Investment result 613 374 -39.1% 638 70.6% 383 360 -6.0%
Investment products 755 750 -0.7% 932 24.4% 430 387 -10.1%
Investment expenses -142 -376 NS -295 NS -47 -26 -43.6%
Change in impairments on investments -313 46 NS -85 NS -64 -29 -54.0%
Reversals of investment write-downs 0 162 >100% 39 -76.1% 25 11 -58.1%
Depreciation of investments -313 -116 NS -124 NS -89 -40 NS
Net investment result 300 420 39.8% 553 31.6% 320 331 3.5%
Technical charges of insurance activities -2 420 -3 139 NS -3 505 NS 1 650 1 737 5.3%
Net result of reinsurance disposals -204 -175 NS -176 0.8% -90 -99 9.5%
Contract acquisition costs -411 -438 6.7% -476 8.7% 219 252 14.8%
Amortization of portfolio value 0 0 -
General charges of exploitation -773 -692 -10.5% -712 3.0% 367 390 6.2%
Net operating expenses -472 -445 NS -312 NS 153 158 3.6%
Wage costs -259 -279 7.6% -303 8.9% 146 156 7.3%
Reversal of depreciation and impairment 142 173 22.1% 34 -80.5% 9 5 -51.0%
Depreciation and impairment -184 -142 -22.7% -131 -7.9% 79 80 2.2%
Other operating income and expenses 0 -93 NA -21 NS 10 1 -92.5%
Operating income 677 624 -7.8% 841 34.8% 364 412 13.1%
Financing charges 2 23 -23.5% -58 NS 32 30 -7.1%
Quote share in the results of associates or joint ventures 677 624 -7,8% 12 -44.8% 8 8 1.3%
Impairment of acquisition gaps - - -
Net result of discontinued operations - - -
Link account must be zero in aggregate
Taxes on income -188 -233 NS -222 NS 124 144 16.0%
Net income of the consolidated group 379 329 -13.3% 574 74.4% 216 247 14.1%
Minority interests -7 -11 NS -10 NS 5 4 -11.7%
Net income group share 372 318 -14.6% 564 77.4% 212 243 14.6%
Source: Saham Assurance.
Prospectus Summary Page 32
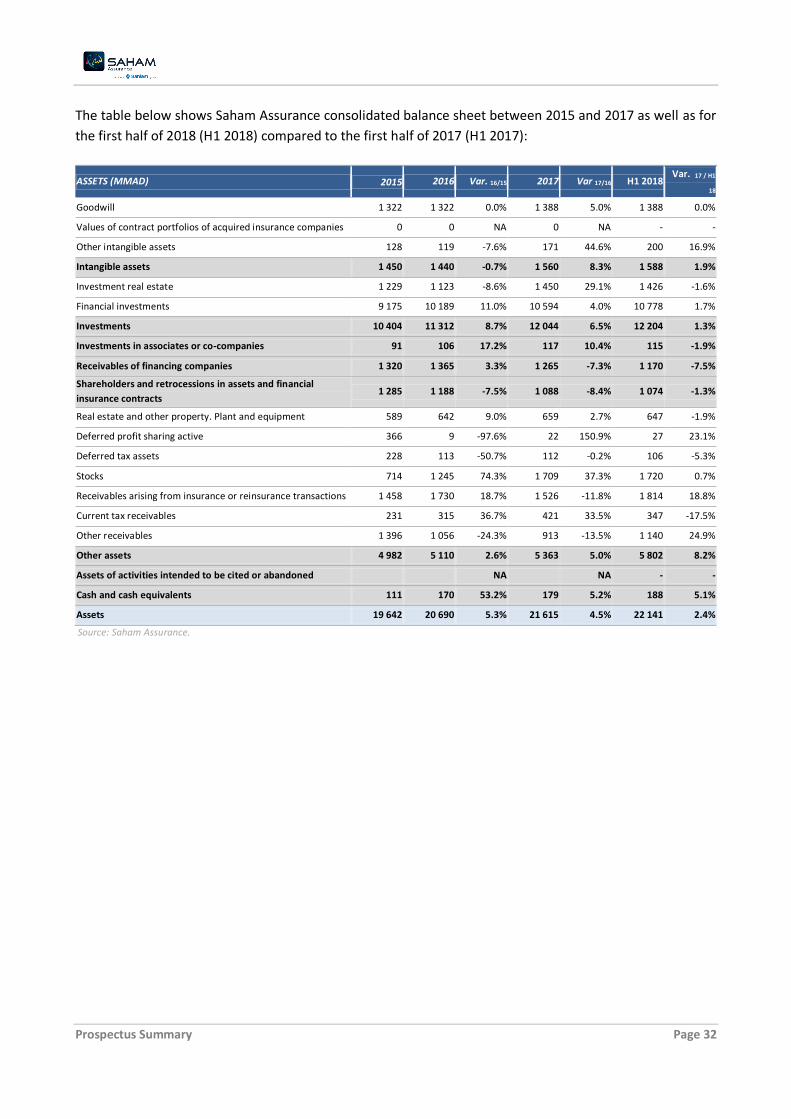
The table below shows Saham Assurance consolidated balance sheet between 2015 and 2017 as well as for
the first half of 2018 (H1 2018) compared to the first half of 2017 (H1 2017):
ASSETS (MMAD) 2015 2016 Var. 16/15 2017 Var 17/16 H1 2018 Var. 17 / H1
18
Goodwill 1 322 1 322 0.0% 1 388 5.0% 1 388 0.0%
Values of contract portfolios of acquired insurance companies 0 0 NA 0 NA - -
Other intangible assets 128 119 -7.6% 171 44.6% 200 16.9%
Intangible assets 1 450 1 440 -0.7% 1 560 8.3% 1 588 1.9%
Investment real estate 1 229 1 123 -8.6% 1 450 29.1% 1 426 -1.6%
Financial investments 9 175 10 189 11.0% 10 594 4.0% 10 778 1.7%
Investments 10 404 11 312 8.7% 12 044 6.5% 12 204 1.3%
Investments in associates or co-companies 91 106 17.2% 117 10.4% 115 -1.9%
Receivables of financing companies 1 320 1 365 3.3% 1 265 -7.3% 1 170 -7.5%
Shareholders and retrocessions in assets and financial
insurance contracts 1 285 1 188 -7.5% 1 088 -8.4% 1 074 -1.3%
Real estate and other property. Plant and equipment 589 642 9.0% 659 2.7% 647 -1.9%
Deferred profit sharing active 366 9 -97.6% 22 150.9% 27 23.1%
Deferred tax assets 228 113 -50.7% 112 -0.2% 106 -5.3%
Stocks 714 1 245 74.3% 1 709 37.3% 1 720 0.7%
Receivables arising from insurance or reinsurance transactions 1 458 1 730 18.7% 1 526 -11.8% 1 814 18.8%
Current tax receivables 231 315 36.7% 421 33.5% 347 -17.5%
Other receivables 1 396 1 056 -24.3% 913 -13.5% 1 140 24.9%
Other assets 4 982 5 110 2.6% 5 363 5.0% 5 802 8.2%
Assets of activities intended to be cited or abandoned NA NA - -
Cash and cash equivalents 111 170 53.2% 179 5.2% 188 5.1%
Assets 19 642 20 690 5.3% 21 615 4.5% 22 141 2.4%
Source: Saham Assurance.

Prospectus Summary Page 33
LIABILITIES (MMAD) 2015 2016 Var. 16/15 2017 Var. 17/16 H1 2018 Var. 17 / H1
18
Capital 412 412 0.0% 412 0.0% 412 0.0%
Issuance and merger premiums 1 170 1 170 0.0% 1 170 0.0% 1 170 0.0%
Consolidated reserves 1 250 1 711 36.9% 2 081 21.6% 2 456 18.0%
Conversion differences 0 NA 0 NA - -
Net income-group share 372 318 -14.6% 564 77.4% 243 -57.0%
Shareholders 'equity - group share 3 204 3 610 12.7% 4 226 17.1% 4 280 1.3%
Interest without control 97 101 4.1% 99 -2.1% 91 -7.1%
Shareholders 'equity 3 300 3 711 12.4% 4 325 16.5% 4 372 1.1%
Provisions for risks and charges 94 92 -2.9% 102 10.9% 103 1.3%
Financial debts 616 635 3.0% 654 3.1% 707 8.1%
Long-term liabilities 710 726 2.2% 756 4.1% 810 7.2%
Technical liabilities relating to insurance contracts 11 474 11 877 3.5% 12 443 4.8% 12 876 3.5%
Technical liabilities relating to investment contracts 0 0 NA 0 NA
- -
Deferred profit sharing 219 46 -78.9% 99 114.5% 76 -23.4%
Technical liabilities of insurance companies 11 693 11 924 2.0% 12 542 5.2% 12 952 3.3%
Deferred tax liabilities 502 533 6.1% 751 41.0% 731 -2.6%
Debts arising from insurance or reinsurance transactions 737 749 1.7% 741 -1.2% 786 6.1%
Current tax debts and other tax debts 273 303 11.0% 309 1.9% 268 -13.1%
Other debts 1 133 1 451 28.1% 950 -34.6% 913 -3.8%
Other liabilities 2 645 3 036 14.8% 2 750 -9.4% 2 698 -1.9%
Debts of financing companies 1 042 1 052 1.0% 1 018 -3.3% 948 -6.9%
Short-term financial debts 253 241 -4.6% 225 -6.6% 361 60.4%
Liabilities of activities to be cited or abandoned - 0 NA 0 NA
- -
Liabilities 19 642 20 690 5.3% 21 615 4.50% 22 141 2.4%
Source: Saham Assurance.
Saham Assurance Consolidated written premiums amouts to MAD 4,846 millions in 2017, versus MAD 3,773
millions in 2015.
Saham Assurance consolidated net income amounts to MAD 574 MMAD in 2017 versus MAD 379 million in
2015.
The company’s total balance sheet amounts to MAD 21,615 million in 2017 against MAD 19,642 million in
2015.

Prospectus Summary Page 34
PART IV. SAHAM ASSURANCE RISK FACTORS I. Market risk
Market risk is defined as any market event that may have a negative impact on the valuation or the
investment income allocated to the insurance operations.
The main market risks that SAHAM ASSURANCE could face are:
Interest rate risk: The bonds price evolution is inversely correlated with interest rates evolution. Lower
interest rates result in higher bond prices and vice versa. The level of the interest rate also determines the
conditions for reinvestment of the coupons (principal + interests) received.
Also, an increase in interest that would impact the market value of bond investments and liabilities could
adversely affect the company's coverage margin.
The risk of a decline in the stock markets: the decline in the stock market could have a negative impact on
the company's financial margin due to the accounting of provisions
Risk on real estate assets: exposure to the real estate markets makes it possible to diversify portfolios, protect
against inflation and the volatility of financial market returns, and also have quality operating assets.
Real estate investment exposes the company to three types of risk: the risk of provision recording in the
event of a decline in valuation, the risk of non-recovery of rents, the risk of vacancy, the risk of exceeding
investment budgets and the risk of pace of selling units produces.
Credit Risk: is defined as the potential default of a counterparty to honor its commitments, it is the inability
to repay a bond principal or interests, or the non-payment of a guaranteed performance in case of a specific
investment mandate.
For several years, SAHAM ASSURANCE has initiated a risk management system enabling it to measure and
reduce market risk impacts.
Asset/liability management system that analyzes the asset / liability adequacy under different market
situations. Indeed, the asset / liability adequacy is simulated according to several shock scenarios, which
makes it possible to verify the company’s financing ratio evolution and its resilience in the event of possible
shocks.
The purpose of these analyses is also to develop the appropriate strategic allocations between risky assets
and non-risky assets, so as to minimize the risk associated with an Asset / Liability mismatch, taking into
account constraints related to liquidity and profitability required for policyholders and shareholders.
Thus, SAHAM ASSURANCE holds a diversified portfolio weighted mainly in monetary and bond assets.
The company relies on its subsidiary SAHAM ASSET MANAGEMENT for a dynamic portfolio management and
an approach adapted to the nature of these activities which takes into account the recommendations made
by the ALM.
The subsidiary constantly study the macroeconomic situation, the stock market indicators, as well as the
bond market indicators, in order to make recommendations on the right positioning in terms of assets but
also in terms of management approach.

Prospectus Summary Page 35
The subsidiary also has a team of dedicated analysts who work on the valuation of listed companies and on
credit analysis. As a result, the company has real-time visibility into the risks inherent to issuers, enabling it
to regularly monitor issuer concentration control rules.
In terms of real estate management, SAHAM ASSURANCE is exposed by more than 75% to Rabat / Casablanca
area. This area is the least affected by the crisis and the one offering the most important demand and yield
and therefore less exposed to prices and valuations decrease. In addition, the assets for professional rental
are located in strategic locations, and meet the needs of the professional market.
The real estate assets are leased to well-Known and diversified clients, the lease contracts are signed mainly
with companies (corporate clients), offering a better return and limiting the risk of non-collectability of rents.
Rigorous and professional facility management allows to retain tenants and reduce the risk of vacancy.
An annual revaluation plan makes it possible to follow the evolution of the stock market values and to
appreciate it at its fair value.
II. COUNTERPARTY RISK
Counterparty risk is the risk of default of a borrower who can no longer fully repay its debt.
Insurance companies are exposed to counterparty risk in the event of doubtful clients, a failure of an
insurance intermediary or in the event of a reinsurer default.
SAHAM ASSURANCE has several recovering entities (Front Office, Back Office and Litigation) to control the
counterparty and insurance intermediary risks.
SAHAM ASSURANCE is insured with leading reinsurers, thereby limiting the risk of reinsurers default.
III. LIQUIDITY RISK
Liquidity risk arises from the short-term inability of insurance companies to meet the cash requirements
imposed by its current operations (claims settlements, investment operations, etc.).
Liquidity risk concerns both assets and liabilities as well as any interactions between them.
SAHAM ASSURANCE constantly ensures that it has sufficient liquidity to meet all its commitments in the short
term as well as in the long term.
Thus, SAHAM ASSURANCE's investments are correctly distributed between highly liquid and illiquid assets.
Cash monitoring is done on a daily basis, monthly as well as in the annual cash flows forecasts.
IV. UNDERWITING RISK/ CLAIM EXPERIENCES INCREASE :
Underwriting risk is related to errors in the acceptance, pricing or reinsurance coverage of a risk.

Prospectus Summary Page 36
The risk of an increase in claims is related to the realization of risks covered by the insurer in an unusual
proportion. It can also relate to the occurrence of a major risk that is very unlikely to occur.
SAHAM ASSURANCE continually monitors these risks through a selection of underwriting acceptances thanks
to a team of experienced underwriters, powerful underwriting tools including underwriting prices and guides
and a risk engineer’s team.
In addition, SAHAM ASSURANCE has a Portfolio Monitoring entity in charge of detecting loss-making cases
and underwriting and management conditions that could compromise the company's portfolio quality and
have a negative impact on its underwriting results. This entity is also responsible for analyzing and proposing
recovery actions for detected loss-making cases.
V. OPERATIONAL RISKS
Operational risk is defined as the risk of a loss resulting from inadequate or erroneous internal processes, or
from staff, information systems, or external events.
Operational risk includes legal risks and excludes risks arising from strategic risks and reputational risks.
As part of operational risk management, SAHAM ASSURANCE has a global internal control system that is
structured into three levels of controls:
1st level control of the operational teams and their hierarchy: these are controls integrated into the
operations and controls carried out later by the operational managers.
2nd level control: this level of control is provided by internal controllers hierarchically and operationally
attached to the internal control entity. These are retrospective controls carried out by sampling and
according to a predefined periodicity.
3rd level control: this level of control is provided by Internal Audit, which reports hierarchically to General
Management and operationally to the Audit Committee. The main mission of the Internal Audit function
is to evaluate the internal control system as a whole and to ensure its effective implementation.
In addition, SAHAM ASSURANCE has other entities that participate in the control system (for example:
General Inspection, Customer Service and Quality, Portfolio Supervision, Actuarial, etc.).
The internal control entity is in charge of Risk Management whose mission is to identify, evaluate and control
the risks associated with the company's activities and processes.
On the other hand, the "Organization" entity ensures the formalization and optimization of the company's
processes and related control activities.
In terms of information system security risks, SAHAM ASSURANCE has set up a Comprehensive IT Support
Plan and a Business Continuity Plan, including a backup site and a fallback site.
The management of external fraud risks is a priority for SAHAM ASSURANCE, which launched in 2018 an
ambitious project to fight against fraud.
VI. OTHER MATERIAL RISKS

Prospectus Summary Page 37
STRATEGIC RISK
Strategic risk is a risk that has a negative impact on the company's results or equity as a result of a failure to
consider sectorial changes or inappropriate managerial decisions.
SAHAM ASSURANCE has governance entities to anticipate and mitigate this risk.
REPUTATION RISK
Reputational risk is the risk that an internal or external event negatively influences the perception and
confidence of the company various stakeholders, or following a gap between the expectations of its
stakeholders and attitudes, actions or inactions of the company.
SAHAM ASSURANCE proactively manages reputational risks to avoid and minimize negative elements that
have an impact on its reputation and establishes trust-based relationship with its various stakeholders.
REGULATORY RISK
The regulation of the insurance sector tends to provide new measures to ensure the development and sustainability of the sector. In recent years, regulations have also been strengthened in terms of the laws protecting insured people with regard to the confidentiality of personal data as well as free competition and the consumer rights. Other regulatory measures have been adopted to strengthen the anti-money laundering and financing terrorism. The Sector was submitted in 2018, along with the financial sector to the US FATCA law and a transitional period was granted to all companies to comply. Some of these regulatory measures may be coercive for the profitability of all insurers such as: the adoption of new life tables, the transfer of certain contracts initially covered by insurers (AMO) to public entities (CNSS or others) and the repeal of certain mandatory insurance. The implementation of risk-based solvency will have an impact on companies' own funds as well as on risk governance devices. This reform principle is to take into account other risks inherent to the insurance business, such as market risk, reinsurer counterparty risk, default risk or operational risks. So far, only the underwriting risk has been taken into account.
Discussions between the operators and the regulator are on the right track. Impact studies are carried out
by the regulator individually with each company in order to make the necessary adjustments to the
quantitative model to take into account the specificities of the Moroccan sector, both on the technical and
the financial sides.
Continued compliance with regulatory requirements and potential commitments to the regulator could have
significant consequences on the Company, such as the deterioration of its net income or financial situation,
as well as an increase in required regulatory capital.
Prospectus Summary Page 38
To Face the Moroccan regulatory environment quick evolution, the company has since 2009 a compliance
entity that deals with all aspects related to actual or potential regulatory changes through impact studies,
which allow the company to better anticipate these changes and even contain their impacts.
TAX RISK
Changes in tax legislation may have adverse effects on some of the company's products by reducing their attractiveness, including those receiving favorable tax treatment, or on the company's tax burden. In general, SAHAM Assurance remains vigilant regarding future interpretations or changes in the tax systems in which it operates, which could lead to an increase in tax expenditures, additional compliance costs or have a negative impact on the company’s business, cash and net result. COMPETITION RISK
Saham Assurance offers a wide range of products (non-life insurance, health, life, savings, retirement etc.). The company is therefore in direct competition not only with Moroccan insurers but also with private health insurers, welfare institutions and even commercial or investment banks. These different operators are very often subject to different regulations, with multiple distribution channels and sometimes offering alternative or similar products at more competitive rates than those of the company.
In addition to the intense competition, the Moroccan insurance market have witnessed the arrival of various disruptive trends observed worldwide: consumer behavior changes, consumers demanding and paying more attention to quality and prices and the rise of digital. Companies will also face new types of risks to be insured, some of which have already been considered and will have the appropriate legal framework, including the risk of natural disasters. At the same time, the legal framework of Takaful is being adopted. In order to face this demanding environment, SAHAM Assurance has implemented a global transformation project of the Company, through the implementation of new production tools, the digitization of work processes and the improvement of the customer experience. Created for this purpose in 2017, the Digital Factory has enabled Saham Assurance to stand out through the launch of a significant number of innovations (the mobile application evolution, the digitalization of many processes, including the Check Auto Express, which deals with the settlement of small automobile claims, and the creation of a single platform hosting all customers claims related to assistance and reporting of automobile claims ...).
The commitment of proximity taken by the Company is also reflected in covering all the Moroccan cities and many rural communes where Saham Assurance stands out by its strong presence.
However, despite this strong position, competitive pressure could lead Saham Assurance to adjust some of its products and services prices, which could affect its ability to maintain/ improve its profitability. ACTUARIAL RISK
Actuarial risk is the risk related to technical provisions computation inaccuracy. As part of its activities, SAHAM Assurance, in accordance with the accounting and regulatory obligations, establishes technical provisions, including provisions for claims and mathematical provisions related to life insurance operations. Provisions represent a technical valuation of liabilities corresponding to a given date, they allow to take into account the uncertain nature of the liability arising from insurance activity:

Prospectus Summary Page 39
Claim provisions represent an estimate of probable future liabilities, including both reported claims and
late claims (occurred but unreported claims). These estimates are made using several actuarial projection techniques and take into account all endogenous & exogenous parameters recognized and known at the reporting date and which may have a positive or negative impact on future commitments.
For mathematical provisions related to life insurance operations, the computation is done separately for
each contract according to the regulatory methods, without resorting to any methods other than the use of the statutory life tables (TD 88 – 90 et la TV 88 – 90). These mathematical provisions are therefore estimated using prudent actuarial methods taking into account the Company's future commitments in accordance with the conditions established for each current contract (guaranteed benefits, including repurchase values, guaranteed minimum rate, options offered to the insured, etc.).
Provisions are, however, subject to change because of the number of variables influencing their determination. These can be of various natures such as the intrinsic evolution of claims, regulatory changes, jurisprudential trends, changes in the financial markets. Some of these elements may be difficult to apprehend, especially on a prospective basis. Therefore, the real expenses may differ significantly from the initially registered gross reserves. The difference between expenses and provisions can have an impact on the net income. To face that, Saham Assurance has an Actuarial entity that regularly and closely monitors the claims by branch and product so that it can adjust the level of technical provisions accordingly, if necessary.
In addition, the Actuarial entity also has the following tasks:
Assess the sufficiency and quality of the data used in the technical provisions computation. o Regular analyses and projections of the technical provisions levels (follow-up of the average cost,
frequency, files registering and revision method, etc.) and propose adequate corrective actions. o Regular analysis and adjustment of opening schedules by branch o Quantification of the impact of a new law or modification of the regulations on the company's
commitments. Review and adjust product prices regularly and closely monitor their profitability levels. Follow the realization of these actions.
In addition, and in order to ensure that the technical provisions are sufficient, Saham Assurance mandates annually independent actuaries to examine the regulatory nature of the provisions and assess their economic level.
Finally, the regulator also carries out regular checks to ensure compliance with the regulations and the quality of the provisioning. RISK RELATED TO BANK-INSURANCE In 2016, Saham Assurance has signed a partnership with Crédit du Maroc and Crédit du Maroc Assurance for the distribution of life and non-life insurance products, for a period of 10 years.
Prospectus Summary Page 40
The premiums collected and related to this partnership for life insurance represent a significant part of Saham Assurance "Life" branch turnover, but contributes slightly to the Company’s overall net income as of December 31, 2017. As a result, the termination of the partnership with Crédit du Maroc and Crédit du Maroc Assurance would have little impact on the profitability of Saham Assurance, given the importance of the profit-sharing paid to life insured. Also, if the level of claims accelerates, which would automatically lead to a decrease in the mathematical provisions, Saham Assurance could then apply the mechanism provided for by Article 50-4 of Decree 1548-05 of 10 October 2005 which authorizes the withdrawal of assigned securities in the case of technical provisions decrease. As a result, the impact of the termination on the company's cash flow remains limited.
WARNING
The abovementioned information only represent a part of the prospectus approved by the Moroccan
Capital Market Authority (AMMC), under the reference VI/EM/038/2018 on 27/12/2018.
The AMMC advises the reading of the full prospectus made available for the public in French.