Embed Size (px)
Citation preview

Protecting Public Education
Property Tax Abatements,Tax Increment Financing,and Funding for Schools
From Tax Giveaways toCorporations

Protecting Public Education
NEA RESEARCHWORKING PAPER
January 2003
Property Tax Abatements,Tax Increment Financing,and Funding for Schools
From Tax Giveaways toCorporations

The National Education Association is the nation’s largest professional employee
organization, representing 2.7 million elementary and secondary teachers, high-
er education faculty, education support professionals, school administrators,
retired educators, and students preparing to become teachers.
A limited supply of complimentary copies of this publication are available from
NEA Research for state and local associations, and UniServ staff by calling 202-
822-7400. Additional copies may be purchased from the NEA Professional
Library, Distribution Center, P.O. Box 2035, Annapolis Junction, MD 20701-
2035. Telephone 800-229-4200, for price information. This publication may also
be downloaded from www.nea.org.
Reproduction: No part of this report may be reproduced in any form without
permission from NEA Research, except by NEA-affiliated associations or NEA
members. Any reproduction of the report materials must include the usual cred-
it line and the copyright notice. Address communications to Editor, NEA
Research, 1201 16th St., N.W., Washington D.C. 20036-3290.
Cover and title page illustration © John MacDonald.
Published January 2003, second printing March 2003.
Copyright © 2003 by the
National Education Association
All Rights Reserved
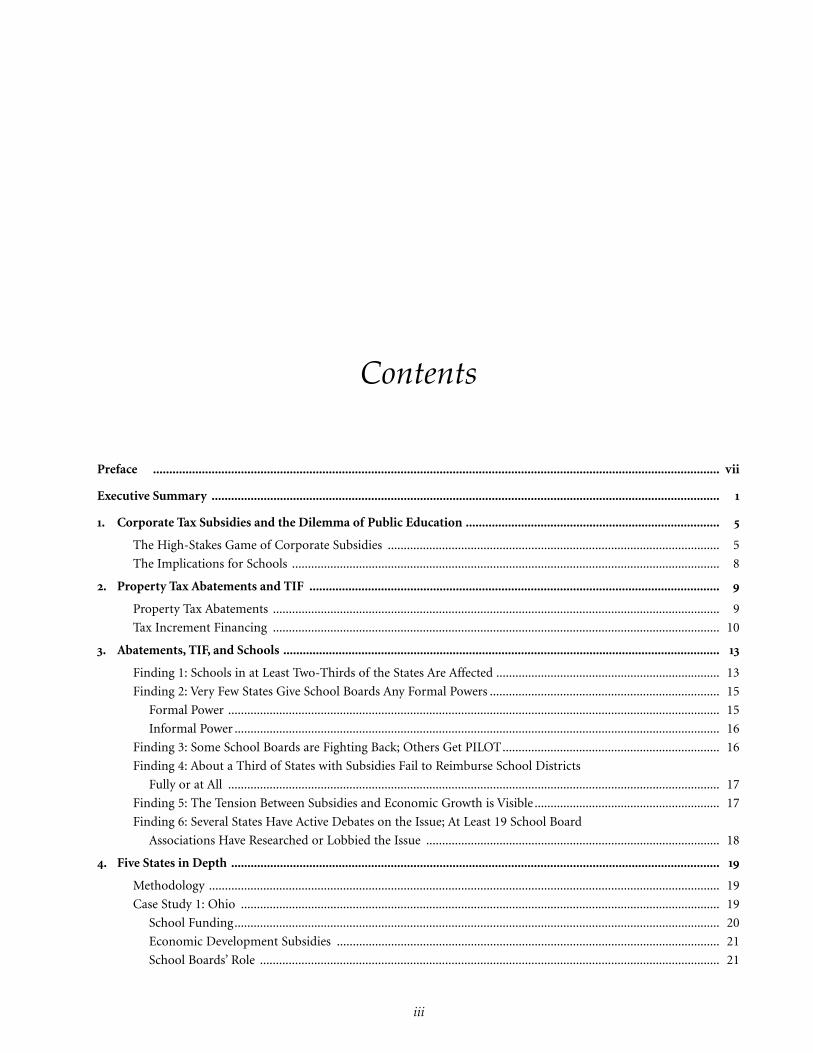
Preface .............................................................................................................................................................................. vii
Executive Summary ............................................................................................................................................................ 1
1. Corporate Tax Subsidies and the Dilemma of Public Education .............................................................................. 5
The High-Stakes Game of Corporate Subsidies ........................................................................................................ 5
The Implications for Schools ...................................................................................................................................... 8
2. Property Tax Abatements and TIF .............................................................................................................................. 9
Property Tax Abatements ............................................................................................................................................ 9
Tax Increment Financing ............................................................................................................................................ 10
3. Abatements, TIF, and Schools ...................................................................................................................................... 13
Finding 1: Schools in at Least Two-Thirds of the States Are Affected ...................................................................... 13
Finding 2: Very Few States Give School Boards Any Formal Powers ........................................................................ 15
Formal Power .......................................................................................................................................................... 15
Informal Power ........................................................................................................................................................ 16
Finding 3: Some School Boards are Fighting Back; Others Get PILOT.................................................................... 16
Finding 4: About a Third of States with Subsidies Fail to Reimburse School Districts
Fully or at All .......................................................................................................................................................... 17
Finding 5: The Tension Between Subsidies and Economic Growth is Visible .......................................................... 17
Finding 6: Several States Have Active Debates on the Issue; At Least 19 School Board
Associations Have Researched or Lobbied the Issue ............................................................................................ 18
4. Five States in Depth ...................................................................................................................................................... 19
Methodology ................................................................................................................................................................ 19
Case Study 1: Ohio ...................................................................................................................................................... 19
School Funding........................................................................................................................................................ 20
Economic Development Subsidies ........................................................................................................................ 21
School Boards’ Role ................................................................................................................................................ 21
Contents
iii

iv Protecting Public Education
Local Impact ............................................................................................................................................................ 21
State Impact ............................................................................................................................................................ 22
State Reimbursement .............................................................................................................................................. 22
Local Personal Income Tax Reimbursement.......................................................................................................... 22
Reimbursement by Companies .............................................................................................................................. 22
Case Study 2: Florida ........................................................................................................................................................ 22
Local Economic Development Subsidies .............................................................................................................. 22
State Economic Development Subsidies ................................................................................................................ 23
Case Study 3: Minnesota .................................................................................................................................................. 23
Current School Funding.......................................................................................................................................... 24
Economic Development Subsidies ........................................................................................................................ 25
School Board Role .................................................................................................................................................. 25
State Impact ............................................................................................................................................................ 25
The Future of TIF in Minnesota ............................................................................................................................ 25
Case Study 4: Montana...................................................................................................................................................... 26
School Funding........................................................................................................................................................ 26
Economic Development Subsidies ........................................................................................................................ 27
School Board Role .................................................................................................................................................. 27
Impact of Subsidies on School Revenues .............................................................................................................. 27
State Reimbursement .............................................................................................................................................. 27
Case Study 5: Texas............................................................................................................................................................ 28
School Boards’ Role ................................................................................................................................................ 28
State Reimbursement .............................................................................................................................................. 29
Impact on Local and State Budgets ........................................................................................................................ 29
5. Other Subsidies and Their Effect on State Revenues for Schools ............................................................................ 31
6. Conclusion .................................................................................................................................................................... 35
Shield School Revenues from Subsidies ...................................................................................................................... 36
Give School Boards Authority in Subsidy Decisions.................................................................................................. 36
Improve Disclosure of Subsidies ................................................................................................................................ 36
Appendix A: Research Methodology and Scope ................................................................................................................ 37
Literature Search................................................................................................................................................................ 37
Statute Review.................................................................................................................................................................... 37
Survey of State School Board Associations ...................................................................................................................... 37
Case Studies ...................................................................................................................................................................... 37
Appendix B: State Funding Formulas and Local Property Tax Subsidies ...................................................................... 39
Local Funding .................................................................................................................................................................... 39
State Funding .................................................................................................................................................................... 39
Reimbursement against Subsidies .................................................................................................................................... 41
Appendix C: Organizations Surveyed ................................................................................................................................ 43
Appendix D: Roles of School Boards in Awarding Property Tax Abatements ................................................................ 44
Appendix E. Roles of School Boards in Tax Increment Financing .................................................................................. 46
Appendix F. School Board Opposition to Abatements, TIF ............................................................................................ 48
Appendix G. Can School Boards Negotiate a Payment in Lieu of Tax (PILOT)? .......................................................... 49
Contents v
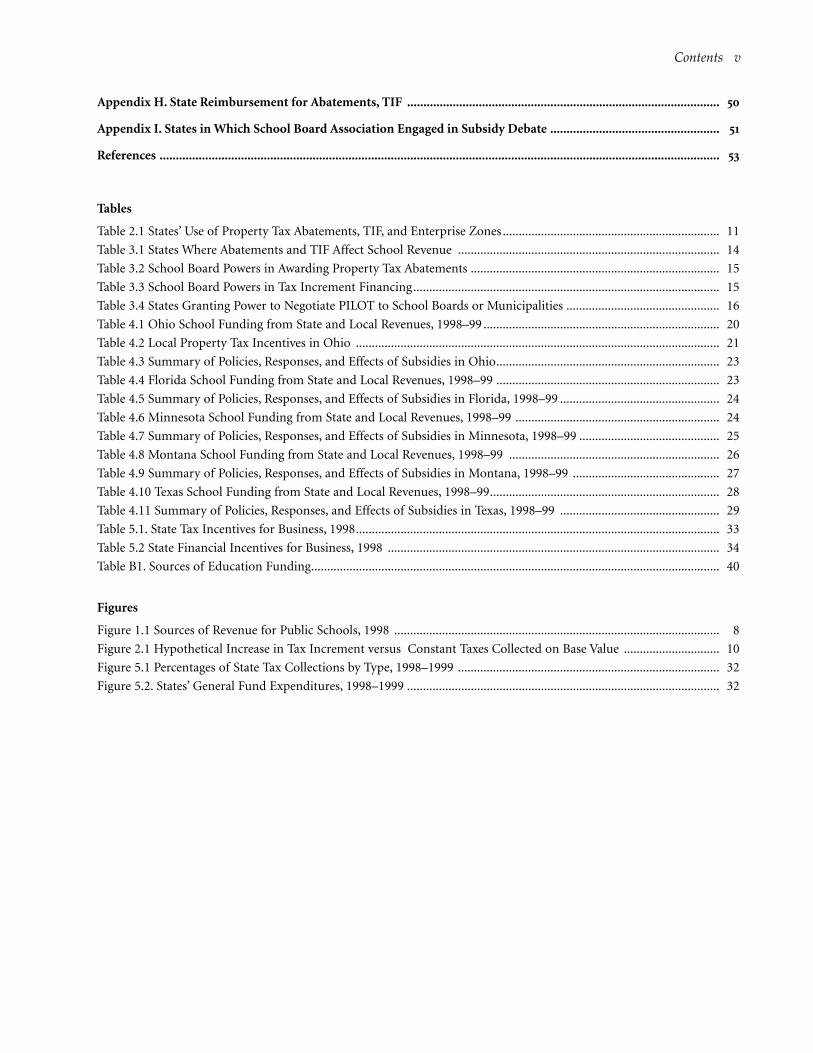
Appendix H. State Reimbursement for Abatements, TIF ................................................................................................ 50
Appendix I. States in Which School Board Association Engaged in Subsidy Debate .................................................... 51
References ............................................................................................................................................................................ 53
Tables
Table 2.1 States’ Use of Property Tax Abatements, TIF, and Enterprise Zones .................................................................... 11
Table 3.1 States Where Abatements and TIF Affect School Revenue .................................................................................. 14
Table 3.2 School Board Powers in Awarding Property Tax Abatements .............................................................................. 15
Table 3.3 School Board Powers in Tax Increment Financing................................................................................................ 15
Table 3.4 States Granting Power to Negotiate PILOT to School Boards or Municipalities ................................................ 16
Table 4.1 Ohio School Funding from State and Local Revenues, 1998–99 .......................................................................... 20
Table 4.2 Local Property Tax Incentives in Ohio .................................................................................................................. 21
Table 4.3 Summary of Policies, Responses, and Effects of Subsidies in Ohio...................................................................... 23
Table 4.4 Florida School Funding from State and Local Revenues, 1998–99 ...................................................................... 23
Table 4.5 Summary of Policies, Responses, and Effects of Subsidies in Florida, 1998–99 .................................................. 24
Table 4.6 Minnesota School Funding from State and Local Revenues, 1998–99 ................................................................ 24
Table 4.7 Summary of Policies, Responses, and Effects of Subsidies in Minnesota, 1998–99 ............................................ 25
Table 4.8 Montana School Funding from State and Local Revenues, 1998–99 .................................................................. 26
Table 4.9 Summary of Policies, Responses, and Effects of Subsidies in Montana, 1998–99 .............................................. 27
Table 4.10 Texas School Funding from State and Local Revenues, 1998–99........................................................................ 28
Table 4.11 Summary of Policies, Responses, and Effects of Subsidies in Texas, 1998–99 .................................................. 29
Table 5.1. State Tax Incentives for Business, 1998.................................................................................................................. 33
Table 5.2 State Financial Incentives for Business, 1998 ........................................................................................................ 34
Table B1. Sources of Education Funding................................................................................................................................ 40
Figures
Figure 1.1 Sources of Revenue for Public Schools, 1998 ...................................................................................................... 8
Figure 2.1 Hypothetical Increase in Tax Increment versus Constant Taxes Collected on Base Value .............................. 10
Figure 5.1 Percentages of State Tax Collections by Type, 1998–1999 .................................................................................. 32
Figure 5.2. States’ General Fund Expenditures, 1998–1999 .................................................................................................. 32
NEA Research commissioned this study by Good
Jobs First, a project of the Institute for Taxation
and Economic Policy. Like these nonprofit, non-
partisan research groups, the NEA has been concerned for
some time about state fiscal policies and has sought to
advise states on ways to protect and enhance funding for
quality education. NEA Research has long maintained
that quality education requires comprehensive and well-
coordinated tax and economic policies at state and local
levels. An equitable and adequate funding system for pub-
lic education can hardly flourish when state and local tax
structures become more regressive and fall into serious
deficit; school systems cannot function effectively when
revenues earmarked for modernizing school buildings are
instead diverted to corporate property tax abatements and
other subsidies.
This study is part of a larger NEA Research effort to
enhance education advocates’ capacity to monitor the
trends in state fiscal policies and in the equity and ade-
quacy of school finance. In this larger effort, NEA
Research has been developing several databases with easy-
to-use map-based interfaces to facilitate research at the
national and state levels. These databases—available or
soon to be available to NEA state affiliates through the
Association’s Intranet, Connect (with highlights on the
NEA’s Internet site, nea.org)—include the following:
• State Fiscal Profiles. These include information on
state fiscal conditions and structural deficits. (Now
accessible on Connect.)
• State Equity Litigation. This compilation comprises
summaries of lawsuits and court decisions in the states
that bear on the equity and adequacy of school fund-
ing across districts. (Now accessible on Connect.)
• Rankings & Estimates. This Intranet tool includes
current-year and long-term trend data on education
revenues, expenditures, teacher salaries, enrollment,
and other school statistics from the NEA’s now-classic
publication of the same name. (Accessible on Connectin late 2003.)
NEA Research is also developing several new databas-
es, including one that would help individual states meas-
ure the gap between current and adequate levels of fund-
ing and one that assembles and facilitates access to state-
level indicators of educational excellence. In addition to
collecting and disseminating data, the department also
continues to explore policy issues and directions for
reform that emerge from research. Toward that end, NEA
Research has investigated the deepening structural deficits
in many states, the funding needed to modernize schools,
the impact of deferring taxation of Internet commerce,
Preface
vii
viii Protecting Public Education
and the effectiveness and equity of different types of tax-
ation in raising funding for education.
The present study focuses on an important aspect of
education funding—property taxes and the policies that
shape them. Local jurisdictions raise 45 percent of total
U.S. funding for K–12 education, and local property taxes
alone account for 29 percent of the U.S. total. The contin-
uing reliance of public education on these local resources
makes it vital not merely to observe events but also to
understand and respond to threats to the flows of this
funding to the schools. The NEA supports reasonable,
equitable, and well-planned taxation that keeps public
services healthy and available to the citizenry. That does-
n’t necessarily mean raising taxes or opposing all tax cuts.
The point is that in fiscal matters, passivity and impulsive
reactions alike can harm education. California, for exam-
ple, fell from front-runner to the back of the pack in lev-
els of per student funding when Proposition 13 slashed
property taxes without protecting education.
The present report probes state and local governments’
increasing support of corporate property owners through
grants of long-term property tax abatements and diver-
sion of property tax revenues for tax increment financing
(TIF). Few would debate the logic of using public financ-
ing as a tool of development in some cases—especially if
was demonstrably effective in rehabilitating distressed
areas in the nation’s cities, providing affordable housing,
creating meaningful and durable employment opportuni-
ties, and jump-starting self-financing renewal. This
report, drawing on the available research literature and its
own survey of the states, casts doubt on whether most
subsidies for corporate property tax abatements and TIF
meet such criteria. Instead, the report suggests that over
the last 25 years, corporations have more often used these
subsidies as quiet conduits for diverting public revenue to
private benefit.
The problem has remained unrecognized and the con-
troversy low key partly because the subsidies are tax
expenditures (i.e., revenue not collected or revenue
diverted) rather than outright budget allocations. In addi-
tion, an exact dollar accounting is difficult to tease from
the records of the myriad jurisdictions that give out the
subsidies. Reasonable estimates show, however, that the
amounts—perhaps some $50 billion per year—are far
from trivial. And despite the enormous injections of pub-
lic funding they have received, subsidized corporate devel-
opment schemes have not really delivered on their prom-
ises of public benefits. Too often, these poorly monitored
subsidies have gone to low-density industrial parks;
tourist, convention, and shopping destinations; and other
enterprises that may not really need special public sup-
port, do not create long-term jobs with decent wages, and
contribute little to community infrastructures as a whole.
Moreover, paying businesses to shift their operations from
one location to another or even just to stay put—as has
happened most visibly with the financing of some sports
stadiums—is likely to offer no net benefit for the econo-
my as a whole. What one area may gain, another may lose.
That is poor policy at any level.
Much of the fact-finding and analysis of the effects of
property tax subsidies must focus on the local level.
Although state governments have the power to authorize
property tax abatements and TIF, city and local govern-
ments are the ones that issue them. The amounts, condi-
tions, and effects of these subsidies differ widely between
jurisdictions. A very few states explicitly protect all educa-
tion funding from the impacts of these subsidies. Others
compensate school districts in part, and many that do so
are becoming painfully aware of the accumulating burden
this places on state budgets. Yet they also know what fail-
ing to fill this gap would do to local public services.
In addition to outlining the status of tax subsidies
across the country, this report details conditions in five
case-study states: Ohio, Florida, Minnesota, Montana, and
Texas. The NEA and NEA Research seek feedback from
state and local governments as well as from NEA affiliates,
educators, and the public regarding the extent and opera-
tion of local tax subsidies that affect education. We hope
that together we can develop a more complete picture of
the facts and share our thoughts on various approaches to
the issue.
In the meantime, the study suggests that educators
and citizens who are knowledgeable about development
subsidies can help bring the facts to light and make their
effects on education more visible. As the front-line work-
ers who see the immediate impacts of overcrowding and
program cuts, teachers and other education employees
can articulate the dangers of underfunding our schools.
They can also join with parents and proponents of public
education to press local and state governments for legisla-
tion and rule changes that would curtail excessive or
unproductive abatements and that would empower
school districts and communities to protect education
funding more effectively.

Preface ix
Education advocates have already been successful in
shielding some schools from harm caused by abate-
ments. Yet most states and localities still deny school
boards any real leverage to review and curtail the most
significant business subsidies—property tax abatements
and TIF. Ultimately, educators, students, and the public
as a whole benefit if they make decisions about how to
use their communities’ resources in the light of clear and
common understanding of subsidies’ costs and conse-
quences. Effective public education is today’s best legacy
to tomorrow. That gives education advocates and other
community interests common ground for considering
quality public schools as an integral part of balanced
development.
NEA Research would like to thank Greg LeRoy, direc-
tor of Good Jobs First, and research analysts Kate Davis,
Sara Hinkley, and Rebecca Heck, for their dedicated and
responsive work on this paper. For further information
about GJF programs and publications, see their Web site,
http://www.goodjobsfirst.org. Also of interest are several
GJF publications, including LeRoy et al. (1994), Hinkley
(2000), and LeRoy and Hinkley (2001).
For questions about this paper, please contact Ed
Hurley or Paul Wolman at NEA Research, 202/822–7400.

This study aims to help education advocates protect
public schools and public services from the effects
of certain types of economic development subsi-
dies. These subsidies—which state and local governments
often dispense in response to corporate lobbying for a
good “business climate”—include cutting companies’
property taxes and granting long-term diversions of cer-
tain districts’ property taxes to corporations making
investments in those districts (the latter is called tax
increment financing, TIF). Some abatements and TIF dis-
tricts help revitalize distressed areas, create opportunity
for low-wage workers, build or rehabilitate affordable
housing, and otherwise stabilize low- and moderate-
income communities. But as abatements and TIF have
proliferated, they have often strayed from their original
antipoverty intentions. This report does not condemn all
abatements or TIF; it does argue that all parties affected by
such expenditures ought to have a say in them.
The report examines the extent and expense of these tax
subsidies around the country, and it details conditions and
policies in five states: Ohio, Florida, Minnesota, Montana,
and Texas. Overall, the report casts doubt on whether such
subsidies promote balanced economic development, espe-
cially on the expanding scale at which governments are
dispensing them (one estimate puts the cost at nearly $50
billion per year). Most importantly, the report shows how
these subsidies can harm public education by diverting
funding that local schools badly need to sustain their edu-
cational mission. Public schools are particularly vulnera-
ble, because local property taxes are now the largest single
source of funding for public education, amounting to
about 65 percent of all local education funding and 29 per-
cent of total education funding (local, state, and federal).
The researchers looked at abatements, TIF, and school
finances in all 50 states and the District of Columbia
(hereafter included in the count of “states”) by research-
ing statutes, news reports, and other studies and by inter-
viewing the leaders and staff of state school board associ-
ations, tax departments, and development agencies. The
paper indicates that 43 states allow cities or counties to
give companies significant, long-term property tax abate-
ments—tax “holidays” that may last 10 years or more. And
48 states allow cities to divert local property tax revenues
into special redevelopment areas, TIF districts, for as
many as 30 years. The full extent of all subsidies is excep-
tionally difficult to track in exact dollar terms, as the
details reside in myriad local jurisdictions and, as tax
expenditures rather than direct allocations, often do not
appear directly in budgets. The information we collected,
however, reveals some important features of the problem:
• All 50 states offer either abatements or TIF or both. In
32 states, respondents report that one or both of the
subsidies divert funding from schools. In 14 more,
interviewees did not know how these subsidies affected
Executive Summary
1

2 Protecting Public Education
school revenue. Thus, schools in at least two-thirds of
the states appear vulnerable to the loss of revenue to
abatements and TIF.
• Educators are putting development subsidies underincreasing scrutiny. At least 18 state school board
associations have researched or lobbied on the issue.
• Some states are providing aid to local school districtsthat helps cushion revenue losses from abatements andTIF. But respondents in 16 states said their states do
not reimburse schools adequately for abatement losses,
and respondents in 15 states reported inadequate reim-
bursements for funds diverted to TIF.
• School boards in Kansas, Minnesota, Ohio, Pennsyl-vania, and Texas have gained a formal say overwhether the school portions of property taxes can besubject to abatement. Five other states require that
local governments notify their school boards of pro-
posed abatements and give them a chance to comment.
The rest of the states apparently grant school boards
informal roles or no role at all.
One of the most fundamental and problematic features
of the issue emerged from our conversations with state-
level officials, several of whom pointed to an intrinsic
contradiction between abatements and development.
That is, when companies grow, build facilities, and bring
in staff and their families, they increase local school
enrollments and generate demand for more teachers and
classrooms. But if the new corporate property has a tax
abatement, it then fails to generate the necessary revenues
to increase school capacity to serve the enrollment it has
created. Under such circumstances, school funding can
fall short, local governments may raise homeowners’
property taxes to compensate, or both.
The study’s detailed examinations of Ohio, Florida,
Minnesota, Montana, and Texas reveal a mixture of suc-
cesses and problems in coping with the effects of abate-
ments on education:
• Florida shields school revenues from both abatementsand TIF. It is one of only two states to do so (the other
is Maryland).
• School districts in Texas have had the power to veto allschool property tax abatements since 1987. Moreover, the
number of Texas school districts choosing to participate
in abatements dropped off considerably after a 1993 state
law cut off state reimbursements. However, local schools
still forgo $52 million each year to abatements and TIF.
• Minnesota has more than 2,100 TIF districts that coststate taxpayers an additional $112 million in 1997.These monies were in the form of additional state aid
payments to local school districts. But TIF may enter a
tailspin in Minnesota as a new school-funding formu-
la takes effect.
• Abatements and TIF in Ohio reduced or divertedschool property tax revenue for schools by $102 mil-lion in 1999. The state shouldered most of the costs by
providing aid to local school districts. But local dis-
tricts also lost potential revenue, because the state aid
does not cover tax breaks affecting levies for capital
outlay and debt service. School boards in Ohio play an
advisory role in economic development decisions.
• Montana schools forgo about $16 million a year tosubsidies. They also face declining support from the
state, declining enrollments in some areas, and resi-
dents’ demands for lower property tax rates in
response to booming home prices.
This study suggests that today’s development subsidies
may be enriching corporations at the cost of the educa-
tion of tomorrow’s work force. Moreover, extensive cor-
porate subsidies can be self-defeating if their main effect
is to sap the funding of quality local public schools,
because in doing so they may be undermining the attrac-
tiveness of an area to the highly skilled work forces that
businesses increasingly seek. As part of state or national
economic policy, extensive subsidies also make little sense
if their principal effect is to pit states, cities, and counties
against each other to attract businesses through escalating
rounds of subsidies. That is, such bidding wars may enrich
corporations by inducing them to move, but what one
area gains another loses. The subsidies thus are unlikely to
result in much net economic growth. The key problems
can be summed up as follows:
• In many states, data collection on subsidy deals is sopoor that it is almost impossible to measure the costsand the outcomes of these programs. In addition, few
granting authorities have armed themselves with any
means to “claw back” subsidies dispensed to corpora-
tions that have failed to yield expected public benefits.
• School officials have very little say over these pro-grams. Except in a small handful of states, local school
officials have no voice in how substantial portions of
the monies originally intended for schools are ulti-
mately spent.

Executive Summary 3
• Abatements and TIF cost schools millions of dollars inrevenue each year. Not every state is affected, but
most are.
What then can states and localities do? This study pro-
vides some initial policy options and recommendations:
• Improve disclosure of subsidies. States should measure
the impact of subsidies on school revenue. In order to
do this, they must collect reliable data on property tax
abatements and TIF and aggregate it by school district,
county, and state. School boards and the public should
have full, advance information about subsidies to make
informed decisions. In addition, the public will not
have to bear the entire brunt of a mistake if develop-
ment agreements provide in advance for a clawback of
subsidies from companies that fail to deliver on jobs,
wages, or capital investment.
• Give local school boards authority in subsidy decisions.Giving school boards a formal say in subsidy decision-
making is a first line of defense for school funding. If
school boards have explicit veto power over abatements
and TIF, they can effectively protect education.
• Seek to have the state government shield school rev-enues from the effects of subsidies. One of the best
ways to protect school revenues from subsidies is for
the state government itself to prohibit the abatement
or diversion of the school portion of property taxes. As
we noted earlier, a handful of states have already done
this. Most states, however, do not prohibit property tax
subsidies and reimburse schools for them only partial-
ly, typically to cover operating expenses, or not at all.
Some states also protect school levies earmarked for
capital outlay or debt service from abatement or diver-
sion into TIF. More could do so. By promoting exclu-
sion of funds for schools’ capital outlay or debt service
in states that do reimburse districts for schools’ operat-
ing expenditures, local districts could create a shield
made up partly by reimbursement and partly by statu-
tory or regulatory restriction of the scope of subsidies.
The permutations of such combined approaches
would of course vary with the particular statutes and
practices in each state.
States and localities control abatements, and some have
effectively protected their public services, including edu-
cation, from losing resources to property tax abatements
and TIF. As this report details, the regulations differ from
state to state and are often complex. But states can learn
from other states’ experiences. This report is a first effort
to survey those experiences systematically. Education
advocates in the states, cities, and counties will need to
understand and discuss the specific policies and practices
in their own areas and work in their communities to
define solutions that effectively protect jobs, encourage
growth, and promote quality public education.
The generous tax breaks that state and local govern-
ments are giving to corporations are creating a
serious problem for public education in the
United States. For some time, corporations have been
convincing state legislatures, county boards, and city
councils to lower businesses’ taxes to foster a better “busi-
ness climate.” Such uses do not necessarily foster the orig-
inal antipoverty objectives of abatements and TIF dis-
tricts—to help revitalize distressed areas, create opportu-
nity for low-wage workers, build or rehabilitate affordable
housing, and otherwise stabilize low- and moderate-
income communities. Moreover, when businesses get
property tax abatements or diversions for 10, 20, or even
30 years, the flow of revenue into public coffers diminish-
es, and K–12 schools and other educational programs are
often left high and dry.
Local property taxes are a key source of funding for
today’s schools, supplying almost a third of the budgets
for public K–12 education (U.S. Census Bureau 1998).
Corporate property tax subsidies can hit this vital source
of revenue a severe blow. This issue arises because many
states and cities have been giving corporations long-term
abatements of these taxes as enticements to build facilities
within their jurisdictions. Tax increment financing (TIF),
a property-tax diversion device, is another aspect of this
same issue. The effects of these tax breaks go beyond the
local level, because local abatements are often bundled as
part of state-regulated enterprise-zone subsidies, thus also
diverting to business state funds that could be going to
education.
Meanwhile, local and state financial resources are lim-
ited, both in the short and long term (see, e.g., NEA
1998a). Thus, the business subsidies typically come at a
cost to other state and local programs. For local govern-
ments in particular this typically means infrastructure
and education. The loss to the public of tax revenues is
thus no minor issue, especially when these potential rev-
enues flow into unnecessary tax giveaways to businesses.
Saying this is not to condemn all abatements or TIF proj-
ects, but it is to argue that all parties affected by these tax
expenditures ought to have a say in them.
The High-Stakes Game of Corporate Subsidies
The tendency of local and state governments to spend
more and more for business tax breaks has continued for
nearly a generation—to the point where some analysts
have depicted it as an “economic war among the states”
(Rolnick and Burstein 1995). How has the competition
among states to attract businesses escalated? In 1977, 9
states gave tax credits for research and development; in
1998, 36 did. In 1977, 13 states made loans for machinery
and equipment; in 1998, 43 did. In 1977, 20 states provid-
ed tax-free revenue bonds; in 1998, 44 did. In 1977, 21
Corporate Tax Subsidies and theDilemma of Public Education
1
5

6 Protecting Public Education
states granted corporate income tax exemptions; in 1998,
37 did (Chi and Hoffman 2000).
Several factors have sustained the trend toward
expanding tax breaks. Corporate lobbyists have sought tax
abatements or tax cuts in preference to direct appropria-
tions to businesses (such as grants) because legislatures
and the public do not scrutinize tax-based subsidies as
carefully as they do outright appropriations. That is, once
states enact tax cuts, they seldom audit, evaluate, or “sun-
set” them. Such cuts are also far less transparent in aggre-
gate than are appropriations. No state discloses corporate
income tax returns to the public. Most do not publish reli-
able aggregate data on how much money they do not col-
lect in the name of promoting economic development.
And although local property tax records are usually avail-
able, they reside in a multitude of county tax offices and
seldom appear in a user-friendly format.
Lobbyists also prefer tax cuts because they are less vis-
ible in budgets than direct spending and hence less likely
to go on the chopping block during tight economic times.
In addition, once they are able to build tax breaks into the
tax system, business beneficiaries often criticize efforts to
reduce the subsidies as “tax hikes” or “tax and spend” pro-
posals.
But it is not only the business community that defends
corporate tax breaks. State and local governments also
protect these subsidies when they adopt a “jobs at any
cost” philosophy that forgoes fiscal break-even or eco-
nomic cost-benefit analysis and pays little if any attention
to the real costs of the subsidies or of costly externalities
that they may involve, such as pollution or poverty-level
wages. One sociologist described this prodigal practice as
shooting everything that flies and claiming anything that
falls (Rubin 1988, p. 237).
The underlying assumptions of all this business and
legislative activity have been that abatements produce a
good business climate for development—particularly in
the cities—and that this in turn means economic growth
and more jobs. But business “climatology” is one of the
most conflict-laden areas of public policy, and no clear
consensus has emerged on whether corporate tax abate-
ments really boost local economies and create jobs in the
long run (see, e.g., Minietta 1996). One factor casting
doubt on the efficacy of tax abatements in this regard
resides in the history of corporate manipulation of the
business climate index. A study by the Corporation for
Enterprise Development (1986) revealed, for example,
that the Chicago accounting firm Grant Thornton, pub-
lisher of the then-dominant business climate index,
allowed each state’s manufacturers’ association to weight
various tax factors each year. This self-weighting allowed
manufacturers to portray taxes they were currently con-
testing as the factors hindering growth—even without
evidence that these taxes had influenced corporate behav-
ior. The manufacturers used the “low” ratings of the tax
factors as they lobbied to reduce or eliminate the taxes.
Another boldface question mark should follow the
assertion that subsidies promote the long-term economic
well being of the public. To begin with, a Congressional
Research Service report (Maguire 2000) confirmed that
the net tax state and local burden has been shifting away
from corporations and onto individual property owners,
wage earners, and consumers. This report noted that the
effective rate of state and local taxes on corporate profits,
which averaged 6.5 percent in the 1980s, had fallen to 3.8
percent by 1998—a drop in the effective rate of more than
41 percent for the period as a whole. The report conclud-
ed that “perhaps the most obvious explanation is the tax
competition among states to attract businesses” (p. 7).
Another study (Fisher 2002) supports the CRS’s con-
clusion (Maguire 2000) that the increase in tax incentives
granted by states and localities has played a role in the
declining tax burdens of corporations. Fisher projected
fiscal flows and corporate tax rates for 20 state and local
tax systems and representative models of firms in 16 man-
ufacturing sectors. His analysis suggests that the statutory
changes in state tax rates were probably the most signifi-
cant factor in the declining corporate income tax rate
nationally between 1988 and 1998. But he points directly
at corporate tax incentives as the most influential con-
tributing factor. 1
Of particular interest here, Fisher (2002) found the
negative fiscal effects of corporate incentives “large and
growing.” He calculated that in the 17 states that offered
general incentives, these incentives accounted for only 9
percent of the new jobs created. The cost, across the 16
1. Fisher sought to pin down more precisely the influence of various factors that might be responsible for the decline in the corporate taxation rate.These include legislative changes in tax rates; revisions in tax apportionments by type of tax (e.g., as described by Mazerov 2001); corporate legal strate-gies that facilitate tax avoidance, and of course the influence of the business cycle itself. Mazerov (2001) had observed that 34 of 45 states with corporateincome taxes have shifted the weighting of these taxes from systems allocating a third to each of property, payroll, and in-state sales to ones that weightsales from 50 to 100 percent. This shift toward a “single sales factor” or to a “double-weighted sales factor” is a tax windfall for in-state manufacturers,

Corporate Tax Subsidies and the Dilemma of Public Education 7
manufacturing sectors that Fisher modeled, was about
$46,000 per job gained through incentives. In fact, over
the 20-year period of Fisher’s projections, none of the 17
states achieved a positive fiscal flow as a result of revenue
gained from corporate-incentive-based job creation, and
even in year 20 of the projection, the per job revenue losswas still $6,500 annually. Taken together, the foregoing
analyses strongly suggest that the public is paying a larger
share of taxes and is receiving meager employment and
economic benefits in return.
Still further doubt arises from two decades of promi-
nent subsidy schemes that had costs of $50,000 and up per
job created (Box 1.1).
A complete accounting of the total taxpayer cost of
economic development subsidies is difficult because few
states publish clear pictures of their tax expenditures.
That is, they do not clearly account for revenues not col-
lected in the name of economic development as opposed
to expenditures made as direct budget appropriations.Many other states publish incomplete and inconsistent tax
expenditure budgets. And only a few maintain centralized
data about local property tax abatements. We do know,
however, that tax spending for economic development
outweighs direct spending by significant margins in many
cities and states. For example, a study of North Carolina
found that tax spending for development exceeded direct
spending by four to one and that tax spending was one of
fastest-growing items in the state budget (Schweke and
Rist 1997: 2). Another study (Thomas 2000) estimated
that by the mid-1990s, states and cities’ annual spending
for business development subsidies totaled nearly
$49 billion.
Box 1.1: Corporate Property Tax Abatements:What Benefit to the Public?States and localities have been using tax subsidies over the past 25 years to attract businesses to their areas.Theirassumption has been that such subsidies promote local economic development. But do they? The idea that subsi-dizing corporations with tax breaks is the best way to promote local development and higher employment doesnot have a real consensus (Minietta 1996).
Many tax subsidy schemes have clearly not produced the desired development benefits.As early as the late 1970s,Pennsylvania offered subsidies amounting to about $70 million to a European auto manufacturer to attract morethan 10,000 manufacturing jobs.The plant employed, at a maximum, 6,000 people, and it closed within a decade. Inthe early 1990s, Alabama got another European auto manufacturer to locate an assembly plant in state in returnfor subsidies of about $253 million—a cost of nearly $169,000 for each of the 1,500 jobs directly created (Minge2000). In the same period, South Carolina and some other southern states made offers to auto manufacturers atcosts of between $50,000 and $150,000 per job created (Mastel 1996).
Examples abound as well of cities subsidizing the building of stadiums through tax breaks to attract or keep base-ball and football teams.Team owners and some highly paid players may profit. But do such subsidies help cities andthe public? That is questionable, because the infrastructural improvements may be too concentrated (e.g., low-usestadiums and vast parking lots for holders of high-priced tickets), and most of the new employment they create islow-wage and seasonal (Minge 2000).
Luring corporations with subsidies is a game that many can play as well as one. New York City’s efforts to stopConnecticut and New Jersey from wooing its financial, publishing, and media firms have involved countersubsidyoffers in the many millions of dollars—at no net gain in jobs. At best such subsidies may only shift companies andjobs from locality to locality or state to state—a zero-sum game. In any case, governments and the public may askwhether the costs of the jobs created are too high, and their value too minimal or short-lived to justify public sup-port of corporate mobility.
because they have large amounts of property and big payrolls. Moreover, 20 states have no provision requiring a “throwback” of sales taxes on goodsexported to states where the original state’s businesses have no tax nexus and are thus not already required to treat the sales as “in-state.” This again com-pounds the shift of the tax burden onto noncorporate taxpayers in the state, could account for the decline in the overall rate of corporate taxation seenin the 1990s, and gives more prominence to the role of property taxes as sources of local government revenue.

8 Protecting Public Education
One of the biggest problems inherent in business-cli-
mate subsidies is its “stealth” aspect. Most states do not
have a clear overall accounting and assessment of their
effects. A U.S. Department of Commerce survey of state
practices found that only Maryland and New York have
invested in the technical capacity to do fiscal impact analy-
sis of incentives. “Other states rely on estimates of impacts
derived from client companies or do not collect data at
all,” the study found. In other words, 48 states still rely on
the self-interested calculations of the companies that ben-
efit from the subsidies in estimating their return on tax-
payers’ investments (U. S. Department of Commerce
1999: iii). Chapter 4 of this report presents studies of tax
abatements and TIF in five states as a first attempt to fill in
some of the details. But clearly we have much more to
learn about fiscal practices and the details of subsidy
measures before we can assess the full impact of corporate
tax subsidies around the nation.
The Implications for Schools
Even if we do not yet have the bottom line on corporate
tax abatements and TIF, we can see the broad implications
for public education. As Figure 1.1 shows, state and local
sources each supply almost half of school funding. Federal
support is only 7 percent. Local property taxes alone con-
tribute 29 percent and (because state funds come from
several programs not separately shown in the figure) rep-
resent the largest single source of school funding (U.S.
Census Bureau 1998).
It is not surprising to find property taxes playing a large
role—about two-thirds, actually—in local funding of edu-
cation. Local governments have few resources to support
direct spending programs, so property taxes are the pri-
mary source of revenue for most local governments. By
the same token, lacking resources for direct spending,
localities tend to rely heavily on tax spending for econom-
ic development, and property tax abatements are the most
common locally granted economic development subsidy.
This practice has significant implications for public
schools, because the abatements compete directly for
schools’ largest revenue source.
Local property taxes are lost to schools primarily
through two subsidies: property tax abatements and tax
increment financing or TIF. Some states target or bundle
abatements as part of enterprise zones. Therefore, abate-
ments and TIF are the focus of this study. The next two
chapters describe in somewhat greater detail how these tax
subsidies operate and convey the study’s general findings
on their prevalence and impact on public education
around the United States.
Figure 1.1 Sources of Revenue for Public Schools, 1998
Source: U.S. Census Bureau (1998).

We focused our study on the two subsidies that
most affect property tax revenues: property tax
abatements and tax increment financing (TIF).
Property Tax Abatements
A property tax abatement is an economic development
subsidy that local governments offer routinely in the belief
that it contributes to attracting or retaining businesses.
When a company receives an abatement, the government
is exempting all or some of the value of the company’s
property—real, personal, or both—from property taxes
for a specified number of years. (Real property includes
the land and the buildings within a parcel of property.
Personal property includes the inventory, machinery, or
other equipment that a business owns and uses.)
Although city councils, county boards, or other local
bodies generally control property tax abatements, the
states are responsible for legally enabling and regulating
them. A total of 37 states now allow tax abatements, and 6
more permit abatements in enterprise zones, for a total of
43 states altogether. Jurisdictions most often give the most
generous tax abatements to new property improve-
ments—for example, when a business facility expands or
acquires new machinery. The abatements are for a fixed
period, generally between 5 and 20 years, and sometimes
decline or phase out over that period.
States typically limit the amount of property eligible
for exemption and specify the duration of abatements.
State laws also typically restrict abatements to certain
kinds of companies. They may also impose quid pro quo
requirements on them. For example, companies may have
to agree to create or retain a certain number of jobs or
invest a certain amount of capital to receive or continue to
receive an abatement. Or they may have to locate within a
state-designated enterprise zone. The local granting bod-
ies may also impose additional requirements, such as wage
standards and health care benefits.
Although most states cannot grant property tax abate-
ments directly, state officials often bundle them into mul-
tiyear packages of incentives for corporations, intending
to refine the arrangements later with the local jurisdic-
tions that technically grant the abatements. The impulse
to put property tax abatements on the table first reflects
the fact that for capital-intensive facilities such as steel
mills, petrochemical plants, or microchip fabrication
plants, a company’s property tax liability may exceed its
Property Tax Abatements and TIF
2
9

10 Protecting Public Education
corporate income tax bill, especially in start-up years.
Local property tax abatements thus are often the largest
economic development subsidy a company receives.
Tax Increment Financing
TIF is a highly flexible development subsidy based on
diversion of property taxes (and, in some states, sales tax
as well). As is the case for abatements, the states enable
and regulate TIF, and the cities or local jurisdictions
implement it. TIF usually aims to revitalize “distressed” or
“blighted” areas; state rules therefore establish measures
of distress or blight that qualify an area for TIF (Johnson
and Kritz 2001).
When a city designates a TIF district, it anticipates the
redevelopment of an area and a resulting rise in property
values and property tax revenues. When that happens, the
TIF provides for splitting the future property taxes for
that area into two streams. The first stream, pegged to the
area’s original property values (base value) continues to
go where it always has—that is, to support local services
such as schools, police, fire and sanitation—for the city as
a whole. But all of the increase in property taxes—the taxincrement—now goes to subsidize the redevelopment of
the TIF district. Thus, within the TIF district, the
increased future property taxes may pay for upgrades of
the district’s public roads, sewers, or lights. In some states,
they may also pay for improvements to private buildings
or land. TIF thus channels the increment to private as well
as public purposes.
Figure 2.1 shows how a TIF scheme might divide the
property tax stream over 20 years.
Although developers like to say that the tax increment
would not exist without the building facilitated by the
subsidy, this may not be so. A recent study in Chicago sug-
gests that many districts were growing before or without
TIF. When that is the case, the city as a whole loses the
benefit of taxing the resulting economic growth
(Neighborhood Capital Budget Group 2000).
A TIF tax diversion may last from 10 to 30 years,
depending on state rules. States may also limit how much
property a city may include in TIF or how much tax rev-
enue it can divert into TIF schemes. Based on revenues it
anticipates from a TIF plan, a city may float bonds to gen-
erate a large amount of cash up front for redevelopment
and then use the incremental revenue from the TIF later
on to service the bond debt. More conservatively, a city
may use TIF revenues to subsidize redevelopment on a
pay-as-you-go basis (Johnson and Man 2001).
Figure 2.1 Hypothetical Increase in Tax Increment versus Constant Taxes Collected on Base Value
0 2 4 6 8 10 12 14 16 18 20
Duration of TIF (years)
Tax collected on base value (continues to accrue to government)
50
40
30
20
10
0
Tax increment: tax derived from appreciation ofproperty value (accrues to corporate developers)
$’00
0
Property Tax Abatements and TIF 11
Property tax Tax increment Enterprise Property tax abatementsState abatement financing zone in enterprise zone
Alabama ■ ■ ■ ■
Alaska ■
Arizona ■ ■ ■
Arkansas ■ ■ ■
California ■ ■ ■
Colorado ■ ■ ■ ■
Connecticut ■ ■ ■ ■
Delaware ■
Dist. of Columbia ■ ■ ■a
Florida* ■ ■ ■ ■
Georgia ■ ■ ■ ■
Hawaii ■ ■ ■
Idaho ■
Illinois ■ ■ ■ ■
Indiana ■ ■ ■ ■
Iowa ■ ■ ■ ■
Kansas ■ ■ ■ ■
Kentucky* ■ ■ ■ ■
Louisiana* ■ ■ ■
Maine ■ ■ ■
Maryland* ■ ■ ■
Massachusetts ■ ■ ■
Michigan ■ ■ ■ ■
Minnesota ■ ■ ■ ■
Mississippi ■ ■
Missouri ■ ■ ■ ■
Montana ■ ■
Nebraska ■ ■ ■
Nevada ■ ■
New Hampshire ■ ■
New Jersey ■ ■ ■
New Mexico ■ ■ ■ ■
New York ■ ■ ■ ■
North Carolina ■ ■
North Dakota ■ ■
Ohio ■ ■ ■ ■
Oklahoma ■ ■ ■
Oregon ■ ■ ■ ■
Pennsylvania ■ ■ ■ ■
Rhode Island ■ ■ ■ ■
South Carolina ■ ■ ■
South Dakota ■ ■
Tennessee ■ ■ ■
Texas ■ ■ ■ ■
Utah ■ ■
Vermont ■ ■ ■
Virginia ■ ■ ■
Washington* ■ ■
West Virginia ■
Wisconsin ■ ■
Wyoming ■
Table 2.1 States’ Use of Property Tax Abatements,TIF, and Enterprise Zones
*States in which TIF is not applicable to the school portion of property tax revenues. ■aFederal, not local, program.Source: Individual state statutes examined by authors.
12 Protecting Public Education
California first allowed tax increment financing in
1952. Now all states allow it except for Arizona, Delaware,
and North Carolina. Washington State only recently legal-
ized TIF, and Washington, D.C., authorized it just a few
years ago. California, Colorado, Florida, Illinois, Indiana,
Minnesota, and Wisconsin use TIF extensively. Connecti-
cut and Washington, D.C., allow TIF districts to capture
both property and sales tax revenues. Alaska has allowed
TIF for several years but has never used it; a recently
enacted law aims to change that.
Only Florida, Louisiana, Kentucky, Maryland, and
Washington specifically prohibit school districts from par-
ticipating in TIF districts (Johnson and Man 2001: 49).
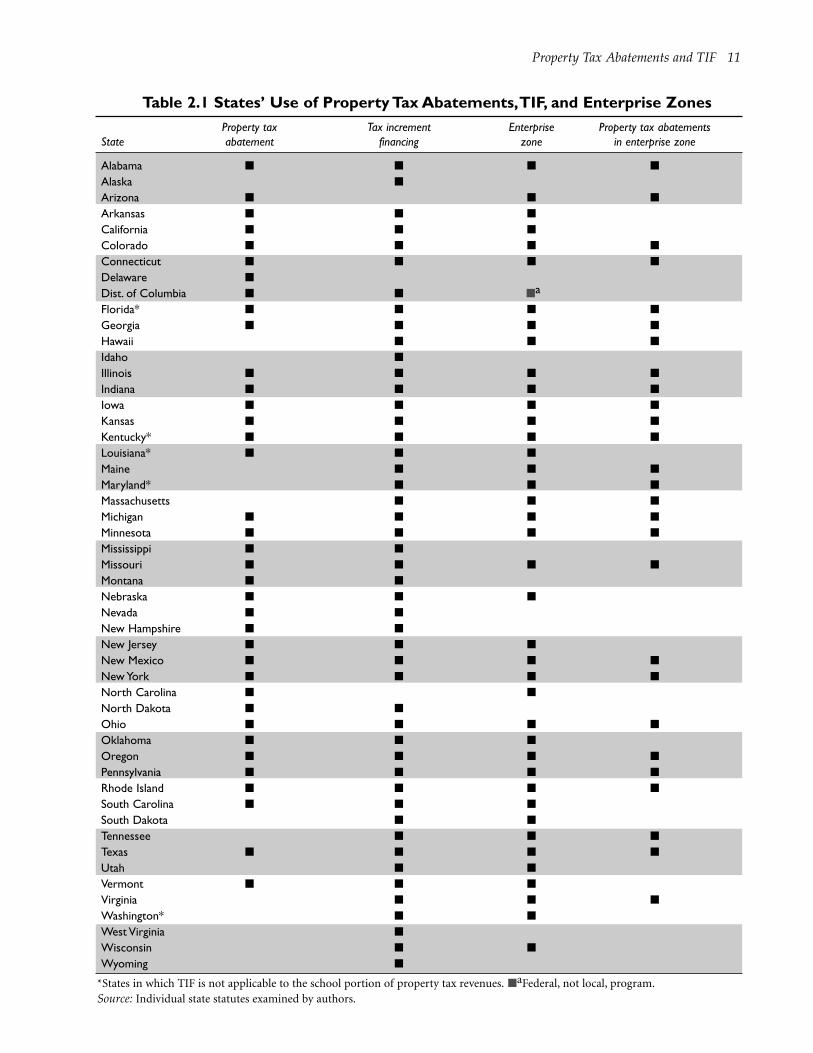
Table 2.1 sums up the present study’s findings on the 50
states’ statutes on abatements and TIF. A total of 36 states
plus Washington, D.C., now allow tax abatements, and 6
more permit abatements in enterprise zones; 47 plus
Washington, D.C., have TIF. Clearly, forgiving or diverting
property taxes has become a common practice of eco-
nomic development across the United States.
We surveyed school board associations and
other education organizations in 49 states and
the District of Columbia (hereafter included
in references to states) to collect basic information about
the role of school boards in subsidy decisions and the
impact of subsidies on school revenues, focusing especial-
ly on abatements and TIF. We did not survey officials in
Hawaii, where state revenues (not local property taxes)
support the schools. The full results of the survey appear
the appendixes to this report.
Finding 1: Schools in at Least Two-Thirdsof the States Are Affected
Our research in states’ statutes indicated that 43 states
allow local governments to offer property tax abatements,
and 48 states permit tax increment financing. We then sur-
veyed state school board association officials and others to
(1) determine the effects of abatements and TIF on school
revenues and (2) find out whether school boards have any
power to protect their revenues from these subsidies.
As Table 3.1 shows, among the 43 tax-abatement states,
school district revenues are vulnerable to abatements in at
least 25. In only 5 of the 43 states did respondents report
that their state protected the schools’ portion of property
taxes from abatement. In 11 other states, respondents did
not know. Given the prevalence of vulnerability among
the 32 states for which we did obtain answers, we feel jus-
tified in assuming that the number of states in which
schools may be affected by abatements is substantially
higher than 25.
Among the 48 states that permit TIF, at least 22 permit
diversion of school taxes. In only 8 TIF states did respon-
dents report that TIF does not affect school property
taxes. In another 17 states, respondents did not know.
Again, given the prevalence of vulnerability for the states
for which we obtained answers, we assume that the num-
ber of states in which TIF may affect schools is much
higher than 22.
Combining the results for both kinds of subsidies, we
find that all 51 U.S. jurisdictions (i.e., the 50 states and
D.C.) offer one or both of the subsidies, and that in at
least 31, abatements, TIF, or both divert funding from
schools. In another 15 states, for either one or both of the
subsidies, respondents did not know whether revenues
were lost or diverted. Remarkably, only 2 states shield
schools from both kinds of subsidies—Florida and
Maryland.
We conclude, then, that schools in at least two-thirds of
the states—and perhaps as many as four-fifths—are vul-
nerable to revenue lost to abatements and TIF. Table 3.1
shows states in which survey respondents indicated that
abatements and TIF affect school revenue.
Abatements, TIF, and Schools
3
13

14 Protecting Public Education
Table 3.1 States Where Abatements and TIF Affect School RevenueSurvey question: Can school property taxes be
abated for economic development?
State Yes No Don’t know n.a. Yes No Don’t know n.a.
Alabama ■ ■
Alaska ■ ■
Arizona ■ ■
Arkansas ■ ■
California ■ ■
Colorado ■ ■
Connecticut ■ ■
Delaware ■ ■
Dist. of Columbia ■ ■
Florida ■ ■
Georgia ■ ■
Hawaii ■ ■
Idaho ■ ■
Illinois ■ ■
Indiana ■ ■
Iowa ■ ■
Kansas ■ ■
Kentucky ■ ■
Louisiana ■ ■
Maine ■ ■
Maryland ■ ■
Massachusetts ■ ■
Michigan ■ ■
Minnesota ■ ■
Mississippi ■ ■
Missouri ■ ■
Montana ■ ■
Nebraska ■ ■
Nevada ■ ■
New Hampshire ■ ■
New Jersey ■ ■
New Mexico ■ ■
New York ■ ■
North Carolina ■ ■
North Dakota ■ ■
Ohio ■ ■
Oklahoma ■ ■
Oregon ■ ■
Pennsylvania ■ ■
Rhode Island ■ ■
South Carolina ■ ■
South Dakota ■ ■
Tennessee ■ ■
Texas ■ ■
Utah ■ ■
Vermont ■ ■
Virginia ■ ■
Washington ■ ■
West Virginia ■ ■
Wisconsin ■ ■
Wyoming ■ ■
TOTAL 25 5 11 10 22 8 17 4
Survey question: Can school property taxes be diverted by TIF?
Source: Authors’ survey results. n.a. = not applicable.

*School boards can only vote on the diversion of debt-services levies.
‡School boards can only vote on TIFs that divert more than 75 percent of the tax increment or that last longer than 10 years.
*School boards can only vote on abatements that exempt more than 75 percent of taxes or that last longer than 10 years.
Abatements, TIF, and Schools 15
Finding 2:Very Few States Give SchoolBoards Any Formal Powers
In most states, a majority vote of a city council or a coun-
ty board settles decisions about abatements or TIF. We
asked respondents whether school boards have any role—
formal or informal—in the process. The overwhelming
majority of states give school boards no formal authority.
Instead, a few states merely require that a school district
be notified when a TIF district or abatement is being con-
sidered, and some others allow school districts to com-
ment or give school districts a seat on an advisory com-
mittee that oversees incentives.
Formal Power
Only Kansas, Minnesota, Ohio, Pennsylvania, and Texas
give school boards a formal say about whether or not the
school portion of property taxes may be abated. In
Michigan, North Dakota, and Ohio, cities or local govern-
ments must notify school boards before granting abate-
ments. In North Dakota and Ohio, school board represen-
tatives sit on a board that oversees tax abatements. Table
3.2 summarizes the powers of school boards in these 7
states. Respondents in 18 other states told us that school
boards did not play any role in the awarding of tax abate-
ments.
Similarly, only 7 states give school boards control over
the diversion of school taxes into TIF (Colorado,
Michigan, Ohio, Oklahoma, Pennsylvania, South
Carolina, and Texas). School boards are members of advi-
sory committees in five states (Missouri, Nevada, Ohio,
Wisconsin, and Utah). Michigan, Minnesota, and Ohio
jurisdictions must notify the affected school boards
before authorizing TIF. Table 3.3 summarizes these
points.
In sum, only two states—Pennsylvania and Texas—
give school boards full power on both abatements
and TIF.
Table 3.2 School Board Powers in Awarding Property Tax Abatements
School board area of authority States granting such authority
Notification or opportunity to comment Michigan, North Dakota, Ohio
Seat on advisory committee North Dakota, Ohio
Must approve abatement of school property tax Kansas, Minnesota, Ohio,* Pennsylvania,Texas
Informal influence Missouri, Nebraska, Nevada, Ohio, South Carolina,Tennessee
Table 3.3 School Board Powers in Tax Increment Financing
School board area of authority State(s) granting such authority
Notification or opportunity to comment Michigan, Minnesota, Ohio
Seat on advisory committee Missouri, Nevada, Ohio,Wisconsin, Utah
Must approve any diversion of school taxes into TIF Colorado, Michigan,* Ohio,‡ Oklahoma, Pennsylvania, South
Carolina,Texas
Informal role Montana

16 Protecting Public Education
Informal Power
Few respondents said that school districts have any infor-mal power over the process. Interviewees reported isolat-
ed instances of school boards organizing to stop or modi-
fy a proposed subsidy, but most respondents felt that a
school board could not successfully halt a subsidy deal
unless substantial local opposition already existed.
A few respondents told of school boards and local gov-
ernments negotiating informal, voluntary arrangements
to reimburse the school districts for revenue lost to abate-
ments or TIF. In some states, local governments have
reimbursed schools by providing funding for specific serv-
ices (e.g., construction of a gym or a school parking lot).
Such arrangements reflect the school boards’ informal
power dynamic with the granting body.
It is also evident from the interviews that even in states
where school boards have some role, they are often under
considerable pressure to approve—or at least to not
oppose—abatements or TIF districts. Indeed, school dis-
tricts hungry for property wealth may be convinced that
in the long run, the proposed subsidies will increase the
local property tax base.
Finding 3: Some School Boards areFighting Back; Others Get PILOT
Although many school boards have opposed TIF and
abatements, only a handful have succeeded. Not surpris-
ingly, most of these success stories are from states in which
school boards have gained formal power in the subsidy-
awarding process. School boards have reportedly been
able to stop or exclude their taxes from TIF in seven states:
Missouri, Nevada, Ohio, Pennsylvania, South Carolina,
Texas, and Wisconsin. Only three states reported cases of
school boards successfully opposing property tax abate-
ments: Minnesota, Missouri, and Pennsylvania (see
Appendix F). Historically, school boards in Texas have also
opted out of tax abatements, although their action under
a new abatement law has yet to be tested (Texas Senate
Economic Development Committee 1996).
Occasionally school boards have become embroiled in
fights with local governments over issues of reimburse-
ment. Two respondents told of local governments that had
negotiated payments in lieu of taxes (PILOT) with com-
panies and then refused to share these payments with the
school district (Survey respondent, personal communica-
tion, June 7, 2001). The Horry County School Board in
South Carolina sued the county government over the dis-
tribution of such a payment.
Sometimes a company will agree to make a PILOT
(also called a fee in lieu of taxes, FILOT) during the peri-
od in which it receives a property tax abatement. These in
lieu payments are usually a fraction of what the company
would have paid without an abatement. Respondents in 10
states reported that school boards could negotiate PILOT
with companies. In four other states, the municipality
negotiates PILOT and shares the proceeds with the school
district (see Appendix G).
Table 3.4 notes the states in which school boards or
municipalities, respectively, negotiate PILOT.
Table 3.4 States Granting Power to Negotiate PILOT to School Boards or MunicipalitiesStates in which school board can negotiate PILOT
Illinois Nebraska
Kentucky Nevada
Louisiana Ohio
Michigan Pennsylvania
Missouri Texas
States in which municipality negotiates PILOT for schools
Kansas Rhode Island
New York South Carolina

Abatements, TIF, and Schools 17
Finding 4:At Least a Third of States withSubsidies Fail to Reimburse SchoolDistricts Fully or at All
We also researched whether local school districts receive
reimbursements for revenue they forgo from property tax
abatements and TIF districts. States may provide such
payments either directly through a specific program that
provides dollar-for-dollar reimbursement or indirectly
through the state school funding formula. Many states
provide funds to local districts to compensate for differ-
ences in property wealth. In some cases, this aid offsets
some of the losses from abatements and TIF. (For more
information on how state aid offsets subsidies, see
Appendix B on state school-funding formulas.)
Many school board officials believe that even when
their state’s formula provides some reimbursement for
subsidies, they ultimately lose money because the formula
funds are insufficient. In many states, state aid does not
cover losses of revenues earmarked for capital outlay, debt
service, or both. And many officials said that even if they
were being reimbursed, they would prefer to have the rev-
enue come from local sources instead of depending on
state decisions about reimbursement. In other words, local
control is important.
Respondents in 16 states reported that the state does
not adequately reimburse school districts for revenue lost
to property tax abatements. Respondents in 15 states
reported that the state did not adequately reimburse local
districts for school revenues diverted into TIF districts. In
addition, 15 respondents did not know whether the states
reimbursed school districts for abatements, and 16
respondents did not know whether state aid reimbursed
school districts for TIF.
Several factors affect reimbursement from state aid.
The most important is whether abated or “TIFed” proper-
ty is included in the measurement of a district’s property
wealth in the school funding formula. Unfortunately, it is
not always easy to tell. States have many different sources
for measuring property wealth; some use actual receipts
from previous years, whereas others use data from the tax
assessors’ office. Some respondents were uncertain how
their own states’ formulas operate in regard to economic
development subsidies. Respondents in only two states—
Oklahoma and Texas—were certain that TIFed property is
included in the state’s measurement of property wealth and
that local schools therefore receive no state reimbursement.
Finding 5:The Tension Between Subsidiesand Economic Growth is Visible
Questions about the relationship of subsidies and growth
have emerged from several sources. Several interviewees
noted that many abatements and TIF districts apply to
new property values (i.e., new buildings or improvements
on existing property), yet when economic activity
expands, population also expands, and school districts
have to hire more teachers and build more classrooms.
States either do not reimburse districts for lost tax proper-
ty tax revenues or do so only partially, but the schools still
must educate the additional children. Their alternatives,
then, are to forgo necessary improvements and programs
or to increase the tax rate on residential or commercial
property—both unpopular options.
These interviews directly contradict an argument com-
monly made by business lobbyists who claim that schools
do not actually “lose revenue” because the property value
stimulated by subsidies did not exist to be taxed before the
improvement was constructed. The problem with the lob-
byists’ argument is that it presupposes that development
would not take place without subsidies—an assumption
that numerous studies and audits have challenged. It also
does not account for the need to expand school resources
to handle population growth.
Even libertarian and conservative groups have ques-
tioned the fairness of subsidies. Some libertarians oppose
subsidies on the grounds that they constitute favoritism
toward newly arriving companies at the expense of estab-
lished firms. The John Locke Foundation (2000) has ques-
tioned the extent as well as the fairness of subsidies, criti-
cizing North Carolina’s “variety of special rates, exemp-
tions, exclusions, deductions, and credits.” The foundation
noted that “in the corporate tax code alone, special tax
credits for job creation, research and development,
machinery, worker training, and other expen-
ditures…total $263 million…or nearly a third of all cor-
porate income taxes the state will collect.” 2
Another questionable aspect of the subsidy issue comes
to light in a Baltimore Sun investigative series (Hancock
1999). The Sun put South Carolina’s subsidy policies
under detailed scrutiny and noted that the state had been
giving local property tax abatements and generous state
corporate income tax credits to a host of new factories.
South Carolina’s largesse with scarce public funds
appeared highly problematic, the Sun thought, consider-
2. The John Locke Foundation, dubbed a “Heritage [Foundation] clone”; see Soley (1998).
18 Protecting Public Education
ing that the state has the lowest SAT scores and eighth-
most-deadly roads in the nation as well as 40 percent of its
homes unconnected to sewer systems.
Finding 6: Several States Have ActiveDebates on the Issue;At Least 18 SchoolBoard Associations Have Researched orLobbied the Issue
A handful of states have seen substantial activity around
these issues. Debates are ongoing in Ohio, Pennsylvania,
South Carolina and Texas. Generally, we found that states
that rely heavily on property taxes or that use abatements
and TIF are the most likely to be aware of the problem.
School board associations were also more likely to be con-
cerned if they felt that the state did not fairly reimburse
them for revenue loss. Respondents in 18 states (see
Appendix I for a list) reported that their organization had
either researched subsidies or lobbied to change the laws
that govern them. Many of these groups had tried to con-
vince their legislatures either to protect school revenues
from subsidies or to give school boards more power in the
decisionmaking process.

In addition to conducting the 50-state survey of school
boards and property tax subsidies we discussed in the
previous chapters, we selected 5 states—Ohio,
Florida, Minnesota, Montana, and Texas—for a more
comprehensive analysis of economic development subsi-
dies and school revenues. The choice of these particular
states for study reflects the salience of the issue in the
states; a desire for a degree of regional variety; and some
informative differences in the states’ regulatory treatment
of subsidies (e.g., forbidding them, giving school boards
oversight or veto powers, or doing nothing). It also reflects
the availability of reasonably recent, complete, and man-
ageable collections of data. We hasten to add that the case
study states do not necessarily constitute a fully represen-
tative sample of the country. 3
Methodology
How much revenue do schools forgo to development sub-
sidies each year? One way to begin a calculation would be
to take the value of abated property in each school dis-
trict, multiply that by each respective district’s property
tax rate, and multiply it by the percentage of the property
tax earmarked for schools. Another method would be to
take the percentage of property tax revenue earmarked for
schools (e.g., 50 percent) and multiply it by the total
amount of revenue lost to property tax abatements and
taxes diverted into TIF (if that amount is discernible).
We employed both of these methods to produce an
estimate of the amount of revenue diverted from levies
originally intended to fund education. We have also
included an explanation of how the various state aid for-
mulas interact with local development subsidies in an
attempt to figure out which government body or bodies
foot the bill for local tax breaks. For more information
about the various state funding formulas referred to in
these case studies, see Appendix B.
Case Study 1: Ohio
Economic development subsidies have created real prob-
lems for school districts in Ohio. Property tax abatements
and TIF cost Ohio schools more than $100 million in
potential tax revenue in 1999. The state and local school
districts shared the burden of these revenue losses. The
state shouldered most of the costs of local property tax
Five States in Depth
4
19
3. The accuracy of any overall analysis of the 50 states, of course, depends heavily on whether and how well a state collects the relevantinformation on property tax abatements and tax increment financing. Unfortunately, most states do not collect centralized informa-tion of this kind, and the states that do accumulate such data vary in the extent and quality of their record keeping. The basic goals ofthis preliminary study were to find how much revenue schools are losing to “business climate” subsidies in the case study states and toencourage further research and responses from states and localities that are aware of and interested in the issue.
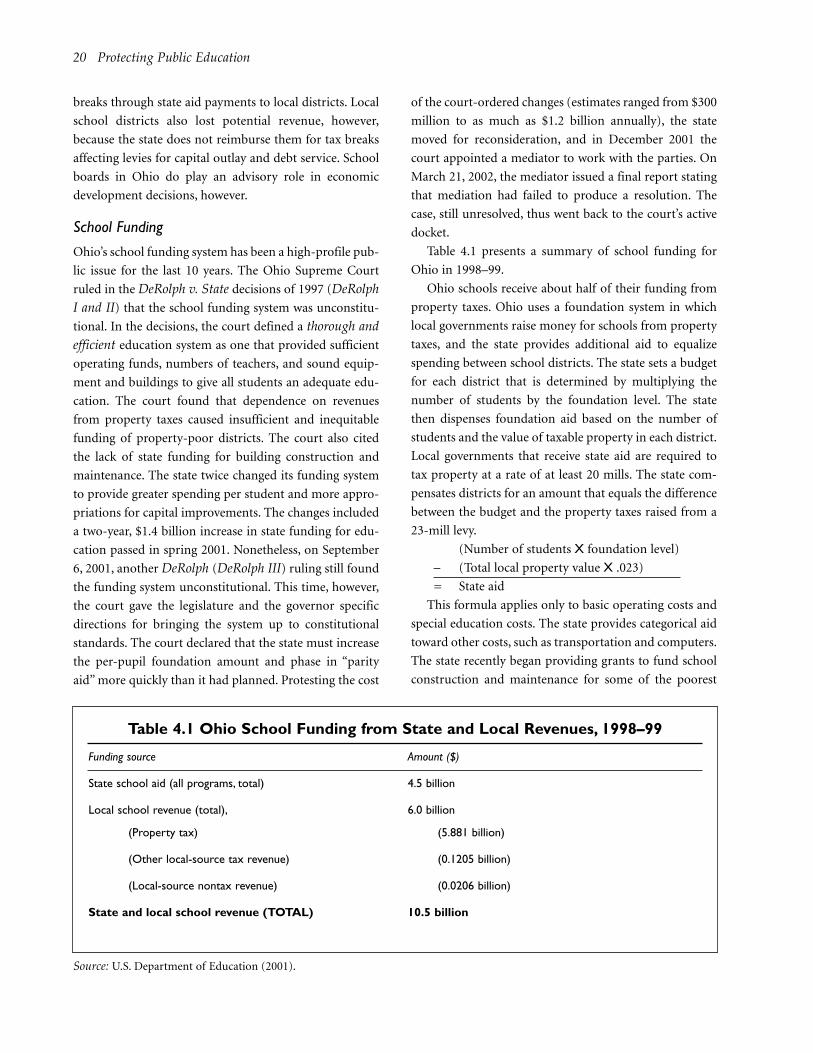
20 Protecting Public Education
breaks through state aid payments to local districts. Local
school districts also lost potential revenue, however,
because the state does not reimburse them for tax breaks
affecting levies for capital outlay and debt service. School
boards in Ohio do play an advisory role in economic
development decisions, however.
School Funding
Ohio’s school funding system has been a high-profile pub-
lic issue for the last 10 years. The Ohio Supreme Court
ruled in the DeRolph v. State decisions of 1997 (DeRolphI and II) that the school funding system was unconstitu-
tional. In the decisions, the court defined a thorough andefficient education system as one that provided sufficient
operating funds, numbers of teachers, and sound equip-
ment and buildings to give all students an adequate edu-
cation. The court found that dependence on revenues
from property taxes caused insufficient and inequitable
funding of property-poor districts. The court also cited
the lack of state funding for building construction and
maintenance. The state twice changed its funding system
to provide greater spending per student and more appro-
priations for capital improvements. The changes included
a two-year, $1.4 billion increase in state funding for edu-
cation passed in spring 2001. Nonetheless, on September
6, 2001, another DeRolph (DeRolph III) ruling still found
the funding system unconstitutional. This time, however,
the court gave the legislature and the governor specific
directions for bringing the system up to constitutional
standards. The court declared that the state must increase
the per-pupil foundation amount and phase in “parity
aid” more quickly than it had planned. Protesting the cost
of the court-ordered changes (estimates ranged from $300
million to as much as $1.2 billion annually), the state
moved for reconsideration, and in December 2001 the
court appointed a mediator to work with the parties. On
March 21, 2002, the mediator issued a final report stating
that mediation had failed to produce a resolution. The
case, still unresolved, thus went back to the court’s active
docket.
Table 4.1 presents a summary of school funding for
Ohio in 1998–99.
Ohio schools receive about half of their funding from
property taxes. Ohio uses a foundation system in which
local governments raise money for schools from property
taxes, and the state provides additional aid to equalize
spending between school districts. The state sets a budget
for each district that is determined by multiplying the
number of students by the foundation level. The state
then dispenses foundation aid based on the number of
students and the value of taxable property in each district.
Local governments that receive state aid are required to
tax property at a rate of at least 20 mills. The state com-
pensates districts for an amount that equals the difference
between the budget and the property taxes raised from a
23-mill levy.
(Number of students X foundation level)
– (Total local property value X .023)
= State aid
This formula applies only to basic operating costs and
special education costs. The state provides categorical aid
toward other costs, such as transportation and computers.
The state recently began providing grants to fund school
construction and maintenance for some of the poorest
Source: U.S. Department of Education (2001).
Table 4.1 Ohio School Funding from State and Local Revenues, 1998–99
Funding source Amount ($)
State school aid (all programs, total) 4.5 billion
Local school revenue (total), 6.0 billion
(Property tax) (5.881 billion)
(Other local-source tax revenue) (0.1205 billion)
(Local-source nontax revenue) (0.0206 billion)
State and local school revenue (TOTAL) 10.5 billion
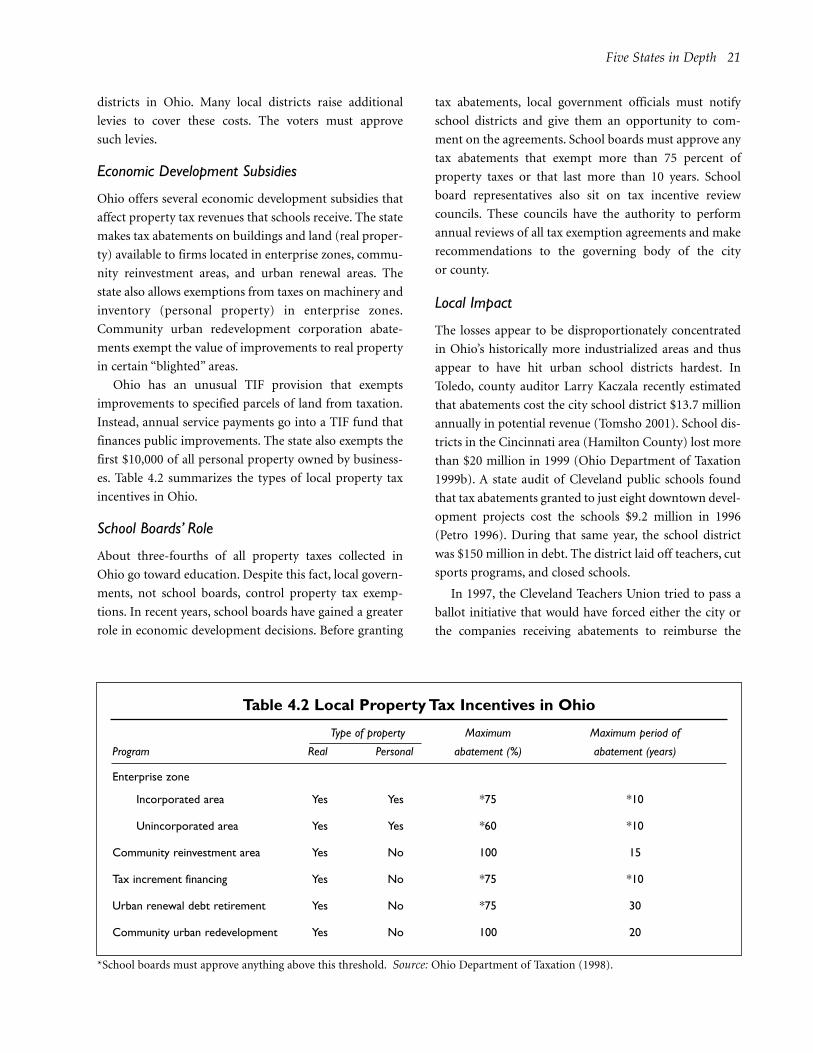
Five States in Depth 21
districts in Ohio. Many local districts raise additional
levies to cover these costs. The voters must approve
such levies.
Economic Development Subsidies
Ohio offers several economic development subsidies that
affect property tax revenues that schools receive. The state
makes tax abatements on buildings and land (real proper-
ty) available to firms located in enterprise zones, commu-
nity reinvestment areas, and urban renewal areas. The
state also allows exemptions from taxes on machinery and
inventory (personal property) in enterprise zones.
Community urban redevelopment corporation abate-
ments exempt the value of improvements to real property
in certain “blighted” areas.
Ohio has an unusual TIF provision that exempts
improvements to specified parcels of land from taxation.
Instead, annual service payments go into a TIF fund that
finances public improvements. The state also exempts the
first $10,000 of all personal property owned by business-
es. Table 4.2 summarizes the types of local property tax
incentives in Ohio.
School Boards’ Role
About three-fourths of all property taxes collected in
Ohio go toward education. Despite this fact, local govern-
ments, not school boards, control property tax exemp-
tions. In recent years, school boards have gained a greater
role in economic development decisions. Before granting
tax abatements, local government officials must notify
school districts and give them an opportunity to com-
ment on the agreements. School boards must approve any
tax abatements that exempt more than 75 percent of
property taxes or that last more than 10 years. School
board representatives also sit on tax incentive review
councils. These councils have the authority to perform
annual reviews of all tax exemption agreements and make
recommendations to the governing body of the city
or county.
Local Impact
The losses appear to be disproportionately concentrated
in Ohio’s historically more industrialized areas and thus
appear to have hit urban school districts hardest. In
Toledo, county auditor Larry Kaczala recently estimated
that abatements cost the city school district $13.7 million
annually in potential revenue (Tomsho 2001). School dis-
tricts in the Cincinnati area (Hamilton County) lost more
than $20 million in 1999 (Ohio Department of Taxation
1999b). A state audit of Cleveland public schools found
that tax abatements granted to just eight downtown devel-
opment projects cost the schools $9.2 million in 1996
(Petro 1996). During that same year, the school district
was $150 million in debt. The district laid off teachers, cut
sports programs, and closed schools.
In 1997, the Cleveland Teachers Union tried to pass a
ballot initiative that would have forced either the city or
the companies receiving abatements to reimburse the
*School boards must approve anything above this threshold. Source: Ohio Department of Taxation (1998).
Table 4.2 Local Property Tax Incentives in Ohio
Type of property Maximum Maximum period of
Program Real Personal abatement (%) abatement (years)
Enterprise zone
Incorporated area Yes Yes *75 *10
Unincorporated area Yes Yes *60 *10
Community reinvestment area Yes No 100 15
Tax increment financing Yes No *75 *10
Urban renewal debt retirement Yes No *75 30
Community urban redevelopment Yes No 100 20

22 Protecting Public Education
schools fully for the lost revenue. The ballot initiative
failed, but the city council has since exercised more cau-
tion in awarding property tax abatements.
State Impact
In 1999, more than $3.3 billion of real property was
exempt from taxation in Ohio (Ohio Department of
Taxation 1999b). Multiplying this figure by the average
school district tax rate for that same year yields an esti-
mate that schools missed out on almost $102 million in
revenue from property tax exemptions in that year alone
(Ohio Department of Taxation 2000).
$3,327,428,725 X .03065 = $101,985,690
The state shouldered most of this revenue loss by pro-
viding aid payments to local districts. These are losses that
the state can hardly afford in the current budget climate.
Indeed, the Ohio legislature recently had to take $140 mil-
lion out of its rainy day fund to cover budget shortfalls
(McDonald 2001).
Ohio does not collect data on the aggregate value of
exempt personal property in enterprise zones. This is a sur-
prising omission in a state that has 240 enterprise zones.
State Reimbursement
In Ohio, the state aid formula partially reimburses local
school districts for economic development subsidies. In
essence, the state’s aid payments enable local governments
to achieve the foundation level of spending for each stu-
dent. This practice does not reimburse school districts for
losses on supplemental levies raised beyond the 23 mills
prescribed by the foundation formula. In 1999, the aver-
age tax rate exceeded the foundation rate by about 7 mills
(Ohio Department of Taxation 2000). These additional
mills include voter-approved levies that cover the costs of
building construction and maintenance.
The state does reimburse local governments for a stan-
dard exemption offered to all companies on $10,000 of
personal property. In 1999, this deduction exempted $1.2
billion of personal property from taxation (Ohio
Department of Taxation 1999a). Multiplying this figure by
the average school district tax rate for personal property
reveals that the state reimbursed local schools for approx-
imately $58 million of lost personal property taxes (Ohio
Department of Taxation 1999a).
$1,200,000,000 X 0.04827 = $57,924,000
Local Personal Income Tax Reimbursement
By law, local governments must share with schools some
of the income tax benefits from subsidized economic
development projects—that is, half of the value of indi-
vidual income tax revenue generated by any new jobs in
projects with at least $1 million of new payroll. This is a
relatively new program, and the state does not collect data
on it.
Reimbursement by Companies
Local governments and school districts can negotiate a
payment in lieu of taxes (PILOT) with a company in an
enterprise zone. Information on these agreements is only
available for agreements executed beginning in 1999. In
that year, the annual payments equaled $1,838,643 for
PILOT negotiated that year.
Table 4.3 presents a summary of the information we
gathered for Ohio.
Case Study 2: Florida
Florida schools receive about a third of their combined
state and local funding (i.e., excluding federal funding)
from local property taxes (U.S. Department of Education
2001). The state funds come principally from the state’s
general fund. Florida is one of only 9 states that do not
levy personal income taxes, so the general fund relies
heavily on sales tax revenue. Florida uses a foundation sys-
tem to allocate state aid to local governments to support
basic costs. In addition to the basic foundation aid, the
state provides categorical aid to local districts for a variety
of programs including capital outlay, technology, reduced
class size, vouchers, and debt service. Table 4.4 presents a
summary of school funding in Florida, 1998–99.
Local Economic Development Subsidies
Florida has three kinds of local tax incentives that affect
property taxes: property tax abatements, enterprise zones,
and tax increment financing. None of these affect schools,
however, because Florida stipulates that local jurisdictions
can abate or divert into TIF plans only county and city
taxes. Florida explicitly forbids abatement or diversion
into TIF of the school portion of local property taxes.
In addition, although the state allows the subsidies,
state law requires voters of each county to approve an
enabling referendum before county officials can start
awarding property tax abatements. This requirement also

Five States in Depth 23
applies to tax abatements granted to businesses located in
enterprise zones. Florida currently has 34 such zones,
which offer both state and local tax breaks. Florida enter-
prise zones cost state and local governments about $68
million between 1995 and 1999. Local governments there
also have the authority to create TIF districts.
State Economic Development SubsidiesFlorida offers businesses a variety of incentives at the state
level. These subsidies totaled $275 million in 2000 (Florida
State Senate 2001: 44, 109–14). The state makes sales and
corporate income tax breaks available to businesses locat-
ed in enterprise zones, rural areas, and “urban high crime
areas.” Florida targets the sales tax exemptions at new man-
ufacturing businesses, silicon technology companies, and
businesses performing research and development. These
subsidies have an indirect impact on school revenues by
their effect on the state’s general fund, which supplies
about 60 percent of school funding. Table 4.5 presents a
summary of the information we gathered for Florida.
Case Study 3: Minnesota
The 2001 legislative session in Minnesota gave extensive
consideration to property taxes and school funding, in
part because Governor Ventura staged a showdown with
the legislature by refusing to sign any bills that did not
adhere to his “revolutionary” tax proposal. The new legis-
lation will eliminate local general education levies. School
districts had depended on these levies as primary sources
of local support. The new tax law also lowered the “class
rates” for various types of property. Class rates determine
the taxable percentage of a property’s market value.
The elimination of the general education levy will
reduce local property tax rates significantly in Minnesota,
Table 4.3 Summary of Policies, Responses, and Effects of Subsidies in Ohio
Subsidy policy or response Amount / detail of effect
School district taxes abated for economic development(real property only) $101,985,690
School district taxes exempted from standard deduction of personal property $57,924,000
School board role Can veto any TIF or property tax exemptions that lastmore than 10 years or divert more than 75% of propertytaxes.
Has a seat on tax incentive review council.
State reimbursement Partial reimbursement through foundation funding formula.
Full reimbursement for standard deduction of personalproperty.
Local reimbursement Not available
Payments in lieu of taxes (PILOT) for deals negotiated in 1999 $1,838,643
Source: U.S. Department of Education (2001).
Table 4.4 Florida School Funding from State and Local Revenues, 1998–99
Funding source Amount ($)
State school aid (all programs, total) 8 billion
Local school revenue (total) 3.9 billion
(Property tax) (3.9 billion)
(Other local-source tax revenue) (0)
(Local-source nontax revenue) (0)
State and local school revenue (TOTAL) 11.9 billion
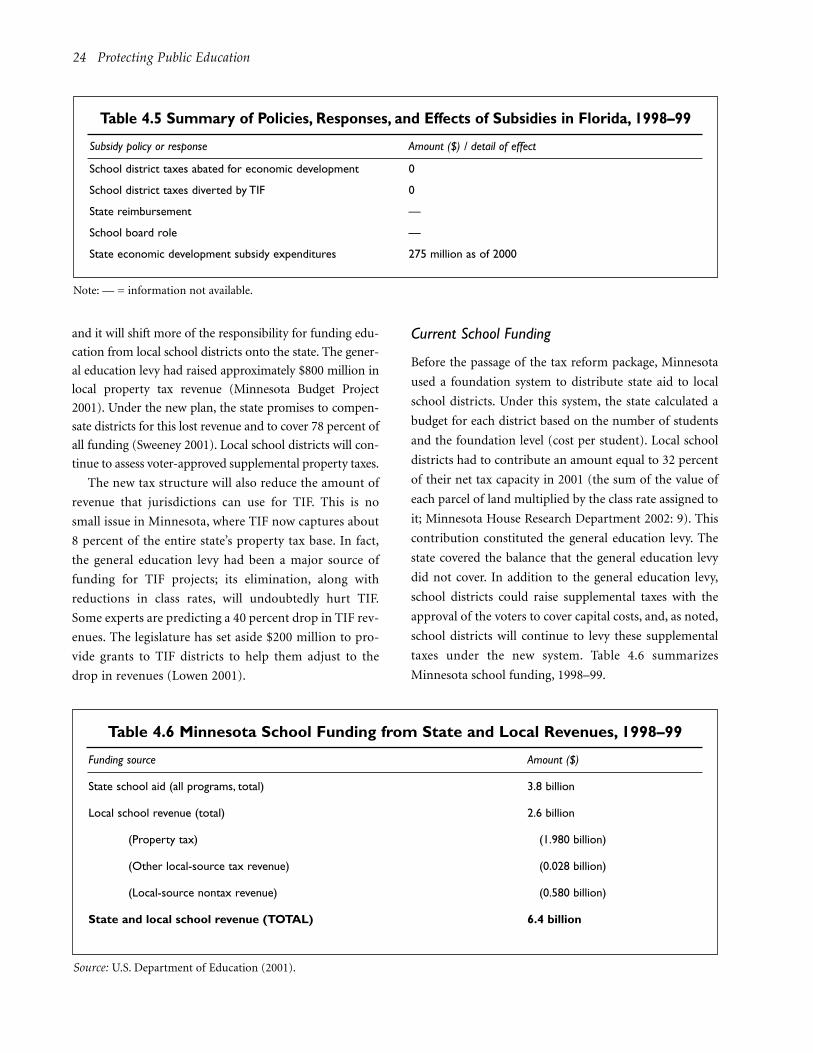
24 Protecting Public Education
and it will shift more of the responsibility for funding edu-
cation from local school districts onto the state. The gener-
al education levy had raised approximately $800 million in
local property tax revenue (Minnesota Budget Project
2001). Under the new plan, the state promises to compen-
sate districts for this lost revenue and to cover 78 percent of
all funding (Sweeney 2001). Local school districts will con-
tinue to assess voter-approved supplemental property taxes.
The new tax structure will also reduce the amount of
revenue that jurisdictions can use for TIF. This is no
small issue in Minnesota, where TIF now captures about
8 percent of the entire state’s property tax base. In fact,
the general education levy had been a major source of
funding for TIF projects; its elimination, along with
reductions in class rates, will undoubtedly hurt TIF.
Some experts are predicting a 40 percent drop in TIF rev-
enues. The legislature has set aside $200 million to pro-
vide grants to TIF districts to help them adjust to the
drop in revenues (Lowen 2001).
Current School Funding
Before the passage of the tax reform package, Minnesota
used a foundation system to distribute state aid to local
school districts. Under this system, the state calculated a
budget for each district based on the number of students
and the foundation level (cost per student). Local school
districts had to contribute an amount equal to 32 percent
of their net tax capacity in 2001 (the sum of the value of
each parcel of land multiplied by the class rate assigned to
it; Minnesota House Research Department 2002: 9). This
contribution constituted the general education levy. The
state covered the balance that the general education levy
did not cover. In addition to the general education levy,
school districts could raise supplemental taxes with the
approval of the voters to cover capital costs, and, as noted,
school districts will continue to levy these supplemental
taxes under the new system. Table 4.6 summarizes
Minnesota school funding, 1998–99.
Source: U.S. Department of Education (2001).
Table 4.6 Minnesota School Funding from State and Local Revenues, 1998–99
Funding source Amount ($)
State school aid (all programs, total) 3.8 billion
Local school revenue (total) 2.6 billion
(Property tax) (1.980 billion)
(Other local-source tax revenue) (0.028 billion)
(Local-source nontax revenue) (0.580 billion)
State and local school revenue (TOTAL) 6.4 billion
Note: — = information not available.
Table 4.5 Summary of Policies, Responses, and Effects of Subsidies in Florida, 1998–99
Subsidy policy or response Amount ($) / detail of effect
School district taxes abated for economic development 0
School district taxes diverted by TIF 0
State reimbursement —
School board role —
State economic development subsidy expenditures 275 million as of 2000
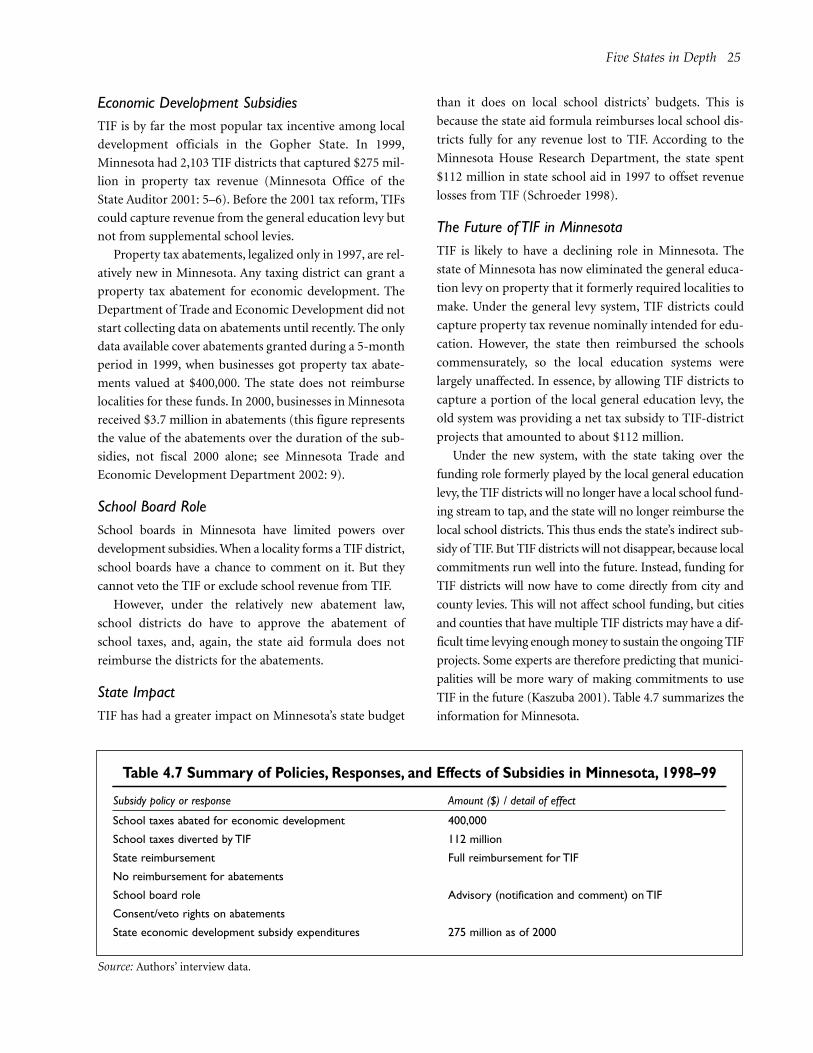
Table 4.7 Summary of Policies, Responses, and Effects of Subsidies in Minnesota, 1998–99
Subsidy policy or response Amount ($) / detail of effect
School taxes abated for economic development 400,000
School taxes diverted by TIF 112 million
State reimbursement Full reimbursement for TIF
No reimbursement for abatements
School board role Advisory (notification and comment) on TIF
Consent/veto rights on abatements
State economic development subsidy expenditures 275 million as of 2000
Five States in Depth 25
Economic Development SubsidiesTIF is by far the most popular tax incentive among local
development officials in the Gopher State. In 1999,
Minnesota had 2,103 TIF districts that captured $275 mil-
lion in property tax revenue (Minnesota Office of the
State Auditor 2001: 5–6). Before the 2001 tax reform, TIFs
could capture revenue from the general education levy but
not from supplemental school levies.
Property tax abatements, legalized only in 1997, are rel-
atively new in Minnesota. Any taxing district can grant a
property tax abatement for economic development. The
Department of Trade and Economic Development did not
start collecting data on abatements until recently. The only
data available cover abatements granted during a 5-month
period in 1999, when businesses got property tax abate-
ments valued at $400,000. The state does not reimburse
localities for these funds. In 2000, businesses in Minnesota
received $3.7 million in abatements (this figure represents
the value of the abatements over the duration of the sub-
sidies, not fiscal 2000 alone; see Minnesota Trade and
Economic Development Department 2002: 9).
School Board RoleSchool boards in Minnesota have limited powers over
development subsidies. When a locality forms a TIF district,
school boards have a chance to comment on it. But they
cannot veto the TIF or exclude school revenue from TIF.
However, under the relatively new abatement law,
school districts do have to approve the abatement of
school taxes, and, again, the state aid formula does not
reimburse the districts for the abatements.
State ImpactTIF has had a greater impact on Minnesota’s state budget
than it does on local school districts’ budgets. This is
because the state aid formula reimburses local school dis-
tricts fully for any revenue lost to TIF. According to the
Minnesota House Research Department, the state spent
$112 million in state school aid in 1997 to offset revenue
losses from TIF (Schroeder 1998).
The Future of TIF in MinnesotaTIF is likely to have a declining role in Minnesota. The
state of Minnesota has now eliminated the general educa-
tion levy on property that it formerly required localities to
make. Under the general levy system, TIF districts could
capture property tax revenue nominally intended for edu-
cation. However, the state then reimbursed the schools
commensurately, so the local education systems were
largely unaffected. In essence, by allowing TIF districts to
capture a portion of the local general education levy, the
old system was providing a net tax subsidy to TIF-district
projects that amounted to about $112 million.
Under the new system, with the state taking over the
funding role formerly played by the local general education
levy, the TIF districts will no longer have a local school fund-
ing stream to tap, and the state will no longer reimburse the
local school districts. This thus ends the state’s indirect sub-
sidy of TIF. But TIF districts will not disappear, because local
commitments run well into the future. Instead, funding for
TIF districts will now have to come directly from city and
county levies. This will not affect school funding, but cities
and counties that have multiple TIF districts may have a dif-
ficult time levying enough money to sustain the ongoing TIF
projects. Some experts are therefore predicting that munici-
palities will be more wary of making commitments to use
TIF in the future (Kaszuba 2001). Table 4.7 summarizes the
information for Minnesota.
Source: Authors’ interview data.
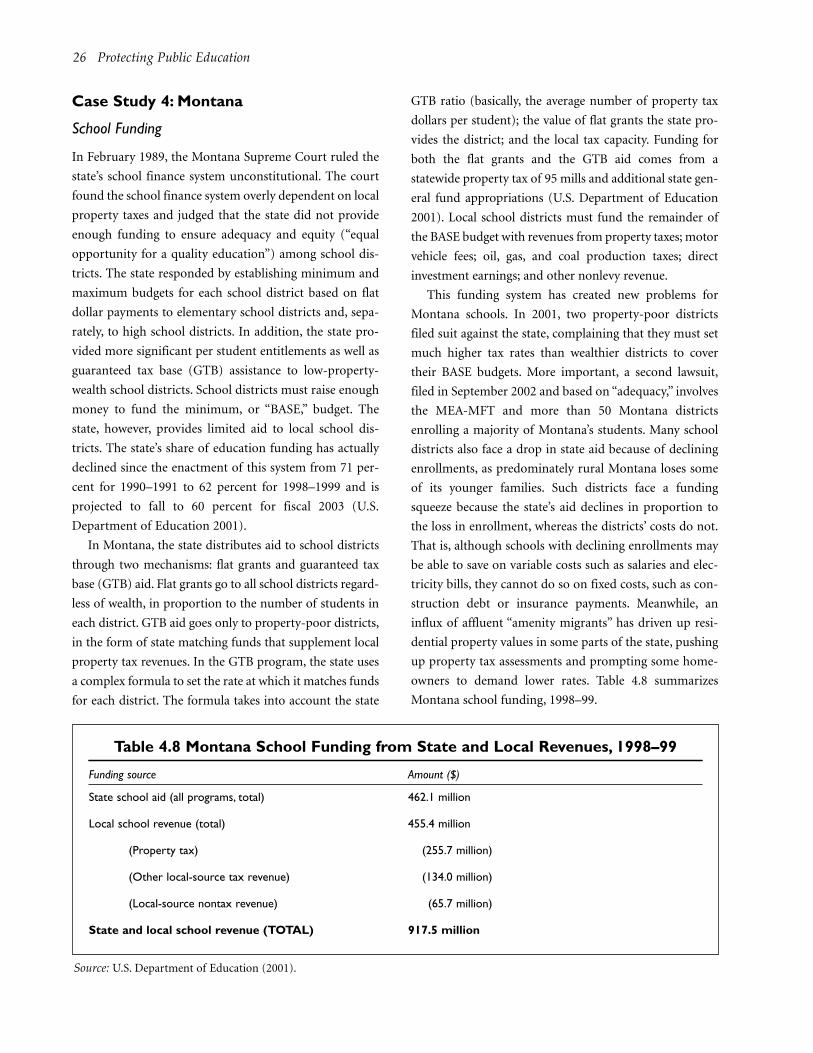
Source: U.S. Department of Education (2001).
26 Protecting Public Education
Case Study 4: Montana
School Funding
In February 1989, the Montana Supreme Court ruled the
state’s school finance system unconstitutional. The court
found the school finance system overly dependent on local
property taxes and judged that the state did not provide
enough funding to ensure adequacy and equity (“equal
opportunity for a quality education”) among school dis-
tricts. The state responded by establishing minimum and
maximum budgets for each school district based on flat
dollar payments to elementary school districts and, sepa-
rately, to high school districts. In addition, the state pro-
vided more significant per student entitlements as well as
guaranteed tax base (GTB) assistance to low-property-
wealth school districts. School districts must raise enough
money to fund the minimum, or “BASE,” budget. The
state, however, provides limited aid to local school dis-
tricts. The state’s share of education funding has actually
declined since the enactment of this system from 71 per-
cent for 1990–1991 to 62 percent for 1998–1999 and is
projected to fall to 60 percent for fiscal 2003 (U.S.
Department of Education 2001).
In Montana, the state distributes aid to school districts
through two mechanisms: flat grants and guaranteed tax
base (GTB) aid. Flat grants go to all school districts regard-
less of wealth, in proportion to the number of students in
each district. GTB aid goes only to property-poor districts,
in the form of state matching funds that supplement local
property tax revenues. In the GTB program, the state uses
a complex formula to set the rate at which it matches funds
for each district. The formula takes into account the state
GTB ratio (basically, the average number of property tax
dollars per student); the value of flat grants the state pro-
vides the district; and the local tax capacity. Funding for
both the flat grants and the GTB aid comes from a
statewide property tax of 95 mills and additional state gen-
eral fund appropriations (U.S. Department of Education
2001). Local school districts must fund the remainder of
the BASE budget with revenues from property taxes; motor
vehicle fees; oil, gas, and coal production taxes; direct
investment earnings; and other nonlevy revenue.
This funding system has created new problems for
Montana schools. In 2001, two property-poor districts
filed suit against the state, complaining that they must set
much higher tax rates than wealthier districts to cover
their BASE budgets. More important, a second lawsuit,
filed in September 2002 and based on “adequacy,” involves
the MEA-MFT and more than 50 Montana districts
enrolling a majority of Montana’s students. Many school
districts also face a drop in state aid because of declining
enrollments, as predominately rural Montana loses some
of its younger families. Such districts face a funding
squeeze because the state’s aid declines in proportion to
the loss in enrollment, whereas the districts’ costs do not.
That is, although schools with declining enrollments may
be able to save on variable costs such as salaries and elec-
tricity bills, they cannot do so on fixed costs, such as con-
struction debt or insurance payments. Meanwhile, an
influx of affluent “amenity migrants” has driven up resi-
dential property values in some parts of the state, pushing
up property tax assessments and prompting some home-
owners to demand lower rates. Table 4.8 summarizes
Montana school funding, 1998–99.
Table 4.8 Montana School Funding from State and Local Revenues, 1998–99
Funding source Amount ($)
State school aid (all programs, total) 462.1 million
Local school revenue (total) 455.4 million
(Property tax) (255.7 million)
(Other local-source tax revenue) (134.0 million)
(Local-source nontax revenue) (65.7 million)
State and local school revenue (TOTAL) 917.5 million

Source: Authors’ interview data. Note: GTB = guaranteed tax base.
Table 4.9 Summary of Policies, Responses, and Effects of Subsidies in Montana, 1998–99
Subsidy policy or response Amount ($) / detail of effect
School taxes abated for economic development 1.5 million
School taxes diverted by TIF 3.6 million
State reimbursement None for districts that do not receive GTB aid
Partial for districts receiving GTB aid
School board role No formal role; consulted on an informal basis
Five States in Depth 27
Economic Development Subsidies
Montana offers businesses several tax breaks that affect
school revenues. Local governments can offer property tax
abatements to new and expanding businesses as well as to
businesses that are remodeling their structures. Local gov-
ernments also can exempt entire industrial parks and
business “incubators” from taxation. These exemptions
apply only to local school taxes, not to Montana’s signifi-
cant state property taxes.
Montana allows TIF, and the state currently has 20 TIF
districts. Unlike abatements, TIFs divert both state and
local property taxes that would otherwise go to schools.
School Board Role
School boards play no formal role in creating TIF districts
or abating property taxes. However, local jurisdictions
usually consult school boards before authorizing the for-
mation of TIF districts. An official at the Montana School
Board Association reported that school boards in
Montana generally support TIF (personal communica-
tion, Montana School Boards Association, June 6, 2001).
This is somewhat surprising, considering the fact that TIFs
capture millions of dollars of school revenue
each year.
Impact of Subsidies on School Revenues
According to the Department of Revenue, approximately
$2.5 million in property tax revenue was lost to property
tax abatements in 2000 (Tax Policy and Research 1998:
63). Of that amount, approximately $1.5 million would
have gone to local school districts (proportion of local
property taxes raised by school districts calculated from
data in Tax Policy and Research 2000: 99). During that
same year, TIF diverted approximately $24 million of
property taxes. This amount includes both local and state
property taxes—in all, about $13.6 million originally ear-
marked for education (Simshaw 2000: 12).
State Reimbursement
The complexity of Montana’s school finance formula
makes it hard to generalize about levels of state reim-
bursement to schools to mitigate the effects of corporate
tax subsidies. Districts receive different amounts and types
of state aid. All districts get the flat grants, which are not
proportional to local property wealth or to levels of sub-
sidy; the grants may lessen a district’s dependence on local
property taxes but are not specifically a reimbursement.
GTB matching funds to property-poor districts are a par-
tial reimbursement for subsidies because under the GTB
formula, subsidies make districts appear poorer than they
really are. That is, if a district has less taxable property
because of abatements or TIF, the state matches local
levies at a slightly higher rate.
Almost one-third of school districts in Montana
receive no GTB aid (Montana Office of Public Instruction
2001) and hence no offset from the state for revenues lost
to subsidies. Those areas must compensate by setting
higher tax rates. To qualify for GTB aid, a district’s GTB
ratio (essentially, the ratio of local tax capacity to students
in a district) must be lower than the state GTB ratio (ratio
of statewide tax capacity to students in the state). Because
TIFs and abatements lower a district’s tax capacity, they
may help some districts qualify for more GTB aid. Yet,
TIFs and abatements also lower the statewide tax capacity,
which may make it more difficult for some districts to
qualify for state aid. Table 4.9 summarizes the information
we gathered for Montana.
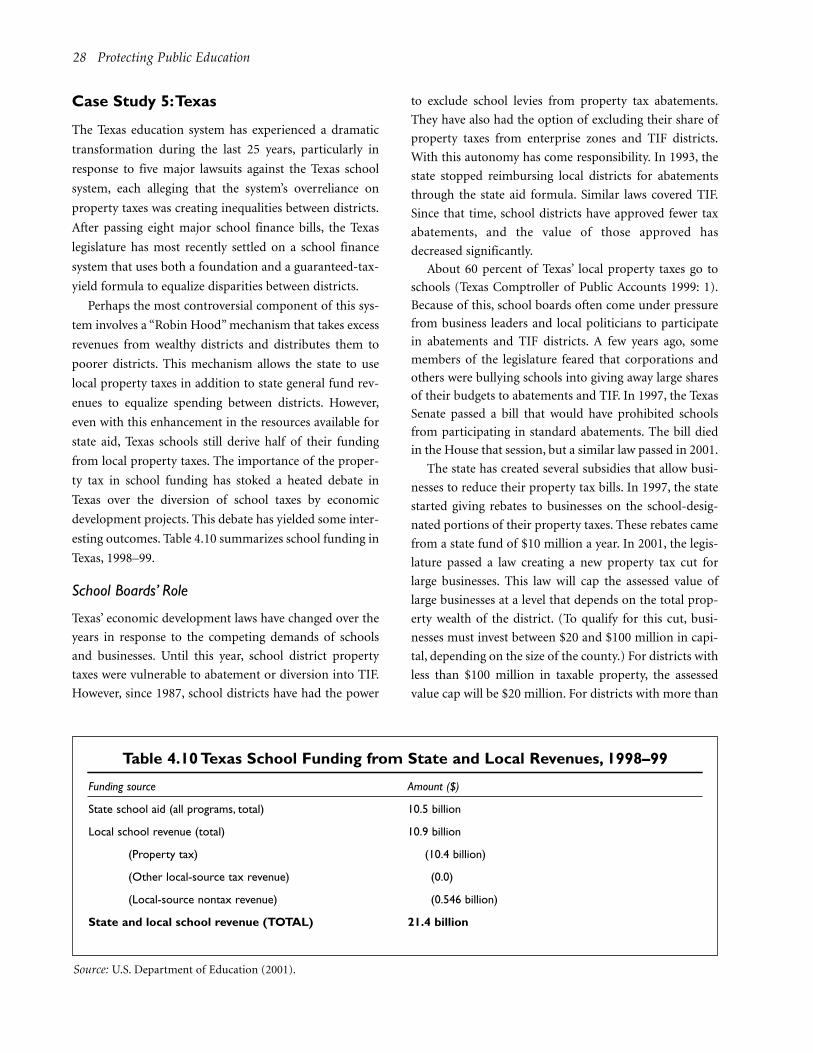
28 Protecting Public Education
Case Study 5:Texas
The Texas education system has experienced a dramatic
transformation during the last 25 years, particularly in
response to five major lawsuits against the Texas school
system, each alleging that the system’s overreliance on
property taxes was creating inequalities between districts.
After passing eight major school finance bills, the Texas
legislature has most recently settled on a school finance
system that uses both a foundation and a guaranteed-tax-
yield formula to equalize disparities between districts.
Perhaps the most controversial component of this sys-
tem involves a “Robin Hood” mechanism that takes excess
revenues from wealthy districts and distributes them to
poorer districts. This mechanism allows the state to use
local property taxes in addition to state general fund rev-
enues to equalize spending between districts. However,
even with this enhancement in the resources available for
state aid, Texas schools still derive half of their funding
from local property taxes. The importance of the proper-
ty tax in school funding has stoked a heated debate in
Texas over the diversion of school taxes by economic
development projects. This debate has yielded some inter-
esting outcomes. Table 4.10 summarizes school funding in
Texas, 1998–99.
School Boards’ Role
Texas’ economic development laws have changed over the
years in response to the competing demands of schools
and businesses. Until this year, school district property
taxes were vulnerable to abatement or diversion into TIF.
However, since 1987, school districts have had the power
to exclude school levies from property tax abatements.
They have also had the option of excluding their share of
property taxes from enterprise zones and TIF districts.
With this autonomy has come responsibility. In 1993, the
state stopped reimbursing local districts for abatements
through the state aid formula. Similar laws covered TIF.
Since that time, school districts have approved fewer tax
abatements, and the value of those approved has
decreased significantly.
About 60 percent of Texas’ local property taxes go to
schools (Texas Comptroller of Public Accounts 1999: 1).
Because of this, school boards often come under pressure
from business leaders and local politicians to participate
in abatements and TIF districts. A few years ago, some
members of the legislature feared that corporations and
others were bullying schools into giving away large shares
of their budgets to abatements and TIF. In 1997, the Texas
Senate passed a bill that would have prohibited schools
from participating in standard abatements. The bill died
in the House that session, but a similar law passed in 2001.
The state has created several subsidies that allow busi-
nesses to reduce their property tax bills. In 1997, the state
started giving rebates to businesses on the school-desig-
nated portions of their property taxes. These rebates came
from a state fund of $10 million a year. In 2001, the legis-
lature passed a law creating a new property tax cut for
large businesses. This law will cap the assessed value of
large businesses at a level that depends on the total prop-
erty wealth of the district. (To qualify for this cut, busi-
nesses must invest between $20 and $100 million in capi-
tal, depending on the size of the county.) For districts with
less than $100 million in taxable property, the assessed
value cap will be $20 million. For districts with more than
Source: U.S. Department of Education (2001).
Table 4.10 Texas School Funding from State and Local Revenues, 1998–99
Funding source Amount ($)
State school aid (all programs, total) 10.5 billion
Local school revenue (total) 10.9 billion
(Property tax) (10.4 billion)
(Other local-source tax revenue) (0.0)
(Local-source nontax revenue) (0.546 billion)
State and local school revenue (TOTAL) 21.4 billion
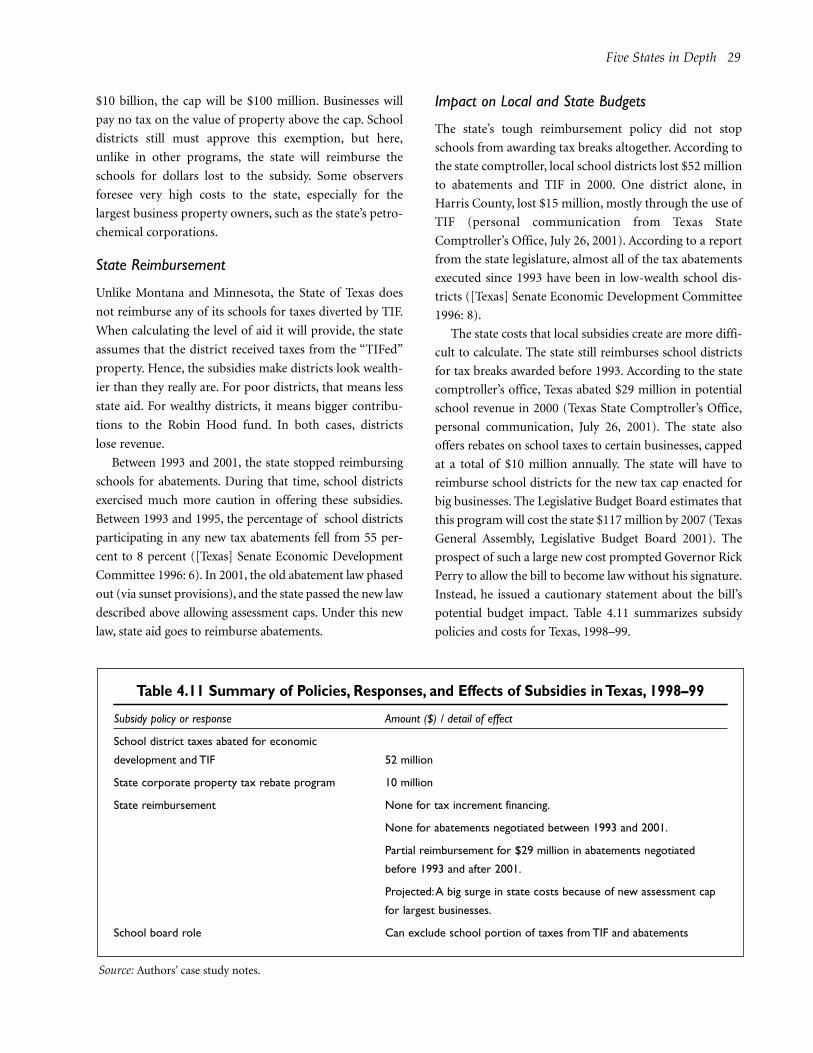
Source: Authors’ case study notes.
Table 4.11 Summary of Policies, Responses, and Effects of Subsidies in Texas, 1998–99
Subsidy policy or response Amount ($) / detail of effect
School district taxes abated for economic
development and TIF 52 million
State corporate property tax rebate program 10 million
State reimbursement None for tax increment financing.
None for abatements negotiated between 1993 and 2001.
Partial reimbursement for $29 million in abatements negotiated
before 1993 and after 2001.
Projected:A big surge in state costs because of new assessment cap
for largest businesses.
School board role Can exclude school portion of taxes from TIF and abatements
Five States in Depth 29
$10 billion, the cap will be $100 million. Businesses will
pay no tax on the value of property above the cap. School
districts still must approve this exemption, but here,
unlike in other programs, the state will reimburse the
schools for dollars lost to the subsidy. Some observers
foresee very high costs to the state, especially for the
largest business property owners, such as the state’s petro-
chemical corporations.
State Reimbursement
Unlike Montana and Minnesota, the State of Texas does
not reimburse any of its schools for taxes diverted by TIF.
When calculating the level of aid it will provide, the state
assumes that the district received taxes from the “TIFed”
property. Hence, the subsidies make districts look wealth-
ier than they really are. For poor districts, that means less
state aid. For wealthy districts, it means bigger contribu-
tions to the Robin Hood fund. In both cases, districts
lose revenue.
Between 1993 and 2001, the state stopped reimbursing
schools for abatements. During that time, school districts
exercised much more caution in offering these subsidies.
Between 1993 and 1995, the percentage of school districts
participating in any new tax abatements fell from 55 per-
cent to 8 percent ([Texas] Senate Economic Development
Committee 1996: 6). In 2001, the old abatement law phased
out (via sunset provisions), and the state passed the new law
described above allowing assessment caps. Under this new
law, state aid goes to reimburse abatements.
Impact on Local and State Budgets
The state’s tough reimbursement policy did not stop
schools from awarding tax breaks altogether. According to
the state comptroller, local school districts lost $52 million
to abatements and TIF in 2000. One district alone, in
Harris County, lost $15 million, mostly through the use of
TIF (personal communication from Texas State
Comptroller’s Office, July 26, 2001). According to a report
from the state legislature, almost all of the tax abatements
executed since 1993 have been in low-wealth school dis-
tricts ([Texas] Senate Economic Development Committee
1996: 8).
The state costs that local subsidies create are more diffi-
cult to calculate. The state still reimburses school districts
for tax breaks awarded before 1993. According to the state
comptroller’s office, Texas abated $29 million in potential
school revenue in 2000 (Texas State Comptroller’s Office,
personal communication, July 26, 2001). The state also
offers rebates on school taxes to certain businesses, capped
at a total of $10 million annually. The state will have to
reimburse school districts for the new tax cap enacted for
big businesses. The Legislative Budget Board estimates that
this program will cost the state $117 million by 2007 (Texas
General Assembly, Legislative Budget Board 2001). The
prospect of such a large new cost prompted Governor Rick
Perry to allow the bill to become law without his signature.
Instead, he issued a cautionary statement about the bill’s
potential budget impact. Table 4.11 summarizes subsidy
policies and costs for Texas, 1998–99.
Other Subsidies and Their Effect on State Revenues for Schools
5
31
Although this study focuses on local property tax
losses, many other economic development subsi-
dies affect state revenues. Most states offer com-
panies exemptions or credits on corporate income, sales,
utility, and inventory taxes. We have attached two tables
from the Council of State Governments that detail tax and
financial subsidies, respectively; the sheer number of such
programs in most states today is enormous. Indeed, it is
not unusual for a major deal to include more than a dozen
different kinds of subsidies.
It is difficult to determine whether a state spends less
on education—or how much less it spends—because of
development subsidies. Education budgeting is very com-
plex: both the availability of revenue and the demands
placed on the education system influence it. Other influ-
ences on the level of state spending on education are elec-
tion cycles, court challenges, local property tax rates, and
additional services for children with special needs
(Augenblick 2001b). We are not asserting here that rev-
enue lost to subsidies results in a dollar-for-dollar
decrease in education spending, but we are suggesting that
to the extent that state development subsidies affect the
amount of money available for schools, a relationship
exists between state tax breaks and school finance. That
said, the 20-year trend in enactment of development sub-
sidies, and its impact on state budgets, is an undeniable
influence on education spending.
Figure 5.1 shows state tax collections for 1998–99. As the
figure shows, corporate income taxes account for 6 percent
of all tax collections and are an important source of revenue
for schools. Figure 5.2 shows states’ general fund expendi-
tures for the same period. Note that education spending
accounts for more than a third of general fund expenditures,
so any reduction in collections going into the general fund
could hurt the schools. In particular, tax spending for eco-
nomic development reduces already declining corporate
contributions to the general fund, shifts the tax burden from
corporations to individual taxpayers, or both.
Tables 5.1 and 5.2 show state tax incentives for business and
state financial incentives for business, respectively, for 1998.

32 Protecting Public Education
Figure 5.1 Percentages of State Tax Collections by Type, 1998–1999
Figure 5.2. States’ General Fund Expenditures, 1998–1999
Source: U.S. Census Bureau (2001) and National Association of State Budget Officers (2000: 8).
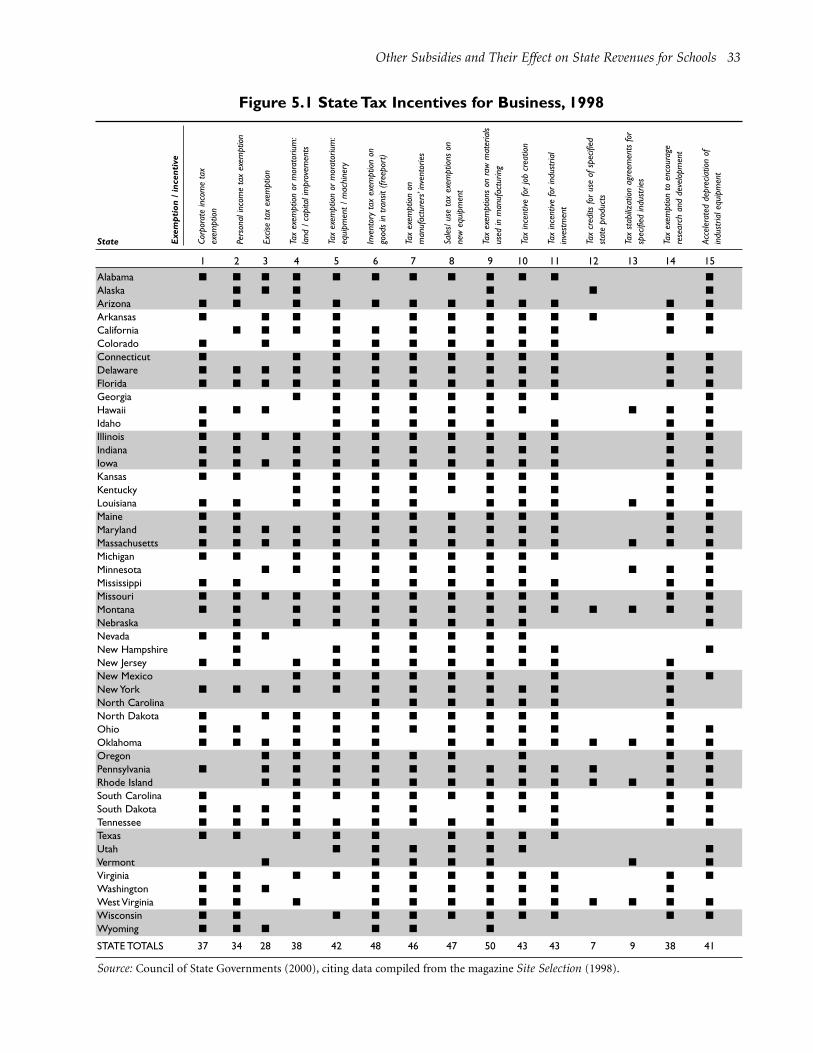
Other Subsidies and Their Effect on State Revenues for Schools 33
Figure 5.1 State Tax Incentives for Business, 1998
Exe
mp
tion
/ in
cent
ive
Corp
orat
e in
com
e ta
x ex
empt
ion
Pers
onal
inco
me
tax
exem
ptio
n
Excis
e ta
x ex
empt
ion
Tax
exem
ptio
n or
mor
ator
ium
:la
nd /
cap
ital i
mpr
ovem
ents
Tax
exem
ptio
n or
mor
ator
ium
:eq
uipm
ent
/ m
achi
nery
Inve
ntor
y ta
x ex
empt
ion
on
good
s in
tra
nsit
(free
port
)
Tax
exem
ptio
n on
m
anuf
actu
rers
’inv
ento
ries
Sale
s/ u
se t
ax e
xem
ptio
ns o
n ne
w e
quip
men
t
Tax
exem
ptio
ns o
n ra
w m
ater
ials
used
in m
anuf
actu
ring
Tax
ince
ntive
for
job
crea
tion
Tax
ince
ntive
for
indu
stria
l in
vest
men
t
Tax
cred
its fo
r us
e of
spe
cifie
d st
ate
prod
ucts
Tax
stab
ilizat
ion
agre
emen
ts fo
r sp
ecifi
ed in
dust
ries
Tax
exem
ptio
n to
enc
oura
ge
rese
arch
and
dev
elop
men
t
Acce
lera
ted
depr
ecia
tion
of
indu
stria
l equ
ipm
ent
State
1 2 3 4 5 6 7 8 9 10 11 12 13 14 15
Alabama ■ ■ ■ ■ ■ ■ ■ ■ ■ ■ ■ ■
Alaska ■ ■ ■ ■ ■ ■
Arizona ■ ■ ■ ■ ■ ■ ■ ■ ■ ■ ■ ■
Arkansas ■ ■ ■ ■ ■ ■ ■ ■ ■ ■ ■ ■
California ■ ■ ■ ■ ■ ■ ■ ■ ■ ■ ■ ■
Colorado ■ ■ ■ ■ ■ ■ ■ ■ ■
Connecticut ■ ■ ■ ■ ■ ■ ■ ■ ■ ■ ■
Delaware ■ ■ ■ ■ ■ ■ ■ ■ ■ ■ ■ ■ ■
Florida ■ ■ ■ ■ ■ ■ ■ ■ ■ ■ ■ ■ ■
Georgia ■ ■ ■ ■ ■ ■ ■ ■ ■
Hawaii ■ ■ ■ ■ ■ ■ ■ ■ ■ ■ ■ ■
Idaho ■ ■ ■ ■ ■ ■ ■ ■ ■
Illinois ■ ■ ■ ■ ■ ■ ■ ■ ■ ■ ■ ■ ■
Indiana ■ ■ ■ ■ ■ ■ ■ ■ ■ ■ ■ ■
Iowa ■ ■ ■ ■ ■ ■ ■ ■ ■ ■ ■ ■ ■
Kansas ■ ■ ■ ■ ■ ■ ■ ■ ■ ■ ■ ■
Kentucky ■ ■ ■ ■ ■ ■ ■ ■ ■ ■
Louisiana ■ ■ ■ ■ ■ ■ ■ ■ ■ ■ ■ ■
Maine ■ ■ ■ ■ ■ ■ ■ ■ ■ ■ ■
Maryland ■ ■ ■ ■ ■ ■ ■ ■ ■ ■ ■ ■ ■
Massachusetts ■ ■ ■ ■ ■ ■ ■ ■ ■ ■ ■ ■ ■ ■
Michigan ■ ■ ■ ■ ■ ■ ■ ■ ■ ■ ■
Minnesota ■ ■ ■ ■ ■ ■ ■ ■ ■ ■ ■
Mississippi ■ ■ ■ ■ ■ ■ ■ ■ ■ ■ ■
Missouri ■ ■ ■ ■ ■ ■ ■ ■ ■ ■ ■ ■ ■
Montana ■ ■ ■ ■ ■ ■ ■ ■ ■ ■ ■ ■ ■ ■
Nebraska ■ ■ ■ ■ ■ ■ ■ ■ ■
Nevada ■ ■ ■ ■ ■ ■ ■ ■
New Hampshire ■ ■ ■ ■ ■ ■ ■ ■ ■
New Jersey ■ ■ ■ ■ ■ ■ ■ ■ ■ ■ ■
New Mexico ■ ■ ■ ■ ■ ■ ■ ■ ■
New York ■ ■ ■ ■ ■ ■ ■ ■ ■ ■ ■ ■
North Carolina ■ ■ ■ ■ ■ ■ ■
North Dakota ■ ■ ■ ■ ■ ■ ■ ■ ■ ■ ■
Ohio ■ ■ ■ ■ ■ ■ ■ ■ ■ ■ ■ ■
Oklahoma ■ ■ ■ ■ ■ ■ ■ ■ ■ ■ ■ ■ ■ ■
Oregon ■ ■ ■ ■ ■ ■ ■ ■ ■
Pennsylvania ■ ■ ■ ■ ■ ■ ■ ■ ■ ■ ■ ■ ■
Rhode Island ■ ■ ■ ■ ■ ■ ■ ■ ■ ■ ■ ■ ■
South Carolina ■ ■ ■ ■ ■ ■ ■ ■ ■ ■ ■
South Dakota ■ ■ ■ ■ ■ ■ ■ ■ ■ ■ ■
Tennessee ■ ■ ■ ■ ■ ■ ■ ■ ■ ■ ■ ■
Texas ■ ■ ■ ■ ■ ■ ■ ■ ■
Utah ■ ■ ■ ■ ■ ■ ■
Vermont ■ ■ ■ ■ ■ ■ ■
Virginia ■ ■ ■ ■ ■ ■ ■ ■ ■ ■ ■ ■
Washington ■ ■ ■ ■ ■ ■ ■ ■ ■ ■
West Virginia ■ ■ ■ ■ ■ ■ ■ ■ ■ ■ ■ ■ ■
Wisconsin ■ ■ ■ ■ ■ ■ ■ ■ ■ ■ ■
Wyoming ■ ■ ■ ■ ■ ■
STATE TOTALS 37 34 28 38 42 48 46 47 50 43 43 7 9 38 41
Source: Council of State Governments (2000), citing data compiled from the magazine Site Selection (1998).
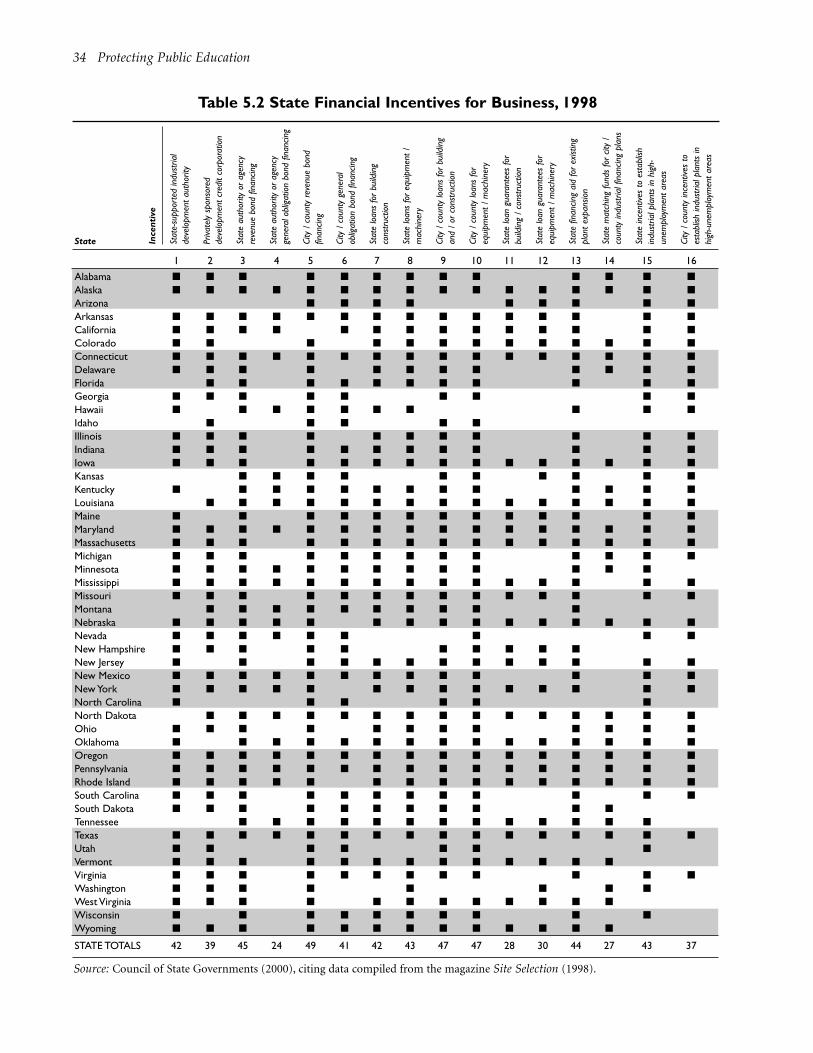
34 Protecting Public Education
Table 5.2 State Financial Incentives for Business, 1998
Ince
ntiv
e
Stat
e-su
ppor
ted
indu
stria
l de
velo
pmen
t au
thor
ity
Priva
tely
spon
sore
d de
velo
pmen
t cr
edit
corp
orat
ion
Stat
e au
thor
ity o
r ag
ency
re
venu
e bo
nd fi
nanc
ing
Stat
e au
thor
ity o
r ag
ency
ge
nera
l obl
igat
ion
bond
fina
ncin
g
City
/ c
ount
y re
venu
e bo
nd
finan
cing
City
/ c
ount
y ge
nera
l ob
ligat
ion
bond
fina
ncin
g
Stat
e lo
ans
for
build
ing
cons
truc
tion
Stat
e lo
ans
for
equi
pmen
t /
mac
hine
ry
City
/ c
ount
y lo
ans
for
build
ing
and
/ or
con
stru
ctio
n
City
/ c
ount
y lo
ans
for
equi
pmen
t /
mac
hine
ry
Stat
e lo
an g
uara
ntee
s fo
r bu
ildin
g /
cons
truc
tion
Stat
e lo
an g
uara
ntee
s fo
r eq
uipm
ent
/ m
achi
nery
Stat
e fin
ancin
g ai
d fo
r ex
istin
g pl
ant
expa
nsio
n
Stat
e m
atch
ing
fund
s fo
r cit
y /
coun
ty in
dust
rial f
inan
cing
plan
s
Stat
e in
cent
ives
to e
stab
lish
indu
stria
l pla
nts
in h
igh-
unem
ploy
men
t ar
eas
City
/ c
ount
y in
cent
ives
to
esta
blish
indu
stria
l pla
nts
in
high
-une
mpl
oym
ent
area
s
State
1 2 3 4 5 6 7 8 9 10 11 12 13 14 15 16
Alabama ■ ■ ■ ■ ■ ■ ■ ■ ■ ■ ■ ■ ■
Alaska ■ ■ ■ ■ ■ ■ ■ ■ ■ ■ ■ ■ ■ ■ ■ ■
Arizona ■ ■ ■ ■ ■ ■ ■ ■ ■
Arkansas ■ ■ ■ ■ ■ ■ ■ ■ ■ ■ ■ ■ ■ ■ ■
California ■ ■ ■ ■ ■ ■ ■ ■ ■ ■ ■ ■ ■ ■
Colorado ■ ■ ■ ■ ■ ■ ■ ■ ■ ■ ■ ■ ■
Connecticut ■ ■ ■ ■ ■ ■ ■ ■ ■ ■ ■ ■ ■ ■ ■ ■
Delaware ■ ■ ■ ■ ■ ■ ■ ■ ■ ■ ■ ■
Florida ■ ■ ■ ■ ■ ■ ■ ■ ■ ■ ■
Georgia ■ ■ ■ ■ ■ ■ ■ ■ ■
Hawaii ■ ■ ■ ■ ■ ■ ■ ■ ■ ■
Idaho ■ ■ ■ ■ ■
Illinois ■ ■ ■ ■ ■ ■ ■ ■ ■ ■ ■
Indiana ■ ■ ■ ■ ■ ■ ■ ■ ■ ■ ■ ■
Iowa ■ ■ ■ ■ ■ ■ ■ ■ ■ ■ ■ ■ ■ ■ ■
Kansas ■ ■ ■ ■ ■ ■ ■ ■ ■ ■
Kentucky ■ ■ ■ ■ ■ ■ ■ ■ ■ ■ ■ ■ ■
Louisiana ■ ■ ■ ■ ■ ■ ■ ■ ■ ■ ■ ■ ■ ■ ■
Maine ■ ■ ■ ■ ■ ■ ■ ■ ■ ■ ■ ■ ■
Maryland ■ ■ ■ ■ ■ ■ ■ ■ ■ ■ ■ ■ ■ ■ ■ ■
Massachusetts ■ ■ ■ ■ ■ ■ ■ ■ ■ ■ ■ ■ ■ ■ ■
Michigan ■ ■ ■ ■ ■ ■ ■ ■ ■ ■ ■ ■ ■
Minnesota ■ ■ ■ ■ ■ ■ ■ ■ ■ ■ ■ ■ ■
Mississippi ■ ■ ■ ■ ■ ■ ■ ■ ■ ■ ■ ■ ■ ■ ■
Missouri ■ ■ ■ ■ ■ ■ ■ ■ ■ ■ ■ ■ ■ ■
Montana ■ ■ ■ ■ ■ ■ ■ ■ ■ ■
Nebraska ■ ■ ■ ■ ■ ■ ■ ■ ■ ■ ■ ■ ■ ■ ■
Nevada ■ ■ ■ ■ ■ ■ ■ ■ ■
New Hampshire ■ ■ ■ ■ ■ ■ ■ ■ ■ ■
New Jersey ■ ■ ■ ■ ■ ■ ■ ■ ■ ■ ■ ■ ■
New Mexico ■ ■ ■ ■ ■ ■ ■ ■ ■ ■ ■ ■ ■
New York ■ ■ ■ ■ ■ ■ ■ ■ ■ ■ ■ ■ ■ ■
North Carolina ■ ■ ■ ■ ■ ■
North Dakota ■ ■ ■ ■ ■ ■ ■ ■ ■ ■ ■ ■ ■ ■ ■
Ohio ■ ■ ■ ■ ■ ■ ■ ■ ■ ■ ■ ■
Oklahoma ■ ■ ■ ■ ■ ■ ■ ■ ■ ■ ■ ■ ■ ■ ■
Oregon ■ ■ ■ ■ ■ ■ ■ ■ ■ ■ ■ ■ ■ ■ ■ ■
Pennsylvania ■ ■ ■ ■ ■ ■ ■ ■ ■ ■ ■ ■ ■ ■ ■ ■
Rhode Island ■ ■ ■ ■ ■ ■ ■ ■ ■ ■ ■ ■ ■ ■ ■
South Carolina ■ ■ ■ ■ ■ ■ ■ ■ ■ ■ ■ ■
South Dakota ■ ■ ■ ■ ■ ■ ■ ■ ■ ■ ■
Tennessee ■ ■ ■ ■ ■ ■ ■ ■ ■ ■ ■ ■ ■
Texas ■ ■ ■ ■ ■ ■ ■ ■ ■ ■ ■ ■ ■ ■ ■ ■
Utah ■ ■ ■ ■ ■ ■ ■
Vermont ■ ■ ■ ■ ■ ■ ■ ■ ■ ■ ■ ■ ■
Virginia ■ ■ ■ ■ ■ ■ ■ ■ ■ ■ ■ ■
Washington ■ ■ ■ ■ ■ ■ ■ ■
West Virginia ■ ■ ■ ■ ■ ■ ■ ■ ■ ■ ■ ■
Wisconsin ■ ■ ■ ■ ■ ■ ■ ■ ■ ■
Wyoming ■ ■ ■ ■ ■ ■ ■ ■ ■ ■ ■ ■ ■
STATE TOTALS 42 39 45 24 49 41 42 43 47 47 28 30 44 27 43 37
Source: Council of State Governments (2000), citing data compiled from the magazine Site Selection (1998).

Subsidies vary in their impact on school revenues
from state to state, but in more than half of the
states, property tax abatements, TIF, or both have a
negative effect on school revenues. Revenue losses to edu-
cation are greater in states such as Ohio, which depend
more on property taxes for school finance and offer
numerous subsidies to businesses. The losses are not as
severe in states that depend less on property taxes for
school finance, such as Minnesota, which has apparently
limited the potential impact of subsidies on school rev-
enues by adjusting the school-funding formula. Schools
lose no property tax revenue to development subsidies in
a very few states, including Florida, that specifically shield
school revenues from the effect of tax breaks.
The impact of subsidies on schools depends a great
deal on how states distribute aid to local school districts.
A few states eliminate the effects of tax subsidies to cor-
porate developers by making up the entire losses in prop-
erty tax revenues to the schools. In others, state aid reim-
burses districts only for revenue earmarked for basic
operating costs but not for capital costs; their schools thus
continue to run but may face problems when buildings
need significant maintenance or replacement. Several
states, such as Texas, provide school districts with no
reimbursement at all for property tax revenue lost to
abatements and TIF. Overall, more than half of the school
board officials surveyed believe that their state does not
fully reimburse these losses.
Ultimately, working families and unsubsidized busi-
nesses bear the costs of economic development subsidies.
It is they who must pay higher taxes to replace the rev-
enues diverted to subsidized corporations and thereby
maintain or expand public services to meet demand. Or it
is they who must put up with degraded levels of servic-
es—more potholes in the streets, fewer teachers in the
classroom, fewer computers in the labs, fewer health serv-
ices, less frequent bus service, and so on. Whether indi-
viduals and nonsubsidized businesses pay up or put up,
they are the ones who are stuck when some companies get
a free pass on property taxes. Even when the state increas-
es aid payments to offset the costs of abatements and TIF,
it either must squeeze taxpayers at the state level or it must
allocate less money other to education priorities, trans-
portation, safety, health care, and so on.
When the local school districts do not get reimburse-
ment from the state for subsidies, the school boards must
press for increased local tax rates or cut educational serv-
ices. The dilemma is disturbing, because many state
supreme courts have been ruling that school funding is
inadequate and inequitable under current conditions, so
it is clear that many districts can ill afford to make further
cuts in response to loss of funding to subsidies. If the
Conclusion
6
35
36 Protecting Public Education
choice seems to come down either to raising taxes or to
cutting public services, the public should consider cutting
development subsidies to corporations as an alternative.
Fortunately, educators and school boards are becom-
ing increasingly aware of the harm done through the
often-subtle tax expenditures that create abatements and
TIF. In at least 19 states, school board associations have
either researched or campaigned around or are already
demanding a larger role in subsidy decisions—a role that
will protect the funding and quality of public education.
Further information on the specific funding formulas
and local property taxes appears in Appendix B for those
who are interested in assessing the impact of subsidies and
potential ways of protecting public education funding.
Education unions have a role to play in this debate. As
the front-line workers who see the impact of overcrowd-
ing and other effects of underfunded schools, teachers and
classified employees can articulate the direct impact sub-
sidies have on tomorrow’s work force.
Most school boards and education organizations still
lack any direct power to affect the process of granting sub-
sidies for development. Yet even businesses have been
highlighting the availability of a highly skilled pool of
labor in their siting decisions (see, e.g., Moline 1998;
Mayfield 1999; and King and Gramko 1999). That is, edu-
cated, skilled workers want to give their children good
educations as well. If businesses are more willing to rec-
ognize the problematic connection between property tax
subsidies and the health of their present and future work
forces, perhaps they will also be willing to reconceptualize
the components of a “business climate” to involve fewer
subsidies on property taxes and fuller funding for educa-
tion. That is something on which unions, school boards,
and business could work together. It is a long-term strate-
gy, however. In the meantime, this report has raised
several concerns:
• In many states, data collection on subsidy deals is so
poor that it is almost impossible to measure the costs
and the outcomes of these programs, much less hold
beneficiaries responsible if they do not perform as
promised.
• School officials have very little say over these programs.
• Abatements and TIF cost schools millions of dollars in
revenue each year.
To address these issues, we offer three policy recommen-
dations below.
1: Improve Disclosure of Subsidies andEnforce Standards
States should measure the impact of subsidies on school
revenue. In order to do this, they must collect reliable data
on property tax abatements and TIF and aggregate it by
school district, county, and state. School boards and the
public should have full, advance information about subsi-
dies so that they can make informed decisions. In addi-
tion, the public does not need to bear the brunt of a mis-
take if a development agreement provides for a clawback
of subsidies given to developers who have failed to meet
their promises on jobs, wages, or capital investment.
2: Give Local School Boards Authority inSubsidy Decisions
Giving school boards a formal say in subsidy decision-
making is another line of defense for school funding. We
strongly recommend that school boards should have veto
power over abatements and TIF.
3: Press State Government to ShieldSchool Revenues from the Effects ofSubsidies
One of the best ways to protect school revenues from
being depleted by business subsidies is for the state gov-
ernment itself to prohibit the abatement or diversion of
the school portion of property taxes. As we noted earlier,
a small handful of states have already done this. Most
states, however, protect schools from property tax subsi-
dies only partially (typically to reimburse operating loss-
es) or not at all. Some states also protect school levies ear-
marked for capital outlay or debt service from abatement
or diversion into TIF. More could do so. By promoting
exclusion of funds for schools’ capital outlay or debt serv-
ice in states that do reimburse districts for schools’ oper-
ating expenditures, local districts could create a shield
made up partly by reimbursement and partly by statutory
or regulatory restriction of the scope of subsidies. The
permutations of such combined approaches will of course
vary with the particular statutes and practices in each
state.

Literature Search
We searched for news articles and research reports on the
relationship between subsidies and school revenue. We
found a handful of reports that looked at the issue in par-
ticular states but could only identify one 50-state
overview, a 1993 report by the U.S. General Accounting
Office, performed at the request of Senator Howard
Metzenbaum of Ohio. Most of the studies we found focus
on the debate surrounding school finance reform.
Statute Review
For each state, we reviewed the statutes that govern tax
increment financing, property tax abatements, and enter-
prise zones. We sought to find out whether these pro-
grams affect school district revenues. We also looked for
information about the role of school boards in making
decisions about granting economic subsidies. We used
this information to inform our interviews with state
school board association officials.
Survey of State School BoardAssociations
We administered a telephone survey of school board asso-
ciations in 49 states and the District of Columbia to col-
lect basic information about the role of school boards in
subsidy decisions and the impact of subsidies on school
revenues, focusing especially on abatements and TIF.
When conducting the survey, we started by speaking with
a staff member of each state’s school board association.
Surprisingly, these association staffers frequently had to
refer us to other sources, such as departments of educa-
tion, state tax assessment departments, or advocacy
organizations. In 13 states, we were unable to find any
answers to our questions from all such sources. In eight
more states, our results are incomplete because associa-
tion officials were only familiar with one of the two subsi-
dies. We did not survey school board officials in Hawaii
because that state finances its schools almost entirely from
state revenue (Appendix C lists the organizations we
interviewed in each state).
Case Studies
For five states—Florida, Minnesota, Montana, Ohio, and
Texas—we sought to paint a more detailed picture of the
issue by calculating the amount of school revenue lost to
economic development tax breaks. We did the following
research:
• Found data on development subsidies by contacting
departments of revenue and economic development,
and state comptrollers
• Reviewed tax expenditure budgets for estimates of rev-
enue lost to development subsidies (property tax
abatements, tax increment financing, and other signif-
icant tax breaks)
• Reviewed detailed explanations of school finance sys-
tems from the National Center for Education Statistics,
the National Education Association, and state sources
• Conducted on-line and telephone-interview searches
about activity on the issue, including trends, legal
issues, prevalence of the problem, and local disputes
and organizing around the issue
• Interviewed additional groups that might have a stake
in the issue, such as local school boards, departments
of education, community groups, and teachers’ unions.
37
Appendix A: Research Methodology and Scope

Funding for K–12 education in nearly every state comes
from three sources: local, state, and federal governments.
Through the 1960s, local governments had virtually sole
responsibility for education, financing schools primarily
with revenue raised from property taxes. During the past
30 years, however, states have come to bear an increasing
share of education spending, reducing schools’ reliance on
local property taxes. In the United States as a whole, how-
ever, local property taxes still account for 29 percent of
school revenues, and other local sources provide 16 per-
cent, so that local sources account for a combined average
of 45 percent of total school funding (48 percent comes
from state governments, 7 percent from the federal gov-
ernment).
The local–state funding mix varies significantly among
states. Local governments provide 87 percent of all fund-
ing in New Hampshire but only 2 percent in Hawaii. How
much a state contributes to any given district is based on
a complex formula intended to supplement funding for all
districts, to equalize funding among districts, and to pro-
vide a basic level of funding in all districts. Table B.1 sum-
marizes sources of education funding by state.
Local Funding
Local governments raise most of their money for educa-
tion through local property taxes. Most entities with tax-
ing authority (i.e., cities, counties, and other taxing dis-
tricts such as water and school) can set their own tax rates,
collect the tax, and distribute it according to a budget.
School spending typically accounts for half or more of the
property revenues raised locally.
Local governments cannot always spend as much of
their property tax revenue as they want on education.
Some state funding formulas cap the amount that a dis-
trict can spend or the rate at which a district can tax in
order to equalize funding among districts. States then
supplement local revenues according to formulas (dis-
cussed below). Local governments may also raise addi-
tional funding, usually with voter approval, through sales
or income taxes or additional property taxes. They often
earmark these taxes or levies for education, especially
for capital expenses such as school construction and
maintenance.
State Funding
State formulas for allocating revenue among local school
districts vary greatly and have evolved over the years.
Many of the changes in school funding formulas have
come from state supreme court decisions finding that
state funding systems have failed to meet state constitu-
tional provisions for equal protection and basic education
guarantees. Several common themes have arisen from
these court cases. Many courts have ruled that education
funding is the responsibility of the state, not the local gov-
ernments. Courts have also ruled that local systems of
funding that rely on property taxes create inequities
among school districts. These rulings have prompted
states to fund a greater share of education costs and to
lessen schools’ reliance on local property taxes.
States provide two types of aid to districts. Basic aid cov-
ers the largest portion of education costs. The state distrib-
utes this aid according to complex formulas that take into
account the differing needs and relative wealth of districts.
Categorical aid goes for special programs such as bilingual
education, transportation, or building construction and
maintenance. Categorical aid exists “outside the formula”
and may not always reflect a district’s relative wealth.
States use four kinds of basic aid formulas. Although
they are individually very different, these formulas all seek
to address disparities among school districts’ capacity to
generate revenue. The basis of most states’ formulas is
some measurement of the local district’s ability to pay,
generally defined as the value of taxable property in the
district, known as “net tax capacity.” The state usually
adjusts the net tax capacity for each district for differences
in assessment practices among districts. State formulas
take other factors into account as well, such as personal
income in the district, the number of children receiving
free lunches, and other indicators of relative wealth or
poverty. The formulas also factor in each district’s costs,
including the number of students, weightings for grade
level, special education considerations, teachers’ salaries,
and real estate prices.
Outlined below are the four kinds of basic aid formu-
las. For the purposes of this report, we are interested in
39
Appendix B: State Funding Formulas and Local Property Tax Subsidies
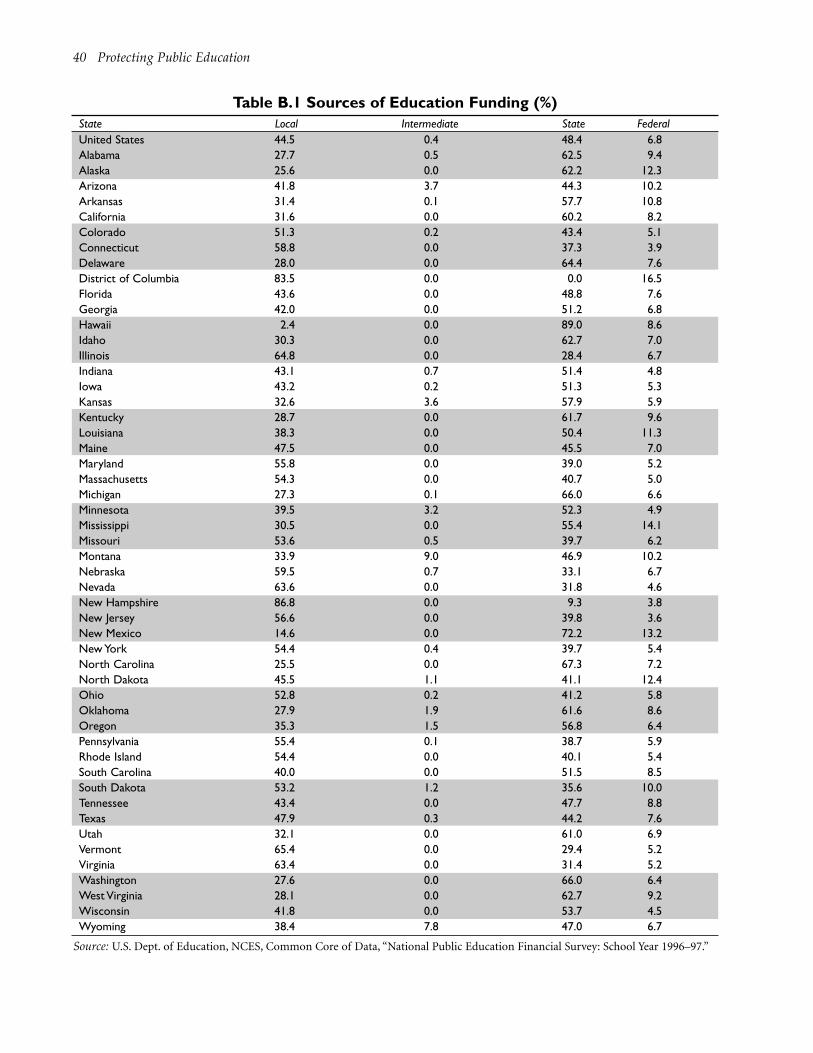
40 Protecting Public Education
Table B.1 Sources of Education Funding (%)State Local Intermediate State FederalUnited States 44.5 0.4 48.4 6.8Alabama 27.7 0.5 62.5 9.4Alaska 25.6 0.0 62.2 12.3Arizona 41.8 3.7 44.3 10.2Arkansas 31.4 0.1 57.7 10.8California 31.6 0.0 60.2 8.2Colorado 51.3 0.2 43.4 5.1Connecticut 58.8 0.0 37.3 3.9Delaware 28.0 0.0 64.4 7.6District of Columbia 83.5 0.0 0.0 16.5Florida 43.6 0.0 48.8 7.6Georgia 42.0 0.0 51.2 6.8Hawaii 2.4 0.0 89.0 8.6Idaho 30.3 0.0 62.7 7.0Illinois 64.8 0.0 28.4 6.7Indiana 43.1 0.7 51.4 4.8Iowa 43.2 0.2 51.3 5.3Kansas 32.6 3.6 57.9 5.9Kentucky 28.7 0.0 61.7 9.6Louisiana 38.3 0.0 50.4 11.3Maine 47.5 0.0 45.5 7.0Maryland 55.8 0.0 39.0 5.2Massachusetts 54.3 0.0 40.7 5.0Michigan 27.3 0.1 66.0 6.6Minnesota 39.5 3.2 52.3 4.9Mississippi 30.5 0.0 55.4 14.1Missouri 53.6 0.5 39.7 6.2Montana 33.9 9.0 46.9 10.2Nebraska 59.5 0.7 33.1 6.7Nevada 63.6 0.0 31.8 4.6New Hampshire 86.8 0.0 9.3 3.8New Jersey 56.6 0.0 39.8 3.6New Mexico 14.6 0.0 72.2 13.2New York 54.4 0.4 39.7 5.4North Carolina 25.5 0.0 67.3 7.2North Dakota 45.5 1.1 41.1 12.4Ohio 52.8 0.2 41.2 5.8Oklahoma 27.9 1.9 61.6 8.6Oregon 35.3 1.5 56.8 6.4Pennsylvania 55.4 0.1 38.7 5.9Rhode Island 54.4 0.0 40.1 5.4South Carolina 40.0 0.0 51.5 8.5South Dakota 53.2 1.2 35.6 10.0Tennessee 43.4 0.0 47.7 8.8Texas 47.9 0.3 44.2 7.6Utah 32.1 0.0 61.0 6.9Vermont 65.4 0.0 29.4 5.2Virginia 63.4 0.0 31.4 5.2Washington 27.6 0.0 66.0 6.4West Virginia 28.1 0.0 62.7 9.2Wisconsin 41.8 0.0 53.7 4.5Wyoming 38.4 7.8 47.0 6.7
Source: U.S. Dept. of Education, NCES, Common Core of Data, “National Public Education Financial Survey: School Year 1996–97.”
Appendix B: State Funding Formulas and Local Property Tax Subsidies 41
how the state handles the question of ability to pay, in par-
ticular how the state assesses local property wealth.
• Flat grants. These provide each “unit” (number of
pupils or teachers) with a designated amount of state
aid dollars. Because the amount granted does not
depend on local property wealth or taxing effort, prop-
erty tax abatements or TIF will not affect the amount
of such aid that the state gives local school districts.
• Foundation programs. The majority of the states use
this method, by which the state commits to ensuring a
minimum level of funding per pupil. This is the foun-dation. Instead of a flat dollar amount, the state pro-
vides school districts with aid on a sliding scale intend-
ed to cover the foundation costs for each student. The
states vary in whether they require local jurisdictions
to impose a minimum tax rate.
In most states’ foundation programs, the state first
establishes a baseline level of funding that each student
needs to get a good education. Then, the state deter-
mines each local government’s ability to raise the
money to reach that foundation for all of its students.
If local property taxes are insufficient, then the state
pays the difference. State aid is determined by multi-
plying the number of students in a district by the foun-
dation and then subtracting the required local effort
(tax rate multiplied by the total value of the district’s
tax base).
State aid = (No. of students X Foundation) –
(Tax Rate X Property Values)
• Guaranteed Tax Base (GTB) or Guaranteed Tax Yield(GTY) programs. These focus on equalizing the ability
of local school districts to raise revenue rather than on
establishing a basic level of funding per student. Under
the GTB system, the state will match the dollars that a
local school district raises. The more money a district
raises, the more dollars the state provides. Under the
GTY system, the state provides matching funds to
guarantee a specific dollar amount that a given local
tax rate raises. Both systems create incentives for dis-
tricts to raise higher taxes to support schools.
• Full funding programs. In these programs, the state
assumes full financial responsibility for school fund-
ing. Local property tax revenues do not go toward edu-
cation spending, so property tax abatements and TIF
cannot affect school funding.
Most states fund special programs (special education,
transportation, capital outlays) through categorical aid.
States are less likely to base this aid on local districts’ abil-
ity to pay, even though local school districts fund some of
these programs through supplemental levies. When local
governments abate these supplemental taxes, they fre-
quently do not receive state reimbursement for the conse-
quent revenue losses.
Reimbursement against Subsidies
In most cases, state aid provides a certain level of reim-
bursement to school districts that have lost revenue to
subsidies. The method that a state uses to distribute basic
aid to local districts determines how much reimburse-
ment a district will receive. Most states take some measure
of net tax capacity into account in measuring a local dis-
trict’s ability to pay for education. If a state includes all
property in a district when it estimates local property
wealth, including property that does not actually con-
tribute to the schools because of an abatement or TIF,
then the state will commensurately overestimate the
affected district’s net tax capacity. That, in turn, means
that the state will not reimburse the district for the rev-
enue lost to the abatement or to TIF. On the other hand,
if a state excludes the value of tax-abated or TIF-captured
property from the locality’s tax capacity, then the schools
may get reimbursement for some or all of the resulting
revenue loss.
Some states impose expenditure and revenue limits for
local schools to help equalize school spending between
districts. These limits are relevant to determining how TIF
or abatements affect school revenues. If a state imposes
spending limits and agrees to help local districts reach
these limits through a foundation formula, then school
budgets are fixed and not vulnerable to depletion from
abatements or TIF. That is, the state will shoulder the cost
of the subsidies by providing higher levels of aid. If a state
does not create a spending limit or a taxing limit, then
school districts could raise more funds than the amounts
prescribed in a foundation formula. In that case, the state
would only be providing a partial reimbursement for the
subsidy, and the state and local governments would be
sharing the costs of the subsidy.
Categorical aid is a different story. States do not always
distribute categorical aid according to property wealth, so
they do not always reimburse local governments for sub-

42 Protecting Public Education
sidies they grant that deplete local contributions to cate-
gorical programs. A good example is categorical aid for
building construction and maintenance. In some states,
local school districts levy special property taxes—called
capital outlay and debt service levies—to pay for these costs.
Because the state does not always reimburse the local gov-
ernments for the revenues lost to subsidies based on these
levies, these sources of school funding are particularly vul-
nerable. For this reason, some states specifically prohibit
diversion of these supplemental taxes into TIF. In Iowa, for
example, the school board association successfully lobbied
to exclude capital and debt service levies from TIF.
The question of reimbursement is critical to this study.
If a state fully reimburses a district for a local subsidy, then
the state bears the burden of paying for the tax incentives
local governments grant to businesses. If the state provides
no reimbursement, then the local schools bear the burden
alone. If the state provides partial reimbursement, then
the state government and local school districts share the
burden. The reimbursement question is clearly not a sim-
ple matter of whether states provide aid to local school
districts. Often it is a question of the duration and depth
of that aid. In fact, many of the school board officials we
queried felt and probably still feel that state aid does not
sufficiently reimburse local school districts for dollars lost
to abatements and TIF.

Appendix C: Organizations SurveyedState Organizations Survey complete?
Alabama Alabama Legislative Service Bureau TIF incompleteAlaska Association of Alaska School Boards YesArizona Arizona School Boards Association NoArkansas Arkansas School Boards Association NoCalifornia California School Boards Association NoColorado Colorado Association of School Boards YesConnecticut Connecticut Association of Boards of Education NoDelaware Delaware School Board Association NoDistrict of Columbia District of Columbia Board of Education TIF incompleteFlorida Senate Finance and Taxation Committee YesGeorgia Georgia School Boards Association NoIdaho Idaho School Boards Association NoIllinois Illinois Association of School Boards YesIndiana Indiana School Boards Association YesIowa Iowa Association of School Boards YesKansas Kansas Association of School Boards YesKentucky Kentucky School Boards Association YesLouisiana Louisiana School Boards Association YesMaine Maine School Boards Association Abatement incompleteMaryland Maryland Association of Boards of Education YesMassachusetts Massachusetts Association of School Committees YesMichigan Michigan School Business Officials YesMinnesota Minnesota School Board Association YesMississippi Mississippi School Board Association NoMissouri Missouri School Boards' Association YesMontana Montana School Boards Association Abatement incompleteNebraska Nebraska Association of School Boards YesNevada Nevada Association of School Boards YesNew Hampshire New Hampshire School Boards Association YesNew Jersey New Jersey Education Association TIF incompleteNew Mexico New Mexico School Boards Association NoNew York New York State School Boards Association TIF incompleteNorth Carolina North Carolina School Boards Association YesNorth Dakota North Dakota School Boards Association YesOhio Ohio School Boards Association YesOklahoma Oklahoma Senate Finance Committee & Education Appropriations Subcommittee YesOregon Oregon School Boards Association YesPennsylvania Pennsylvania School Boards Association YesRhode Island Rhode Island Association of School Committees YesSouth Carolina South Carolina School Boards Association YesSouth Dakota Associated School Boards of South Dakota YesTennessee Tennessee School Boards Association TIF incompleteTexas Texas Association of School Boards YesUtah Utah Department of Education YesVermont Vermont - National Education Association NoVirginia Virginia School Boards Association TIF incompleteWashington Washington State School Directors’ Association NoWest Virginia West Virginia School Boards Association NoWisconsin Wisconsin Association of School Boards Abatement incompleteWyoming Wyoming School Boards Association No
No = Respondents were unable to answer questions because they were not familiar with subsidies.TIF incomplete = Respondents were unable to answer questions because they were not familiar with TIF.Abatement incomplete = Respondents were unable to answer questions because they were not familiar with abatements.
43

App
endi
x D
:Ro
les
of
Sch
oo
l Bo
ards
in A
war
ding
Pro
pert
y Ta
x A
bate
men
ts
44
Do
boar
ds p
lay
a fo
rmal
rol
e in
gra
ntin
g ab
atem
ents
?N
atur
e of
boa
rd’s
role
Stat
eYe
sN
oD
on’t
know
n.a.
Appr
oval
pow
er
Advis
ory
Com
mitt
ee S
eat
Info
rmal
Ala
bam
a■
Ala
ska
■
Ari
zona
■
Ark
ansa
s■
Cal
iforn
ia■
Col
orad
o■
Con
nect
icut
■
Del
awar
e■
Dis
tric
t of
Col
umbi
a■
Flor
ida
■
Geo
rgia
■
Idah
o■
Illin
ois
■
Indi
ana
■
Iow
a■
Kan
sas
■■
Ken
tuck
y■
Loui
sian
a■
Mai
ne■
Mar
ylan
d■
Mas
sach
uset
ts■
Mic
higa
n■
■
Min
neso
ta■
■
Mis
siss
ippi
■
Mis
sour
i■
■
Mon
tana
■
Appe
ndix
D c
ontin
ues
on n
ext
page

Appendix D: Roles of School Boards in Awarding Property Tax Abatements 45
Appe
ndix
D (
cont
inue
d)
Do
boar
ds p
lay
a fo
rmal
rol
e in
gra
ntin
g ab
atem
ents
?N
atur
e of
boa
rd’s
role
Stat
eYe
sN
oD
on’t
know
n.a.
Appr
oval
pow
er
Advis
ory
Com
mitt
ee S
eat
Info
rmal
Neb
rask
a■
■
Nev
ada
■■
New
Ham
pshi
re■
New
Jers
ey■
New
Mex
ico
■
New
Yor
k■
■
Nor
th C
arol
ina
■
Nor
th D
akot
a■
■■
Ohi
o■
■■
■■
Okl
ahom
a■
Ore
gon
■
Penn
sylv
ania
■■
Rho
de Is
land
■
Sout
h C
arol
ina
■■
Sout
h D
akot
a■
Tenn
esse
e■
■
Texa
s■
■
Uta
h■
Verm
ont
■
Vir
gini
a■
Was
hing
ton
■
Wes
t Vir
gini
a■
Wis
cons
in■
Wyo
min
g■
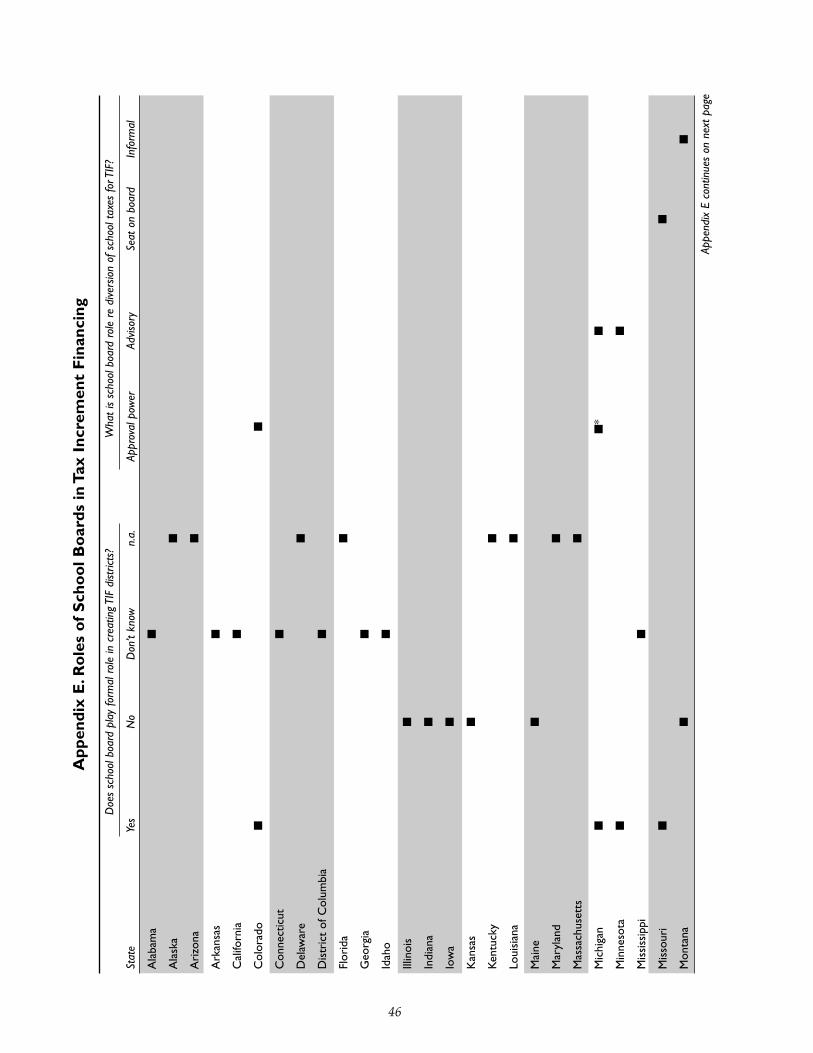
46
App
endi
x E
.Ro
les
of
Sch
oo
l Bo
ards
in T
ax I
ncre
men
t F
inan
cing
Doe
s sc
hool
boa
rd p
lay
form
al r
ole
in c
reat
ing
TIF
dist
ricts
?W
hat
is sc
hool
boa
rd r
ole
re d
ivers
ion
of s
choo
l tax
es fo
r TIF
?
Stat
eYe
sN
oD
on’t
know
n.a.
Appr
oval
pow
er
Advis
ory
Seat
on
boar
dIn
form
al
Ala
bam
a■
Ala
ska
■
Ari
zona
■
Ark
ansa
s■
Cal
iforn
ia■
Col
orad
o■
■
Con
nect
icut
■
Del
awar
e■
Dis
tric
t of
Col
umbi
a■
Flor
ida
■
Geo
rgia
■
Idah
o■
Illin
ois
■
Indi
ana
■
Iow
a■
Kan
sas
■
Ken
tuck
y■
Loui
sian
a■
Mai
ne■
Mar
ylan
d■
Mas
sach
uset
ts■
Mic
higa
n■
■*
■
Min
neso
ta■
■
Mis
siss
ippi
■
Mis
sour
i■
■
Mon
tana
■■
Appe
ndix
E c
ontin
ues
on n
ext
page

Appendix E. Roles of School Boards in Tax Increment Financing 47
Appe
ndix
E (
cont
inue
d)
Doe
s sc
hool
boa
rd p
lay
form
al r
ole
in c
reat
ing
TIF
dist
ricts
?W
hat
is sc
hool
boa
rd r
ole
re d
ivers
ion
of s
choo
l tax
es fo
r TIF
?
Stat
eYe
sN
oD
on’t
know
n.a.
Appr
oval
pow
er
Advis
ory
Seat
on
boar
dIn
form
al
Neb
rask
a■
Nev
ada
■■
New
Ham
pshi
re■
New
Jers
ey■
New
Mex
ico
■
New
Yor
k■
Nor
th C
arol
ina
■
Nor
th D
akot
a■
Ohi
o■
■■
■
Okl
ahom
a■
■
Ore
gon
■
Penn
sylv
ania
■■
Rho
de Is
land
■
Sout
h C
arol
ina
■■
Sout
h D
akot
a■
Tenn
esse
e■
Texa
s■
■
Uta
h■
■
Verm
ont
■
Vir
gini
a■
Was
hing
ton
■
Wes
t Vir
gini
a■
Wis
cons
in■
■
Wyo
min
g■
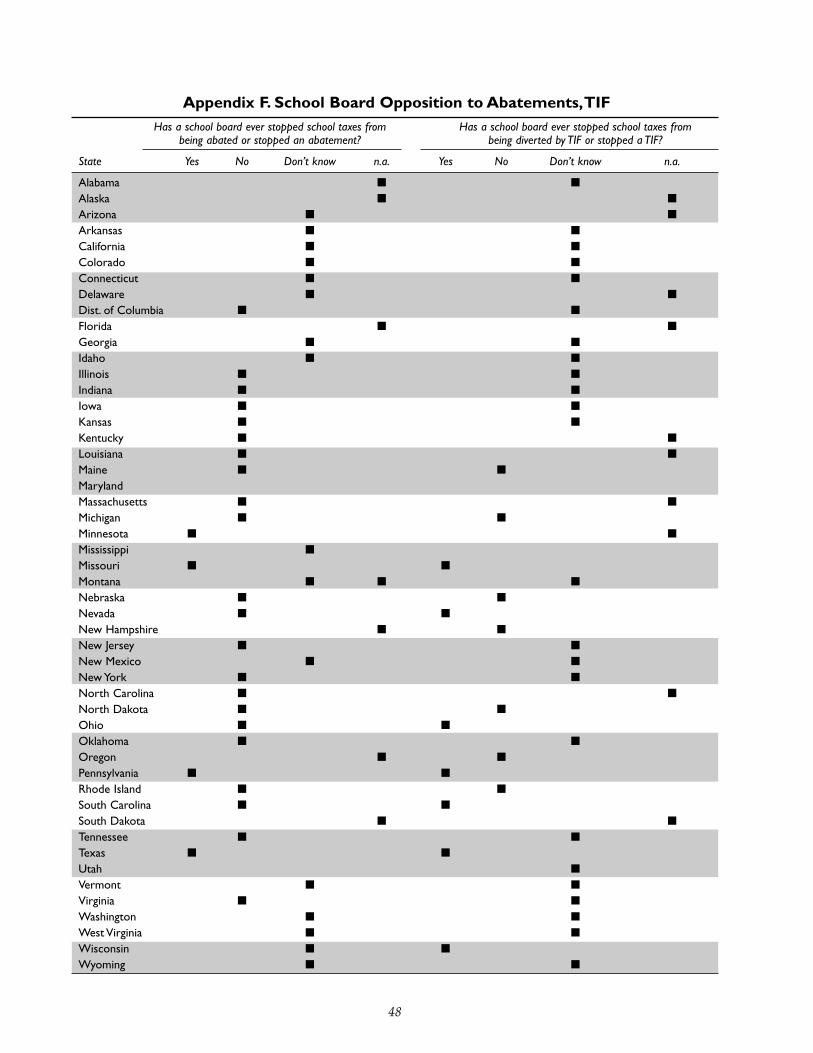
Appendix F. School Board Opposition to Abatements,TIFHas a school board ever stopped school taxes from Has a school board ever stopped school taxes from
being abated or stopped an abatement? being diverted by TIF or stopped a TIF?
State Yes No Don’t know n.a. Yes No Don’t know n.a.
Alabama ■ ■
Alaska ■ ■
Arizona ■ ■
Arkansas ■ ■
California ■ ■
Colorado ■ ■
Connecticut ■ ■
Delaware ■ ■
Dist. of Columbia ■ ■
Florida ■ ■
Georgia ■ ■
Idaho ■ ■
Illinois ■ ■
Indiana ■ ■
Iowa ■ ■
Kansas ■ ■
Kentucky ■ ■
Louisiana ■ ■
Maine ■ ■
MarylandMassachusetts ■ ■
Michigan ■ ■
Minnesota ■ ■
Mississippi ■
Missouri ■ ■
Montana ■ ■ ■
Nebraska ■ ■
Nevada ■ ■
New Hampshire ■ ■
New Jersey ■ ■
New Mexico ■ ■
New York ■ ■
North Carolina ■ ■
North Dakota ■ ■
Ohio ■ ■
Oklahoma ■ ■
Oregon ■ ■
Pennsylvania ■ ■
Rhode Island ■ ■
South Carolina ■ ■
South Dakota ■ ■
Tennessee ■ ■
Texas ■ ■
Utah ■
Vermont ■ ■
Virginia ■ ■
Washington ■ ■
West Virginia ■ ■
Wisconsin ■ ■
Wyoming ■ ■
48
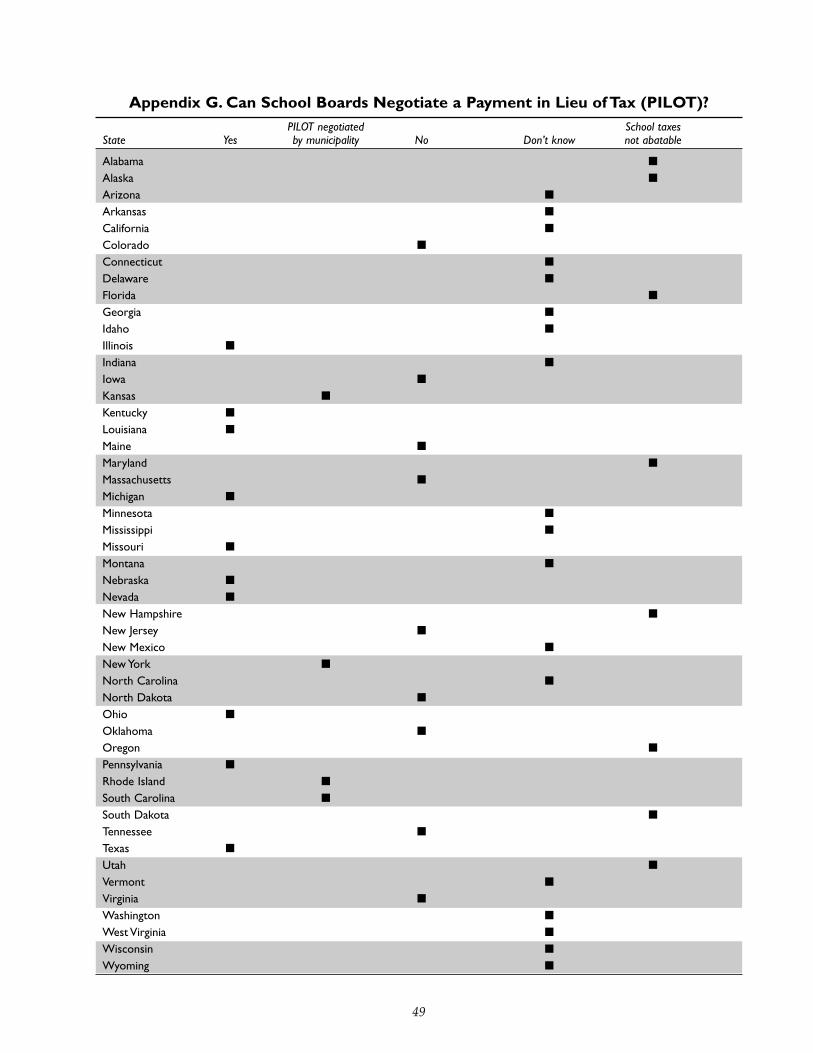
Appendix G. Can School Boards Negotiate a Payment in Lieu of Tax (PILOT)?
49
PILOT negotiated School taxes State Yes by municipality No Don’t know not abatable
Alabama ■
Alaska ■
Arizona ■
Arkansas ■
California ■
Colorado ■
Connecticut ■
Delaware ■
Florida ■
Georgia ■
Idaho ■
Illinois ■
Indiana ■
Iowa ■
Kansas ■
Kentucky ■
Louisiana ■
Maine ■
Maryland ■
Massachusetts ■
Michigan ■
Minnesota ■
Mississippi ■
Missouri ■
Montana ■
Nebraska ■
Nevada ■
New Hampshire ■
New Jersey ■
New Mexico ■
New York ■
North Carolina ■
North Dakota ■
Ohio ■
Oklahoma ■
Oregon ■
Pennsylvania ■
Rhode Island ■
South Carolina ■
South Dakota ■
Tennessee ■
Texas ■
Utah ■
Vermont ■
Virginia ■
Washington ■
West Virginia ■
Wisconsin ■
Wyoming ■

Appendix H. State Reimbursement for Abatements,TIFAbatement TIF
State reimbursed How Amount ($) reimbursed How Amount
Alabama n.a. Don’t knowAlaska n.a. n.a.Arizona Don’t know n.a.Arkansas Don’t know Don’t knowCalifornia Don’t know Don’t knowColorado Yes State aid 2–3 million Yes State aid $6 millionConnecticut Don’t know Don’t knowDelaware Don’t know n.a.Dist. of Columbia No NoFlorida n.a. n.a.Georgia Don’t know Don’t knowIdaho Don’t know Don’t knowIllinois No NoIndiana No NoIowa Yes State aid Don’t know Yes State aid 87% of lost valueKansas No NoKentucky Yes State aid Don’t know n.a.Louisiana Yes State aid Don’t know n.a.Maine No Yes Don’t knowMaryland n.a. n.a.Massachusetts No n.a.Michigan Yes State aid Don’t know Yes State aid Don’t knowMinnesota No Yes State aid Don’t knowMississippi Don’t know Don’t knowMissouri No NoMontana n.a. NoNebraska Yes State aid Don’t know NoNevada No NoNew Hampshire n.a. Yes State aid Don’t knowNew Jersey No Don’t knowNew Mexico Don’t know Don’t knowNew York No Don’t knowNorth Carolina Don’t know n.a.North Dakota No NoOhio No NoOklahoma Yes Special fund $23.6 million NoOregon n.a. Yes State aid Don’t knowPennsylvania No NoRhode Island Yes State aid Yes State aidSouth Carolina No NoSouth Dakota n.a. n.a.Tennessee No Don’t knowTexas Yes State aid NoUtah n.a. NoVermont Don’t know Don’t knowVirginia Don’t know Don’t knowWashington Don’t know Don’t knowWest Virginia Don’t know Don’t knowWisconsin n.a. Yes State aidWyoming Don’t know Don’t know
Key: n.a. = not applicable; respondent thought that subsidy did not affect school property taxes. Don’t know = respondent not famil-iar with subsidy or reimbursement procedure.
50

Appendix I. States in Which School Board Association Engaged in Subsidy DebateState Worked on issue Researched issue Lobbied on issue
AlabamaAlaskaArizona ■
ArkansasCaliforniaColoradoConnecticutDelaware ■ ■
FloridaGeorgiaIdahoIllinois ■
Indiana ■
Iowa ■ ■ ■
KansasKentuckyLouisiana ■
Maine ■ ■
MarylandMassachusettsMichigan ■ ■
Minnesota ■ ■
MississippiMissouri ■ ■
Montana ■ ■
Nebraska ■ ■
NevadaNew HampshireNew JerseyNew MexicoNew York ■ ■
North CarolinaNorth Dakota ■ ■
Ohio ■ ■
OklahomaOregon ■ ■
Pennsylvania ■ ■
Rhode IslandSouth Carolina ■ ■ ■
South Dakota ■
TennesseeTexas ■ ■
Utah ■ ■ ■
VermontVirginiaWashingtonWest VirginiaWisconsin ■ ■
Wyoming
51
AEFA (American Education Finance Association). 1992.
Public School Finance Programs of the United Statesand Canada: 1990–1991. Albany, N.Y.: AEFA Center
for Study of the States, Nelson A. Rockefeller Institute
of Government, State University of New York.
Augenblick, John. 2001a. School Finance and PropertyTaxes: A Continuing, if Changing, Linkage. Denver:
National Conference of State Legislatures. Retrieved
April 29, 2002, from http://www.ncsl.org/programse-duc/NCEFTaxes.htm
———. 2001b. The Status of School Finance Today.Denver: Education Commission of the States.
Retrieved January 18, 2002, from http://www.ecs.org/clearinghouse/28/01/2801.htm
Bonnett, Thomas. 1998. Is the New Global EconomyLeaving State-Local Tax Structures Behind? National
League of Cities. Washington, D.C.: National
Conference of State Legislatures, and National
Governors’ Association.
Braddock, Douglas. 1999. “Occupational Employment
Projections to 2008.” Monthly Labor Review 122
(November): 51–77.
Chi, Keon, and Daniel Hoffman. 2000. States BusinessIncentives: Trends and Options for the Future. 2nd ed.
Lexington, KY: Council of State Governments.
Corporation for Enterprise Development. 1986. Taken forGranted: How Grant Thornton Leads the StatesAstray. Washington, D.C.: Author.
Fisher, Peter. 2002. “Tax Incentives and the Disappearing
State Corporate Income Tax.” State Tax Notes 23(9;
March 4): 767–74.
Florida Department of Education. 2000. 2001–2002Funding for Florida School Districts: StatisticalReport. September. http://www.myfloridaeducation.com/bin00042/pdf/fefpdist.pdf
Florida State Senate. 2001. 2001 Florida Tax Handbook.Senate Finance and Taxation Committee, House
Committee on Fiscal Policy and Resources, Office of
Economic and Demographic Research, and Office of
Research and Analysis of the Department of Revenue.
Tallahassee: Author.
Hancock, Jay. 1999. “S.C. Pays Dearly for Added Jobs:
South Carolina’s Economy Was Supposed to Improve,
but Taxes Exploded while Services Crumbled.”
Baltimore Sun, October 12, pp. 1A, 9A, 17A.
Hinkley, Sara. 2000. Minding the Candy Store: AGrassroots Guide to Investigating DevelopmentSubsidies. Washington, D.C.: Good Jobs First.
Hood, John. 1994. “Ante Freeze: Stop the State Bidding
Wars for Big Business.” Policy Review: Journal of theHeritage Foundation (Spring): 62–67.
References
53

54 Protecting Public Education
John Locke Foundation. 2000. “Agenda 2000—A
Candidate’s Guide to North Carolina Public Policy:
State Tax Reform.” Retrieved July 8, 2002, from
http://www.johnlocke.org/issues/agenda2000/3reform.html
Johnson, Craig L., and Kenneth Kritz. 2001. “A Review of
State Tax Increment Financing Laws.” In Craig L.
Johnson and Joyce Y. Man, eds., Tax IncrementFinancing and Economic Development: Uses,Structures, and Impact (pp. 31–69). Albany, N.Y.: State
University of New York Press.
Johnson, Craig L., and Joyce Y. Man. 2001. Tax IncrementFinancing and Economic Development: Uses, Struc-tures, and Impact. Albany, N.Y.: State University of
New York Press.
Johnston, Robert C., and Kelly A. White. 1997a. “Despite
Rhetoric, Businesses Eye Bottom Line.” EducationWeek, March 19. Retrieved October 15, 2002, from
http://www.edweek.org/ew/vol-16/25tax.h16
———. 1997b. “Schools’ Taxes Bartered Away To Garner
Jobs.” Education Week, March 12. Retrieved October
15, 2002, from http://www.edweek.org/ew/vol16/24tax.h16
Kaszuba, Mike. 2001. “Cities Weigh Tax Shift: Revised Law
for Tax-increment Financing are Changing the
Redevelopment Landscape.” Star Tribune, July 8, p. 1B.
King, Bill, and Les Gramko. 1999. “Where Will You Find
Tomorrow’s Best Work Force?” ExpansionManagement, 1999 Ratings Edition, pp. 21–55.
LeRoy, Greg, Richard Healey, Dan Doherty, and Harry
Khalil. 1994. No More Candy Store: States and CitiesMaking Job Subsidies Accountable. Washington, D.C.:
Good Jobs First.
LeRoy, Greg, and Sarah Hinkley. 2001. No More SecretCandy Store: A Grassroots Guide to InvestigatingDevelopment Subsidies. Washington, D.C.: Good Jobs
First.
Lowen, J. Trout. 2001.“Property Tax Reform Will Result in
Lower Tax Revenue for TIF Districts.” MinnesotaJournal, Minnesota Citizens League, 2001 Tax
Increment Financing (TIF) Review, July, 2001.
Retrieved May 23, 2002, from http://www.citizensleague.net/mj/2001/07/article1.htm
Lynch, Robert G. 1996. Do State and Local Tax IncentivesWork? Washington, D.C.: Economic Policy Institute.
McDonald, Greg. 2001. “States Struggle To Carry Out
Governors’ Agendas.” Stateline.org, June 12, 2001.
Retrieved May 1, 2002, from http://www.stateline.org/story.cfm?StoryID=132345
Maguire, Steve. 2000. “Average Effective Corporate Tax
Rates.” Congressional Research Service Report 2000-
8883, RL30469, February 29. Washington, D.C.: CRS.
Mastel, Greg. 1996. “States’ Subsidy Wars.” Journal of Commerce, December 27. Retrieved May 28, 2002,
from http://www.econstrat.org/jocstsub.htm
Mayfield, Gil. 1999. “Workers Will Bail Unless the Check’s
in the Mail.” Expansion Management (January): 8.
Mazerov, Michael. 2001. The “Single Sales Factor”Formula for State Corporate Taxes. Washington, D.C.:
Center on Budget and Policy Priorities.
Mazerov, Michael, and William Schweke. 1999. “The Care
and Feeding of the State and Local Tax Base: A Valuable
Public Asset.” Accountability: The Newsletter of theBusiness Incentives Clearinghouse 1(1). Retrieved
October 15, 2002, from http://www.cfed.org/sustain-able_economies/business_incentives/BI_newslet-ters/1_99_2.htm
Minietta, Robin. 1996. “Southern Hospitality.” On-line News Hour, October 14 (Transcript of discussion with
Carl Rist, Linda Paulimeno, Dave Philipps, Dennis
Rondinelli, Kimbel Price, Neal Wade, and John Lefler).
Washington, D.C.: MacNeil/Lehrer Productions.
Retrieved May 28, 2002, from http://www.pbs.org/newshour/bb/business/october96/southern_auto_10-14.html
Minge, David. 2000. “Statement of Honorable David
Minge, M.C., Minnesota.” Testimony before the
Subcommittee on Oversight of the House Committee
on Ways and Means Hearing on the Tax Code and the
New Economy. 106th Congress, 2d sess. September 26.
Minnesota Budget Project. 2001. Tax Decisions in the
2001 Legislative Session. August. Retrieved May 23,
2002, from http://www.mncn.org/bp/taxes01.htm; also
available as http://www.mncn.org/bp/taxes01.pdf
Minnesota House Research Department. 2002. SchoolFinance: A Guide for State Legislators. Prepared by
Tim and Danyell Punelli. January. Retrieved May 24,
2002, from http://www.house.leg.state.mn.us/hrd/pubs/mnschfin.pdf
References 55
Minnesota Office of the State Auditor. 2001. TaxIncrement Financing Report 2001. St. Paul: Minnesota
Office of the State Auditor.
Minnesota Trade and Economic Development
Department. 2002. 2001 Business Assistance Report.St. Paul: Author.
Moline, Ann. 1998. “Need to Know: Essential Location-
Decision Questions.” Plants, Sites & Parks 25(3): 15.
Montana Office of Public Instruction. 2001. Budget Data
for FY2001. January. Retrieved May 24, 2002, from
http://www.metnet.state.mt.us/SchoolFinance/School_Finance/Dist.%20Budget%20Data/%236115763
NASB (National Association of State Budget Officers).
1998 State Expenditure Report. Washington, D.C.:
Author.
NEA (National Education Association). 1995. HowEducation Spending Matters to EconomicDevelopment. Washington, D.C.: Author.
———. 1998a. The Outlook for State and Local Finances.Washington, D.C.: Author.
———. 1998b. Understanding the Property Tax.Washington, D.C.: Author.
———. 1999. Investing in Public Education: TheImportance of Schooling in the New Global Economy.Washington, D.C.: Author.
Ohio Department of Taxation. 1998. “Property Tax
Abatement Programs in Ohio, 1998 Edition.” Tax
Analysis Division. Columbus: Author. Retrieved June
13, 2002, from http://www.state.oh.us/tax/Publications/ta.pdf
———. 1999a. “Reduction in Value and Amount
Reimbursed for the $10,000 Exemption, by County,
Calendar Year 1999.” Columbus: Author. Retrieved
April 30, 2002, from http://www.state.oh.us/tax/Publications/Tax_Data_Series/SD1/sd1cy99.htm
———. 1999b. “Valuation of Real Property Exempted by
Tax Abatements, by Class of Abatement and County,
Calendar Year 1999.” Ohio Tax Data Series, Columbus:
Author. Retrieved April 30, 2002, from http://www.state.oh.us/tax/Publications/Tax_Data_Series/PE3/pe3cy99.htm
———. 2000. “School District Taxable Property Values,
Taxes Levied and Tax Rates for Current Expenses, and
Average Property Values Per Pupil, Tax Year 1999.” Tax
Data Series. Columbus: Author. Retrieved April 30,
2002, from http://www.state.oh.us/tax/Publications/Tax_Data_Series/SD1/sd1cy99.htm
Pearson, Greg, and A. Thomas Young, eds. 2002.
Technically Speaking: Why All Americans Need toKnow More About Technology. Committee on
Technological Literacy, National Academy of
Engineering; National Research Council. Washington,
D.C.: National Academy Press. Retrieved April 30,
2002, from http://www.nap.edu/books/0309082625/html
Petro, Jim. 1996. Cleveland City School DistrictPerformance Audit. Cleveland, OH: Ohio State
Auditor’s Office. Retrieved October 15, 2002, from
http://auditsearch.auditor.state.oh.us/RPIE/PDF/approve/cleveland_city_school_district_96-cuyahoga.htm
Rolnick, Arthur, and Melvin Burstein. 1995. “Congress
Should End the Economic War among the States.” In
The 1994 Annual Report of the Minneapolis FederalReserve Bank. March. Retrieved April 11, 2002, from
http://woodrow.mpls.frb.fed.us/pubs/ar/ar1994.html
Rubin, Herbert J. 1988. “Shoot Anything that Flies; Claim
Anything that Falls: Conversations with Economic
Development Practitioners.” Economic DevelopmentQuarterly 23: 236–51.
Schroeder, Dana. 1998. “Tax-Increment Use Grows at a
Faster Rate.” Minnesota Journal 15(5; May 19): 1, 6–7.
Schweke, William, and Carl Rist. 1997. Managing forHigher Returns: What Does North Carolina ActuallySpend on Economic Development and How Can TheseInvestments Be Better Managed? Washington, D.C.:
Corporation for Enterprise Development.
Simshaw, Brad. 2000. “Tax Increment Financing Districts
(TIF).” Helena: Montana Department of Revenue,
January 21, p. 12.
Soley, Lawrence. 1998. “Heritage Clones in the Heartland:
Local Think Tanks’ ‘Research’ Comes Pre-digested.”
Think Tank Monitor EXTRA!, September/October.
Fairness and Accuracy in Reporting. Retrieved from
http://www.fair.org/extra/9809/local-think-tanks.html
Sweeney, Patrick. 2001. “Minnesota Lawmakers Approve
$900 Million Tax-Cut Bill.” Saint Paul Pioneer Press,June 29, p. A1.
Tax Policy and Research. 1998. 1996–1998 BiennialReport of the Montana Department of Revenue.
56 Protecting Public Education
Helena: Montana Department of Revenue.
———. 2000. 1998–2000 Biennial Report of the Montana Department of Revenue. Helena: Montana
Department of Revenue.
Texas Comptroller of Public Accounts. 1999. AnnualProperty Tax Report: Tax Year 1998. Austin, Texas:
Author.
Texas General Assembly, Legislative Budget Board. 2001.
“Fiscal Note Enrolled Version (HB 1200), 77th Regular
Session.” May 22. Retrieved using “bill finder,” January
14, 2003, from http://www.capitol.state.tx.us
[Texas] Senate Economic Development Committee. 1996.
“The Fiscal Impact of Tax Abatements on Texas Public
Schools.” October. Austin: Author.
Thomas, Kenneth. 2000. Competing for Capital: Europeand North America in a Global Era. Washington, D.C.:
Georgetown University Press.
Tomsho, Robert. 2001. “Heavy Tax Abatements Keep
Firms in Toledo but Drain Education Coffers.” WallStreet Journal, July 18, sec. A, p. 1.
U.S. Census Bureau. 1998. “Statistical Tables, 1998 Public
Elementary-Secondary Education Finance Data.”
Tables 1 and 4. Retrieved April 29, 2002, from
http://www.census.gov/govs/school/98tables.pdf
———. 2001. Government Finances 1998–1999.Retrieved September 3, 2002, from http://www.cen-sus.gov/govs/estimate/99allpub.pdf, p. 1.
U.S. Congress, House, and U.S. Congress, Senate. 2000.
American Competitiveness in the Twenty-firstCentury Act of 2000: An Act to Amend theImmigration and Nationality Act with Respect to H-1B Nonimmigrant Aliens. 106th Congress, 2d sess. S.
2045. Retrieved April 11, 2002, from http://thomas.loc.gov/cgi-bin/query/z?c106:S.2045.ENR
U.S. Department of Commerce. 1999. “Evaluating
Business Development Incentives.” Economic Develop-
ment Administration, Washington, D.C. August.
U.S. Department of Education. 1999. “National Public
Education Financial Survey: School Year 1996–97.” In
Statistics in Brief: Revenues and Expenditures forPublic Elementary and Secondary Education: SchoolYear 1996–97. NCES Common Core of Data.
Retrieved October 15, 2002, from http://nces.ed.gov/pubs99/1999301.pdf
———. 2001. Public School Finance Programs of theUnited States and Canada: 1998–99. National Center
for Education Statistics, NCES 2001–309. Washington,
D.C.: NCES. Retrieved June 13, 2002, from
http://nces.ed.gov/edfin/state_finance/StateFinancing.asp
U.S. Government Accounting Office. 1993. Nature and Extent of Tax Abatements in the United States. Report
no. GAO/HRD-93-27R. Washington, D.C.: Author.

03.13.48910
Research1201 16th St., N.W.
Washington, D.C. 20036-3290www.nea.org