Embed Size (px)
Citation preview
Protectionism Indices for Non-Tariff Measures: An Application to Maximum Residue Levels
Yuan Li John Beghin
January 2013 IATRC
Working Paper #13-02
Working Paper
International Agricultural Trade Research Consortium
Protectionism Indices for Non-Tariff Measures: An Application to Maximum Residue Levels
Yuan Li
John C Beghin*
Working Paper #13-02 The International Agricultural Trade Research Consortium is an informal association of University and Government economists interested in agricultural trade. Its purpose is to foster interaction, improve research capacity and to focus on relevant trade policy issues. It is supported by United States Department of Agriculture (ERS, and FAS), Agriculture and Agri-Food Canada and the participating institutions. The IATRC Working Paper series provides members an opportunity to circulate their work at the advanced draft stage through limited distribution within the research and analysis community. The IATRC takes no political positions or responsibility for the accuracy of the data or validity of the conclusions presented by working paper authors. Further, policy recommendations and opinions expressed by the authors do not necessarily reflect those of the IATRC or its funding agencies. For a copy of this paper and a complete list of IATRC Working Papers, books, and other publications, see the IATRC Web Site http://www.iatrc.org A copy of this paper can be viewed/printed from the IATRC Web Site indicated above. * Yuan Li is a PhD Candidate in the Economics Department at Iowa State University. John Beghin <[email protected]> is Marlin Cole Professor of International Agricultural Economics in the same department. This paper is based on Li’s second dissertation essay. The MRL data and computations in this version of the manuscript have been updated in spring 2012. Correspondence regarding this paper should be addressed to the authors.
January 2013
ISSN 1098-9210 IATRC
Working Paper #13-02
Protectionism Indices for Non-Tariff Measures:
An Application to Maximum Residue Levels
Yuan Li
John C Beghin*
Iowa State University
July 20, 2012
Abstract
We propose aggregation indices of Non-Tariff Measures (NTMs) to quantify their protectionism
relative to international standards. We apply the indices to national Maximum Residue Limit
(MRL) regulations affecting agricultural and food trade and using a science-based criteria
embodied in Codex Alimentarius international standards. The approach links two streams of the
NTM literature, one concerned with the aggregation of various NTMs into operational indices
for econometric and modeling purposes, and the other attempting to evaluate the protectionism
of NTMs. The data used in the application come from a large international dataset on veterinary
and pesticide MRLs and CODEX MRL standards for a large set of countries.
JEL code: F13, Q17, Q18
Keywords: NTMs, non-tariff measures, barriers, protectionism, Maximum residue limit, MRL
* Yuan Li is a PhD Candidate in the Economics Department at Iowa State University. John Beghin is
Marlin Cole Professor of International Agricultural Economics in the same department. This paper is
based on Li’s second dissertation essay. The MRL data and computations in this version of the
manuscript have been updated in spring 2012. We thank Dermot Hayes, David Hennessy, John Schroeter,
and Bo Xiong for comments and discussions. The usual disclaimer applies. Beghin acknowledges support
from the Marlin Cole Fund at Iowa State University. Contact author: John Beghin: 260 Heady Hall.
Economics. Iowa State University Ames IA 50011-1030. USA. Email: [email protected]. Phone: 1 515
294 5811. Fax: 1 515 294 0221.
1
Introduction
We fill a gap in the literature on empirical measures of protectionism of nontariff measures
(NTMs) by proposing simple yet formal aggregation indices of NTMs. The indices measure the
protectionism of Maximum Residue Limit (MRL) standards relative to science-based criteria
embodied in international standards such as Codex Alimentarius. MRLs set limits on harmful
substances, like pesticide residues, veterinary drug residues, and other harmful substances, that
importing countries allow on similar imported and domestic products as implied by national
treatment. MRLs are often substance, product, and country specific. MRLs can also be used to
impede trade to protect domestic producers rather than protecting health or the environment.
We link two streams of the NTMs literature, each addressing a specific problem. These
two problems have been vexing and remain largely unresolved. One stream is concerned with the
aggregation of various NTMs into meaningful indices, to characterize NTM regimes and to be
used in econometric analyses of trade flows or to model and analyze policy impact (Disdier,
Fontagné, and Mimouni (2008)). The other stream attempts to evaluate the protectionist nature of
NTMs. Unlike tariffs for which the presumption is that they distort trade and welfare, NTMs
may improve welfare because they address some market imperfection (Beghin et al. (2012)). So
quantification, aggregation, and delineation of the potential protectionism of NTMs are a
complex and important issue in the analysis of NTMs.
Empirical studies of NTMs almost inevitably involve quantification and aggregation of
several policies. Unlike tariffs, a single policy type whose numerical values can be directly used
and interpreted, NTMs cover a lot of intrinsically different policies. For example, a Multi-
Agency Support Team (MAST) of international organizations proposed a classification of
NTMs, which consists of 16 major categories, including Sanitary and Phytosanitary (SPS)
2
measures, Technical Barriers to Trade (TBT), other technical measures, price control measures,
quantity control measures, etc. These NTMs can be qualitative and/or quantitative standards. For
qualitative standards, like labeling, no numerical values can be directly used. Further, these
qualitative policies affect different components of cost of production and marketing and cannot
be easily aggregated into a single price equivalent. Evaluating the protectionist component of
these numerous qualitative policies into a protectionist score is likely to remain a challenge. For
quantitative NTM policies, we show that aggregation is a much more manageable task
Individual NTMs have been used empirically in a disaggregated fashion (Disdier and
Marette (2010); Wilson and Otsuki (2004)). For qualitative standards, dummies are usually used
to indicate the existence of such a standard. For quantitative standards, like Maximum Residue
Limits (MRLs), the numerical levels may be directly used in the model (Xiong and Beghin
(2012)). However, a single disaggregated NTM has limited application. Usually, a myriad of
standards work together to regulate the quality of a product, and picking just one of the NTMs
may lead to subjective selection bias and a mischaracterization of the set of NTMs regulating the
market under study. In addition, even if there is no bias, a single NTM is not exhaustive and may
not be representative.
Based on that concern, researchers often aggregate regulations and standards in summary
indicators (Winchester et al., forthcoming). Indices involve aggregating over different
regulations and standards, like labeling and MRL, and/or aggregating over products of different
importance. Recent investigations focus on measuring the heterogeneity of NTMs across
countries and products. Kox and Lejour (2006) propose an index based on a binary indicator of
NTMs similarity. Rau, Shutes, and Sclueter (2010) developed a heterogeneity index of trade
(HIT) of NTMs that can be applied to binary, ordered, or quantitative NTMs. The HIT is non-

3
directional which means it measures the bilateral dissimilarity of NTMs, but gives no
information about the relative strictness of NTMs. Winchester et al. (forthcoming) extend the
HIT, to a directional HIT (DHIT) capturing the asymmetric stringency between two countries
and apply it to MRL data in an investigation of bilateral trade of agricultural products. Vigani,
Raimondi, and Opler (2009), Drogué and DeMaria (forthcoming), and Achterbosch et al. (2009)
offer alternative scalar measures of dissimilarity of policies.
An alternative to these indices, the frequency ratio, is often used (Harrigan (1993);
Fontagné, Mimouni, and Pasteels (2005); Disdier, Fontagné, Mimouni (2008)). It calculates the
coverage of NTMs of product categories relative to the total number of product categories of at
aggregated level (say HS4 or HS2 digit) and weighted by production levels. Other aggregate or
summary NTM proxies exist. See Li and Beghin (2011) for a systematic review of various NTM
proxies and aggregators used in econometric investigations.
Many NTMs investigations assume NTMs impede trade (and implicitly welfare) and rule
out trade or welfare enhancing effects. However, we know market imperfections such as
asymmetric information and externalities abound and NTM policy interventions could increase
welfare and may be trade-impeding or trade enhancing while increasing welfare. NTMs may also
be protectionist of course. Nevertheless, some agnostic priors on their protectionist nature ought
to prevail. The empirical literature actually shows numerous cases of trade-enhancing NTMs (Li
and Beghin 2011). There is no simple mapping between NTMs and their trade and welfare
effects in presence of market imperfections.
To complicate further, market imperfections may justify some NTMs but do not exclude
protectionism because the level of the chosen measure may be overly stringent, hence,
protectionist by creating unnecessary frictions in trade. This is an increasing preoccupation in
4
policy forums (Disdier and van Tongeren (2010)). Several investigations correlate frequency and
trade frictions, without formalizing what is protectionism. For example, Disdier and van
Tongeren (2010) make the conjecture that protectionism is responsible for some variance of
incidence of NTMs across agri-food products. Disdier, Fontagné, Mimouni (2008) posit that
protectionism may exist when a SPS measure is enforced by only a few countries. Finally,
Winchester et al. (forthcoming) investigate how bilateral stringency differences in NTMs affect
bilateral trade. Reducing stringency differences to common lower stringency levels would
increase trade; the welfare grounds to do so are less clear, unless protectionism is presumed to
prevail in the most stringent countries. These “conjectures” are intuitive, but lack formalism.
Formalizing protectionism
When defining protectionism of NTMs one can start with the simple science-based test. In
absence of scientific evidence establishing market imperfections or risk, a NTM is protectionist.1
In presence of established risk or imperfections, identifying protectionism is more cumbersome.
More conceptually, Fischer and Serra (2000) provide a formal criterion for gauging
protectionism in presence of market imperfection. They conceptually analyze the protectionism
behavior of a local social planner (LSP) setting up a quality standard to lower a negative
consumption externality. The authors define a standard as protectionist if its optimum level is
higher under a local LSP than under a global social planner treating all firms competing for the
domestic market (foreign and domestic firms) as purely domestic. They find that when there a
negative consumption externality the LSP always set the optimum domestic standard at a higher
(protectionist) level than the level chosen by the global planner. Their results hinge on the
domestic firms being more efficient at meeting the quality standard than foreign firms are.
1 There is a caveat of the precautionary principle which lets a country introduce a NTM while establishing the
science. A precautionary policy without the pursuit of evidence is protectionist according to the WTO.

5
Marette and Beghin (2010) show that if foreign firms are much more efficient at meeting the
standard, the domestic LSP will choose an anti-protectionist standard, lower than the global
standard. Berti and Falvey (2009) extend the analysis of Fisher and Serra and incorporate rent
seeking industries influencing the way the LSP sets standards. They investigate how rent-seeking
and socially optimum standards vary from autarky to free trade. Rent-seeking under free trade
between two countries promotes the harmonization of standards that were heterogeneous under
autarky. Finally, earlier on, Baldwin (1970) defines a NTM as protectionist whenever it lowers
global real income. The latter criteria could conceptually accommodate cases with market
imperfections.
These conceptual efforts provide clear definitions of protectionism. However, they are
difficult to operationalize in realistic empirical applications when many NTMs are imposed at
once and because informational requirements are extensive. The issue of an aggregator lurks
again in presence of many NTMs. Further, the Fisher and Serra criterion is not directly
applicable when the supply is only made of foreign firms as in the case of tropical exports to
most of the Northern hemisphere (e.g., the EU peanut market). The Baldwin criterion is also
difficult to implement in real empirical cases given the “world” dimension of the criteria.
The World Trade Organization (WTO) does not set standards but encourages countries
to use internationally accepted science-based standards, like Codex Alimentarius standards
whenever available. However, the WTO allows its members to set their own standards away
from international ones, as long as their individual standards are science based, non-
discriminating, and least trade restrictive (WTO Doha Ministerial (2001)). The issue of
“appropriate level of protection” is still under discussion, and the WTO has not yet
disambiguated what this means practically. Yet the science-based argument is a corner stone to
6
fight protectionism and has led to several ruling by the WTO against policies in the EU, Japan,
and Australia which could not be justified using scientific evidence (see WTO dispute cases
DS245, DS367, and DS26).
In the next section, we propose indices of NTM protectionism based on their departures
from international science-based standards. We consider MRL measures, which are quantitative
standards and give us a basis for comparison and aggregation. We use the Codex Alimentarius
MRL standards as the non-protectionist science-based reference level. MRLs that exceed Codex
levels are defined to be protectionist, a simple criterion. It extends naturally from the WTO
recommendation to use international standards. We also limit our analysis to science-based
situations for each of which an international standard exists.
Defining Protectionism Indices
Different aggregation levels have specific purposes. A measure of the protectionism for a given
importer and given good provides detailed information for importers by commodities. This
aggregator is useful for cross section (goods and countries) econometric investigations.
Aggregate-country level protectionism scores over all considered goods facilitate straightforward
country differences in MRL protectionism. These most aggregate scores allow us to assess and
rank countries by their relative protectionism. These could also be compared to summary
protection measures via tariffs and farm subsidies to analyze the policy composition of
protectionism. Product level protectionism scores facilitate straightforward high-level
interpretation in the sector or commodity differences in MRL protectionism and are the building
blocks of the other two aggregation scores.
We define an importer’s MRL to be protectionist when its stringency exceeds the
7
corresponding science-based international MRL. If an importer’s MRL is higher than the
corresponding international MRL, then we deem the MRL non-protectionist. The aggregation
over a multitude of substances (and goods) provides robustness to the indices. An “unintended”
accidental protectionist MRL will be swamped by other non-protectionist MRLs included in the
three indices proposed below if a country is mostly non-protectionist.
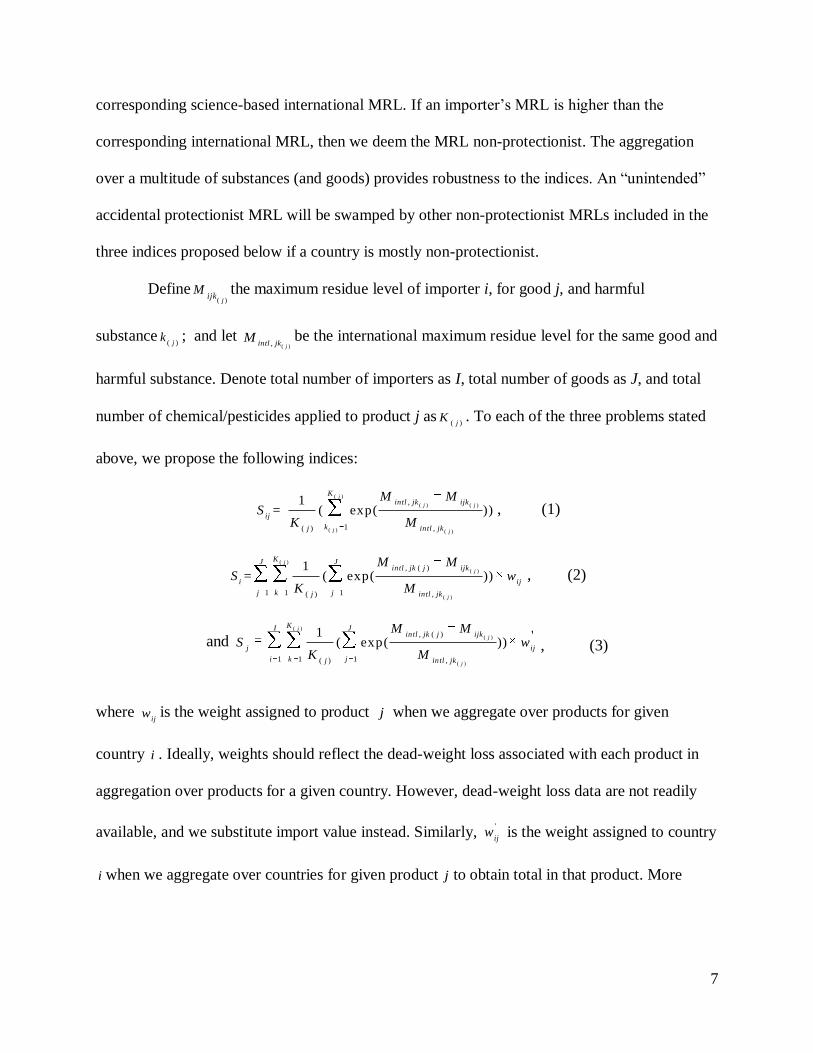
Define( )j
ijkM the maximum residue level of importer i, for good j, and harmful
substance( )j
k ; and let ( ), jintl jk
M be the international maximum residue level for the same good and
harmful substance. Denote total number of importers as I, total number of goods as J, and total
number of chemical/pesticides applied to product j as( )j
K . To each of the three problems stated
above, we propose the following indices:
( )
( ) ( )
( ) ( )
,
1( ) ,
1= ( exp( ))
j
j j
j j
K
intl jk ijk
ij
kj intl jk
M MS
K M, (1)
( )
( )
( )
, ( )
1 1 1( ) ,
1= ( exp( ))
j
j
j
KJ Jintl jk j ijk
i ij
j k jj intl jk
M MS w
K M, (2)
and ( )
( )
( )
, ( )
1 1 1( ) ,
1 '( exp( ))
j
j
j
KI Jintl jk j ijk
j ij
i k jj intl jk
M MS w
K M, (3)
where ij
w is the weight assigned to product j when we aggregate over products for given
country i . Ideally, weights should reflect the dead-weight loss associated with each product in
aggregation over products for a given country. However, dead-weight loss data are not readily
available, and we substitute import value instead. Similarly, '
ijw is the weight assigned to country
i when we aggregate over countries for given product j to obtain total in that product. More
8
specifically,
1
ij
Jij
ij
j
IMw
IM
and
1
' ij
Iij
ij
i
IMw
IM
, where ij
IM is the import value of country
i for total trade of product j . Below, we refer to the traded scores as “trade-weighted” or simply
“weighted” and we refer to the unweighted scores as “equally-weighted” or “unweighted.” 2
To summarize, index ij
S measures the protectionism of the MRLs for a given product and
importer, aggregating over substances; i
S measures the protectionism of MRLs for a given
importer, aggregating over substances and products; and j
S measures the protectionism of
MRLs for a given product, aggregating over substances and importers.
Properties of the indices
By design, the indices have the following properties: invariance to scale, increasing marginal
difficulty of attaining stricter standards (convexity in protectionism), invariance to regulation
intensity, monotonicity (non-decreasing in MRL stringency of different countries, same product
and same harmful substance, other things equal), and lower and upper bounded.
First, we subtract the importer’s MRL from the international MRL, because, by the
definition of protectionism, only the part of the importer’s MRL that is more stringent than the
international MRL contributes to protectionism. When the MRL is laxer than the international
standard, it is anti-protectionist. MRLs have different scales, which could vary from 0.01
ppm(parts per million) to 10ppm or more. To make the index invariant to the scale of different
residue levels, we scale the differences between importer and international MRLs by the
international MRL. Second, the lower (i.e, stricter) the standard the harder it is for exporters to
achieve. For example, some importers may relax all but one MRL above the international
2 In the empirical section, we also investigate normalized trade weights by dividing trade weights by a measure of
aggregate trade openness.
9
accepted level. But the one stringent MRL may become tough to achieve. By taking the
exponential of the protectionism contributing part of the MRL, we put more weight on the MRLs
that are relatively more stringent.
Third, the number of substances regulated varies by products in many cases. In our
application, this number of substances ranges from over a hundred to below 10. For example, the
United States has established 107 pesticide MRLs for apples, and only 7 pesticide MRLs for
coconut. The different regulatory intensity is possibly due the heterogeneous popularity of
products with consumers. By averaging the sum of protectionism scores of each pesticide by the
total number of pesticides, we make the protectionism indices invariant the regulation intensity.
This property is further analyzed later in the paper as the regulatory intensity may be confounded
with some missing data issue.
Fourth, the indices are non-decreasing in stringency (( )jijk
M getting smaller) for different
countries given the same j, ( )j
k and all other things being equal. If a country’s standard is more
stringent, its protectionist scores will be nondecreasing in that stringency. Last, the scores are
bounded by 0 at the lower bound and 2 .7 2e at the upper bound. A score of 1 indicate a non-
protectionist policy. Scores larger than 1 indicate “protectionism” of policies as MRLs can be
more stringent than Codex, and scores below 1 indicate the “anti-protectionism,” of policies as
MRLs can be laxer than Codex.3
Application and Data Description
The MRL data used here are publicly available and come from the USDA FAS International
3 In an earlier version, we truncated the indices below at 1 by constraining MRLs to have a score of 1 if they are not
protectionist, including anti-protectionist MRLs. Avoiding truncation allows for anti-protectionism and provides a
better measure of the variation in scores within a given index, but allows to have protectionism and anti-
protectionism offsetting each other within the index. The latter would be reflected in an index with a large variance.

10
MRL database (http://www.mrldatabase.com/) made available on line in 2010. The database
consists of pesticide MRLs and veterinary drug MRLs. Pesticide and veterinary drug MRLs are
maintained in two separate databases and their data structures are different. We discuss the
pesticide MRLs database first.
The pesticide MRLs database covers 341 products (Table 1), 19,486 (product by
pesticide) pairs, and 83 countries (Table 2), and has 1,617,338 records. Among the 83 countries
covered by the pesticide MRLs database, 29 countries completely comply with Codex standards;
18 countries comply with EU standards; 7 countries defer to exporting countries standards; 5
countries comply with Gulf Cooperation Council (GCC) standards; and Mexico adopted U.S.
standards. Finally, 22 out of 83 countries set their own standards only or partially combined with
Codex or EU standards.
This rich database has several shortcomings, however. First, there is some redundancy in
the listed products. This is not a problem when we calculate product-level protectionism indices.
However, when we aggregate over products to calculate country-level protectionism indices, this
redundancy causes larger influence for the redundant products. The redundancy is a result of
different names of products that different countries use. Specifically, there are two types of
redundancies. One is exact redundancy: same product with alternative names but with similar
MRL data. For example, “Beet”, “Beet, Garden”, and “Beet, Garden, Roots” are the same
commodity. These product names are listed separately in the database but with the same MRL
data. We manually detect and delete the redundant names.
Table 1: Product categories in the pesticide database
Category Count
Grains & Oilseeds 14
Poultry & Eggs 6
Dairy 2
Horticultural & Tropical 313
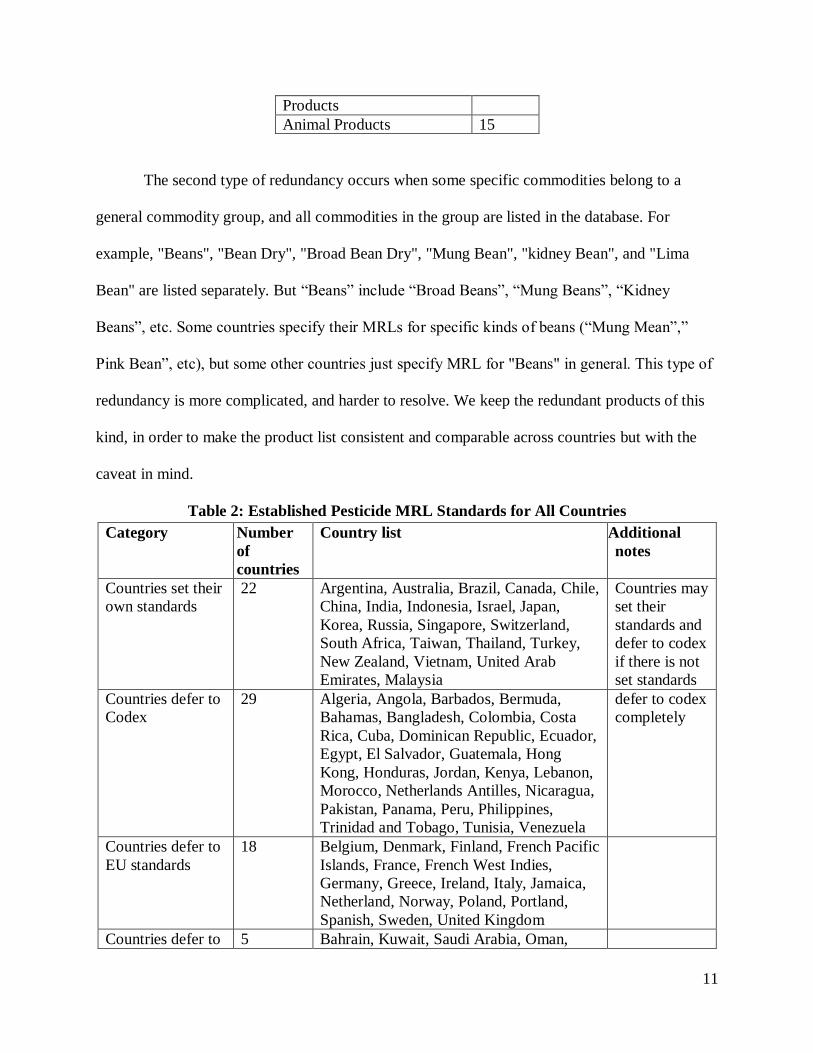
11
Products
Animal Products 15
The second type of redundancy occurs when some specific commodities belong to a
general commodity group, and all commodities in the group are listed in the database. For
example, "Beans", "Bean Dry", "Broad Bean Dry", "Mung Bean", "kidney Bean", and "Lima
Bean" are listed separately. But “Beans” include “Broad Beans”, “Mung Beans”, “Kidney
Beans”, etc. Some countries specify their MRLs for specific kinds of beans (“Mung Mean”,”
Pink Bean”, etc), but some other countries just specify MRL for "Beans" in general. This type of
redundancy is more complicated, and harder to resolve. We keep the redundant products of this
kind, in order to make the product list consistent and comparable across countries but with the
caveat in mind.
Table 2: Established Pesticide MRL Standards for All Countries
Category Number
of
countries
Country list Additional
notes
Countries set their
own standards
22 Argentina, Australia, Brazil, Canada, Chile,
China, India, Indonesia, Israel, Japan,
Korea, Russia, Singapore, Switzerland,
South Africa, Taiwan, Thailand, Turkey,
New Zealand, Vietnam, United Arab
Emirates, Malaysia
Countries may
set their
standards and
defer to codex
if there is not
set standards
Countries defer to
Codex
29 Algeria, Angola, Barbados, Bermuda,
Bahamas, Bangladesh, Colombia, Costa
Rica, Cuba, Dominican Republic, Ecuador,
Egypt, El Salvador, Guatemala, Hong
Kong, Honduras, Jordan, Kenya, Lebanon,
Morocco, Netherlands Antilles, Nicaragua,
Pakistan, Panama, Peru, Philippines,
Trinidad and Tobago, Tunisia, Venezuela
defer to codex
completely
Countries defer to
EU standards
18 Belgium, Denmark, Finland, French Pacific
Islands, France, French West Indies,
Germany, Greece, Ireland, Italy, Jamaica,
Netherland, Norway, Poland, Portland,
Spanish, Sweden, United Kingdom
Countries defer to 5 Bahrain, Kuwait, Saudi Arabia, Oman,

12
GCC standards Qatar
Countries defer to
exporting
countries standards
7 Albania, Antigua and Barbuda, Cayman
Island, Haiti, Nevis, Sri Lanka, St. Lucia
Countries defer to
US standards
2 United States, Mexico
A second issue is that the MRL database only lists chemicals that are available to U.S.
farmers. This problem also applies to the veterinary drug database. A foreign MRL for a product
or chemical is only included in the database if there is a U.S. MRL for that product or chemical.
Hence, the foreign country could be regulating other residues but we do not know for which
chemical and the corresponding MRLs. Luckily the U.S list is the most extensive so this
limitation is not frequent.
The third problem with the database resides with non-established MRLs. This problem
also applies to Veterinary Drug database. Usually, the default MRLs defined by countries may
apply when no MRLs are established. But there are rare cases when chemicals are exempt or
banned. Since the database only includes the chemicals that the United States has positively
listed, it is unlikely that these chemicals are considered exempt by other countries. In addition, it
is difficult to find lists of banned chemicals maintained by other countries. We have no further
information to distinguish between the situations when a not-established MRL means default,
exempt, banned, or just plain missing data. Because the exempt and banned cases are rare, we
substitute non-established MRLs with individual country’s default MRLs (see table 3). Missing
data remain a concern. The USDA database was considerably updated in 2012 after its initial
(2010) release with many non-established data being eventually updated by actual MRLs.
Presumably missing data have been greatly reduced.
Table 3: Default Values for Not-established Pesticide MRLs
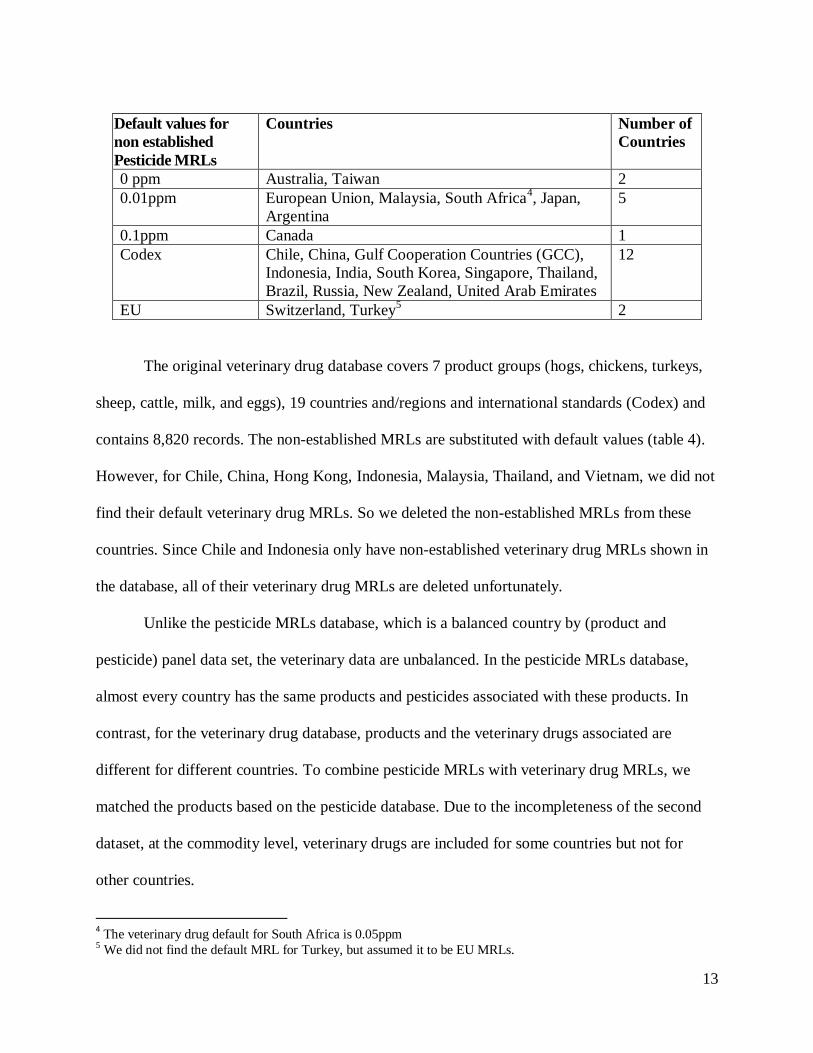
13
The original veterinary drug database covers 7 product groups (hogs, chickens, turkeys,
sheep, cattle, milk, and eggs), 19 countries and/regions and international standards (Codex) and
contains 8,820 records. The non-established MRLs are substituted with default values (table 4).
However, for Chile, China, Hong Kong, Indonesia, Malaysia, Thailand, and Vietnam, we did not
find their default veterinary drug MRLs. So we deleted the non-established MRLs from these
countries. Since Chile and Indonesia only have non-established veterinary drug MRLs shown in
the database, all of their veterinary drug MRLs are deleted unfortunately.
Unlike the pesticide MRLs database, which is a balanced country by (product and
pesticide) panel data set, the veterinary data are unbalanced. In the pesticide MRLs database,
almost every country has the same products and pesticides associated with these products. In
contrast, for the veterinary drug database, products and the veterinary drugs associated are
different for different countries. To combine pesticide MRLs with veterinary drug MRLs, we
matched the products based on the pesticide database. Due to the incompleteness of the second
dataset, at the commodity level, veterinary drugs are included for some countries but not for
other countries.
4 The veterinary drug default for South Africa is 0.05ppm 5 We did not find the default MRL for Turkey, but assumed it to be EU MRLs.
Default values for
non established
Pesticide MRLs
Countries Number of
Countries
0 ppm Australia, Taiwan 2
0.01ppm European Union, Malaysia, South Africa4, Japan,
Argentina
5
0.1ppm Canada 1
Codex Chile, China, Gulf Cooperation Countries (GCC),
Indonesia, India, South Korea, Singapore, Thailand,
Brazil, Russia, New Zealand, United Arab Emirates
12
EU Switzerland, Turkey5 2
14
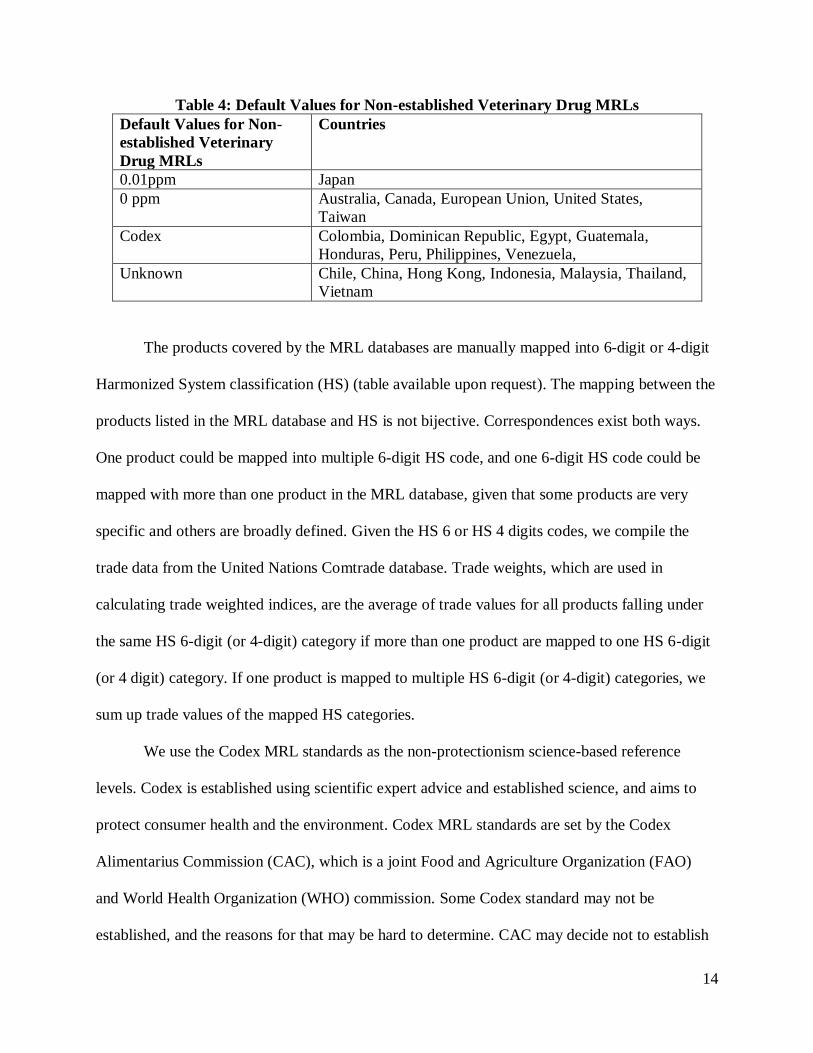
Table 4: Default Values for Non-established Veterinary Drug MRLs
Default Values for Non-
established Veterinary
Drug MRLs
Countries
0.01ppm Japan
0 ppm Australia, Canada, European Union, United States,
Taiwan
Codex Colombia, Dominican Republic, Egypt, Guatemala,
Honduras, Peru, Philippines, Venezuela,
Unknown Chile, China, Hong Kong, Indonesia, Malaysia, Thailand,
Vietnam
The products covered by the MRL databases are manually mapped into 6-digit or 4-digit
Harmonized System classification (HS) (table available upon request). The mapping between the
products listed in the MRL database and HS is not bijective. Correspondences exist both ways.
One product could be mapped into multiple 6-digit HS code, and one 6-digit HS code could be
mapped with more than one product in the MRL database, given that some products are very
specific and others are broadly defined. Given the HS 6 or HS 4 digits codes, we compile the
trade data from the United Nations Comtrade database. Trade weights, which are used in
calculating trade weighted indices, are the average of trade values for all products falling under
the same HS 6-digit (or 4-digit) category if more than one product are mapped to one HS 6-digit
(or 4 digit) category. If one product is mapped to multiple HS 6-digit (or 4-digit) categories, we
sum up trade values of the mapped HS categories.
We use the Codex MRL standards as the non-protectionism science-based reference
levels. Codex is established using scientific expert advice and established science, and aims to
protect consumer health and the environment. Codex MRL standards are set by the Codex
Alimentarius Commission (CAC), which is a joint Food and Agriculture Organization (FAO)
and World Health Organization (WHO) commission. Some Codex standard may not be
established, and the reasons for that may be hard to determine. CAC may decide not to establish
15
the MRL, or decide the chemical should not be allowed, or that the chemicals are not harmful, or
it might be that the standard setting process is still undergoing. Codex MRLs are established
through a multi-year process by the Codex Commission on Pesticide Residue (CCPR). Member
countries nominate MRLs they wish to establish. It takes an average of two to four years for
Codex to complete a standard (Roberts and Josling (2010)). However, Codex maintains a rather
extensive list of chemical MRLs, and more than half of the countries in our dataset completely or
partially defer to Codex standards.
Therefore, to avoid ambiguity in our investigation, we focus on the subset of products
and chemicals for which Codex MRLs are established. For countries that have non-established
standards for certain chemicals, we substitute their default values based on that individual
country’s default MRLs (see Table 3 and Table 4). In addition, since the GCC standards are not
available in the database, we remove the 5 GCC countries from our sample.
The final combined MRL dataset for calculation in this paper consists of 273 products, 77
countries, and includes 411,304 records. Note that the chemicals applied to each product may
differ, and the set (product x chemicals) associated with different countries may vary due to the
unbalanced veterinary drug data we mentioned above. In addition, we added EU-27 as a group,
in addition to the individual EU countries. So, in total we have 77 countries (83 countries (all
countries in the original MRL database), minus 5 excluded GCC countries, minus 2 data
unavailable countries (Switzerland and Norway), plus one aggregate EU-27 as a group).
Results
We calculated 21,021 country-by-product level protectionism scores6 with non-established
MRLs substituted with default levels (method 1) and 18,758 country-by-product level
protectionism scores with non-established MRLs deleted (method 2). For each method, we then
6Detailed results are available upon request.
16
aggregated country-by-product scores to country level and product level with trade weights, and
then equal weights. We have 50 trade-weighted country level indices and 77 equally-weighted
country level indices (available upon request). Note that the difference in number of countries is
due to the availability of COMTRADE trade data of year 2009 (in 2011). In addition, EU
countries have the same EU standards and similar trade structures, so, instead of individual EU
countries, we report for the aggregate EU-27. Mexico complies with U.S. standard, yet it has a
slightly different protectionism score, which is caused by its own import structure leading to
different weights in the indices’ aggregation.
Table 5 presents the protectionism scores by country. The first two columns are un-
weighted scores with method 1 and method 2 respectively, the next two columns are the trade-
weighted protectionism scores, and third set of two columns shows the normalized trade-
weighted scores, which are the trade-weighted scores normalized by the openness. For simplicity
of discussion, we refer the (un)weighted protectionism scores calculated with method 1 and
method 2 as (un)weighted score 1 and (un)weighted score 2. The last column is the sum of non-
established MRLs count by country. 12 countries have non-zero count of non-established
MRLs. The number of non-established MRLs range from 4883 (China) to 856 (EU).
The openness is measured by the ratio of total agricultural imports over GDP of the country. The
normalized score is intended to correct the potential upward biasness in scores for countries with
stricter MRL standards and large imports. The latter does not have an upper bound. Caution
should be used in interpreting the normalized protectionism indices. Adjusting for openness
reduces the influence of trade-weights used in aggregating over products. The indices, by design,
put heavier weights on the products with higher imports, which indicate the importance of the
related products. Whether protectionism scores for large importers should be adjusted
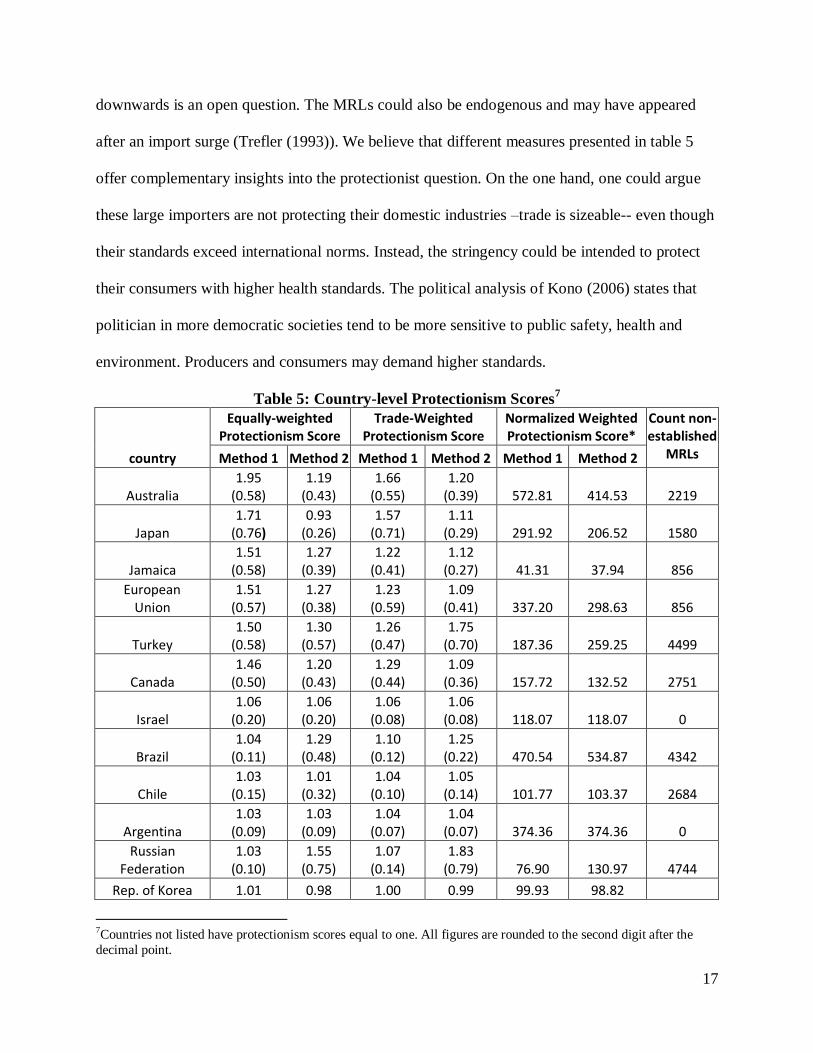
17
downwards is an open question. The MRLs could also be endogenous and may have appeared
after an import surge (Trefler (1993)). We believe that different measures presented in table 5
offer complementary insights into the protectionist question. On the one hand, one could argue
these large importers are not protecting their domestic industries –trade is sizeable-- even though
their standards exceed international norms. Instead, the stringency could be intended to protect
their consumers with higher health standards. The political analysis of Kono (2006) states that
politician in more democratic societies tend to be more sensitive to public safety, health and
environment. Producers and consumers may demand higher standards.
Table 5: Country-level Protectionism Scores7
country
Equally-weighted Protectionism Score
Trade-Weighted Protectionism Score
Normalized Weighted Protectionism Score*
Count non-established
MRLs Method 1 Method 2 Method 1 Method 2 Method 1 Method 2
Australia 1.95
(0.58) 1.19
(0.43) 1.66
(0.55) 1.20
(0.39) 572.81 414.53
2219
Japan 1.71
(0.76) 0.93
(0.26) 1.57
(0.71) 1.11
(0.29) 291.92 206.52
1580
Jamaica 1.51
(0.58) 1.27
(0.39) 1.22
(0.41) 1.12
(0.27) 41.31 37.94
856
European Union
1.51 (0.57)
1.27 (0.38)
1.23 (0.59)
1.09 (0.41) 337.20 298.63
856
Turkey 1.50
(0.58) 1.30
(0.57) 1.26
(0.47) 1.75
(0.70) 187.36 259.25
4499
Canada 1.46
(0.50) 1.20
(0.43) 1.29
(0.44) 1.09
(0.36) 157.72 132.52
2751
Israel 1.06
(0.20) 1.06
(0.20) 1.06
(0.08) 1.06
(0.08) 118.07 118.07
0
Brazil 1.04
(0.11) 1.29
(0.48) 1.10
(0.12) 1.25
(0.22) 470.54 534.87
4342
Chile 1.03
(0.15) 1.01
(0.32) 1.04
(0.10) 1.05
(0.14) 101.77 103.37
2684
Argentina 1.03
(0.09) 1.03
(0.09) 1.04
(0.07) 1.04
(0.07) 374.36 374.36
0
Russian Federation
1.03 (0.10)
1.55 (0.75)
1.07 (0.14)
1.83 (0.79) 76.90 130.97
4744
Rep. of Korea 1.01 0.98 1.00 0.99 99.93 98.82
7Countries not listed have protectionism scores equal to one. All figures are rounded to the second digit after the
decimal point.
18
(0.16) (0.46) (0.11) (0.21) 3867
China 1.01
(0.05) 1.04
(0.40) 1.03
(0.10) 1.17
(0.37) 145.56 165.04
4883
Malaysia 0.99
(0.04) 0.99
(0.04) 0.99
(0.04) 0.99
(0.04) 37.25 37.25
0
United Arab Emirates
0.99 (0.03)
0.99 (0.03)
0.99 (0.03)
0.99 (0.03) 31.25 31.25
0
United States 0.98
(0.36) 0.98
(0.36) 0.89
(0.35) 0.89
(0.35) 356.85 356.85
0
Mexico 0.98
(0.35) 0.98
(0.35) 0.97
(0.26) 0.97
(0.26) 72.93 72.93
0
India 0.97
(0.14) 0.96
(0.18) 1.03
(0.09) 1.05
(0.13) 163.84 166.77
1859
New Zealand 0.97
(0.07) 0.97
(0.07) 0.97
(0.04) 0.97
(0.04) 137.79 137.79
0
Singapore 0.96
(0.13) 0.96
(0.13) 0.98
(0.11) 0.98
(0.11) 55.15 55.15
0
South Africa 0.87
(0.15) 0.87
(0.15) 0.82
(0.11) 0.82
(0.11) 113.40 113.40
0
Sri Lanka 0.53
(0.20) 0.55
(0.20) 0.43
(0.15) 0.47
(0.16) 19.92 22.02
08 *Note: Normalized Weighted Protectionism Score=Weighted Protectionism Score / (Ag Import/GDP), where Ag
Import is the import value of agricultural sectors HS02, HS04, HS06, HS07, HS08, HS09, HS10, HS12, and HS15
that we covered in this paper (see table 6 below for sector descriptions). Trade data come from COMTRADE, GDP
data come from World Bank, and these data are of the year 2009.
**Note: Numbers within parentheses are standard deviations of the (country×product) level protectionism scores.
On the other hand, higher imports may indicate higher demand, but strict MRLs pose a
hurdle for other countries with laxer MRL standards. Therefore, their imports come from both
countries with equal or stricter MRLs or other non-protectionist countries that incurred extra cost
to meet stricter standards. For those lower-standard countries, where MRLs are based on
internationally accepted standards or even lower, the strict MRLs of large importers could
represent protectionism.
The variation of scores for a given country comes from two sources: the difference
between method 1 and method 2; and the weights and normalization method. The difference
8 Sri Lanka complies with exporter’s MRLs. We substitute the maximum MRLs of matching
country×product×substance as Sri Lanka MRLs. The maximum could change as the datasets of method 1 and
method 2 differ, so we observe slight difference between score1 and score2 given Sri Lanka has no non-established
MRLs.
19
between scores 1 and 2 (under similar weights) depends on the number of non-established MRLs
and differences between the default MRL level and the other established MRLs for that country.
A much larger score 1 than score 2 indicates a default MRL being relatively stricter than
established MRLs and indicates that protectionism in that country is caused by a protectionist
default rather than by a concerted effort to be stringent on a particular MRL. The data could also
have some missing MRLs, which are confounded with non-established MRLs. We keep this
caveat in mind when drawing implications about discrepancies between scores 1 and 2.
We also note some differences between trade-weighted and equally-weighted scores for a
given country; the trade-weighted score could be higher or lower than or close to the equally-
weighted score. Self-evidently, if a country has higher trade-weighted scores relative to equally-
weighted scores, products with strict MRLs are heavily imported. Conversely, if a country has
lower trade-weighted scores than equally-weighted scores, products with less stringent MRLs are
heavily imported.
Australia, Japan, the EU, Jamaica, Turkey, and Canada rank among protectionist MRL regimes
based on score1 both weighted and unweighted. Australia and Japan have substantial difference
between score 1 and score 2, because of their large number of non-established MRLs and their
tight default levels (0 ppm for Australia, and 0.01 ppm for Japan) leading to their score 1 being
larger than their score 2. Much of the protectionism in MRLs in these two countries arises from
the tight default. Australia also exhibits some protection in established MRLs. Again here the
caveat applies on potentially missing data and the implied upward bias in score 1. The EU,
Canada, and Jamaica have similar but more moderate patterns given their tight default (0.01
ppm) but smaller number of non-established MRLs.
Chile, Korea, and India, despite their large number of non-established MRLs, have close

20
score 1 and score 2. The default MRL level of these countries (Codex) is similar to their
established MRLs. Since score 1 and score 2 are close, we feel confident to conclude that these
countries do not exhibit MRL protectionism. The United States is not protectionist based on any
of the unweighted/weighted scores 1 and scores 2, and even shows evidence of slight “anti-
protectionism” (below Codex) based on trade-weighted scores. South Africa and Sri Lanka have
score 1 and score 2 well below one, indicating they might be under protecting their consumers.
Singapore and New Zealand show scores very close to but slightly under 1.
Also notable, the Russian Federation and Brazil have higher protectionist scores 2 than
scores 1, suggesting that their established MRLs is chiefly responsible for their MRL
protectionism. Their low default and large number of non-established MRLs make them appear
moderately protectionist and mitigates the protectionism of establish MRLs. Turkey illustrates
the importance of weights. With trade weights, it appears that protectionism arises more from
established MRLs, whereas with unweighted scores, Turkey’s protectionism seems to come from
both established and default MRLs. For the EU and the US, trade-weighted scores are lower than
equally-weighted scores, indicating that some heavily imported products face less stringent
standards. For some other countries, we observe trade-weighted scores higher than unweighted
scores for one of or both score 1 and score 2. Stringent MRLs exceeding international norms
affect heavily traded products, possibly as a reaction to import surges.
If we normalize the protectionism score by openness, Brazil, Argentina, Australia, the EU
and the US come to the top. For Australia and the EU, this normalization does not alter the
notion that they exhibit MRL protectionism, but for Jamaica, the normalized scores are very low
and mitigating the conclusion that this country shows some MRL protectionism. Finally,
NAFTA integration on residue standards has been much deeper between Mexico and the United
21
States, relative to what Canada has done with its own standards, a surprising finding. Unlike for
tariffs, MRL regulations have not been harmonized across the three NAFTA members.
Each score comes with an estimated standard deviation, reflecting the variation of product
scores for each country. For trade-weighted scores’ standard deviations, products with smaller
import shares count for less and vise-versa. Generally, notable differences between scores 1 and
2 for any country, extend to their standard deviations. A significantly higher score (either 1 or 2)
for a country tends to show higher standard deviation for the corresponding score. Hence, we do
not see evidence of countries being non-protectionist “on average” by offsetting protectionist
MRLs with anti-protectionist ones. In most cases, standard deviations are small relative to scores
suggesting the scores and indices are informative. We turn to product scores next. We average
them over all countries and regulated substances by product. Detailed scores are available upon
request.
The averaging over all countries leads to smaller variations. The maximum of equally-
weighted scores 1 is 1.28 (Green onion) and minimum is 0.75 (Guava). The maximum of
equally-weighted score 2 is 1.21 (Belgian endive) and minimum is 0.74 (Guava). Adding trade
weights expands the variation of the scores. The maximum of trade-weighted score 1 is 2.47
(Belgian endive) and minimum is 0.42 (Guava); the maximum of trade-weighted scores 2 is 2.10
(Belgian endive) and minimum is 0.19 (Plantain).
To better elucidate the product-level protectionism, we look at score distribution plots by
grouping products by HS2 digit sectors, and then select a few commonly-discussed products to
investigate their MRL protectionism. Table 6 shows HS2 digit sectors, associated products that
fall into each sector, the number of products in each sector, and the number of non-established
MRLs for the product. The boxplots of weighted protectionism scores and unweighted scores for
22
each sector are presented in figures 1 and 2. Score 1 shows a wider dispersion and higher mean
than score 2 for fruit and vegetables. This observation shows that substituting non-established
MRLs with default levels risks inflating these products’ protectionism scores. Animal products
(HS02 and HS15) seem have little discrepancy between score 1 and score 2. Meat, diary, and egg
products have the lowest average, and mostly span in the lower protectionism region.
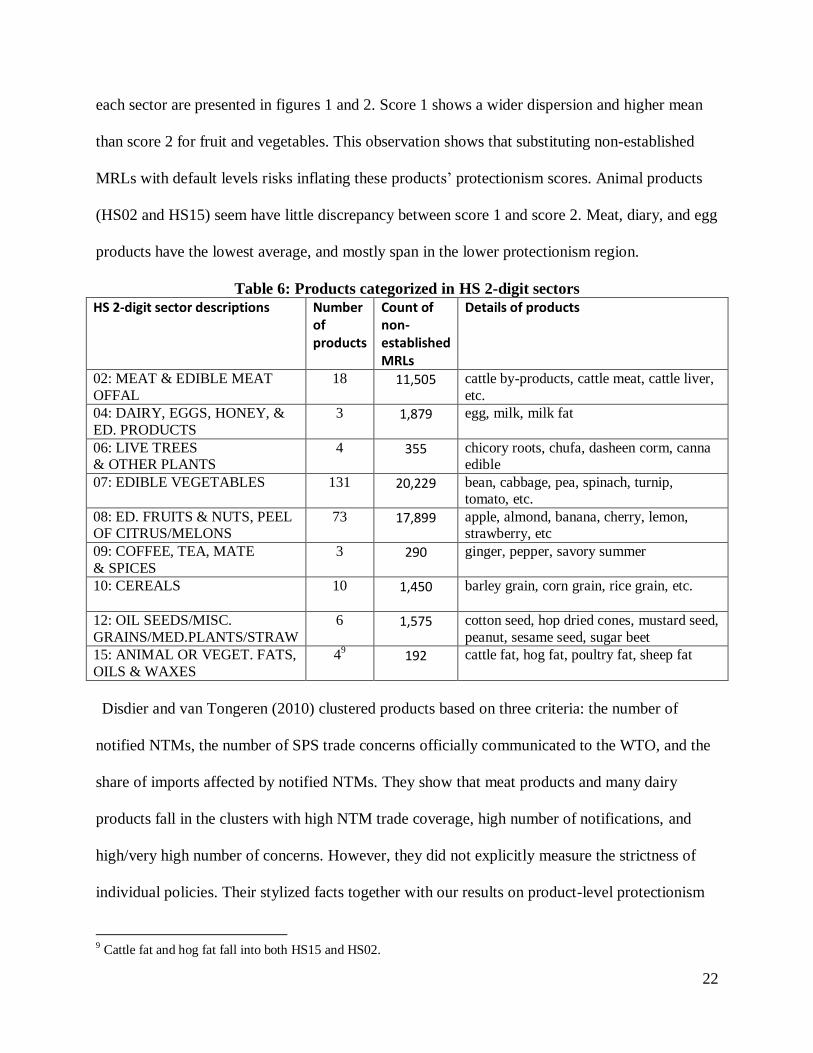
Table 6: Products categorized in HS 2-digit sectors
HS 2-digit sector descriptions Number of products
Count of non-established MRLs
Details of products
02: MEAT & EDIBLE MEAT
OFFAL
18 11,505 cattle by-products, cattle meat, cattle liver,
etc.
04: DAIRY, EGGS, HONEY, &
ED. PRODUCTS
3 1,879 egg, milk, milk fat
06: LIVE TREES & OTHER PLANTS
4 355 chicory roots, chufa, dasheen corm, canna edible
07: EDIBLE VEGETABLES 131 20,229 bean, cabbage, pea, spinach, turnip, tomato, etc.
08: ED. FRUITS & NUTS, PEEL OF CITRUS/MELONS
73 17,899 apple, almond, banana, cherry, lemon, strawberry, etc
09: COFFEE, TEA, MATE
& SPICES
3 290 ginger, pepper, savory summer
10: CEREALS 10 1,450 barley grain, corn grain, rice grain, etc.
12: OIL SEEDS/MISC.
GRAINS/MED.PLANTS/STRAW
6 1,575 cotton seed, hop dried cones, mustard seed,
peanut, sesame seed, sugar beet
15: ANIMAL OR VEGET. FATS,
OILS & WAXES
49 192 cattle fat, hog fat, poultry fat, sheep fat
Disdier and van Tongeren (2010) clustered products based on three criteria: the number of
notified NTMs, the number of SPS trade concerns officially communicated to the WTO, and the
share of imports affected by notified NTMs. They show that meat products and many dairy
products fall in the clusters with high NTM trade coverage, high number of notifications, and
high/very high number of concerns. However, they did not explicitly measure the strictness of
individual policies. Their stylized facts together with our results on product-level protectionism
9 Cattle fat and hog fat fall into both HS15 and HS02.
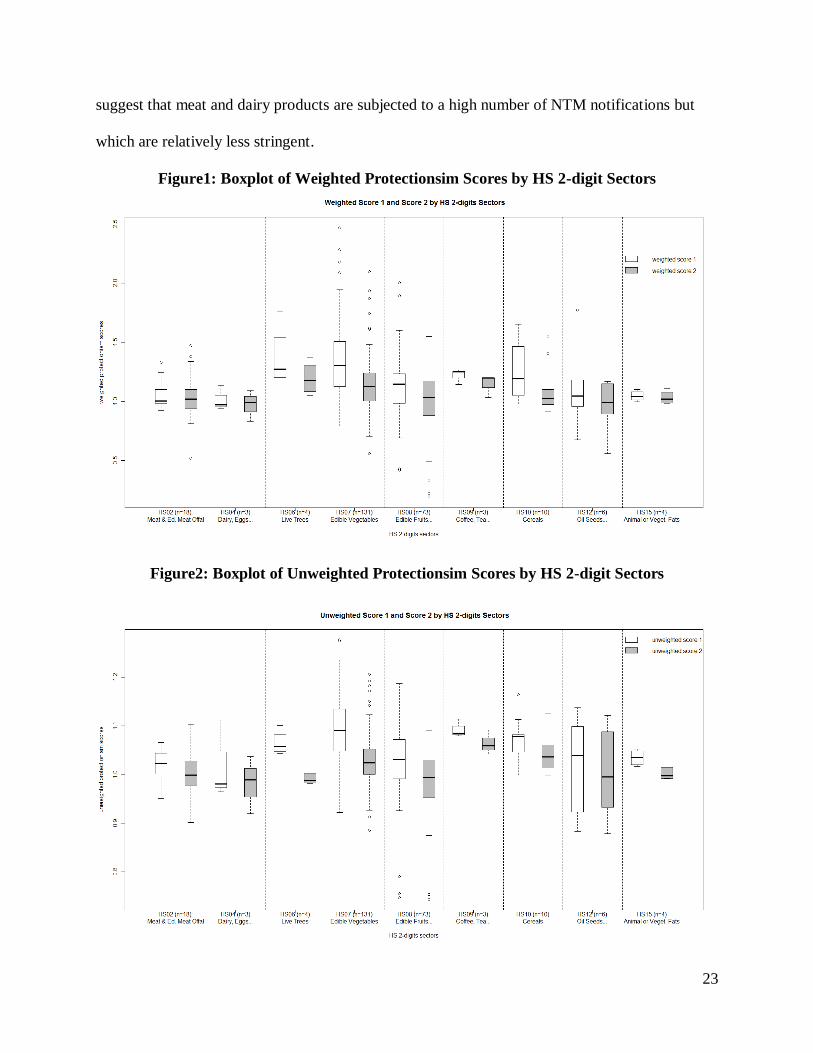
23
suggest that meat and dairy products are subjected to a high number of NTM notifications but
which are relatively less stringent.
Figure1: Boxplot of Weighted Protectionsim Scores by HS 2-digit Sectors
Figure2: Boxplot of Unweighted Protectionsim Scores by HS 2-digit Sectors
24
These heavily regulated sectors may not be heavily protected, but rather may involve more
health and food safety concerns. Disdier and van Tongeren (2010) also found that vegetable
products are spread over several clusters with high or low number of notifications. We observe a
similar variation in protectionism scores for vegetable products; their protectionism scores have
the widest span. The protectionism span is related to the large number of the products in this
sector. Fruit product protectionism scores are also found to exhibit large variations. Disdier and
van Tongeren (2010) suggest fruit products overall have a high number of notifications and high
number of concerns. This again indicates the complexity of gauging protectionism. Frequency of
notifications and concerns are not sufficient to establish protectionism; the actual stringency of
the standards should also be taken into consideration.
The differences between trade-weighted and equally-weighted scores are quite obvious
for product-level scores. Most of the large trade-weighted scores are higher than their equally-
weighted scores counterparts, and conversely for low-level scores. A trade-weighted score being
higher than its unweighted counterpart means that larger importers tend to have stricter MRLs
for that product; and vise versa. To see this clearly, we list the top country contributors to the
scores of selected products in table 7.
Table 7: Top Contributors of Protectionism Scores for Selected Products
product Score type and level top 5 contributing countries
total contribut
ion Subs. Count
non-established MRLs
count
Apple
weighted score 1
1.11 EU (32%), Russia (20%), Canada (5%), Mexico (5%), US (5%)
67%
64 580 weighted score 2
1.17 EU (30%), Russia (26%), Mexico (5%), US (5%), Canada (4%)
70%
unweighted score 1
1.02 Australia (3%), Turkey (3%), Argentina (3%), Brazil (3%), Israel (3%)
15%
25
unweighted score 2
1.03 Turkey (4%), Russia (3%), Brazil (3%), Argentina (3%), Israel (3%)
16%
Banana
weighted score 1
0.88 EU (46%), US (19%), Japan (10%), Russia (8%), Canada (6%)
89%
21 121
weighted score 2
0.85 EU (48%), US (20%), Japan (11%), Canada (6%), Russia (4%)
89%
unweighted score 1
0.96 Canada (3%), Israel (3%), Brazil (3%), Singapore (2%), Argentina (2%)
13%
Unweighted score 2
0.95 Canada (3%), Brazil (3%), Israel (3%), Singapore (3%), Argentina (3%)
15%
Cattle, meat
weighted score 1
1.17 US (17%), Japan (15%), Russia (14%), EU (14%), Mexico (7%)
67%
90 1152
weighted score 2
1.38 Russia (27%), US (14%), Japan (13%), EU (11%), Mexico (6%)
71%
unweighted score 1
1.05 Australia (3%), Jamaica (3%), EU (3%), Mexico (3%), Japan (3%)
15%
Unweighted score 2
1.08 Russia (5%), Jamaica (3%), EU (3%), Mexico (3%), Australia (3%)
17%
Corn, grain
weighted score 1
0.98 EU (21%), Malaysia (19%), US (18%), Canada (7%), Russia (5%)
70%
42 243
weighted score 2
0.97 Malaysia (20%), EU (20%), US (18%), Canada (7%), Russia (5%)
70%
unweighted score 1
1 Australia (3%), Israel (2%), China (2%), India (2%), Turkey (2%)
11%
Unweighted score 2
1 China (3%), Turkey (3%), Indonesia (2%), Israel (2%), India (2%)
12%
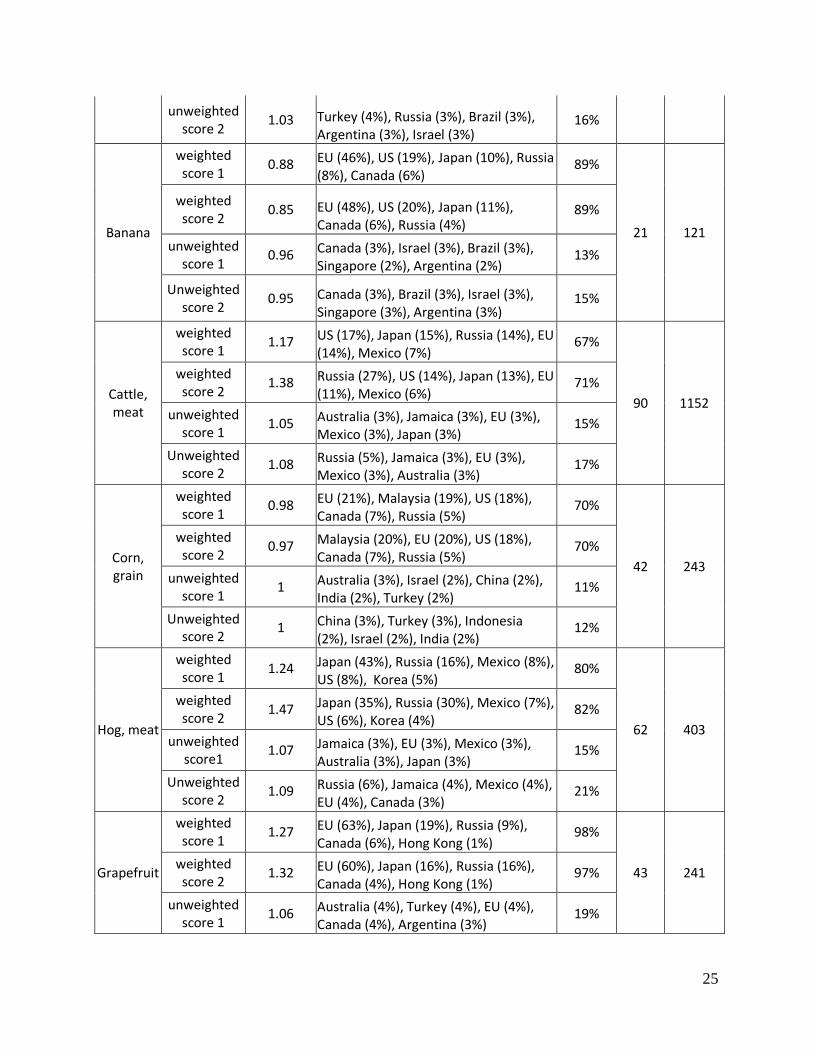
Hog, meat
weighted score 1
1.24 Japan (43%), Russia (16%), Mexico (8%), US (8%), Korea (5%)
80%
62 403
weighted score 2
1.47 Japan (35%), Russia (30%), Mexico (7%), US (6%), Korea (4%)
82%
unweighted score1
1.07 Jamaica (3%), EU (3%), Mexico (3%), Australia (3%), Japan (3%)
15%
Unweighted score 2
1.09 Russia (6%), Jamaica (4%), Mexico (4%), EU (4%), Canada (3%)
21%
Grapefruit
weighted score 1
1.27 EU (63%), Japan (19%), Russia (9%), Canada (6%), Hong Kong (1%)
98%
43 241 weighted score 2
1.32 EU (60%), Japan (16%), Russia (16%), Canada (4%), Hong Kong (1%)
97%
unweighted score 1
1.06 Australia (4%), Turkey (4%), EU (4%), Canada (4%), Argentina (3%)
19%

26
Unweighted score 2
1.08 Russia (6%), Turkey (5%), EU (4%), Brazil (3%), Argentina (3%)
21%
Poultry, meat
weighted score 1
0.98 Hong Kong (17%), Russia (16%), China (13%), Japan (13%), Mexico (9%)
68%
45 281
weighted score 2
1.04 Russia (21%), Hong Kong (16%), China (12%), Japan (12%), Mexico (8%)
69%
unweighted score 1
0.97 Russia (2%), Japan (2%), EU (2%), Chile (2%), Singapore (2%)
10%
Unweighted score 2
0.98 Russia (3%), Japan (2%), Chile (2%), Singapore (2%), Thailand (2%)
11%
Sheep, meat
weighted score 1
1.33 EU (53%), US (17%), United Arab Emirates (6%), Japan (4%), Canada (4%)
84%
66 487
weighted score 2
1.34 EU (50%), US (17%), United Arab Emirates (6%), Canada (5%), China (5%)
83%
unweighted score 1
1.06 Jamaica (3%), Australia (3%), EU (3%), Japan (3%), Mexico (3%)
15%
Unweighted score 2
1.1 Russia (6%), Canada (4%), Jamaica (3%), Australia (3%), EU (3%)
19%
Wheat, grain
weighted score 1
1.05 EU (10%), Algeria (9%), Egypt (8%), Japan (7%), Indonesia (7%)
41%
38 200
weighted score 2
1.1 Turkey (9%), EU (9%), Algeria (9%), Egypt (7%), Indonesia (7%)
41%
unweighted score1
1.05 Australia (3%), Canada (3%), Turkey (3%), India (3%), China (3%)
15%
Unweighted score2
1.07 Turkey (5%), China (3%), Australia (3%), India (3%), Russia (3%)
17%
The top contributors to unweighted scores are countries that have the tightest MRLs for
the corresponding product. Trade weights temper or exacerbate these with import shares.
Countries, that contribute large percentage to weighted scores, have large import share and/or
large unweighted scores contribution. Top contributors to weighted scores are generally
consistent from score 1 to score 2. In contrast, Australia and Japan, probably due to their tight
default values and the discrepancy between default with the rest of their MRLs, sometimes
appear to be the top contributors of unweighted score 1 but not for unweighted score 2 (i.e.,
apple, corn grain, grapefruit). On the other hand, The Russian Federation, sometimes is the top
27
contributor for unweighted score 2, but not for unweighted score1 (i.e., cattle meat, hog meat,
grapefruit). This is probably due the discrepancy between its relatively “low” default value
(Codex) and its tight established MRLs.
A weighted score is larger than its unweighted counterpart when countries with stricter
MRLs are large or dominant importers (i.e., sheep meat, hog meat, grapefruit, etc.). A weighted
score is close to or smaller than its unweighted counterpart, when there are no dominant
importers or when countries with less stringent MRLs are large importers (i.e., banana, poultry
meat, wheat, etc.).
Further, for selected meat products (cattle, hog, sheep, and poultry meat), score 2 is
always higher than score 1. Unweighted score1 and score 2 are similar and close to one (slightly
above or below 1). Accounting for the trade weights, we observe some obvious increase from
score 1 to score 2 in weighted scores. Cattle, hog, and sheep meat have larger weighted score
well above 1 (1.17, 1.24, 1.33 for score 1, and 1.38, 1.47, 1.34 for score 2), and poultry meat has
trade-weighted score close to 1 (0. 98 for score 1 and 1.04 for score 2). It shows that cattle, hog,
sheep meat are more protected than poultry meat product overall. In addition, we observe
relatively large increase from weighted score 1 to weighted score 2 for cattle meat and hog meat.
Russia is playing an important role in driving this discrepancy for cattle and hog with its high
established MRLs for cattle and pork products which are much tighter than its default. Russia is
also a large importer of cattle and hog products, which induces large differences for trade-
weighted scores.
A look at the top contributors in scores is interesting. For example, the dominant top
contributor to weighted score 1 for sheep meat is the EU (43%), and the EU sheep meat MRLs
are among the tightest (one of the top contributors to unweighted scores). Therefore, we see a big
28
increase form unweighted scores to weighted scores. Australia, on the other hand, does not
import much sheep meat while keeping tight MRLs. Australia is a large exporter, so it set its
MRLs to meet high EU standards. The economic and rent-seeking determinants of protectionism
scores will be investigated in a subsequent investigation.
Looking at selected fruit products, the weighted scores for apple are 1.11 and 1.17 for
score 1 and score 2 respectively, larger than that of unweighted scores. Banana has weighted
scores smaller than unweighted scores, and weighted scores are well below 1 (0.88 and 0.85 for
score 1 and score 2 respectively). The dominant contributor, the EU (46%), has lax MRLs and a
score of 0.9 for banana.10
The EU imports a lot of banana, and clearly exhibits MRL anti-
protectionism for banana. This explains why we observe the weighted scores of banana being
even smaller than the unweighted scores. Grapefruit weighted scores are 1.27 and 1.32 for score
1 and score 2. The EU is the dominant importer and has tight grapefruit MRLs, hence the EU is
the top contributor to weighted scores (63%). Among these three fruit products, grapefruit is
more protected than apple, and banana is “under” protected.
Regarding grains, corn scores are around 1. The top contributors EU (21%), Malaysia
(19%), and US (18%) have lax MRLs, and hence corn is a non-protected product overall.
Weighted scores for oats are also around 1. The dominant contributor to weighted score, the US
(72%), has lax oat grain MRLs (0.94 and 0.88 for score 1 and score 2), which drives the overall
weighted scores below 1. Weighted and unweighted scores for wheat are slightly above 1. This is
because there are no dominant importers of wheat and specific influences are diffused.
Robustness check
We evaluate the robustness of our scores with a focus on the weights used in the scores
(between trade weighted scores and unweighted scores), and also on data limitations and their
10 Countries by product protectionism score results are available upon request.

29
potential impact on the stability of the protectionism scores. Since we have several products with
small substance counts, we find it imperative to check the robustness of the product-level
protectionism scores as well as country-level protectionism scores relative to the variation in
substance count per product score.
In the dataset, the number of substances for each product ranges from 1 to 98, and we
conjecture that this number is likely to be positively related with the “true” number of substances
regulated for this product. One of the possible explanations for the variations could be that some
products may raise more health concerns than others. The other potential reason, mentioned
before, is that the list is determined by the U.S. list of substances.. We have 13% of the products
(34 out of 252) with less or equal to 5 substances (data available upon request). The
protectionism scores for products with fewer substances may still be valid, but we certainly have
more confidence in the scores calculated with more substances. In order to systematically check
the robustness, bias, variance as well as identify outliers in the product protectionism scores, we
look at box plots of scores grouped by substance count, Quantile-Quantile plots (QQ-plots) with
small counts against the rest, and compute some statistical tests, when applicable.
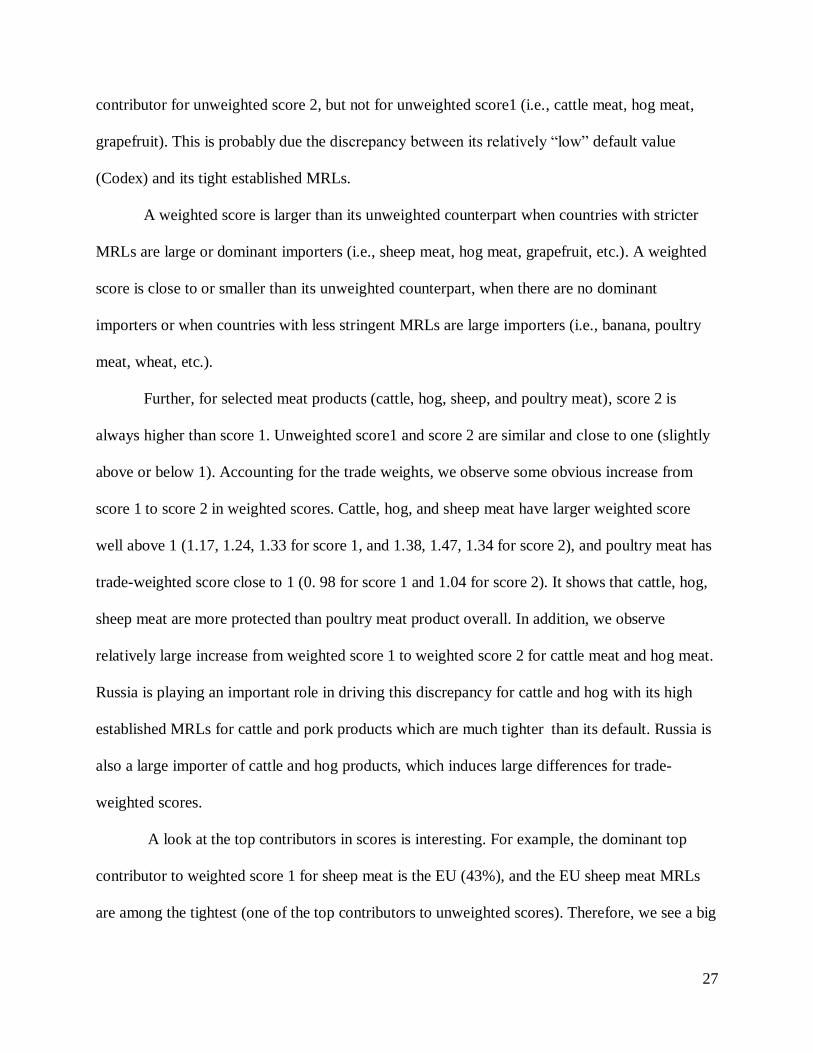
Figure 3 shows the histograms of combinations of weighted and unweighted score 1 and score 2.
The variation shows the patterns for weighted-unweighted, and score 1- score 2. Trade weight
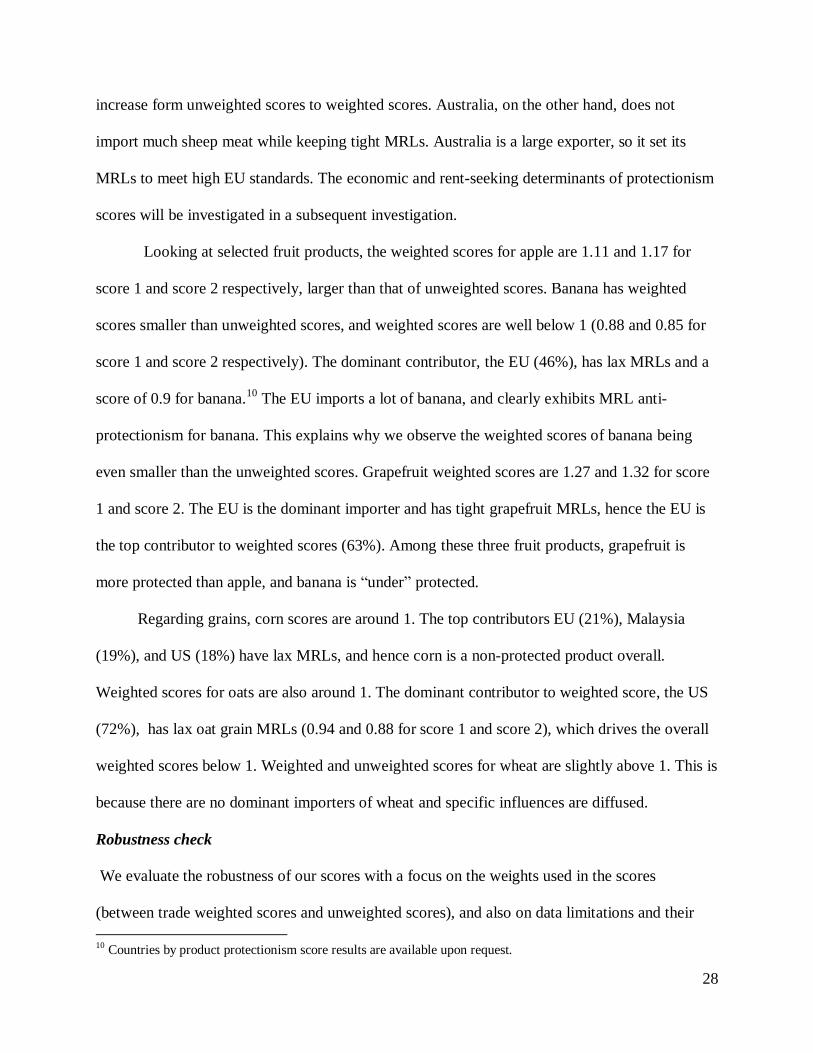
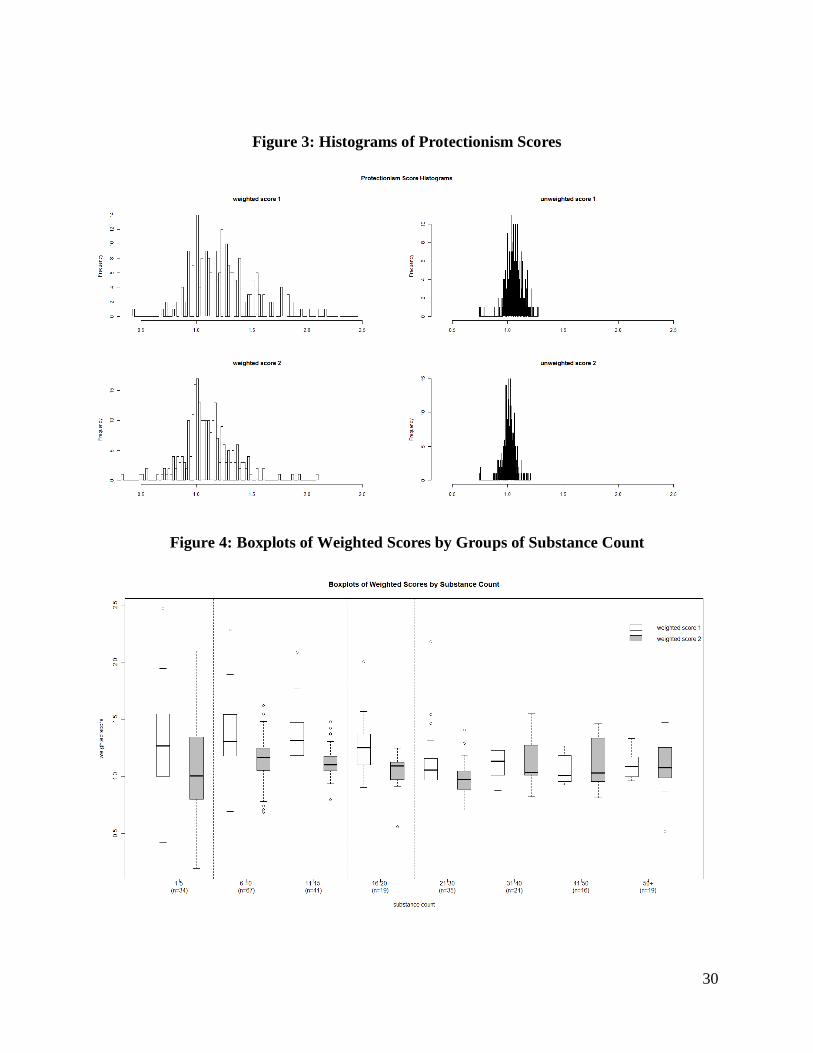
creates more dispersion and higher scores. Figures 4 and 5 show the boxplots of weighted and
unweighted protectionism scores grouped by the number of substances. For both weighted and
unweighted, products with fewer substances (say substance count <20) tend to have higher score
1 and a wider dispersion than products with more substances (say substance count >20). But no
obvious difference is found for products with different substance counts for scores 2, both
weighted and unweighted.
30
Figure 3: Histograms of Protectionism Scores
Figure 4: Boxplots of Weighted Scores by Groups of Substance Count
31
Figure 5: Boxplots of Unweighted Scores by Groups of Substance Count
QQ plots of product scores (available upon request) are sorted out using cut off numbers
of substances. The difference between weighted and unweighted scores is not obvious, but we
observe systematic difference between score 1 and score 2. Score 1 of products with smaller
substance count show more variation (fatter left tail) in the lower side and similar variation but
higher scores on the upper side, comparing to the same score 1 of products with larger substance
count. Scores 2 for products with smaller substance count show more variation (fatter tails) in
both lower and upper tails than products with larger substance count. This is consistent with the
box plots. Scores with substance count of less or equal to 4 do not line up close to the 45-degree
line but show a much steeper pattern.
In addition to the plots, we conduct non-parametric Cochran tests for the variability and
differences among product scores groups. We group products by substance count, i.e., substance
count equals 1-4, 5-9, 9-10, etc., and try to make each group of similar size of about 30 products.
32
The test suggests that the product group with less or equal to 4 substances have “outlying
variance” for all combinations of weighted/unweighted/score1/score 2, which means that the
scores of products with no more than 4 substances exhibit more variability than the rest.
However, there is a caveat to the test, which is that it maintains normality, which is rejected for
unweighted scores and for some groups of weighted scores.
We also check the robustness of country-level scores. We compare the country
protectionism scores by gradually deleting products with up to 5 substances, and recalculate
them. We see only negligible variations in the scores and country ranking, which strongly
suggests that country level scores are robust to the presence of products scores established based
on fewer substances (results are available upon request).
Conclusion
We proposed aggregation indices of NTMs to quantify the protectionism of Maximum Residue
Limit (MRL) regulations at various level using a science-based criteria embodied in international
standards such as Codex Alimentarius. We applied the aggregators to a large international
dataset on pesticide and veterinary drug MRLs and associated CODEX MRL standards. We
calculated both trade-weighted and equally-weighted scores, since they offer complementary
information. Looking at country scores, trade weights do not appear to be pivotal. However, we
found trade weights induce more dispersion of product scores. Considering or not non-
established MRLs is quite important in establishing a country’s MRL protectionism. The latter
can arise from strict established MRLs or from strict default MRLs, or both.
Country-level results show that Australia ranks the most protectionist from all three
indices: weighted, normalized weighted and equally weighted, using score 1 because of its tight
default value. The Russian Federation ranks the most protectionist from scores based on established
33
MRLs (no default). Other countries ranked differently to various extents based on the different
weights used. However, the set of most protectionist countries is remarkably stable over the
change of weights in indices. We also found that NAFTA integration on residue standards has
been much deeper between Mexico and the United States, than with Canada.
Product level protectionism scores are shown by sector-wise distribution first. Meat and
dairy products (HS02, HS04, HS15) have lower protectionism scores in general than other
goods. Fruit and vegetable products (HS07, HS08) exhibit the most within-sector variation in
protectionism. Breaking down scores by top contributors, we found that products like beans,
apple, cattle meat, etc. are controlled by a few dominant importers who set stricter MRLs than
other small importers. We checked the robustness of scores to address concerns for products with
fewer substances used in their scores. Products with fewer substances seemed consistently biased
upward (higher protectionism scores). Some evidence suggest that products scores based on no
more than 3 substances have higher variance or noise. As a positive note, country level scores are
robust to the deletion of products with fewer substances and provide solid policy implications.
34
References:
Achterbosch, T. J., A. Engler, M.-L. Rau and R. Toledo. 2009. “Measure the measure: the impact
of differences in pesticide MRLs on Chilean fruit exports to the EU.” Paper presented at the
International Association of Agricultural Economists Conference, Beijing, China, 16-22
August.
Baldwin, R.E. 1970. Nontariff Distortions of International Trade. Washington D.C.: Brookings
Institution.
Beghin, J.C., A.-C. Disdier, S. Marette, and F. van Tongeren. 2012. "Measuring Costs and
Benefits of Non-Tariff Measures in Agri-Food Trade." World Trade Review 11: 356-375.
Berti, K., and R. Falvey. 2009.”Does Trade Weaken Product Quality Standards?” Bond
University Globalization and Development Centre Working paper 29, Australia.
Burnquist, H. L., M. J. P. de, Souza, R. N. de Faria, Rau, M.-L., and K. Shutes. “A Systematic
Approach to Regulatory Heterogeneity Applied to EU Agri-Food Trade”. NTM-Impact
Working Paper.
Disdier, A.-C., and F. van Tongeren. 2010. “Non-Tariff Measures in Agri-Food Trade: What Do
the Data Tell Us? Evidence from a Cluster Analysis on OECD Imports." Applied Economic
Perspectives and Policy vol. 32(3): 436-455.
Disdier, A.C., L. Fontagné, and M. Mimouni. 2008. "The Impact of Regulations on Agricultural
Trade: Evidence from the SPS and TBT Agreements," American Journal of Agricultural
Economics, American Agricultural Economics Association, vol. 90(2), pages 336-350, 05.
Disdier A.-C., and S. Marette. 2010. “The Combination of Gravity and Welfare Approaches for
Evaluating Non-Tariff Measures.” American Journal of Agricultural Economics, 2010,
92(3): 713-726
Drogué, S. and F. DeMaria. Forthcoming. “Pesticides Residues and Trade: the Apple of
Discord?” Food Policy.
Fischer, R. and P. Serra. 2000. "Standards and protection," Journal of International Economics
vol. 52(2): 377-400.
Fontagné, L., M. Mimouni, and J.-M. Pasteels. 2005. “Estimating the Impact of Environmental
SPS and TBT on International Trade.” Integration and Trade Journal, 22: 7-37.
Harrigan, J. 1993 “OECD Imports and Trade Barriers in 1983," Journal of International
Economics 34(1-2): 91-111.
Kono, D. Y. 2006. “Optimal Obfuscation: Democracy and Trade Policy Transparency.”
American Political Science Review 100(3): 369-384.
Kox, H., and A. Lejour. 2006. “The Effects of the Services Directive on Intra-EU Trade and
FDI.” Revue économique, Presses de Sciences-Po, vol. 57(4), pages 747-769.
Li, Y., and J.C. Beghin. 2011. “A meta-analysis of estimates of the impact of technical barriers
to trade.” Journal of Policy Modeling (2011). doi:10.1016/j.jpolmod.2011.11.001.
Marette, S. and J. Beghin. 2010. "Are Standards Always Protectionist?" Review of International
Economics, Wiley Blackwell, vol. 18(1), pages 179-192, 02.
35
Rau, M.-L., K. Shutes and S. Schlueter. 2010. “Index of Heterogeneity of Requirements in
International Agri-Food Trade.” NTM-Impact Working Paper 10/01.
Roberts, D. and T. Josling. 2010. “Tracking the Implementation of Internationally Agreed
Standards in Food and Agricultural Production.” International Food and Agricultural Trade
Policy Council.
Trefler, D. 1993. "Trade Liberalization and the Theory of Endogenous Protection: An
Econometric Study of U.S. Import Policy," Journal of Political Economy 101(1): 138-60.
USDA FAS International MRL database (http://www.mrldatabase.com/).
Vigani, M., R. Raimondi and A. Opler. 2009. “GMO Regulations, International Trade and the
Imperialism of Standards.” LICOS Discussion Paper 255/2009.
Wilson, J.S., and Otsuki, T. 2004. "To spray or not to spray: pesticides, banana exports, and food
safety," Food Policy 29(2): 131-146.
Winchester, N., M.L. Rau, C. Goetz, B, Larue, T. Otsuki, K. Shutes, C. Wieck, H. L. Burnquist,
M. J. Pinto de Souza, R. N. de Faria. Forthcoming. “The Impact of Regulatory
Heterogeneity on Agri-Food Trade” The World Economy.
WTO Agreement on the Application of Sanitary and Phytosanitary Measures (SPS Agreement)
(http://www.wto.org/english/tratop_e/sps_e/spsagr_e.htm).
Xiong, B., and J. Beghin. 2012. “Does European Aflatoxin Regulation Hurt Groundnut
Exporters from Africa?” European Review of Agricultural Economics. Available on line at:
http://erae.oxfordjournals.org.proxy.lib.iastate.edu:2048/content/early/2011/11/21/erae.jbr0
62.full.pdf+html?sid=75ad892d-e754-4bcd-92fc-358f860d510b